Embed Size (px)
Citation preview
7/30/2019 Sterlite 4Q FY 2013
http://slidepdf.com/reader/full/sterlite-4q-fy-2013 1/13
Please refer to important disclosures at the end of this report 1
Quarterly highlights – (Consolidated)
Particulars (` cr) 4QFY13 4QFY12 % chg (yoy) 3QFY13 % chg (qoq)
Net sales 12,609 10,763 17.2 10,692 17.9
EBITDA 3,307 2,705 22.2 2,327 42.1
% margin 26.2 25.1 109bp 21.8 446bp
Adjusted PAT 1,964 1,377 42.6 1,254 56.6
Source: Company, Angel Research
Sterlite Industries (Sterlite) reported better-than-expected 4QFY2013 results. Both,
the top-line as well as the net profit were above our expectations, mainly due to
better-than-expected performance from the Copper and Zinc segments.We
recommend Accumulate rating on the stock.
Top-line growth driven by all the segments: The company’s net sales grew 17.2%
yoy to ` 12,609cr. The growth was driven by increase in all the segments’
revenues. Aluminium, Copper and Zinc segment revenues grew 9.8%, 16.9 and
21.6% yoy to ` 954cr, ` 5,783cr and ` 4,950cr, respectively
Copper segment profitability surprises: On the operating front, Sterlite’s EBITDA
grew 22.2% yoy to ` 3,307cr and EBITDA margin improved by 109bp yoy to
26.2% (above our estimate of 23.1%) because of improved profitability across all
segments. Copper segment’s profitability was above our estimate as its EBIT
improved by 22.5% yoy due to higher volumes and power sales from the 80MW
captive power plant, although partially offset by higher costs of production).
Lower interest costs and higher other income boost PAT: Interest costs declined by
15.9% yoy to ` 276cr and other income grew by 13.5% yoy to ` 798cr. Tax rate
was also lower at 12.1% compared to 16.8% in 4QFY2012; hence, adjusted net
profit increased by 42.6% yoy to ` 1,964cr, which was above our estimate of
` 1,522cr.
Outlook and valuation: We expect Sterlite to benefit from the expansion of
Zinc-Lead smelting capacity during FY2014-15 although its Aluminium segment’s
profitability is expected to remain under pressure. Considering the ongoing process
of group restructuring by the promoter, Vedanta Resources, the valuation of Sterlite
will mirror the valuation of the consolidated company - Sesa Sterlite. We recommend
Accumulate rating on the stock.
Key financials (Consolidated)Y/E March ( ` cr) FY2012 FY2013E FY2014E FY2015E
Net sales 41,179 45,162 44,462 45,568
% chg 35.3 9.7 -1.5 2.5
Net profit 4,828 6,060 6,092 6,787
% chg -4.3 25.5 0.5 11.4
FDEPS (`) 15.5 18.3 18.1 20.2
OPM (%) 24.0 23.2 23.2 24.7
P/E(x) 6.1 5.2 5.2 4.7
P/BV(x) 0.7 0.6 0.6 0.5
RoE(%) 11.0 12.5 11.3 11.4RoCE(%) 11.3 10.2 8.4 8.5
EV/Sales (x) 0.7 0.6 0.6 0.5
EV/EBITDA (x) 2.8 2.5 2.4 2.0
Source: Company, Angel Research
ACCUMULATECMP ` 95
Target Price ` 100
Investment Period 12 months
Stock Info
Sector
Net Debt ( ` cr) (6,234)
Bloomberg Code
Shareholding Pattern (%)
Promoters 53.3
MF / Banks / Indian Fls 9.3
FII / NRIs / OCBs 27.6
Indian Public / Others 9.8
Abs. (%) 3m 1yr 3yr
Sensex (3.0) 13.5 11.1
STLT (16.3) (9.7) (53.9)
52 Week High / Low 123/83
Base Metals
Market Cap ( ` cr) 32,077
Beta 1.5
Avg. Daily Volume 615,888
Face Value ( ` ) 1
BSE Sensex 19,504
Nifty 5,930
Reuters Code STRL.BO
STLT@IN
Bhavesh Chauhan
Tel: 022- 39357600 Ext: 6821
Vinay Rachh
Tel: 022- 39357600 Ext: 6841
Sterlite Industries
Performance Highlights
4QFY2013 Result Update | Base Metals
April 30, 2013
7/30/2019 Sterlite 4Q FY 2013
http://slidepdf.com/reader/full/sterlite-4q-fy-2013 2/13
Sterlite Industries | 4QFY2013 Result Update
April 30, 2013 2
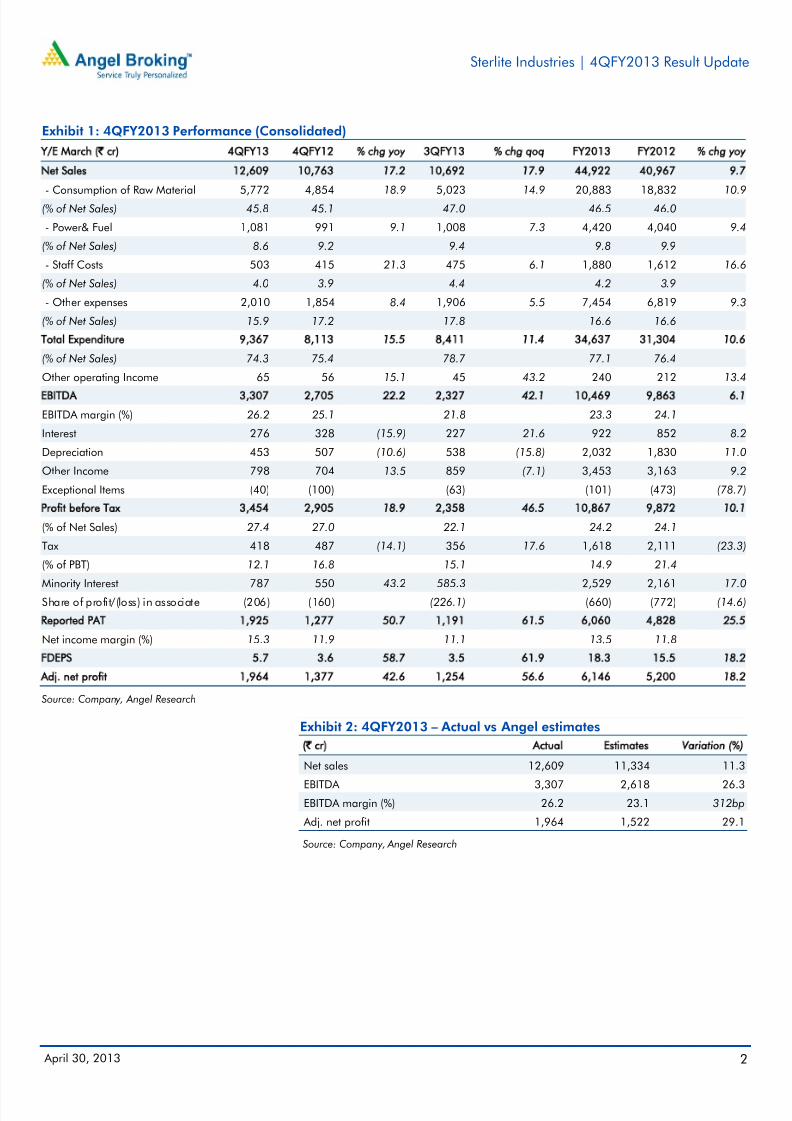
Exhibit 1: 4QFY2013 Performance (Consolidated)
Y/E March (` cr) 4QFY13 4QFY12 % chg yoy 3QFY13 % chg qoq FY2013 FY2012 % chg yoy
Net Sales 12,609 10,763 17.2 10,692 17.9 44,922 40,967 9.7
- Consumption of Raw Material 5,772 4,854 18.9 5,023 14.9 20,883 18,832 10.9(% of Net Sales) 45.8 45.1 47.0 46.5 46.0
- Power& Fuel 1,081 991 9.1 1,008 7.3 4,420 4,040 9.4
(% of Net Sales) 8.6 9.2 9.4 9.8 9.9
- Staff Costs 503 415 21.3 475 6.1 1,880 1,612 16.6
(% of Net Sales) 4.0 3.9 4.4 4.2 3.9
- Other expenses 2,010 1,854 8.4 1,906 5.5 7,454 6,819 9.3
(% of Net Sales) 15.9 17.2 17.8 16.6 16.6
Total Expenditure 9,367 8,113 15.5 8,411 11.4 34,637 31,304 10.6
(% of Net Sales) 74.3 75.4 78.7 77.1 76.4
Other operating Income 65 56 15.1 45 43.2 240 212 13.4
EBITDA 3,307 2,705 22.2 2,327 42.1 10,469 9,863 6.1
EBITDA margin (%) 26.2 25.1 21.8 23.3 24.1
Interest 276 328 (15.9) 227 21.6 922 852 8.2
Depreciation 453 507 (10.6) 538 (15.8) 2,032 1,830 11.0
Other Income 798 704 13.5 859 (7.1) 3,453 3,163 9.2
Exceptional Items (40) (100) (63) (101) (473) (78.7)
Profit before Tax 3,454 2,905 18.9 2,358 46.5 10,867 9,872 10.1
(% of Net Sales) 27.4 27.0 22.1 24.2 24.1
Tax 418 487 (14.1) 356 17.6 1,618 2,111 (23.3)
(% of PBT) 12.1 16.8 15.1 14.9 21.4
Minority Interest 787 550 43.2 585.3 2,529 2,161 17.0
Share of profit/(loss) in associate (206) (160) (226.1) (660) (772) (14.6)
Reported PAT 1,925 1,277 50.7 1,191 61.5 6,060 4,828 25.5
Net income margin (%) 15.3 11.9 11.1 13.5 11.8
FDEPS 5.7 3.6 58.7 3.5 61.9 18.3 15.5 18.2
Adj. net profit 1,964 1,377 42.6 1,254 56.6 6,146 5,200 18.2
Source: Company, Angel Research
Exhibit 2: 4QFY2013 – Actual vs Angel estimates
(` cr) Actual Estimates Variation (%)
Net sales 12,609 11,334 11.3
EBITDA 3,307 2,618 26.3
EBITDA margin (%) 26.2 23.1 312bp
Adj. net profit 1,964 1,522 29.1
Source: Company, Angel Research
7/30/2019 Sterlite 4Q FY 2013
http://slidepdf.com/reader/full/sterlite-4q-fy-2013 3/13
Sterlite Industries | 4QFY2013 Result Update
April 30, 2013 3
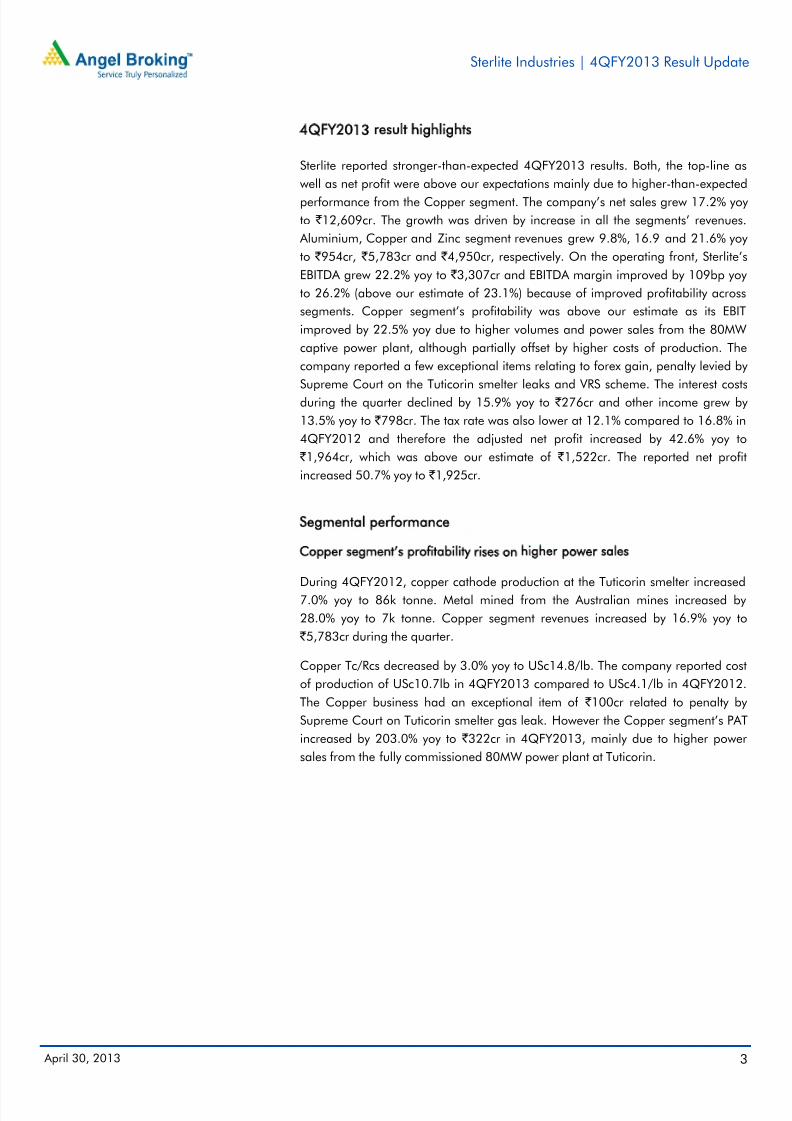
4QFY2013 result highlights
Sterlite reported stronger-than-expected 4QFY2013 results. Both, the top-line as
well as net profit were above our expectations mainly due to higher-than-expected
performance from the Copper segment. The company’s net sales grew 17.2% yoy
to ` 12,609cr. The growth was driven by increase in all the segments’ revenues.
Aluminium, Copper and Zinc segment revenues grew 9.8%, 16.9 and 21.6% yoy
to ` 954cr, ` 5,783cr and ` 4,950cr, respectively. On the operating front, Sterlite’s
EBITDA grew 22.2% yoy to ` 3,307cr and EBITDA margin improved by 109bp yoy
to 26.2% (above our estimate of 23.1%) because of improved profitability across
segments. Copper segment’s profitability was above our estimate as its EBIT
improved by 22.5% yoy due to higher volumes and power sales from the 80MW
captive power plant, although partially offset by higher costs of production. The
company reported a few exceptional items relating to forex gain, penalty levied by
Supreme Court on the Tuticorin smelter leaks and VRS scheme. The interest costsduring the quarter declined by 15.9% yoy to ` 276cr and other income grew by
13.5% yoy to ` 798cr. The tax rate was also lower at 12.1% compared to 16.8% in
4QFY2012 and therefore the adjusted net profit increased by 42.6% yoy to
` 1,964cr, which was above our estimate of ` 1,522cr. The reported net profit
increased 50.7% yoy to ` 1,925cr.
Segmental performance
Copper segment’s profitability rises on higher power sales
During 4QFY2012, copper cathode production at the Tuticorin smelter increased7.0% yoy to 86k tonne. Metal mined from the Australian mines increased by
28.0% yoy to 7k tonne. Copper segment revenues increased by 16.9% yoy to
` 5,783cr during the quarter.
Copper Tc/Rcs decreased by 3.0% yoy to USc14.8/lb. The company reported cost
of production of USc10.7lb in 4QFY2013 compared to USc4.1/lb in 4QFY2012.
The Copper business had an exceptional item of ` 100cr related to penalty by
Supreme Court on Tuticorin smelter gas leak. However the Copper segment’s PAT
increased by 203.0% yoy to ` 322cr in 4QFY2013, mainly due to higher power
sales from the fully commissioned 80MW power plant at Tuticorin.
7/30/2019 Sterlite 4Q FY 2013
http://slidepdf.com/reader/full/sterlite-4q-fy-2013 4/13
Sterlite Industries | 4QFY2013 Result Update
April 30, 2013 4
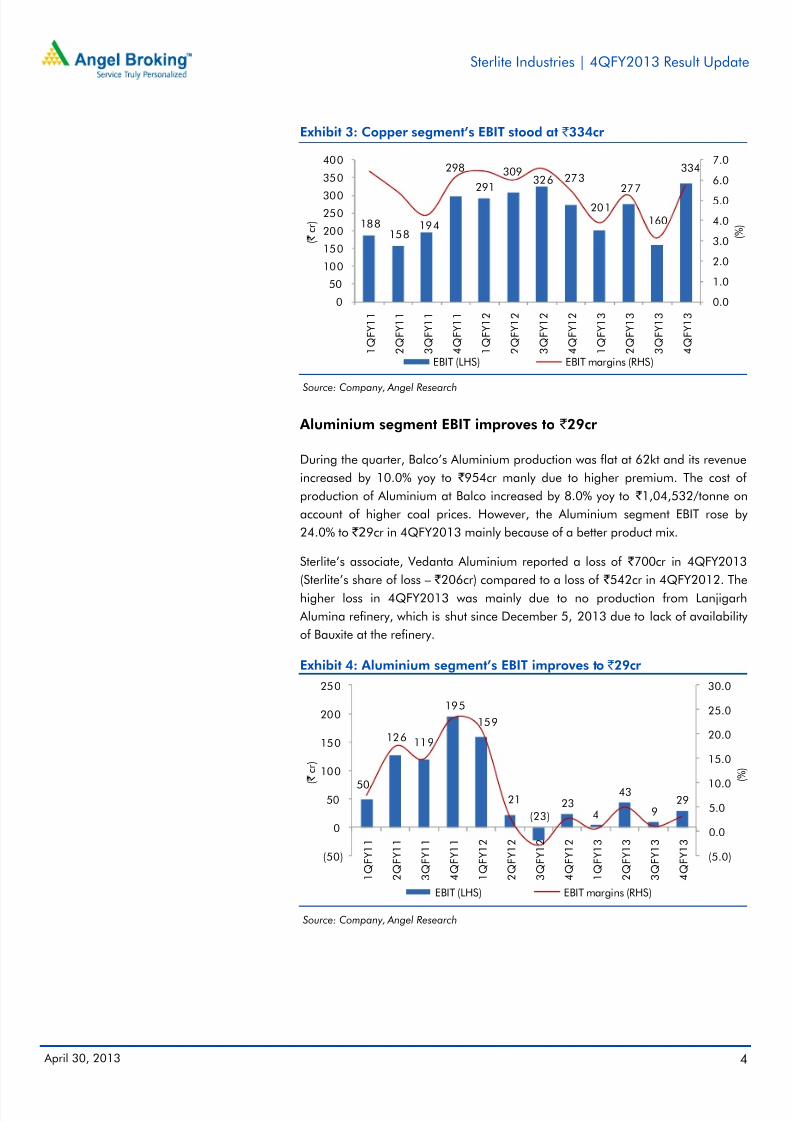
Exhibit 3: Copper segment’s EBIT stood at ` 334cr
Source: Company, Angel Research
Aluminium segment EBIT improves to ` 29cr
During the quarter, Balco’s Aluminium production was flat at 62kt and its revenue
increased by 10.0% yoy to ` 954cr manly due to higher premium. The cost of
production of Aluminium at Balco increased by 8.0% yoy to ` 1,04,532/tonne on
account of higher coal prices. However, the Aluminium segment EBIT rose by
24.0% to `29cr in 4QFY2013 mainly because of a better product mix.
Sterlite’s associate, Vedanta Aluminium reported a loss of ` 700cr in 4QFY2013
(Sterlite’s share of loss – ` 206cr) compared to a loss of ` 542cr in 4QFY2012. Thehigher loss in 4QFY2013 was mainly due to no production from Lanjigarh
Alumina refinery, which is shut since December 5, 2013 due to lack of availability
of Bauxite at the refinery.
Exhibit 4: Aluminium segment’s EBIT improves to ` 29cr
Source: Company, Angel Research
188158
194
298
291
309326 273
201277
160
334
0.0
1.0
2.0
3.0
4.0
5.0
6.0
7.0
0
50
100
150
200
250
300
350
400
1 Q F Y 1 1
2 Q F Y 1 1
3 Q F Y 1 1
4 Q F Y 1 1
1 Q F Y 1 2
2 Q F Y 1 2
3 Q F Y 1 2
4 Q F Y 1 2
1 Q F Y 1 3
2 Q F Y 1 3
3 Q F Y 1 3
4 Q F Y 1 3
( % )
( `
c r )
EBIT (LHS) EBIT margins (RHS)
50
126 119
195
159
21
(23)23
4
43
929
(5.0)
0.0
5.0
10.0
15.0
20.0
25.0
30.0
(50)
0
50
100
150
200
250
1 Q F Y 1 1
2 Q F Y 1 1
3 Q F Y 1 1
4 Q F Y 1 1
1 Q F Y 1 2
2 Q F Y 1 2
3 Q F Y 1 2
4 Q F Y 1 2
1 Q F Y 1 3
2 Q F Y 1 3
3 Q F Y 1 3
4 Q F Y 1 3
( %
)
( `
c r )
EBIT (LHS) EBIT margins (RHS)
7/30/2019 Sterlite 4Q FY 2013
http://slidepdf.com/reader/full/sterlite-4q-fy-2013 5/13
Sterlite Industries | 4QFY2013 Result Update
April 30, 2013 5
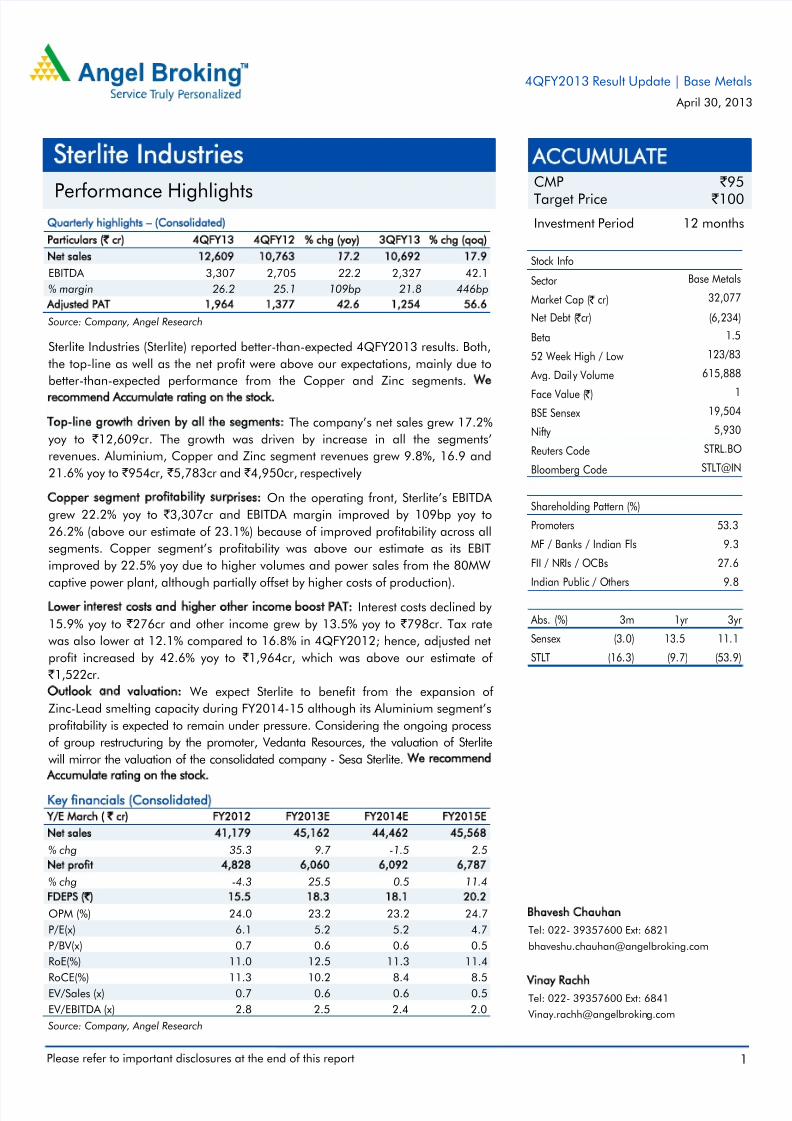
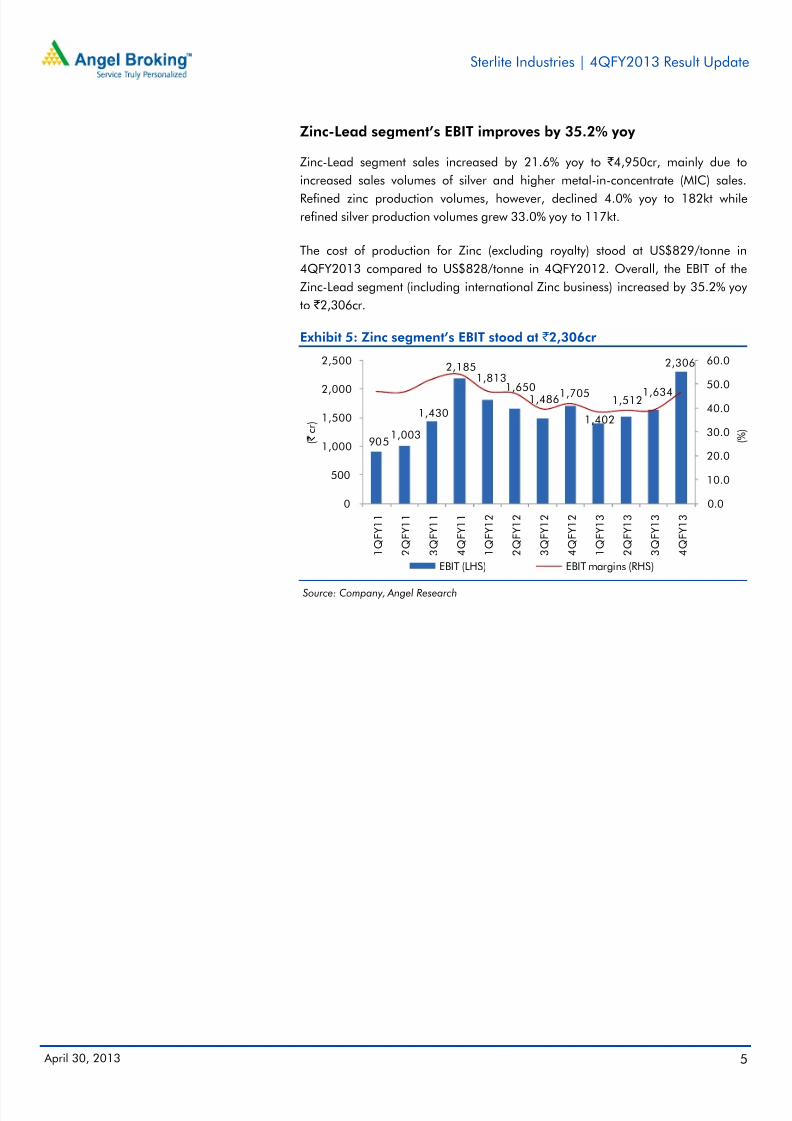
Zinc-Lead segment’s EBIT improves by 35.2% yoy
Zinc-Lead segment sales increased by 21.6% yoy to ` 4,950cr, mainly due to
increased sales volumes of silver and higher metal-in-concentrate (MIC) sales.
Refined zinc production volumes, however, declined 4.0% yoy to 182kt while
refined silver production volumes grew 33.0% yoy to 117kt.
The cost of production for Zinc (excluding royalty) stood at US$829/tonne in
4QFY2013 compared to US$828/tonne in 4QFY2012. Overall, the EBIT of the
Zinc-Lead segment (including international Zinc business) increased by 35.2% yoy
to ` 2,306cr.
Exhibit 5: Zinc segment’s EBIT stood at ` 2,306cr
Source: Company, Angel Research
9051,003
1,430
2,1851,813
1,6501,486
1,705
1,402
1,5121,634
2,306
0.0
10.0
20.0
30.0
40.0
50.0
60.0
0
500
1,000
1,500
2,000
2,500
1 Q F Y 1 1
2 Q F Y 1 1
3 Q F Y 1 1
4 Q F Y 1 1
1 Q F Y 1 2
2 Q F Y 1 2
3 Q F Y 1 2
4 Q F Y 1 2
1 Q F Y 1 3
2 Q F Y 1 3
3 Q F Y 1 3
4 Q F Y 1 3
( % )
( `
c r )
EBIT (LHS) EBIT margins (RHS)
7/30/2019 Sterlite 4Q FY 2013
http://slidepdf.com/reader/full/sterlite-4q-fy-2013 6/13
Sterlite Industries | 4QFY2013 Result Update
April 30, 2013 6
Investment rationale
Zinc-Lead expansion to aid growth: Sterlite’s subsidiary, Hindustan Zinc (HZL) has
commenced work at its underground Kayar mine, which has 11mn tonne of high-
grade reserves (10-12% zinc content). The company expects to increase its capacity
from 1.0mn tonne to 1.2mn tonne. Moreover, given the cash-rich balance sheet,
HZL is actively exploring greenfield projects through prospecting licenses and
mining lease projects across different states.
Ban on Sesa Goa’s mines in Goa remains a concern: During 2QFY2013, the Goa
government had imposed a ban on iron ore mining in Goa until further review.
Later, the Ministry of Environment and Forest Clearances (MOEF) also suspended
environment clearances to all functional mining leases in Goa. Sesa Goa operated
several mines in the region with an annual production of 12mn tonne. While we
believe the ban could be temporary, there are chances of iron ore production cap
by the government/MOEF which could affect Sesa’s production going forward. This
is likely to be a key overhang on the stock in our view.
Outlook and Valuation
We expect Sterlite to benefit from the expansion of Zinc-Lead smelting capacity
during FY2014-15. While we expect the Aluminium segment’s profitability to
remain under pressure, the current stock price factors these concerns.
Considering the ongoing process of group restructuring by the promoter, Vedanta
Resources, the valuation of Sterlite will mirror the valuation of the consolidated
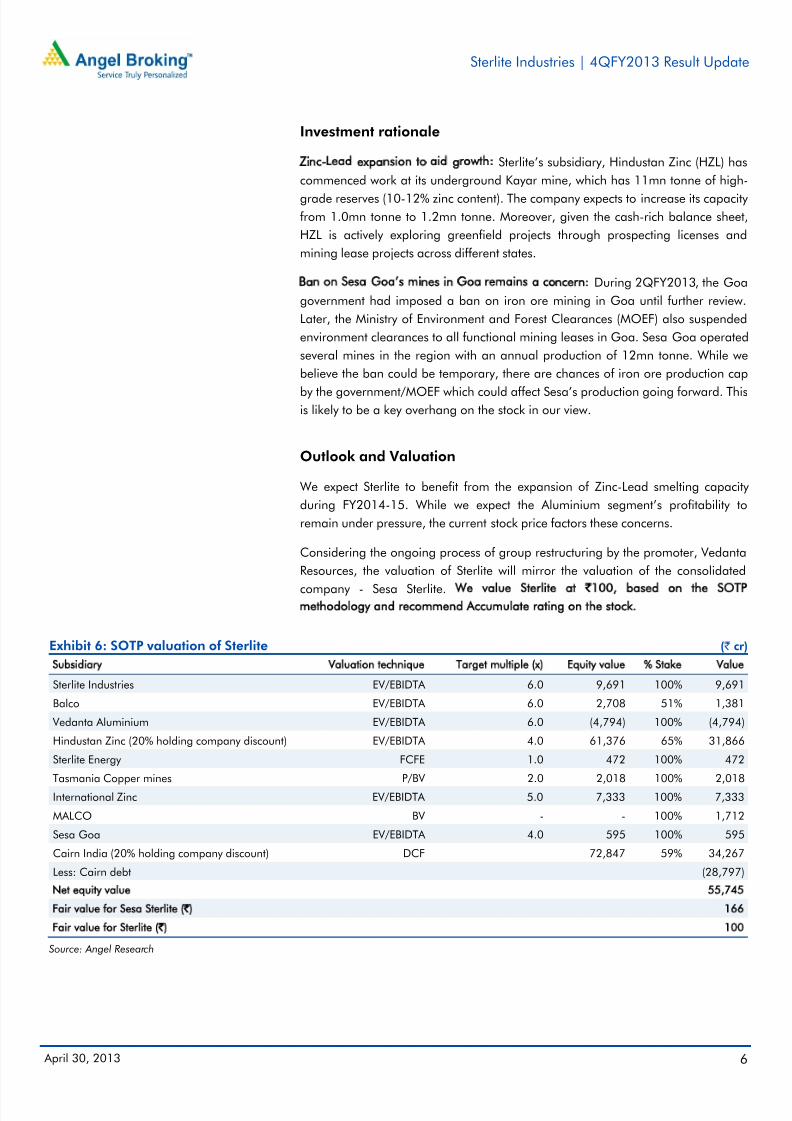
company - Sesa Sterlite. We value Sterlite at `100, based on the SOTP
methodology and recommend Accumulate rating on the stock.
Exhibit 6: SOTP valuation of Sterlite ( ` cr)
Subsidiary Valuation technique Target multiple (x) Equity value % Stake Value
Sterlite Industries EV/EBIDTA 6.0 9,691 100% 9,691
Balco EV/EBIDTA 6.0 2,708 51% 1,381
Vedanta Aluminium EV/EBIDTA 6.0 (4,794) 100% (4,794)
Hindustan Zinc (20% holding company discount) EV/EBIDTA 4.0 61,376 65% 31,866
Sterlite Energy FCFE 1.0 472 100% 472
Tasmania Copper mines P/BV 2.0 2,018 100% 2,018
International Zinc EV/EBIDTA 5.0 7,333 100% 7,333
MALCO BV - - 100% 1,712
Sesa Goa EV/EBIDTA 4.0 595 100% 595
Cairn India (20% holding company discount) DCF 72,847 59% 34,267
Less: Cairn debt (28,797)
Net equity value 55,745
Fair value for Sesa Sterlite (`) 166
Fair value for Sterlite (`) 100
Source: Angel Research
7/30/2019 Sterlite 4Q FY 2013
http://slidepdf.com/reader/full/sterlite-4q-fy-2013 7/13
Sterlite Industries | 4QFY2013 Result Update
April 30, 2013 7
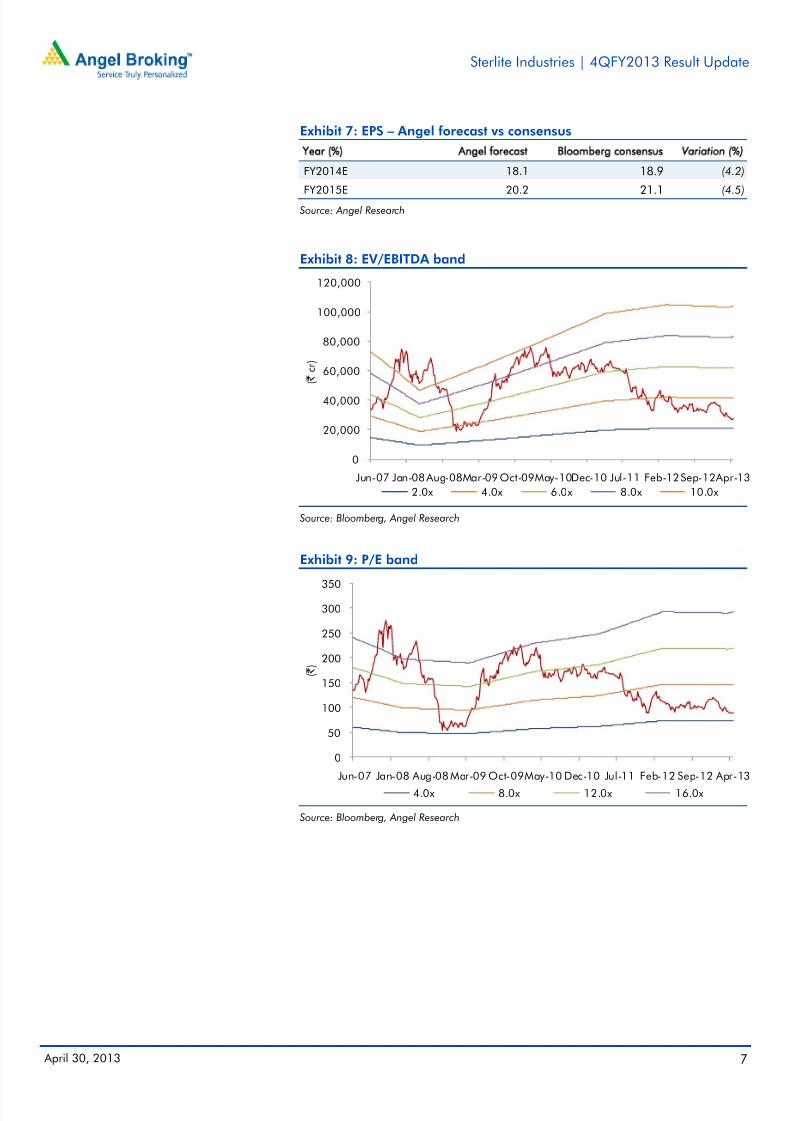
Exhibit 7: EPS – Angel forecast vs consensus
Year (%) Angel forecast Bloomberg consensus Variation (%)
FY2014E 18.1 18.9 (4.2)
FY2015E 20.2 21.1 (4.5) Source: Angel Research
Exhibit 8: EV/EBITDA band
Source: Bloomberg, Angel Research
Exhibit 9: P/E band
Source: Bloomberg, Angel Research
0
20,000
40,000
60,000
80,000
100,000
120,000
Jun-07 Jan-08Aug-08Mar-09Oct-09May-10Dec-10 Jul-11 Feb-12Sep-12Apr-13
( ` c r )
2.0x 4.0x 6.0x 8.0x 10.0x
0
50
100
150
200
250
300
350
Jun-07 Jan-08 Aug-08 Mar-09 Oct-09May-10 Dec-10 Jul-11 Feb-12 Sep-12 Apr-13
( ` )
4.0x 8.0x 12.0x 16.0x
7/30/2019 Sterlite 4Q FY 2013
http://slidepdf.com/reader/full/sterlite-4q-fy-2013 8/13
Sterlite Industries | 4QFY2013 Result Update
April 30, 2013 8
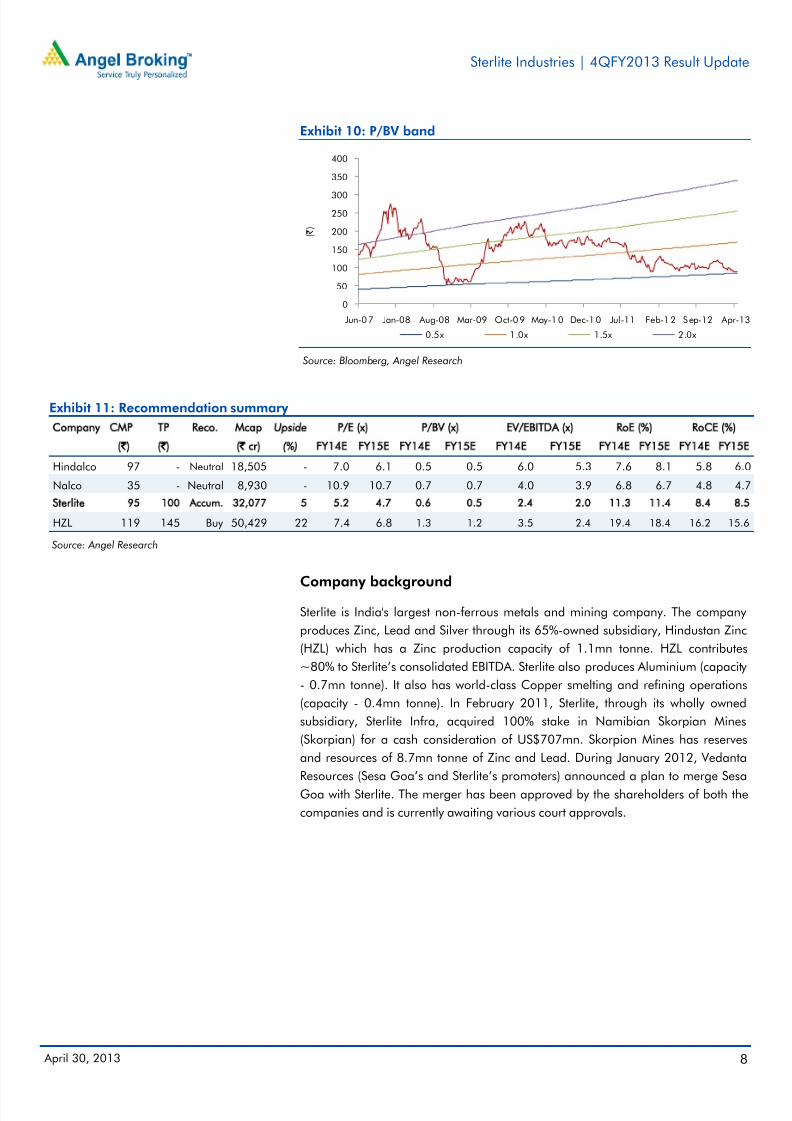
Exhibit 10: P/BV band
Source: Bloomberg, Angel Research
Exhibit 11: Recommendation summary
Company CMP TP Reco. Mcap Upside P/E (x) P/BV (x) EV/EBITDA (x) RoE (%) RoCE (%)
(`) (`) (` cr) (%) FY14E FY15E FY14E FY15E FY14E FY15E FY14E FY15E FY14E FY15E
Hindalco 97 - Neutral 18,505 - 7.0 6.1 0.5 0.5 6.0 5.3 7.6 8.1 5.8 6.0
Nalco 35 - Neutral 8,930 - 10.9 10.7 0.7 0.7 4.0 3.9 6.8 6.7 4.8 4.7
Sterlite 95 100 Accum. 32,077 5 5.2 4.7 0.6 0.5 2.4 2.0 11.3 11.4 8.4 8.5
HZL 119 145 Buy 50,429 22 7.4 6.8 1.3 1.2 3.5 2.4 19.4 18.4 16.2 15.6
Source: Angel Research
Company background
Sterlite is India's largest non-ferrous metals and mining company. The company
produces Zinc, Lead and Silver through its 65%-owned subsidiary, Hindustan Zinc
(HZL) which has a Zinc production capacity of 1.1mn tonne. HZL contributes
~80% to Sterlite’s consolidated EBITDA. Sterlite also produces Aluminium (capacity
- 0.7mn tonne). It also has world-class Copper smelting and refining operations
(capacity - 0.4mn tonne). In February 2011, Sterlite, through its wholly owned
subsidiary, Sterlite Infra, acquired 100% stake in Namibian Skorpian Mines
(Skorpian) for a cash consideration of US$707mn. Skorpion Mines has reserves
and resources of 8.7mn tonne of Zinc and Lead. During January 2012, Vedanta
Resources (Sesa Goa’s and Sterlite’s promoters) announced a plan to merge SesaGoa with Sterlite. The merger has been approved by the shareholders of both the
companies and is currently awaiting various court approvals.
0
50
100
150
200
250
300
350
400
Jun-07 Jan-08 Aug-08 Mar-09 Oct-09 May-10 Dec-10 Jul-11 Feb-12 Sep-12 Apr-13
( ` )
0.5x 1.0x 1.5x 2.0x
7/30/2019 Sterlite 4Q FY 2013
http://slidepdf.com/reader/full/sterlite-4q-fy-2013 9/13
Sterlite Industries | 4QFY2013 Result Update
April 30, 2013 9
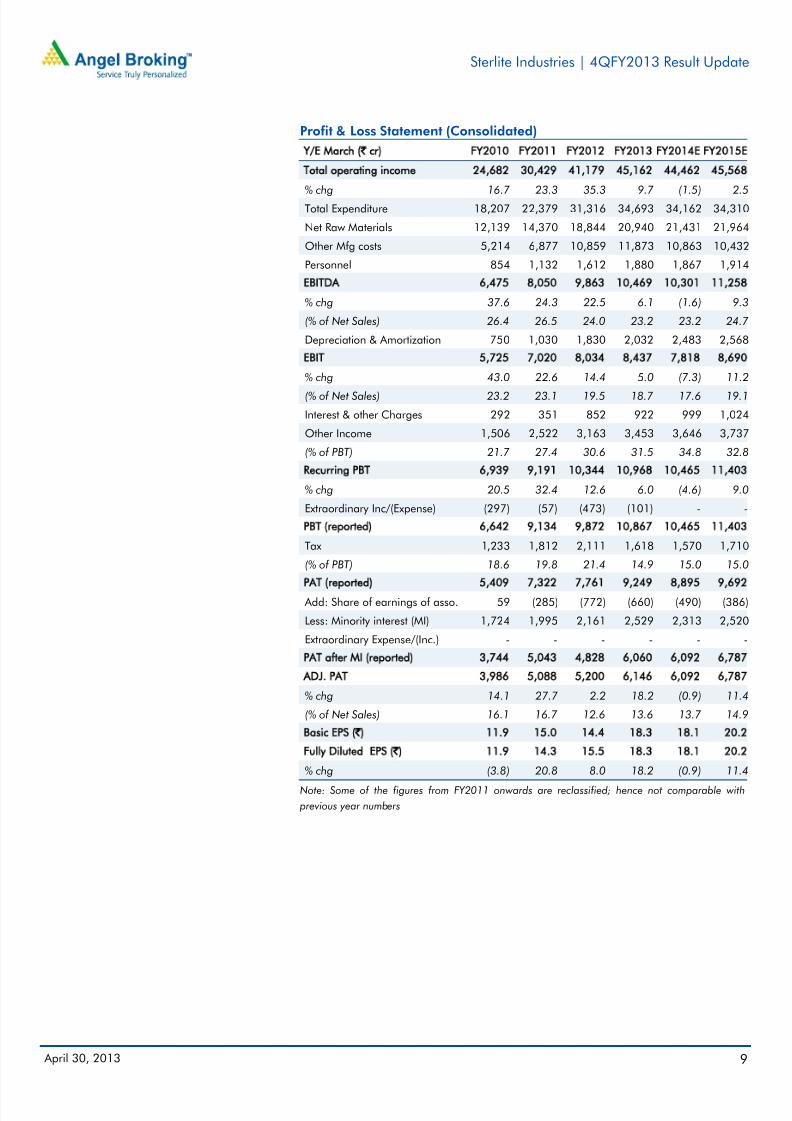
Profit & Loss Statement (Consolidated)
Y/E March (` cr) FY2010 FY2011 FY2012 FY2013 FY2014E FY2015E
Total operating income 24,682 30,429 41,179 45,162 44,462 45,568
% chg 16.7 23.3 35.3 9.7 (1.5) 2.5Total Expenditure 18,207 22,379 31,316 34,693 34,162 34,310
Net Raw Materials 12,139 14,370 18,844 20,940 21,431 21,964
Other Mfg costs 5,214 6,877 10,859 11,873 10,863 10,432
Personnel 854 1,132 1,612 1,880 1,867 1,914
EBITDA 6,475 8,050 9,863 10,469 10,301 11,258
% chg 37.6 24.3 22.5 6.1 (1.6) 9.3
(% of Net Sales) 26.4 26.5 24.0 23.2 23.2 24.7
Depreciation & Amortization 750 1,030 1,830 2,032 2,483 2,568
EBIT 5,725 7,020 8,034 8,437 7,818 8,690
% chg 43.0 22.6 14.4 5.0 (7.3) 11.2
(% of Net Sales) 23.2 23.1 19.5 18.7 17.6 19.1
Interest & other Charges 292 351 852 922 999 1,024
Other Income 1,506 2,522 3,163 3,453 3,646 3,737
(% of PBT) 21.7 27.4 30.6 31.5 34.8 32.8
Recurring PBT 6,939 9,191 10,344 10,968 10,465 11,403
% chg 20.5 32.4 12.6 6.0 (4.6) 9.0
Extraordinary Inc/(Expense) (297) (57) (473) (101) - -
PBT (reported) 6,642 9,134 9,872 10,867 10,465 11,403
Tax 1,233 1,812 2,111 1,618 1,570 1,710
(% of PBT) 18.6 19.8 21.4 14.9 15.0 15.0
PAT (reported) 5,409 7,322 7,761 9,249 8,895 9,692
Add: Share of earnings of asso. 59 (285) (772) (660) (490) (386)
Less: Minority interest (MI) 1,724 1,995 2,161 2,529 2,313 2,520
Extraordinary Expense/(Inc.) - - - - - -
PAT after MI (reported) 3,744 5,043 4,828 6,060 6,092 6,787
ADJ. PAT 3,986 5,088 5,200 6,146 6,092 6,787
% chg 14.1 27.7 2.2 18.2 (0.9) 11.4
(% of Net Sales) 16.1 16.7 12.6 13.6 13.7 14.9
Basic EPS (`) 11.9 15.0 14.4 18.3 18.1 20.2
Fully Diluted EPS (̀ ) 11.9 14.3 15.5 18.3 18.1 20.2
% chg (3.8) 20.8 8.0 18.2 (0.9) 11.4
Note: Some of the figures from FY2011 onwards are reclassified; hence not comparable with
previous year numbers
7/30/2019 Sterlite 4Q FY 2013
http://slidepdf.com/reader/full/sterlite-4q-fy-2013 10/13
Sterlite Industries | 4QFY2013 Result Update
April 30, 2013 10
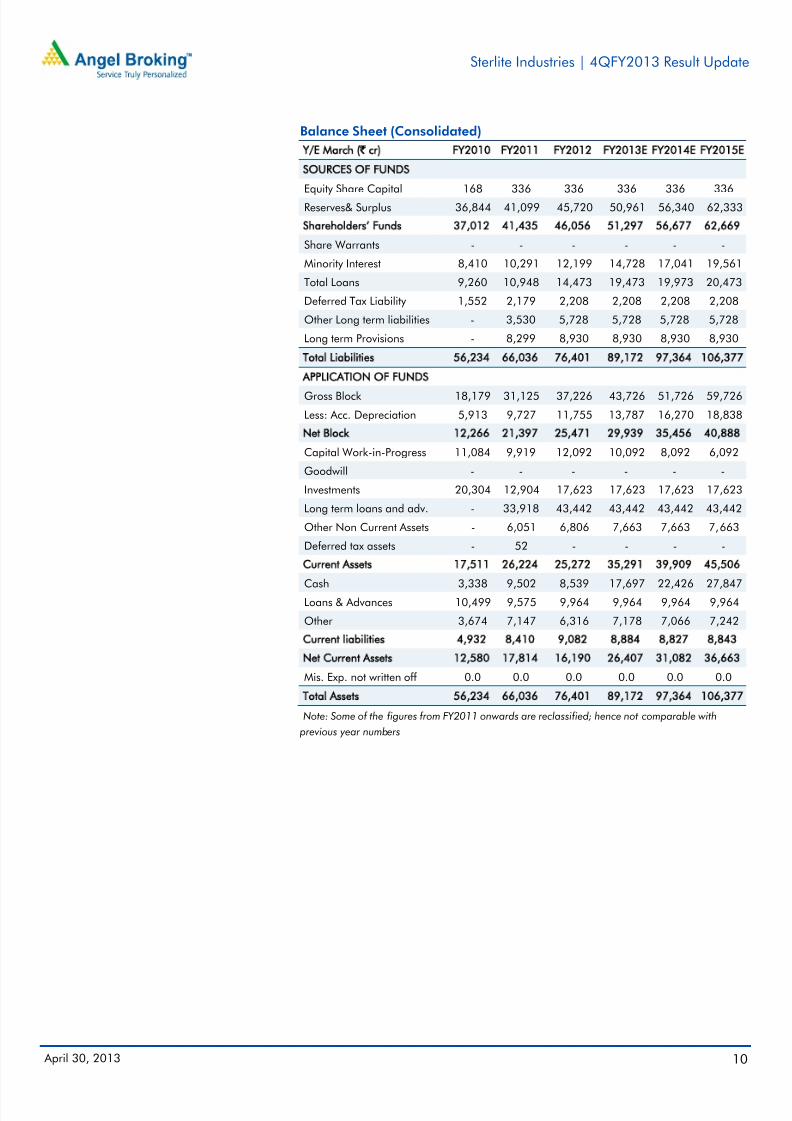
Balance Sheet (Consolidated)
Y/E March (` cr) FY2010 FY2011 FY2012 FY2013E FY2014E FY2015E
SOURCES OF FUNDS
Equity Share Capital 168 336 336 336 336 336Reserves& Surplus 36,844 41,099 45,720 50,961 56,340 62,333
Shareholders’ Funds 37,012 41,435 46,056 51,297 56,677 62,669
Share Warrants - - - - - -
Minority Interest 8,410 10,291 12,199 14,728 17,041 19,561
Total Loans 9,260 10,948 14,473 19,473 19,973 20,473
Deferred Tax Liability 1,552 2,179 2,208 2,208 2,208 2,208
Other Long term liabilities - 3,530 5,728 5,728 5,728 5,728
Long term Provisions - 8,299 8,930 8,930 8,930 8,930
Total Liabilities 56,234 66,036 76,401 89,172 97,364 106,377
APPLICATION OF FUNDS
Gross Block 18,179 31,125 37,226 43,726 51,726 59,726
Less: Acc. Depreciation 5,913 9,727 11,755 13,787 16,270 18,838
Net Block 12,266 21,397 25,471 29,939 35,456 40,888
Capital Work-in-Progress 11,084 9,919 12,092 10,092 8,092 6,092
Goodwill - - - - - -
Investments 20,304 12,904 17,623 17,623 17,623 17,623
Long term loans and adv. - 33,918 43,442 43,442 43,442 43,442
Other Non Current Assets - 6,051 6,806 7,663 7,663 7,663
Deferred tax assets - 52 - - - -
Current Assets 17,511 26,224 25,272 35,291 39,909 45,506
Cash 3,338 9,502 8,539 17,697 22,426 27,847
Loans & Advances 10,499 9,575 9,964 9,964 9,964 9,964
Other 3,674 7,147 6,316 7,178 7,066 7,242
Current liabilities 4,932 8,410 9,082 8,884 8,827 8,843
Net Current Assets 12,580 17,814 16,190 26,407 31,082 36,663
Mis. Exp. not written off 0.0 0.0 0.0 0.0 0.0 0.0
Total Assets 56,234 66,036 76,401 89,172 97,364 106,377
Note: Some of the figures from FY2011 onwards are reclassified; hence not comparable with
previous year numbers
7/30/2019 Sterlite 4Q FY 2013
http://slidepdf.com/reader/full/sterlite-4q-fy-2013 11/13
Sterlite Industries | 4QFY2013 Result Update
April 30, 2013 11
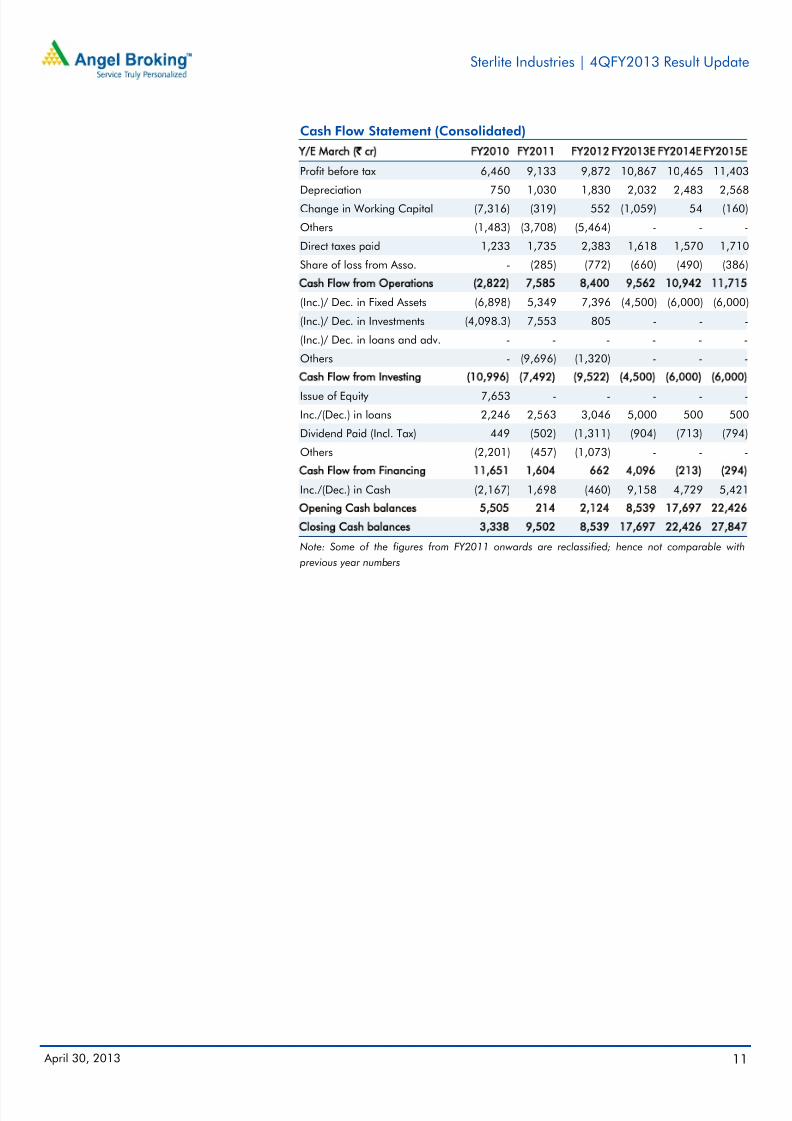
Cash Flow Statement (Consolidated)
Y/E March (` cr) FY2010 FY2011 FY2012FY2013EFY2014EFY2015E
Profit before tax 6,460 9,133 9,872 10,867 10,465 11,403
Depreciation 750 1,030 1,830 2,032 2,483 2,568Change in Working Capital (7,316) (319) 552 (1,059) 54 (160)
Others (1,483) (3,708) (5,464) - - -
Direct taxes paid 1,233 1,735 2,383 1,618 1,570 1,710
Share of loss from Asso. - (285) (772) (660) (490) (386)
Cash Flow from Operations (2,822) 7,585 8,400 9,562 10,942 11,715
(Inc.)/ Dec. in Fixed Assets (6,898) 5,349 7,396 (4,500) (6,000) (6,000)
(Inc.)/ Dec. in Investments (4,098.3) 7,553 805 - - -
(Inc.)/ Dec. in loans and adv. - - - - - -
Others - (9,696) (1,320) - - -
Cash Flow from Investing (10,996) (7,492) (9,522) (4,500) (6,000) (6,000)
Issue of Equity 7,653 - - - - -
Inc./(Dec.) in loans 2,246 2,563 3,046 5,000 500 500
Dividend Paid (Incl. Tax) 449 (502) (1,311) (904) (713) (794)
Others (2,201) (457) (1,073) - - -
Cash Flow from Financing 11,651 1,604 662 4,096 (213) (294)
Inc./(Dec.) in Cash (2,167) 1,698 (460) 9,158 4,729 5,421
Opening Cash balances 5,505 214 2,124 8,539 17,697 22,426
Closing Cash balances 3,338 9,502 8,539 17,697 22,426 27,847
Note: Some of the figures from FY2011 onwards are reclassified; hence not comparable with
previous year numbers
7/30/2019 Sterlite 4Q FY 2013
http://slidepdf.com/reader/full/sterlite-4q-fy-2013 12/13
Sterlite Industries | 4QFY2013 Result Update
April 30, 2013 12
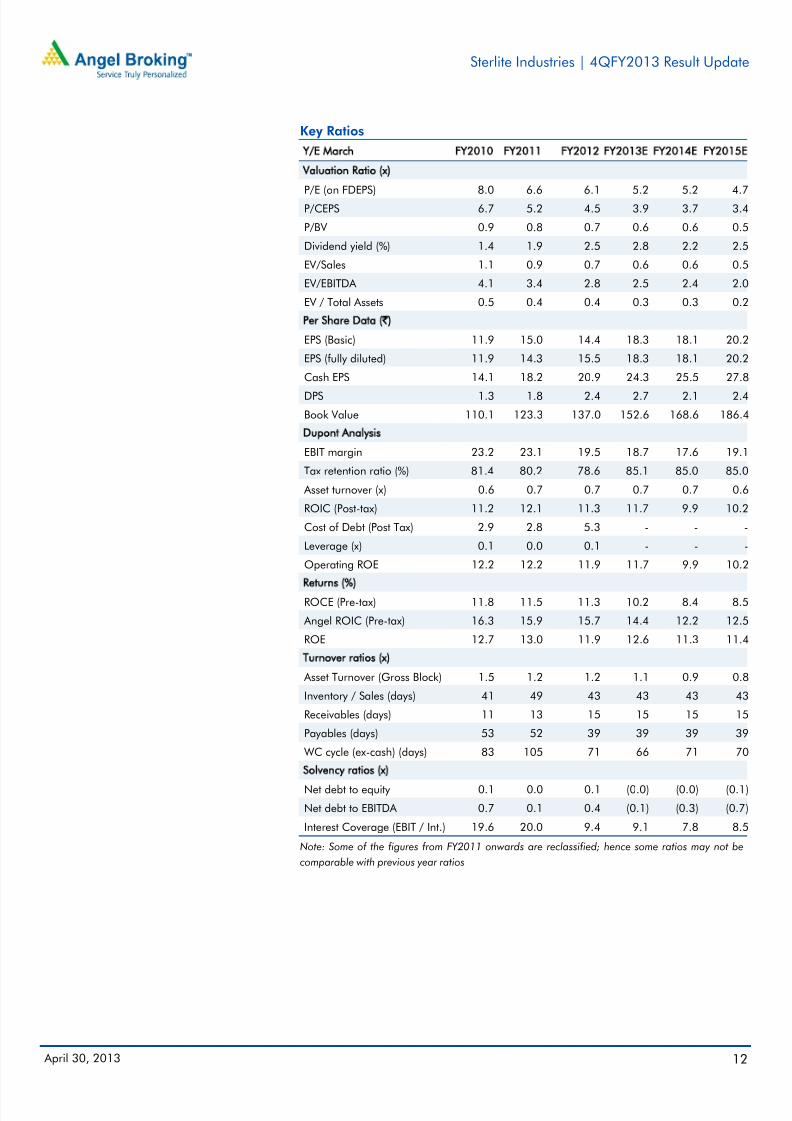
Key Ratios
Y/E March FY2010 FY2011 FY2012 FY2013E FY2014E FY2015E
Valuation Ratio (x)
P/E (on FDEPS) 8.0 6.6 6.1 5.2 5.2 4.7P/CEPS 6.7 5.2 4.5 3.9 3.7 3.4
P/BV 0.9 0.8 0.7 0.6 0.6 0.5
Dividend yield (%) 1.4 1.9 2.5 2.8 2.2 2.5
EV/Sales 1.1 0.9 0.7 0.6 0.6 0.5
EV/EBITDA 4.1 3.4 2.8 2.5 2.4 2.0
EV / Total Assets 0.5 0.4 0.4 0.3 0.3 0.2
Per Share Data (`)EPS (Basic) 11.9 15.0 14.4 18.3 18.1 20.2
EPS (fully diluted) 11.9 14.3 15.5 18.3 18.1 20.2
Cash EPS 14.1 18.2 20.9 24.3 25.5 27.8
DPS 1.3 1.8 2.4 2.7 2.1 2.4
Book Value 110.1 123.3 137.0 152.6 168.6 186.4
Dupont Analysis
EBIT margin 23.2 23.1 19.5 18.7 17.6 19.1
Tax retention ratio (%) 81.4 80.2 78.6 85.1 85.0 85.0
Asset turnover (x) 0.6 0.7 0.7 0.7 0.7 0.6
ROIC (Post-tax) 11.2 12.1 11.3 11.7 9.9 10.2
Cost of Debt (Post Tax) 2.9 2.8 5.3 - - -
Leverage (x) 0.1 0.0 0.1 - - -
Operating ROE 12.2 12.2 11.9 11.7 9.9 10.2
Returns (%)
ROCE (Pre-tax) 11.8 11.5 11.3 10.2 8.4 8.5
Angel ROIC (Pre-tax) 16.3 15.9 15.7 14.4 12.2 12.5
ROE 12.7 13.0 11.9 12.6 11.3 11.4
Turnover ratios (x)
Asset Turnover (Gross Block) 1.5 1.2 1.2 1.1 0.9 0.8
Inventory / Sales (days) 41 49 43 43 43 43
Receivables (days) 11 13 15 15 15 15
Payables (days) 53 52 39 39 39 39
WC cycle (ex-cash) (days) 83 105 71 66 71 70
Solvency ratios (x)Net debt to equity 0.1 0.0 0.1 (0.0) (0.0) (0.1)
Net debt to EBITDA 0.7 0.1 0.4 (0.1) (0.3) (0.7)
Interest Coverage (EBIT / Int.) 19.6 20.0 9.4 9.1 7.8 8.5
Note: Some of the figures from FY2011 onwards are reclassified; hence some ratios may not be
comparable with previous year ratios
7/30/2019 Sterlite 4Q FY 2013
http://slidepdf.com/reader/full/sterlite-4q-fy-2013 13/13
Sterlite Industries | 4QFY2013 Result Update
A il 30 2013 13
Disclosure of Interest Statement Sterlite Industries
1. Analyst ownership of the stock No
2. Angel and its Group companies ownership of the stock No
3. Angel and its Group companies' Directors ownership of the stock No
4. Broking relationship with company covered No
Note: We have not considered any Exposure below ` 1 lakh for Angel, its Group companies and Directors.
Ratings (Returns) : Buy (> 15%) Accumulate (5% to 15%) Neutral (-5 to 5%)Reduce (-5% to -15%) Sell (< -15%)
Research Team Tel: 022 – 3935 7800 E-mail: [email protected] Website: www.angelbroking.com
DISCLAIMER
This document is solely for the personal information of the recipient, and must not be singularly used as the basis of any investment
decision. Nothing in this document should be construed as investment or financial advice. Each recipient of this document should make
such investigations as they deem necessary to arrive at an independent evaluation of an investment in the securities of the companies
referred to in this document (including the merits and risks involved), and should consult their own advisors to determine the merits and
risks of such an investment.
Angel Broking Limited, its affiliates, directors, its proprietary trading and investment businesses may, from time to time, make
investment decisions that are inconsistent with or contradictory to the recommendations expressed herein. The views contained in this
document are those of the analyst, and the company may or may not subscribe to all the views expressed within.
Reports based on technical and derivative analysis center on studying charts of a stock's price movement, outstanding positions and
trading volume, as opposed to focusing on a company's fundamentals and, as such, may not match with a report on a company's
fundamentals.The information in this document has been printed on the basis of publicly available information, internal data and other reliablesources believed to be true, but we do not represent that it is accurate or complete and it should not be relied on as such, as thisdocument is for general guidance only. Angel Broking Limited or any of its affiliates/ group companies shall not be in any way responsible for any loss or damage that may arise to any person from any inadvertent error in the information contained in this report .
Angel Broking Limited has not independently verified all the information contained within this document. Accordingly, we cannot testify,nor make any representation or warranty, express or implied, to the accuracy, contents or data contained within this document. While Angel Broking Limited endeavours to update on a reasonable basis the information discussed in this material, there may be regulatory,compliance, or other reasons that prevent us from doing so.
This document is being supplied to you solely for your information, and its contents, information or data may not be reproduced,
redistributed or passed on, directly or indirectly.
Angel Broking Limited and its affiliates may seek to provide or have engaged in providing corporate finance, investment banking orother advisory services in a merger or specific transaction to the companies referred to in this report, as on the date of this report or in
the past.
Neither Angel Broking Limited, nor its directors, employees or affiliates shall be liable for any loss or damage that may arise from or in
connection with the use of this information.
Note: Please refer to the important ` Stock Holding Disclosure' report on the Angel website (Research Section). Also, pleaserefer to the latest update on respective stocks for the disclosure status in respect of those stocks. Angel Broking Limited andits affiliates may have investment positions in the stocks recommended in this report.