Embed Size (px)
Citation preview

Max-Planck-Institut für Biochemie
Abteilung Strukturforschung
Biologische NMR-Arbeitsgruppe
Structural basis for the regulation of insulin-like growth factors (IGFs) by IGF binding proteins (IGFBPs)
Igor Siwanowicz
Vollständiger Abdruck der von der Fakultät für Chemie der Technischen Universität
München zur Erlangung des akademischen Grades eines
Doktors der Naturwissenschaften
genehmigten Dissertation.
Vorsitzender: Univ.-Prof. Dr. J. Buchner
Prüfer der Dissertation: 1. apl. Prof. Dr. Dr. h. c. R. Huber
2. Univ.-Prof. Dr. Dr. A. Bacher
Die Dissertation wurde am 14.02.2005 bei der Technischen Universität München eingereicht
und durch die Fakultät für Chemie am 11.05.2005 angenommen.

Acknowledgements
I would like to thank everyone who contributed to this work.
In particular I am grateful to Professor Robert Huber for giving me the opportunity to
work in his department and for being my Doktorvater.
To my supervisor Doctor Tad A. Holak, for his support, discussions and
encouragement.
To the laboratory team: Dorota Ksiazek, Grzegorz Popowicz, Joma Joy, Loy D’Silva,
Madhu Ghosh, Magda Wisniewska, Mahavir Singh, Marcin Krajewski, Mariusz
Kamionka, Ola Mikolajka, Pawel Smialowski, Przemyslaw Ozdowy, Sudipta Majumdar,
Till Rehm Tomasz Sitar and Ulli Rothweiler, for creating one of the kind, motivating
atmosphere of competence and creativity.
My special thanks go to Joma, Mahavir, and Sudipta – for the supply of Bollywood
blockbusters and the discussion of thereof; Christine Breitenlechner – for help in the
matters requiring the knowledge of German language and bureaucracy; Narashima
and C. Vinula – for being such unusual specimens; Grzegorz, the source of Anime
artworks and creations, for the ideas and discussions usually not related to the subject
of my studies; Magda – for her patience and care.
Publications
Parts of this thesis have been or will be published in due course:
Siwanowicz, I., Popowicz, G.M., Wisniewska, M., Huber, R., Kuenkele, K-P., Lang, K.,
Engh, R.A., and Holak, T.A. (2005) Structural basis for the regulation of insulin-like
growth factors by IGF binding proteins. Structure 13 (in press).
Siwanowicz, I., Popowicz, G.M., Ghosh, M., Moroder, L., Dsilva, L., Joy, J., Majumdar,
S., Wisniewska, M., Firth, S.M., Baxter, R.C., Huber, R., and Holak T.A. (2005)
Molecular architecture of the insulin-like growth factor binding proteins (IGFBPs). J.
Biol. Chem. (submitted).
Ghosh, M., Shanker, S., Siwanowicz, I., Mann, K., Machleidt, W., and Holak, T.A.
(2005) Proteolysis of insulin-like growth factor binding proteins (IGFBPs) by calpain.
Biological Chemistry 386 (in press).
Budisa, N., Pipitone, O., Siwanowicz, I., Rubini, M., Pal, P.P., Holak, T.A. and Gelmi,
M.L. (2004) Efforts towards the design of 'Teflon' proteins: In vivo translation with
trifluorinated leucine and methionine analogues. Chemistry & Biodiversity 1, 1465-
1475.

Contents
1 Introduction ................................................................................................................... 1
1.1 The IGF system................................................................................................... 1
1.1.1 IGFs ......................................................................................................... 1
1.1.2 IGF receptors ........................................................................................... 4
1.1.2.1 IGF receptor signaling ................................................................... 6
1.1.3 Insulin-like growth factor binding proteins ................................................ 9
1.2 IGF-dependent actions of IGFBPs ..................................................................... 10
1.2.1 Inhibition of IGF-IR binding ...................................................................... 10
1.2.2 Modulation of IGF binding activity of IGFBPs .......................................... 11
1.2.2.1 Association of the IGFBPs to the extracellular matrix (ECM)
or specific cell membranes ............................................................ 11
1.2.2.2 Cleavage of the IGFBPs by specific proteases .............................. 12
1.2.2.3 Dephosphorylation .......................................................................... 13
1.3 IGF-independent actions of the IGFBPs ............................................................. 13
1.4 The structure of the IGFBPs ............................................................................... 16
1.4.1 Posttranslational modifications ................................................................ 18
1.5 IGF – IGFBP interaction ..................................................................................... 19
1.5.1 IGF residues involved in IGFBP binding .................................................. 19
1.5.2 IGFBP residues involved in IGF binding .................................................. 20
1.6 The IGF system and cancer ............................................................................... 21
2 Goals of the study ........................................................................................................ 23
3 Techniques of structure and function analysis .............................................................. 24
3.1 X-ray crystallography .......................................................................................... 24
3.1.1 Crystal space groups and symmetries ..................................................... 24
3.1.2 Crystallization ........................................................................................... 24
3.1.3 X-ray diffraction ....................................................................................... 26
3.1.4 Solving the “phase problem” ................................................................... 26
3.2 NMR spectroscopy ............................................................................................. 29
3.3 Isothermal titration calorimetry ........................................................................... 31
3.4 Fluorescence spectroscopy ................................................................................. 32
4 Materials and laboratory methods ................................................................................. 35
4.1 Materials ............................................................................................................. 35
4.1.1 E. coli strains and plasmids ...................................................................... 35
4.1.2 Cell growth media and stocks .................................................................. 35
4.1.3 Protein purification – buffers ..................................................................... 38
4.1.4 Reagents and buffers for the SDS-PAGE ................................................ 40
4.1.5 Enzymes and other proteins ..................................................................... 42
4.1.6 Kits and reagents ..................................................................................... 42
4.1.7 Protein and nucleic acids markers ........................................................... 43
4.1.8 Chromatography equipment, columns and media .................................... 43
4.2 Laboratory methods and principles ..................................................................... 43
4.2.1 Constructs’ design .................................................................................... 43
4.2.2 Choice of the expression vector ............................................................... 44
4.2.3 DNA techniques ....................................................................................... 46
4.2.3.1 Preparation of plasmid DNA .......................................................... 46
4.2.3.2 PCR ............................................................................................... 46
4.2.3.3 Digestion with restriction enzymes ................................................ 48
4.2.3.4 Purification of PCR and restriction digestion products ................... 48
4.2.3.5 Mutagenesis of the miniNBP-5 and CBP-4 ................................... 49
4.2.3.6 Agarose gel electrophoresis of DNA ............................................. 50
4.2.4 Transformation of E. coli .......................................................................... 50
4.2.4.1 Transformation of chemically competent cells ............................... 51
4.2.4.2 Transformation by electroporation ................................................. 51
4.2.5 Protein chemistry methods & techniques ................................................. 51
4.2.5.1 Sonication ...................................................................................... 51
4.2.5.2 SDS polyacrylamide gel electrophoresis (SDS PAGE) ................. 52
4.2.5.3 Visualization of separated proteins ................................................. 52
4.2.5.4 Protein expression, refolding and purification ................................ 52
4.2.5.5 Determination of protein concentration .......................................... 54
4.2.6 X-ray crystallography ............................................................................... 54
4.2.6.1 protein crystallization ..................................................................... 54
4.2.6.2 Data collection and molecular replacement ................................... 56
4.2.7 NMR - experimental procedure ................................................................ 59
4.2.8 Isothermal titration calorimetry ................................................................. 59
4.2.9 Fluorescence measurements ................................................................... 60
4.2.10 IGF–IR autophosphorylation inhibition assay ........................................ 60
5 Results .......................................................................................................................... 62
5.1 Cloning, expression and purification of IGFBP domains .................................... 62
5.1.1 Protein purification strategies ................................................................... 62
5.1.2 Solubilization of inclusion bodies ............................................................. 66
5.1.3 Immobilized metal affinity chromatography (IMAC) ................................. 66
5.1.4 Refolding .................................................................................................. 66
5.1.5 Ion exchange chromatography ................................................................. 68
5.1.6 Gel filtration chromatography ................................................................... 68
5.2 Preliminary functional and structural studies ...................................................... 68
5.2.1 Gel filtration mobility shift assay ............................................................... 68
5.2.2 NMR studies on the folding and domain organization of IGFBPs ............ 71
5.2.3 Optimization of the carboxyl-terminal construct of IGFBP-4 .................... 71
5.3 Structure of IGFBP-4 .......................................................................................... 74
5.3.1 Crystallization of the binary and ternary complexes ................................. 74
5.3.2 Overall structure of the NBP-4(3-82)/IGF-I binary complex ..................... 75
5.3.3 NBP4(3-82)/IGF-I vs. NBP4(1-92)/IGF-I .................................................. 80
5.3.4 The subdomain organization of NBP-4 .................................................... 82
5.3.5 Ternary complex NBP-4(3-82)/IGF-I/CBP-4(151-232) ............................. 83
5.3.6 The IGF-I/NBP-4 interaction – implications for IGF-I binding
to its receptor ............................................................................................ 86
5.4 Functional studies of IGFBP-4 – IGF interaction ................................................ 86
5.4.1 Binding among domains of IGFBP-4 and IGF as studied with NMR
and ITC measurements ............................................................................ 86
5.4.2 Inhibition of the IGF-I receptor binding and action by IGFBP fragments .. 90
5.4.3 Fine-tuning of the N-terminal “thumb” residues ........................................ 91
5.4.4 Characterization of the thumb microenvironment in the IGFBP/IGF-I
complex by fluorescence spectroscopy .................................................... 91
5.5 Isoquinoline compound NBI-31772 does not cause dissociation
of the IGF-I/IGFBP complex .............................................................................. 94
6 Discussion ..................................................................................................................... 96
6.1 Domain organization of IGFBPs .......................................................................... 96
6.2 Contributions of the N- and C-terminal domains to IGF-I binding ....................... 96
6.3 The IGF-I/NBP-4/CBP-4 interaction .................................................................... 98
6.4 Inhibition of the IGF-I receptor binding and action by IGFBP fragments ............. 103
7 Summary ........................................................................................................................ 107
8 Zusammenfassung ......................................................................................................... 109
9 Appendix ........................................................................................................................ 111
9.1 Abbreviations and symbols .................................................................................. 111

9.2 Isothermal titration calorimetry ............................................................................ 113
9.3 IGF-IR autophosphorylation inhibition assay ....................................................... 117
10 References ................................................................................................................... 118
Chapter 1 Introduction
1
1 Introduction
1.1 The IGF system The identity and function of a developing cell is predestined by the stimuli it receives
from the surrounding environment. Contacts with neighboring cells and signals
received from membrane receptors, which are activated by various specific growth
factors, modulate a gene expression pattern of the cell, leading to differentiation. The
very same stimuli decide fates of the mature cell, i.e. the rate of protein and nucleic
acid synthesis, cell cycle progression, and survival depend on the presence of cell-to-
cell junctions and constant supply of the protein factors. In a cell deprived of this
steady stimulation, anabolic pathways cease and suicidal pathways take over, leading
to apoptosis. Deregulation of extracellular developmental signals may lead to an
opposite extreme situation: quiescent cells commence excessive proliferation, the first
step in cancerogenesis.
It is an ensemble of mutually interacting proteins referred to as “the IGF system”
that plays the key role in regulation of cell development, metabolism and survival
through its life. The IGF system involves two ligands, insulin-like growth factor-I and -II
(IGF-I and IGF-II) that interact with specific type 1 or type 2 IGF receptors (IGF-IR and
IGF-IIR). There are six high affinity IGF binding proteins (IGFBPs) modulating IGF
availability and bioactivity.
1.1.1 IGFs Salmon and Daughaday first identified insulin-like growth factors as “sulphation factor
activity” (Daughaday et al., 1972). Later the term “somatomedin” was introduced,
which was replaced by “insulin-like growth factor” because of its structural homology
with insulin (Rinderknecht and Humbel, 1976). Rinderknecht and Humbel revealed the
amino acid sequences of both IGF-I and IGF-II in 1978 (Rinderknecht and Humbel,
1978a; 1978b). Almost all cell types express IGF receptors, and therefore respond to
IGF stimulation of growth and differentiation. Both IGF-I and –II are required for normal
embryonic and fetal development. Postnatally IGF-I mediates the growth-promoting
effect of growth hormone (GH) (Schlechter et al., 1986; Daughaday et al., 1999) and is
Chapter 1 Introduction
2
the major regulator of animal skeletal growth, maintaining bone mass throughout life.
IGF-I augments wound healing by acting at several sites during the repair process
(Chan and Spencer, 1998; Suh et al., 1992). Also, nerve cell survival and regeneration
is promoted by IGF-I (Leventhal et al., 1999; Jung et al., 1998). IGF-I is anti-apoptotic
and autocrine production by tumors is common. In the kidney, IGF-I increases the
glomerular filtration rate, phosphate transport, and the activity of 25-hydroxyvitamin D-
1-α-hydroxylase (Halloran and Spencer, 1988). The primary regulator of IGF-I
expression is growth hormone. Developmental expression of IGF-I in various tissues
precedes however that of GH, supporting an independent role of IGF-I in embryonic
and fetal life.
Human IGF-I and IGF-II are single-chain polypeptides. IGF-I is a basic peptide
and contains 70 amino acids, with IGF-II being slightly an acidic protein containing 67
amino acids. The amino acids of both IGF-I and -II are grouped into domains A and B
(similar to insulin), domain C (analogous to the connecting peptide of proinsulin) and
the C-terminal octapeptide (D region, 63–70) that has no counterpart in insulins and
proinsulins (Baxter et al., 1992). Both IGF factors contain three disulphide bonds, and
display approximately 62 percent sequence homology with each other and 47 percent
with insulin (Figure 2). In addition to the classical IGF-I molecules a truncated form of
IGF-I known as DES(1- 3)IGF-I has been found in fetal and adult human brain
(Carlsson–Skwirut et al., 1986; Sara et al., 1986; Humbel, 1990). DES(1-3)IGF-I is the
product of differential processing of pro-IGF-I lacking the first three residues at the
amino terminus: Gly-Pro-Glu (GPE). The biological potency of this truncated form is 10
times higher than that of the full-length form and is explained by reduced binding to
IGF-binding proteins (Francis et al., 1988; Beck et al., 1993; Carlsson–Skwirut et al.,
1989; Ballard et al., 1996).
The 3-dimensional crystal structure of insulin has been first determined in the late
1960s (Adams et al., 1969), and several structures of its variants, mutants and
oligomeric forms of insulin are known today. This is in contrast to IGFs, for which no
high-definition structure existed until recently. The structures of IGFs obtained from
NMR studies were of low resolution due to the tendency of the proteins to aggregate at
higher concentrations and pH values >3. These studies confirmed however the
consistency of the solution structure of IGF-I with its model, deduced from the porcine
insulin structure (Blundell et al., 1978; Cooke et al., 1991; Sato et al., 1993). Only very
recently two crystal structures of IGF-I have been published: in a complex with amino-
Chapter 1 Introduction
3
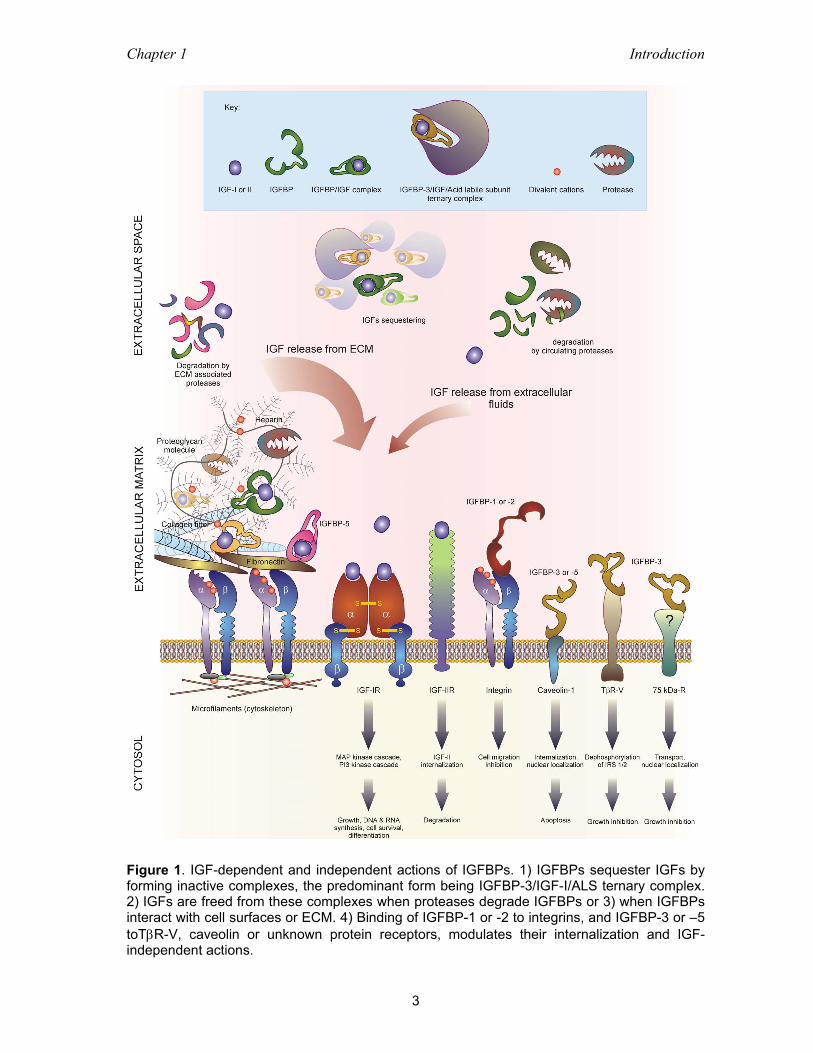
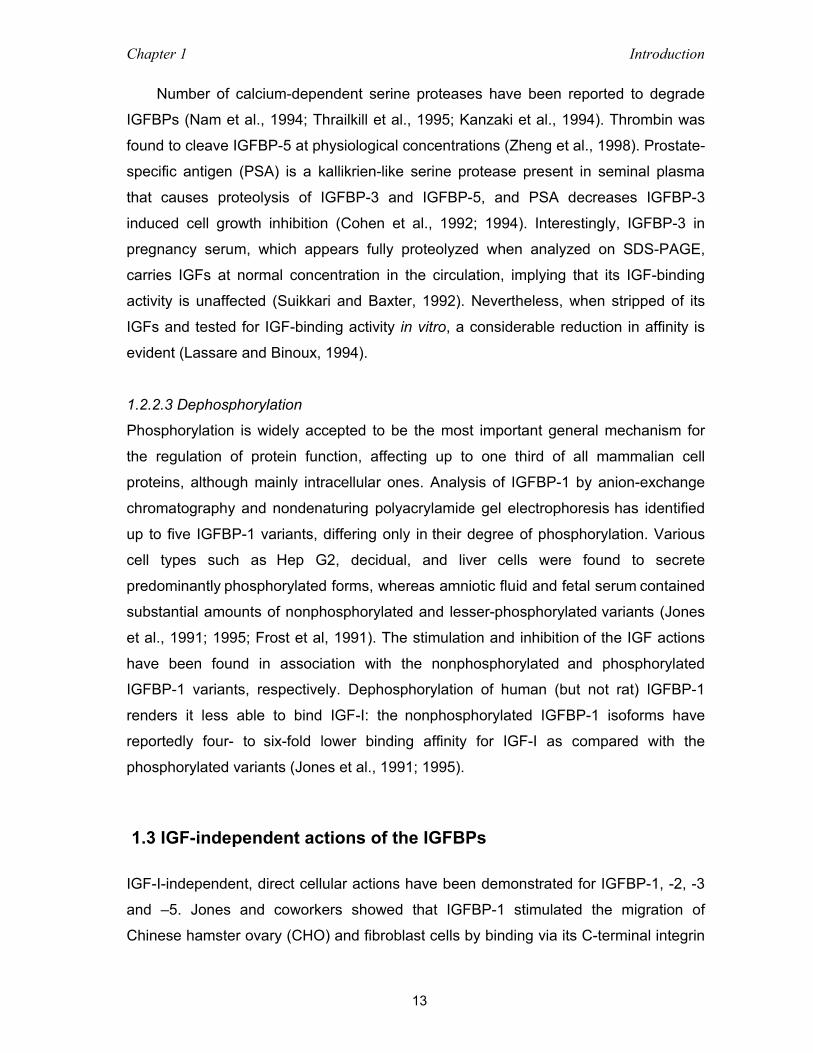
Figure 1. IGF-dependent and independent actions of IGFBPs. 1) IGFBPs sequester IGFs by forming inactive complexes, the predominant form being IGFBP-3/IGF-I/ALS ternary complex. 2) IGFs are freed from these complexes when proteases degrade IGFBPs or 3) when IGFBPs interact with cell surfaces or ECM. 4) Binding of IGFBP-1 or -2 to integrins, and IGFBP-3 or –5 toTβR-V, caveolin or unknown protein receptors, modulates their internalization and IGF-independent actions.
Chapter 1 Introduction
4
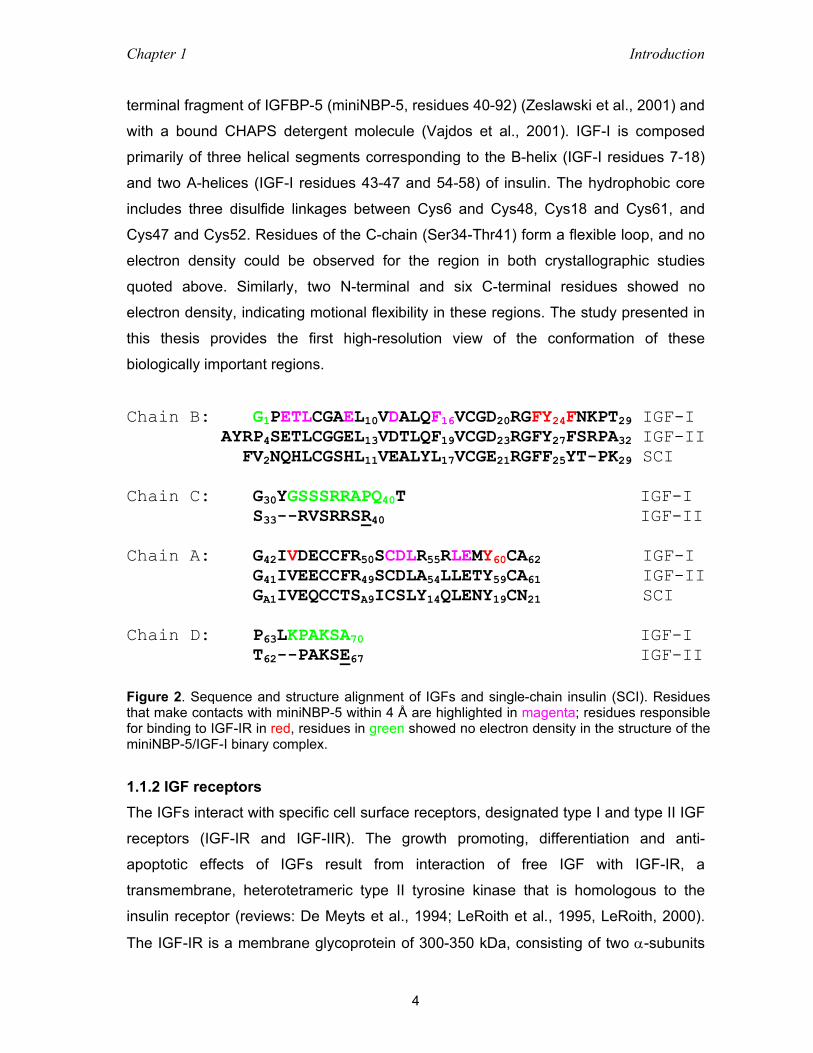
terminal fragment of IGFBP-5 (miniNBP-5, residues 40-92) (Zeslawski et al., 2001) and
with a bound CHAPS detergent molecule (Vajdos et al., 2001). IGF-I is composed
primarily of three helical segments corresponding to the B-helix (IGF-I residues 7-18)
and two A-helices (IGF-I residues 43-47 and 54-58) of insulin. The hydrophobic core
includes three disulfide linkages between Cys6 and Cys48, Cys18 and Cys61, and
Cys47 and Cys52. Residues of the C-chain (Ser34-Thr41) form a flexible loop, and no
electron density could be observed for the region in both crystallographic studies
quoted above. Similarly, two N-terminal and six C-terminal residues showed no
electron density, indicating motional flexibility in these regions. The study presented in
this thesis provides the first high-resolution view of the conformation of these
biologically important regions.
Chain B: G1PETLCGAEL10VDALQF16VCGD20RGFY24FNKPT29 IGF-I AYRP4SETLCGGEL13VDTLQF19VCGD23RGFY27FSRPA32 IGF-II FV2NQHLCGSHL11VEALYL17VCGE21RGFF25YT-PK29 SCI Chain C: G30YGSSSRRAPQ40T IGF-I S33--RVSRRSR40 IGF-II Chain A: G42IVDECCFR50SCDLR55RLEMY60CA62 IGF-I G41IVEECCFR49SCDLA54LLETY59CA61 IGF-II GA1IVEQCCTSA9ICSLY14QLENY19CN21 SCI Chain D: P63LKPAKSA70 IGF-I T62--PAKSE67 IGF-II
Figure 2. Sequence and structure alignment of IGFs and single-chain insulin (SCI). Residues that make contacts with miniNBP-5 within 4 Å are highlighted in magenta; residues responsible for binding to IGF-IR in red, residues in green showed no electron density in the structure of the miniNBP-5/IGF-I binary complex.
1.1.2 IGF receptors The IGFs interact with specific cell surface receptors, designated type I and type II IGF
receptors (IGF-IR and IGF-IIR). The growth promoting, differentiation and anti-
apoptotic effects of IGFs result from interaction of free IGF with IGF-IR, a
transmembrane, heterotetrameric type II tyrosine kinase that is homologous to the
insulin receptor (reviews: De Meyts et al., 1994; LeRoith et al., 1995, LeRoith, 2000).
The IGF-IR is a membrane glycoprotein of 300-350 kDa, consisting of two α-subunits

Chapter 1 Introduction
5
(135 kDa each) and two β-subunits (90 kDa each) (Figure 1) (Rechler, 1985; Yamasaki
et al., 1993). Disulphide bonds connect both alpha and beta-subunits to form a
functional heterotetrameric receptor complex. In analogy with the insulin receptor, IGF-
I receptor subunits are encoded within a single 180 kDa polypeptide precursor that is
glycosylated, dimerised and proteolytically processed to yield the mature alpha-2-beta-
2-form of the receptor. The α-subunit is entirely extracellular and contains the ligand-
binding site, a cysteine-rich domain. The β-subunit contains the hydrophobic
transmembrane domain with a short extracellular region, and a tyrosine kinase domain
in its cytoplasmic portion. However, the mature brain also expresses a structural
subtype of the IGF-I receptor, which appears to be unique to differentiated neurons.
This receptor consists of a lower mass α-subunit of 115 kDa (Heidenreich et al., 1986;
Burgess et al., 1987). The structure of the first three domains of the extracellular
portion of IGF-IR (L1-Cys-rich-L2, residues 1-462) has been determined to a 2.6 Å
resolution (Garrett et al., 1998). The L domains (L stands for “large”) each adopt a
compact shape consisting of a single-stranded right-handed β-helix. The Cys-rich
region is composed of eight disulphide-bonded modules, seven of which form a rod-
shaped domain. The receptor fragment is not active in terms of IGF binding.
Information on ligand binding has come from chemical crosslinking with
derivatised insulin or IGFs and from the analysis of receptor chimaeras and receptors
with point mutations (reviewed in: Adams et al., 2000). The residues of IGF-I and –II
engaged in binding of IGF-IR have been mapped in a number of studies (Cascieri et
al., 1988 and 1989; Bayne et al., 1990; Sakano et al., 1991; Roth et al., 1991; Darren
et al., 1996). The topic of IGF/IGF-IR interaction is covered in detail in the Discussion
section of this thesis.
The physiological functions of insulin and IGFs are very different, while their
receptor structures are similar. Tissue distribution of the individual receptors, the
specificity of the ligand-receptor interaction, the rate of internalization and the small
structural differences between the two receptors explain the well-characterized
divergent physiological functions of insulin and IGFs. For example, the liver expresses
only the insulin receptor and fat cells express mainly IRs. For this reasons these
tissues display metabolic responses such as glucose uptake and lipid synthesis.
Further, the IGF-IR ligands include IGFs and insulin. The IGF-IR binds IGF-I with a
high affinity (ca. 0.1 nM), IGF-II with a 10-fold lower affinity, and insulin with a 100-
1000 fold lower affinity (Bohannon et al., 1988; Lesniak et al., 1988). On the other
Chapter 1 Introduction
6
hand, IR demonstrates high-affinity binding to insulin (ca. 0.1 nM), 10-fold lower affinity
binding to IGF-II, and a 100-fold lower affinity binding to IGF-I. The IR is mainly
involved in short-term metabolic effects, while the IGF-IR is predominantly involved in
long-term growth/mitogenic effects (Rechler, 1985; LeRoith et al. 1995). The structural
differences between both receptors are also involved in different intracellular signaling.
For example, the IR contains two distal tyrosine residues, whereas the IGF-IR contains
three tyrosine residues, and the tyrosine kinases of both receptors show distinct
preferences for the tyrosine phosphorylation domains of insulin receptor substrate 1
(IRS 1) (De Meyts et al., 1994).
The IGF-II receptor (IGF-IIR) consists of a single glycosylated polypeptide of
approximately 260 kDa. It is primarily extracellular, having a short cytoplasmic tail and
consists of 15 repeat mannose-6-phosphate (M6P)-binding units (August et al., 1983;
Kornfeld, 1992). In 1987, Morgan and coworkers cloned the IGF-II receptor and
revealed that it is identical to the cation-independent mannose-6-phosphate (Man-6-P)
receptor that is involved in transport of Man-6-P-bearing lysosomal enzymes from their
sites of synthesis into an endosomal/pre-lysosomal compartment (Morgan et al, 1987;
reviews: Braulke, 1999, Hassan, 2003). This finding was confirmed by showing that the
IGF-II receptor binds independently both IGF-II and lysosomal enzymes that contain
M6P. Several studies have shown that the binding sites for IGF-II and M6P on the
receptor are distinct, and that the receptor can bind both ligands simultaneously
(MacDonald et al., 1988; Nissley and Kiess, 1991).
IGF-IIR binds IGF-II with high affinity but interacts minimally with IGF-I and does
not bind to insulin at all. Gene targeting studies revealed that IGF-IIR is important for
the control of embryonic growth, and for internalization and degradation of extracellular
IGF-II (reviews: Braulke, 1999; Hassan, 2003), however, it is unclear whether this
receptor is involved in IGF-II signaling. The M6P/IGF-IIR was identified as a putative
“IQ gene”. Comparing Caucasian children with an IQ of 160 or higher with those with
an average IQ, showed that the M6P/IGF2R is linked to human cognitive ability
(Chorney et al. 1998).
1.1.2.1 IGF receptor signaling
IGF-I binding to a cysteine-rich domain in the extracellular α subunit of IGF-IR causes
autophosphorylation of three tyrosines in the activation loop of the tyrosine kinase
domain in the cytoplasmic portion of the β subunit, which results in amplification of
Chapter 1 Introduction
7
tyrosine kinase activity and further autophosphorylation of additional tyrosine residues.
These phosphotyrosine containing motifs are binding sites for adaptor and effector
molecules in receptor signaling pathways, including insulin receptor substrates and Src
homology/collagen (Shc), which are subsequently phosphorylated on their tyrosines
(reviewed in White and Kahn, 1998; Kim et al., 1998). The IRSs are known as
“docking” proteins and constitute a family of four structurally related adaptor proteins
that can link the IGF-I receptor to downstream signal transduction mediators regulating
cellular growth. IRS 1 is the most extensively studied, and has multiple tyrosines,
which associates with SH2 domain-containing proteins including growth factor receptor
bound-2 protein (Grb2) and p85 regulatory subunit of phosphoinositol-3 (PI-3) kinase,
p110. phosphorylation of IRS 1 and 2 leads to activation of two downstream signaling
cascades: 1) the mitogen-activated protein kinase (MAPK) and the 2) phosphatidyl-
inositol 3-kinase (P3K) cascades (Figure 3).
1) Stimulation of growth factor receptor-bound protein 2 (Grb2) by activated IRS
1/2 or Shc leads to the coupling of Grb2 with the guanyl nucleotide exchange factor
son of sevenless (Sos), which in turn activates ras. In the ras pathway,
phosphorylation of c-raf 1 activates the downstream protein kinase, MAP kinase kinase
1 (also known as MEK or MKK1) or MAP kinase kinase 2 (MKK2). MKK1 and MKK2
activate two members of the MAP kinase family; extracellular signal related protein
kinase (ERK)-1 and -2. Phosphorylated ERK-1 and (or) ERK-2 are translocated to the
nucleus where in turn they phosphorylate a variety of transcription factors including c-
fos, c-jun and c-myc. This signaling cascade is important for cellular growth and
mitogenesis (Hernandez-Sanchez et al., 1995). The c-Myc protooncogene encodes a
nuclear transcription factor that is both necessary and sufficient to trigger entry of
certain cell types into the S-phase of the cell cycle (Cole, 1986).
2) IGF-IR-activated IRS 1 binds the regulatory p85 alpha-subunit of PI-3 kinase,
and this complex activates the 110-kDa catalytic subunit, which phosphorylates
phosphoinositides, generating PI-3 phosphate, PI-3, 4-bisphosphate, and PI-3, 4, 5-
triphosphate (reviewed in Myers and White, 1995). These phosphatidylinositides in
turn activate protein kinases including p70 ribosomal protein S6 kinase (p70s6k), and
protein kinase B (PKB/Akt) as well as other less characterised downstream molecules
(Datta et al., 1997; Du and Montminy, 1998; Myers et al., 1994). This pathway is
important for IGF-mediated survival, enhancement of cellular motility and protein
synthesis, retaining of cell-to-cell junctions and protection from programmed cell death.
Chapter 1 Introduction
8
Chapter 1 Introduction
9
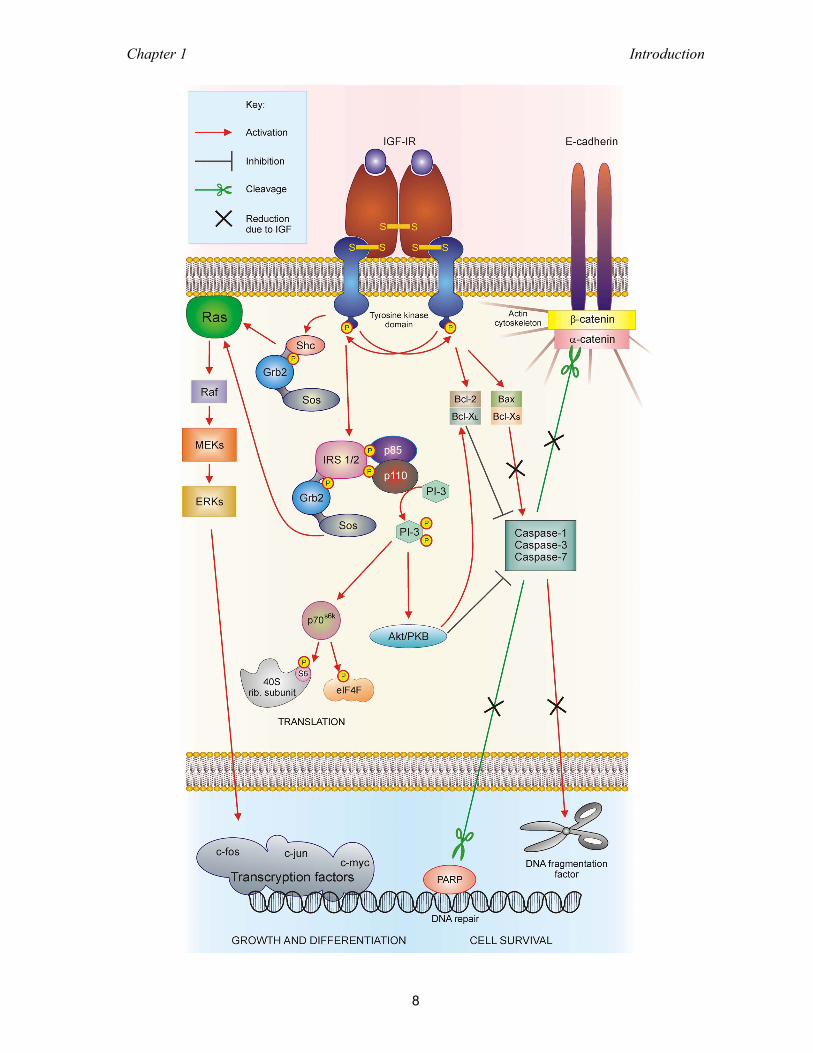
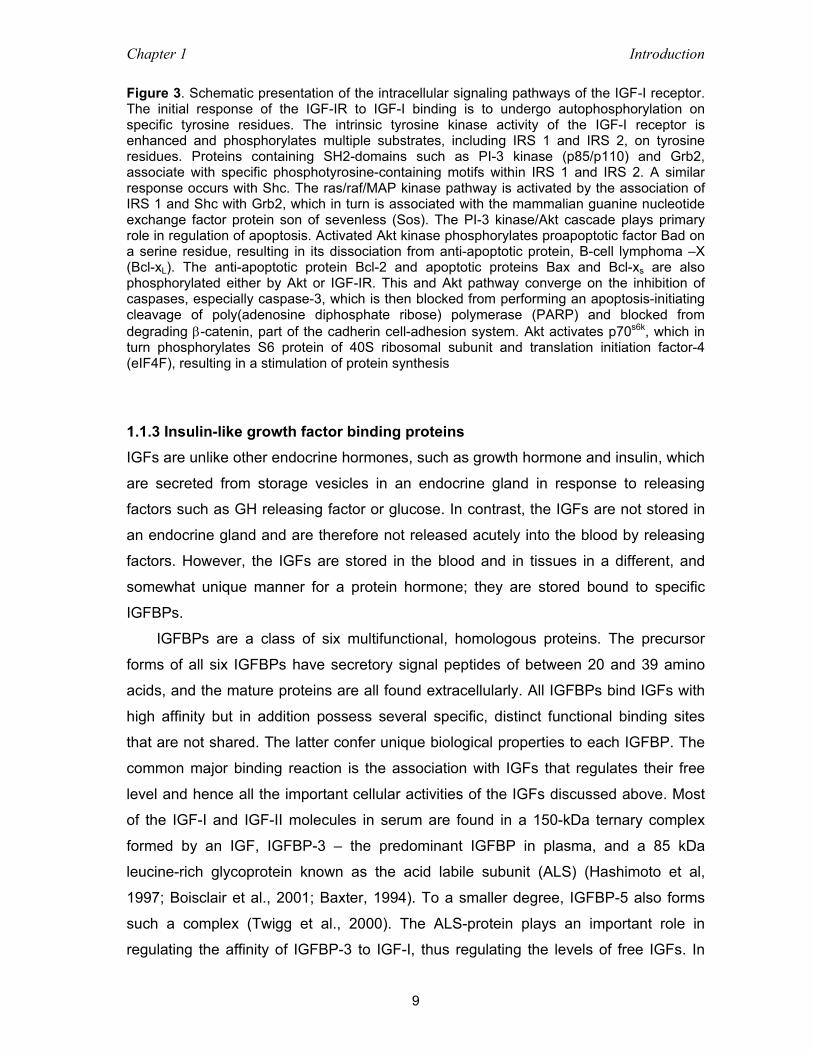
Figure 3. Schematic presentation of the intracellular signaling pathways of the IGF-I receptor. The initial response of the IGF-IR to IGF-I binding is to undergo autophosphorylation on specific tyrosine residues. The intrinsic tyrosine kinase activity of the IGF-I receptor is enhanced and phosphorylates multiple substrates, including IRS 1 and IRS 2, on tyrosine residues. Proteins containing SH2-domains such as PI-3 kinase (p85/p110) and Grb2, associate with specific phosphotyrosine-containing motifs within IRS 1 and IRS 2. A similar response occurs with Shc. The ras/raf/MAP kinase pathway is activated by the association of IRS 1 and Shc with Grb2, which in turn is associated with the mammalian guanine nucleotide exchange factor protein son of sevenless (Sos). The PI-3 kinase/Akt cascade plays primary role in regulation of apoptosis. Activated Akt kinase phosphorylates proapoptotic factor Bad on a serine residue, resulting in its dissociation from anti-apoptotic protein, B-cell lymphoma –X (Bcl-xL). The anti-apoptotic protein Bcl-2 and apoptotic proteins Bax and Bcl-xs are also phosphorylated either by Akt or IGF-IR. This and Akt pathway converge on the inhibition of caspases, especially caspase-3, which is then blocked from performing an apoptosis-initiating cleavage of poly(adenosine diphosphate ribose) polymerase (PARP) and blocked from degrading β-catenin, part of the cadherin cell-adhesion system. Akt activates p70s6k, which in turn phosphorylates S6 protein of 40S ribosomal subunit and translation initiation factor-4 (eIF4F), resulting in a stimulation of protein synthesis
1.1.3 Insulin-like growth factor binding proteins IGFs are unlike other endocrine hormones, such as growth hormone and insulin, which
are secreted from storage vesicles in an endocrine gland in response to releasing
factors such as GH releasing factor or glucose. In contrast, the IGFs are not stored in
an endocrine gland and are therefore not released acutely into the blood by releasing
factors. However, the IGFs are stored in the blood and in tissues in a different, and
somewhat unique manner for a protein hormone; they are stored bound to specific
IGFBPs.
IGFBPs are a class of six multifunctional, homologous proteins. The precursor
forms of all six IGFBPs have secretory signal peptides of between 20 and 39 amino
acids, and the mature proteins are all found extracellularly. All IGFBPs bind IGFs with
high affinity but in addition possess several specific, distinct functional binding sites
that are not shared. The latter confer unique biological properties to each IGFBP. The
common major binding reaction is the association with IGFs that regulates their free
level and hence all the important cellular activities of the IGFs discussed above. Most
of the IGF-I and IGF-II molecules in serum are found in a 150-kDa ternary complex
formed by an IGF, IGFBP-3 – the predominant IGFBP in plasma, and a 85 kDa
leucine-rich glycoprotein known as the acid labile subunit (ALS) (Hashimoto et al,
1997; Boisclair et al., 2001; Baxter, 1994). To a smaller degree, IGFBP-5 also forms
such a complex (Twigg et al., 2000). The ALS-protein plays an important role in
regulating the affinity of IGFBP-3 to IGF-I, thus regulating the levels of free IGFs. In
Chapter 1 Introduction
10
addition, ALS-proteins increase the molecular mass of the IGF-IGFBP-3 complex so
that the access of the circulating IGFs to the extracellular fluid and thus to the various
tissues is limited. IGFs are released from the 150-kDa complexes by limited proteolysis
of IGFBP-3 and cross the vascular endothelial barrier alone or associated with smaller
IGFBPs.
The other 20-25% of the IGFs is associated with lower mass IGFBPs, and less
then 1% of IGFs circulate in the free forms (Baxter, 1994; Hashimoto et al, 1997).
However, not only can IGFBPs inhibit IGF actions, all, except IGFBP-4, can potentiate
specific activities of the IGFs under certain experimental conditions (reviewed in Firth
and Baxter, 2002). In addition, the IGFBPs have IGF-independent receptor-mediated
actions on cells, which can also be inhibitory or stimulatory (see below).
1.2 IGF-dependent actions of IGFBPs It is broadly agreed that the functions of IGFBPs which regulate the endocrine actions
of IGFs are: 1) regulation of the rate of transport of IGFs from the vascular
compartment to enhance the growth-potentiating effects of IGFs, 2) prolongation of the
plasma half-lives of IGFs and 3) inhibition of the insulin-like activity of IGFs.
1.2.1 Inhibition of IGF-IR binding IGFBPs regulate the bioactivity of IGFs in several ways. They transport the IGFs to
and from the extracellular fluid and control the level of the biologically active, free IGFs
since binding partially inactivates the IGFs. As a consequence of the high affinities of
the IGFBPs only ca. 0.5% of IGFs in the plasma are free to act and thus IGFs do not
produce hypoglycemia physiologically because of the IGFBPs (Martin and Baxter,
1999). Since their affinity is 10-fold higher, the IGFBPs compete favorably with the
tissue IGF receptors and can inhibit the stimulatory actions of IGFs on cellular
proliferation, migration and differentiation. IGFBPs 1, 2, 3 and 5 have been shown to
block the anti-apoptotic effects of IGFs on a variety of normal and malignant cells
(Martin and Baxter, 1999). IGFBPs also prolong the half-life of IGFs, increasing it from
7-9 min to 30-40 min. In plasma the half-life is increased to 18 hours because once
IGFs bind IGFBP-3, the complex associates with the acid labile subunit.
Chapter 1 Introduction
11
1.2.2 Modulation of IGF binding activity of IGFBPs The IGFBP interaction with IGF can change from a high affinity stable complex to a
highly labile one when IGF release is required. In the tissues the release of IGFs from
the IGFBPs can be modulated by three mechanisms, which function to decrease the
affinity of the IGFBPs to the IGFs and act as a sustaining local source of IGFs to the
IGF receptor.
1.2.2.1 Association of the IGFBPs to the extracellular matrix (ECM) or specific cell
membranes
The unique ability of IGFBPs to potentiate rather than inhibit certain actions of the IGFs
involves tissue association of the IGFBPs. Cell surface and ECM association is one of
the possible mechanisms to alter the affinity of IGFBPs for the IGFs. Cell associated
IGFBP-3 and -5 have a 3 to 40-fold lower affinity for IGF-I than that of free, soluble
proteins. For IGFBP-3, a 40-fold lower IGF-I affinity was reported when bound to the
human fibroblast cell lines GM10 and T98G compared with IGFBP-3 in solution
(McCusker et al., 1997); IGFBP-2, which associates with cell-surface proteoglycans in
the brain, shows a threefold decrease in IGF affinity when bound to chondroitin sulfate
(Russo et al., 1997). The partition between membrane associated and soluble IGFBPs
seems to be multivalent cation dependent. Zinc was shown to prevent the loss of cell-
associated IGFBP-3 and –5, and at the same time lower their IGF binding affinity
(McCusker et al., 1990, 1997; Sackett and McCusker, 1998a,b). Simultaneously, zinc
increases the affinity of the IGF-IR for both IGF-I and –II (McCusker et al., 1998). Metal
ions interact with IGFBP-3 and -5 through a specific metal binding site, localized in the
C-domain (Singh et al, 2004).
Components of cell membranes and extracellular matrix that interact with IGFBPs
include proteoglycans, heparin (Andress, 1995), integrin (Jones et al., 1993),
fibronectin (Xu et al., 2004) and vitronectin (Nam et al., 2002). Only vitronectin has
been shown unequivocally to modulate IGF binding by IGFBP-5 directly. Binding of
fibronectin to IGFBP-5 had no effect on its ability to bind IGF-I, but it increased the
proteolytic degradation of IGFBP-5, and hence IGF release (Xu et al., 2004). Certain
proteases, such as thrombin or pregnancy-associated plasma protein-A (PAPP-A)
have been shown to be present in the extracellular matrix of human tissues. Presence
of the proteolytic enzymes in ECM may account for degradation of IGFBPs directed to
this compartment (see below). Both IGFBP-1 and IGFBP-2 have an Arg-Gly-Asp
Chapter 1 Introduction
12
(RGD) motif, which was shown to bind α5β1 integrin and consequently to mediate cell
surface association of these IGFBPs (Jones et al., 1993). In this circumstance,
integrin-bound IGFBP could act as a reservoir for IGF, which provides a high
concentration of IGF to stimulate the IGF-I receptor. There is no evidence for cell
surface association of IGFBP-4 (Kelley et al. 1996), suggesting that IGFBP-4 exists
primarily in a soluble extracellular form and this may be why IGFBP-4 is generally
considered the only purely inhibitory IGFBP.
1.2.2.2 Cleavage of the IGFBPs by specific proteases
Each of the six IGFBPs can undergo proteolysis, which results in a generation of
fragments with markedly decreased affinity for IGFs. Members of several classes of
proteases have shown the ability to cleave IGFBPs, including kallikreins, cathepsins
and matrix metalloproteases. While some of the IGFBP proteases can use multiple
IGFBPs as substrate, there are apparently proteases that are specific for individual
IGFBPs (reviews: Maile et al., 1999, Schneider et al., 2002). Proteolysis is a major
regulatory mechanism of IGFBP-4 functions. An IGF-dependent IGFBP-4-specific
protease was first reported in the media conditioned by both human and sheep dermal
fibroblasts (Fowlkes and Freemark, 1992). This proteolytic activity has also been
detected in the conditioned media from human osteoblasts (Qin et al., 1999), vascular
smooth muscle cells (Bayes-Genis et al., 2001), granulosa cells (Conover et al. 2001),
trophoblast and decidualized endometrial stromal cells (Giudice et al., 2002), as well
as in ovarian follicular fluid (Conover et al., 1999) and human pregnancy serum (Byun
et al. 2001b). The protein factor responsible for this activity was identified as
pregnancy-associated plasma protein-A (PAPP-A) (Lawrence et al., 1999a). As the
name implicates, PPAP-A was first isolated from human pregnancy serum (Lin et al.,
1974) and belongs to the large metzincin family of metalloproteases (Lawrence et al.
1999b; Boldt et al., 2001). It cleaves IGFBP-4 at a single site, between Met135/Lys136
in human IGFBP-4 (Byun et al., 2000, Laursen et al. 2002). IGFBP-4 cleavage by
PAPP-A uniquely depends on the presence of IGF (Byun et al., 2000; Qin et al., 2000;
Laursen et al., 2001). Recent data suggest that IGFs enhance the proteolysis by
binding to IGFBP-4, but not by interaction with PAPP-A (Qin et al., 2000; Laursen et
al., 2001). PAPP-A can also cleave bovine IGFBP-2 between Gln165/Met166 in an
IGF-dependent manner (Monget et al. 2003).
Chapter 1 Introduction
13
Number of calcium-dependent serine proteases have been reported to degrade
IGFBPs (Nam et al., 1994; Thrailkill et al., 1995; Kanzaki et al., 1994). Thrombin was
found to cleave IGFBP-5 at physiological concentrations (Zheng et al., 1998). Prostate-
specific antigen (PSA) is a kallikrien-like serine protease present in seminal plasma
that causes proteolysis of IGFBP-3 and IGFBP-5, and PSA decreases IGFBP-3
induced cell growth inhibition (Cohen et al., 1992; 1994). Interestingly, IGFBP-3 in
pregnancy serum, which appears fully proteolyzed when analyzed on SDS-PAGE,
carries IGFs at normal concentration in the circulation, implying that its IGF-binding
activity is unaffected (Suikkari and Baxter, 1992). Nevertheless, when stripped of its
IGFs and tested for IGF-binding activity in vitro, a considerable reduction in affinity is
evident (Lassare and Binoux, 1994).
1.2.2.3 Dephosphorylation
Phosphorylation is widely accepted to be the most important general mechanism for
the regulation of protein function, affecting up to one third of all mammalian cell
proteins, although mainly intracellular ones. Analysis of IGFBP-1 by anion-exchange
chromatography and nondenaturing polyacrylamide gel electrophoresis has identified
up to five IGFBP-1 variants, differing only in their degree of phosphorylation. Various
cell types such as Hep G2, decidual, and liver cells were found to secrete
predominantly phosphorylated forms, whereas amniotic fluid and fetal serum contained
substantial amounts of nonphosphorylated and lesser-phosphorylated variants (Jones
et al., 1991; 1995; Frost et al, 1991). The stimulation and inhibition of the IGF actions
have been found in association with the nonphosphorylated and phosphorylated
IGFBP-1 variants, respectively. Dephosphorylation of human (but not rat) IGFBP-1
renders it less able to bind IGF-I: the nonphosphorylated IGFBP-1 isoforms have
reportedly four- to six-fold lower binding affinity for IGF-I as compared with the
phosphorylated variants (Jones et al., 1991; 1995).
1.3 IGF-independent actions of the IGFBPs IGF-I-independent, direct cellular actions have been demonstrated for IGFBP-1, -2, -3
and –5. Jones and coworkers showed that IGFBP-1 stimulated the migration of
Chinese hamster ovary (CHO) and fibroblast cells by binding via its C-terminal integrin
Chapter 1 Introduction
14
receptor recognition RGD sequence to the cellular α5β1 integrin (fibronectin receptor)
(Jones et al., 1993). However, the same interaction was shown to inhibit IGF-I
stimulated as well as basal motility of breast cancer cell line MDA-231BO (Zhang et al.,
2002). It is possible, that IGFBP-1 competes with fibronectin and blocks integrin-
mediated effect required for cell migration. The Arg-Gly-Asp motif in IGFBP-1 also
appears to be involved in the induction of focal adhesion kinase dephosphorylation,
cell detachment, and subsequent apoptosis, because IGFBP-1 and a synthetic Arg-
Gly-Asp-containing peptide had similar effects in initiating these events in breast
cancer cells (Perks et al., 1999). Thus, it appears that the effect of IGFBP-1 on integrin
function could be cell specific. IGFBP-2, the only other IGFBP with RGD sequence,
binds to αvβ3 integrin and is localized efficiently to αvβ3 -expressing tumors. The
interaction was found to mediate reduced migration and was associated with reduced
in vivo tumor growth (Pereira et al., 2004).
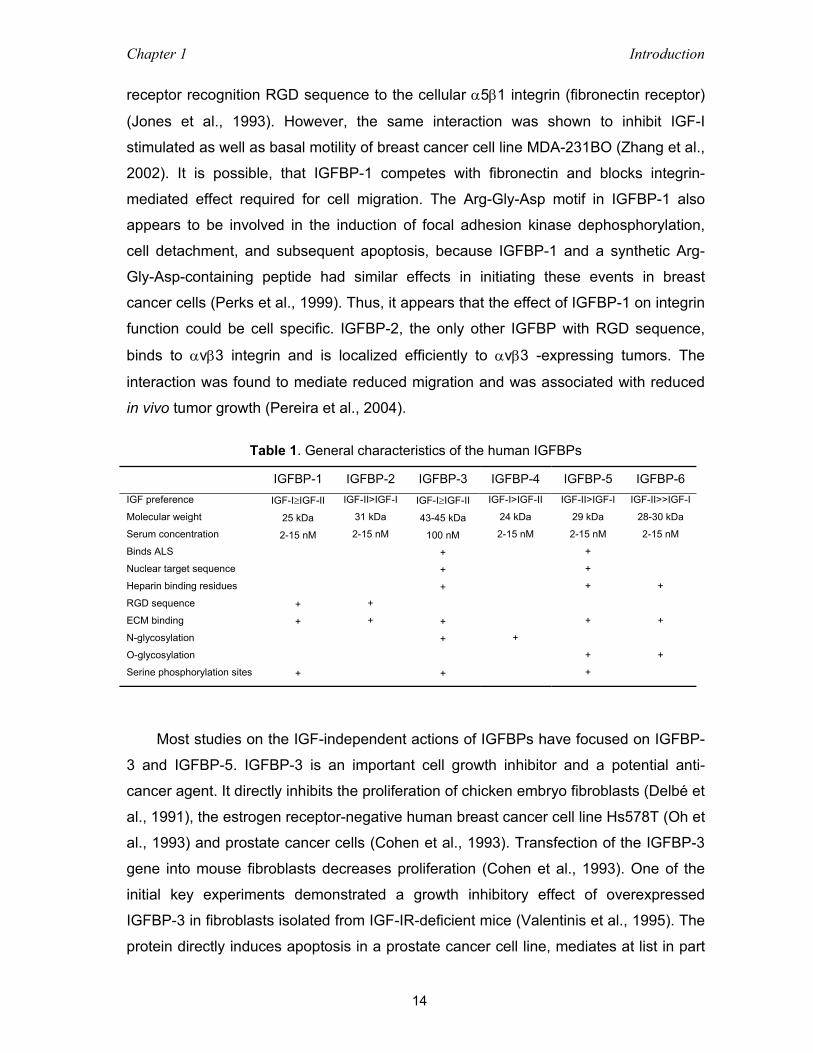
Table 1. General characteristics of the human IGFBPs
IGFBP-1 IGFBP-2 IGFBP-3 IGFBP-4 IGFBP-5 IGFBP-6 IGF preference
Molecular weight
Serum concentration
Binds ALS
Nuclear target sequence
Heparin binding residues
RGD sequence
ECM binding
N-glycosylation
O-glycosylation
Serine phosphorylation sites
IGF-I≥IGF-II
25 kDa
2-15 nM
+
+
+
IGF-II>IGF-I
31 kDa
2-15 nM
+
+
IGF-I≥IGF-II
43-45 kDa
100 nM
+
+
+
+
+
+
IGF-I>IGF-II
24 kDa
2-15 nM
+
IGF-II>IGF-I
29 kDa
2-15 nM
+
+
+
+
+
+
IGF-II>>IGF-I
28-30 kDa
2-15 nM
+
+
+
Most studies on the IGF-independent actions of IGFBPs have focused on IGFBP-
3 and IGFBP-5. IGFBP-3 is an important cell growth inhibitor and a potential anti-
cancer agent. It directly inhibits the proliferation of chicken embryo fibroblasts (Delbé et
al., 1991), the estrogen receptor-negative human breast cancer cell line Hs578T (Oh et
al., 1993) and prostate cancer cells (Cohen et al., 1993). Transfection of the IGFBP-3
gene into mouse fibroblasts decreases proliferation (Cohen et al., 1993). One of the
initial key experiments demonstrated a growth inhibitory effect of overexpressed
IGFBP-3 in fibroblasts isolated from IGF-IR-deficient mice (Valentinis et al., 1995). The
protein directly induces apoptosis in a prostate cancer cell line, mediates at list in part
Chapter 1 Introduction
15
the growth inhibitory actions of retinoic acid, TGF-β and the tumor suppressor gene
p53 (Oh et al., 1995; Leal et al., 1997; Rajah et al., 1997). Transforming growth factor
β and retinoic acid, which are known to inhibit cell growth and induce apoptosis in a
variety of normal and malignant cell types, also induce the expression and secretion of
IGFBP-3 (Martin et al., 1992; 1995, Babajko and Binoux, 1996). In 1995, Buckbinder
and coworkers first identified IGFBP-3 as one of the p53-inducible genes (Buckbinder
et al., 1995).
Although the precise mechanism of growth regulation by IGFBP-3 is unknown,
one plausible explanation is that IGFBP-3 is transported to the nucleus where it directly
or indirectly modulates gene transcription. The basic carboxyl-terminal domain of
IGFBP-3 contains a region with strong sequence homology to nuclear localization
signals (NLS) (Figure 4). In addition, this basic region shares homology with the DNA-
binding domains of several transcription factors (Turner et al., 1989). Based on
sequence homology between the basic carboxyl-terminal regions of IGFBP-3 and
IGFBP-5 (IGFBP-3, amino acids 215–232; IGFBP-5, amino acids 201–218), IGFBP-5
also has the potential to be targeted to the nuclei of cells and to interact directly with
DNA. Both IGFBP-3 and –5 have been indeed identified in the nuclei of opossum
kidney cells (Li et al., 1997), mink lung epithelial cells and T47D breast cancer cells
(Schedlich et al., 1998).
Taylor and coworkers have isolated a 75 kDa receptor which transports IGFBP-3
intracellularly into the α-granules of megakaryocytes, and thus potentially makes it
possible for the protein to reach cell nucleus (Taylor and Spencer, 2001). The same
receptor is present on the breast cancer cells that respond to IGFBP-3 and absent on
those that do not. Inhibition of receptor-mediated endocytosis does not however affect
nuclear uptake of IGFBP-3, suggesting that it uses also an alternative non-classical
import pathway for transport across the plasma membrane (Schedlich et al., 1998).
Lee and coworkers observed cellular internalization of IGFBP-3 occurring via
interaction with caveolin, one of two (next to clathrin) major proteins mediating
endocytic uptake (Lee et al., 2004). Both IGFBP-3 and –5 possess caveolin docking
domains in their C-domains (Figure 3).
The transforming growth factor-β receptor (TβR-V), a membrane glycoprotein with
Ser-specific protein kinase activity, was found to be identical to IGFBP-3 receptor,
which mediates IGF-independent growth inhibition (Leal et al., 1997; Leal et al., 1999;
Wu et al., 2000). Findings of Huang and coworkers suggest that the growth inhibition
Chapter 1 Introduction
16
results from dephosphorylation of insulin receptor substrates, IRS-1 and –2, by the
IGFBP-3-bound TβR-V (Huang et al., 2004).
IGFBP-5 stimulates mitogenesis of endothelial, osteoblast and other cell types
independent of IGF (Andress and Birnbaum, 1992; Andress et al., 1993; Andress,
1995). Cell association is required, but receptor has not been isolated. Fragments of
the IGFBPs have been reported to have both inhibitory and stimulatory actions (Binoux
et al., 1999). IGFBP-5(1-169) directly stimulates osteoblast proliferation suggesting a
regulatory role in bone formation (Andress et al., 1992; Mohan et al., 1999). The C-
terminal metal binding domain (MBD) of IGFBP-3 has been shown to mediate cellular
uptake and nuclear localization of C-terminally conjugated not related partner proteins:
green fluorescent protein (GFP) and horseradish peroxidase (HRP). A 12-amino acid
long MBD peptide triggered apoptosis as effectively as an intact IGFBP-3 in chemically
or nutritionally stressed human embryonic kidney (HEK) cells (Singh et al., 2004).
It has been also shown that the E7 protein encoded by human papillomavirus type
16 binds to intracellular IGFBP-3 and triggers its proteolytic cleavage, preventing its
proapoptotic functions, hence overriding senescence (Mannhardt et al., 2000).
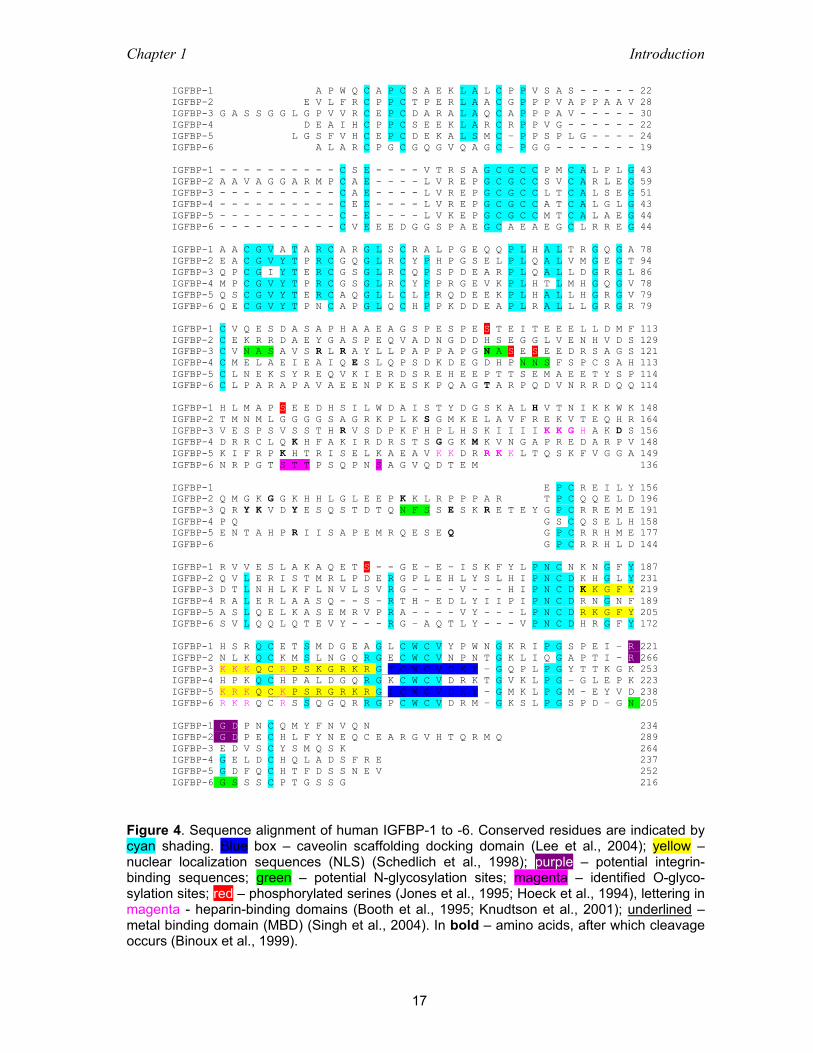
1.4 The structure of the IGFBPs The molecular size of the six IGFBPs ranges from 22 to 32 kDa. The N- and C-terminal
thirds of all the IGFBPs are homologous and heavily cross-liked by disulfide bonds
whose positions are conserved (Figure 4). The middle regions have a minimal
homology and only IGFBP-4 has a disulfide bond in this region. Secondary structure
predictions and accessibility to proteolysis suggests that the linker region is exposed
and lacks significant structure. Several studies aimed at establishing the disulfide bond
linkages of IGFBPs using conventional biochemical methods. Only mapping of
disulfides in IGFBP-6, containing six amino-terminal cysteine bridges, one less than
other IGFBPs, produced complete and accurate map of all the linkages in both N- and
C-domains (Neumann et al., 1999). In a study on IGFBP-4, Chelius and coworkers
established 8 out of 10 disulfide bonds and narrowed the remaining assignment to 2
possibilities (Chelius et al., 2001). On the following pages of this thesis it will be
unequivocally shown that the N-terminal linkages identified by Chelius were incorrectly
assigned. All IGFBPs examined so far (IGFBP-1, -2, -4, -6) have an identical intra
Chapter 1 Introduction
17
IGFBP-1 A P W Q C A P C S A E K L A L C P P V S A S - - - - - 22 IGFBP-2 E V L F R C P P C T P E R L A A C G P P P V A P P A A V 28 IGFBP-3 G A S S G G L G P V V R C E P C D A R A L A Q C A P P P A V - - - - - 30 IGFBP-4 D E A I H C P P C S E E K L A R C R P P V G - - - - - - 22 IGFBP-5 L G S F V H C E P C D E K A L S M C – P P S P L G - - - - 24 IGFBP-6 A L A R C P G C G Q G V Q A G C – P G G - - - - - - - 19
IGFBP-1 - - - - - - - - - - C S E - - - - V T R S A G C G C C P M C A L P L G 43 IGFBP-2 A A V A G G A R M P C A E – - - - L V R E P G C G C C S V C A R L E G 59 IGFBP-3 - - - - - - - - - - C A E - - - - L V R E P G C G C C L T C A L S E G 51 IGFBP-4 - - - - - - - - - - C E E - - - - L V R E P G C G C C A T C A L G L G 43 IGFBP-5 - - - - - - - - - - C – E - - - - L V K E P G C G C C M T C A L A E G 44 IGFBP-6 - - - - - - - - - - C V E E E D G G S P A E G C A E A E G C L R R E G 44
IGFBP-1 A A C G V A T A R C A R G L S C R A L P G E Q Q P L H A L T R G Q G A 78 IGFBP-2 E A C G V Y T P R C G Q G L R C Y P H P G S E L P L Q A L V M G E G T 94 IGFBP-3 Q P C G I Y T E R C G S G L R C Q P S P D E A R P L Q A L L D G R G L 86 IGFBP-4 M P C G V Y T P R C G S G L R C Y P P R G E V K P L H T L M H G Q G V 78 IGFBP-5 Q S C G V Y T E R C A Q G L L C L P R Q D E E K P L H A L L H G R G V 79 IGFBP-6 Q E C G V Y T P N C A P G L Q C H P P K D D E A P L R A L L L G R G R 79
IGFBP-1 C V Q E S D A S A P H A A E A G S P E S P E S T E I T E E E L L D M F 113 IGFBP-2 C E K R R D A E Y G A S P E Q V A D N G D D H S E G G L V E N H V D S 129 IGFBP-3 C V N A S A V S R L R A Y L L P A P P A P G N A S E S E E D R S A G S 121 IGFBP-4 C M E L A E I E A I Q E S L Q P S D K D E G D H P N N S F S P C S A H 113 IGFBP-5 C L N E K S Y R E Q V K I E R D S R E H E E P T T S E M A E E T Y S P 114 IGFBP-6 C L P A R A P A V A E E N P K E S K P Q A G T A R P Q D V N R R D Q Q 114
IGFBP-1 H L M A P S E E D H S I L W D A I S T Y D G S K A L H V T N I K K W K 148 IGFBP-2 T M N M L G G G G S A G R K P L K S G M K E L A V F R E K V T E Q H R 164 IGFBP-3 V E S P S V S S T H R V S D P K F H P L H S K I I I I K K G H A K D S 156 IGFBP-4 D R R C L Q K H F A K I R D R S T S G G K M K V N G A P R E D A R P V 148 IGFBP-5 K I F R P K H T R I S E L K A E A V K K D R R K K L T Q S K F V G G A 149 IGFBP-6 N R P G T S T T P S Q P N S A G V Q D T E M 136
IGFBP-1 E P C R E I L Y 156 IGFBP-2 Q M G K G G K H H L G L E E P K K L R P P P A R T P C Q Q E L D 196 IGFBP-3 Q R Y K V D Y E S Q S T D T Q N F S S E S K R E T E Y G P C R R E M E 191 IGFBP-4 P Q G S C Q S E L H 158 IGFBP-5 E N T A H P R I I S A P E M R Q E S E Q G P C R R H M E 177 IGFBP-6 G P C R R H L D 144
IGFBP-1 R V V E S L A K A Q E T S - - G E – E – I S K F Y L P N C N K N G F Y 187 IGFBP-2 Q V L E R I S T M R L P D E R G P L E H L Y S L H I P N C D K H G L Y 231 IGFBP-3 D T L N H L K F L N V L S V R G - - - - V - - - H I P N C D K K G F Y 219 IGFBP-4 R A L E R L A A S Q - - S – R T H – E D L Y I I P I P N C D R N G N F 189 IGFBP-5 A S L Q E L K A S E M R V P R A - - - - V Y - - - L P N C D R K G F Y 205 IGFBP-6 S V L Q Q L Q T E V Y - - - R G – A Q T L Y - - - V P N C D H R G F Y 172
IGFBP-1 H S R Q C E T S M D G E A G L C W C V Y P W N G K R I P G S P E I – R 221 IGFBP-2 N L K Q C K M S L N G Q R G E C W C V N P N T G K L I Q G A P T I – R 266 IGFBP-3 K K K Q C R P S K G R K R G F C W C V D K Y – G Q P L P G Y T T K G K 253 IGFBP-4 H P K Q C H P A L D G Q R G K C W C V D R K T G V K L P G – G L E P K 223 IGFBP-5 K R K Q C K P S R G R K R G I C W C V D K Y – G M K L P G M – E Y V D 238 IGFBP-6 R K R Q C R S S Q G Q R R G P C W C V D R M – G K S L P G S P D – G N 205
IGFBP-1 G D P N C Q M Y F N V Q N 234 IGFBP-2 G D P E C H L F Y N E Q C E A R G V H T Q R M Q 289 IGFBP-3 E D V S C Y S M Q S K 264 IGFBP-4 G E L D C H Q L A D S F R E 237 IGFBP-5 G D F Q C H T F D S S N E V 252 IGFBP-6 G S S S C P T G S S G 216
Figure 4. Sequence alignment of human IGFBP-1 to -6. Conserved residues are indicated by cyan shading. Blue box – caveolin scaffolding docking domain (Lee et al., 2004); yellow – nuclear localization sequences (NLS) (Schedlich et al., 1998); purple – potential integrin-binding sequences; green – potential N-glycosylation sites; magenta – identified O-glyco-sylation sites; red – phosphorylated serines (Jones et al., 1995; Hoeck et al., 1994), lettering in magenta - heparin-binding domains (Booth et al., 1995; Knudtson et al., 2001); underlined – metal binding domain (MBD) (Singh et al., 2004). In bold – amino acids, after which cleavage occurs (Binoux et al., 1999).
Chapter 1 Introduction
18
domain disulphide-bonding pattern of the C-domain (Forbes et al., 1998; Neumann et
al., 1998; Standker et al., 2000). Regions of amino acid sequence homology and the
conserved N- and C-terminal disulfide cross-linking pattern in IGFBPs suggest
maintenance of a conserved structure across all IGFBPs in these regions. IGFBPs with
reduced disulfides exhibit no IGF binding activity, suggesting the importance of the
bridging for maintaining structural elements required for ligand binding (Landale et al.,
1995; Hashimoto et al., 1997; Qin et al. 1998; Neumann and Bach, 1999).
Several properties of IGFBPs and IGFs, such as the intrinsic disorder of the
central one-third of the IGFBPs, the highly disulfide bridged folded domains, and rapid
aggregation of IGFs have hindered structural studies with these proteins (reviewed in
Clemmons, 2001, in Hwa et al., 1999; in Carrick et al., 2002; Cooke et al., 1991;
Torres et al., 1995). Only in the last few years have reports on structural characte-
rization of small domains of IGFBPs appeared. The first direct information on IGFBP
folding came from the NMR study of miniNBP-5, a short amino-terminal fragment
spanning residues 40-92 (Kalus et al., 1998), which was later confirmed by X-ray
crystallography (Zeslawski et al., 2001). The structure of this minimum-binding region
of the N-terminal domain can be described as a compactly arranged, short three-
stranded antiparallel β-sheet (residues 46–47, 59–61, 78–82). As expected, the fold of
miniNBP-5 determined by NMR was conserved in the crystal structure with IGF-I,
although complex formation did rigidify the miniNBP-5 loop at residues 62–69.
Headey and coworkers have recently determined a solution structure of the
carboxyl-terminal domain of IGFBP-6 (residues 161-240 of the full-length precursor)
using NMR (Headey et al., 2004). The domain consists of a thyroglobulin type-1 fold
comprising an α-helix followed by a loop, a three-stranded anti-parallel β-sheet
incorporating a second loop, and finally a disulfide bonded flexible third loop. The
structure is in an agreement with a model proposed for C-terminal domain of IGFBP-4
(residues 136-237) based on the crystal structure of homologous protein, p41 (a
proteolytic fragment of MHC class II) (Mazebourg et al., 2004).
1.4.1 Posttranslational modifications IGFBPs 3-6 are glycosylated, but only IGFBP-3 is heavily glycosylated, which
increases its molecular weight to 43-45 from 28.7 kDa. On the basis of the number and
molecular masses of the electrophoretic bands detected for each glycoform, there is
approximately 4, 4.5 and 5 kDa of carbohydrate on Asn89, Asn109 and Asn172

Chapter 1 Introduction
19
respectively, with variable occupancy of Asn172. The three residues are located in the
weakly conserved central region. Ternary complex formation by the three glycovariants
in the presence of acid-labile subunit (ALS) and excess IGF-I is not significantly
different from that of fully glycosylated recombinant human IGFBP-3. In contrast, Asn
to Asp substitutions decrease ALS binding activity (Firth and Baxter, 1999).
Glycosylation of IGFBP-3 is required for high-affinity binding to its receptor, but no
other definitive function has been discerned for the sugar moieties on the other
IGFBPs (Taylor et al., 2001).
As mentioned above, phosphorylation of IGFBP-1 increases its affinity for IGFs,
but appears to have no affect on that of circulating IGFBP-3 (Jones et al., 1995) or
IGFBP-5, although it does decrease the binding of IGFBP-3 to ALS and cell surfaces.
IGFBP-3 is secreted from the liver as the phosphorylated form with subsequent
dephosphorylation leading to a 2-fold increase in its affinity for the ALS (Forbes et al.,
1998). Results of Schedlich and coworkers suggest that when IGF-I is cotransported
into the nucleus by IGFBP-3, phosphorylation of IGFBP-3 by nuclear double-stranded
DNA-dependent protein kinase (DNA-PK) provides a means for releasing bound IGF-I
and creating a phosphoform of IGFBP-3 with increased affinity for nuclear components
(Schedlich et al., 2003). There are reports on both stimulatory (Coverley and Baxter,
1995) and inhibitory (Mishra and Murphy, 2003) effects of IGF on IGFBP-3
phosphorylation.
1.5 IGF – IGFBP interaction 1.5.1 IGF residues involved in IGFBP binding The earliest data came from studies of IGF-I naturally truncated at the amino terminus,
DES-(1-3)-IGF-I, which binds to IGFBP-3 with several times lower affinity than natural
IGF-I and shows greatly reduced binding to other IGFBPs (Forbes et al., 1988).
Mutational analysis showed Glu3 to be an important determinant of binding, because
variants like [Arg3]IGF-I and [Gln3, Ala4]IGF-I show considerably reduced IGFBP
interaction. Other important IGFBP-binding determinants of IGF-I, as revealed by
mutagenesis experiments, include Gln15 and Phe16 in the B domain of IGF-I and the
A-domain residues Phe49, Arg50, and Ser51, because substitution of these for the
corresponding residues in insulin considerably reduces IGFBP binding (Clemmons et
Chapter 1 Introduction
20
al., 1990). In IGF-II, mutation of Phe26 in the B domain has a pronounced effect on
binding to all six of the IGFBPs, most notably IGFBP-1, and, as with IGF-I, the residues
Phe48, Arg49, and Ser50 are also of key importance (Bach et al., 1993).
1.5.2 IGFBP residues involved in IGF binding The structural basis for the IGF binding by IGFBPs has been probed for past 20 years
by mutagenesis studies (reviewed in: Clemmons, 2001). Mutagenesis of both amino-
and carboxyl-terminal residues has been shown to disrupt binding, but it is not always
clear whether these loss-of-function mutations affect gross IGFBP structure or point to
specific interacting residues. It is generally accepted, however, that the primary IGF-
binding site is located in the N-terminal region: deletions of amino-terminal residues
and point mutations of residues in this region, particularly between conserved Cys
residues 9 and 12, produced IGFBPs with no or reduced affinity to IGF. The direct
evidence for an amino-terminal IGF-binding domain came from the solution structure of
a recombinant IGFBP-5 fragment determined by Kalus and coworkers and later
confirmed by Zeslawski and coworkers using X-ray crystallography. The studies
identified a key role for IGFBP-5 residues Val49, Tyr50, Pro62, and Lys68-Leu74 in
IGF binding.
Mutagenesis and functional studies also indicated that carboxyl-terminal residues
were important in IGF binding. Removal of most or the entire C-terminal domain of
human IGFBP-3 (Firth et al., 1998), IGFBP-4 (Rajah et al., 1997, Qin et al., 1998), or
IGFBP-5 (Andress et al., 1993) disrupts IGF binding, although some residual activity is
typically seen. In IGFBP-4, Cys205 through Val214 have been described as key
residues (Qin et al., 1998), whereas in bovine IGFBP-2, a more amino-terminal
sequence (Lys222-Asn236, corresponding to residues 185–199 of human IGFBP-4)
was found to be important (Forbes et al., 1998). The IGF-II binding site on the C-
domain of IGFBP-6 was defined as a largely hydrophobic surface patch involving the
α-helix (residues Pro162 to Thr176), the first β-strand (Leu185 to Asp191) and the first
and second loops.
The issue of the structural determinants required for high affinity binding of IGF-I
by IGFBPs and its implications for interaction of IGF-I with IGF-IR will be addressed in
the Discussion section of this thesis.

Chapter 1 Introduction
21
1.6 The IGF system and cancer Most cultured cancer cells express increased levels of components of the insulin-like
growth factor system (reviewed in: LeRoith and Roberts, 2003). Many investigators
have reported an association between serum concentrations of IGF-I and increased
risks of breast, prostate, colorectal, and lung carcinomas (reviewed in: Furstenberger
and Senn, 2002). The link between cancer and IGF signaling is also consistent with
recent epidemiological studies showing an increased relative risk for the development
of colon, prostate, breast, lung, and bladder cancers in individuals with circulating IGF-I
levels in the upper quartile of the normal range (Chan et al., 1998). These findings
were confirmed in animal models, where reduced circulating IGF-I levels result in
significant reductions in cancer development, growth, and metastases, whereas
increased circulating IGF-I levels are associated with enhanced tumor growth (Wu et
al., 2003).
Characteristic alterations detected in primary hepatocellular (HCC) and cutaneous
carcinomas, breast carcinomas and hepatoma cell lines, comprise the overexpression
of the IGF-IR (sometimes accompanied by its hyperphosphorylation), emerging as
critical event in malignant transformation and growth of tumors (Sharf and Braulke,
2003, Keehn et al., 2004). Simultaneous reduction of IGFBPs expression and the
increase in proteolytic cleavage of IGFBPs result in an excess of bioactive IGFs.
Defective functions of the IGF-II/mannose 6-phosphate receptor involved in
degradation of IGF-II and the lysosomal targeting of cathepsin proteases capable to
degrade extracellular matrix proteins may also contribute to the development of many
human neoplasms (Sharf and Braulke, 2003; LeRoith and Roberts, 2003).
IGF-IR is overexpressed in many diverse tumor types and is a critical signaling
molecule for tumor cell proliferation and survival. Moreover, IGF-IR also plays a critical
role in cell transformation that is induced by tumor-virus proteins and oncogene
products. Therapeutic strategies targeting the IGF-IR by eliminating it from the cell
membrane, blocking the interaction with IGFs, or interrupting the signal transduction
pathway downstream of IGF-IR, may therefore be an effective broad-spectrum
anticancer action (Yu and Rohan, 2000; LeRoith et al., 1995).
Preventing the IGF-IR interaction with its ligand can be achieved either by
neutralization of circulating IGFs or blocking the IGF binding site on IGF-IR. The
strategies aiming at elimination of active IGFs utilize either specific antibodies or
Chapter 1 Introduction
22
inhibitory IGFBPs (Arteaga et al., 1989; Firth and Baxter, 2002). Blocking of the active
site of IGF-IR using antibodies has been extensively studied (Arteaga et al., 1989;
Burtrum et al., 2003). Antibody-mediated blockade of ligand binding to the IGF-IR
inhibited downstream signaling of IGFs pathways and, as a result, the mitogenic and
proliferative potential of IGF-I and IGF-II were significantly reduced. In addition, some
antibodies were shown to induce IGF-IR internalization and degradation, resulting in a
significant reduction in tumor cell surface receptor density.
Direct reduction of IGF-IR expression has been approached by using antisense
strategy through either oligonucleotides (Grzmil et al., 2004), stable transfections, or
siRNAs (Neuenschwander et al., 1995; reviewed in: Baserga, 1995). Selective
elimination of cells bearing the type I IGF receptor can be achieved using a chimeric
toxin in which the cell-binding domain of Pseudomonas exotoxin was replaced with
IGF-I (Prior et al., 1991). Blocking of the IGF-IR tyrosine kinase activity with a small
molecule inhibitor would stop the downstream signal cascades. Certain compounds of
the group cyclolignans have recently been reported to be potent and selective
inhibitors of tyrosine phosphorylation of the IGF-IR (Girnita et al., 2004).
The IGF system plays a central role in many aspects of tumorigenesis. The
approaches to its control listed above have numerous drawbacks and problems,
including lack of specificity, difficulty of drug delivery, etc. A better understanding of
this complex system will facilitate the development of novel approaches to diagnose
and treat various human cancers.
Chapter 2 Goals of the study
23
2 Goals of the study
While IGFBPs have different actions, all IGF-dependent actions, positive or negative,
depend on binding to a single high-affinity binding site on IGFBPs. Therefore,
elucidation of structural determinants of various IGFBPs in IGF binding is important to
a general understanding of the biology of the IGF system and may shed light on how
different IGFBPs exhibit specific actions.
A precise model of the IGF/IGFBP interaction can be created based on high-
resolution 3-D structures of the interacting proteins, kinetic data from binding studies
on truncated variants and information on their dynamic behaviour from NMR
experiments. The rationale behind this project is that determining the 3-D structure of
the entire IGFBP would greatly improve our understanding of the structure-function
relationship of this multi-dimensional protein family. Knowledge of structural
determinants of the IGF binding site would place at our disposal a means to regulate
the actions of the IGF, arguably one of the most important growth factors. This could
be carried out by selectively modifying the binding affinity of IGFBPs for IGFs using
site-directed mutagenesis on IGFBPs and/or IGFs. These mutants could serve as tools
to investigate the biology of IGFs. Less active mutants would improve delivery of IGF-I
to tissues. Mutants with increased affinity would find immediate use for blocking IGFs’
activity. Design and in silico modeling of novel, low molecular weight ligands with
therapeutic potential should be possible based on new interaction sites revealed in this
study.
Chapter 3 Techniques of structure and function analysis
24
3 Techniques of structure and function analysis
3.1 X-ray crystallography 3.1.1 Crystal space groups and symmetries Crystals are by definition regular, three-dimensional arrays of atoms, ions, molecules
or molecular assemblies. The minimal structural part that repeats in all three
dimensions to build up the crystal is defined as the unit cell. Within the unit cell, a
crystal can contain further symmetry elements, dividing it into several asymmetric
units, which form the most basic structural element, which is related to all other
identical objects in the unit cell by symmetry operations. The geometry of the unit cell
together with the possible symmetry operations defines the space group of the crystal.
Proteins and nucleic acids do not crystallize in space groups with inversion symmetries
because they are composed of enantiomers (L-amino acids and D-sugars,
respectively). As a consequence, the number of possible space groups is reduced
from 230 to 65, which are distributed between 7 crystal systems: triclinic, monoclinic,
orthorhombic, tetragonal, trigonal, hexagonal and cubic. The combination of the 4
crystal lattices: primitive (P), body centred (I), face centred (F) and centred in the (010)
planes (C) with the mentioned 7 crystal systems allows a total of 14 Bravais lattices.
Space groups containing translational elements, i.e., nonprimitive lattices, screw axes
and glide planes, yield diffraction patterns in which certain classes of reflections are
absent. Such systematic absences are termed space-group extinctions. Therefore,
looking at the diffraction pattern it is often possible to determine the space group
unambiguously. The knowledge of the crystal space-group makes possible to take
advantage of the crystals symmetry – the higher the symmetry, the less data is
required to be collected.
3.1.2 Crystallization The first prerequisite for solving the three-dimensional structure of a protein by X-ray
crystallography is a well-ordered crystal that will diffract X-rays strongly. Crystallization
of macromolecules is a multiparametric process involving three main steps: nucleation,
growth and cessation of growth. It is indispensable for crystallization to bring the
Chapter 3 Techniques of structure and function analysis
25
protein to a supersaturated state, which will force the macromolecules into the solid
state - the crystal.
The Debye-Hückel theory describes how the solubility of the protein depends on
ions. At low ionic strength the protein solubility increases with higher salt
concentrations, this phenomenon is called salting-in. On the contrary, in the salting-out
phenomenon, the protein at high ionic strength behaves as a neutral dipole and mainly
hydrophobic effects govern solubility. Thus, salting-out corresponds to a decrease of
protein solubility at high salt concentration. The crystallographer can shift the
equilibrium from solution to supersaturation by reducing or, much more often,
increasing the ionic strength of the protein solution. The main parameters that
influence protein solubility are temperature, pH and presence of precipitating agents:
salts, polymers or organic solvents. Crystal growth can be divided into two steps. First,
a spontaneous nucleus formation occurs in the supersaturation area followed by
formation of small ordered aggregates. After the critical amount of aggregated
molecules (10-200) is surpassed, the crystal growth becomes an energetically
privileged process. Crystal growth always needs a lower degree of supersaturation
than nucleus formation. Crystals should grow slowly enough to achieve the maximum
possible internal order.
There are several techniques for setting up crystallization experiments including
sitting drop vapor diffusion, hanging drop vapor diffusion, sandwich drop, batch,
microbatch, under oil, microdialysis, and free interface diffusion. Sitting and hanging
drop methodologies are the most popular because they are easy to perform, require a
small amount of sample, and allow large amount of flexibility during screening and
optimization. Using the sitting drop technique one places a small (1 to 40 µl) droplet of
the sample mixed with crystallization reagent on a platform in vapor equilibration with
the reagent. The initial reagent concentration in the droplet is less than that in the
reservoir. The volume proportion of mixed solutions is actually yet another variable in
the crystallization experiment setup. Over time the reservoir solution pulls water from
the droplet in a gaseous phase, and equilibrium establishes between the drop and the
reservoir. During this equilibration process the sample is concentrated, increasing the
relative supersaturation of the sample in the drop. The advantages of the sitting drop
technique include speed and simplicity. The disadvantages are that crystals can
sometimes adhere to the surface making removal difficult. This disadvantage can turn
Chapter 3 Techniques of structure and function analysis
26
into an advantage where occasionally the surface of the sitting drop can assist in
nucleation. The sitting drop is an excellent method for screening and optimization.
3.1.3 X-ray diffraction When the primary beam from an X-ray source strikes the crystal, most of the X-rays
travel straight through it. Some, however, interact with the electrons on each atom and
cause them to oscillate. The oscillating electrons, as any oscillating charges, emit
radiation serving as a new source of X-rays, which are emitted in almost all directions.
We refer to this rather loosely as scattering. When atoms and hence their electrons are
arranged in a regular three-dimensional array, as in a crystal, the X-rays emitted from
the oscillating electrons interfere with one another. In most cases, these X-rays,
colliding from different directions, cancel each other out; those from certain directions,
however, will add together to produce diffracted beams of radiation that can be
recorded as a pattern on a detector. Diffraction by a crystal can be regarded as the
reflection of the primary beam by sets of parallel planes. The relationship between the
reflection angle, θ, the distance between the planes, d, and the wavelength, λ, is given
by Bragg’s law:
2d sinθ = λ
Each atom in a crystal scatters X-ray in all directions, and only those that positively
interfere with one another, according to Bragg’s law, give rise to diffracted beams that
can be recorded as a distinct diffraction spot. Each diffraction spot is the result of
interference of all X-rays with the same diffraction angle emerging from all atoms. All
heavy enough atoms contribute to the intensity of each spot, even though they do not
lay on the Bragg’s planes, from which the diffraction occurs. For a typical protein
crystal, myoglobin, each of the about 20000 diffracted beams that have been
measured contains scattered X-rays from each of the around 1500 atoms (not
including hydrogen) in the molecule. To extract information about individual atoms from
such a system the Fourier transform is employed.
3.1.4 Solving the “phase problem” Each diffracted beam, which is recorded as a spot on the detector, is defined by three
attributes: the amplitude, which can be measured from intensity of the spot; the
wavelength, which is set by the X-ray source; and the phase, which is lost in X-ray
experiments. All three properties for all of the diffracted beams have to be known to

Chapter 3 Techniques of structure and function analysis
27
determine the position of the atoms. This is a so-called phase problem in X-ray
crystallography. Several approaches are applicable to circumvent the phase problem:
molecular replacement (MR), single isomorphous replacement (SIR), multiple
isomorphous replacement (MIR), multiple-wavelength anomalous dispersion (MAD),
and direct methods.
The method of Molecular Replacement (MR) depends on the availability of a
sufficiently homologous model structure. That is, if the structure of a protein (search
molecule) is known that is homologous to the crystallized protein (target molecule) with
unknown structure, the former can be used as a model to calculate a starting set of
phases that can be interactively refined (Hoppe, 1957; Huber, 1965). If successful, a
preliminary model of the target structure will be obtained by correctly orienting and
positioning the search molecule in the target cell. This solution can be optimised by
rigid body refinement. Finally, the target structure can be put through cycles of map
calculation, model fitting and refinement, which help to reduce the bias introduced by
the starting model. Even in the absence of a suitable search molecule, the self-rotation
function can be used to determine the direction and nature of non-crystallographic
symmetry elements.
There are two operations in molecular replacement and these are known as the
rotation and translation functions. In the rotation step, the spatial orientation of the
known and unknown molecule with respect to each other is determined, while in the
next step the translation which is needed to superimpose the now correctly oriented
molecule onto the other is calculated. The basic principle of the MR method can be
understood with help of the Patterson function of a protein crystal structure. The
Patterson map is a vector map: distances between atoms in the real structure show up
as vectors from the origin to maxima in the Patterson map. If the pairs of atoms belong
to the same molecule, then the corresponding vectors are relatively short and their
end-points are found not too far from the origin in the Patterson map; they are called
self-Patterson vectors. If there were no intermolecular vectors (cross-Patterson
vectors), this inner region of the Patterson map would be equal for the same molecule
in different crystal structures, apart from a rotation difference. For homologous
molecules it is not exactly equal but very similar. Therefore, the self-Patterson vectors
can supply us with the rotation relationship between the known and the unknown
molecular structures. The solutions of the rotation and translation functions are not
always found in a straightforward way. In some cases, it can be necessary to modify
Chapter 3 Techniques of structure and function analysis
28
the model, for instance, by ignoring the side chains and deletions/insertions in the
model, and/or by systematically varying the resolution range of the X-ray data used in
the search. With the rapid increase in the number of successful protein structure
determinations, molecular replacement has become an extremely used technique for
protein phase angle determination.
Without any previous knowledge of the structure multiple isomorphous
replacement (MIR) is still the most commonly used method. Following heavy-metal
introduction into the crystal lattice, some spots measurably increase in intensity, others
decrease, and many show no detectable difference. The intensity differences can be
used to deduce the positions of the heavy-atoms in the crystal unit cell. Fourier
summations of these intensity differences give maps of the vectors between the heavy
atoms, the so-called Patterson maps. From these vector maps, the atomic
arrangement of the heavy atoms can be deduced. From the positions of the heavy
metals in the unit cell, one can calculate the amplitudes and phases of their
contribution to the diffracted beams of the protein crystals containing heavy metals.
Subsequently the phase of the protein can be calculated.
Phase information can also be obtained by multiwavelength anomalous diffraction
(MAD) experiments. For certain X-ray wavelengths, the interaction between the X-rays
and the electrons of an atom causes the electrons to absorb the energy of the X-ray.
This causes a change in the X-ray scattering of the atom, called anomalous scattering.
By collecting data at several wavelengths near the absorption edge of an element in
the crystal, the phase information analogous to that from MIR is obtained The intensity
differences obtained in the diffraction pattern by illuminating such a crystal by X-rays of
different wavelengths can be used in a way similar to the method of MIR to obtain the
phases of the diffracted beams. Since wavelength needs to be tuned and modulated,
the MAD method requires access to synchrotron radiation.
The amplitudes and the phases of the diffraction data from the protein crystals are
used to calculate an electron-density map of the repeating unit of the crystal. This map
then has to be interpreted as a polypeptide chain with a particular amino acid
sequence. The quality of the map depends on the resolution of the diffraction data,
which in turn depends on how well-ordered the crystals are. The initial model will
contain errors, which can be subsequently removed by crystallographic refinement of
the model. In this process the model is changed to minimize the difference between
the experimentally observed diffraction amplitudes and those calculated for a
Chapter 3 Techniques of structure and function analysis
29
hypothetical crystal containing the model instead of the real molecule. This difference
is expressed as an R factor, residual disagreement, which is 0.0 for exact agreement
and around 0.59 for total disagreement. In real life R factor values between 0.15 and
0.25 are regarded satisfactory. In refined structures at high resolution (around 2Å)
there are usually no major errors in the orientation of individual residues.
The introduction presented here was adapted from Branden and Tooze (1999). For
more details about crystallization procedures refer to McPherson (1999), and for the
basis of X-ray crystallography refer to Drenth (1994) or Giacovazzo (1992).
3.2 NMR spectroscopy
When protein molecules are placed in a strong magnetic field, the spin of their
atoms aligns along the field. This equilibrium alignment can be changed to an excited
state by applying radio frequency (RF) pulses to the sample. When the nuclei of the
protein molecule revert to their equilibrium state, they emit RF radiation that can be
measured. The exact frequency of the emitted radiation from each nucleus depends on
the molecular environment of the nucleus and is different for each atom, unless they
are chemically equivalent and have the same molecular environment. These different
frequencies are obtained relative to a reference signal and are called chemical shifts.
The nature, duration, and combination of applied RF pulses can be varied enormously,
and different molecular properties of the sample can be probed by selecting the
appropriate combination of pulses.
One-dimensional proton spectra of protein molecules contain overlapping signals
from many hydrogen atoms because the differences in chemical shifts are often
smaller than the resolving power of the experiment. This problem has been bypassed
by designing experimental conditions that yield a two-dimensional NMR spectrum. The
diagonal in such a diagram corresponds to a normal one-dimensional NMR spectrum.
The peaks off the diagonal result from interactions between hydrogen atoms that are
close to each other in space. By varying the nature of the applied RF pulses these off-
diagonal peaks can reveal different types of interactions. A COSY (correlation
spectroscopy) experiment gives peaks between hydrogen atoms that are covalently
connected through one or two other atoms. An NOE (nuclear Overhauser effect)
spectrum, on the other hand, gives peaks between pairs of hydrogen atoms that are
Chapter 3 Techniques of structure and function analysis
30
close together in space even if they are from amino acid residues that are quite distant
in the primary amino acid sequence.
Two-dimensional NOE spectra, by specifying which groups are close together in
space, contain three-dimensional information about the protein molecule. It is far from
trivial, however, to assign the observed peaks in the spectra to hydrogen atoms in
specific residues along the polypeptide chain because the order of peaks along the
diagonal has no simple relation to the order of amino acids along the polypeptide
chain. This problem has been solved by sequential assignment. Each type of an amino
acid has a specific set of covalently connected hydrogen atoms that will give a specific
combination of cross-peaks. From the COSY spectrum, or similar through bond
experiments (for example, TOCSY) it is therefore possible to identify the H atoms that
belong to each amino acid residue and, in addition, determine the nature of the side
chain of that residue. However, the order of these fingerprints along the diagonal has
no relation to the amino acid sequence of the protein. The sequence-specific
assignment, however, can be made from NOE spectra that record signals from H
atoms that are close together in space. These signals in the NOE spectra make it
possible to determine which fingerprint in the COSY spectrum comes from residue
adjacent to the one previously identified. The introduction of three- and four-
dimensional NMR experiments and the availability of 13C-, 15N-labelled proteins allow
one to assign the proton, nitrogen and carbon chemical shifts of proteins and protein
complexes with molecular weights well above 25 kDa and to determine their structures
in solution.
The final result of the sequence-specific assignment of NMR signals is a list of
distance constraints from specific hydrogen atoms in one residue to hydrogen atoms in
a second residue. This list immediately identifies the secondary structure elements of
the protein molecule because both α helices and β sheets have very specific sets of
interactions of less than 5 Å between their hydrogen atoms. It is also possible to derive
models of the three-dimensional structure of the protein molecule. However, usually a
set of possible structures rather that a unique structure is obtained. NMR
spectroscopy, which has the disadvantage of being very time consuming and restricted
for small molecular weight proteins (up to 30 kDa) in protein structure determination,
has, however, many advantages in comparison to X-ray crystallography, as it can be
useful for dynamics studies and can provide us with many other useful information
about the protein in the solution. NMR proved to be an efficient technique for studying
Chapter 3 Techniques of structure and function analysis
31
protein/ligand interactions that is used for identifying and designing high-affinity binding
ligands for proteins in pharmaceutical research. The method called ‘‘SAR by NMR’’
(Structure Activity Relationship by NMR) is based on monitoring chemical shift
changes of amide protons and nitrogens, which accompany the titration of potential
ligands to a solution of 15N-labelled protein (Branden and Tooze, 1999).
3.3 Isothermal titration calorimetry Isothermal titration calorimetry (ITC) is a thermodynamic technique for monitoring any
chemical reaction initiated by the addition of a binding component, and has become
the method of choice for characterizing biomolecular interactions. When substances
bind, heat is either generated or absorbed. Measurement of this heat allows accurate
determination of dissotiation constants (KD), reaction stoichiometry (n), enthalpy (∆H)
and entropy (∆S), thereby providing a complete thermodynamic profile of the molecular
interaction in a single experiment. In ITC experiment, a syringe containing a “ligand”
solution is titrated into a cell containing a solution of the “macromolecule” at constant
temperature. When ligand is injected into the cell, the two materials interact, and heat
is released or absorbed in direct proportion to the amount of binding. As the
macromolecule in the cell becomes saturated with ligand, the heat signal diminishes
until only background heat of dilution is observed.
In the binding studies presented here, the VP-ITC system (MicroCal) was used. It
is a sensitive isothermal titration calorimeter that uses a cell feedback network (CFB) to
differentially measure heat produced or absorbed between the sample and reference
cell. Twin coin-shaped cells are mounted in a cylindrical adiabatic environment, and
connect to the outside through narrow access tubes (Figure 5). A thermoelectric device
measures the temperature difference between the two cells and a second device
measures the temperature difference between the cells and the jacket. As chemical
reactions occur in the sample cell, heat is generated or absorbed. The temperature
difference between the sample and reference cells (∆T1) is kept at zero by the addition
of heat to the sample or reference cell, as appropriate, using the CFB system. The
integral of the power required to maintain ∆T1 = 0 over time is a measure of total heat
resulting from the process being studied.
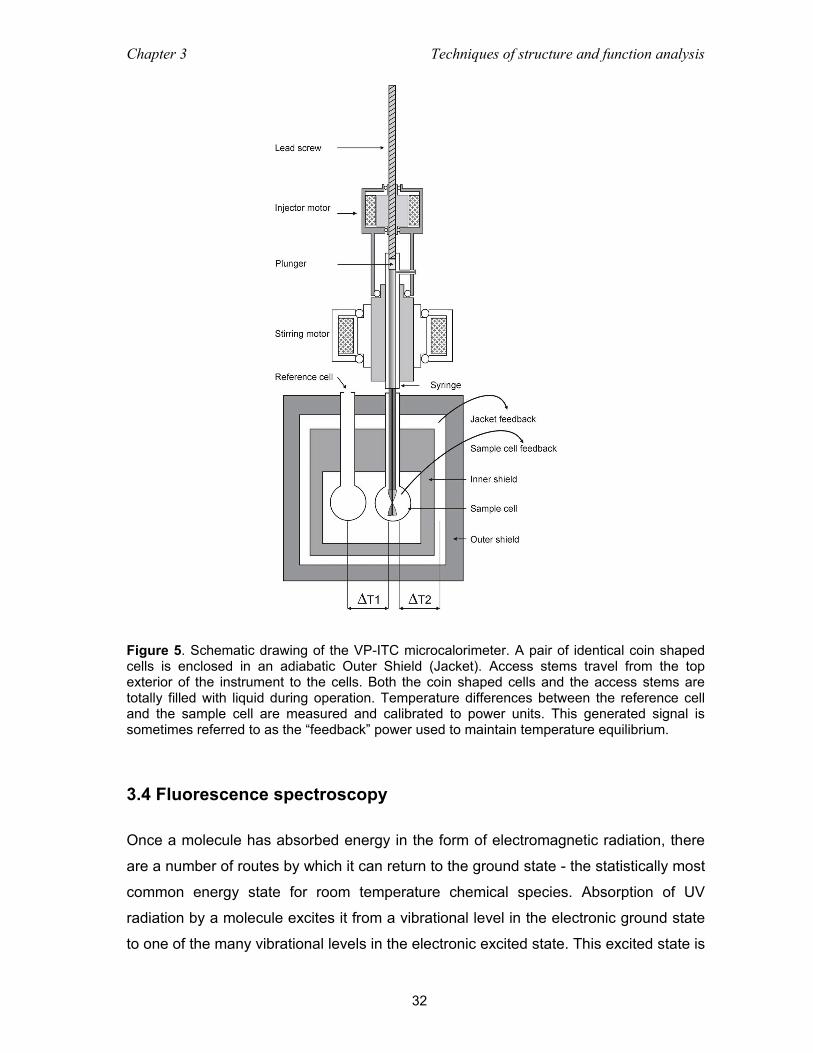
Chapter 3 Techniques of structure and function analysis
32
Figure 5. Schematic drawing of the VP-ITC microcalorimeter. A pair of identical coin shaped cells is enclosed in an adiabatic Outer Shield (Jacket). Access stems travel from the top exterior of the instrument to the cells. Both the coin shaped cells and the access stems are totally filled with liquid during operation. Temperature differences between the reference cell and the sample cell are measured and calibrated to power units. This generated signal is sometimes referred to as the “feedback” power used to maintain temperature equilibrium.
3.4 Fluorescence spectroscopy Once a molecule has absorbed energy in the form of electromagnetic radiation, there
are a number of routes by which it can return to the ground state - the statistically most
common energy state for room temperature chemical species. Absorption of UV
radiation by a molecule excites it from a vibrational level in the electronic ground state
to one of the many vibrational levels in the electronic excited state. This excited state is

Chapter 3 Techniques of structure and function analysis
33
usually the first excited singlet state. A molecule in a high vibrational level of the
excited state will quickly fall to the lowest vibrational level of this state by losing energy
to other molecules through collision. Fluorescence occurs when the molecule returns
to the electronic ground state, from the excited singlet state, by emission of a photon. It
is a dynamic phenomenon and the lifetime of the excited state is sufficient for a variety
of chemical and physical reactions to take place prior to emission. The usual
nanosecond time-window of fluorescence is normally shorter than that of other
dynamic techniques (e.g. NMR). Fluorescence spectroscopy is essentially a probe
technique sensing changes in the local environment of the fluorophore, which
distinguishes it from generalized techniques, such as calorimetry, far-ultraviolet circular
dichroism (CD), and infrared (IR) spectroscopy. Intensity of fluorescence emission
measured as a function of wavelength comprises the fluorescence spectrum. The
position of the emission spectrum reflects changes in energetics of the excited and
ground state between excitation and emission of a photon (Ladokhin, 2000).
Fluorescence from the amino acid tryptophan has long been known to be sensitive
to the polarity of its local environment (Burstein et al., 1973; Lakowicz, 1999; Vivian
and Callis, 2001). Among the properties used are changes in the fluorescence
intensity, wavelength maximum (λmax), band shape, anisotropy, fluorescence
lifetimes, and energy transfer. They are applied to folding/unfolding, substrate binding,
external quencher accessibility, etc. The power of this probe has been considerably
amplified by the finding that Trp can often be substituted for other amino acids by site-
directed mutagenesis, with minimal effect on structure and activity. Trp λmax is quite
sensitive to its local environment, ranging from 308 nm (azurin) to 355 nm (e.g.,
glucagon) and roughly correlates with the degree of solvent exposure of the
chromophore. Formation of various exciplexes (complexes in the excited state) and
subsequent dipole relaxation is believed to cause the red-shift of emission. There are
five most probable spectral forms of tryptophan residues according to the model of
discrete states of Burstein et al. (1973) (Figure 6):
Spectral form A corresponds to emission of the unperturbed indole chromophore
in the extremely nonpolar environment inside the protein globule.
Spectral form S corresponds to the emission of the indole chromophore located in
the relatively nonpolar environment inside the protein globule and forming a 1 : 1
exciplex with polar protein groups.
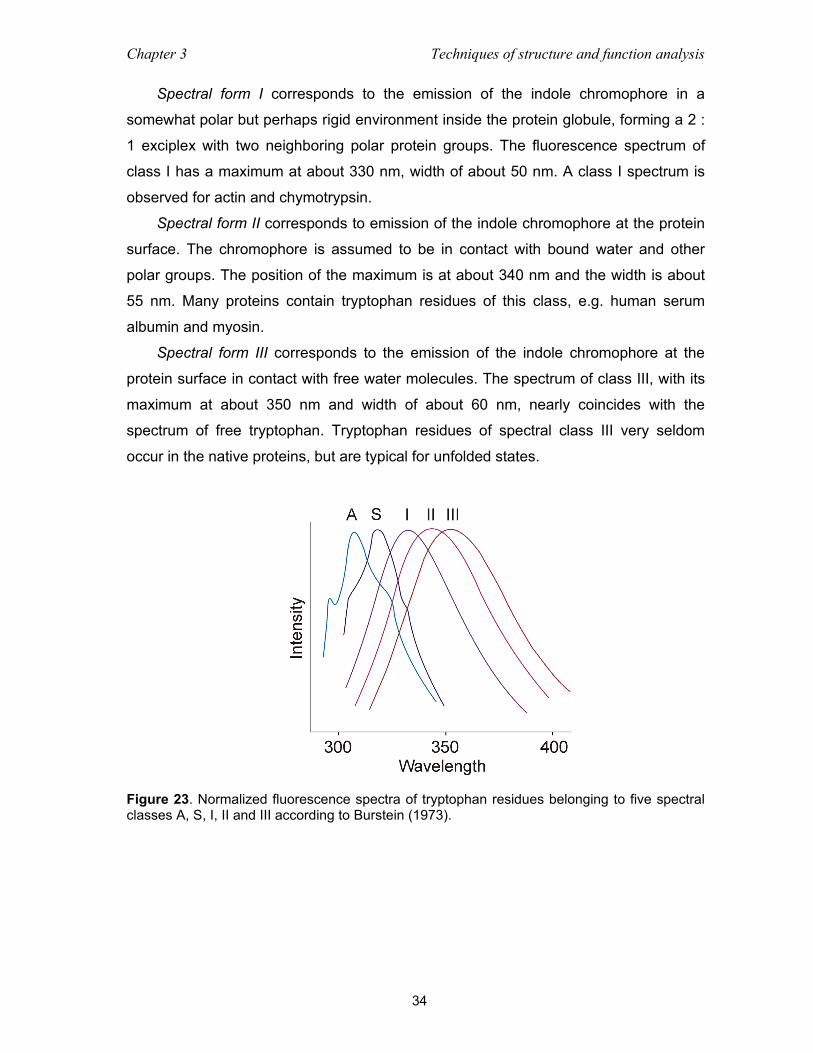
Chapter 3 Techniques of structure and function analysis
34
Spectral form I corresponds to the emission of the indole chromophore in a
somewhat polar but perhaps rigid environment inside the protein globule, forming a 2 :
1 exciplex with two neighboring polar protein groups. The fluorescence spectrum of
class I has a maximum at about 330 nm, width of about 50 nm. A class I spectrum is
observed for actin and chymotrypsin.
Spectral form II corresponds to emission of the indole chromophore at the protein
surface. The chromophore is assumed to be in contact with bound water and other
polar groups. The position of the maximum is at about 340 nm and the width is about
55 nm. Many proteins contain tryptophan residues of this class, e.g. human serum
albumin and myosin.
Spectral form III corresponds to the emission of the indole chromophore at the
protein surface in contact with free water molecules. The spectrum of class III, with its
maximum at about 350 nm and width of about 60 nm, nearly coincides with the
spectrum of free tryptophan. Tryptophan residues of spectral class III very seldom
occur in the native proteins, but are typical for unfolded states.
Figure 23. Normalized fluorescence spectra of tryptophan residues belonging to five spectral classes A, S, I, II and III according to Burstein (1973).
Chapter 4 Materials and laboratory methods
35
4 Materials and laboratory methods
4.1 Materials 4.1.1 E. coli strains and plasmids Cloning strains XL1-Blue Stratagene (USA)
One Shot TOP10 Invitrogen (Holland)
DH5α Novagen (Canada)
Protein expression strains One Shot® BL21 Star™ Invitrogen (Holland)
One Shot® BL21 Star™ (DE3) Invitrogen (Holland)
One Shot® BL21 Star™ (DE3) pLysS Invitrogen (Holland)
Plasmids
pET 28a(+) Novagen (Canada)
pQE 30 Qiagen (Germany)
pQE 80 Qiagen (Germany)
4.1.2 Cell growth media and stocks LB medium
For 1 liter LB medium: 10 g bacto tryptone
5 g bacto yeast extract
10 g sodium chloride
pH was adjusted to 7.0. For the preparation of agar plates the medium was
supplemented with 15 g agar.
For 1 liter TB medium 12 g bacto tryptone
24 g bacto teast extract
10 g sodium chloride
Chapter 4 Materials and laboratory methods
36
4 ml glycerol
900 ml deionized water
The medium was autoclaved, cooled; 100 ml sterile K phosphate and glucose were
added. The final concentration of glucose was 0.5%
For 1 liter K-phosphate, pH 7.1: 23.1 g KH2 PO4
125.4 g K2HPO4
Minimal medium (MM) for uniform enrichment with 15N: For 1 liter MM: 0.5 g NaCl
1.3 ml trace elements solution
1 g citric acid monohydrate
36 mg ferrous citrate
4.02 g KH2PO4
7.82 g K2HPO4 x 3H2O
1 ml Zn-EDTA solution
1 g NH4Cl or 15NH4Cl
pH was adjusted to 7.0 with NaOH, the mixture was autoclaved, upon cooling
separately sterilized solutions were added: 25 ml glucose, 560 µl thiamin, antibiotics,
2ml MgSO4 stock.
Defined medium for selective 15N labeling of proteins For 1 litre of medium: 400 mg Ala, Gln, Glu, Arg, Gly
255 mg Asp, Met
125 mg cytosine, guanosine, uracil
100 mg Asn, Leu, His, Lys, Pro, Thr,
100 mg Try
400 mg Ile, Val
50 mg Phe, thymine, thymidine
1.6 g Ser
10 mg CaCl2
2 g NaAc
10 g K2HPO4

Chapter 4 Materials and laboratory methods
37
1 g citric acid
1.3 ml trace element solution
36 mg ferrous citrate
1 ml Zn-EDTA solution
1g NH4Cl
pH was adjusted to 7.0 with NaOH, the mixture was autoclaved. To the cooled
medium, separately sterilized solutions were added: 25 ml glucose, 560 µl thiamin,
antibiotics, 2ml 1 M MgSO4, sterile filtered:
50 mg Cys, Trp, nicotinic acid
0.1 mg biotin
X mg 15N-amino acid
Another portion of the 15N-amino acid is added at the time of induction as well (same
amount as added before, 0.22 µm filtred).
Stock solutions Glucose: 20% (w/v) in deionised H2O, autoclaved;
Ampicillin: 100 mg/ml of ampicillin in deionised H2O, sterilized by filtration, stored
in aliquots at -20 °C until used. Working concentration: 200 µg/ml.
Chloramphenicol was dissolved in ethanol (0.5 g/10 ml) to the end concentration
of 50mg/ml. Working concentration: 50 µg/ml.
Kanamycin: 50 mg/ml of kanamycin in deionised H2O, sterile filtrated and stored in
aliquots at -20 °C until used. Working concentration: 100 µg/ml.
IPTG: A sterile filtered 1 M stock of IPTG in distilled water was prepared and
stored in aliquots at -20 °C until used.
Thiamin, 1%, in deionised H2O, sterilized by filtration.
MgSO4, 1M, in deionised H2O, sterilized by filtration.
Zn-EDTA solution: 5 mg/ml EDTA
8.4 mg/ml Zn(Ac)2
Trace elements solution: 2.5 g/l H3BO3
2.0 g/l CoCl2 x H2O
1.13 g/l CuCl2 x H2O
Chapter 4 Materials and laboratory methods
38
9.8 g/l MnCl2 x 2H2O
2.0 g/l Na2MoO4 x 2H2O
pH lowered with citric acid or HCl.
4.1.3 Protein purification – buffers Ion exchange and gel filtration chromatography buffers Buffer P(0) 8 mM KH2PO4
16 mM Na2HPO4
0.05% NaN3
pH 7.2
Buffer P(1000) 8 mM KH2PO4
16 mM Na2HPO4
1 M NaCl
0.05% NaN3
pH 7.2
PBS 140 mM NaCl
2.7 mM KCl
10 mM Na2HPO4
1.8 mM KH2PO4
0.05% NaN3
pH 7.3
Buffers for IMAC under denaturing conditions Buffer A 6 M guanidinium chloride
100 mM NaH2PO4 x H2O
10 mM Tris
10 mM β-mercaptoethanol
pH 8.0
Buffer B 6 M guanidinium chloride
100 mM NaH2PO4 x H2O
Chapter 4 Materials and laboratory methods
39
10 mM Tris
10 mM β-mercaptoethanol
pH 6.5
Buffer C 6 M guanidinium chloride
100 mM NaAc x 3H2O
10 mM β-mercaptoethanol
pH 4.0
Buffer D 6 M guanidinium chloride
pH 3.0
Buffer E (refolding buffer) 200 mM arginine HCl
1 mM EDTA
100 mM Tris
2 mM red GSH
2 mM ox GSH
10% (v/v) glycerol
0.05% NaN3
pH 8.4
Buffers for IMAC under native conditions Binding buffer 50 mM NaH2PO4
300 mM NaCl
10 mM imidazole
pH 8.0
Wash buffer 50 mM NaH2PO4
300 mM NaCl
20 mM imidazole
pH 8.0
Elution buffer 50 mM NaH2PO4
300 mM NaCl
Chapter 4 Materials and laboratory methods
40
250 mM imidazole
pH 8.0
Protease buffers Buffer T (thrombin cleavage buffer) 60 mM NaCl
60 mM KCl
2.5 mM CaCl2
50 mM Tris
0.05% NaN3
pH 8.0
Buffer X (Factor Xa cleavage buffer) 100 mM NaCl
4 mM CaCl2
50 mM Tris
0.05% NaN3
pH 8.0
4.1.4 Reagents and buffers for the SDS-PAGE Anode buffer (+): 200 mM Tris pH 8.9
Cathode buffer (-): 100 mM Tris pH 8.25
100 mM tricine
0.1% SDS
Separation buffer: 1 M Tris pH 8.8
0.3% SDS
Stacking buffer: 1 M Tris pH 6.8
0.3% SDS
Separation acrylamide: 48% acrylamide
1.5% bis-acrylamide
Chapter 4 Materials and laboratory methods
41
Stacking acrylamide: 30% acrylamide
0.8% bis-acrylamide
Pouring polyacrylamide gels Separation gel: 1.675 ml H2O
2.5 ml separation buffer
2.5 ml separation acrylamide
0.8 ml glycerol
25 µl APS
2.5 µl TEMED
Intermediate gel: 1.725 ml H2O
1.25 ml separation buffer
0.75 ml separation acrylamide
12.5 µl APS
1.25 µl TEMED
Stacking gel: 2.575 ml H2O
0.475 ml stacking buffer
0.625 ml stacking acrylamide
12.5 µl 0.5 M EDTA, pH 8.0
37.5 µl APS
1.9 µl TEMED
Protein visualization Coomassie-blue solution: 45% ethanol
10% acetic acid
Destaining solution: 5% ethanol
10% acetic acid
Chapter 4 Materials and laboratory methods
42
4.1.5 Enzymes and other proteins BSA New England BioLabs (USA)
CIP New England BioLabs (USA)
BamH I New England BioLabs (USA)
EcoR I New England BioLabs (USA)
Hind III New England BioLabs (USA)
Nde I New England BioLabs (USA)
Xho I New England BioLabs (USA)
Pfu turbo DNA Polymerase Stratagene (USA)
Pwo DNA Polymerase Roche (Germany)
T4 DNA Ligase Roche (Germany)
Dpn I Stratagene (USA)
Xa Factor Sigma (USA)
Xa Factor Novagen (Canada)
TAGzyme Qiagen (Germany)
Thrombin Sigma (USA)
Thrombin Roche (Germany)
hIGF-I receptor grade GroPep (Australia)
4.1.6 Kits and reagents Advantage 2 PCR kit BD biosciences (USA)
ExSite Site-Directed Mutagenesis Kit Stratagene (USA)
ExCite Site-Directed Mutagenesis Kit Stratagene (USA)
QIAquick PCR Purification Kit Qiagen (Germany)
QIAprep Spin Miniprep Kit Qiagen (Germany)
QIAGEN Plasmid Midi Kit Qiagen (Germany)
QIAGEN Plasmid Maxi Kit Qiagen (Germany)
QuikChange Site-Directed Mutagenesis Kit Stratagene (USA)
Pre-Crystallization Test (PCT) Hampton Research (USA)
Rapid Ligation Kit Roche (Germany)
Complete Protease Inhibitor Cocktail Roche (Germany)
Chapter 4 Materials and laboratory methods
43
4.1.7 Protein and nucleic acids markers
Mark12 Standard for SDS-PAGE Invitrogen (Holland)
Prestained Protein Marker, New England BioLabs (USA)
Broad Range (6-175 kDa) 1 kb DNA-Leiter Peqlab (Germany)
4.1.8 Chromatography equipment, columns and media
ÄKTA explorer 10 Amersham Pharmacia (Sweden)
Peristaltic pump P-1 Amersham Pharmacia (Sweden)
Fraction collector RediFrac Amersham Pharmacia (Sweden)
Recorder REC-1 Amersham Pharmacia (Sweden)
UV flow through detector UV-1 Amersham Pharmacia (Sweden)
BioloLogic LP System Biorad (USA)
HiLoad 26/60 Superdex S75pg Amersham Pharmacia (Sweden)
HiLoad 10/30 Superdex S75pg Amersham Pharmacia (Sweden)
Mono Q HR 5/5, 10/10 Amersham Pharmacia (Sweden)
Mono S HR 5/5, 10/10 Amersham Pharmacia (Sweden)
NiNTA-agarose Qiagen (Germany)
4.2 Laboratory methods and principles
4.2.1 Constructs’ design Careful choice of the constructs’ amino and carboxyl termini may decide about later
success or failure of crystallization attempts: erratically behaving, flexible parts of
protein are known to inhibit crystallization or result in crystals of low quality, useless for
structure determination. IGFBPs in turn are known to possess large unstructured
regions, localized mainly in the central - linker – part, but also within the carboxyl-
terminal domain.
Studies on domain organization of IGFBP-5, employing limited proteolysis, protein
sequencing, mass spectrometry and NMR spectroscopy (Kalus, Rehm), determined
approximate boundaries of the proteins’ domains. Because of the high degree of
sequence homology between IGFBPs, the estimates from IGFBP-5 studies could be
Chapter 4 Materials and laboratory methods
44
extended and applied to the remaining members of the family, making the design of
the constructs feasible. Thus, similarly to miniNBP-5(A40-I92), miniNBP-4(A39-L82)
was produced. NBP-4(A3-L82) and NBP-6(A1-A82) had their counterpart in 10kD-
NBP-5 (Kalus). For miniNBP-5, the last 9 amino acids showed no electron density in its
IGF complex structure (Zeslawski et al., 2001) and were unstructured as determined
by NMR (Kalus et al., 1998); equivalent residues were therefore initially not included in
the constructs. It came later to our attention that IGFBP-4 residues Glu90 and Ser91
were probably imortnant for IGF-I and IGF-II binding (Qin et al. 1998), consequently
the constructs were extended, resulting in NBP-4(D1-I92) and NBP-6 (A1-S96). The
residues Asp1 and Glu2 were also added to the NBP-4 N-terminus, when the
importance of the amino-terminal residues became evident. The boundaries of
carboxyl-terminal constructs were chosen assuming that amino acids in an immediate
proximity of disulfide bridges have limited flexibility.
4.2.2 Choice of the expression vector The present day existence of a large number of prokaryotic expression vectors,
possessing various restriction sites and encoding tags facilitating fusion protein
purification (Makrides, 1996), makes a choice of a suitable vector an easy task. The
plasmid-encoded transcription signals: trascription initiation and termination sites and
“strong” promoters, either hybrid or of phage origin, make high levels of mRNA
synthesis possible. A long half-life of the mRNA is assured when specifically designed
E. coli strains are used, for instance BL21 Star, characterized by deletions of genes
encoding specific RNAses. The level of translation, which determines an overall yield
of an overexpressed protein, depends on properties of the transcript RNA: its
sequence and the quality of its codons, rather than on the strength of the promoter.
The hairpin type secondary structure assumed by mRNA leads to attenuation of
ribosome progression, greatly reducing protein production. The phenomenon of a
“codon bias” arises from a different codon usage by eukaryotic and prokaryotic
organisms: from the existing possible triplets encoding one amino acid, the former
group of organisms sometimes chooses different ones than the latter. As a result, a
pool of amino acyl-tRNAs and aa-tRNA synthetases present in E. coli differs from the
one found in human cells. In particular, Arg codons AGA, AGG, CGG, CGA, Ile codon
AUA, Leu codon CUA, Gly codon GGA and Pro codon CCC are rarely used. This
impact appears to be highest when these codons are present near the N-terminus and
Chapter 4 Materials and laboratory methods
45
when they appear consecutively. Several laboratories have shown that the yield of a
protein whose genes contain rare codons can be dramatically improved when the
cognate tRNA is increased within the host (Rosenberg et al., 1993). E. coli strains are
commercially available that have artificially introduced copies of genes encoding the
tRNAs, either at the genomic level or in a plasmid (Rossetta from Invitrogen; BL21 RP
or RIL from Novagen).
The choice of the expression vector and fusion partner/tag is dictated by such
parameters of the recombinant protein as its toxicity to E. coli and solubility. Tightly
controlled expression systems are preferred, such as a pET system based on the
phage T7 RNA polymerase, enabling a high level of control over a basal (i.e.
uninduced) expression of genes encoding toxic proteins. The system provides several
levels of control due to additional plasmids, which express T7 lysosyme, a natural T7
RNA polymerase inhibitor. Large, vector encoded fusion tags, such as glutathione S-
transferase (GSH), thioredoxin or maltose binding protein (MBP) often increase
solubility and promote proper folding of recombinant fusion partners. For proteins
directed into inclusion bodies, use of a 6-histidine fusion peptide (His-Tag) makes use
of immobilized metal chromatography (IMAC) possible under strong denaturing/re-
ducing conditions, enabling rapid purification. It is often observed that the presence of
a tag sequence, even if it is a short His-Tag, preceding the recombinant gene,
enhances its expression, increasing the products’ yield. For carboxyl-terminal
constructs of IGFBP-3 and IGFBP-6 lacking N-terminal tag sequences, expression
yield was reduced below practical levels.
It is often required for functional studies of a recombinant protein and for
crystallization purposes that the fusion tag is removed. This is usually achieved with an
aid of a specific restriction protease. The enzymes most commonly used are serine
proteases of the blood coagulation cascade: Factor Xa (cleaves after R in a IEGRX
sequence, X≠P) and thrombin (cleaves after R in LVPRGS). The sequences encoding
the desired cleavage site are introduced by means of PCR, in 5’-overhangs of forward
primers (Table 2). The specificity of the proteases often appears to be overestimated,
and treatment of the fusion protein with these enzymes results in unwanted cleavage
at sites possessing a certain degree of homology to the recognition sequences.
Certain proteins are actually targets for blood circulating proteases, and are degraded
even at low, physiological concentrations of the enzyme (Zheng et al., 1998). This
problem can be completely avoided when amino dipeptidase (TAGzyme, Qiagen) is
Chapter 4 Materials and laboratory methods
46
used. The enzyme cleaves dipeptides from the N-terminus of a fusion protein, and
stops before Arg, Lys or 1 or 2 residues before Pro. The enzyme is active in the
presence of PMSF and EDTA, making it ideal for work with degradation susceptible
proteins. The enzyme is used for removal of only short N-terminal His-tags.
In choosing the restriction protease, enzyme – target protein compatibility has to
be considered: the optimal cleavage conditions for the enzyme may not be appropriate
for the stability of the protein in question. For instance, Factor Xa requires the
presence of 1-4 mM Ca2+ in the buffer and oxidizing conditions, and will not work in the
presence of chelating agents, phosphate buffer, reducing agents or high salt. Presence
of even small amounts of detergents may hamper its selectivity. PreScission protease
on the other hand requires strong reducing conditions.
Plasmids pET 28a and pQE 80 were selected as vectors of choice for expression
of the proteins discussed in this work. All amino-terminal constructs and mutants of
IGFBP-4 and –5 were cloned into pET 28a in frame to a His/T7-tag of the following
sequence: MGSSHHHHHHCCGLVPRGSHMASMTGGQQMGRGSIEGR. Treatment
with Factor Xa (the cleavage site in bold) yielded proteins with native N-termini. The
same vector was used to express CBP-4, -5 and –6, both Factor Xa and thrombin sites
were introduced. The construct CBP-5 appeared to by remarkably susceptible to
excessive cleavage by both restriction proteases. It was therefore subcloned into pQE
80, enabling successful use of the TAGzyme.
4.2.3 DNA techniques
4.2.3.1 Preparation of plasmid DNA
The isolation of plasmid DNA from E. coli was carried out using dedicated plasmid
purification kits from Qiagen. The kits employ a standard alkalic lysis of the precipitated
bacteria in the presence of RNAse and strong ionic detergent, SDS, followed by
neutralization/DNA renaturation with acetate. For purification, a crude cell lysate is
loaded onto a silica gel column, washed with an ethanol-containing buffer, and eluted
in a small volume, yielding up to 20 µg of the plasmid DNA.
4.2.3.2 PCR
A polymerase chain reaction was employed to amplify desired DNA fragments and
genes, introduce restriction sites, STOP codons and sequences encoding restriction
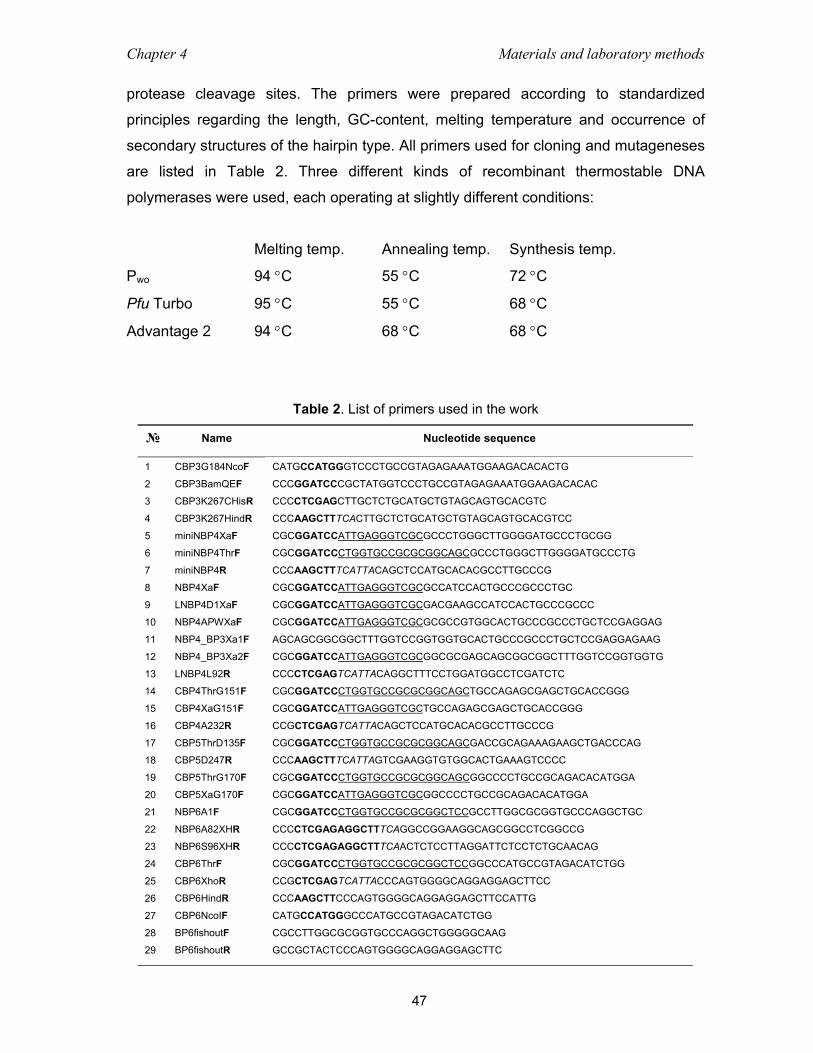
Chapter 4 Materials and laboratory methods
47
protease cleavage sites. The primers were prepared according to standardized
principles regarding the length, GC-content, melting temperature and occurrence of
secondary structures of the hairpin type. All primers used for cloning and mutageneses
are listed in Table 2. Three different kinds of recombinant thermostable DNA
polymerases were used, each operating at slightly different conditions:
Melting temp. Annealing temp. Synthesis temp.
Pwo 94 °C 55 °C 72 °C
Pfu Turbo 95 °C 55 °C 68 °C
Advantage 2 94 °C 68 °C 68 °C
Table 2. List of primers used in the work
№ Name Nucleotide sequence
1
2
3
4
5
6
7
8
9
10
11
12
13
14
15
16
17
18
19
20
21
22
23
24
25
26
27
28
29
CBP3G184NcoF CBP3BamQEF
CBP3K267CHisR
CBP3K267HindR
miniNBP4XaF miniNBP4ThrF miniNBP4R NBP4XaF
LNBP4D1XaF
NBP4APWXaF NBP4_BP3Xa1F NBP4_BP3Xa2F LNBP4L92R CBP4ThrG151F CBP4XaG151F CBP4A232R CBP5ThrD135F
CBP5D247R
CBP5ThrG170F CBP5XaG170F NBP6A1F
NBP6A82XHR NBP6S96XHR
CBP6ThrF CBP6XhoR CBP6HindR
CBP6NcoIF
BP6fishoutF BP6fishoutR
CATGCCATGGGTCCCTGCCGTAGAGAAATGGAAGACACACTG
CCCGGATCCCGCTATGGTCCCTGCCGTAGAGAAATGGAAGACACAC
CCCCTCGAGCTTGCTCTGCATGCTGTAGCAGTGCACGTC
CCCAAGCTTTCACTTGCTCTGCATGCTGTAGCAGTGCACGTCC
CGCGGATCCATTGAGGGTCGCGCCCTGGGCTTGGGGATGCCCTGCGG
CGCGGATCCCTGGTGCCGCGCGGCAGCGCCCTGGGCTTGGGGATGCCCTG
CCCAAGCTTTCATTACAGCTCCATGCACACGCCTTGCCCG
CGCGGATCCATTGAGGGTCGCGCCATCCACTGCCCGCCCTGC
CGCGGATCCATTGAGGGTCGCGACGAAGCCATCCACTGCCCGCCC
CGCGGATCCATTGAGGGTCGCGCGCCGTGGCACTGCCCGCCCTGCTCCGAGGAG
AGCAGCGGCGGCTTTGGTCCGGTGGTGCACTGCCCGCCCTGCTCCGAGGAGAAG
CGCGGATCCATTGAGGGTCGCGGCGCGAGCAGCGGCGGCTTTGGTCCGGTGGTG
CCCCTCGAGTCATTACAGGCTTTCCTGGATGGCCTCGATCTC
CGCGGATCCCTGGTGCCGCGCGGCAGCTGCCAGAGCGAGCTGCACCGGG
CGCGGATCCATTGAGGGTCGCTGCCAGAGCGAGCTGCACCGGG
CCGCTCGAGTCATTACAGCTCCATGCACACGCCTTGCCCG
CGCGGATCCCTGGTGCCGCGCGGCAGCGACCGCAGAAAGAAGCTGACCCAG
CCCAAGCTTTCATTAGTCGAAGGTGTGGCACTGAAAGTCCCC
CGCGGATCCCTGGTGCCGCGCGGCAGCGGCCCCTGCCGCAGACACATGGA
CGCGGATCCATTGAGGGTCGCGGCCCCTGCCGCAGACACATGGA
CGCGGATCCCTGGTGCCGCGCGGCTCCGCCTTGGCGCGGTGCCCAGGCTGC
CCCCTCGAGAGGCTTTCAGGCCGGAAGGCAGCGGCCTCGGCCG
CCCCTCGAGAGGCTTTCAACTCTCCTTAGGATTCTCCTCTGCAACAG
CGCGGATCCCTGGTGCCGCGCGGCTCCGGCCCATGCCGTAGACATCTGG
CCGCTCGAGTCATTACCCAGTGGGGCAGGAGGAGCTTCC
CCCAAGCTTCCCAGTGGGGCAGGAGGAGCTTCCATTG
CATGCCATGGGCCCATGCCGTAGACATCTGG
CGCCTTGGCGCGGTGCCCAGGCTGGGGGCAAG
GCCGCTACTCCCAGTGGGGCAGGAGGAGCTTC
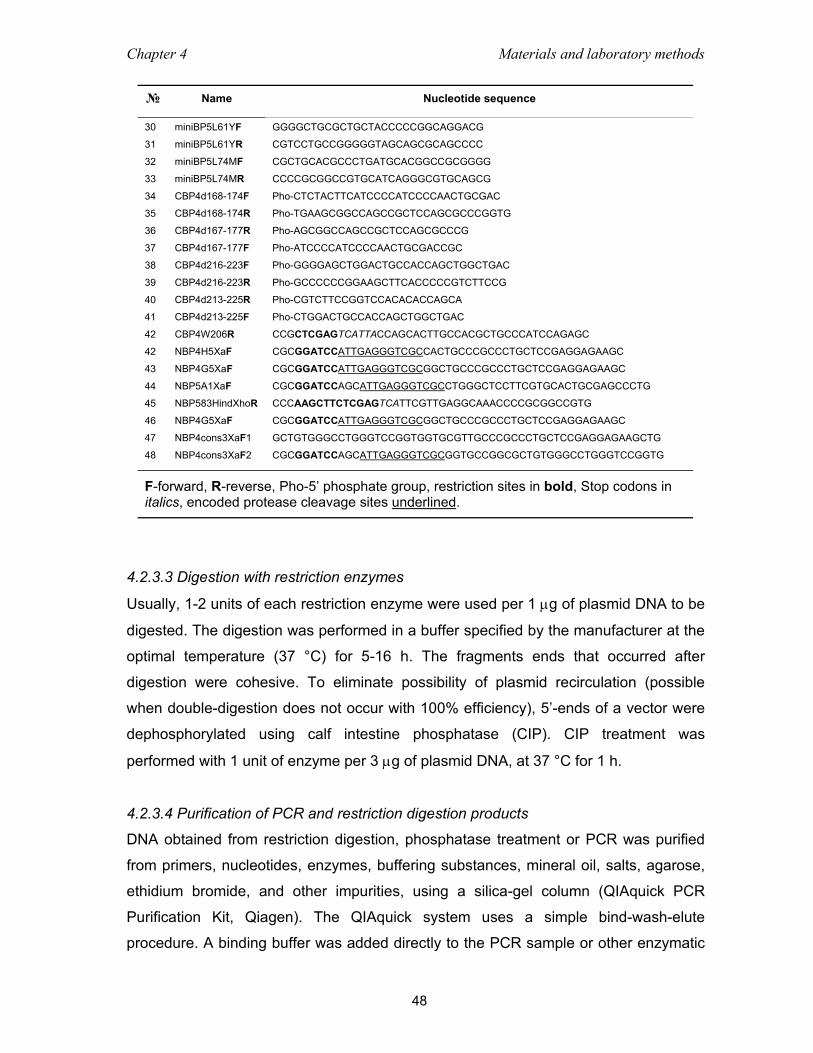
Chapter 4 Materials and laboratory methods
48
№ Name Nucleotide sequence
30
31
32
33
34
35
36
37
38
39
40
41
42
42
43
44
45
46
47
48
miniBP5L61YF miniBP5L61YR
miniBP5L74MF miniBP5L74MR
CBP4d168-174F CBP4d168-174R CBP4d167-177R CBP4d167-177F
CBP4d216-223F
CBP4d216-223R CBP4d213-225R CBP4d213-225F CBP4W206R NBP4H5XaF
NBP4G5XaF NBP5A1XaF NBP583HindXhoR
NBP4G5XaF
NBP4cons3XaF1
NBP4cons3XaF2
GGGGCTGCGCTGCTACCCCCGGCAGGACG
CGTCCTGCCGGGGGTAGCAGCGCAGCCCC
CGCTGCACGCCCTGATGCACGGCCGCGGGG
CCCCGCGGCCGTGCATCAGGGCGTGCAGCG
Pho-CTCTACTTCATCCCCATCCCCAACTGCGAC
Pho-TGAAGCGGCCAGCCGCTCCAGCGCCCGGTG
Pho-AGCGGCCAGCCGCTCCAGCGCCCG
Pho-ATCCCCATCCCCAACTGCGACCGC
Pho-GGGGAGCTGGACTGCCACCAGCTGGCTGAC
Pho-GCCCCCCGGAAGCTTCACCCCCGTCTTCCG
Pho-CGTCTTCCGGTCCACACACCAGCA
Pho-CTGGACTGCCACCAGCTGGCTGAC
CCGCTCGAGTCATTACCAGCACTTGCCACGCTGCCCATCCAGAGC
CGCGGATCCATTGAGGGTCGCCACTGCCCGCCCTGCTCCGAGGAGAAGC
CGCGGATCCATTGAGGGTCGCGGCTGCCCGCCCTGCTCCGAGGAGAAGC
CGCGGATCCAGCATTGAGGGTCGCCTGGGCTCCTTCGTGCACTGCGAGCCCTG
CCCAAGCTTCTCGAGTCATTCGTTGAGGCAAACCCCGCGGCCGTG
CGCGGATCCATTGAGGGTCGCGGCTGCCCGCCCTGCTCCGAGGAGAAGC
GCTGTGGGCCTGGGTCCGGTGGTGCGTTGCCCGCCCTGCTCCGAGGAGAAGCTG
CGCGGATCCAGCATTGAGGGTCGCGGTGCCGGCGCTGTGGGCCTGGGTCCGGTG
F-forward, R-reverse, Pho-5’ phosphate group, restriction sites in bold, Stop codons in italics, encoded protease cleavage sites underlined.
4.2.3.3 Digestion with restriction enzymes
Usually, 1-2 units of each restriction enzyme were used per 1 µg of plasmid DNA to be
digested. The digestion was performed in a buffer specified by the manufacturer at the
optimal temperature (37 °C) for 5-16 h. The fragments ends that occurred after
digestion were cohesive. To eliminate possibility of plasmid recirculation (possible
when double-digestion does not occur with 100% efficiency), 5’-ends of a vector were
dephosphorylated using calf intestine phosphatase (CIP). CIP treatment was
performed with 1 unit of enzyme per 3 µg of plasmid DNA, at 37 °C for 1 h.
4.2.3.4 Purification of PCR and restriction digestion products
DNA obtained from restriction digestion, phosphatase treatment or PCR was purified
from primers, nucleotides, enzymes, buffering substances, mineral oil, salts, agarose,
ethidium bromide, and other impurities, using a silica-gel column (QIAquick PCR
Purification Kit, Qiagen). The QIAquick system uses a simple bind-wash-elute
procedure. A binding buffer was added directly to the PCR sample or other enzymatic
Chapter 4 Materials and laboratory methods
49
reaction, and the mixture was applied to the spin column. Nucleic acids adsorbed to
the silica-gel membrane in the high-salt conditions provided by the buffer. Impurities
and short fragments of single or double-stranded DNAs were washed away and pure
DNA was eluted with a small volume of 10 mM Tris pH 8.0 or water.
4.2.3.5 Mutagenesis of the miniNBP-5 and CBP-4
Site directed mutagenesis of miniNBP-5 was performed by means of PCR, using
enzymes and instructions supplied in the QuikChange Site-Directed Mutagenesis Kit
(Stratagene). The mutagenic oligonucleotide primers were designed according to
suggestions provided by the manufacturer: they possessed 30-32 bases in length, their
melting temperatures were greater than 78 °C, they had a GC content of more than
40% and terminated in C or G bases. The desired mutation was in the middle of the
primer with ~ 10-15 bases of a correct sequence on both sides (Table 2, primers: 30,
31, 32, 33). Vector pET 28a containing a copy of a gene encoding miniNBP-5 was
used as a DNA template. High concentration of the template DNA and low number of
PCR cycles, combined with high accuracy and fidelity of highly processive DNA
polymerase Pfu Turbo, minimizes the occurrence of unwanted mutations.
The mutagenic PCR reaction mixture contained:
10 × reaction buffer 5 µl
plasmid (5 ng/µl) 2 µl (10 ng)
oligonucleotide primer F 1.25 µl (125 ng)
oligonucleotide control primerF 1.25 µl (125 ng)
dNTP mix 1 µl
milli-Q to a final volume of 50 µl 39.5 µl
PfuTurbo DNA polymerase (2.5 U/µl) 1 µl
PCR cycling parameters:
denaturation: 95 °C, 30’’
denaturation: 95 °C, 30’’
annealing: 55 °C, 1’ 16 x
synthesis (1 min per 1000 base pairs): 68 °C, 4.5’
Chapter 4 Materials and laboratory methods
50
Following temperature cycling, the product was treated with Dpn I (10 U, 37 °C, for 2
h). The Dpn I endonuclease (target sequence: 5´-Gm6ATC-3´) is specific for
methylated and hemimethylated DNA and is used to digest the parental DNA template
and to select for mutation-containing synthesized DNA. 2 µl of the mixture were used
to transform XL1-Blue or Top10 chemically competent cells. Plasmid DNA was isolated
using QIAprep Spin Miniprep Kit (Qiagen) and was subjected to verification by
automated sequencing.
Essentially the same procedure was applied for deletional mutagenesis of CBP-4.
Since in this case a linear PCR product is obtained, 5’-phosphorylated primers were
applied to enable a subsequent blunt-end ligation. After Dpn I treatment, linear DNA
was end polished with cloned Pfu DNA polymerase to remove extended bases placed
on the 3’ ends of the PCR products by ExSite DNA polymerase. The DNA was then
intramolecularly ligated at 37 °C for 1 h with T4 DNA ligase and transformed into the
XL1-Blue or Top10 supercompetent cells.
4.2.3.6 Agarose gel electrophoresis of DNA
For verification of the presence and length of PCR or restriction digestion products,
agarose gel electrophoresis was performed. For this purpose 1% agarose in TBE
buffer plus ethidium bromide was prepared. The solution was poured into a horizontal
gel chamber to cool down and polymerise. The DNA samples were mixed with 6x
sample buffer prior loading. Electrophoresis was carried out at 100-120 V DC. Results
were evaluated using UV illumination.
4.2.4 Transformation of E. coli A number of factors have been elucidated that produced an increase in transformation
efficiency. Such factors include: prolonged incubation of bacteria with CaCl2, addition
of multiple cations, such as Mg2+, Cs2+ or Rb2+, into the transformation mixture and
treatment of bacteria with dimethyl sulfoxide (DMSO), polyethylene glycol, hexamine-
cobalt, and dithiothreitol in the presence of both monovalent and divalent cations
(Chung et al., 1989). After incubation with DNA, in order to make the cells keep the
plasmid and to be certain they survive, the cells were heat shocked for several
seconds to induce heat shock genes, which aid in survival and recovery. The cells
were than incubated at 37 °C without selective pressure; sufficient time was given for
Chapter 4 Materials and laboratory methods
51
expression of antibiotic resistance genes. Plating on selective media enabled recovery
of those cells that actually received the DNA.
Transformation by electroporation employs high voltage to temporarily puncture
bacterial cell walls. High mortality of cells treated this way implicates the need for high
concentrations of bacteria. Preparation of electrocompetent cells was resolved by
thorough washing of pelleted cells in order to remove salt present in growth media,
which would otherwise cause short-circuiting and mass destruction of the cells.
4.2.4.1 Transformation of chemically competent cells
3 µl of a ligation mix or ca. 50 µg of plasmid DNA was added to 50 µl of chemically
competent cells. The mixture was incubated on ice for 30 min followed by a heat shock
of 30 s at 42 °C, short cooling on ice, and addition of 250 µl of glucose and magnesium
containing medium. After 1 h of incubation at 37 °C, 20-50 µl of the mixture was spread
out on LB agar plates that included selective antibiotic and incubated overnight at 37
°C.
4.2.4.2 Transformation by electroporation
1 µl of an aqueous solution of plasmid DNA (ca. 100 ng/µl) was added to 50 µl of
electrocompetent cells, the mixture was pipetted into a 2 mm electroporation cuvette.
The electroporation was performed in an electroporation vessel (Gene pulser) at 1650
V. Then the suspension was transferred into an Eppendorf tube and mixed with 1 ml
LB medium. After 1 h of incubation at 37 °C, cells were plated as described above.
4.2.5 Protein chemistry methods & techniques 4.2.5.1 Sonication
Sonication is a simple method used for the disruption of cells by ultrasounds. The high
frequency sound wave induces formation of cavitations in the solution, the collapse of
which produces sheer forces able to break cells. The advantage of this method for cell
disruption over French press, freezing and thawing or lysozyme digestion is
comparatively low viscosity of the lysate due to the nucleic acid fragmentation.
Pulsed mode of operation was applied (output control 8, 60% duty cycle) and
sonication was carried out on ice, in 3 steps of 5 min each, with 5 min intervals
between steps, to avoid overheating of the sample.
Chapter 4 Materials and laboratory methods
52
4.2.5.2 SDS polyacrylamide gel electrophoresis (SDS PAGE)
SDS polyacrylamide gel electrophoresis was performed at various stages of
purification to verify samples’ purity, identity of the eluted proteins in chromatography
purification, progression of enzymatic digestion etc. Due to the small size of the
expressed proteins, tricine gels were applied (Schagger and von Jagow, 1987).
Tricine, used as the trailing ion instead of glycine, allows a resolution of small proteins
at lower acrylamide concentrations than in glycine-SDS-PAGE systems. A resolution of
proteins, especially in the range between 5 and 20 kDa, is thus achieved without the
necessity to use urea.
The guanidinium HCl-free protein samples were prepared by mixing 20 µl of
protein solution with 5 µl of sample buffer (SB) followed by 3 min incubation at 100 °C.
Due to rapid precipitation of SDS in contact with guanidine, the samples to be
examined by PAGE after Ni-NTA chromatography under denaturing conditions had to
be prepared in a following fashion: 20 µl of the protein solution in a denaturing buffer
was diluted with 400 µl 20% trichloroacetic acid (TCA). The sample was incubated for
5 min at room temperature followed by centrifugation for 5 min at 20 000 x g.
Supernatant was discarded by suction, the precipitated protein pellet was washed
once by vortexing with 400 µl ethanol. After centrifugation and ethanol removal, the
protein pellet was resuspended in 20 µl of 2x SB and the sample was boiled for 3 min.
4.2.5.3 Visualization of separated proteins
For visualization of the protein bands, the gels were stained in a Coomassie-blue
solution. Background was cleared by incubation of the gel in a destaining solution.
Both processes were greatly accelerated by brief heating with microwaves of the gel
submerged in an appropriate solution.
4.2.5.4 Protein expression, refolding and purification
The One Shot® BL21 Star™ (DE3) chemically competent cells were transformed with
the plasmid DNA according to the protocol described above. Growth media contained
kanamycin (for pET 28a transformed cells) or ampicillin (for pQE transformed cells) as
selective antibiotics. Use of ampicillin as a selective antibiotic requires special care
because β-lactamase is made in substantial amounts and is secreted into the medium,
where it can destroy all of the ampicillin. In addition, ampicillin is susceptible to
hydrolysis under acidic media conditions created by bacterial metabolism. This means
Chapter 4 Materials and laboratory methods
53
that a culture in which the cells carry an unstable plasmid will be growing under
ampicillin selection only until enough β-lactamase has been secreted to destroy the
ampicillin in the medium. From that point on, cells that lack the plasmid will not be
killed and will begin to overgrow the culture. This point is reached when the culture is
barely becoming turbid (about 107 cells per milliliter) for a typical pBR322-based
plasmid, growing in amedium containing 50 µg ampicillin per ml. The presence of 200
µg ampicillin per milliliter delays this point to a slightly higher cell density, but given the
catalytic activity of β-lactamase, it would not be feasible to add enough ampicillin to the
medium to keep the cells under selection all the way to saturation. The precultures
used as starting cultures were therefore grown at 28 °C, to slow bacterial growth, and
not longer than 12 h.
The overnight cultures of 20 ml were used as an inoculum for the 1 liter culture.
Typically, the cells were induced at OD600 = 0.8-0.9 by addition of IPTG (1 mM final
concentration) and cells were grown for the next 3 h with vigorous shaking at 37 °C.
The cells were harvested by centrifugation (5500 x G, 20 min, 4 °C), bacterial pellets
were resuspended in buffer A and left for solubilisation at room temperature overnight.
The cell suspension was sonicated 3 x 5 minutes using a macrotip (output control 7.5,
50%) and centrifuged at 60000 x g for 1 h at 20 °C. The resulting supernatant was
incubated with a Ni-NTA slurry (Qiagen), equilibrated previously with buffer A for 1 h at
room temperature with gentle agitation. Next, the mixture was loaded onto an empty
column and washed with buffer A and B. The protein was eluted with buffer C. The
fractions containing the desirable protein were pooled, concentrated and dialysed
against buffer D for removal of reducing agents. Subsequently, refolding of the protein
was performed. For this purpose, the protein sample was stepwise diluted in buffer E
in a 1:50 volume proportion. The refolding mixture was left with stirring at 4 °C. After 3
days, the mixture was concentrated and dialysed against a low salt phosphate buffer,
and then was loaded onto a cation exchange column (MonoS). Bound proteins were
fractionated with a linear NaCl gradient. Fractions containing the protein of interest
were pooled and dialysed against thrombin or Factor Xa cleavage buffers. Factor Xa
digestion was performed for 72 h at room temperature in the 50 mM Tris buffer pH 8.0,
150 mM NaCl, 4 mM CaCl2 using 1 U of the activated protease (Novagen) per 1 mg of
the fusion protein. Thrombin cleavage was carried out in the same conditions; 2 U of
thrombin (Sigma) was used per 1 mg of protein.
Chapter 4 Materials and laboratory methods
54
The proteins of interest were separated from the HisTag and protease by gel
filtration on the Superdex 75 prep grade 26/60 XR column. The buffer used contained
140 mM NaCl, 2.7 mM KCl, 10 mM Na2HPO4, 1.8 mM KH2PO4, 0.05% NaN3, pH 7.3.
4.2.5.5 Determination of protein concentration
The concentration of proteins in solution was estimated by means of the Bradford
colorimetric assay. 5 µl of the protein sample was added to 1 ml (10 x diluted stock)
Bradford reagent (BioRad) into a plastic cuvette. After gentle mixing, A595 was
measured and converted to the protein concentration on the basis of a calibration
curve prepared for known concentrations of BSA.
A precise protein concentration determination was performed spectrophoto-
metrically. Absorption at 280 nm was measured and converted to a protein
concentration on the basis of theoretical extinction coefficients. It has been shown that
it is possible to estimate the molar extinction coefficient Eλ(Prot) of a protein from
knowledge of its amino acid composition (Gill and Hippel, 1989). From the molar
extinction coefficient of tyrosine, tryptophan and cystine (cysteine residues do not
absorb appreciably at wavelenghts >260 nm, while cystine does) at a given
wavelength λ the extinction coefficient of a protein can be computed using the
equation:
Eλ(Prot) = Numb(Tyr)xExtλ(Tyr) + Numb(Trp)xExtλ(Trp) + Numb(cystine)xExtλ(cystine)
The absorbance (A, optical density) can be calculated using the following formula:
Aλ (Prot) = Eλ(Prot) / Molecular weight.
4.2.6 X-ray crystallography 4.2.6.1 protein crystallization
The purity and homogeneity of the proteins subjected to crystallization (i.e. NBP-4(3-
82), NBP-4(-1-92) and CBP-4) was evaluated using N-terminal sequencing and mass
spectrometry. IGF-I was purchased from GroPep (Australia). The binary (NBP-4/IGF-I)
and ternary (NBP-4(3-82)/CBP-4/IGF-I) complexes were prepared by mixing equimolar
amounts of the respective components. The complexes were separated from any
excess of either protein by gel filtration on the Superdex S75 prep grade 26/60XR
column. The buffer used contained 5 mM Tris, pH 8.0, 50 mM NaCl and 0.01% NaN3.
Chapter 4 Materials and laboratory methods
55
Preliminary determination of the range of favorable protein concentration was
performed using a Pre-Crystallization Test (PCT, Hampton Research). The search of
crystallization conditions was performed using Hampton Research crystallization
screens I, II and Index (Hampton Research), as well as the in-house library of
factorials.
Initial screening of crystallization conditions for NBP-4(3-82)/IGF-I binary complex
yielded 3 hits. Crystal Screen I solutions 42 (0.05 M KH2PO4, 20% PEG 8000) and 43
(30% PEG 1500) contained a quasi-crystalline material. The Index screen solution 37
(25% w/v PEG 1500) produced micro crystals. The latter condition was further
optimized in terms of PEG and protein concentrations. The largest influence on crystal
formation, however, had addition of the Tris buffer (even at concentrations as low as
12.5 mM) promoting growth of large crystals. Crystallization occurred in various
conditions of pH (7.25-8.45), PEG (20-23%) and Tris (12.5-100 mM) concentrations.
Micro seeding had to be applied to induce crystal growth in most drops. Crystallization
of the NBP-4(3-82)/IGF-I binary complex was carried out with the sitting drop vapor
diffusion method. The X-ray quality crystals were obtained from 23% PEG 1500, 25
mM Tris pH 7.8. They appeared in several days and grew to a final size of ca. 0.4 x 0.2
x 0.2 mm. Figure 14 encloses photographs of the crystals.
Crystals of NBP-4(1-92)/IGF-I were grown from the Index solution 74 (0.2 M
lithium sulfate monohydrate, 0.1 M Bis-Tris pH 5.5 and 25% w/v PEG 3350). The
optimization of the conditions was achieved by dilution of the original solution by the
factor of 1/16, 1/8 and 1/4, varying the size of drops and the ratios of protein and
precipitant. Large, up to 0.8 mm, long plates or plate cluster crystals grew throughout
the range of these conditions.
Crystallization of the NBP-4(3-82)/CBP-4/IGF-I ternary complex occurred in the
Crystal Screen solution 49 and 50 (1.0 M lithium sulfate monohydrate, 15% w/v PEG
8000 and 0.5 M lithium sulfate monohydrate, 2% w/v PEG 8000, respectively), and the
in-house factorial 30 (0.1 M ammonium sulfate, 0.1 M Hepes/NaOH pH 7.3, 20% PEG
4000). The crystals grown in solution 49, although flawless in appearance (Figure 14
H), demonstrated poor diffraction properties. Further optimization (constant 1 M lithium
sulfate concentration, varying concentration of PEG 8000: 0.5, 1, 1.5, 2%) produced
large crystals of totally different morphology, diffracting up to 3 Å (Figure 14 E, F and
G). The crystals of the first batch appeared after 2-6 days. It took 1 year for the
optimized ones to emerge from the solution. These crystals were subsequently used
Chapter 4 Materials and laboratory methods
56
for heavy metal derivatization. Factorial 30 yielded crystals diffracting up to 2.1 Å, but
the conditions for their growth could not be repeated.
4.2.6.2 Data collection and molecular replacement
Prior to plunge freezing, the crystals of the NBP-4(3-82)/IGF-I binary complex were
soaked for ca. 30 s in a drop of a reservoir solution containing 15% v/v ethylene glycol
as cryoprotectant. The crystals belonged to the space group P212121 and contained
one complex per an asymmetric unit.
A lower-resolution dataset (up to 2.1 Å) was collected from a plunge frozen crystal
at a rotating anode laboratory source. The high-resolution dataset up to 1.6 Å was
collected on the MPG/GBF beamline BW6 at DESY, Hamburg, Germany. Collected
data were integrated, scaled and merged by XDS and XSCALE programs (Kabsch,
1993). The structure was determined by molecular replacement using the Molrep
program from the CCP4 suite (CCP4, 1994). The structure of the complex of IGF-I and
a fragment of the N-terminal domain of IGFBP-5 (miniNBP-5, PDB entry 1H59) was
used as a probe structure (Zeslawski et al., 2001). Rotation search in the Patterson
space yielded one peak of a height 7.56 σ over the highest noise peak of 3.75 σ.
Translation search gave a 16.28 σ peak over the noise height of 9.49 σ. The initial R-
factor of the model was 0.49. At this stage the free atom model improvement was
performed using Arp/wArp (Perrakis et al., 2001). As the next step an iterative model
building was performed using Arp/wArp (Perrakis et al., 1999). The initial model
consisted of 137 residues and was completed and revised manually using Xfit software
(McRee, 1999). Arp/wArp was used to add solvent atoms (Lamzin et al., 1993).
The structure was finally refined by the Refmac5 program (CCP4, 1994). Final
electron density maps were of high quality; there were however no interpretable
densities for side chains of residues Glu11, Arg16, Leu42, Glu66 and Glu81 of NPB-4
and Lys27, Arg37, Arg50 of IGF-I. These side chains were removed from the model.
The final R crystallographic factor was 0.186 and Rfree 0.2582. Data collection and
refinement statistics are summarized in Table 3.
Crystals of the ternary complex were obtained in two conditions. One form,
obtained from 1 M lithium sulfate and 1 % PEG 8000, diffracted up to 2.9 Å and
belonged to the space group R32. The second crystal, grown from 0.1 M ammonium
sulfate, 20% PEG 4000 and 0.1 M Hepes/NaOH, with the space group C2, diffracted
up to 2.1 Å. Molecular replacement trials using the NBP4/IGF-I model were unsuccess

Chapter 4 Materials and laboratory methods
57
ful. Experimental phasing was then performed using R32 crystals; we did not succeed
in derivatizing C2 crystals. Soaking crystals with 2 mM potassium hexabromoplatinate
(IV) or 2 mM uranylacetate for 24 h created two isomorphous derivatives. Native and
derivative datasets were collected at the BW6 beamline in DESY, Hamburg. Datasets
Table 3. Data collection and refinement statistics for the NBP-4(3-82)/IGF-I complex
Data Collection
Space group
Cell constants (Å)
Resolution range (Å)
Wavelength (Å)
Observed reflections
Unique reflections
Whole range:
Completeness (%)
Rmerge
I/σ(I)
Last shell:
Resolution range (Å)
Completeness (%)
Rmerge
I/σ(I)
P212121
a=34.47 b=54.28 c=74.55
37-1.6
1.542, 1.05
86002
17605
92.1
4.4
16.86
1.6-1.7
76.9
17.8
5.45
Refinement
No. of reflections
Resolution (Å)
R-factor (%)
Rfree (%)
Average B (Å2)
R.m.s bond length (Å)
R.m.s. angles (°)
17388
30-1.6
18.65
25.82
24.51
0.017
1.83
Content of Asymmetric Unit
No. of protein complexes
No. of protein residues/atoms
No. of solvent atoms
1
144/1061
157
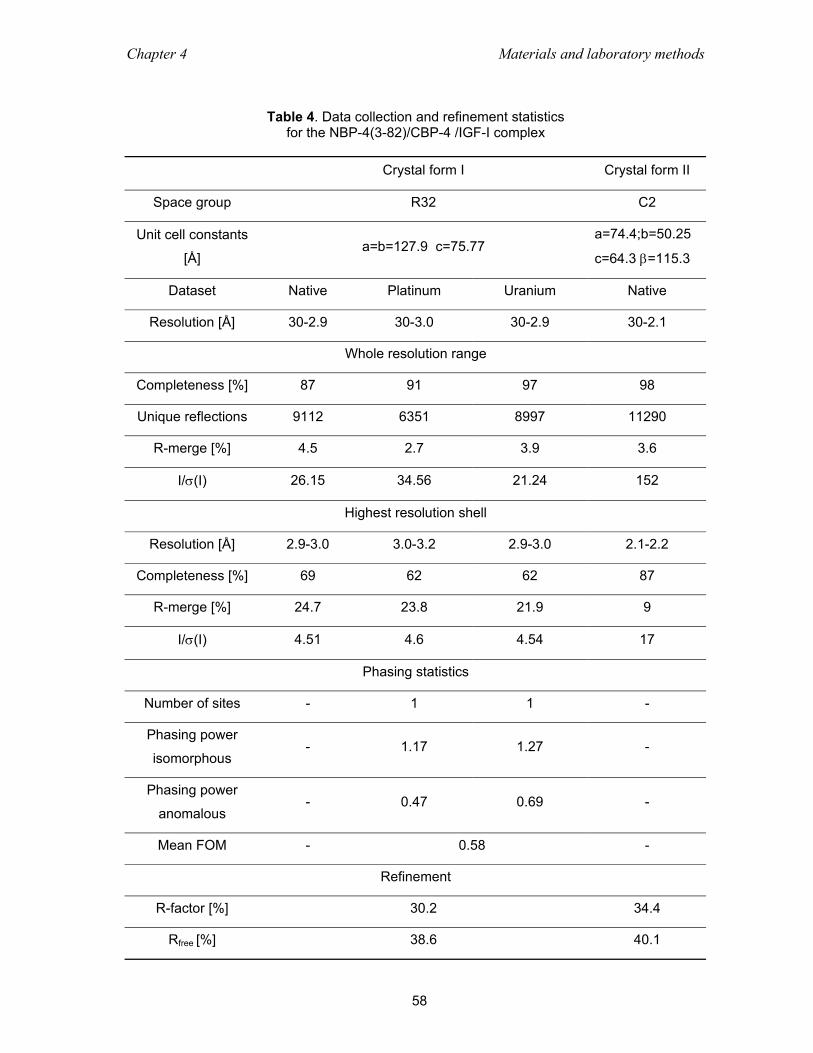
Chapter 4 Materials and laboratory methods
58
Table 4. Data collection and refinement statistics
for the NBP-4(3-82)/CBP-4 /IGF-I complex
Crystal form I Crystal form II
Space group R32 C2
Unit cell constants
[Å] a=b=127.9 c=75.77
a=74.4;b=50.25
c=64.3 β=115.3
Dataset Native Platinum Uranium Native
Resolution [Å] 30-2.9 30-3.0 30-2.9 30-2.1
Whole resolution range
Completeness [%] 87 91 97 98
Unique reflections 9112 6351 8997 11290
R-merge [%] 4.5 2.7 3.9 3.6
I/σ(I) 26.15 34.56 21.24 152
Highest resolution shell
Resolution [Å] 2.9-3.0 3.0-3.2 2.9-3.0 2.1-2.2
Completeness [%] 69 62 62 87
R-merge [%] 24.7 23.8 21.9 9
I/σ(I) 4.51 4.6 4.54 17
Phasing statistics
Number of sites - 1 1 -
Phasing power
isomorphous - 1.17 1.27 -
Phasing power
anomalous - 0.47 0.69 -
Mean FOM - 0.58 -
Refinement
R-factor [%] 30.2 34.4
Rfree [%] 38.6 40.1
Chapter 4 Materials and laboratory methods
59
were indexed, integrated and scaled using a XDS software package. Heavy atom
search and phase improvement were performed with the SHARP program (de La
Fortelle and Bricogne, 1997) using both anomalous and isomorphous signals. The
phases obtained were of good quality up to the resolution of 3.5 Å. The model of the
NBP4/IGF-I complex was fitted to this map. All parts of the complex maintain the
spatial organization found in the crystals of the NBP4/IGF-I binary complex. After
placing the NBP-4/IGF part, polyalanine fragments were fitted into a broken electron
density associated with the C-terminal domain. This model of the complex was later
used as a molecular replacement probe for the C2 crystal data. The replacement
solution was clear, however further model building and completion of the C-terminal
part was not possible. The current R-factor of the ternary complex model is 34%.
Statistics of data collection, phasing and refinement are summarized in Table 4.
4.2.7 NMR - experimental procedure All NMR experiments were carried out on a Bruker DRX 600 spectrometer equipped
with a triple resonance, triple gradient 5 mm probehead, at 300 K. The samples
contained typically 0.1-0.5 mM protein in the PBS buffer supplemented with 10% 2H2O.
All the 1D 1H NMR spectra were recorded with a time domain of 32 K complex points
and a sweep-width of 10,000 Hz. The 2D 1H-15N-HSQC spectra were recorded with a
time domain of 1K complex data points with 128 complex increments with a sweep
width of 8 kHz in the 1H dimension and 2 kHz in the 15N dimension.
4.2.8 Isothermal titration calorimetry All experiments were carried out according to references provided by the
manufacturer. Proteins (IGFBPs, their separate domains and IGF-I) were used at 0.25-
0.4 mM in PBS (140 mM NaCl, 2.7 mM KCl 10 mM Na2HPO4, 1.8 mM KH2PO4, 0.05
NaN3, pH 7.3) and titrated from a 300 µl syringe into a sample chamber holding 1.43
ml of 0.025-0.04 mM respective binding partner. All solutions were degassed prior to
measurements. Heat generated by protein dilution was determined in separate
experiments by injecting protein solution into PBS filled sample chamber. All data were
corrected for the heat of protein dilution. The details of the experimental and injection
parameters are described below.
Parameters of the experiments:
total number of injections: 58

Chapter 4 Materials and laboratory methods
60
volume of a single injection [µl]: 5
duration of an injection [sec]: 10
intervals between injections [sec]: 400
filter period [sec]: 2
equilibrium cell temperature [°C]: 20
initial delay [sec]: 60
reference power [µCal/sec]: 15
stirring speed [RPM]: 270
All data were corrected for the heat of protein dilution. Data were fitted using χ2
minimization on a model assuming a single set of sites to calculate the binding affinity
KD, except for titrations involving the NBP-4–IGF binary complex with CBP-4, where
only a 2 binding site model could be applied. All steps of the data analysis were
performed using ORIGIN (V5.0) software provided by the manufacturer.
4.2.9 Fluorescence measurements Binding of NBP-4 and CBP-4 to IGF-I was monitored by changes in the intrinsic
tryptophan 3 fluorescence of a mutant BP1-NBP-4 (residues 1-3 of the IGFBP-1
followed by residues 5-82 of IGFBP-4). Experiments were performed in a 1 ml
fluorimeter cuvette at 20 °C using Perkin Elmer LS 50 B luminance spectrophotometer
with spectral bandwidth of 5 nm for excitation and emission. The proteins and protein
complexes were diluted to 4 µM in 1 ml of a buffer containing 140 mM NaCl, 2.7 mM
KCl 10 mm Na2HPO4, 1.8 mM KH2PO4 (pH 7.3), 0.05% NaN3. All spectra were
corrected for buffer fluorescence. Excitation wavelength was adjusted to 295 nm to
minimize tyrosine fluorescence contribution, and emission was scanned over the range
of 305–500 nm.
4.2.10 IGF–IR autophosphorylation inhibition assay Confluent monolayers of the NIH 3T3 cells stably expressing human IGF-IR in 3.5 cm
dishes were starved in DMEM containing 0.5% dialysed fetal calf serum. After 48 h,
cells were incubated without any hormone or with 5x10⁻⁹ M IGF-I or 1x10⁻⁸ M IGF-II;
each sample was preincubated with increasing concentrations of different IGF-binding
proteins from 0 to 1x10⁻⁶ M at room temperature for 1 h. After a 10 min stimulation at
37 °C, the medium was removed and cells were lysed with 250 ml of a lysing buffer (20

Chapter 4 Materials and laboratory methods
61
mM Hepes pH 7.5, 150 mM NaCl, 10% glycerol, 1% NP-40, 1.5 mM MgCl2, 1 mM
EGTA), 10 mM sodium orthovanadate, and the protease inhibitor cocktail Complete
(Roche) for 10 min on ice. Subsequently, the cells were scraped off the plate and the
insoluble material was separated by centrifugation for 20 min at 4 °C. The protein
concentration of the supernatant was determined using the BCA kit from Pierce
according to the manufacturer’s instructions. Equal protein concentration was
incubated with the SDS sample buffer (63 mM Tris–HCl pH 6.8, 3% SDS, 10%
glycerol, 0.05% bromophenolblue, 100 mM DTT), boiled for 5 min and loaded on a
7.5% SDS–polyacrylamide gel. After electrophoresis the proteins were transferred on a
nitrocellulose membrane, which first was blocked for 1 h with the 3% BSA containing
phosphatebuffered saline–Tween (PBST), then incubated overnight with 1 mg/ml
monoclonal anti-phosphotyrosine antibody 3-365-10 (Boehringer Mannheim) in PBST
that contained 3% BSA. Unbound antibody was removed by extensive washing. The
blot was then incubated with the 1:10 000 diluted anti-mouse IgG-specific antibody
conjugated with horse radish peroxidase (Boehringer Mannheim). The immunoblot was
developed using the ECL kit from Amersham.
Chapter 5 Results
62
5 Results
This section of the thesis contains results of the work in a logical, although not always
chronological order. First, methods of IGFBP protein expression and routes to their
purification are described. The results of investigation on protein structures and folding
by means of NMR, and the subsequent constructs’ optimisation trials are then
presented. Crystals and X-ray analysis of the binary (NBP-4(3-82)/IGF-I and NBP-4(1-
92)/IGF-I) and ternary (NBP-4(3-82)/CBP-4/IGF-I) complexes are reported, followed by
the results of isothermal titration calorimetry studies. This part is followed by results of
the experiments loosely connected with the mainstream project, such as a potential
inhibitor of the IGF-I-IGFBP-5 interaction.
5.1 Cloning, expression and purification of IGFBP domains 5.1.1 Protein purification strategies The topic of the constructs design, choice of expression vectors, fusion tags and
means of their removal is covered in a detail in sections 4.2.1 and 4.2.2, pp. 43-46.
The list of the constructs generated in this work, with references to the primers used, is
enclosed in Table 5.
A starting point in the design of a purification workflow is learning about properties
of a protein of interest, such as its theoretical isoelectric point (pI), molecular mass
(MW) and extinction coefficient (E280). The information can be deduced solely on the
basis of the amino acid composition with the aid of an Internet engine, ProtParam on
www.expasy.ch for instance. Examination of already existing methods of purification of
similar or homologous proteins can yield important information. Closer examination of
the proteins’ amino acid sequence may reveal potential cleavage/degradation sites.
For example, proline often precedes basic residues at thrombin cleavage site (Mann et
al., 1982).
Table 6 contains information on the basic physicochemical properties of the
proteins produced or used in the work. The theoretical pI informs of the net charge of a
protein placed in a solvent of a given pH. Thus a proper buffer and ion-exchanger
(cation- or anion-exchanger) medium combination can be chosen. It is common, how-
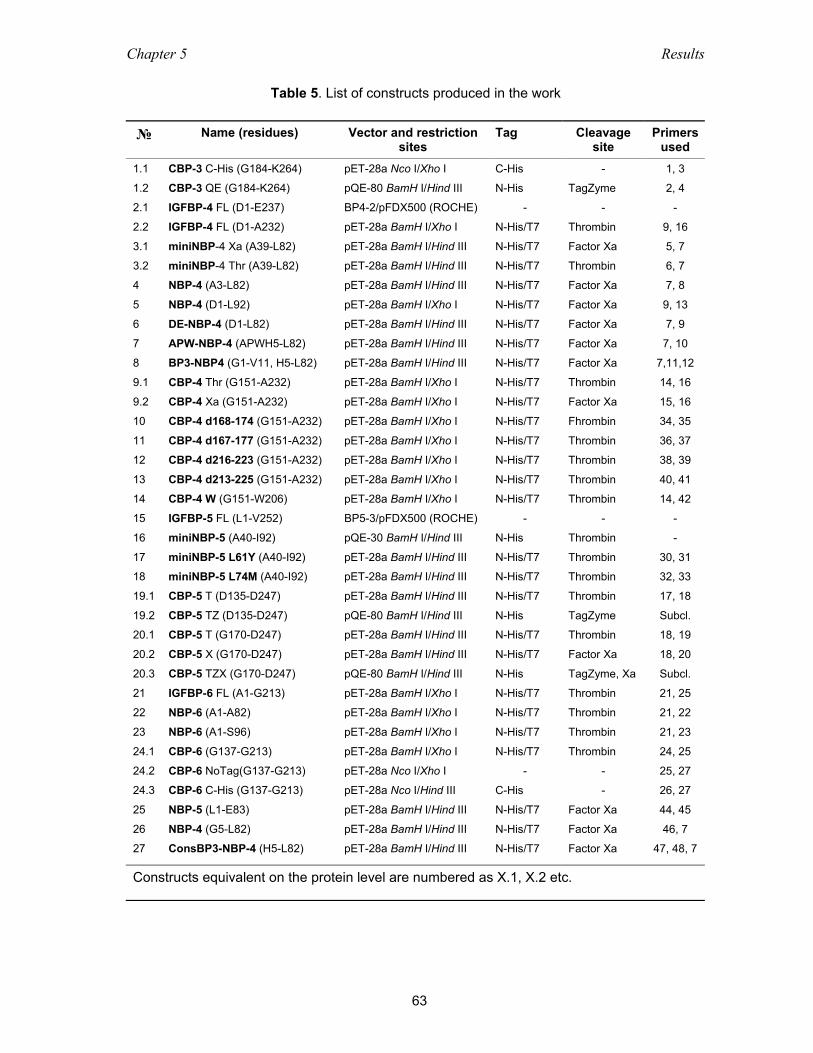
Chapter 5 Results
63
Table 5. List of constructs produced in the work
№ Name (residues) Vector and restriction sites
Tag Cleavage site
Primers used
1.1
1.2
2.1
2.2
3.1
3.2
4
5
6
7
8
9.1
9.2
10
11
12
13
14
15
16
17
18
19.1
19.2
20.1
20.2
20.3
21
22
23
24.1
24.2
24.3
25
26
27
CBP-3 C-His (G184-K264)
CBP-3 QE (G184-K264)
IGFBP-4 FL (D1-E237)
IGFBP-4 FL (D1-A232)
miniNBP-4 Xa (A39-L82)
miniNBP-4 Thr (A39-L82)
NBP-4 (A3-L82)
NBP-4 (D1-L92)
DE-NBP-4 (D1-L82)
APW-NBP-4 (APWH5-L82)
BP3-NBP4 (G1-V11, H5-L82)
CBP-4 Thr (G151-A232)
CBP-4 Xa (G151-A232)
CBP-4 d168-174 (G151-A232)
CBP-4 d167-177 (G151-A232)
CBP-4 d216-223 (G151-A232) CBP-4 d213-225 (G151-A232)
CBP-4 W (G151-W206)
IGFBP-5 FL (L1-V252)
miniNBP-5 (A40-I92)
miniNBP-5 L61Y (A40-I92)
miniNBP-5 L74M (A40-I92)
CBP-5 T (D135-D247)
CBP-5 TZ (D135-D247)
CBP-5 T (G170-D247)
CBP-5 X (G170-D247)
CBP-5 TZX (G170-D247)
IGFBP-6 FL (A1-G213)
NBP-6 (A1-A82)
NBP-6 (A1-S96)
CBP-6 (G137-G213)
CBP-6 NoTag(G137-G213)
CBP-6 C-His (G137-G213)
NBP-5 (L1-E83)
NBP-4 (G5-L82)
ConsBP3-NBP-4 (H5-L82)
pET-28a Nco I/Xho I
pQE-80 BamH I/Hind III
BP4-2/pFDX500 (ROCHE)
pET-28a BamH I/Xho I
pET-28a BamH I/Hind III
pET-28a BamH I/Hind III
pET-28a BamH I/Hind III
pET-28a BamH I/Xho I
pET-28a BamH I/Hind III
pET-28a BamH I/Hind III
pET-28a BamH I/Hind III
pET-28a BamH I/Xho I
pET-28a BamH I/Xho I
pET-28a BamH I/Xho I
pET-28a BamH I/Xho I
pET-28a BamH I/Xho I
pET-28a BamH I/Xho I
pET-28a BamH I/Xho I
BP5-3/pFDX500 (ROCHE)
pQE-30 BamH I/Hind III
pET-28a BamH I/Hind III
pET-28a BamH I/Hind III
pET-28a BamH I/Hind III
pQE-80 BamH I/Hind III
pET-28a BamH I/Hind III
pET-28a BamH I/Hind III
pQE-80 BamH I/Hind III
pET-28a BamH I/Xho I
pET-28a BamH I/Xho I
pET-28a BamH I/Xho I
pET-28a BamH I/Xho I
pET-28a Nco I/Xho I
pET-28a Nco I/Hind III
pET-28a BamH I/Hind III
pET-28a BamH I/Hind III
pET-28a BamH I/Hind III
C-His
N-His
-
N-His/T7
N-His/T7
N-His/T7
N-His/T7
N-His/T7
N-His/T7
N-His/T7
N-His/T7
N-His/T7
N-His/T7
N-His/T7
N-His/T7
N-His/T7
N-His/T7
N-His/T7
-
N-His
N-His/T7
N-His/T7
N-His/T7
N-His
N-His/T7
N-His/T7
N-His
N-His/T7
N-His/T7
N-His/T7
N-His/T7
-
C-His
N-His/T7
N-His/T7
N-His/T7
-
TagZyme
-
Thrombin
Factor Xa
Thrombin
Factor Xa
Factor Xa
Factor Xa
Factor Xa
Factor Xa
Thrombin
Factor Xa
Fhrombin
Thrombin
Thrombin
Thrombin
Thrombin
-
Thrombin
Thrombin
Thrombin
Thrombin
TagZyme
Thrombin
Factor Xa
TagZyme, Xa
Thrombin
Thrombin
Thrombin
Thrombin
-
-
Factor Xa
Factor Xa
Factor Xa
1, 3
2, 4
-
9, 16
5, 7
6, 7
7, 8
9, 13
7, 9
7, 10
7,11,12
14, 16
15, 16
34, 35
36, 37
38, 39
40, 41
14, 42
-
-
30, 31
32, 33
17, 18
Subcl.
18, 19
18, 20
Subcl.
21, 25
21, 22
21, 23
24, 25
25, 27
26, 27
44, 45
46, 7
47, 48, 7
Constructs equivalent on the protein level are numbered as X.1, X.2 etc.

Chapter 5 Results
64
ever, that a protein of an acidic pI would bind to a cation-exchanger resin at pH > pI.
This can be observed for the N-terminal domains of IGFBP-4 and –5, which can bind
MonoS medium in a buffer of pH 7.3 even though their theoretical isoelectric points are
low (6.3 and 5.28, respectively). Polar arrangement of the charged residues, resulting
in positively charged patches, can account for this phenomenon. Masses of all proteins
discussed in this work fall between fractionation ranges of the Superdex 75 resin, i.e.
3000-60 000 Da. A known extinction coefficient of a protein enables quick estimation of
the yield on the basis of the elution profile (height and area of the peak) monitored at a
given wavelength.
Table 6. Biophysical properties of the investigated proteins
№ Name MW (Da)* E280 (M-1 cm-1)** pI
-
2.1, 2.2
15
3.1, 3.2
16
4
5
6
7
8
9.1, 9.2
25
19.1, 19.2
-
-
IGF-I
IGFBP-4 (fl)
IGFBP-5 (fl)
miniNBP-4
miniNBP-5
NBP-4 (3-82)
NBP-4 (1-92)
NBP-4 (1-82)
APW-NBP-4(5-82)
BP3-NBP-4(5-82)
CBP-4
NBP-5(1-83)
CBP-5 (IEGR etension)
His/T7-Tag
PQE-HisTag
7649
25954
28555
4681
6095
8475
9803
8719
8645
9173
9096
8868
9578
4171
1872
4200
10730
15730
2800
2800
3280
3280
3280
8970
3280
7330
2000
11170
-
-
7.76
6.87
8.59
8.53
7.88
7.65
5.28
6.30
7.65
7.62
7.81
5.28
9.57
12.3
9.45
*Mol. weight is calculated for the proteins with oxidized cysteines. **E(Prot) = Numb(Tyr) x Ext(Tyr) + Numb(Trp) x Ext(Trp) + Numb(Cystine) x Ext(Cystine)
Purification of all IGFBPs constructs followed similar protocol, involving three
different liquid chromatography steps: immobilized metal affinity chromatography on
Ni-NTA, cation exchange followed by gel filtration chromatography. The major
variations of the procedure considered the shape and length of NaCl gradients at the
cation-exchange chromatography step (related to the strength of protein-column
interaction, which depends on pI) and conditions of the His- or His/T7-tag cleavage
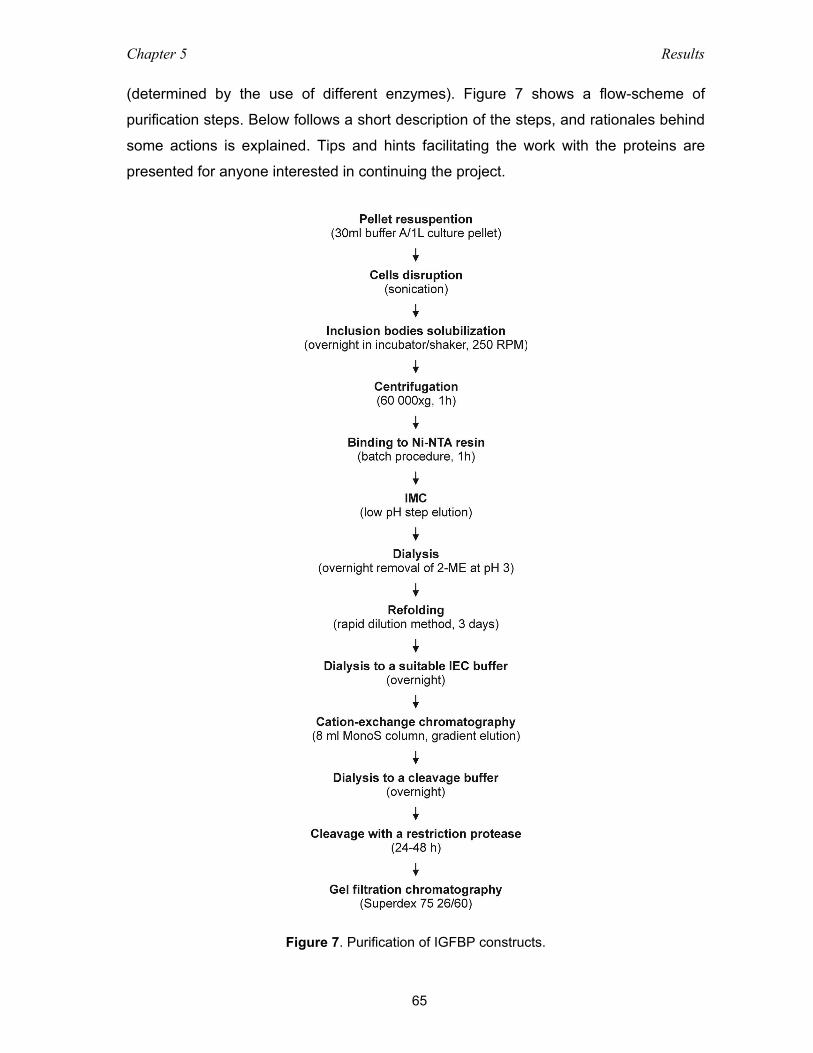
Chapter 5 Results
65
(determined by the use of different enzymes). Figure 7 shows a flow-scheme of
purification steps. Below follows a short description of the steps, and rationales behind
some actions is explained. Tips and hints facilitating the work with the proteins are
presented for anyone interested in continuing the project.
Figure 7. Purification of IGFBP constructs.
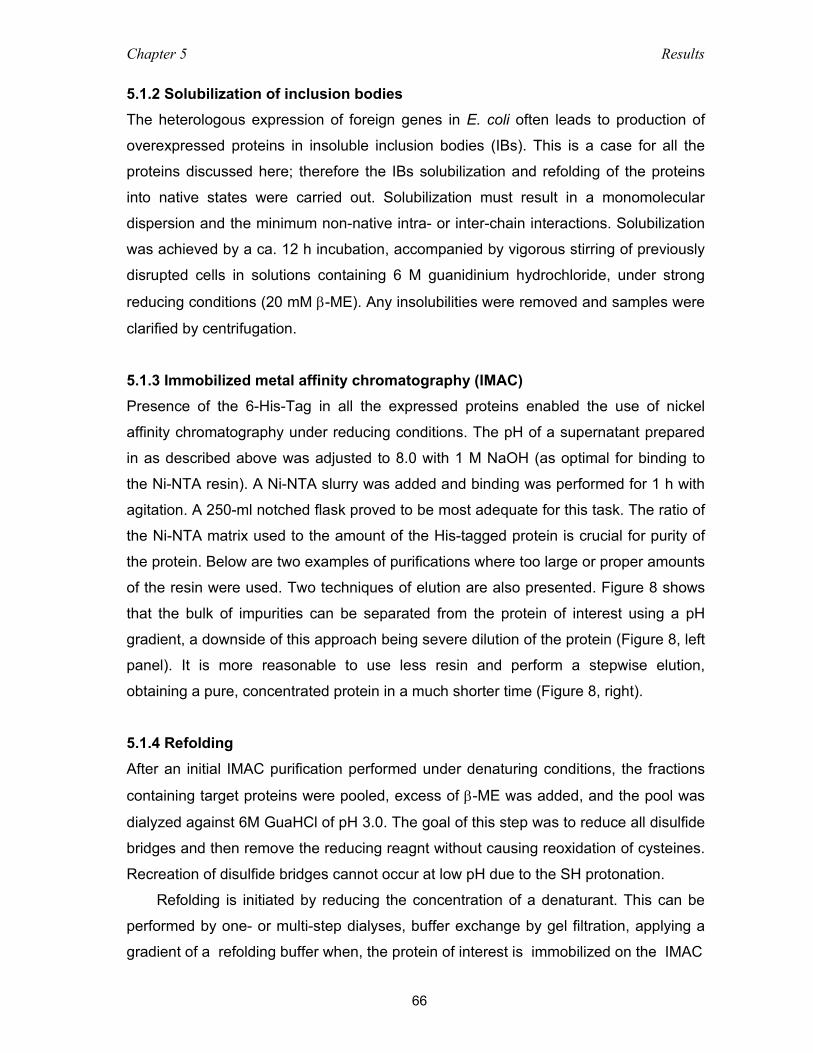
Chapter 5 Results
66
5.1.2 Solubilization of inclusion bodies The heterologous expression of foreign genes in E. coli often leads to production of
overexpressed proteins in insoluble inclusion bodies (IBs). This is a case for all the
proteins discussed here; therefore the IBs solubilization and refolding of the proteins
into native states were carried out. Solubilization must result in a monomolecular
dispersion and the minimum non-native intra- or inter-chain interactions. Solubilization
was achieved by a ca. 12 h incubation, accompanied by vigorous stirring of previously
disrupted cells in solutions containing 6 M guanidinium hydrochloride, under strong
reducing conditions (20 mM β-ME). Any insolubilities were removed and samples were
clarified by centrifugation.
5.1.3 Immobilized metal affinity chromatography (IMAC) Presence of the 6-His-Tag in all the expressed proteins enabled the use of nickel
affinity chromatography under reducing conditions. The pH of a supernatant prepared
in as described above was adjusted to 8.0 with 1 M NaOH (as optimal for binding to
the Ni-NTA resin). A Ni-NTA slurry was added and binding was performed for 1 h with
agitation. A 250-ml notched flask proved to be most adequate for this task. The ratio of
the Ni-NTA matrix used to the amount of the His-tagged protein is crucial for purity of
the protein. Below are two examples of purifications where too large or proper amounts
of the resin were used. Two techniques of elution are also presented. Figure 8 shows
that the bulk of impurities can be separated from the protein of interest using a pH
gradient, a downside of this approach being severe dilution of the protein (Figure 8, left
panel). It is more reasonable to use less resin and perform a stepwise elution,
obtaining a pure, concentrated protein in a much shorter time (Figure 8, right).
5.1.4 Refolding After an initial IMAC purification performed under denaturing conditions, the fractions
containing target proteins were pooled, excess of β-ME was added, and the pool was
dialyzed against 6M GuaHCl of pH 3.0. The goal of this step was to reduce all disulfide
bridges and then remove the reducing reagnt without causing reoxidation of cysteines.
Recreation of disulfide bridges cannot occur at low pH due to the SH protonation.
Refolding is initiated by reducing the concentration of a denaturant. This can be
performed by one- or multi-step dialyses, buffer exchange by gel filtration, applying a
gradient of a refolding buffer when, the protein of interest is immobilized on the IMAC
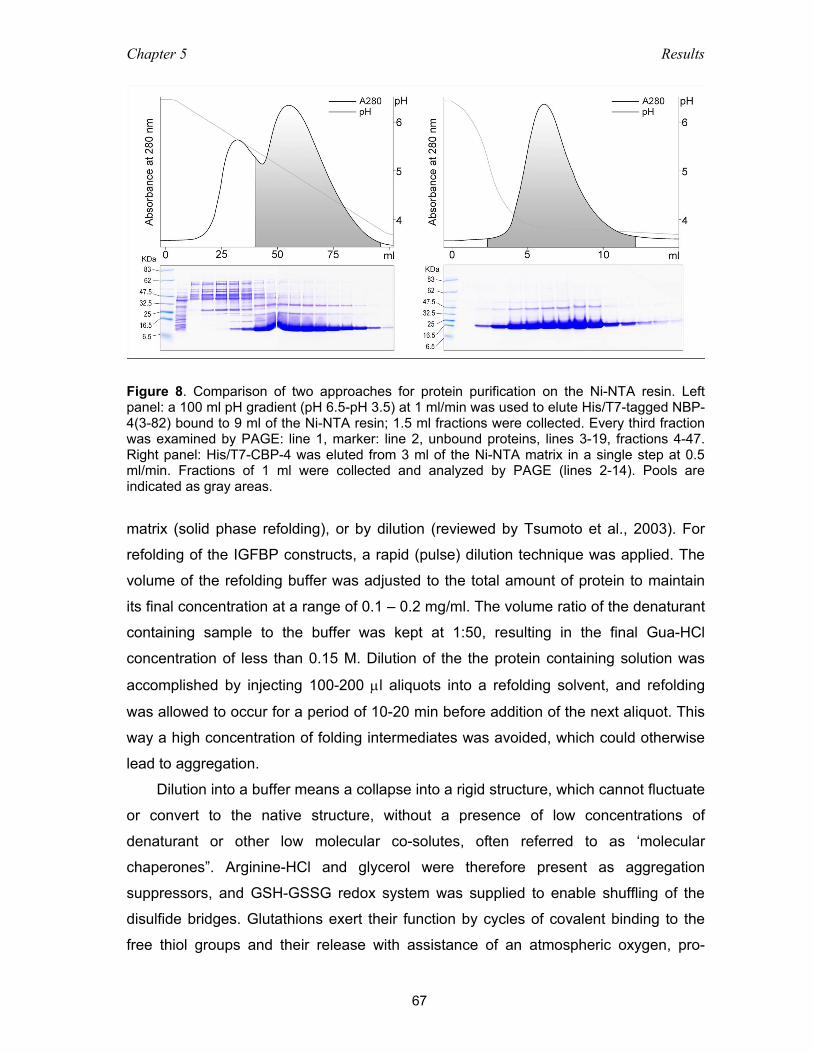
Chapter 5 Results
67
Figure 8. Comparison of two approaches for protein purification on the Ni-NTA resin. Left panel: a 100 ml pH gradient (pH 6.5-pH 3.5) at 1 ml/min was used to elute His/T7-tagged NBP-4(3-82) bound to 9 ml of the Ni-NTA resin; 1.5 ml fractions were collected. Every third fraction was examined by PAGE: line 1, marker: line 2, unbound proteins, lines 3-19, fractions 4-47. Right panel: His/T7-CBP-4 was eluted from 3 ml of the Ni-NTA matrix in a single step at 0.5 ml/min. Fractions of 1 ml were collected and analyzed by PAGE (lines 2-14). Pools are indicated as gray areas.
matrix (solid phase refolding), or by dilution (reviewed by Tsumoto et al., 2003). For
refolding of the IGFBP constructs, a rapid (pulse) dilution technique was applied. The
volume of the refolding buffer was adjusted to the total amount of protein to maintain
its final concentration at a range of 0.1 – 0.2 mg/ml. The volume ratio of the denaturant
containing sample to the buffer was kept at 1:50, resulting in the final Gua-HCl
concentration of less than 0.15 M. Dilution of the the protein containing solution was
accomplished by injecting 100-200 µl aliquots into a refolding solvent, and refolding
was allowed to occur for a period of 10-20 min before addition of the next aliquot. This
way a high concentration of folding intermediates was avoided, which could otherwise
lead to aggregation.
Dilution into a buffer means a collapse into a rigid structure, which cannot fluctuate
or convert to the native structure, without a presence of low concentrations of
denaturant or other low molecular co-solutes, often referred to as ‘molecular
chaperones”. Arginine-HCl and glycerol were therefore present as aggregation
suppressors, and GSH-GSSG redox system was supplied to enable shuffling of the
disulfide bridges. Glutathions exert their function by cycles of covalent binding to the
free thiol groups and their release with assistance of an atmospheric oxygen, pro-

Chapter 5 Results
68
ducing GSSG, H2O and Cys-Cys bridges. This disulfide shuffling mimics the action of
disulfide isomerase enzyme in vivo, preventing the structure from being prematurely
rigidified by forming disulfide linkages. Sufficient time is thus given for the protein to
collapse into a global free energy minimum state. The refolding was conducted for 3
days with vigorous steering and free access of air. The recovery of the protein of
interest varied between 70-95%. In general, the C-terminal constructs of IGFBPs were
more susceptible to aggregation than N-terminal ones.
5.1.5 Ion exchange chromatography A high-resolution chromatographic medium, MonoS, was used at a second purification
step. Monodispersive, 5-µm bed support particles and a large protein binding capacity
of the 8-ml column, ranging up to 20 mg/ml, assured excellent resolution of absorbed
proteins. Bound proteins were fractionated with a linear NaCl gradient, the length of
which was chosen individually for each construct on the basis of pilot experiments (see
Figure 9 for examples).
5.1.6 Gel filtration chromatography This final step of purification enabled separation of the proteins from digested tag
peptides, and the restriction protease used for tag cleavage. Complete exchange of
the buffer was also possible, removing any low molecular weight substances, which
could interfere with NMR measurements (such as Tris, EDTA, protease inhibitors,
glycerol etc.) The column used, a 320-ml Superdex 75 prep grade, is characterized by
good resolution in the range 3-60 kDa. To make the best of its capability, low flow rates
(0.75-1.25 ml/min) were used and samples not larger than 6 ml were loaded on the
column.
5.2 Preliminary functional and structural studies
5.2.1 Gel filtration mobility shift assay To qualitatively assess IGF-I binding activity of the purified proteins, an analytical-scale
gel filtration binding assay was carried out. The proteins were mixed in approximately
equimolar ratios and separated on an analytical 23-ml Superdex 75 column. Different

Chapter 5 Results
69
combinations of the proteins were examined to cover all possible interactions. Figure
10 summarizes the results of an assay performed for miniNBP-5, CBP-5 and IGF-I.
Figure 9. Four examples of separations of various IGFBP constructs by chromatography on a 8-ml cation exchange column. A: purification of CBP-4; bound proteins were fractionated with a 10-700 mM NaCl gradient in 17.5 column volumes (CV); B: CBP-5 purification: the protein was eluted with a 15 CV-long, 250-800 mM NaCl gradient; C: NBP-4(3-82) was eluted with a 20-800 mM NaCl gradient in 5 CV; D: NBP-4(1-92) was fractionated with a 15 CV, 10-700 mM NaCl gradient. Pooled fractions are indicated as gray areas.
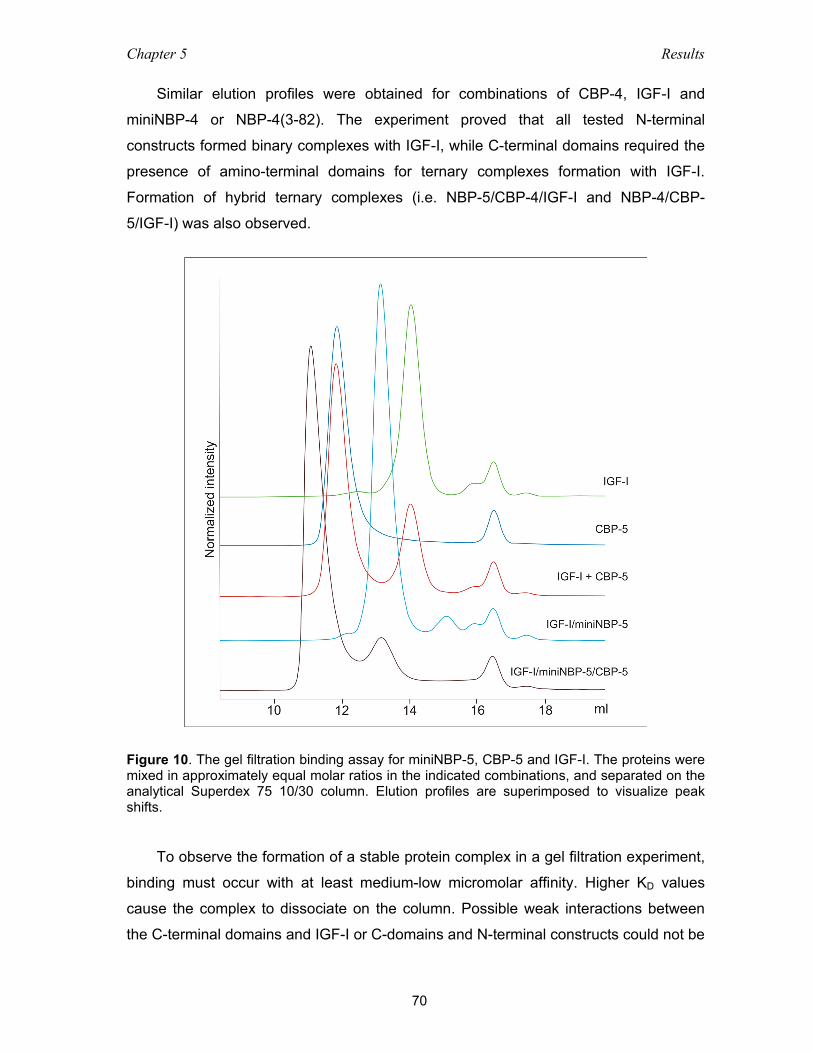
Chapter 5 Results
70
Similar elution profiles were obtained for combinations of CBP-4, IGF-I and
miniNBP-4 or NBP-4(3-82). The experiment proved that all tested N-terminal
constructs formed binary complexes with IGF-I, while C-terminal domains required the
presence of amino-terminal domains for ternary complexes formation with IGF-I.
Formation of hybrid ternary complexes (i.e. NBP-5/CBP-4/IGF-I and NBP-4/CBP-
5/IGF-I) was also observed.
Figure 10. The gel filtration binding assay for miniNBP-5, CBP-5 and IGF-I. The proteins were mixed in approximately equal molar ratios in the indicated combinations, and separated on the analytical Superdex 75 10/30 column. Elution profiles are superimposed to visualize peak shifts.
To observe the formation of a stable protein complex in a gel filtration experiment,
binding must occur with at least medium-low micromolar affinity. Higher KD values
cause the complex to dissociate on the column. Possible weak interactions between
the C-terminal domains and IGF-I or C-domains and N-terminal constructs could not be
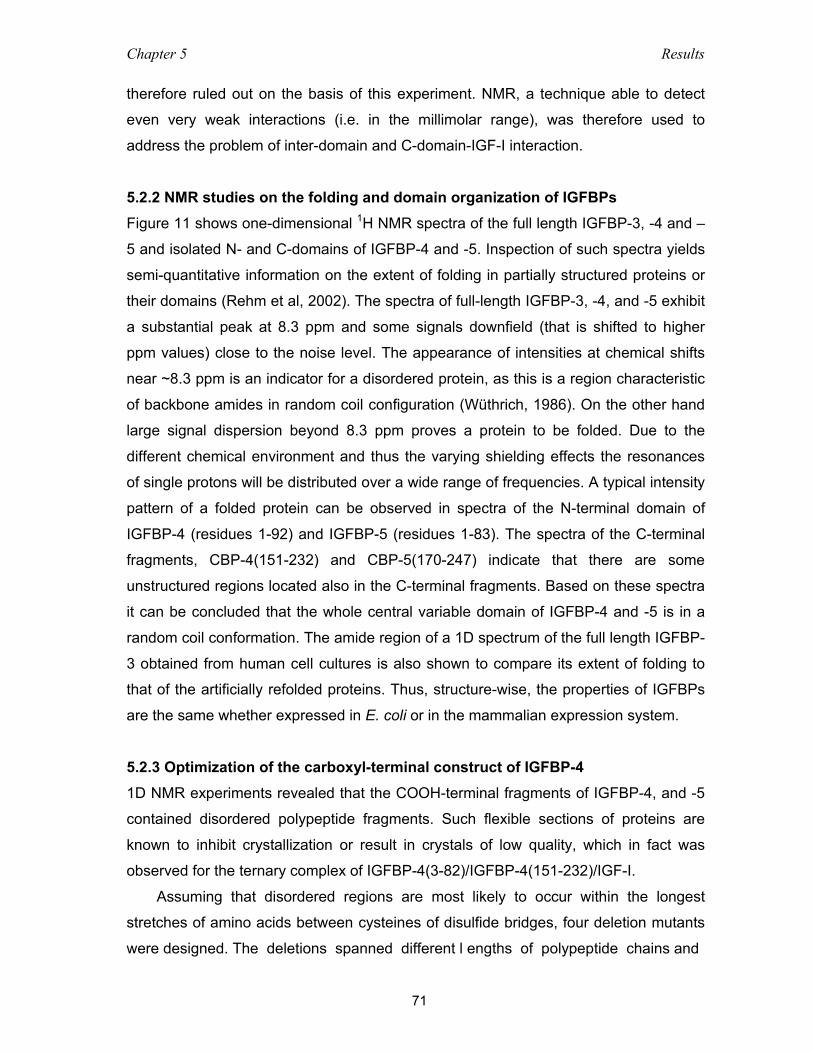
Chapter 5 Results
71
therefore ruled out on the basis of this experiment. NMR, a technique able to detect
even very weak interactions (i.e. in the millimolar range), was therefore used to
address the problem of inter-domain and C-domain-IGF-I interaction.
5.2.2 NMR studies on the folding and domain organization of IGFBPs Figure 11 shows one-dimensional 1H NMR spectra of the full length IGFBP-3, -4 and –
5 and isolated N- and C-domains of IGFBP-4 and -5. Inspection of such spectra yields
semi-quantitative information on the extent of folding in partially structured proteins or
their domains (Rehm et al, 2002). The spectra of full-length IGFBP-3, -4, and -5 exhibit
a substantial peak at 8.3 ppm and some signals downfield (that is shifted to higher
ppm values) close to the noise level. The appearance of intensities at chemical shifts
near ~8.3 ppm is an indicator for a disordered protein, as this is a region characteristic
of backbone amides in random coil configuration (Wüthrich, 1986). On the other hand
large signal dispersion beyond 8.3 ppm proves a protein to be folded. Due to the
different chemical environment and thus the varying shielding effects the resonances
of single protons will be distributed over a wide range of frequencies. A typical intensity
pattern of a folded protein can be observed in spectra of the N-terminal domain of
IGFBP-4 (residues 1-92) and IGFBP-5 (residues 1-83). The spectra of the C-terminal
fragments, CBP-4(151-232) and CBP-5(170-247) indicate that there are some
unstructured regions located also in the C-terminal fragments. Based on these spectra
it can be concluded that the whole central variable domain of IGFBP-4 and -5 is in a
random coil conformation. The amide region of a 1D spectrum of the full length IGFBP-
3 obtained from human cell cultures is also shown to compare its extent of folding to
that of the artificially refolded proteins. Thus, structure-wise, the properties of IGFBPs
are the same whether expressed in E. coli or in the mammalian expression system.
5.2.3 Optimization of the carboxyl-terminal construct of IGFBP-4 1D NMR experiments revealed that the COOH-terminal fragments of IGFBP-4, and -5
contained disordered polypeptide fragments. Such flexible sections of proteins are
known to inhibit crystallization or result in crystals of low quality, which in fact was
observed for the ternary complex of IGFBP-4(3-82)/IGFBP-4(151-232)/IGF-I.
Assuming that disordered regions are most likely to occur within the longest
stretches of amino acids between cysteines of disulfide bridges, four deletion mutants
were designed. The deletions spanned different l engths of polypeptide chains and
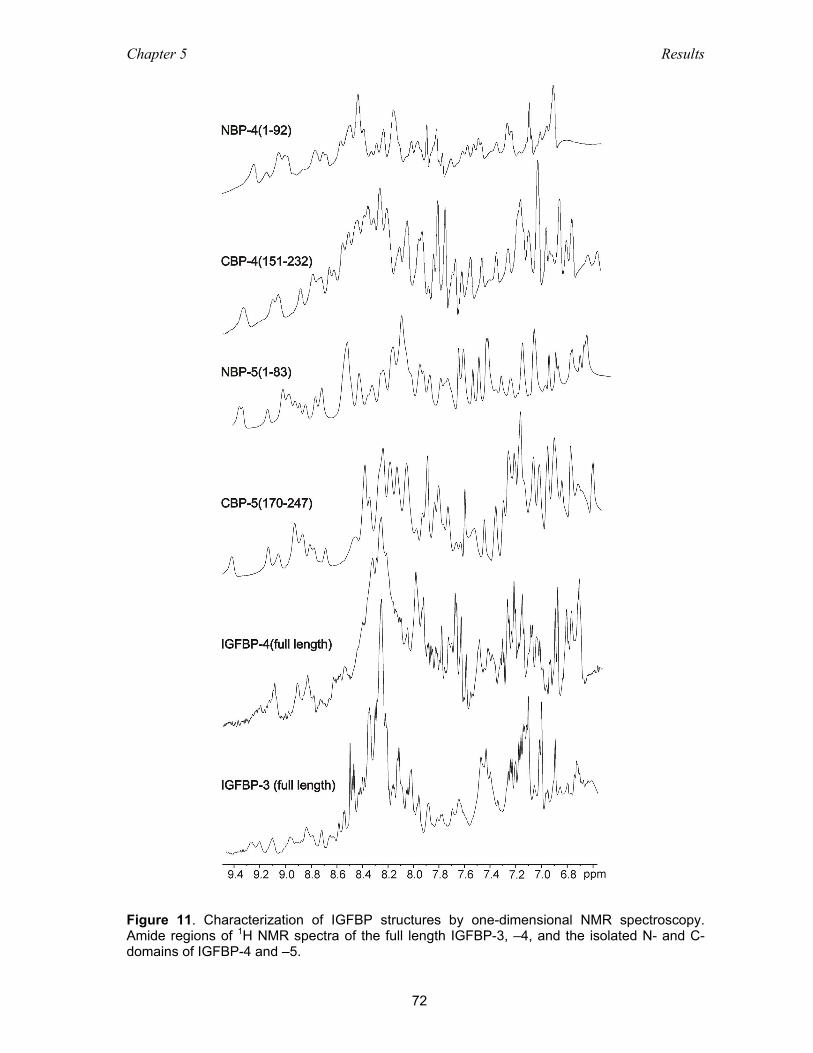
Chapter 5 Results
72
Figure 11. Characterization of IGFBP structures by one-dimensional NMR spectroscopy. Amide regions of 1H NMR spectra of the full length IGFBP-3, –4, and the isolated N- and C-domains of IGFBP-4 and –5.
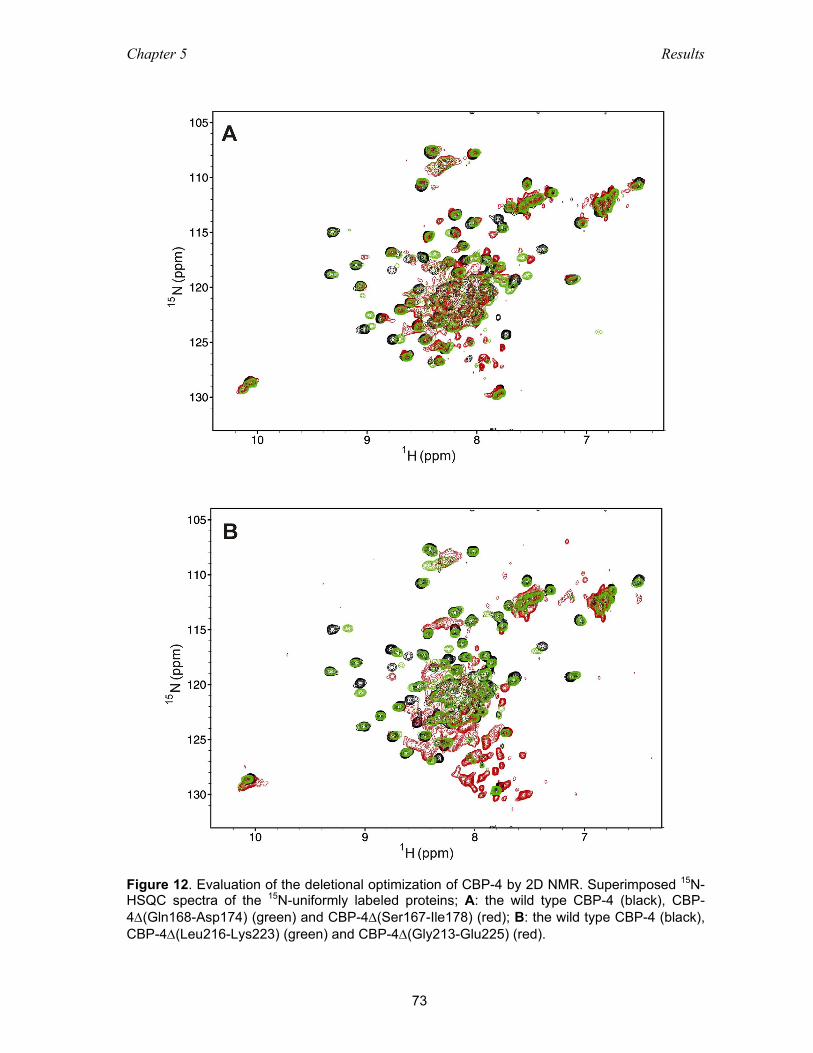
Chapter 5 Results
73
Figure 12. Evaluation of the deletional optimization of CBP-4 by 2D NMR. Superimposed 15N-HSQC spectra of the 15N-uniformly labeled proteins; A: the wild type CBP-4 (black), CBP-4∆(Gln168-Asp174) (green) and CBP-4∆(Ser167-Ile178) (red); B: the wild type CBP-4 (black), CBP-4∆(Leu216-Lys223) (green) and CBP-4∆(Gly213-Glu225) (red).
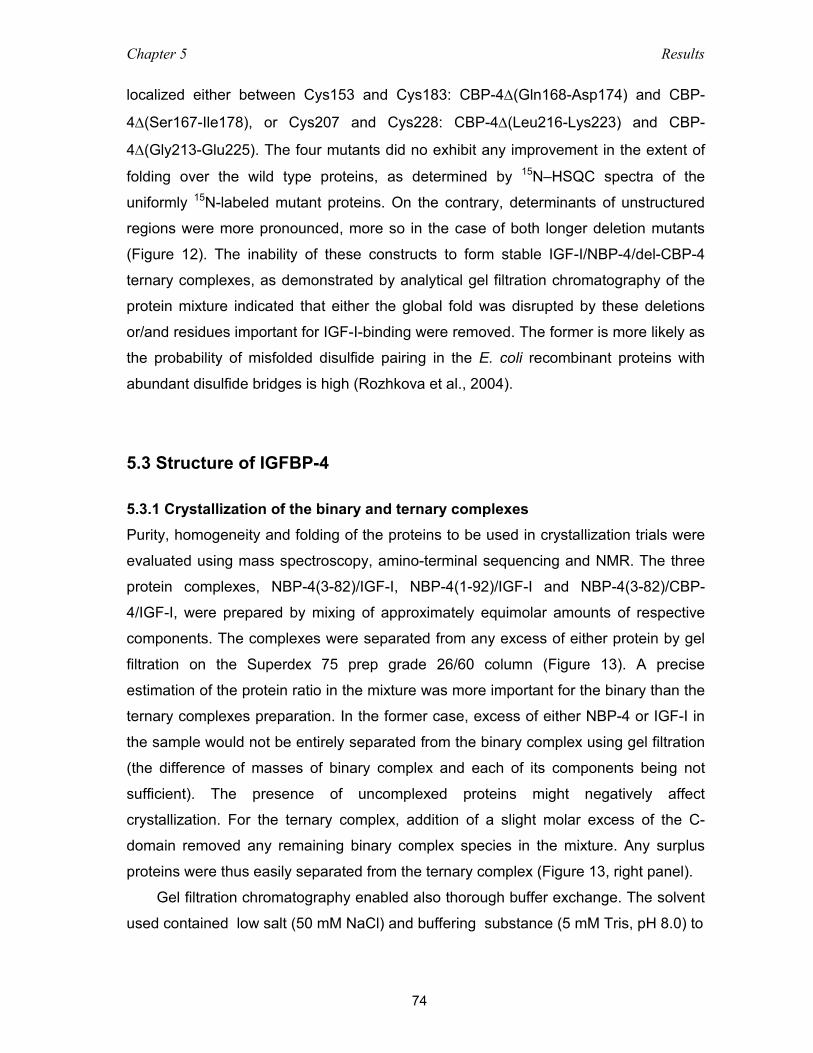
Chapter 5 Results
74
localized either between Cys153 and Cys183: CBP-4∆(Gln168-Asp174) and CBP-
4∆(Ser167-Ile178), or Cys207 and Cys228: CBP-4∆(Leu216-Lys223) and CBP-
4∆(Gly213-Glu225). The four mutants did no exhibit any improvement in the extent of
folding over the wild type proteins, as determined by 15N–HSQC spectra of the
uniformly 15N-labeled mutant proteins. On the contrary, determinants of unstructured
regions were more pronounced, more so in the case of both longer deletion mutants
(Figure 12). The inability of these constructs to form stable IGF-I/NBP-4/del-CBP-4
ternary complexes, as demonstrated by analytical gel filtration chromatography of the
protein mixture indicated that either the global fold was disrupted by these deletions
or/and residues important for IGF-I-binding were removed. The former is more likely as
the probability of misfolded disulfide pairing in the E. coli recombinant proteins with
abundant disulfide bridges is high (Rozhkova et al., 2004).
5.3 Structure of IGFBP-4 5.3.1 Crystallization of the binary and ternary complexes Purity, homogeneity and folding of the proteins to be used in crystallization trials were
evaluated using mass spectroscopy, amino-terminal sequencing and NMR. The three
protein complexes, NBP-4(3-82)/IGF-I, NBP-4(1-92)/IGF-I and NBP-4(3-82)/CBP-
4/IGF-I, were prepared by mixing of approximately equimolar amounts of respective
components. The complexes were separated from any excess of either protein by gel
filtration on the Superdex 75 prep grade 26/60 column (Figure 13). A precise
estimation of the protein ratio in the mixture was more important for the binary than the
ternary complexes preparation. In the former case, excess of either NBP-4 or IGF-I in
the sample would not be entirely separated from the binary complex using gel filtration
(the difference of masses of binary complex and each of its components being not
sufficient). The presence of uncomplexed proteins might negatively affect
crystallization. For the ternary complex, addition of a slight molar excess of the C-
domain removed any remaining binary complex species in the mixture. Any surplus
proteins were thus easily separated from the ternary complex (Figure 13, right panel).
Gel filtration chromatography enabled also thorough buffer exchange. The solvent
used contained low salt (50 mM NaCl) and buffering substance (5 mM Tris, pH 8.0) to
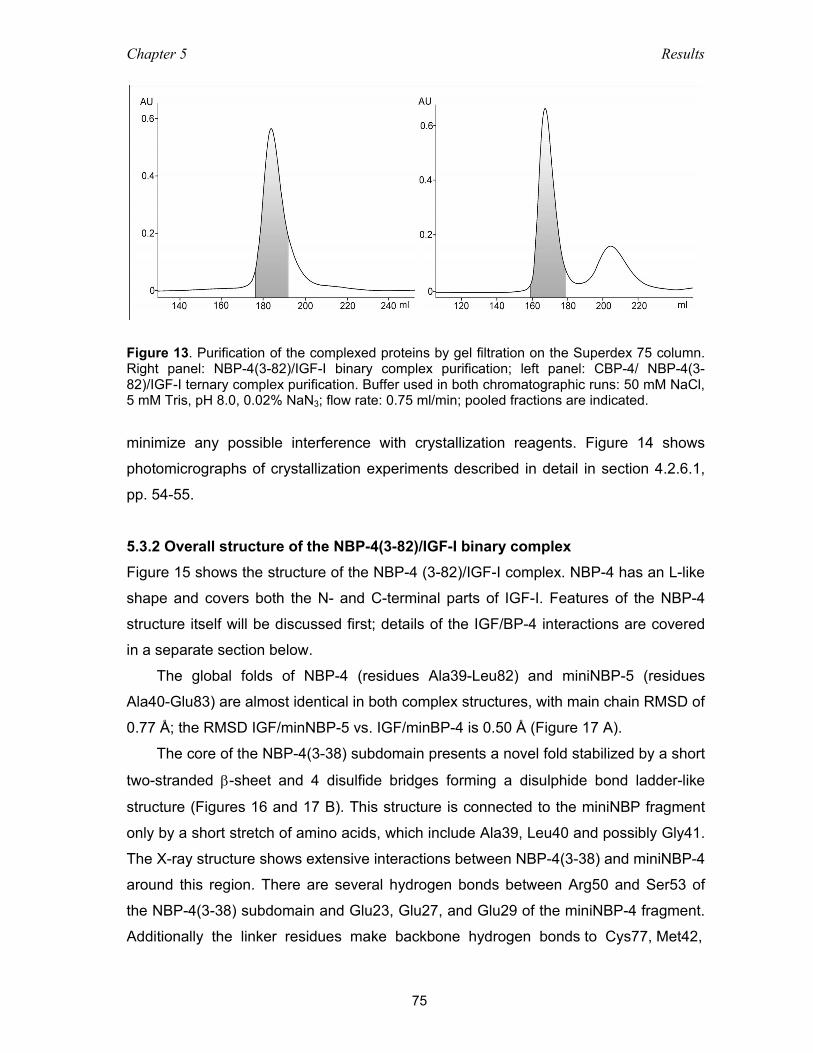
Chapter 5 Results
75
Figure 13. Purification of the complexed proteins by gel filtration on the Superdex 75 column. Right panel: NBP-4(3-82)/IGF-I binary complex purification; left panel: CBP-4/ NBP-4(3-82)/IGF-I ternary complex purification. Buffer used in both chromatographic runs: 50 mM NaCl, 5 mM Tris, pH 8.0, 0.02% NaN3; flow rate: 0.75 ml/min; pooled fractions are indicated.
minimize any possible interference with crystallization reagents. Figure 14 shows
photomicrographs of crystallization experiments described in detail in section 4.2.6.1,
pp. 54-55.
5.3.2 Overall structure of the NBP-4(3-82)/IGF-I binary complex Figure 15 shows the structure of the NBP-4 (3-82)/IGF-I complex. NBP-4 has an L-like
shape and covers both the N- and C-terminal parts of IGF-I. Features of the NBP-4
structure itself will be discussed first; details of the IGF/BP-4 interactions are covered
in a separate section below.
The global folds of NBP-4 (residues Ala39-Leu82) and miniNBP-5 (residues
Ala40-Glu83) are almost identical in both complex structures, with main chain RMSD of
0.77 Å; the RMSD IGF/minNBP-5 vs. IGF/minBP-4 is 0.50 Å (Figure 17 A).
The core of the NBP-4(3-38) subdomain presents a novel fold stabilized by a short
two-stranded β-sheet and 4 disulfide bridges forming a disulphide bond ladder-like
structure (Figures 16 and 17 B). This structure is connected to the miniNBP fragment
only by a short stretch of amino acids, which include Ala39, Leu40 and possibly Gly41.
The X-ray structure shows extensive interactions between NBP-4(3-38) and miniNBP-4
around this region. There are several hydrogen bonds between Arg50 and Ser53 of
the NBP-4(3-38) subdomain and Glu23, Glu27, and Glu29 of the miniNBP-4 fragment.
Additionally the linker residues make backbone hydrogen bonds to Cys77, Met42,
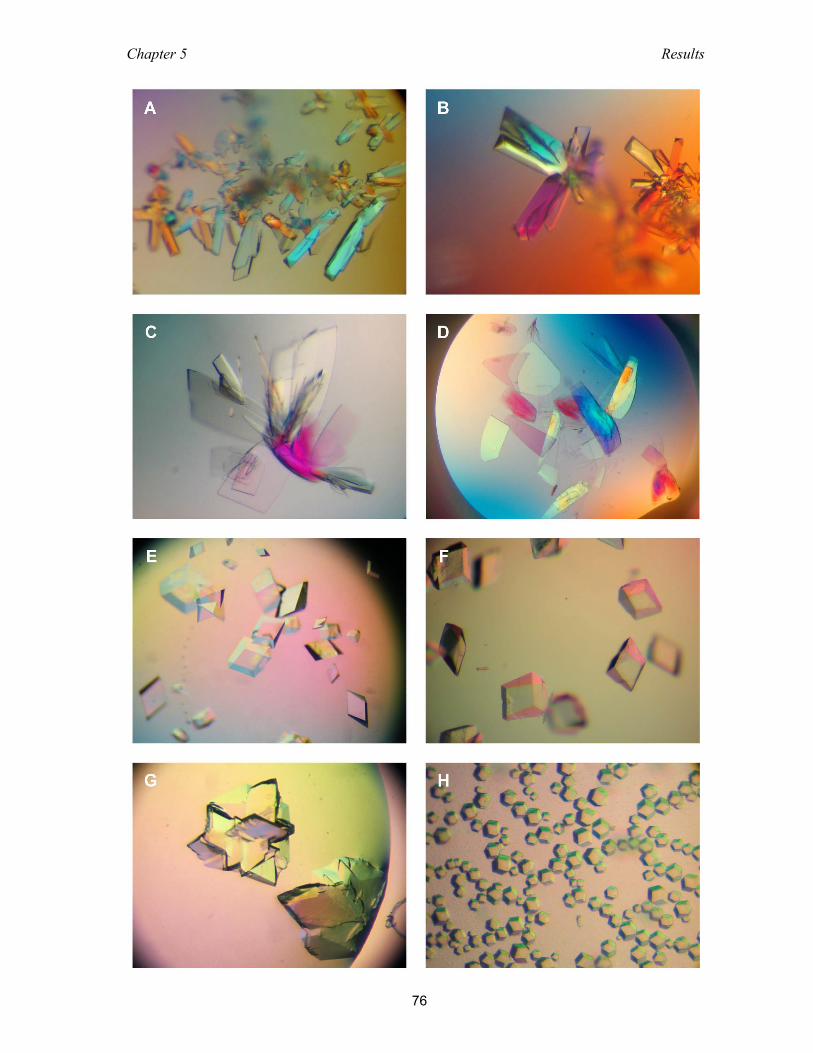
Chapter 5 Results
76
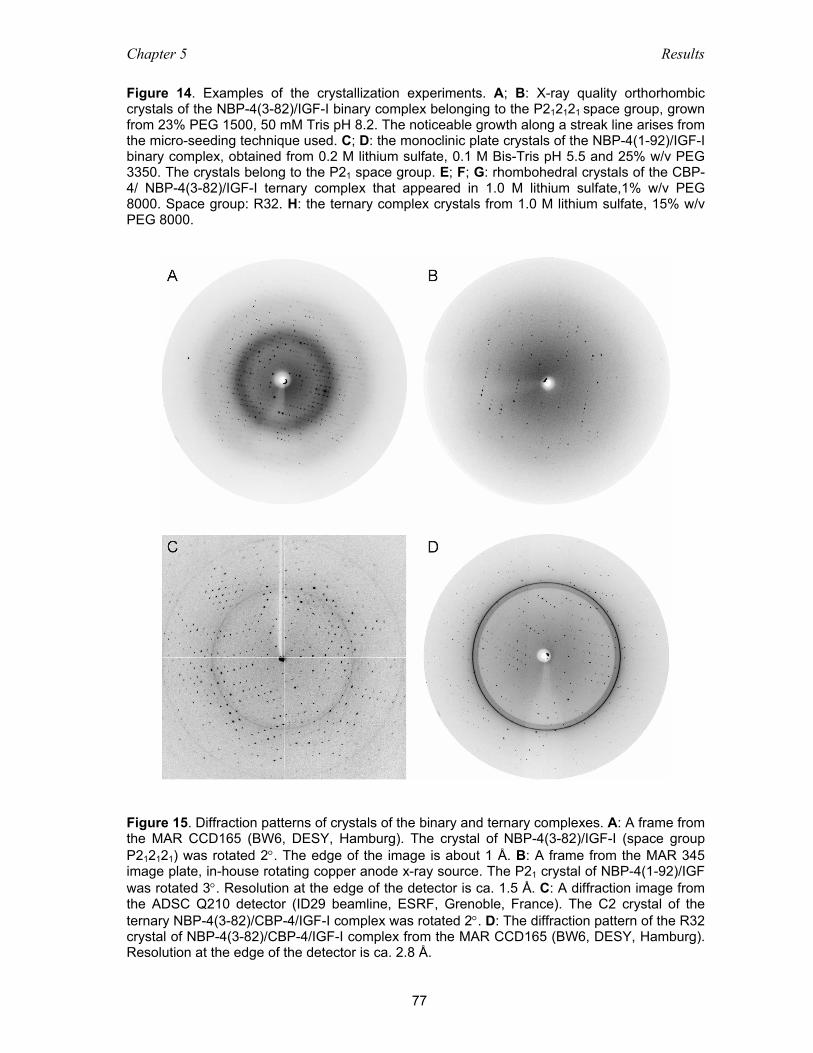
Chapter 5 Results
77
Figure 14. Examples of the crystallization experiments. A; B: X-ray quality orthorhombic crystals of the NBP-4(3-82)/IGF-I binary complex belonging to the P212121 space group, grown from 23% PEG 1500, 50 mM Tris pH 8.2. The noticeable growth along a streak line arises from the micro-seeding technique used. C; D: the monoclinic plate crystals of the NBP-4(1-92)/IGF-I binary complex, obtained from 0.2 M lithium sulfate, 0.1 M Bis-Tris pH 5.5 and 25% w/v PEG 3350. The crystals belong to the P21 space group. E; F; G: rhombohedral crystals of the CBP-4/ NBP-4(3-82)/IGF-I ternary complex that appeared in 1.0 M lithium sulfate,1% w/v PEG 8000. Space group: R32. H: the ternary complex crystals from 1.0 M lithium sulfate, 15% w/v PEG 8000.
Figure 15. Diffraction patterns of crystals of the binary and ternary complexes. A: A frame from the MAR CCD165 (BW6, DESY, Hamburg). The crystal of NBP-4(3-82)/IGF-I (space group P212121) was rotated 2°. The edge of the image is about 1 Å. B: A frame from the MAR 345 image plate, in-house rotating copper anode x-ray source. The P21 crystal of NBP-4(1-92)/IGF was rotated 3°. Resolution at the edge of the detector is ca. 1.5 Å. C: A diffraction image from the ADSC Q210 detector (ID29 beamline, ESRF, Grenoble, France). The C2 crystal of the ternary NBP-4(3-82)/CBP-4/IGF-I complex was rotated 2°. D: The diffraction pattern of the R32 crystal of NBP-4(3-82)/CBP-4/IGF-I complex from the MAR CCD165 (BW6, DESY, Hamburg). Resolution at the edge of the detector is ca. 2.8 Å.
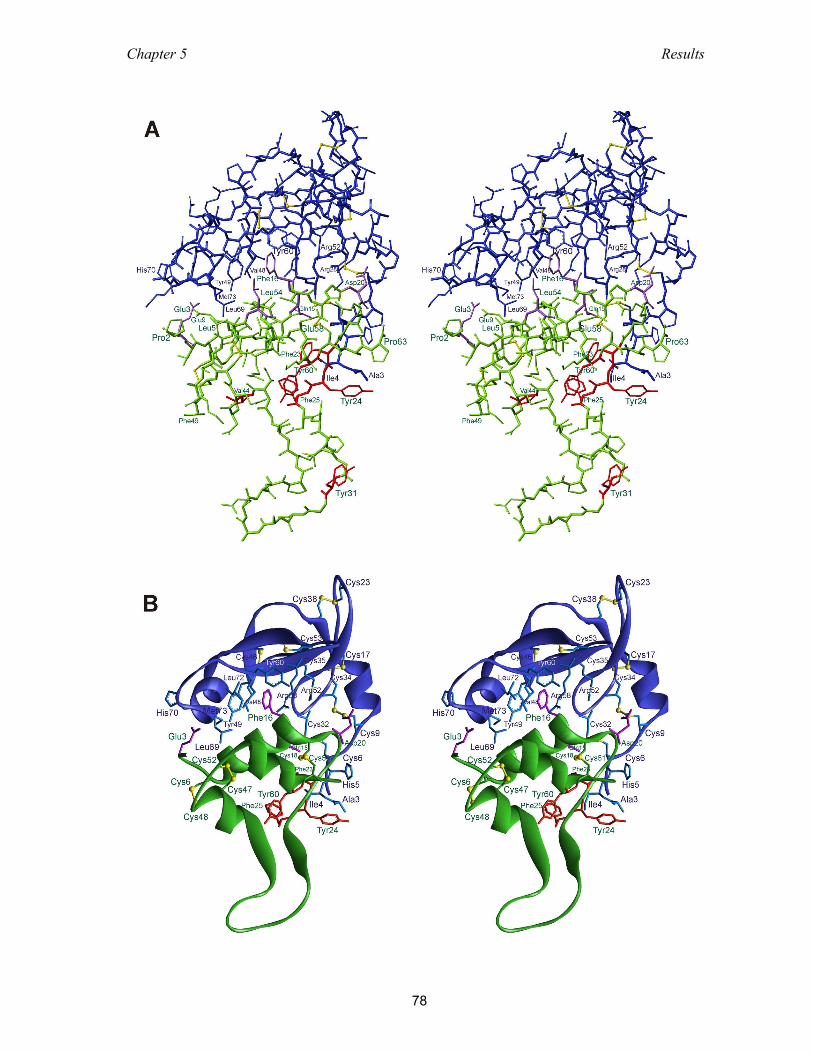
Chapter 5 Results
78
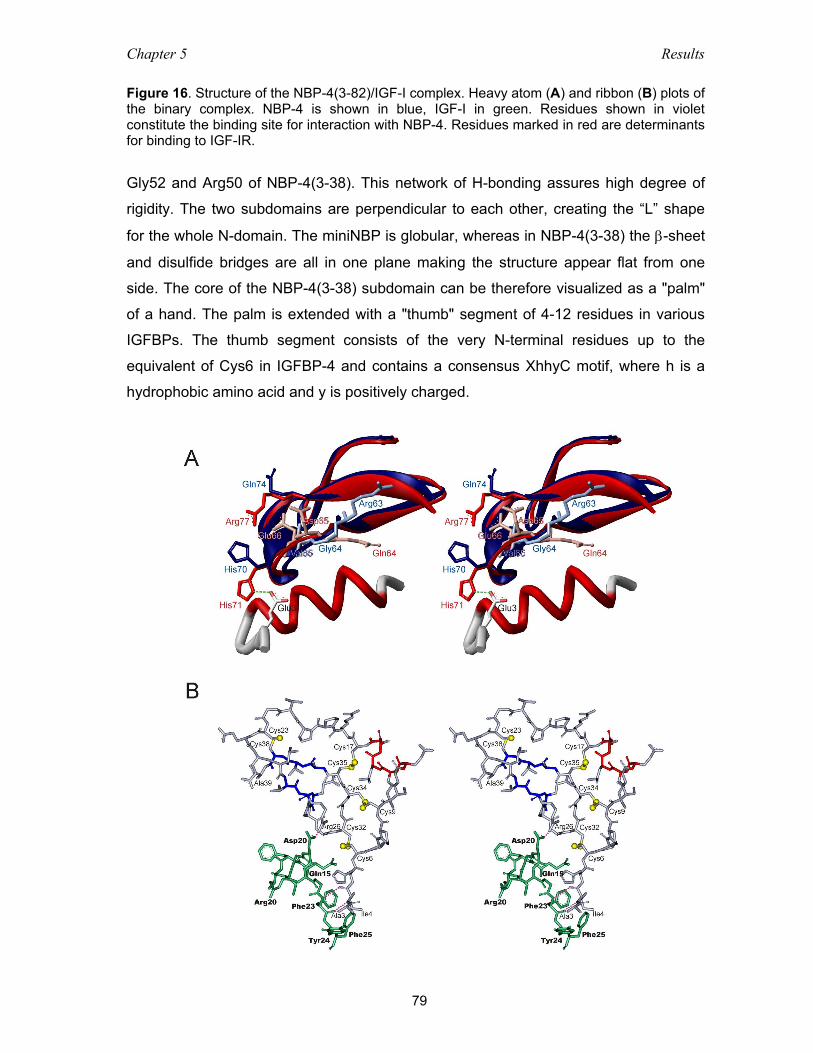
Chapter 5 Results
79
Figure 16. Structure of the NBP-4(3-82)/IGF-I complex. Heavy atom (A) and ribbon (B) plots of the binary complex. NBP-4 is shown in blue, IGF-I in green. Residues shown in violet constitute the binding site for interaction with NBP-4. Residues marked in red are determinants for binding to IGF-IR.
Gly52 and Arg50 of NBP-4(3-38). This network of H-bonding assures high degree of
rigidity. The two subdomains are perpendicular to each other, creating the “L” shape
for the whole N-domain. The miniNBP is globular, whereas in NBP-4(3-38) the β-sheet
and disulfide bridges are all in one plane making the structure appear flat from one
side. The core of the NBP-4(3-38) subdomain can be therefore visualized as a "palm"
of a hand. The palm is extended with a "thumb" segment of 4-12 residues in various
IGFBPs. The thumb segment consists of the very N-terminal residues up to the
equivalent of Cys6 in IGFBP-4 and contains a consensus XhhyC motif, where h is a
hydrophobic amino acid and y is positively charged.
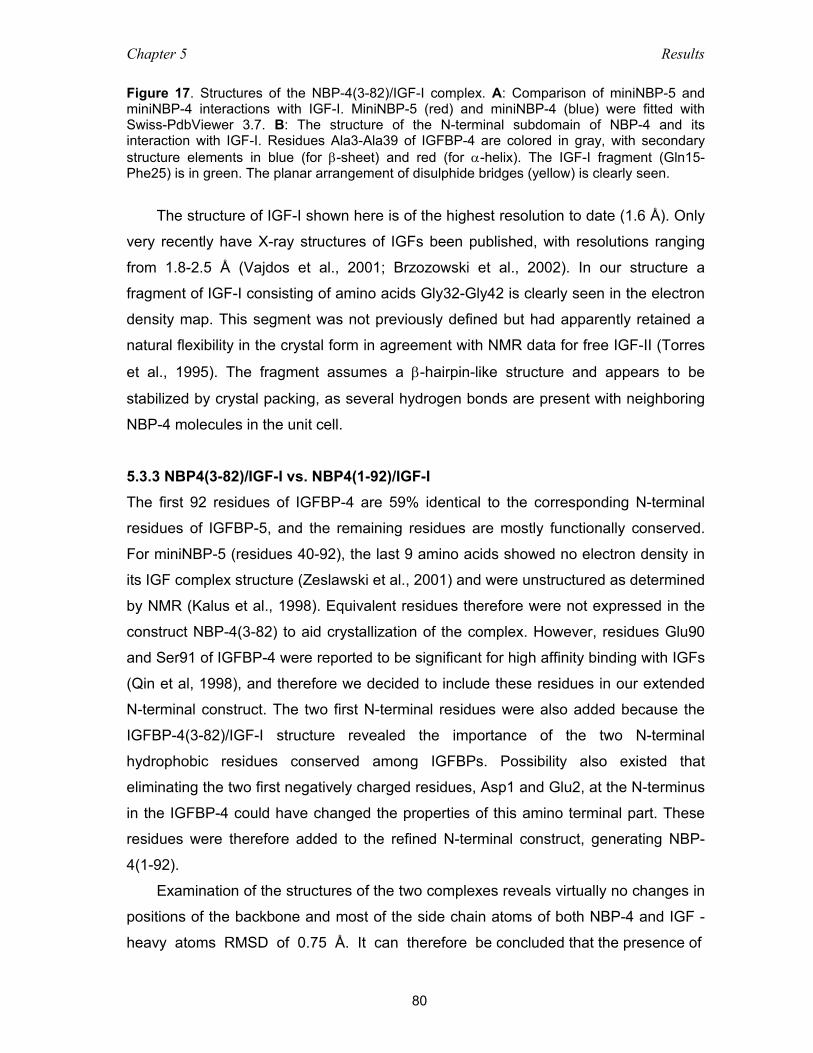
Chapter 5 Results
80
Figure 17. Structures of the NBP-4(3-82)/IGF-I complex. A: Comparison of miniNBP-5 and miniNBP-4 interactions with IGF-I. MiniNBP-5 (red) and miniNBP-4 (blue) were fitted with Swiss-PdbViewer 3.7. B: The structure of the N-terminal subdomain of NBP-4 and its interaction with IGF-I. Residues Ala3-Ala39 of IGFBP-4 are colored in gray, with secondary structure elements in blue (for β-sheet) and red (for α-helix). The IGF-I fragment (Gln15-Phe25) is in green. The planar arrangement of disulphide bridges (yellow) is clearly seen.
The structure of IGF-I shown here is of the highest resolution to date (1.6 Å). Only
very recently have X-ray structures of IGFs been published, with resolutions ranging
from 1.8-2.5 Å (Vajdos et al., 2001; Brzozowski et al., 2002). In our structure a
fragment of IGF-I consisting of amino acids Gly32-Gly42 is clearly seen in the electron
density map. This segment was not previously defined but had apparently retained a
natural flexibility in the crystal form in agreement with NMR data for free IGF-II (Torres
et al., 1995). The fragment assumes a β-hairpin-like structure and appears to be
stabilized by crystal packing, as several hydrogen bonds are present with neighboring
NBP-4 molecules in the unit cell.
5.3.3 NBP4(3-82)/IGF-I vs. NBP4(1-92)/IGF-I The first 92 residues of IGFBP-4 are 59% identical to the corresponding N-terminal
residues of IGFBP-5, and the remaining residues are mostly functionally conserved.
For miniNBP-5 (residues 40-92), the last 9 amino acids showed no electron density in
its IGF complex structure (Zeslawski et al., 2001) and were unstructured as determined
by NMR (Kalus et al., 1998). Equivalent residues therefore were not expressed in the
construct NBP-4(3-82) to aid crystallization of the complex. However, residues Glu90
and Ser91 of IGFBP-4 were reported to be significant for high affinity binding with IGFs
(Qin et al, 1998), and therefore we decided to include these residues in our extended
N-terminal construct. The two first N-terminal residues were also added because the
IGFBP-4(3-82)/IGF-I structure revealed the importance of the two N-terminal
hydrophobic residues conserved among IGFBPs. Possibility also existed that
eliminating the two first negatively charged residues, Asp1 and Glu2, at the N-terminus
in the IGFBP-4 could have changed the properties of this amino terminal part. These
residues were therefore added to the refined N-terminal construct, generating NBP-
4(1-92).
Examination of the structures of the two complexes reveals virtually no changes in
positions of the backbone and most of the side chain atoms of both NBP-4 and IGF -
heavy atoms RMSD of 0.75 Å. It can therefore be concluded that the presence of
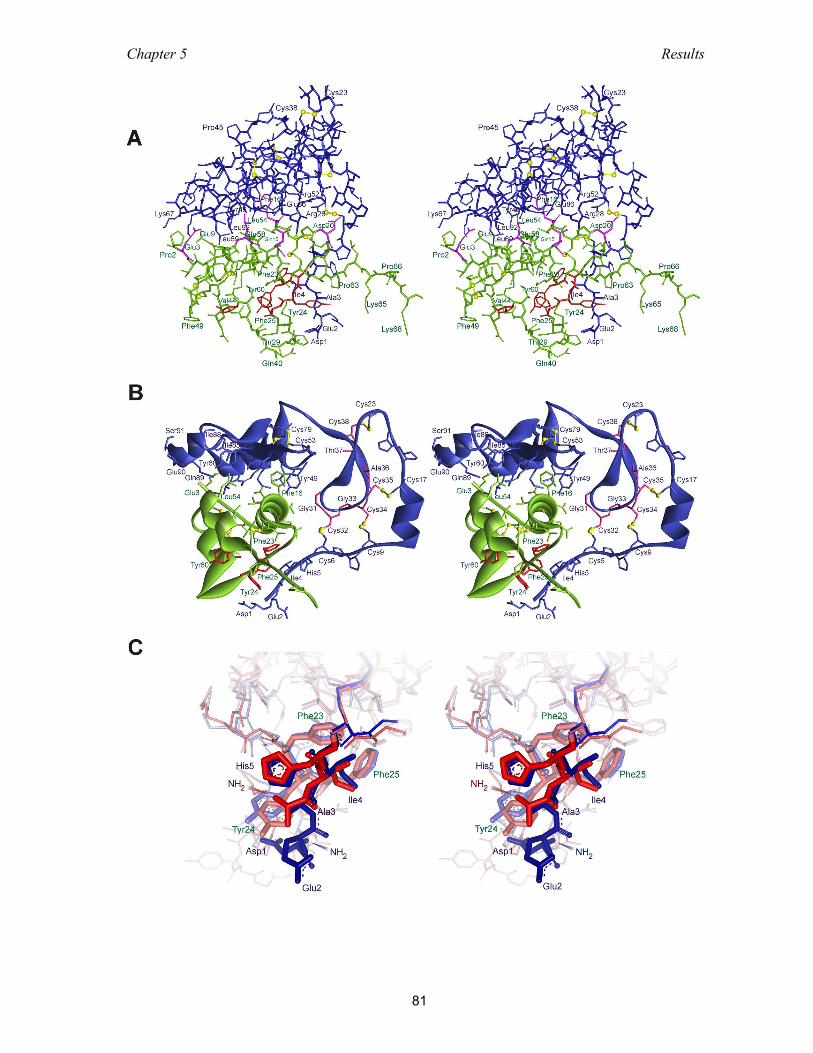
Chapter 5 Results
81
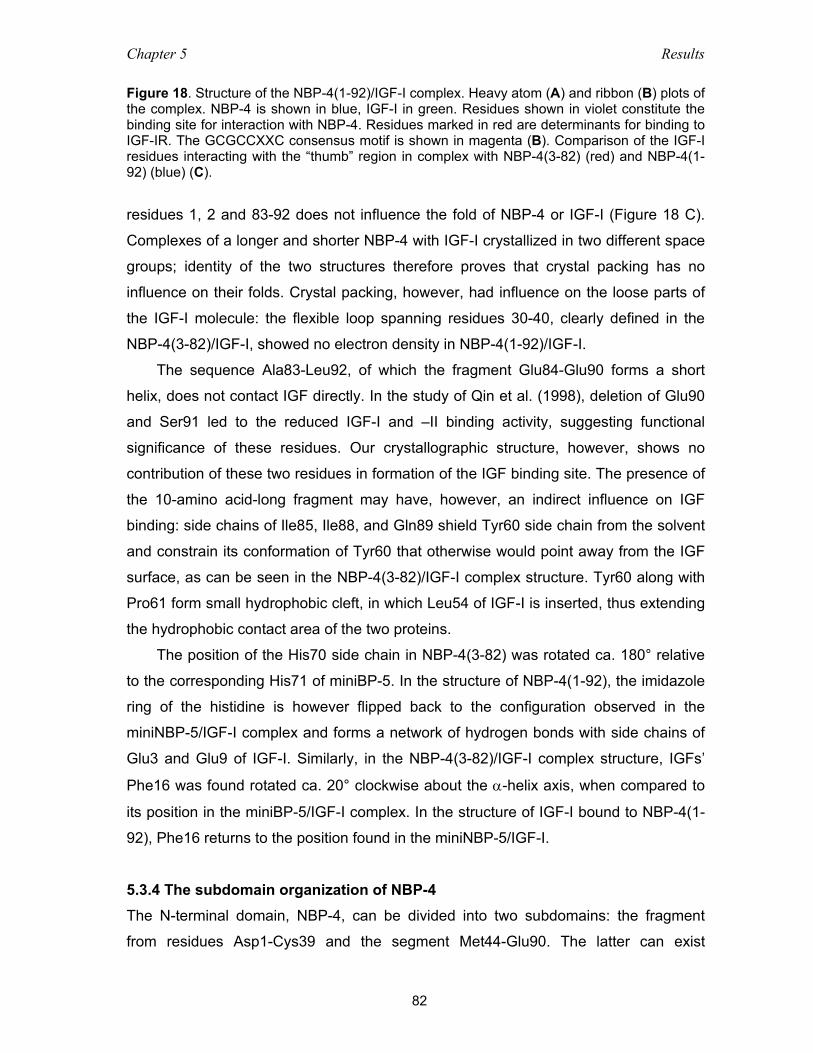
Chapter 5 Results
82
Figure 18. Structure of the NBP-4(1-92)/IGF-I complex. Heavy atom (A) and ribbon (B) plots of the complex. NBP-4 is shown in blue, IGF-I in green. Residues shown in violet constitute the binding site for interaction with NBP-4. Residues marked in red are determinants for binding to IGF-IR. The GCGCCXXC consensus motif is shown in magenta (B). Comparison of the IGF-I residues interacting with the “thumb” region in complex with NBP-4(3-82) (red) and NBP-4(1-92) (blue) (C).
residues 1, 2 and 83-92 does not influence the fold of NBP-4 or IGF-I (Figure 18 C).
Complexes of a longer and shorter NBP-4 with IGF-I crystallized in two different space
groups; identity of the two structures therefore proves that crystal packing has no
influence on their folds. Crystal packing, however, had influence on the loose parts of
the IGF-I molecule: the flexible loop spanning residues 30-40, clearly defined in the
NBP-4(3-82)/IGF-I, showed no electron density in NBP-4(1-92)/IGF-I.
The sequence Ala83-Leu92, of which the fragment Glu84-Glu90 forms a short
helix, does not contact IGF directly. In the study of Qin et al. (1998), deletion of Glu90
and Ser91 led to the reduced IGF-I and –II binding activity, suggesting functional
significance of these residues. Our crystallographic structure, however, shows no
contribution of these two residues in formation of the IGF binding site. The presence of
the 10-amino acid-long fragment may have, however, an indirect influence on IGF
binding: side chains of Ile85, Ile88, and Gln89 shield Tyr60 side chain from the solvent
and constrain its conformation of Tyr60 that otherwise would point away from the IGF
surface, as can be seen in the NBP-4(3-82)/IGF-I complex structure. Tyr60 along with
Pro61 form small hydrophobic cleft, in which Leu54 of IGF-I is inserted, thus extending
the hydrophobic contact area of the two proteins.
The position of the His70 side chain in NBP-4(3-82) was rotated ca. 180° relative
to the corresponding His71 of miniBP-5. In the structure of NBP-4(1-92), the imidazole
ring of the histidine is however flipped back to the configuration observed in the
miniNBP-5/IGF-I complex and forms a network of hydrogen bonds with side chains of
Glu3 and Glu9 of IGF-I. Similarly, in the NBP-4(3-82)/IGF-I complex structure, IGFs’
Phe16 was found rotated ca. 20° clockwise about the α-helix axis, when compared to
its position in the miniBP-5/IGF-I complex. In the structure of IGF-I bound to NBP-4(1-
92), Phe16 returns to the position found in the miniNBP-5/IGF-I.
5.3.4 The subdomain organization of NBP-4 The N-terminal domain, NBP-4, can be divided into two subdomains: the fragment
from residues Asp1-Cys39 and the segment Met44-Glu90. The latter can exist
Chapter 5 Results
83
autonomously and corresponds approximately to the mini-IGFBP-5 described by Kalus
et al. (1998). The two subdomains are connected by a short stretch rich in Gly and Leu
(i.e. Ala39, Leu40, Gly41, Leu42, and Gly43). In order to assess the flexibility of this
short stretch, a selectively labelled 15N-Gly and 15N-Leu sample of NBP-4 has been
prepared and then a 1H-15N het-NOE experiment was performed. The NOE values
obtained for these residues are shown in the Figure 19. It is seen from the figure that
only one peak is below the threshold level of the NOE intensity 0.5, indicating that the
linker is rigid. This one peak can be assigned with high probability to Gly56 present in
the loop known to be flexible from mini-NBP-5 NMR studies.
Figure 19. NOE intensity values for all glycine and leucine residues of NBP-4(3-82). The numbers have been assigned randomly.
5.3.5 Ternary complex NBP-4(3-82)/IGF-I/CBP-4(151-232) We have also obtained crystals of a ternary complex of NBP-4(3-82) and the C-
terminal domain, CBP-4(151-232), with IGF-I (Table 4). The structure of the binary
segment NBP-4(3-82)/IGF-I in this complex could be readily solved by molecular
replacement. Unfortunately, the C-domain produced electron densities in disconnected
patches that could not be interpreted in detail. Only fragments of the domain in contact
with or in proximity to NBP-4/IGF-I showed electron density sufficiently defined to allow
incorporation of fragments of a polyalanine model. Identities of individual residues
could not however be reliably established. The data allows identification of the C-
domain interface surface of IGF-I and NBP-4 (Figures 20, 21 and 30). CBP-4 appears
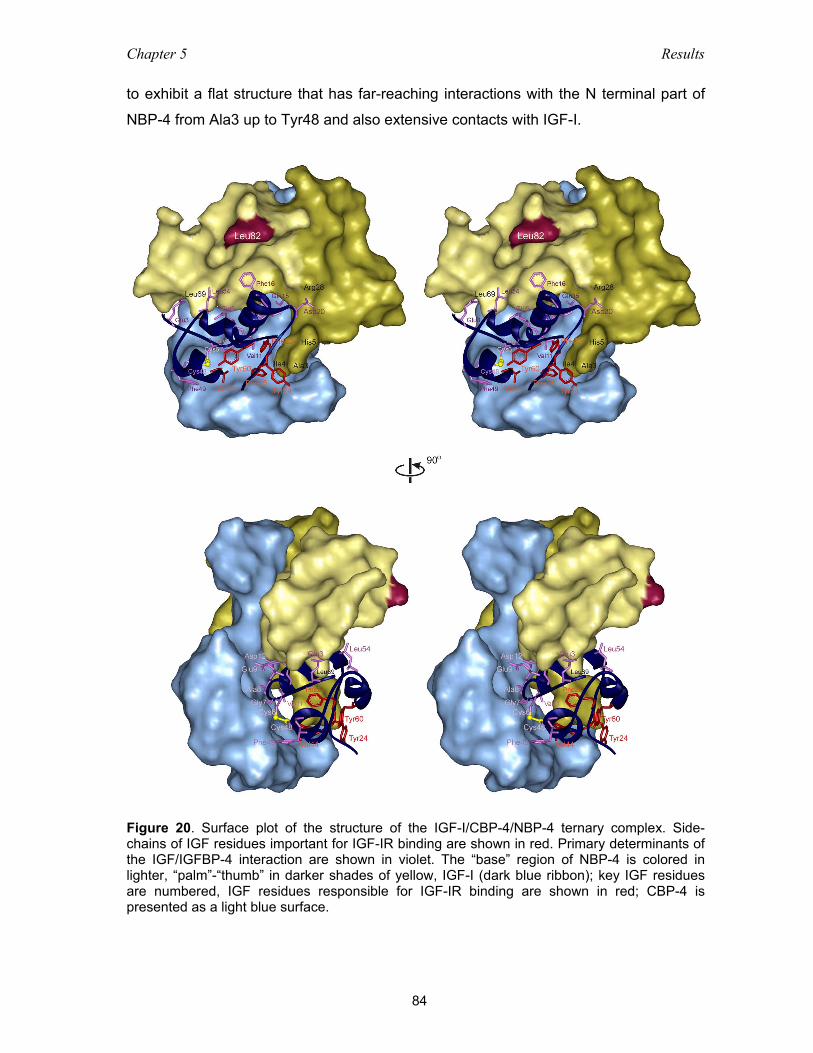
Chapter 5 Results
84
to exhibit a flat structure that has far-reaching interactions with the N terminal part of
NBP-4 from Ala3 up to Tyr48 and also extensive contacts with IGF-I.
Figure 20. Surface plot of the structure of the IGF-I/CBP-4/NBP-4 ternary complex. Side-chains of IGF residues important for IGF-IR binding are shown in red. Primary determinants of the IGF/IGFBP-4 interaction are shown in violet. The “base” region of NBP-4 is colored in lighter, “palm”-“thumb” in darker shades of yellow, IGF-I (dark blue ribbon); key IGF residues are numbered, IGF residues responsible for IGF-IR binding are shown in red; CBP-4 is presented as a light blue surface.
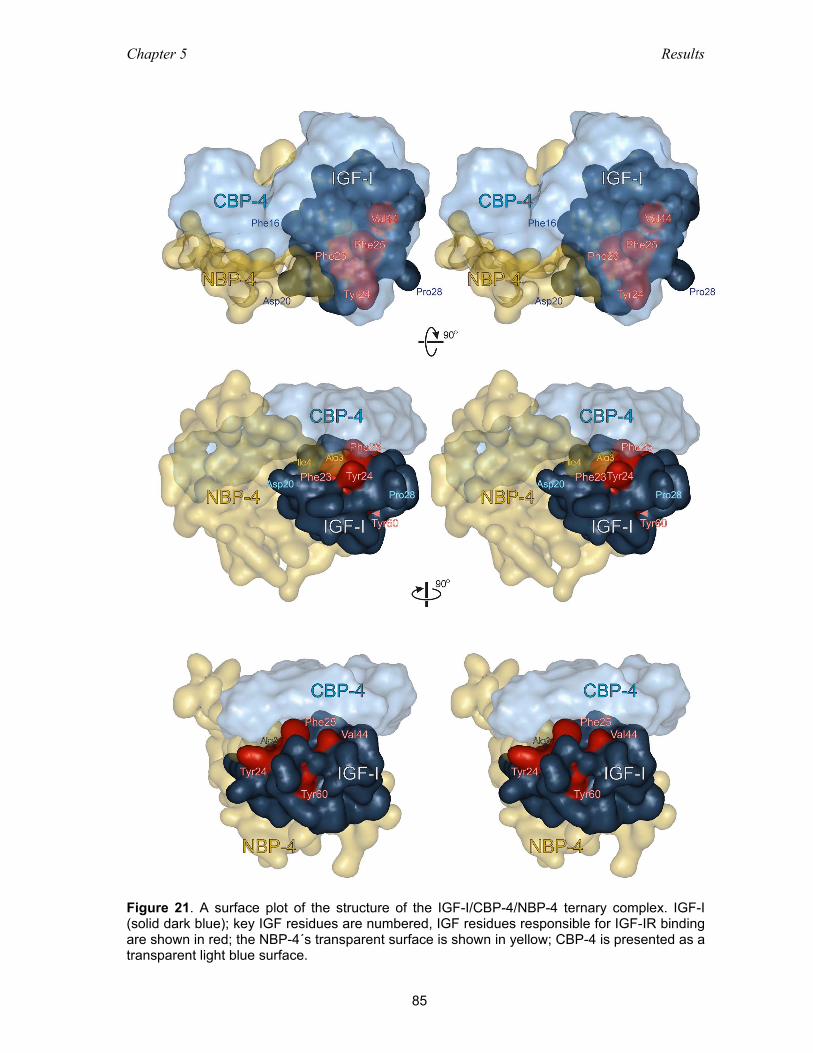
Chapter 5 Results
85
Figure 21. A surface plot of the structure of the IGF-I/CBP-4/NBP-4 ternary complex. IGF-I (solid dark blue); key IGF residues are numbered, IGF residues responsible for IGF-IR binding are shown in red; the NBP-4´s transparent surface is shown in yellow; CBP-4 is presented as a transparent light blue surface.
Chapter 5 Results
86
5.3.6 The IGF-I/NBP-4 interaction – implications for IGF-I binding to its receptor The principal interface between IGF-I and NBP-4 is located in the miniNBP subdomain
and comprises a hydrophobic sandwich that consists of interlaced protruding side
chains of IGF-I and solvent-exposed hydrophobic side chains of the NBP-4. The side
chains of IGF-I Phe16 and also Leu54 are inserted deep into a cleft present in NBP-4.
This cleft is formed by side chains of Arg52 and Arg58 on one side of the molecule and
by Val48, Leu69 and Leu72 on the opposite inner side, with a base formed by residues
Gly47, Cys59 and Tyr60. Phe16 of IGF makes direct contacts with the backbone and
side chain of Val48, and with Cys59 of NBP-4. The IGF Phe16 NBP-4 interaction is
closed on the solvent side by side chains of Glu3 and Glu9 of IGF-I, and by Tyr49,
Thr50 and Pro30 of NBP-4.
The N-terminal palm subdomain (between residues 6-38) and the thumb segment
(residues 3-5) make several additional contacts to IGF-I. The "thumb" Ala3 and Ile4 of
NBP-4 make major interactions by filling the hydrophobic patch created by IGF Phe23,
Tyr24 and Phe25. The interaction is further strengthened by hydrogen bonding (Ile4
C=O to Phe23 NH, Ile4 NH to Phe23 C=O). The palm contacts IGF only from one edge
mostly through BP-4 Arg28 (Arg28 NH1 to the IGF Asp 20 OD1).
The C-domain appears to make extensive contacts to IGF. Contact residues on
IGF are Cys6-Ala8, the sidechain of Glu9, Val11 and Asp12, Tyr24, Phe25, Asn26,
Val44, Cys48 and Phe49 (Figures 19, 20 and 30).
5.4 Functional studies of IGFBP-4 – IGF interaction 5.4.1 Binding among domains of IGFBP-4 and IGF as studied with NMR and ITC measurements ITC calorimetry indicates that NBP-4(3-82) and NBP-4(1-92) bind IGF-I with KDs of ca.
0.8 µM and 0.3 µM, respectively (Table 7; the ITC graphs can be found in the
Appendix 2). The presence of the C-terminal domain (CBP-4, residues 151-232)
increases affinities of both NBP-4s to IGF-I, resulting in a 2-6 times tighter binding.
IGF-I-binding activities of both NBP-4(3-82) and NBP-4(1-92) in the presence of CBP-4
are comparable and close to the miniNBP-5 affinity alone (without CBP-4). CBP-4
does not influence IGF-I binding activity of miniNBP-5 (see below). No direct binding
between CBP-4 and NBP-4, and CBP-4 and IGF-I could be detected.
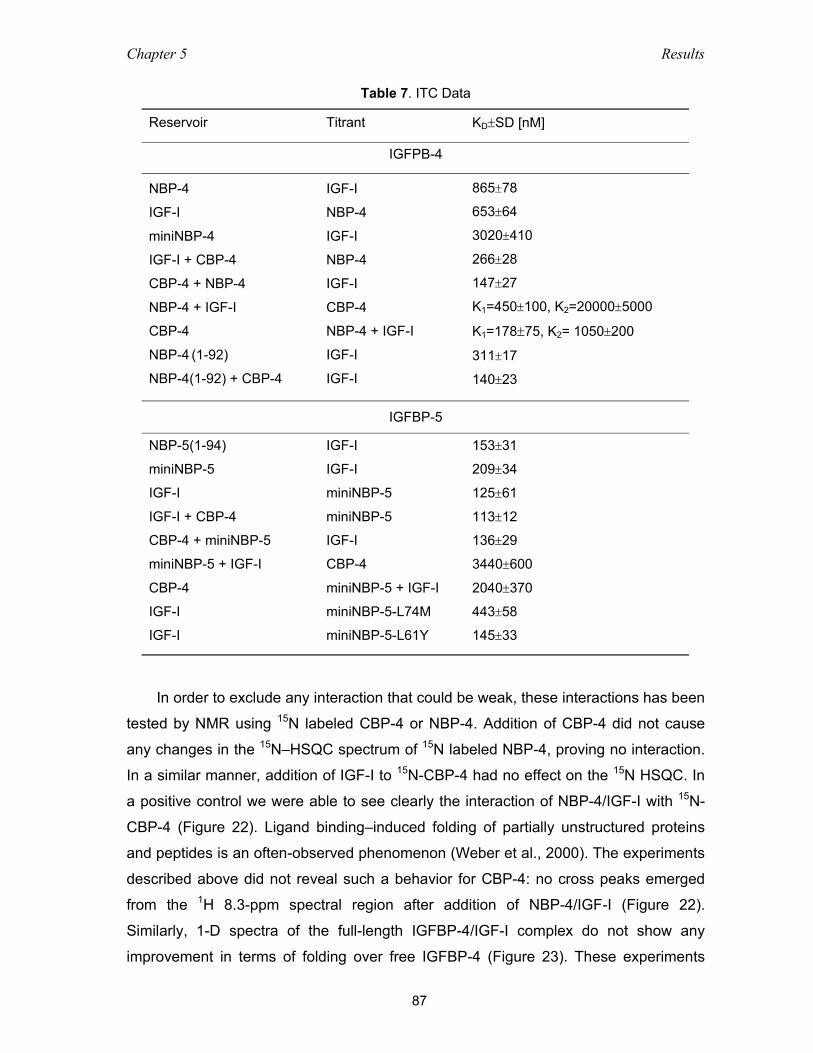
Chapter 5 Results
87
Table 7. ITC Data
Reservoir Titrant KD±SD [nM]
IGFPB-4
NBP-4
IGF-I
miniNBP-4
IGF-I + CBP-4
CBP-4 + NBP-4
NBP-4 + IGF-I
CBP-4
NBP-4 (1-92)
NBP-4(1-92) + CBP-4
IGF-I
NBP-4
IGF-I
NBP-4
IGF-I
CBP-4
NBP-4 + IGF-I
IGF-I
IGF-I
865±78
653±64
3020±410
266±28
147±27
K1=450±100, K2=20000±5000
K1=178±75, K2= 1050±200
311±17
140±23
IGFBP-5
NBP-5(1-94)
miniNBP-5
IGF-I
IGF-I + CBP-4
CBP-4 + miniNBP-5
miniNBP-5 + IGF-I
CBP-4
IGF-I
IGF-I
IGF-I
IGF-I
miniNBP-5
miniNBP-5
IGF-I
CBP-4
miniNBP-5 + IGF-I
miniNBP-5-L74M
miniNBP-5-L61Y
153±31
209±34
125±61
113±12
136±29
3440±600
2040±370
443±58
145±33
In order to exclude any interaction that could be weak, these interactions has been
tested by NMR using 15N labeled CBP-4 or NBP-4. Addition of CBP-4 did not cause
any changes in the 15N–HSQC spectrum of 15N labeled NBP-4, proving no interaction.
In a similar manner, addition of IGF-I to 15N-CBP-4 had no effect on the 15N HSQC. In
a positive control we were able to see clearly the interaction of NBP-4/IGF-I with 15N-
CBP-4 (Figure 22). Ligand binding–induced folding of partially unstructured proteins
and peptides is an often-observed phenomenon (Weber et al., 2000). The experiments
described above did not reveal such a behavior for CBP-4: no cross peaks emerged
from the 1H 8.3-ppm spectral region after addition of NBP-4/IGF-I (Figure 22).
Similarly, 1-D spectra of the full-length IGFBP-4/IGF-I complex do not show any
improvement in terms of folding over free IGFBP-4 (Figure 23). These experiments
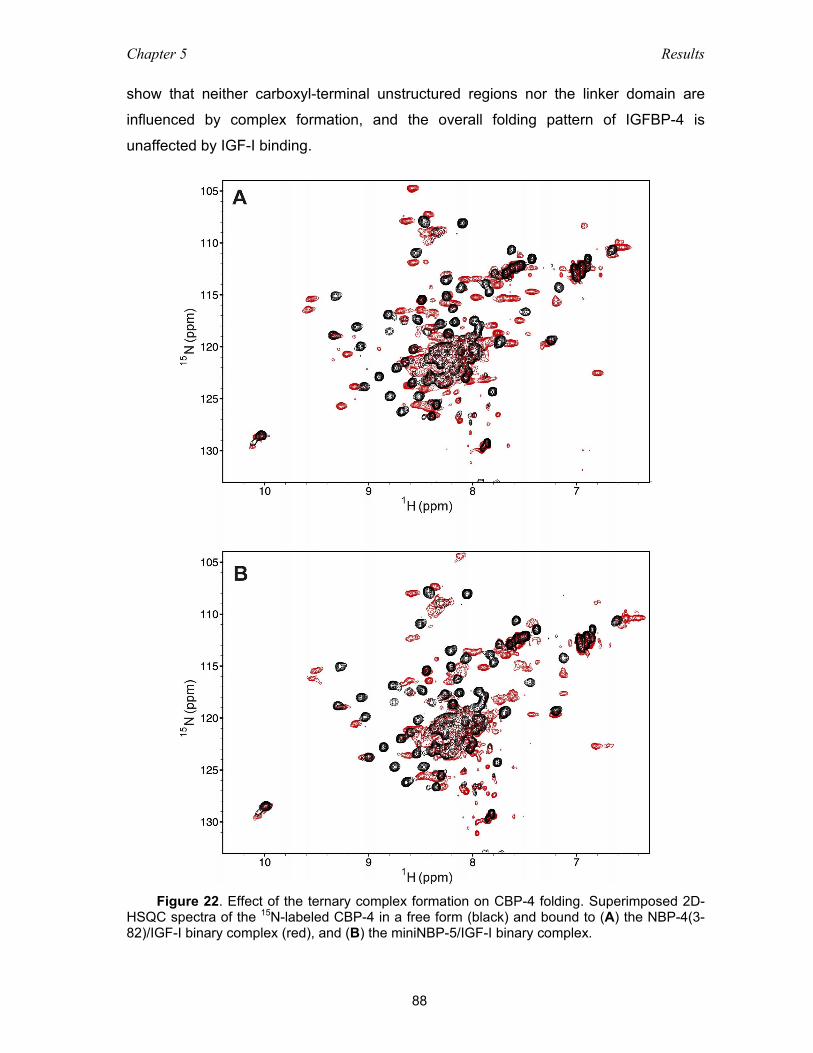
Chapter 5 Results
88
show that neither carboxyl-terminal unstructured regions nor the linker domain are
influenced by complex formation, and the overall folding pattern of IGFBP-4 is
unaffected by IGF-I binding.
Figure 22. Effect of the ternary complex formation on CBP-4 folding. Superimposed 2D-
HSQC spectra of the 15N-labeled CBP-4 in a free form (black) and bound to (A) the NBP-4(3-82)/IGF-I binary complex (red), and (B) the miniNBP-5/IGF-I binary complex.
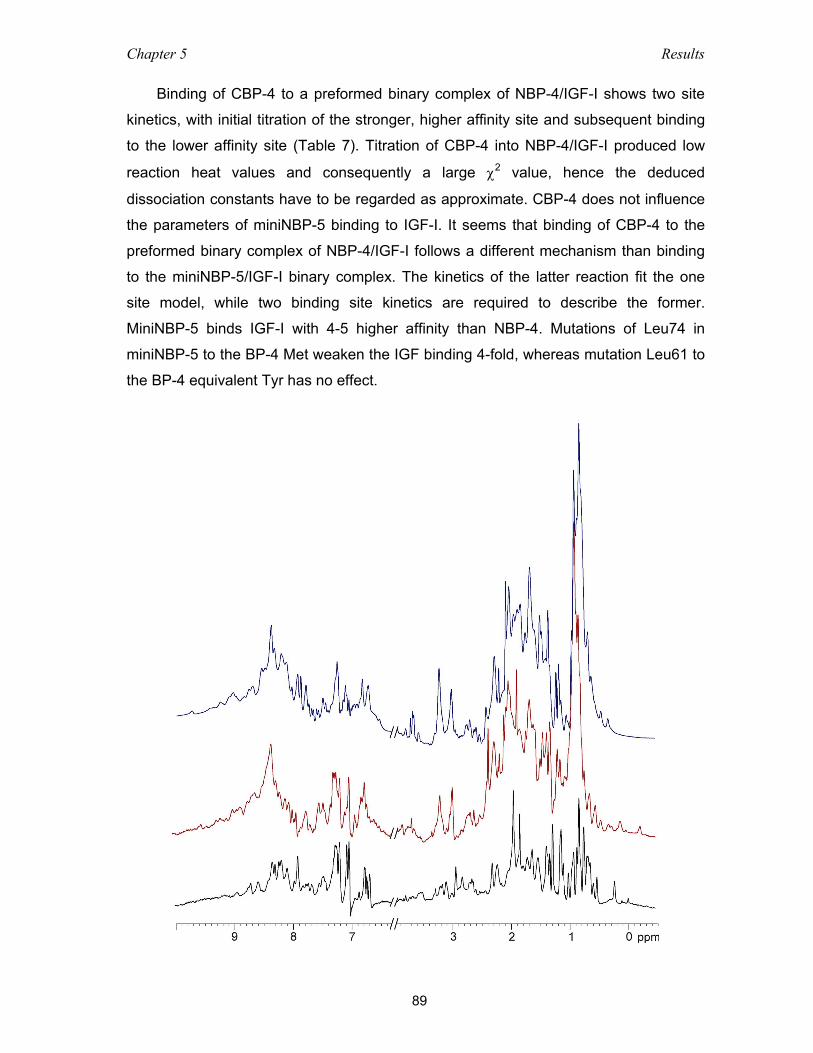
Chapter 5 Results
89
Binding of CBP-4 to a preformed binary complex of NBP-4/IGF-I shows two site
kinetics, with initial titration of the stronger, higher affinity site and subsequent binding
to the lower affinity site (Table 7). Titration of CBP-4 into NBP-4/IGF-I produced low
reaction heat values and consequently a large χ2 value, hence the deduced
dissociation constants have to be regarded as approximate. CBP-4 does not influence
the parameters of miniNBP-5 binding to IGF-I. It seems that binding of CBP-4 to the
preformed binary complex of NBP-4/IGF-I follows a different mechanism than binding
to the miniNBP-5/IGF-I binary complex. The kinetics of the latter reaction fit the one
site model, while two binding site kinetics are required to describe the former.
MiniNBP-5 binds IGF-I with 4-5 higher affinity than NBP-4. Mutations of Leu74 in
miniNBP-5 to the BP-4 Met weaken the IGF binding 4-fold, whereas mutation Leu61 to
the BP-4 equivalent Tyr has no effect.
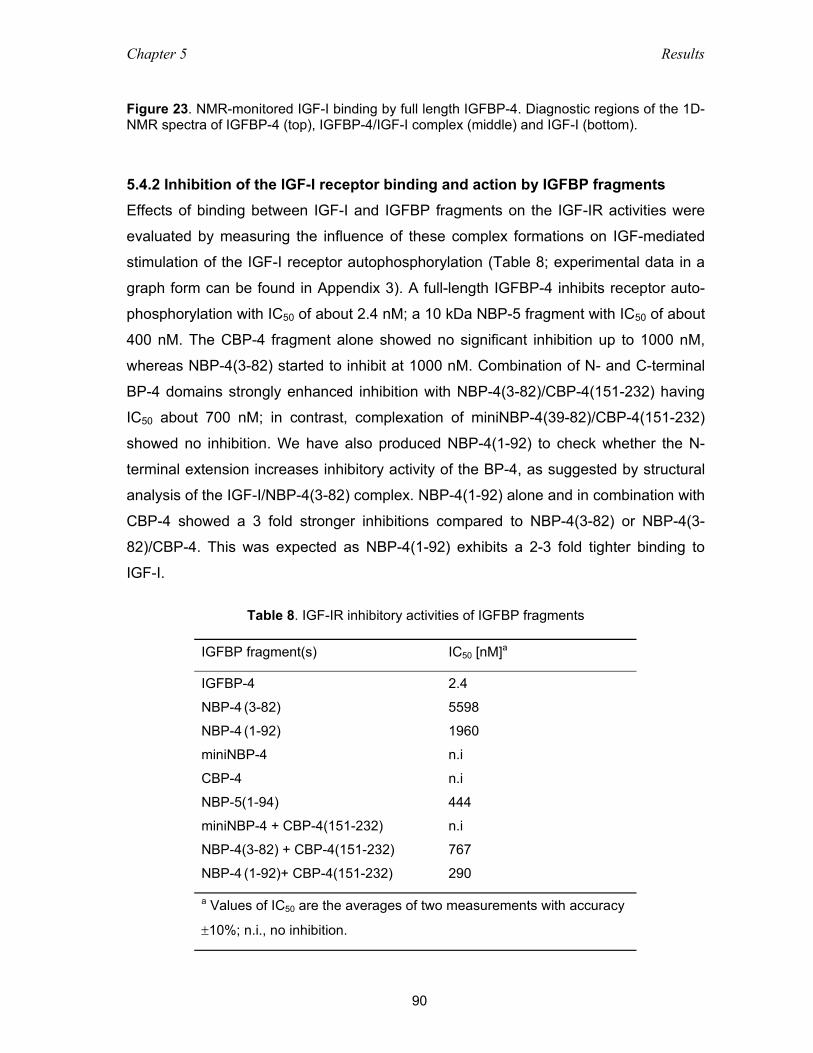
Chapter 5 Results
90
Figure 23. NMR-monitored IGF-I binding by full length IGFBP-4. Diagnostic regions of the 1D-NMR spectra of IGFBP-4 (top), IGFBP-4/IGF-I complex (middle) and IGF-I (bottom).
5.4.2 Inhibition of the IGF-I receptor binding and action by IGFBP fragments Effects of binding between IGF-I and IGFBP fragments on the IGF-IR activities were
evaluated by measuring the influence of these complex formations on IGF-mediated
stimulation of the IGF-I receptor autophosphorylation (Table 8; experimental data in a
graph form can be found in Appendix 3). A full-length IGFBP-4 inhibits receptor auto-
phosphorylation with IC50 of about 2.4 nM; a 10 kDa NBP-5 fragment with IC50 of about
400 nM. The CBP-4 fragment alone showed no significant inhibition up to 1000 nM,
whereas NBP-4(3-82) started to inhibit at 1000 nM. Combination of N- and C-terminal
BP-4 domains strongly enhanced inhibition with NBP-4(3-82)/CBP-4(151-232) having
IC50 about 700 nM; in contrast, complexation of miniNBP-4(39-82)/CBP-4(151-232)
showed no inhibition. We have also produced NBP-4(1-92) to check whether the N-
terminal extension increases inhibitory activity of the BP-4, as suggested by structural
analysis of the IGF-I/NBP-4(3-82) complex. NBP-4(1-92) alone and in combination with
CBP-4 showed a 3 fold stronger inhibitions compared to NBP-4(3-82) or NBP-4(3-
82)/CBP-4. This was expected as NBP-4(1-92) exhibits a 2-3 fold tighter binding to
IGF-I.
Table 8. IGF-IR inhibitory activities of IGFBP fragments
IGFBP fragment(s) IC50 [nM]a
IGFBP-4
NBP-4 (3-82)
NBP-4 (1-92)
miniNBP-4
CBP-4
NBP-5(1-94)
miniNBP-4 + CBP-4(151-232)
NBP-4(3-82) + CBP-4(151-232)
NBP-4 (1-92)+ CBP-4(151-232)
2.4
5598
1960
n.i
n.i
444
n.i
767
290
a Values of IC50 are the averages of two measurements with accuracy
±10%; n.i., no inhibition.
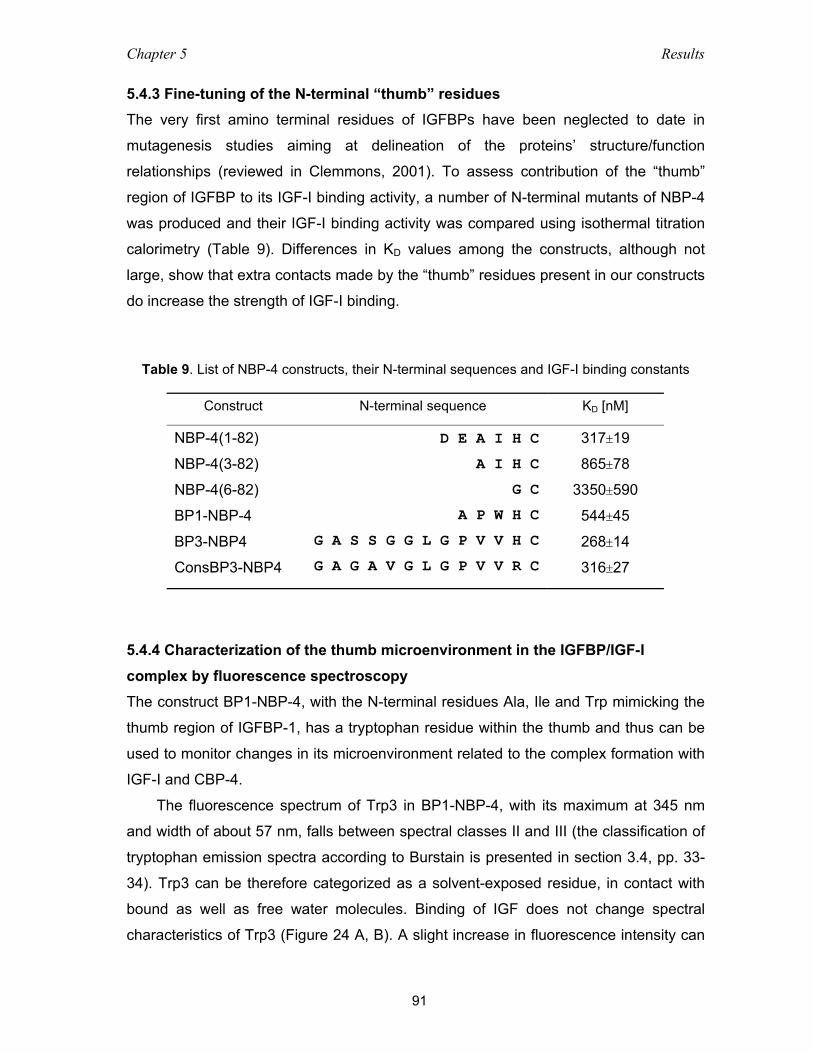
Chapter 5 Results
91
5.4.3 Fine-tuning of the N-terminal “thumb” residues The very first amino terminal residues of IGFBPs have been neglected to date in
mutagenesis studies aiming at delineation of the proteins’ structure/function
relationships (reviewed in Clemmons, 2001). To assess contribution of the “thumb”
region of IGFBP to its IGF-I binding activity, a number of N-terminal mutants of NBP-4
was produced and their IGF-I binding activity was compared using isothermal titration
calorimetry (Table 9). Differences in KD values among the constructs, although not
large, show that extra contacts made by the “thumb” residues present in our constructs
do increase the strength of IGF-I binding.
Table 9. List of NBP-4 constructs, their N-terminal sequences and IGF-I binding constants
Construct N-terminal sequence KD [nM]
NBP-4(1-82)
NBP-4(3-82)
NBP-4(6-82)
BP1-NBP-4
BP3-NBP4
ConsBP3-NBP4
D E A I H C
A I H C
G C
A P W H C
G A S S G G L G P V V H C
G A G A V G L G P V V R C
317±19
865±78
3350±590
544±45
268±14
316±27
5.4.4 Characterization of the thumb microenvironment in the IGFBP/IGF-I complex by fluorescence spectroscopy The construct BP1-NBP-4, with the N-terminal residues Ala, Ile and Trp mimicking the
thumb region of IGFBP-1, has a tryptophan residue within the thumb and thus can be
used to monitor changes in its microenvironment related to the complex formation with
IGF-I and CBP-4.
The fluorescence spectrum of Trp3 in BP1-NBP-4, with its maximum at 345 nm
and width of about 57 nm, falls between spectral classes II and III (the classification of
tryptophan emission spectra according to Burstain is presented in section 3.4, pp. 33-
34). Trp3 can be therefore categorized as a solvent-exposed residue, in contact with
bound as well as free water molecules. Binding of IGF does not change spectral
characteristics of Trp3 (Figure 24 A, B). A slight increase in fluorescence intensity can
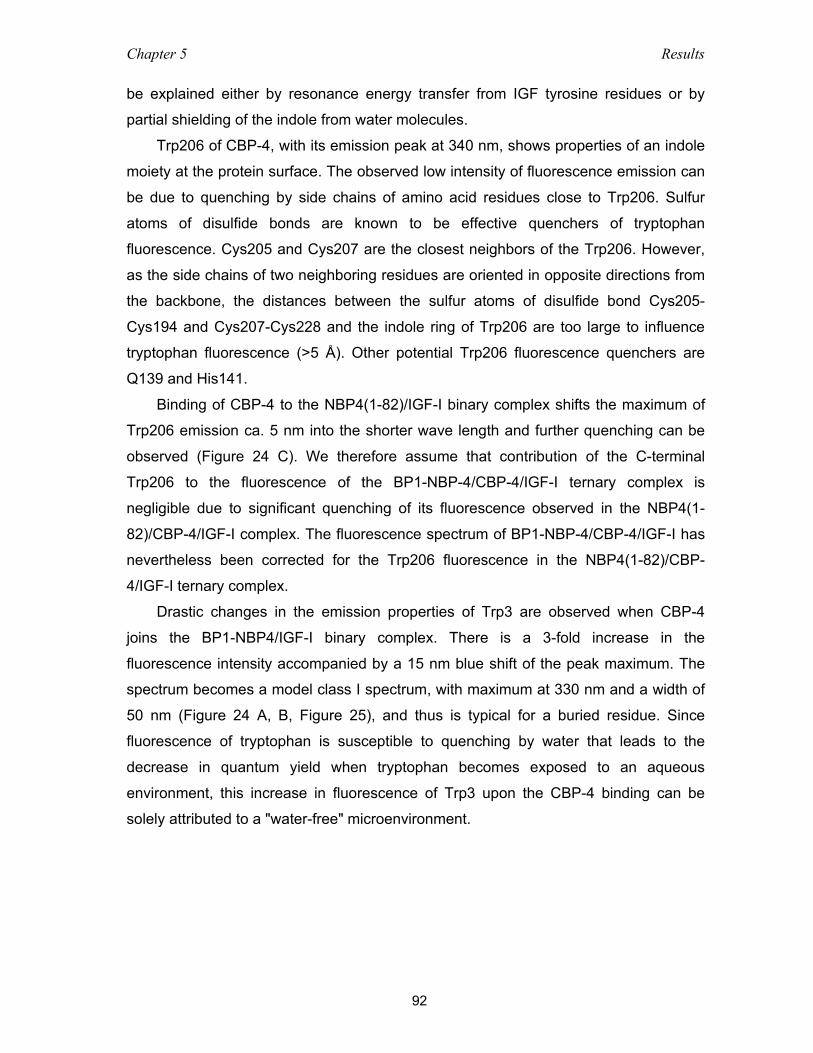
Chapter 5 Results
92
be explained either by resonance energy transfer from IGF tyrosine residues or by
partial shielding of the indole from water molecules.
Trp206 of CBP-4, with its emission peak at 340 nm, shows properties of an indole
moiety at the protein surface. The observed low intensity of fluorescence emission can
be due to quenching by side chains of amino acid residues close to Trp206. Sulfur
atoms of disulfide bonds are known to be effective quenchers of tryptophan
fluorescence. Cys205 and Cys207 are the closest neighbors of the Trp206. However,
as the side chains of two neighboring residues are oriented in opposite directions from
the backbone, the distances between the sulfur atoms of disulfide bond Cys205-
Cys194 and Cys207-Cys228 and the indole ring of Trp206 are too large to influence
tryptophan fluorescence (>5 Å). Other potential Trp206 fluorescence quenchers are
Q139 and His141.
Binding of CBP-4 to the NBP4(1-82)/IGF-I binary complex shifts the maximum of
Trp206 emission ca. 5 nm into the shorter wave length and further quenching can be
observed (Figure 24 C). We therefore assume that contribution of the C-terminal
Trp206 to the fluorescence of the BP1-NBP-4/CBP-4/IGF-I ternary complex is
negligible due to significant quenching of its fluorescence observed in the NBP4(1-
82)/CBP-4/IGF-I complex. The fluorescence spectrum of BP1-NBP-4/CBP-4/IGF-I has
nevertheless been corrected for the Trp206 fluorescence in the NBP4(1-82)/CBP-
4/IGF-I ternary complex.
Drastic changes in the emission properties of Trp3 are observed when CBP-4
joins the BP1-NBP4/IGF-I binary complex. There is a 3-fold increase in the
fluorescence intensity accompanied by a 15 nm blue shift of the peak maximum. The
spectrum becomes a model class I spectrum, with maximum at 330 nm and a width of
50 nm (Figure 24 A, B, Figure 25), and thus is typical for a buried residue. Since
fluorescence of tryptophan is susceptible to quenching by water that leads to the
decrease in quantum yield when tryptophan becomes exposed to an aqueous
environment, this increase in fluorescence of Trp3 upon the CBP-4 binding can be
solely attributed to a "water-free" microenvironment.
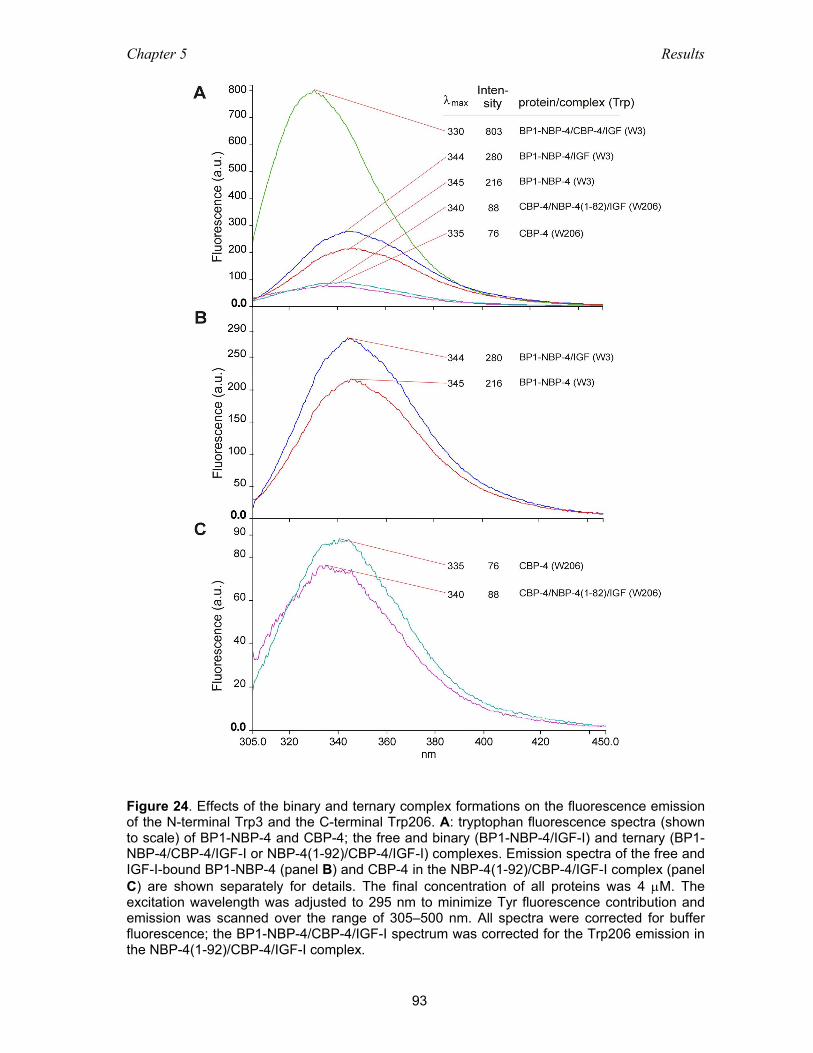
Chapter 5 Results
93
Figure 24. Effects of the binary and ternary complex formations on the fluorescence emission of the N-terminal Trp3 and the C-terminal Trp206. A: tryptophan fluorescence spectra (shown to scale) of BP1-NBP-4 and CBP-4; the free and binary (BP1-NBP-4/IGF-I) and ternary (BP1-NBP-4/CBP-4/IGF-I or NBP-4(1-92)/CBP-4/IGF-I) complexes. Emission spectra of the free and IGF-I-bound BP1-NBP-4 (panel B) and CBP-4 in the NBP-4(1-92)/CBP-4/IGF-I complex (panel C) are shown separately for details. The final concentration of all proteins was 4 µM. The excitation wavelength was adjusted to 295 nm to minimize Tyr fluorescence contribution and emission was scanned over the range of 305–500 nm. All spectra were corrected for buffer fluorescence; the BP1-NBP-4/CBP-4/IGF-I spectrum was corrected for the Trp206 emission in the NBP-4(1-92)/CBP-4/IGF-I complex.
Chapter 5 Results
94
Figure 25. Trp3 of BP1-NBP-4 is buried in a water-free environment upon the CBP-4 binding. Normalized emission spectra of Trp3 in free or IGF-I-bound BP1-NBP-4 (red curve) and in the BP1-NBP-4/CBP-4/IGF-I ternary complex (blue curve).
5.5 Isoquinoline compound NBI-31772 does not cause dissociation of the IGF-I/IGFBP complex Recently Chen and coworkers reported discovery of an isoquinoline-based family of
potent inhibitors of the IGF-IGFBP binding, effective in a nM concentrations (Liu et al,
2001, Chen et al, 2001, Zhu et al, 2003). We thought to use an NMR-monitored
titration with one of their small molecule compounds to map the binding site of this
compound on 15N-miniNBP-5. We have chosen compound NBI-31772 (1-(3,4-
dihydroxybenzoyl)-3-hydroxycarbonyl-6, 7-dihydroxyisoquinoline) characterized by the
highest IGFBP-3 binding affinity (Ki=5.6±0.5 nM, as determined by radioactive IGF-I
displacement, Chen et al., 2001).
The 15N-miniBP-5 titration with this compound was carried out with molar ratio of
the protein to NBI-31772 ranging, respectively, from 1:0.1 to 1:10. No interaction with
miniNBP-5 was observed, although the compound was present in a high molar excess.
The possibility that isoquinolines disrupt IGF/IGFBP complex through binding with IGF
was than investigated. The 15N-miniBP-5/IGF-I complex was titrated with NBI-31772 in
a similar manner, but no changes in the 15N-HSQC spectrum were observed, indicating
no efficacy of this compound in this assay (Figure 26). Taken together, our results

Chapter 5 Results
95
show unequivocally lack of interactions of NBI-31772 with IGFBP-5(40-92), miniBP-
5/IGF-I, or IGF-I. Even weak milimolar associations could be excluded. In addition, we
have shown that NBI-31772 cannot dissociate NBP/IGF-I complexes.
Figure 26. NMR-monitored titration of 15N-miniNBP-5 with NBI-31772. Superimposed 15N-HSQC spectra of miniNBP-5 before (red) and after the last step of titration with the isoquinoline compound (green).
Chapter 6 Discussion
96
6 Discussion
6.1 Domain organization of IGFBPs The molecular size of the six IGFBPs ranges from 22 to 32 kDa. The amino- and
carboxyl-terminal thirds of the IGFBPs are homologous globular domains, heavily
cross-linked by disulfide bonds whose positions are conserved (with an exception of
IGFBP-6, missing 6th and 7th N-terminal cysteines). Both N and C domains contain
IGF binding determinants common for all members of IGFBP family. On the basis of
1D NMR spectra of the intact IGFBP-4 and –5 and their N- and C-domains we can
conclude that their whole central variable domain is disordered, while the first ca. 90
amino acids from the N-terminus form a folded structure. The spectra of the C-terminal
fragments indicate presence of disordered regions also within the carboxyl-domains.
Comparison of 1D NMR spectra of the E. coli expressed full-length recombinant
IGFBPs with that of IGFBP-3 produced in Chinese hamster ovary (CHO) cell cultures
shows no noticeable differences in the folding extent, proving that the in vitro refolding
recreates protein structures seen in the one from the mammalian expression system.
Addition of IGF and formation of binary complex has no influence on the folding extent
either in the linker region or in the C-domain alone.
6.2 Contributions of the N- and C-terminal domains to IGF-I binding It is now generally accepted that both N- and C-domains of IGFBPs are involved in
binding to IGFs (Clemmons, 2001; Imai et al., 2000; Shand et al., 2003; Payet et al.,
2003). A comprehensive review of the literature on this subject has recently been
published by Heady at al. (2004c) in connection with their study of binding of the
IGFBP-6 domains to IGFs. This current compilation of the data can be summarized as
follows: In general, the strongest binding to IGFs is shown by amino terminal
fragments, which however bind to IGF with 10-1000-fold lower affinity than full-length
IGFBPs (Andress et al., 1993; Carrick et al., 2001; Cheung et al., 1994; Firth et al.,
1998; Galanis et al., 2001; Hashimoto et al., 1997; Kalus et al., 1998; Qin et al., 1998;
Standker et al., 2000; Twigg et al., 2000 Imai et al. 2000; Zeslawski et al. 2001).
There are conflicting reports in the literature regarding the role of the C-terminal
domains in binding to IGFs. Deletion (Forbes et al., 1998) or point mutation (Bramani
Chapter 6 Discussion
97
et al., 1999) of C-domains of IGFBPs clearly leads to lower affinities for IGFs, showing
that C domains are involved in binding. However, Galanis et al. (2001) and Carrick et
al. (2001) reported that C-domains of IGFBP-2 and IGFBP-3, respectively, bound IGFs
with higher affinities than N-domains whereas Vorwerk et al. (2002) reported identical
binding affinities for the N- and C-domains of IGFBP-3. In several studies evidence for
such binary interactions were not found, for example, C-terminal fragments of IGFBP-3
(Lalou et al., 1996), IGFBP-4 (Qin et al., 1998) and IGFBP-5 (Kalus et al., 1998) were
found not to bind to IGFs.
Many reported data fall in between these two extremes. C-terminal fragments of
IGFBP-2 and IGFBP-3 were found to bind IGFs ~10-fold and 3 to 1000-fold weaker
than full-length IGFBP-2 (Carrick et al., 2001; Ho and Baxter 1997; Wang et al., 1988)
and full-length IGFBP-3, respectively (Galanis et al., 2001; Payet et al., 2003; Vorwerk
et al., 2002). C-domains of IGFBP-4 (Ständker et al., 2000) and IGFBP-6 (Headey et
al., 2004c) were found to bind to IGF-II in a low µM range, weaker than a double-digit
nM binding of N-terminal domains. The binding of C-domains to IGF-I was even
weaker compared to IGF-II and could not be determined for IGFBP-6 (Headey et al.,
2004c). For the IGFBP-4 fragment 136-237 it was estimated to be > 60 nM by plasmon
resonance spectroscopy, ligand blot analysis, and saturation and displacement
methods (Ständker et al., 2000). Our ITC measurements showed no binding of CBP-4
to either IGF-I or to NBP-4. We next used NMR to check for very weak (i.e. millimolar)
interactions (Rehm et al., 2002); standard molecular biology methods for protein
binding, such as for example ELISA, RIA, or Biacore fail to detect ligands with weak
(i.e. millimolar) affinities. NMR demonstrated lack of even weak binding between CBP-
4 and IGF-I or CBP-4 and NBP-4.
NBP-4 binds IGF-I with 4-5 fold higher affinity than miniNBP-4. The extra contact
sites observed between IGF and NBP-4, in particular involving the two N-terminal
hydrophobic residues, may explain this increased affinity. These residues, in BP-4
Ala3 and Ile4, have their counterparts among all 6 IGF binding proteins. There are
always 2 nonpolar or aromatic side chain residues at corresponding positions in all
IGFBPs. This homology at the extreme N-terminus has been largely overlooked, and
apparently has not been considered to be involved in any kind of interaction. These
residues belong to the "thumb" fragment in our model of the IGFBP domain
architecture.
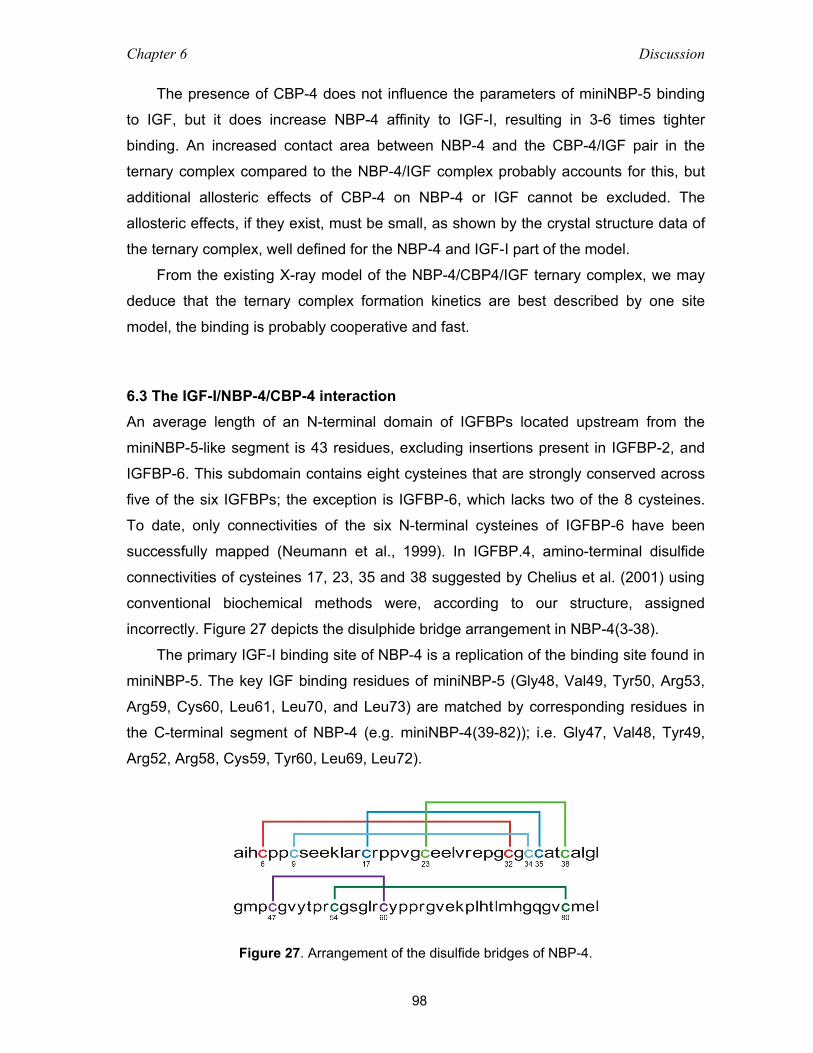
Chapter 6 Discussion
98
The presence of CBP-4 does not influence the parameters of miniNBP-5 binding
to IGF, but it does increase NBP-4 affinity to IGF-I, resulting in 3-6 times tighter
binding. An increased contact area between NBP-4 and the CBP-4/IGF pair in the
ternary complex compared to the NBP-4/IGF complex probably accounts for this, but
additional allosteric effects of CBP-4 on NBP-4 or IGF cannot be excluded. The
allosteric effects, if they exist, must be small, as shown by the crystal structure data of
the ternary complex, well defined for the NBP-4 and IGF-I part of the model.
From the existing X-ray model of the NBP-4/CBP4/IGF ternary complex, we may
deduce that the ternary complex formation kinetics are best described by one site
model, the binding is probably cooperative and fast.
6.3 The IGF-I/NBP-4/CBP-4 interaction An average length of an N-terminal domain of IGFBPs located upstream from the
miniNBP-5-like segment is 43 residues, excluding insertions present in IGFBP-2, and
IGFBP-6. This subdomain contains eight cysteines that are strongly conserved across
five of the six IGFBPs; the exception is IGFBP-6, which lacks two of the 8 cysteines.
To date, only connectivities of the six N-terminal cysteines of IGFBP-6 have been
successfully mapped (Neumann et al., 1999). In IGFBP.4, amino-terminal disulfide
connectivities of cysteines 17, 23, 35 and 38 suggested by Chelius et al. (2001) using
conventional biochemical methods were, according to our structure, assigned
incorrectly. Figure 27 depicts the disulphide bridge arrangement in NBP-4(3-38).
The primary IGF-I binding site of NBP-4 is a replication of the binding site found in
miniNBP-5. The key IGF binding residues of miniNBP-5 (Gly48, Val49, Tyr50, Arg53,
Arg59, Cys60, Leu61, Leu70, and Leu73) are matched by corresponding residues in
the C-terminal segment of NBP-4 (e.g. miniNBP-4(39-82)); i.e. Gly47, Val48, Tyr49,
Arg52, Arg58, Cys59, Tyr60, Leu69, Leu72).
Figure 27. Arrangement of the disulfide bridges of NBP-4.

Chapter 6 Discussion
99
Figure 28. Bipolar binding of IGF-I by NBP-4(1-92). Three views of the binary complex; NBP-4(1-92) is presented as a surface: the “base” region is colored in yellow, “palm” in blue and “thumb” in magenta. IGF-I is shown as a green ribbon.
The amino-terminal part of IGFBP-4 can be further divided into two subdomains:
the fragment from residues Asp1-Cys39 and the segment Met44-Glu90, joined by a
short, glycine - leucine rich linker. Each of the subdomains has its own system of
disulfide bridges reinforcing their folds. Evident from the binary complex structure lack
of a extensive contact areas between the subdomains that would impose rigid linkers
as well as amino acid composition of the linker, prompted us to examine molecular
motions in the uncomplexed NBP-4 using NMR 15N relaxation measurements. The
experiment demonstrated that the linker is rigid even in the absence of bound IGF-I.
We should mention here that in all structures of either binary complex of IGF-I and
NBP-4(3-82) or IGF-I and NBP-4(1-90), as well as in the ternary complex of IGF-I,
NBP-4(3-82) and CBP-4 (151-232), the relative orientation of both subdomains is
identical.
The N-terminal domain can be viewed as consisting of a globular base,
corresponding to the miniBP-5 that contains the primary IGF binding site, and an
extended palm followed by a short hydrophobic thumb (Ala3, Ile4). The thumb interacts
with IGF residues Phe23, Tyr24 and Phe25 upon complex formation. The palm is rigid
because of four disulphide bonds arranged in a ladder-like manner plane. A number of
H-bonding inter-subdomain interactions prevent the palm to notably move in respect to
the base.
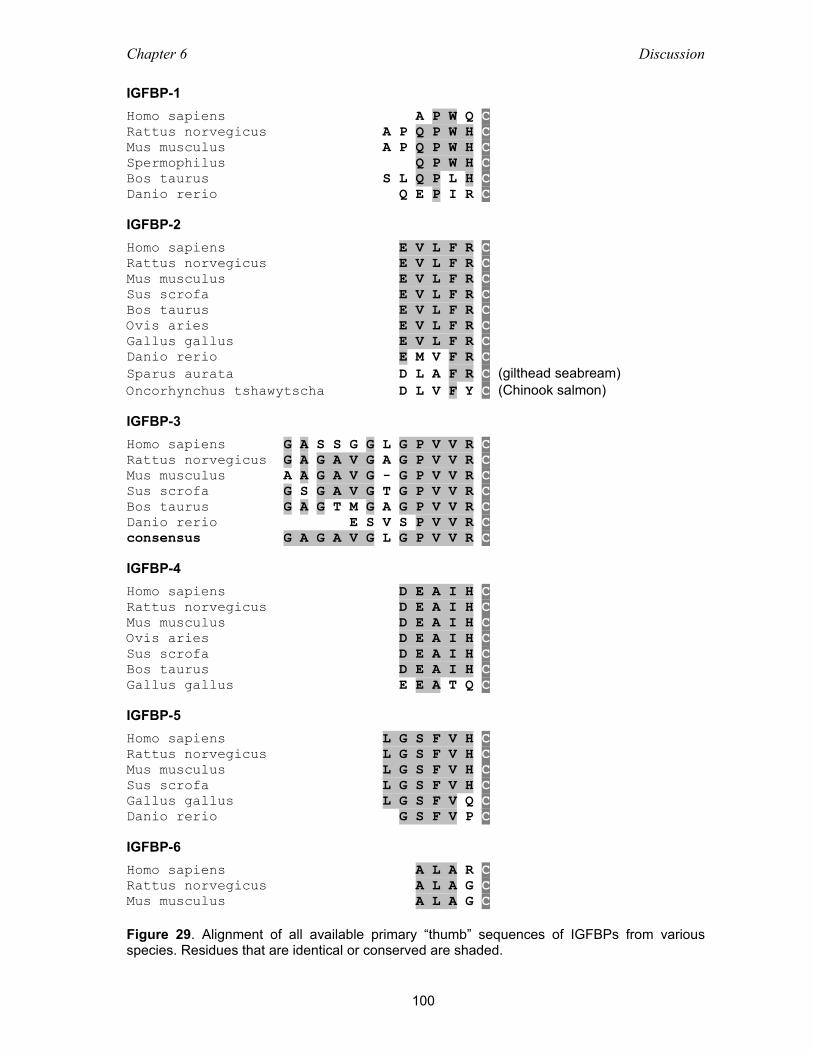
Chapter 6 Discussion
100
IGFBP-1 Homo sapiens A P W Q C Rattus norvegicus A P Q P W H C Mus musculus A P Q P W H C Spermophilus Q P W H C Bos taurus S L Q P L H C Danio rerio Q E P I R C IGFBP-2 Homo sapiens E V L F R C Rattus norvegicus E V L F R C Mus musculus E V L F R C Sus scrofa E V L F R C Bos taurus E V L F R C Ovis aries E V L F R C Gallus gallus E V L F R C Danio rerio E M V F R C Sparus aurata D L A F R C (gilthead seabream) Oncorhynchus tshawytscha D L V F Y C (Chinook salmon) IGFBP-3 Homo sapiens G A S S G G L G P V V R C Rattus norvegicus G A G A V G A G P V V R C Mus musculus A A G A V G - G P V V R C Sus scrofa G S G A V G T G P V V R C Bos taurus G A G T M G A G P V V R C Danio rerio E S V S P V V R C consensus G A G A V G L G P V V R C IGFBP-4 Homo sapiens D E A I H C Rattus norvegicus D E A I H C Mus musculus D E A I H C Ovis aries D E A I H C Sus scrofa D E A I H C Bos taurus D E A I H C Gallus gallus E E A T Q C IGFBP-5 Homo sapiens L G S F V H C Rattus norvegicus L G S F V H C Mus musculus L G S F V H C Sus scrofa L G S F V H C Gallus gallus L G S F V Q C Danio rerio G S F V P C IGFBP-6 Homo sapiens A L A R C Rattus norvegicus A L A G C Mus musculus A L A G C Figure 29. Alignment of all available primary “thumb” sequences of IGFBPs from various species. Residues that are identical or conserved are shaded.
Chapter 6 Discussion
101
Truncation of the thumb reduces the IGF-I binding of NBP-4 to that of miniNBP-4
(residues 39-82), suggesting that the palm does not contribute directly to IGF binding.
The segment appears therefore to serve solely a mechanical purpose of a rigid linker
between primary binding sites - the base and the thumb residues. The central element
of the palm has a GCGCCXXC consensus motif, around which the polypeptide chain
(residues Cys6-Cys23) is bent forming a disulfide ladder and assuring proper spatial
relationship between the base and the thumb.
Substitution of the IGFBP-4 thumb with a corresponding region from two other
IGFBPs does not influence the strength of IGF-I binding markedly. Interestingly,
available sequences of IGFBPs from different species show a remarkable high degree
inter-species conservation of thumb residues within a one type of IGFBP (Figure 29),
implying that the sequence of a thumb may confer unique properties to each IGFBP.
The experiment utilizing Trp3 of BP1-NBP-4 as a fluorescence probe shows that
upon C-terminal domain binding to the NBP-4/IGF-I binary complex, microenvironment
of the tryptophan changes its character. Formation of the IGFBP/IGF-I complex leads
to enclosure of the thumb residues into a rigid, water free core. To exclude water from
the Trp3 microenvironment, the interacting molecules must show high degree of
surface complementarity in the immediate vicinity of the thumb. The experiments show
that N- and C-terminal domains of IGFBP cooperate to block the primary IGF-IR
binding site of IGF-I: the thumb hinders the access to the Phe23-Tyr24-Phe25 pocket
of IGF-I, while the C-terminal domain reinforces further this hindrance in agreement
with our NBP-4(3-82)/CBP-4/IGF-I ternary complex model.
Bach et al. (1993) in their mutagenesis study on IGFBPs-binding determinants of
IGF-II reported that Phe26 of IGF-II is the second most important site in recognition of
IGF-II by IGFBPs (after the stretch of amino acids Phe48-Arg49-Ser50). The mutant
[Ser26]IGF-II bound IGFBP-1, -4 and –6 with only 1-7% of the wt-IGF-II affinity. Similar
results were obtained by Darren et al. (1996): mutation of the IGF-I residue Phe23
(corresponding to Phe26 in IGF-II) lowered the affinity to all IGFBPs a 100-fold. In
contrast, Dubaquie et al. (1999) pointed to the IGF-I residue Phe25 as the pivotal
IGFBP binding determinant. Alanine-scanning mutagenesis studies showed that IGF-I
with Phe23 replaced by Ala exhibits only slight loss of affinities to IGFBP-1 and –3;
relative affinities being 1.3 and 2.9-fold lower than those of wild type protein for IGFBP-
1 and IGFBP-3, respectively. More significant drop in affinity is observed when Phe25
is mutated to Ala: the affinity of IGFBP-1 and IGFBP-3 for the mutant is 25 and 5 times
Chapter 6 Discussion
102
lower than that for the wild type IGF-I, respectively. IGFBP-1 responds to the mutation
Phe25Ala noticeably stronger than IGFBP-3. In IGFBP-3, both hydrophobic positions
of the thumb consensus sequence are occupied by valines, while in IGFBP-1 there is a
proline (the only exception from the consensus in the IGFBPs family) and tryptophan at
the respective sites. The bulk of the Trp side chain compensates excessively for lack
of a hydrophobic side chain at the neighboring position (van der Waals volume of
Pro+Trp is 253, Val+Val, 210). The indole ring of tryptophan can participate in aromatic
stacking interactions with neighboring aromatic residues of IGF in the binary complex.
Substitution of Phe by Ala does not change the overall hydrophobic environment of the
patch, but reduces its aromatic character. Differences in interactions of Phe25 with C-
domains of IGFBPs will also contribute to different behavior among IGFBPs.
Effects of substituting IGF-I Tyr24, and its IGF-II counterpart Tyr27, on IGFBPs
binding have also been studied. Mutations of Tyr27 to a hydrophobic residue showed
only minor decrease in the IGFBPs binding affinity (Roth, 1991, Bach, 1993). Similarly,
mutation of IGF-I Tyr24 to Leu (Baxter et al, 1992) or Ala (Dubaquie, 1999) had a
relatively little effect on IGFBPs binding. Substitution of Tyr27 with Glu resulted in a 40-
fold lower IGFBP-3 binding affinity compared with the wild type IGF-II (Roth, 1991).
The C-domain increases affinity of IGFBP-4 for IGFs. The low resolution structure
of the ternary complex of NBP-4(3-82)/IGF-I/CBP-4(151-232) provided the binding site
for the C-domain on IGF-I. CBP-4 contacts both the amino-terminal part of NBP-4 and
IGF-I. On IGF, a segment Cys6-Val12, which is in an extended conformation, Tyr24,
Phe25, Gln26, Val 44, Cys48 and Phe49 are the key interacting residues. Among them
Tyr24, Phe25, Val44 are the determinants of IGF binding to its IGF-I receptor.
Headey et al. (2004a) have recently mapped the binding site of the C-domain of
IGFBP-6 on IGF-II using NMR. The contact area lies adjacent to and between the
binding sites for the IGFBP N-domain and IGF-I receptor and includes residues Thr7,
Cys9, Gly10-Thr16, Gln18, Cys21, Phe28, Ile42, Val43, Glu44, Cys46, Cys47, Phe48,
Arg49 and Cys51. The binding site defined by the authors agrees with our findings,
although their contact surface is slightly larger than the one obtained from our X-ray
data: residues of IGF-I corresponding to IGF-II Thr7, Leu10, Gln18, Cys21, Ile42,
Glu44, Cys46, Arg49 and Cys51 are too far away from CBP-4 to be directly involved in
binding. These differences are however not unexpected as the interfaces for protein-
protein interactions identified by NMR chemical shift perturbation methods are similar
but not identical to those revealed by X-ray crystallography, or other NMR methods,
Chapter 6 Discussion
103
such as for example, hydrogen/deuterium exchange experiments (Takahashi et al.,
2000; Stoll et al., 2001).
The location of C-terminal residues of NBP-4 shown in Figures 18 and 28
suggests the location for the central L-domain of IGFBP-4 in the IGF/IGFBP
interaction. The L-domain, which constitutes roughly 1/3 of the amino acid sequence in
IGFBPs (28% in IGFBP-4 and up to 36% in IGFBP-3), would cover most of the
remaining parts of IGF that already were not enclosed by NBP-4 and CBP-4 domains.
It appears therefore that IGFs are encapsulated by IGFBPs before their release after
IGFBP proteolysis.
6.4 Inhibition of the IGF-I receptor binding and action by IGFBP fragments Site-directed mutagenesis studies of mapping binding sites of IGFs for IGF-IR and the
insulin receptor (IR) showed that the major determinants of binding in IGF-I are Tyr60,
Tyr24, Phe23, Val44 (Cascieri et al., 1988; Bayne et al., 1990; Hodgson et al., 1996;
Sakano et al., 1991; Perdue et al., 1994), and possibly Phe25 and Arg21 (Hodgson et
al., 1996; Torres et al., 1995; Cooke et al., 1991) (Figure 30). The most notable feature
evident from the earlier structural studies on the miniNBP-5/IGF-I complex was that
Phe23-Tyr24-Phe25, Val 44, and Tyr60 form a fully solvent-exposed hydrophobic
binding site for IGF-IR that is located on the opposite side of IGF to that used for the
binding to mini-IGFBP-5 (Zeslawski et al., 2001). The additional N-terminal subdomain
1-38 of NBP-4 on the other hand reaches the IGF-I Tyr24 and its surroundings primary
through the "thumb" segment residues Ala3 and Ile4 of NBP-4 that fill a hydrophobic
cleft of IGFs’ Phe23, Tyr24 and Phe25. We would therefore expect to see some
inhibition of activity of IGF-IR for the entire NBP-4 (e.g. which include the "thumb"
residues) compared to the miniNBP-4 domain only. This has indeed been confirmed by
the data on the inhibition of autophosphorylation of IGF-IR (Table 8).
Both IGF-I and IGF-II bind to the IGF-I receptor with high affinity (KD = 1.5 and 3.0
nM, respectively; Loddick et al., 1998). In our assay, a full-length IGFBP-4 inhibited
IGF-IR autophosphorylation with IC50 of about 2.4 nM (Table 8). The N-domains
showed some inhibition, with the longer NBP-4 fragment NBP-4(1-92) (and NBP-5(1-
94)) exhibiting superior inhibition relative to that of NBP-4(3-82). This trend parallels
stronger IGF binding of these fragments relative to NBP-4(3-82). MiniNBP subdomains
showed no inhibition, indicating that the N-terminal "thumb" part of BPs is important for
inhibition of IGF action.
Chapter 6 Discussion
104
As discussed above, the N-terminal domain of IGFBPs is characterized by high
degree of rigidity. This may be of significance when the competition with IGF-IR for IGF
binding is concerned. To displace the hydrophobic thumb that covers the primary IGF-
IR binding site of IGFs (IGF-I, Phe23-Phe25), the receptor has to lift also the rest of the
N-terminal domain, which is bound on the opposite side of the IGF-I molecule, and
does not prevent receptor binding on its own (Kalus et al. 1998). Thus, the thumb does
not have to significantly contribute to the overall binding affinity of IGFBPs for IGFs.
This mechanism is expected to be shared by all IGFBPs given the conserved
arrangement of the N-terminal cysteine residues and the consensus presence of two
hydrophobic residues at positions -2 and –3 with respect to the first N-terminal Cys
residue.
The structure of the ternary complex suggests that addition of CBP-4(151-232) to
the NBP-4(3-82)/IGF interaction should enhance inhibition of IGF-IR activity, and
indeed a 6-fold increase is seen (Table 8). Our data are in agreement with that of
Payet et al. (2003) who have recently demonstrated that isolated amino-terminal and
carboxy-terminal domains of IGFBP-3, residues 1-88 and 185-264, respectively,
cooperate in the presence of IGFs to form high-affinity complexes that retain the ability
to block IGF activity. We observe no inhibition for miniNBP-4(39-82) and CBP-4,
indicating again a crucial role of the N-terminal "thumb" residues of BPs in blocking
IGF activity.
Proteolytic cleavage has gained wide acceptance as the predominant mechanism
for IGF release from IGFBPs (Bunn and Fowlkes, 2003). The current paradigm for IGF
release proposes that proteolysis takes place at the central L-domain producing low
affinity N- and C-terminal fragments that cannot compete with IGF receptors for IGFs.
The data presented by Payet et al. (2003), together with our results, clearly indicate
that IGFBP fragments still retain properties to inhibit IGF activity, and therefore this
paradigm has to be revised. The structures of the IGF/BP-4 complexes presented here
suggest a following model for IGF binding proteins actions (Figure 31): The data
indicates that IGFs, which are approximately globular structures, are encapsulated by
IGFBPs. The N-terminal domain of IGFBPs plays an important role in binding IGFs.
The globular C-terminal part of this domain, miniNBP, serves as a primary docking site
for IGFs; the N-terminal subdomain, which consists of a "palm" and a "thumb", reaches
a hydrophobic IGF receptor binding site of IGFs with the conserved thumb hydrophobic
residues. Next, the C-terminal domain, which covers roughly an equal surface of IGF
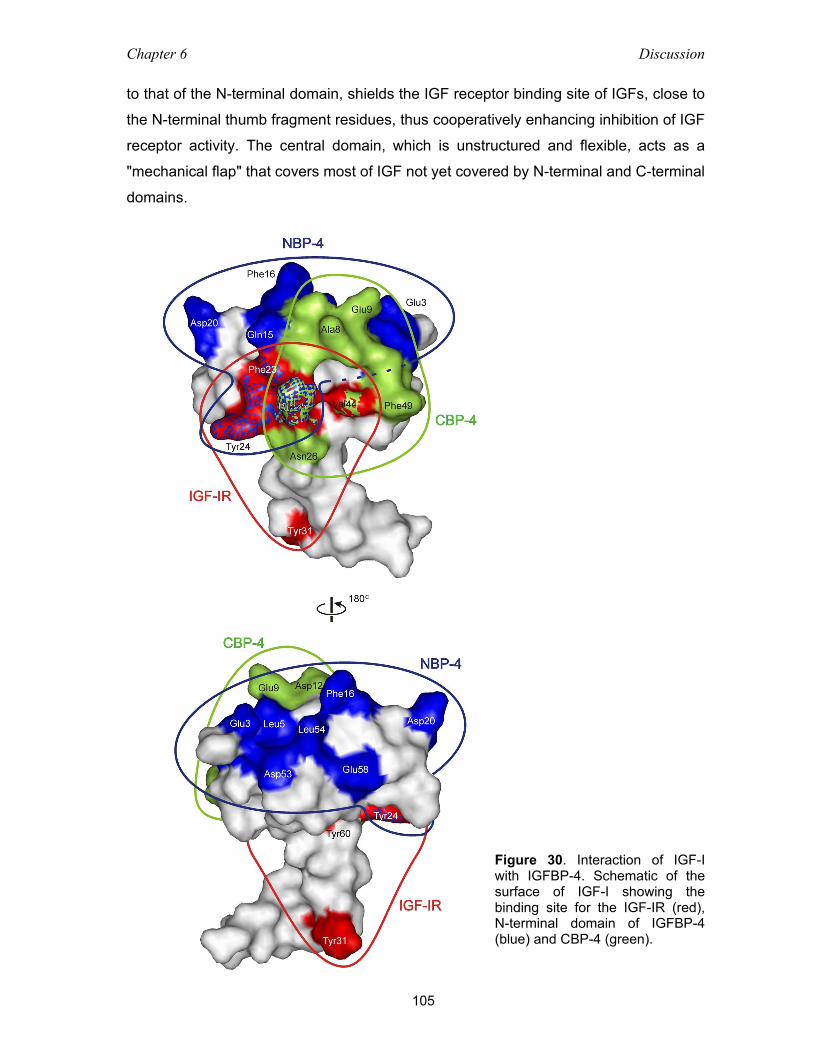
Chapter 6 Discussion
105
to that of the N-terminal domain, shields the IGF receptor binding site of IGFs, close to
the N-terminal thumb fragment residues, thus cooperatively enhancing inhibition of IGF
receptor activity. The central domain, which is unstructured and flexible, acts as a
"mechanical flap" that covers most of IGF not yet covered by N-terminal and C-terminal
domains.
Figure 30. Interaction of IGF-I with IGFBP-4. Schematic of the surface of IGF-I showing the binding site for the IGF-IR (red), N-terminal domain of IGFBP-4 (blue) and CBP-4 (green).
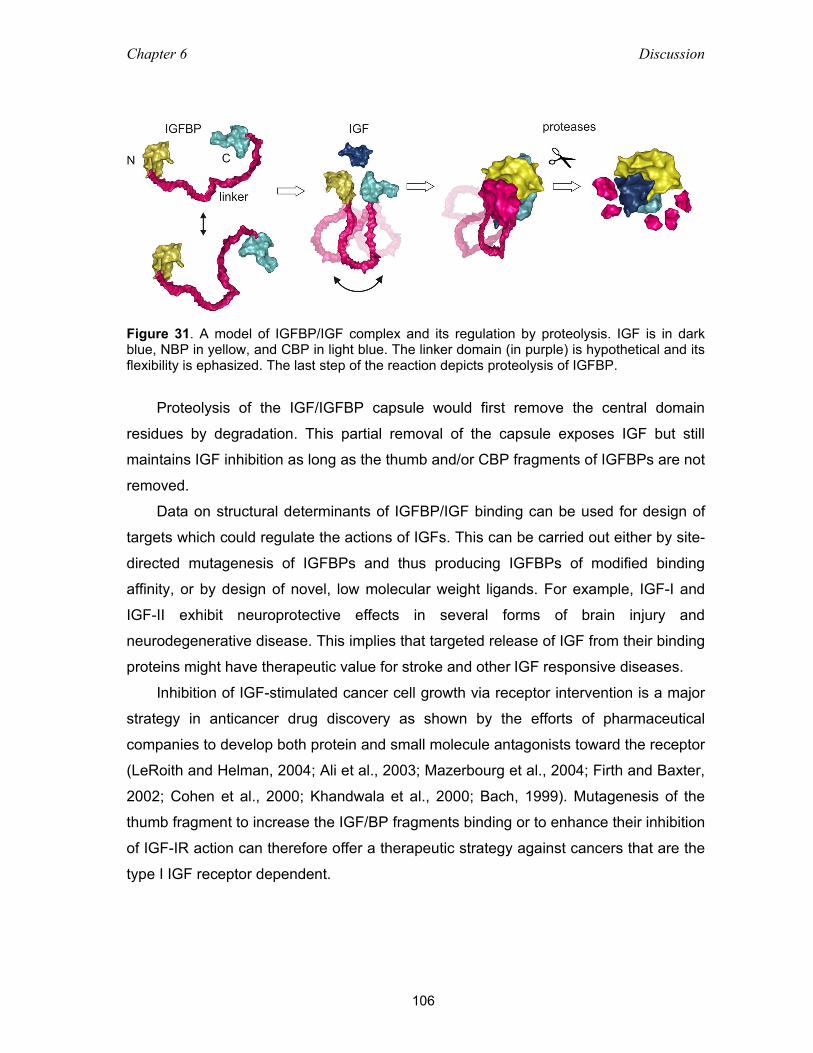
Chapter 6 Discussion
106
Figure 31. A model of IGFBP/IGF complex and its regulation by proteolysis. IGF is in dark blue, NBP in yellow, and CBP in light blue. The linker domain (in purple) is hypothetical and its flexibility is ephasized. The last step of the reaction depicts proteolysis of IGFBP.
Proteolysis of the IGF/IGFBP capsule would first remove the central domain
residues by degradation. This partial removal of the capsule exposes IGF but still
maintains IGF inhibition as long as the thumb and/or CBP fragments of IGFBPs are not
removed.
Data on structural determinants of IGFBP/IGF binding can be used for design of
targets which could regulate the actions of IGFs. This can be carried out either by site-
directed mutagenesis of IGFBPs and thus producing IGFBPs of modified binding
affinity, or by design of novel, low molecular weight ligands. For example, IGF-I and
IGF-II exhibit neuroprotective effects in several forms of brain injury and
neurodegenerative disease. This implies that targeted release of IGF from their binding
proteins might have therapeutic value for stroke and other IGF responsive diseases.
Inhibition of IGF-stimulated cancer cell growth via receptor intervention is a major
strategy in anticancer drug discovery as shown by the efforts of pharmaceutical
companies to develop both protein and small molecule antagonists toward the receptor
(LeRoith and Helman, 2004; Ali et al., 2003; Mazerbourg et al., 2004; Firth and Baxter,
2002; Cohen et al., 2000; Khandwala et al., 2000; Bach, 1999). Mutagenesis of the
thumb fragment to increase the IGF/BP fragments binding or to enhance their inhibition
of IGF-IR action can therefore offer a therapeutic strategy against cancers that are the
type I IGF receptor dependent.
Chapter 7 Summary
107
7 Summary
Insulin-like growth factor binding proteins (IGFBPs) control bioavailability, activity and
distribution of IGF-I and –II in the serum. While IGFBPs have also IGF-independent
direct actions, all IGF-dependent actions, positive or negative, i.e. potentiation or
inhibition of its mitogenic and metabolic effects, depend on the formation of high-
affinity complexes with IGFs. Amino- and carboxyl-terminal fragments of IGFBPs, the
two conserved domains of IGFBPs, form together a high-affinity IGF binding site, but
their relative contribution to the binding affinity varies among IGFBPs.
The study reported in this thesis employed techniques of nuclear magnetic
resonance and X-ray crystallography to gain a more detailed understanding of the
IGFBPs domain organization and structural requirements for binding to IGFs. An inter-
and intra-domain arrangement and the extent of folding within domains of IGFBP, -4,
and –5 have been determined with the aid of NMR spectra.
This thesis presents 1.6 Å and 2.5 Å resolution structures of binary complexes
between IGF-I and two amino-terminal domain constructs of IGFBP-4 (NBP-4,
residues 3-82 and 1-92), and a model of the ternary complex of IGF-I, NBP-4 and the
carboxyl-terminal domain (CBP-4, residues 151-232) derived from the 2.1 Å diffraction
data. Key features of the structures include: 1) a disulphide bond ladder (the “palm”)
that binds to IGF through the extreme-N-terminal residues (the “thumb”), which partially
mask the IGF residues responsible for type I IGF receptor (IGF-IR) binding; 2) the high
affinity IGF-I interaction site formed by residues 39-82 in a globular fold (the “base”),
comprising interlaced hydrophobic side chains that protrude from both IGF-I and NBP-
4, and the surrounding network of polar interactions, and 3) CBP-4 interactions with
both NBP-4 and IGF-I. The mechanical role of the “palm” and importance of the
“thumb” residues for IGF binding was confirmed and quantitatively assessed with ITC
utilizing a number of mutants and truncated forms of IGFBP-4. A rigid character of the
whole N-terminal domain was confirmed by NMR 15N relaxation measurements. A new
insight was gained from these experiments into the involvemet of the IGFBP amino-
terminal domain in the inhibition of the IGF-IR activity.
The model of the NBP-4/CBP-4/IGF-I ternary complex explains the relative
arrangement of the domains and IGF and shows that the C-terminal domain, CBP-4,
Chapter 7 Summary
108
contacts both the N-terminal domain and IGF-I, although, as determined by gel
filtration, ITC and NMR, does not bind individually to either IGF-I or NBP-4. The
interaction of CBP-4 and NBP-4 in the ternary complex was also analysed by
monitoring Trp3 of the BP1-NBP-4 as a fluorescence probe. The study showed that the
Trp3 is burried upon the ternary complex formation in a water free, rigid environment.
Due to the high degree of sequence homology within the investigated domains,
the interactions described above can be regarded as prototypes for all members of the
IGFBP family.
Chapter 8 Zusammenfassung
109
8 Zusammenfassung
IGFBPs (Insulin-like growth factor binding proteins) kontrollieren die Bioverfügbarkeit,
Aktivität und Verteilung von IGF-I und -II im Serum. Während IGFBPs auch IGF-
unabhängige direkte Wirkungen haben, hängen alle IGF-abhängigen Aktionen, positiv
oder negativ, d. h. Potenzierung oder Hemmung der mitogenetischen und
metabolischen Effekte, von der Bildung hoch affiner Komplexe mit IGFs ab. Amino-
und Carboxyterminale Fragmente von IGFBPs, den zwei konservierten Domänen von
IGFBPs, bilden zusammen eine hoch affine IGF Bindestelle, aber ihr relativer Beitrag
zur Bindungsaffinität variiert unter IGFBPs.
Die in dieser Doktorarbeit beschriebenen Untersuchungen benutzten die
Techniken des NMR (Nuclear Magnetic Resonance) und der Röntgenkristallographie
um ein vertieftes Verständnis der Domänenorganisation der IGFBPs und der
strukturellen Voraussetzungen der Bindung der IGFs zu erwerben. Ein Inter- und Intra-
Domänen-Arrangement und der Faltungsgrad innerhalb der Domänen von IGFBP-4
und -5 ist mit Hilfe von NMR bestimmt worden.
Diese Doktorarbeit zeigt Strukturen mit 1,6 Å und 2,5 Å Auflösung des binären
Komplexes zwischen IGF-I und zwei Konstrukten der amino-terminalen Domäne von
IGFBP-4 (NBP-4, Aminosäuren 3-82 bzw. 1-92) und ein Modell des ternären
Komplexes von IGF-I, NBP-4 und der carboxy-terminalen Domäne (CBP-4,
Aminosäuren 151-232) erhalten von Diffraktionsdaten von 2,1 Å Auflösung. Die
wichtigsten Eigenschaften der Strukturen beinhalten: 1) eine Leiter von Disulfidbrücken
(die „Handfläche“), die an IGF durch extreme N-terminale Reste (der „Daumen“)
bindet, das zum Teil die IGF Reste abdeckt, die für die Typ I IGF Rezeptorbindung
(IGF-1R) verantwortlich sind; 2) die hoch affine IGF-I Interaktionsstelle gebildet von
Resten 39-82 in einer globulären Faltung (die „Basis“), die verkettete hydrophobe
Seitenketten, die aus IGF-I und NBP-4 herausragen, und ein umgebendes Netzwerk
von polaren Wechselwirkungen umfasst; und 3) CBP-4 Interaktionen mit sowohl NBP-
4 als auch IGF-I. Die mechanische Rolle von „Handfläche“ und die Wichtigkeit des
„Daumens“ für die IGF Bindung wurde mit ITC bestätigt und quantitativ bestimmt,
indem zahlreiche Mutanten und trunkierte Formen von IGFBP-4 verwendet worden
sind. Der starre Charakter der gesamten N-terminalen Domäne wurde mit NMR 15N
Chapter 8 Zusammenfassung
110
Relaxationsmessungen bestätigt. Ein neuer Einblick in die Beteiligung der N-
terminalen Domäne von IGFBP an der Hemmung der IGF-IR Aktivität wurde durch
diese Experimente gewonnen.
Das Model des ternären NBP-4/CBP-4/IGF-I Komplexes erklärt das relative
Arrangement der Domänen und IGF und zeigt, dass die C-terminale Domäne, CBP-4,
sowohl die N-terminale Domäne als auch IGF-I berührt, obwohl sie, wie mit
Gelfiltration, ITC und NMR bestimmt, weder an IGF-I noch NBP-4 individuell bindet.
Die Interaktion von CBP-4 und NBP-4 im ternären Komplex wurde auch analysiert,
indem Trp3 des BP1-NBP-4 als Fluoreszenz Probe überwacht wurde. Die
Untersuchung zeigte, dass Trp3 auf die ternäre Komplexbindung hin in einer
wasserfreien, starren Umgebung begraben wird.
Aufgrund des hohen Grades der Sequenzhomologie innerhalb der erforschten
Domänen können die oben beschriebenen Wechselwirkungen als Prototyp für alle
Mitglieder der IGFBP Familie angesehen werden.
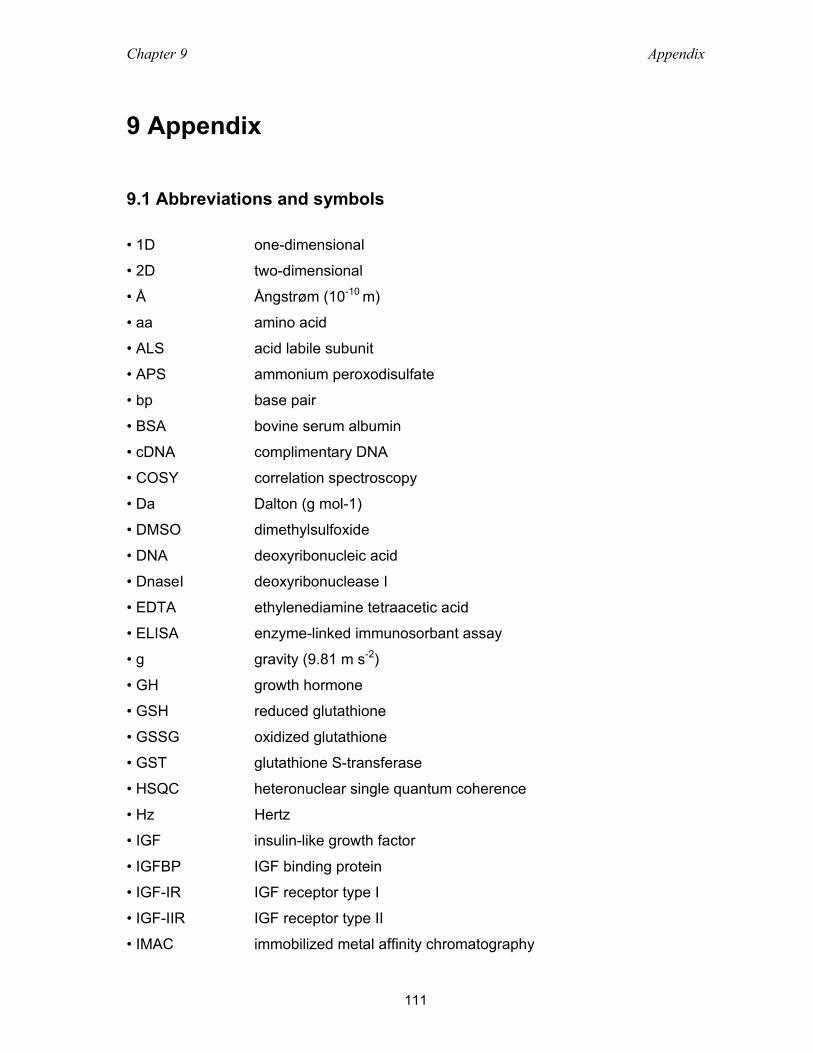
Chapter 9 Appendix
111
9 Appendix 9.1 Abbreviations and symbols • 1D one-dimensional
• 2D two-dimensional
• Å Ångstrøm (10-10 m)
• aa amino acid
• ALS acid labile subunit
• APS ammonium peroxodisulfate
• bp base pair
• BSA bovine serum albumin
• cDNA complimentary DNA
• COSY correlation spectroscopy
• Da Dalton (g mol-1)
• DMSO dimethylsulfoxide
• DNA deoxyribonucleic acid
• DnaseI deoxyribonuclease I
• EDTA ethylenediamine tetraacetic acid
• ELISA enzyme-linked immunosorbant assay
• g gravity (9.81 m s-2)
• GH growth hormone
• GSH reduced glutathione
• GSSG oxidized glutathione
• GST glutathione S-transferase
• HSQC heteronuclear single quantum coherence
• Hz Hertz
• IGF insulin-like growth factor
• IGFBP IGF binding protein
• IGF-IR IGF receptor type I
• IGF-IIR IGF receptor type II
• IMAC immobilized metal affinity chromatography
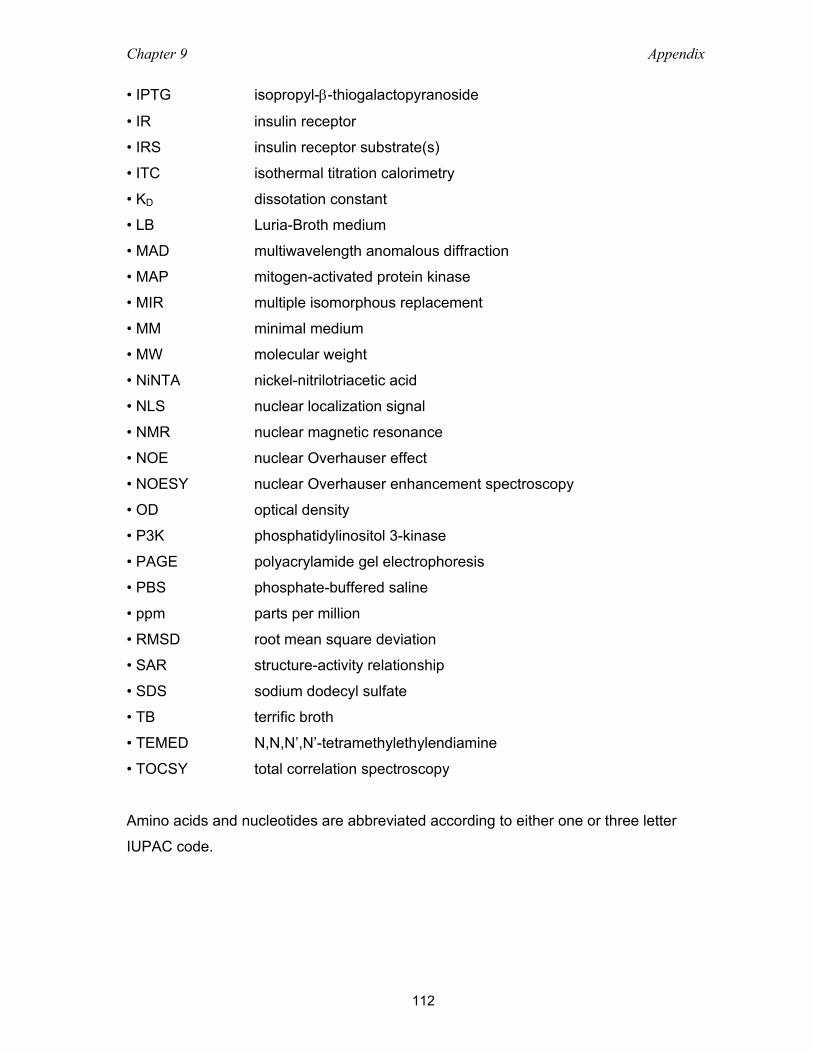
Chapter 9 Appendix
112
• IPTG isopropyl-β-thiogalactopyranoside
• IR insulin receptor
• IRS insulin receptor substrate(s)
• ITC isothermal titration calorimetry
• KD dissotation constant
• LB Luria-Broth medium
• MAD multiwavelength anomalous diffraction
• MAP mitogen-activated protein kinase
• MIR multiple isomorphous replacement
• MM minimal medium
• MW molecular weight
• NiNTA nickel-nitrilotriacetic acid
• NLS nuclear localization signal
• NMR nuclear magnetic resonance
• NOE nuclear Overhauser effect
• NOESY nuclear Overhauser enhancement spectroscopy
• OD optical density
• P3K phosphatidylinositol 3-kinase
• PAGE polyacrylamide gel electrophoresis
• PBS phosphate-buffered saline
• ppm parts per million
• RMSD root mean square deviation
• SAR structure-activity relationship
• SDS sodium dodecyl sulfate
• TB terrific broth
• TEMED N,N,N’,N’-tetramethylethylendiamine
• TOCSY total correlation spectroscopy
Amino acids and nucleotides are abbreviated according to either one or three letter
IUPAC code.
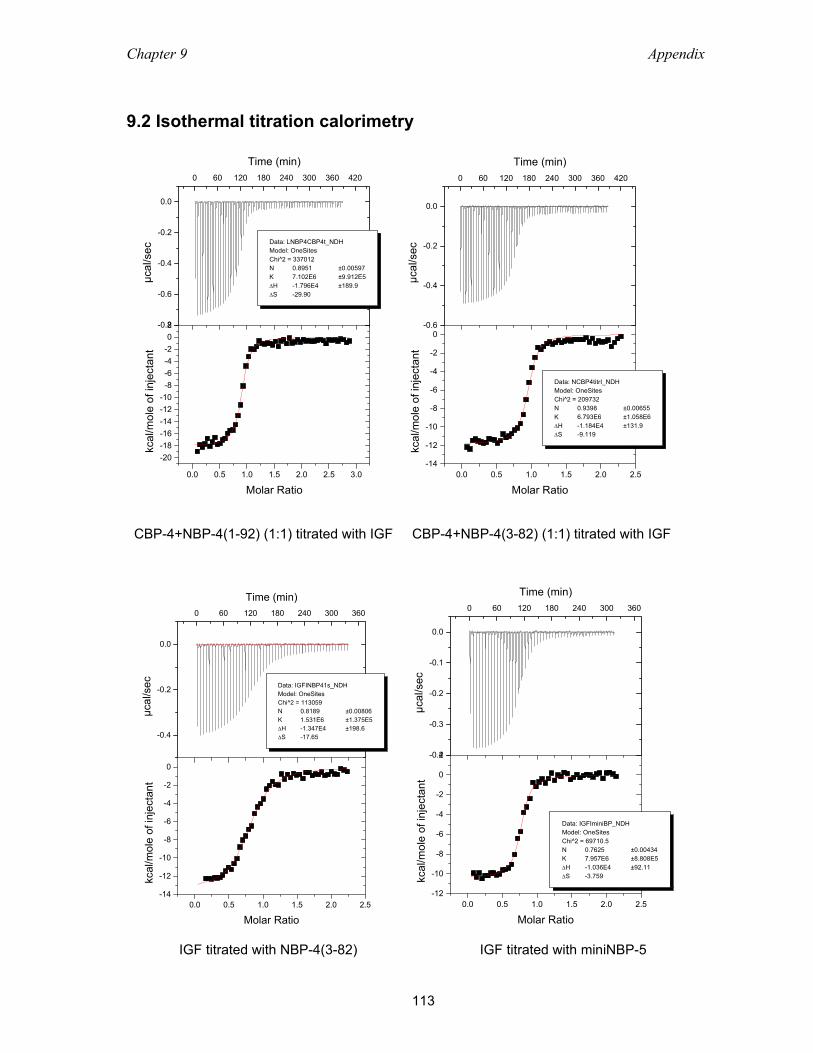
Chapter 9 Appendix
113
9.2 Isothermal titration calorimetry
-0.8
-0.6
-0.4
-0.2
0.0
0 60 120 180 240 300 360 420
Data: LNBP4CBP4t_NDHModel: OneSitesChi^2 = 337012N 0.8951 ±0.00597K 7.102E6 ±9.912E5∆H -1.796E4 ±189.9∆S -29.90
Time (min)µc
al/s
ec
0.0 0.5 1.0 1.5 2.0 2.5 3.0
-20-18-16-14-12-10-8-6-4-202
Molar Ratio
kcal
/mol
e of
inje
ctan
t
-0.6
-0.4
-0.2
0.0
0 60 120 180 240 300 360 420
Time (min)
µcal
/sec
0.0 0.5 1.0 1.5 2.0 2.5-14
-12
-10
-8
-6
-4
-2
0
Data: NCBP4titrI_NDHModel: OneSitesChi^2 = 209732N 0.9398 ±0.00655K 6.793E6 ±1.058E6∆H -1.184E4 ±131.9∆S -9.119
Molar Ratio
kcal
/mol
e of
inje
ctan
t
CBP-4+NBP-4(1-92) (1:1) titrated with IGF CBP-4+NBP-4(3-82) (1:1) titrated with IGF
-0.4
-0.2
0.0
0 60 120 180 240 300 360
Data: IGFINBP41s_NDHModel: OneSitesChi^2 = 113059N 0.8189 ±0.00806K 1.531E6 ±1.375E5∆H -1.347E4 ±198.6∆S -17.65
Time (min)
µcal
/sec
0.0 0.5 1.0 1.5 2.0 2.5-14
-12
-10
-8
-6
-4
-2
0
Molar Ratio
kcal
/mol
e of
inje
ctan
t
-0.4
-0.3
-0.2
-0.1
0.0
0 60 120 180 240 300 360
Time (min)
µcal
/sec
0.0 0.5 1.0 1.5 2.0 2.5-12
-10
-8
-6
-4
-2
0
2
Data: IGFIminiBP_NDHModel: OneSitesChi^2 = 69710.5N 0.7625 ±0.00434K 7.957E6 ±8.808E5∆H -1.036E4 ±92.11∆S -3.759
Molar Ratio
kcal
/mol
e of
inje
ctan
t
IGF titrated with NBP-4(3-82) IGF titrated with miniNBP-5
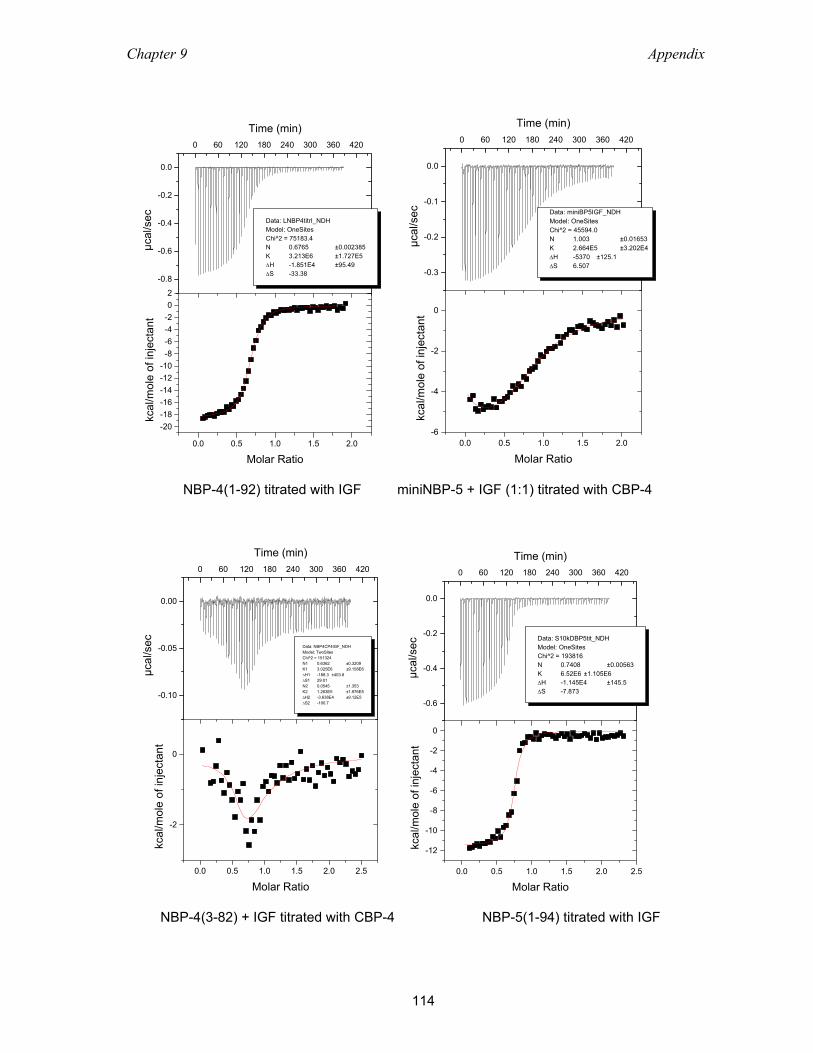
Chapter 9 Appendix
114
-0.8
-0.6
-0.4
-0.2
0.0
0 60 120 180 240 300 360 420
Data: LNBP4titrI_NDHModel: OneSitesChi^2 = 75183.4N 0.6765 ±0.002385K 3.213E6 ±1.727E5∆H -1.851E4 ±95.49∆S -33.38
Time (min)
µcal
/sec
0.0 0.5 1.0 1.5 2.0
-20-18-16-14-12-10-8-6-4-202
Molar Ratio
kcal
/mol
e of
inje
ctan
t
-0.3
-0.2
-0.1
0.0
0 60 120 180 240 300 360 420
Data: miniBP5IGF_NDHModel: OneSitesChi^2 = 45594.0N 1.003 ±0.01653K 2.664E5 ±3.202E4∆H -5370 ±125.1∆S 6.507
Time (min)
µcal
/sec
0.0 0.5 1.0 1.5 2.0-6
-4
-2
0
Molar Ratio
kcal
/mol
e of
inje
ctan
t
NBP-4(1-92) titrated with IGF miniNBP-5 + IGF (1:1) titrated with CBP-4
-0.10
-0.05
0.00
0 60 120 180 240 300 360 420
Data: NBP4CP4IGF_NDHModel: TwoSitesChi^2 = 151324N1 0.6362 ±0.3209K1 3.025E6 ±9.158E6∆H1 -188.3 ±403.8∆S1 29.01N2 0.0545 ±1.353K2 1.263E5 ±1.976E5∆H2 -3.638E4 ±9.12E5∆S2 -100.7
Time (min)
µcal
/sec
0.0 0.5 1.0 1.5 2.0 2.5
-2
0
Molar Ratio
kcal
/mol
e of
inje
ctan
t
-0.6
-0.4
-0.2
0.0
0 60 120 180 240 300 360 420
Data: S10kDBP5tit_NDHModel: OneSitesChi^2 = 193816N 0.7408 ±0.00563K 6.52E6 ±1.105E6∆H -1.145E4 ±145.5∆S -7.873
Time (min)
µcal
/sec
0.0 0.5 1.0 1.5 2.0 2.5
-12
-10
-8
-6
-4
-2
0
Molar Ratio
kcal
/mol
e of
inje
ctan
t
NBP-4(3-82) + IGF titrated with CBP-4 NBP-5(1-94) titrated with IGF
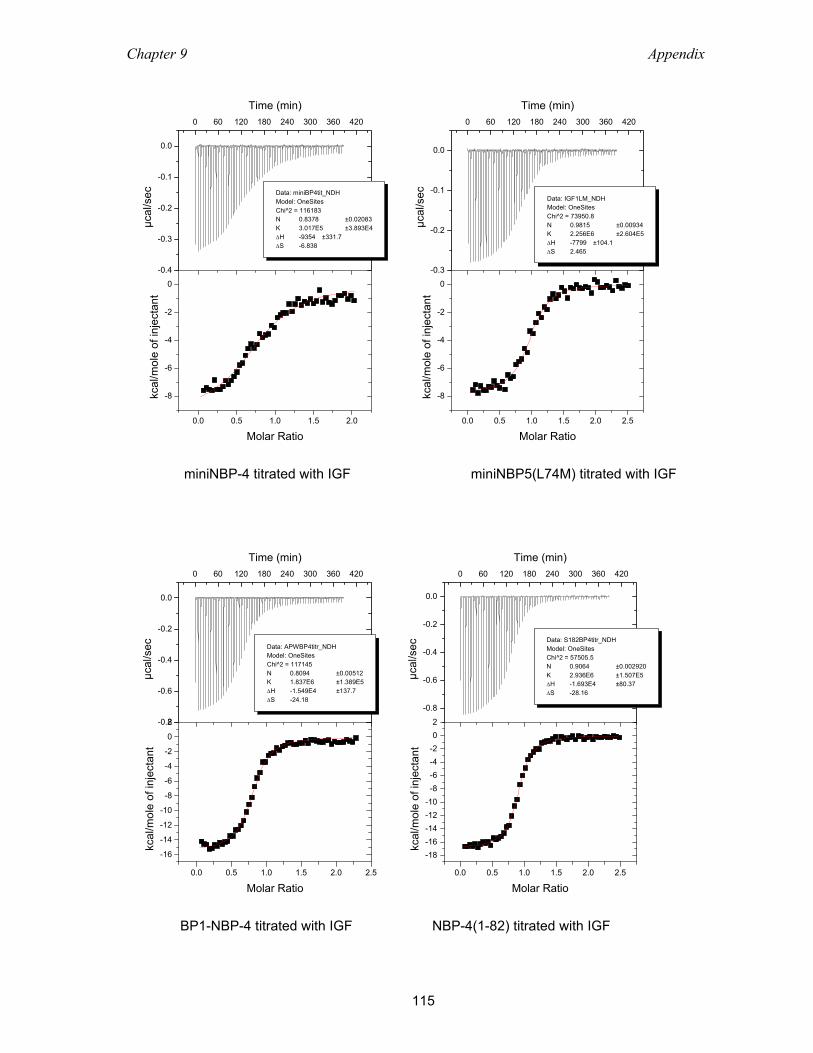
Chapter 9 Appendix
115
-0.4
-0.3
-0.2
-0.1
0.0
0 60 120 180 240 300 360 420
Data: miniBP4tit_NDHModel: OneSitesChi^2 = 116183N 0.8378 ±0.02083K 3.017E5 ±3.893E4∆H -9354 ±331.7∆S -6.838
Time (min)
µcal
/sec
0.0 0.5 1.0 1.5 2.0
-8
-6
-4
-2
0
Molar Ratio
kcal
/mol
e of
inje
ctan
t
-0.3
-0.2
-0.1
0.0
0 60 120 180 240 300 360 420
Data: IGF1LM_NDHModel: OneSitesChi^2 = 73950.8N 0.9815 ±0.00934K 2.256E6 ±2.604E5∆H -7799 ±104.1∆S 2.465
Time (min)
µcal
/sec
0.0 0.5 1.0 1.5 2.0 2.5
-8
-6
-4
-2
0
Molar Ratiokc
al/m
ole
of in
ject
ant
miniNBP-4 titrated with IGF miniNBP5(L74M) titrated with IGF
-0.8
-0.6
-0.4
-0.2
0.0
0 60 120 180 240 300 360 420
Data: APWBP4titr_NDHModel: OneSitesChi^2 = 117145N 0.8094 ±0.00512K 1.837E6 ±1.389E5∆H -1.549E4 ±137.7∆S -24.18
Time (min)
µcal
/sec
0.0 0.5 1.0 1.5 2.0 2.5
-16
-14
-12
-10
-8
-6
-4
-2
0
2
Molar Ratio
kcal
/mol
e of
inje
ctan
t
-0.8
-0.6
-0.4
-0.2
0.0
0 60 120 180 240 300 360 420
Data: S182BP4titr_NDHModel: OneSitesChi^2 = 57505.5N 0.9064 ±0.002920K 2.936E6 ±1.507E5∆H -1.693E4 ±80.37∆S -28.16
Time (min)
µcal
/sec
0.0 0.5 1.0 1.5 2.0 2.5
-18-16-14-12-10-8-6-4-202
Molar Ratio
kcal
/mol
e of
inje
ctan
t
BP1-NBP-4 titrated with IGF NBP-4(1-82) titrated with IGF
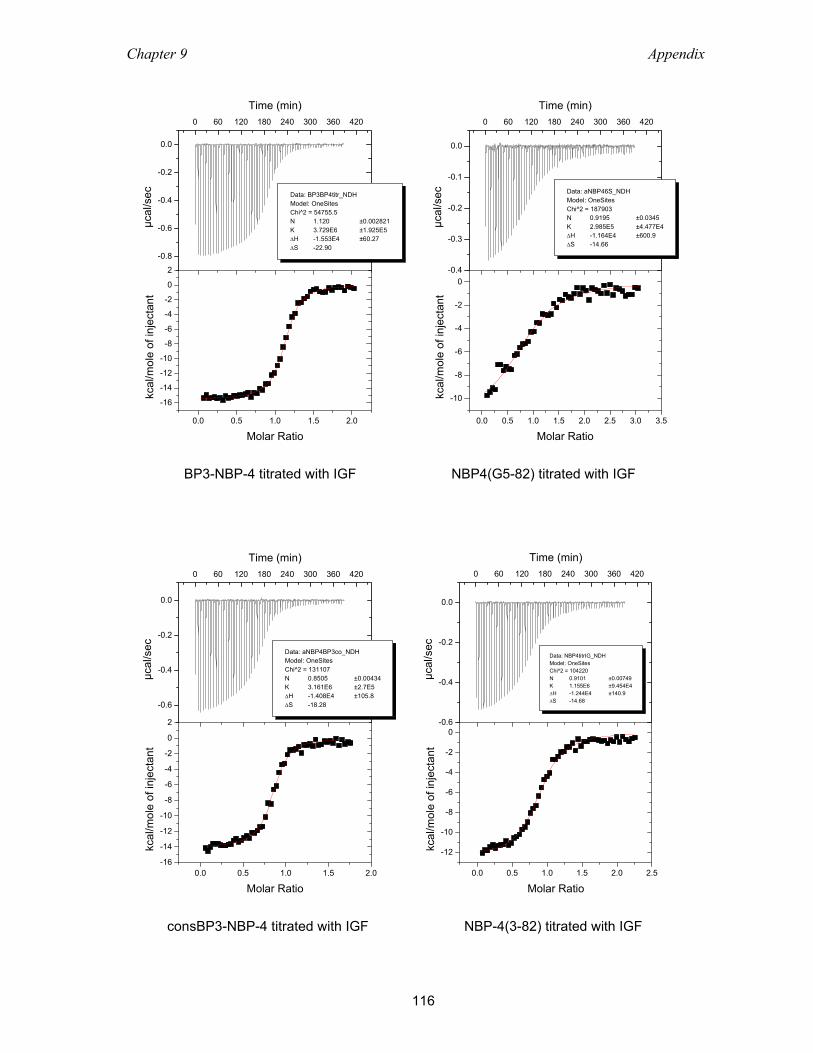
Chapter 9 Appendix
116
-0.8
-0.6
-0.4
-0.2
0.0
0 60 120 180 240 300 360 420
Data: BP3BP4titr_NDHModel: OneSitesChi^2 = 54755.5N 1.120 ±0.002821K 3.729E6 ±1.925E5∆H -1.553E4 ±60.27∆S -22.90
Time (min)
µcal
/sec
0.0 0.5 1.0 1.5 2.0
-16
-14
-12
-10
-8
-6
-4
-2
0
2
Molar Ratio
kcal
/mol
e of
inje
ctan
t
-0.4
-0.3
-0.2
-0.1
0.0
0 60 120 180 240 300 360 420
Data: aNBP46S_NDHModel: OneSitesChi^2 = 187903N 0.9195 ±0.0345K 2.985E5 ±4.477E4∆H -1.164E4 ±600.9∆S -14.66
Time (min)
µcal
/sec
0.0 0.5 1.0 1.5 2.0 2.5 3.0 3.5
-10
-8
-6
-4
-2
0
Molar Ratiokc
al/m
ole
of in
ject
ant
BP3-NBP-4 titrated with IGF NBP4(G5-82) titrated with IGF
-0.6
-0.4
-0.2
0.0
0 60 120 180 240 300 360 420
Data: aNBP4BP3co_NDHModel: OneSitesChi^2 = 131107N 0.8505 ±0.00434K 3.161E6 ±2.7E5∆H -1.408E4 ±105.8∆S -18.28
Time (min)
µcal
/sec
0.0 0.5 1.0 1.5 2.0-16
-14
-12
-10
-8
-6
-4
-2
0
2
Molar Ratio
kcal
/mol
e of
inje
ctan
t
-0.6
-0.4
-0.2
0.0
0 60 120 180 240 300 360 420
Data: NBP4titrIG_NDHModel: OneSitesChi^2 = 104220N 0.9101 ±0.00749K 1.155E6 ±9.454E4∆H -1.244E4 ±140.9∆S -14.68
Time (min)
µcal
/sec
0.0 0.5 1.0 1.5 2.0 2.5
-12
-10
-8
-6
-4
-2
0
Molar Ratio
kcal
/mol
e of
inje
ctan
t
consBP3-NBP-4 titrated with IGF NBP-4(3-82) titrated with IGF
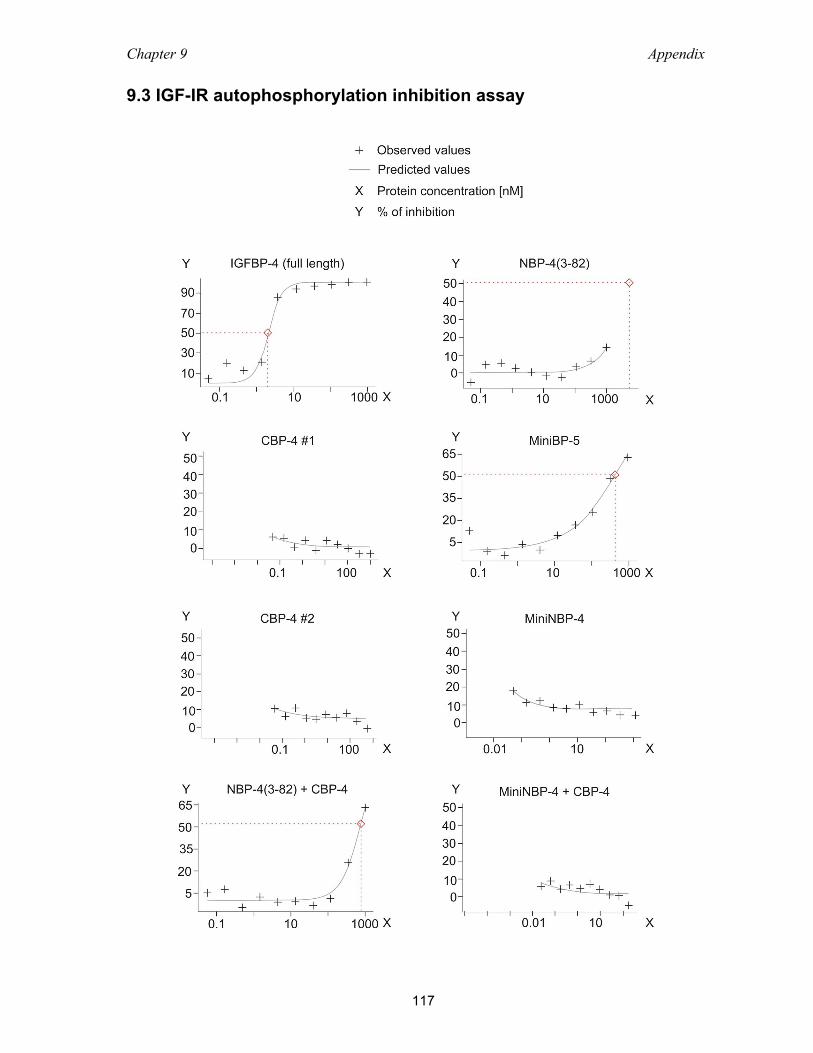
Chapter 9 Appendix
117
9.3 IGF-IR autophosphorylation inhibition assay
Chapter 10 References
118
10 References Adams, M.J., Blundell, T.L., Dodson, E.J., Dodson, G.G., Vijayan, M., Baker, E.N., Harding, M.M., Hodgkin, D.C., Rimmer, B. and Sheat, S. (1969) Structure of rhombohedral 2 zinc insulin crystals. Nature, 224, 491. Adams, T.E., Epa, V.C., and Garrett, T.P.J. (2000) Structure of the type I insulin-like growth factor receptor. Cell. Mol. Life Sci. 57, 1050–93. Ali, O., Cohen, P., and Lee, K.W. (2003) Epidemiology and biology of insulin-like growth factor binding protein-3 (IGFBP-3) as an anti-cancer molecule. Hor. Met. Res. 35, 726-733. Andress, D.L., and Birnbaum, R.S. (1992) Human osteoblast-derived insulin-like growth factor (IGF) binding protein-5 stimulates osteoblast mitogenesis and potentiates IGF action. J. Biol Chem. 267, 22467-72. Andress, D.L. (1995) Heparin modulates the binding of insulin-like growth factor (IGF) binding protein-5 to a membrane protein in osteoblastic cells. J. Biol. Chem. 47, 28289–28296. Andress, D.L., Loop, S.M., Zapf, J., and Kiefer, M.C. (1993) Carboxy-truncated insulin-like growth factor binding protein-5 stimulates mitogenesis in osteoblast-like cells. Biochem. Biophys. Res. Commun. 195, 25-30. Arteaga, C.L, Kitten, L.J., Coronado, E.B., Jacobs, S., Kull Jr., F.C., and Osborne, K. (1989) Blockade of the type I somatomedin receptor inhibits growth of human breast cancer cells in athymic mice. J. Clin. Invest. 84, 1418-1423. August, G.P., Nissley, S.P., Kasuga, M., Lee, L., Greenstein, L., and Rechler, M.M. (1983) Purification of an insulin-like growth factor II receptor from rat chondrosarcoma cells. J. Biol. Chem. 258, 9033-6. Babajko, S., and Binoux, M. (1996) Modulation by retinoic acid of insulin-like growth factor (IGF) and IGF binding protein expression in human SK-N-SH neuroblastoma cells. E. J. Endocrinology, 134, 474–480. Bach, L.A., (1999) The insulin-like growth factor system: basic and clinical aspects. Aust. N.Z. J. Med. 29, 355-361. Bach, L.A., and Rechler, M.M. (1995) Insulin-like growth factor binding proteins. Diabetes Rev. 3, 38-61. Bach, L.A., Hsieh, S., Sakano, K., Fujiwara, H., Perdue, J.F., and Rechler, M.M. (1993) Binding of mutants of human insulin-like growth factor II to insulin-like growth factor binding proteins 1–6. J. Biol. Chem. 268, 9246–9254. Ballard, F.J., Wallace, J.C., Francis, G.L., Read, L.C., and Tomas, F.M. (1996) Des (1-3)-IGF-I: a truncated form of insulin-like growth factor-I. Int. J. Biochem. Cell. Biol. 28, 1085-7. Baserga, R. (1995) The insulin-like growth factor I receptor: a key to tumor growth? Cancer Res. 55, 249-52.
Chapter 10 References
119
Baxter, R.C. (1988) Characterisation of the acid-labile subunit of the growth hormone-dependent insulin-like growth factor binding protein complex. J. Clin. Endocrinol. Metab. 67, 265-72. Baxter, R.C. (1991) Insulin-like growth factor (IGF) binding proteins: the role of serum IGFBPs in regulating IGF availability. Acta Paediatr. Scand. 372, 107-14. Baxter, R.C. (1994) Insulin-like growth factor binding proteins in the human circulation: a review. Horm. Res. 42, 140-4. Baxter, R.C. (2000). Insulin-like growth factor (IGF)-binding proteins: interactions with IGFs and intrinsic bioactivities. Am. J. Physiol. 278, E967–E976. Baxter, R.C., Bayne, M.L., and Cascieri, M. A. (1992) Structural determinants for binary and ternary complex formation between insulin-like growth factor-I (IGF-I) and IGF binding protein-3. J. Biol. Chem. 267, 60-65. Baxter, R.C., Martin, J.L., Tyler, M.I., and Howden, M.E. (1986) Growth-hormone-dependent insulin-like growth factor (IGF) binding protein from human plasma differs from other human IGF binding proteins. Biochem. Biophys. Res. Commun. 139, 1256-61. Bayes-Genis, A., Schwartz, R.S., Lewis, D.A., Overgaard, M.T., Christiansen, M., Oxvig, C., Ashai, K., Holmes, D.R., and Conover, C.A. (2001) Insulin-like growth factor binding protein-4 protease produced by smooth muscle cells increases in the coronary artery after angioplasty. Arteriosclerosis, Thrombosis, and Vascular Biology, 21, 335–341. Bayne, M.L., Applebaum, J., Chicchi, G.G., Miller, R.E., and Cascieri, M.A. (1990) The roles of tyrosine 24, 31, and 60 in the high affinity binding of insulin-like growth factor-I and the type 1 insulin-like growth factor receptor. J. Biol. Chem. 265, 15648-15652. Beck, K.D., Knusel, B., and Hefti, F. (1993) The nature of the trophic action of brain- derived neurotrophic factor des(1-3)-insulin-like growth factor-1, and basic fibroblast growth factor on mesencephalic dopaminergic neurons developing in culture. Neurosci. 52, 855-66. Binoux, M., lalou, C., and Mohseni-Zadeh, S. (1999) Biological actions of proteolytic fragments of the IGF binding proteins. In The IGF System: Molecular Biology, Physiology and Clinical Applications. M. Ron G. Rosenfeld, and J. Charles T. Roberts, Phd (eds.) Humana Press, Totowa, New Jersey. 281-313. Blundell, T. L., Bedarkar, S., Rinderknecht, E. and Humbel, R. E. (1978) Insulin-like growth factor: a model for tertiary structure accounting for immunoreactivity and receptor binding, Proc. Natl Acad. Sci. USA, 75, 180 184. Bohannon, N.J., Corp, E.S., Wilcox, B.J., Figlewicz, D.P., Dorsa, D.M., and Baskin, D.G. (1988) Localisation of binding sites for insulin-like growth factor-I (IGF-I) in the rat brain by quantitative autoradiography. Brain Res. 444, 205-13. Boisclair, Y.R., Rhoads, R.P., Ueki, I. Wang, J. and. Ooi, G.T. (2001) Regulation of the acid-labile subunit of the 150-kDa IGF-binding protein complex and its role in the circulating IGF system. J. Anim. Sci. 79, E41-E47. Boldt, H.B., Overgaard, M.T., Laursen, L.S., Weyer, K., Sottrup-Jensen, L., and Oxvig, C. (2001) Mutational analysis of the proteolytic domain of pregnancy-associated plasma protein-A (PAPP-A): classification as a metzincin. Biochemical Journal, 358, 359–367.

Chapter 10 References
120
Booth, B.A., Boes, M., Andress, D.L., Dake, B.L., Kiefer, M.C., Maack, C., Linhardt, R.J., Bar, K., Caldwell, E.E., Weiler, J. et al. (1995) IGFBP-3 and IGFBP-5 association with endothelial cells: role of C-terminal heparin binding domain. Growth Regulation, 5, 1–17. Bramani, S., Song, H., Beattie, J., Tonner, E., Flint, D.J., and Allan, G.J. (1999) Amino acids within the extracellular matrix (ECM) binding region (201-218) of rat insulin-like growth factor binding protein (IGFBP)-5 are important determinants in binding IGF-I. J. Mol. Endocrinol. 23, 117-123. Branden, C. and Tooze, J. (1999) Introduction to Protein Structure. Garland Publ., New York. Braulke, T. (1999) Type-2 IGF receptor: a multi-ligand binding protein. Hormone and Metabolism Research, 31, 242–246. Brünger, A.T., Adams, P.D., Clore, M.G., DeLano, W.L., Gros, P., Grosse-Kunstleve, R.W., Jiang, J., Kuszewski, J., Nilges, M., Pannu, N.S., Read, R.J., Rice, L.M., Simonson, T., and Warren, G.L. (1998) Crystallography and NMR System – A new software suite for macro-molecular structure determination. Acta Crystallogr. D 54, 905-921. Brzozowski, A.M., Dodson, E.J., Dodson, G.G., Murshudov, G.N., Verma, C., Turkenburg, J.P., de Bree, F.M., and Dauter, Z. (2002) Structural origins of the functional divergence of human insulin-like growth factor-I and insulin. Biochemistry 41, 9389-939. Buckbinder, L., Talbott, R., Velasco-Miguel, S., Takenaka, I., Faha, B., Seizinger, B.R., and Kley, N. (1995) Induction of the growth inhibitor IGF-binding protein 3 by p53. Nature, 377, 646-649. Buckway, C.K., Wilson, E.M., Ahlsen, M., Bang, P., Oh, Y., and Rosenfeld, R.G. (2001) Mutation of three critical amino acids of the N-terminal domain of IGF-binding protein-3 essential for high affinity IGF binding. J. Clin. Endoc. & Metabol. 86. 4943-4950. Bunn, R.C., and Fowlkes, J.L. (2003) Insulin-like growth factor binding protein proteolysis. Trends Endoc. & Metabol. 14, 176-181. Burgess, S.K., Jacobs, S., Cuatrecasas, P., and Sahyoun, N. (1987) Characterisation of a neuronal subtype of insulin-like growth factor-I receptor. J. Biol. Chem. 262, 1618-22. Burstein, E.A., Vedenkina, N.S., and Ivkova, M.N. (1973) Fluorescence and the location of tryptophan residues in protein molecules. Photochem. Photobiol. 18, 263–279. Burtrum, D., Zhu, Z., Lu, D., Anderson, D.M., Prewett, M., Pereira, D.S., Bassi, R., Abdullah, R., Hooper, A.T., Koo, H., Jimenez, X., Johnson, D., Apblett, R., Kussie, P., Bohlen, P., Witte, L., Hicklin, D.J., and Ludwig, D.L. (2003) A fully human monoclonal antibody to the insulin-like growth factor I receptor blocks ligand-dependent signaling and inhibits human tumor growth in vivo. Cancer Research, 63, 8912–8921. Butt, A.J., Firth, S.M., King, M.A., and Baxter, R.C. (2000) Insulin-like growth factor-binding protein-3 modulates expression of Bax and Bcl-2 and potentiates p53-independent radiation-induced apoptosis in human breast cancer cells. J. Biol. Chem. 275, 39174-39181. Byun, D., Mohan, S., Baylink, D.J., and Qin, X. (2001a) Localization of the IGF binding domain and evaluation of the role of cysteine residues in IGF binding in IGF binding protein-4. Journal of Endocrinology, 169, 135–143.
Chapter 10 References
121
Byun, D., Mohan, S., Yoo, M., Sexton, C., Baylink, D.J., and Qin, X. (2001b) Pregnancy-associated plasma protein-A accounts for the insulin-like growth factor (IGF)-binding protein-4 (IGFBP-4) proteolytic activity in human pregnancy serum and enhances the mitogenic activity of IGF by degrading IGFBP-4 in vitro. Journal of Clinical Endocrinology and Metabolism, 86, 847–854. Carlsson–Skwirut, C., Jornvall, H., Holmgren, A., Andersson, C., Bergman, T., Lundquist, B., and Sara, V.R. (1986) Isolation and characterisation of variant IGF-I as well as IGF-2 from adult human brain. FEBS Lett. 201, 46-50. Carlson-Skwirut, C., Lake, M., Hartmanis, M., Hall, K., and Sara, V.R. (1989) A comparison of the biological activity of the recombinant intact, and truncated insulin-like growth factor 1 (IGF-1). Biochim. Biophys. Acta. 1011, 192-7. Carrick, F.E., Forbes, B.E., and Wallace, J.C. (2001) BIAcore analysis of bovine insulin-like growth factor (IGF)-binding protein-2 identifies major IGF binding site determinants in both the amino- and carboxyl-terminal domains. J. Biol. Chem. 276, 27120-27128. Carrick, F.E., Wallace, J.C., and Forbes, B.E. (2002) The interaction of Insulin-like growth factors (IGFs) with Insulin-like growth factor binding proteins (IGFBPs): a review. Lett. Pep. Sci. 8, 147–153. Cascieri, M.A., Chicchi, G.C., Applebaum, J., Hazes, N.S., Green, B.C., and Bayne, M.L. (1988). Mutants of human insulin-like growth factor I with reduced affinity for the type I insulin-like growth factor receptor. Biochemistry, 27, 3229-3233. CCP4, Collaborative Computational Project, Number 4. (1994) The CCP4 Suite: Programs for protein crystallography. Acta Cryst., D50, 760-763. Chan, K., and Spencer, E.M. (1998) Megakaryocytes endocytose insulin-like growth factor (IGF) I and IGF-binding protein-3: a novel mechanism directing them into alpha granules of platelets. Endocrinology, 139, 559-65. Chan, J.M., Stampfer, M.J., Giovannucci, E., Gann, P.H., Ma, J., Wilkinson, P., Henneken, C.H., and Pollak, M. (1998) Plasma insulin-like growth factor-I and prostate cancer risk: A prospective study. Science, 279, 563–566. Chelius, D., Baldwin, M.A., Lu, X., and Spencer, E.M. (2001) Expression, purification and characterization of the structure and disulfide linkages of insulin-like growth factor binding protein-4. J. Endocrinol. 168, 283-96. Chen, C., Zhu, Y.F., Liu, X.J., Lu, Z.X., Xie, Q., and Ling, N. (2001) Discovery of a series of nonpeptide small molecules that inhibit the binding of insulin-like growth factor (IGF) to IGF-binding proteins. J Med Chem. 44,:4001-10. Chernausek, S.D., Smith, C.E., Duffin, K.L., Busby, W.H., Wright, G., and Clemmons, D.R (1995) Proteolytic cleavage of insulin-like growth factor binding protein 4 (IGFBP-4) Localization of cleavage site to non-homologous region of native IGFBP-4. J. Biol. Chem. 270, 11377-11382. Cheung, P.T., Wu, J., Banach, W., and Chernausek, S.D. (1994) Glucocorticoid regulation of an insulin-like growth factor-binding protein-4 protease produced by a rat neuronal cell line. Endocrinology, 135, 1328-35.

Chapter 10 References
122
Chorney, M.J., Chorney, K., Seese, N., Owen, M.J., and Daniels, J.(1998) A quantitative trait locus associated with cognitive ability in children. Psych. Sci. 9, 159–166. Chung, C.T. Niemela, S.L., Miller, R.H. (1989) One-step preparation of competent Escherichia coli: Transformation and storage of bacterial cells in the same solution PNAS, 86, 2172-2175. Clemmons, D.R., Cascieri, M.A., Camacho-Hübner, C., Mc-Cusker, R.H., and Bayne, M.L. (1990) Discrete alterations of the insulin-like growth factor I molecule which alter its affinity for insulin-like growth factor-binding proteins result in changes in bioactivity. J. Biol. Chem. 265, 12210–12216. Clemmons, D.R. (1999) IGF binding proteins and extracellular matrix. In Rosenfeld, R.G., and Roberts, C.T. (eds), The IGF system. Molecular biology, physiology, and clinical applications. Humana Press, Totowa, pp. 273-279. Clemmons, D.R. (2001) Use of mutagenesis to probe IGF-binding protein structure/function relationships. Endocr. Rev. 22, 800-817. Cohen, P., Graves, H.C., Peehl, D.M., Kamarei, M., Guidice, L.C., and Rosenfeld, R.G. (1992) Prostate-specific antigen (PSA) is an insulin-like growth factor binding protein-3 protease found in seminal plasma. J. Clin. Endocrinol. Metab. 75, 1046-53. Cohen, P., Lamson, G., Okajima, T., and Rosenfeld, R.G. (1993) Transfection of the human insulin-like growth factor binding protein-3 gene into Balb/c fibroblasts inhibits cellular growth. Mol. Endocrinol. 7, 380-386. Cohen, P., Peehl, D.M., Graves, H.C., and Rosenfeld, R.G. (1994) Biological effects of prostate specific antigen as an insulin-like growth factor binding protein-3 protease. J. Endocrinol. 142, 407-15. Cohen, P., Clemmons, D.R., and Rosenfeld, R.G. (2000) Does the GH-IGF axis play a role in cancer pathogenesis? Growth Hor. IGF Res. 10, 297-305. Cole, M.D. (1986) The myc oncogene: its role in transformation and differentiation. Annu. Rev. Genet. 20, 361-84. Conover, C.A., Oxvig, C., Overgaard, M.T., Christiansen, M., and Giudice, L.C. (1999) Evidence that the insulin-like growth factor binding protein-4 protease in human ovarian follicular fluid is pregnancy associated plasma protein-A. Journal of Clinical Endocrinology and Metabolism, 84, 4742–4745. Conover, C.A., Faessen, G.F., Ilg, K.E., Chandrasekher, Y.A., Christiansen, M., Overgaard, M.T., Oxvig, C., and Giudice, L.C. (2001) Pregnancy-associated plasma protein-A is the insulin-like growth factor binding protein-4 protease secreted by human ovarian granulosa cells and is a marker of dominant follicle selection and the corpus luteum. Endocrinology, 142, 2155. Cooke, R.M., Harvey, T.S., and Campbell, I.D. (1991) Solution structure of human insulin-like growth factor 1: a nuclear magnetic resonance and restrained molecular dynamics study. Biochemistry, 30, 5484-5491. Datta, S.R., Dudeck, H., Tao, X., Masters, S., Fu, H., Gotoh, Y., and Greenberg, M.E. (1997) Akt phosphorylation of BAD couples’ survival signals to intrinsic machinery. Cell, 91, 231-41.

Chapter 10 References
123
Daughaday, W.H., Hall, K., Raben, M.S., Salmon Jr., W.D., Van den Brande, J.L., and Van Wyk, J.J. (1972) Somatomedin: proposed designation for sulphation factor. Nature, 235, 107. Daughaday, W., and Salmon Jr, W.D. (1999) Historical perspective: the origins and development of the somatomedin hypothesis. In The IGF system: Molecular bilogy, physiology and clinical applications. Rosenfeld, R.G., and Roberts, C.T. (eds),. Humana Press, Totowa, New Jersey. 1-15. Delbé, J., Blat, C., Desauty, G., and Harel, L. (1991) Presence of IDF45 (mIGFBP-3) binding sites on chick emryo fibroblasts. Biochem Biophys. Res. Commun. 179, 495-501. De Meyts, P., Wallach, B., Christoffersen, C.T., Urso, B., Gronskov, K., Latus, L.J., Yakushiji, F., Ilondo, M.M., and Shymko, R.M. (1994) The insulin-like growth factor-I receptor: Structure, ligand-binding mechanism and signal transduction. Horm. Res. 42, 152-69. Drenth, J. (1994) Principles of protein X-ray crystallography. Springer-Verlag, New York Du, K., and Montminy, M. (1998) CREB is a regulatory target for the protein kinase Akt/PKB. J. Biol. Chem. 273, 32377-9. Dubaquie, Y. and Lowman, H.B. (1999) Total alanine-scanning mutagenesis of insulin-like growth factor I (IGF-I) identifies differential binding epitopes for IGFBP-1 and IGFBP-3. Biochemistry, 38, 6386-96. Fanayan, S., Firth, S.M., Butt, A.J., and Baxter, R.C. (2000) Growth inhibition by insulin-like growth factor binding protein-3 in T47D breast cancer cells requires transforming growth factor-β (TGF-β) and type II TGF-β receptor. J. Biol. Chem. 275, 39146-39151. Firth, S.M., and Baxter, R.C. (2002) Cellular actions of the insulin-like growth factor binding proteins. Endocr. Rev. 23, 824-854 Firth, S.M., Clemmons, D.R., and Baxter, R.C. (2001) Mutagenesis of basic amino acids in the carboxyl-terminal region of insulin-like growth factor binding protein-5 affects acid-labile subunit binding. Endocrinology, 14, 2147-2150. Firth, S.M., Ganeshprasad, U., and Baxter, R.C. (1998) Structural determinants of ligand and cell surface binding of insulin-like growth factor-binding protein-3. J. Biol. Chem. 273, 2631-2638. Forbes, B., Szabo, L., Baxter, R.C., Ballard, F.J., and Wallace, J.C. (1988) Classification of the insulin-like growth factor binding proteins into three distinct categories according to their binding specificities. Biochem. Biophys. Res. Commun. 157, 196–202. Forbes, B.E., Turner, D., Hodge, S.J., McNeil, K.A., Forsberg, G., and Wallace, J.C. (1998) Localization of an insulin-like growth factor (IGF) binding site of bovine IGF binding protein-2 using disulfide mapping and deletion mutation analysis of the C-terminal domain. J. Biol. Chem. 273, 4647-4652. La Fortelle, E. de and Bricogne, G. (1997) Maximum-likelihood heavy-atom parameter refinement in MIR and MAD methods. Meth. Enzym. 276, 472-494. Fowlkes, J., and Freemark, M. (1992) Evidence for a novel insulin-like growth factor (IGF)-dependent protease regulating IGF-binding protein-4 in dermal fibroblasts. Endocrinology, 131, 2071-2076.
Chapter 10 References
124
Francis, G.L., Upton, F.M., Ballard, F.J., McNeil, K.A., and Wallace, J.C. (1988) Insulin-like growth factors 1 and 2 in bovine colostrum. Sequences and biological activities compared with those of a potent truncated form. Biochemical J. 251, 95-103. Frost, R.A., and Tseng L. (1991) Insulin-like growth factor binding protein-1 is phosphorylated by cultured human endometrial stromal cells and multiple protein kinases in vitro. J. Biol. Chem. 266, 18082-18088. Furstenberger, G., and Senn, H.J. (2002) Insulin-like growth factors and cancer. Lancet Oncol. 3, 298. Galanis, M., Firth, S.M., Bond, J., Nathanielsz, A., Kortt, A.A., Hudson, P.J., and Baxter, R.C. (2001) Ligand- binding characteristics of recombinant amino- and carboxyl-terminal fragments of human insulin-like growth factor-binding protein-3. J. Endocrinol. 169, 123-133. Gallicchio, M.A., Kneen, M., Hall, C., Scott, A.M., and Bach, L.A. (2001) Overexpression of insulin-like growth factor binding protein-6 inhibits rhabdomyosarcoma growth in vivo. Int. J. Cancer. 94, 645-651. Garrett, T.P., McKern, N.M., Lou, M., Frenkel, M.J., Bentley, J.D., Lovrecz, G.O., Elleman, T.C., Cosgrove, L.J., and Ward, C.W. (1998) Crystal structure of the first three domains of the type-1 insulin-like growth factor receptor. Nature, 394, 395-9. Giacovazzo, C., Monaco, H.L., Viterbo, D., Scordari, F., Gilli, G., Zanotti, M. and Catti, M. (1992) Fundamentals of crystallography. Oxford University Press, Oxford. Gill, S.C., and von Hippel, P.H. (1989) Calculation of protein extinction coefficients from amino acid sequence data. Anal. Biochem. 182, 319-26. Girnita, A., Girnita, L., del Prete, F., Bartolazzi, A., Larsson, O., and Axelson, M. (2004) Cyclolignans as inhibitors of the insulin-like growth factor-1 receptor and malignant cell growth. Cancer Research, 64, 236–42. Grellier, P., Degalle, B., Babajko, S. (1998) Expression of insulin-like growth factor-binding protein 6 complementary DNA alters neuroblastoma cell growth. Cancer Res. 58, 1670-1676. Grzmil, M., Hemmerlein, B., Thelen, P., Schweyer, S., and Burfeind, P. (2004) Blockade of the type I IGF receptor expression in human prostate cancer cells inhibits proliferation and invasion, up-regulates IGF binding protein-3, and suppresses MMP-2 expression. J. Pathol. 202, 50-9. Giudice, L.C., Conover, C.A., Bale, L., Faessen, G.H., Ilg, K., Sun, I., Imani, B., Suen, L.-F., Irwin, J.C., Christiansen, M., Overgaard, M.T., and Oxvig, C. (2002) Identification and Regulation of the IGFBP-4 Protease and Its Physiological Inhibitor in Human Trophoblasts and Endometrial Stroma: Evidence for Paracrine Regulation of IGF-II Bioavailability in the Placental Bed during Human Implantation. The Journal of Clinical Endocrinology & Metabolism, 87, 2359-66. Halloran, B.P., and Spencer, E.M. (1988) Dietary phosphorus and 1,25-dihydroxyvitamin D metabolism: influence of insulin-like growth factor I. Endocrinology, 123, 1225-9. Hashimoto, R., Ono, M., Fujiwara, H., Higashihashi, N., Yoshida, M., Enjohkimura, T., and Sakano, K. (1997) Binding sites and binding properties of binary and ternary complexes of insulin-like growth factor-II (IGF-II), IGF-binding protein-3, and acid-labile subunit. J. Biol. Chem. 272, 27936-42.
Chapter 10 References
125
Hassan, A.B. (2003) Keys to the hidden treasures of the mannose 6-phosphate/insulin-like growth factor 2 receptor. American Journal of Pathology, 162, 3–6. Headey, S.J., Keizer, D.W., Yao, S., Wallace, J.C., Bach, L.A., and Norton, R.S. (2004a) Binding site for the C-domain of insulin-like growth factor (IGF) binding protein-6 on IGF-II; implications for inhibition of IGF actions. FEBS Lett. 568, 19-22. Headey, S.J., Keizer, D.W., Yao, S., Brasier, G., Kantharidid P., Bach, L.A., and Norton, R.S. (2004b) C-terminal domain of insulin-like growth factor binding protein-6: structure and interaction with insulin-like growth factor-II Mol. Endocrinol. 18, 2740-50. Headey, S.J., Leeding, K.S., Norton, R.S., and Bach, L.A. (2004c) Contributions of the N- and C-terminal domains of IGF binding protein-6 to IGF binding. J. Mol. Endocr. 33, 377-86. Heidenreich, K.A., Freidenberg, G.R., Figlewicz, D.P., and Gilmore, P.R. (1986) Evidence for a subtype of insulin-like growth factor I receptor in brain. Regul. Pept. 15, 301-10. Hernandez-Sanchez, C., Blakesley, V., Kalebic, T., Helman, L., and LeRoith, D. (1995) The role of the tyrosine kinase domain of the insulin-like growth factor-I receptor in intracellular signalling, cellular proliferation and tumorgenesis. J. Biol. Chem. 270, 29176-81. Ho, P.J., and Baxter, R.C. (1997) Characterization of truncated insulin-like growth factor-binding protein-2 in human milk. Endocrinology, 138, 3811-3818. Hodgson, D.R., May, F.E.B., and Westley, B.R. (1996) Involvement of phenylalanine 23 in the binding of IGF-1 to the insulin and type I IGF receptor. Regul. Pept. 66, 191-196. Hoeck, W.G., and Mukku, V.R. (1994) Identification of the major sites of phosphorylation in IGF binding protein-3. J. Cell. Biochem. 56, 262-273. Hoppe, W. (1957) Die Faltmolekülmethode: eine neue Methode zur Bestimmung der Kristallstruktur bei ganz oder teilweise bekannten Molekülstrukturen. Acta Cryst. 10, 750-1. Huang, S.S., Leal, S.M., Chen, C-L., Liu, I-H., and Huang, J.S. (2004) Identification of insulin receptor substrate proteins as key molecules for the TβR-V/LRP-1-mediated growth inhibitory signaling cascade in epithelial and myeloid cells. FASEB, 18, 1230-54. Huber, R. (1965) Die automatisiere Faltmolekülmethode. Acta Cryst. 19, 353-6. Humbel, R.E. (1990) Insulin-like growth factor-I, and II. Eur. J. Biochem. 190, 445-62. Hwa, V., Oh, Y., Burren, C.P., Choi, W.K., Graham, D.L., Ingermann, A., Kim, H.S., Lopez-Bermejo, A., Minniti, G., Nagalla, S.R., Pai, K., Spagnoli, A., Vorwerk, P., Wanek, D.L.V., Wilson, E.M., Yamanaka, Y., Yang, D.H., and Rosenfeld, R.G. (1999) The IGF binding protein superfamily. In Rosenfeld, R.G., and Roberts, C.T. (eds), The IGF system. Molecular biology, physiology, and clinical applications. Humana Press, Totowa, pp. 315-327. Imai, Y., Moralez, A., Andag, U., Clarke, J.B., Busby, W.H., and Clemmons, D.R. (2000) Substitutions for hydrophobic amino acids in the N-terminal domains of IGFBP-3 and-5 markedly reduce IGF-I binding and alter their biologic actions. J. Biol. Chem. 275, 18188-94. Jones, J.I., D'Ercole, A.J., Camacho-Hubner, C., and Clemmons, D.R. (1991) Phosphorylation of insulin-like growth factor (IGF)-binding protein 1 in cell culture and in vivo: effects on affinity for IGF-I. Proc. Natl. Acad. Sci. U S A, 88, 7481-5.
Chapter 10 References
126
Jones, J.L., Gockerman, A., Busby, W.H., Wrigh, G. and Clemmons, D.R. (1993) Insulin-like growth factor binding protein 1 stimulates cell migration and binds to the a5b integrin receptor by means of its Arg-Gly-Asp sequence. Proc. Natl. Acad. Sci. USA, 90, 10553-7. Jones, J.L., and Clemmons, D.R. (1995) Insulin-like growth factors and their binding proteins: biological actions. Endocr. Rev. 16, 3-34. Jung, G.W., Spencer, E.M., and Lue, T.F. (1998) Growth hormone enhances regeneration of nitric oxide synthase-containing penile nerves after cavernous nerve neurotomy in rats. Journal of Urology, 160, 1899-904 Kabsch, W. (1993) Automatic processing of rotation diffraction data from crystals of initially unknown symmetry and cell constants. J. Appl. Cryst. 26, 795-800. Kalus, W., Zweckstetter, M., Renner, C., Sanchez, Y., Georgescu, J., Grol, M., Demuth, D., Schumacher, R., Dony, C., Lang, K., and Holak, T.A. (1998) Structure of the IGF binding domain of the insulin-like growth factor-binding protein-5 (IGFBP-5): implications for IGF and IGF-I receptor interactions. EMBO J. 17, 6558-72. Kanzaki, S., Hilliker, S., Baylink, D.J., and Mohan, S. (1994) Evidence that human bone cells in culture produce insulin-like growth factor-binding protein-4 and –5 proteases. Endocrinology, 134, 383–92. Kelley, K.M., Oh, Y., Gargosky, S.E., Gucev, Z., Matsumoto, T., Hwa, V., Ng, L., Simpson, D.M., and Rosenfeld, R.G. (1996) Insulin-like growth factor-binding proteins (IGFBPs) and their regulatory dynamics. Int. J. Biochem. and Cell Biol. 28, 619–637. Khandwala, H.M., McCutcheon, I.E., Flyvbjerg, A., and Friend, K.E. (2000) The effects of insulin-like growth factors on tumorigenesis and neoplastic growth. Endocr. Rev. 21, 215-44. Kim, B., Cheng, H.L., Margolis, B., and Feldman, E.L. (1998) Insulin receptor substrate 2 and Shc play different roles in insulin-like growth factor-I signalling. J. Biol. Chem. 273, 34543-50. Kim, B., Leventhal, P.S., Saltiel, A.R., and Feldman, E.L. (1997) Insulin-like growth factor-I mediated neurite outgrowth in vitro requires mitogen-activated protein kinase activation. J. Biol. Chem. 272, 21268-73. Knudtson, K.L., Boes, M., Sandra, A., Dake, B.L., Booth, B.A., and Bar, R.S. (2001) Distribution of chimeric IGF binding protein (IGFBP)-3 and IGFBP-4 in the rat heart: importance of C-terminal basic region. Endocrinology, 142, 3749–3755. Kornfeld, S. (1992) Structure and function of the mannose-6-phosphate/Insulin-like growth factor II receptors. Annu. Rev. Biochem. 61, 307-30. Ladokhin, A.S. (2000) Fluorescence Spectroscopy in Peptide and Protein Analysis. in Encyclopedia of Analytical Chemistry, R.A. Meyers (Ed.), pp. 5762–79. Lakowicz, J. 1999. Principles of Fluorescence Spectroscopy. Plenum, New York. Lalou, C., Lassarre, C., and Binoux, M. (1996). A proteolytic fragment of insulin-like growth factor (IGF) binding protein-3 that fails to bind IGFs inhibits the mitogenic effects of IGF-I and insulin. Endocrinology, 137, 3206-12.
Chapter 10 References
127
Lamzin, V.S., and Wilson, K.S. (1993) Automated refinement of protein models. Acta Cryst. D49, 129-47. Landale, E.C., Strong, D.D., Mohan, S. and Baylink, D.J. (1995) Sequence comparison and predicted structure for the four exon-encoded regions of human insulin-like growth factor binding protein 4. Growth Factors, 12, 245–50. Lassarre, C., and Binoux, M. (1994) Insulin-like growth factor binding protein-3 is functionally altered in pregnancy plasma. Endocrinology, 134, 1254–62. Lawrence, J.B., Bale, L.K., Haddad, T.C., Clarkson, J.T., and Conover, C.A. (1999a) Characterization and partial purification of the insulin-like growth factor (IGF)-dependent IGF binding protein-4-specific protease from human fibroblast conditioned media. Growth Hormone and IGF Research, 9, 25–34. Lawrence, J.B., Oxvig, C., Overgaard, M.T., Sottrup-Jensen, L., Gleich, G.J., Hays, L.G., Yates, J.R., and Conover, C.A. (1999b) The insulin-like growth factor (IGF)-dependent IGF binding protein-4 protease secreted by human fibroblasts is pregnancy-associated plasma protein-A. PNAS, 96, 3149–53. Leal, S.M., Huang, S.S., and Huang, J.S. (1999) Interactions of high affinity insulin-like growth factor-binding proteins with the type V transforming growth factor-β receptor in mink lung epithelial cells. J. Biol. Chem. 274, 6711–7. Leal, S.M., Liu, Q., Huang, S.S., and Huang, J.S. (1997) The type V transforming growth factor β receptor is the putative insulin-like growth factor binding protein 3 receptor. J. Biol. Chem. 272, 20572–6. Lee, K-W., Liu, B., Ma, L., Li, H., Bang, P., Koeffler H.P., and Cohen, P. (2004) Cellular Internalization of insulin-like growth factor binding protein-3. J. Biol. Chem. 279, 469–76. LeRoith, D. and Helman, L. (2004) The new kid on the block(ade) of the IGF-1 receptor. Cancer Cell, 5, 201-2. LeRoith, D., Werner, H., Faria, T.N., Kato, H., Adamo, M., and Roberts, C.T. (1993) Insulin-like growth factor receptor: implications for nervous function. Ann. NY Acad. Sci. 692, 22-32. LeRoith, D., Werner, H., Beitner-Johnson, D., and Roberts, C.T. (1995) Molecular and cellular aspects of the insulin-like growth factor I receptor. Endocr. Rev. 16, 143-63. Lesniak, M.A., Hill, J.M., Kiess, W., Rojeski, M., Pert, C.B., and Roth, J. (1988) Receptors for insulin-like growth factors I and II: Autoradiographic localisation in rat brain and comparison to receptors for insulin. Endocrinology, 123, 2089-99. Leventhal, P.S., Russel, J.W., and Feldman, E.L. (1999) IGFs and the nervous system. In The IGF System. R.G. Rosenfeld and C. Roberts (eds). Humana Press, Totowa, New Jersey. Li, W., Fawcett, J., Widmer, H.R., Fielder, P.J., Rabkin, R., and Keller, G.A. (1997) Nuclear transport of insulin-like growt factor-I and insulin-like growth factor binding protein-3 in opossum kidney cells. Endocrinology, 138, 1763-6. Lin, T.M., Galbert, S.P., Kiefer, D., Spellacy, W.N., and Gall, S. (1974) Characterization of four human pregnancy-associated plasma proteins. American Journal of Obstetrics and Gynecology, 118, 223–36.
Chapter 10 References
128
Liu, X.J., Xie, Q., Zhu, Y.F., Chen, C., Ling, N. (2001) Identification of a nonpeptide ligand that releases bioactive insulin-like growth factor-I from its binding protein complex. J. Biol. Chem. 31, 32419-22. Loddick, S.A., Liu, X.J., Lu, Z.X., Liu, C.L., Behan, D.P., Chalmers, D.C., Foster, A.C., Vale, W.W., Ling, N., and Desouza, E.B. (1998) Displacement of insulin-like growth factors from their binding proteins as a potential treatment for stroke. Proc. Nat. Acad. Sci. USA, 95, 1894-8. MacDonald, R.G., Pfeffer, S.R., Coussens, L., Tepper, M.A., Brocklebank, C.M., Mole, J.E., Anderson, J.K., Chen, E., Czech, M.P., and Ulrich, A. (1988) A single receptor binds both insulin-like growth factor II and mannose-6-phosphate. Science, 329, 1134-37. Maile, L.A., Gill, Z.P., Perks, C.M., and Holly, J.M. (1999) The role of cell surface attachment and proteolysis in the insulin-like growth factor (IGF)-independent effects of IGF-binding protein-3 on apoptosis in breast epithelial cells. Endocrinology, 140, 4045-5. Mannhardt, B., Weinzimer, S.A., Wagner, M., Fiedler, M., Cohen, P., Jansen-Durr, P., and Zwerschke, W. (2000) Human papillomavirus type 16 E7 oncoprotein binds and inactivates growth-inhibitory insulin-like growth factor binding protein 3. J. Mol. Cell. Biol. 20, 6483-95. Martin, J. L., Ballesteros, M., and Baxter, R. C. (1992) Insulin-like growth factor-I (IGF-I) and transforming growth factor-beta 1 release IGF-binding protein-3 from human fibroblasts by different mechanisms. Endocrinology 131, 1703–10. Martin, J.L, and Baxter, R.C. (1999) IGF binding proteins as modulators of IGF action. In The IGF system: Molecular bilogy, physiology and clinical applications. M. Ron G. Rosenfeld, and J. Charles T. Roberts, Phd (eds) Humana Press, Totowa, New Jersey. 227-55. Martin, J.L., Coverley, J.A., Pattison, S.T., and Baxter, R.C. (1995) IGFBP-3 and IGFBP-6 production by MCF-7 breast cancer cells: Stimulation by retinoic acid and cyclic AMP, and differential effects of estradiol. Endocrinology 136, 1219–1226. Makrides, S.C. (1996) Strategies for achieving high-level expression of genes in Escherichia coli. Microbiol. Rev., 60, 512-538. Mann, K.G., and Lungblad, R.L. (1982) Biochemistry of thrombin. In: Colman, R.W., Hirsh, J., Marder, V.J., Salzman, E.W. (eds) Hemostasis and Thrombosis. Lippincott, Philadelphia, pp 112–126. Mazerbourg, S., Callebaut, I., Zapf, J., Mohan, S., Overgaard, M., and Monget, P. (2004) Update on IGFBP-4: regulation of IGFBP-4 levels and functions, in vitro and in vivo, Growth Hormone & IGF Research, 14, 71-84. McCusker, R.H., Camacho-Hubner, C., Bayne, M.L., Cascieri, M.A., and Clemmons, D.R. (1990) Insulin-like growth factor (IGF) binding to human fibroblast and glioblastoma cells: the modulating effect of cell released IGF binding proteins (IGFBPs). J Cell Physiol. 144, 244–253. McCusker, R.H., and Clemmons, D.R. (1997) Use of lanthanum to accurately quantify insulin-like growth factor binding to proteins on cell surfaces. J. Cell. Biochem. 66, 256–267. McCusker, R.H., Kaleko, M., Sackett, R.L. (1998) Multivalent cations and ligand affinity of the type 1 insulin-like growth factor receptor on P2A2-LISN muscle cells. J. Cell. Physiol. 176, 392–401. McPherson, A. (1999) Crystallization of Biological Macromolecules. CSHL Press, New York

Chapter 10 References
129
McRee, D.E. (1999) XtalView/Xfit - A versatile program for manipulating atomic coordinates and electron density. J. Struc. Biol. 125, 156-65. Mishra, S., and Murphy, L. J. (2003) Phosphorylation of insulin-like growth factor (IGF) binding protein-3 by breast cancer cell membranes enhances IGF-I binding. Endocrinology, 144, 4042–50. Monget, P., Mazerbourg, S., Delpuech, T., Maurel, M.C., Maniere, S., Zapf, J., Lalmanach, G., Oxvig, C., and Overgaard, M.T. (2003) Pregnancy-associated plasma protein-A is involved in insulin-like growth factor binding protein-2 (IGFBP-2) proteolytic degradation in bovine and porcine preovulatory follicles: identification of cleavage site and characterization of IGFBP-2 degradation. Biology of Reproduction, 68, 77–86. Morgan, D.O., Edman, J.C., Standring, D.N., Fried, V.A., Smith, M.C., Roth, R.A., and Rutter, W.J. (1987) Insulinlike growth factor II receptor as a multifunctional binding protein. Nature, 329, 301-7. Myers, M.G., Grammer, T.C., Wang, L.M., Sun, X.J., Pierre, J.H., Blenis, J., and White, M.F. (1994) Insulin receptor substrate -1 mediates phosphatidylinositol- 3’- kinase and p70S6k signalling during insulin, IGF-1 and interleukin-4 stimulation. J. Biol. Chem. 269, 28783-9. Myers, M.G. Jr, and White, M.F. (1996) Insulin signal transduction and the IRS proteins. Annu. Rev. Pharmacol. Toxicol. 36, 615-58. Nam, T.J., Busby, W.H., and Clemmons, D.R. (1994) Human fibroblasts secrete a serine protease that cleaves insulin-like growth factor binding-5. Endocrinology, 135, 1385–1391. Nam, T., Moralez, A., and Clemmons, D. (2002) Vitronectin Binding to IGF Binding Protein-5 (IGFBP-5) Alters IGFBP-5 Modulation of IGF-I Actions. Endocrinology, 143, 30–36 Nemato, S. and Finkel, T. (2004) Ageing and the mystery at Arles. Nature 429, 149-152. Neumann, G.M., and Bach, L.A. (1999) The N-terminal disulfide linkages of human insulin-like growth factor-binding protein-6 (hIGFBP-6) and hIGFBP-1 are different as determined by mass spectrometry. J. Biol. Chem. 274, 14587-14594. Neuenschwander, S., Roberts Jr, C.T., and LeRoith, D. (1995) Growth inhibition of MCF-7 breast cancer cells by stable expression of an insulin-like growth factor I receptor antisense ribonucleic acid. Endocrinology, 136, 4298-4303. Nissley, S.P., and Kiess, W. (1991) Binding of insulin-like growth factor II (IGF-II) and lysosomal enzymes to the IGF-II/mannose-6-phosphate receptor. Modern concepts of insulin-like growth factors. EM Spencer, ed. Elsevier Science Publishing Co., Inc. New York, 419-30. Oh, Y., Müller, H.L., Lamson, G., and Rosenfeld, R. (1993) Insulin-like growth factor (IGF)-independent action of IGF-binding protein-3 in Hs578T human breast cancer cells. Cell surface binding and growth inhibition. J. Biol. Chem. 268, 14964-71. Oh, Y., Müller, H.L., Ng, L., and Rosenfeld, R. (1993) Transforming growth factor-beta-induced cell growth inhibition in human breast cancer cells is mediated through insulin-like growth factor binding protein-3 action. J. Biol. Chem. 270,13589–92.
Chapter 10 References
130
Payet, L.D., Wang, X.H., Baxter, R.C., and Firth, M. (2003) Amino- and carboxyl-terminal fragments of insulin-like growth factor (IGF) binding protein-3 cooperate to bind IGFs with high affinity and inhibit IGF receptor interactions. Endocrinology, 144, 2797-806. Perdue, J.F., Bach L.A., Hashimoto, R., Sakano, K., Fujita-Yamaguchi, Y., Fujiwara, H., and Rechler, M.M. (1994) in: The insulin-like growth factors and their regulatory proteins, Baxter, R.C., Gluckman, P.D., and Rosenfeld, R.G. (eds), Elsevier Science Publishing Co., New York, pp. 67-76. Perks, C.M., Newcomb, P.V., Norman, M.R., and Holly, J.M. (1999) Effect of insulin-like growth factor binding protein-1 on integrin signaling and the induction of apoptosis in human breast cancer cells. J. Mol. Endocrinol. 22, 141–50. Perrakis, A., Morris, R., and Lamzin, V.S. (1999) Automated protein model building combined with iterative structure refinement. Nature Struct. Biol. 6, 458-63. Perrakis, A., Harkiolaki, M., Wilson, K.S., and Lamzin, V.S. (2001) ARP/wARP and molecular replacement. Acta Cryst. D57, 1445-50. Pollak, M.N., Schernhammer, E.S., and Hankinson, S.E. (2004) Insulin-like growth factors and neoplasia. Nature Rev. Cancer, 4, 505-18. Prior, T.I., Helman, L.J., FitzGerald, D.J., and Pastan, I. (1991) Cytotoxic activity of a recombinant fusion protein between insulin-like growth factor I and Pseudomonas exotoxin. Cancer Research, 51, 174-80. Rehm, T., Huber, R., and Holak, T.A. (2002) Application of NMR in structural proteomics: screening for proteins amenable to structural analysis. Structure, 10, 1613-18. Qin, X., Byun, D., Strong, D.D., Baylink, D.J. and Mohan, S. (1999) Studies on the role of human insulin-like growth factor-II (IGF-II)-dependent IGF binding protein (hIGFBP)-4 protease in human osteoblasts using protease-resistant IGFBP-4 analogs. Journal of Bone and Mineral Research, 14, 2079–2088. Qin, X.Z., Strong, D.D., Baylink, D.J., and Mohan, S. (1998) Structure-function analysis of the human insulin-like growth factor binding protein-4. J. Biol. Chem. 273, 23509-16. Rajah, R., Lee, K.W., and Cohen, P. (2002) Insulin-like growth factor binding protein-3 mediates tumor necrosis factor-alpha-induced apoptosis: role of Bcl-2 phosphorylation. Cell Growth Differ. 13, 163–71. Rajah, R., Valentinis, B., and Cohen, P. (1997) Insulin-like growth factor (IGF)-binding protein-3 induces apoptosis and mediates the effects of transforming growth factor-b1 on programmed cell death through a p53- and IGF-independent mechanism. J. Biol. Chem. 272, 12181–8. Rechler, M.M. (1985) The nature and regulation of the receptors for insulin-like growth factors. Ann. Rev. Physiol. 47, 425-42. Rechler, M.M. (1993) Insulin-like growth factor-binding proteins. Vitam. Horm. 47, 1-114. Rechler, M.M. (1997) Growth inhibition by insulin-like growth factor (IGF) binding protein-3—What’s IGF got to do with it? Endocrinolgy, 138, 2645-7.
Chapter 10 References
131
Rinderknecht, E. and, Humbel, R.E. (1976) Amino-terminal sequences of two polypeptides from human serum with nonsuppressible insulin-like and cell-growth promoting activities: evidence for structural homology with insulin B chain. Proc. Natl. Acad. Sci. USA, 73, 4379-81. Rinderknecht, E., and, Humbel, R.E. (1978a) The amino acid sequences of human insulin-like growth factor-I and its structural homology with proinsulin. J. Biol. Chem. 253, 2769-76. Rinderknecht, E., and Humbel, R.E. (1978b) Primary structure of human insulin-like growth factor II. FEBS Lett. 89, 283-6. Rosenberg, A.H., Goldman, E., Dunn, J.J., Studier, F.W. and Zubay, G. (1993) Effects of consecutive AGG codons on translation in Escherichia coli, demonstrated with a versatile codon test system. J. Bacteriol. 175, 716–22. Rozhkova, A., Stirnimann, C.U., Frei, P., Grauschopf, U., Brunisholz, R., Grutter, M.G., Capitani, G., and Glockshuber, R. (2004) Structural basis and kinetics of inter- and intramolecular disulfide exchange in the redox catalyst DsbD. EMBO J. 23, 1709-19. Russo, V.C., Bach, L.A., Fosang, A.J., Baker, N.L., and Werther, G.A. (1997) Insulin-like growth factor binding protein-2 binds to cell surface proteoglycans in the rat brain olfactory bulb. Endocrinology, 138, 4858–67. Sackett, R.L., McCusker, R.H., (1998a) Multivalent cations depress ligand binding to cell-associated insulin-like growth factor binding protein-5 on human glioblastoma cells. Endocrinology, 139, 1943–51. Sackett, R.L., McCusker, R.H., (1998b) Multivalent cations depress ligand affinity of insulin-like growth factor-binding proteins-3 and -5 on human GM-10 fibroblast cell surfaces. J. Cell. Biochem. 69, 364–75. Sakano, K., Enjoh, T., Numata, F., Fujiwara, H., Marumoto, Y., Higashihashi, N., Sato, Y., Perdue, J.F., and Fujita-Yamaguchi Y. (1991) The design, expression, and characterization of human insulin-like growth factor II (IGF-II) mutants specific for either the IGF-II/cation- independent mannose 6-phosphate receptor or IGF-I receptor J. Biol. Chem. 266, 31, 20626-35. Sara, V.R., Carlsson-Skwirut, C., Anderson, C., Hall, E., Sjorgen, B., Holmgren, A, and Jornvall, H. (1986) Characterisation of somatomedins from human foetal brain: identification of a variant form of insulin-like growth factor I. Proc. Natl. Acad. Sci. USA, 83, 4904-7. Sato, H., Nishimura, S., Ohkubo, T., Kyoguku, Y., Koyama, S. and Kobayashi, Y. (1993) Three-dimensional structure of human insulin-like growth factor I (TGF-I) determined by 1H-NMR and distance geometry, Int. J. Pept. Protein Res. 41, 433 40. Schagger, H., von Jagow, G. (1987) Tricine-sodium dodecyl sulfate-polyacrylamide gel electrophoresis for the separation of proteins in the range from 1 to 100 kDa. Anal Biochem. 166, 368-79. Scharf, J.G., and Braulke, T. (2003) The role of the IGF axis in hepatocarcinogenesis. Horm. Metab. Res. 35, 685-93. Schedlich, L.J., Young, T., Firth S., and Baxter, R. (1998) Insulin-like growth factor-binding protein (IGFBP9-3 and IGFBP-5 share a common nuclear trasport pathway in T47D human breast carcinoma cells. J. Biol. Chem. 273, 18347-52.
Chapter 10 References
132
Schedlich, L.J., O'Han, M.K., Leong, G.M., and Baxter, R.C. (2004) Insulin-like growth factor binding protein-3 prevents retinoid receptor heterodimerization: implications for retinoic acid-sensitivity in human breast cancer cells. Bioch. Bioph. Res. Comm. 314, 83-8. Schlechter, N.L., Russel, S.M., Spencer, E.M., and Nicoll, C.S. (1986) Evidence suggesting that the direct growth-promoting effect of growth hormone on cartiliage in vivo is mediated by local production of somatomedin. Proc. Natl. Acad. Sci. 83, 7932-4. Schneider, M.R., Wolf, E., Hoeflich, A., and Lahm H. (2002) IGF-binding protein-5: flexible player in the IGF system and effector on its own. Journal of Endocrinology, 172, 423–40. Shand, J.H., Beattie, J., Song, H., Phillips, K., Kelly, S.M., Flint, D.J., and Allan, G.J. (2003) Specific amino acid substitutions determine the differential contribution of the N- and C-terminal domains of insulin-like growth factor (IGF)-binding protein-5 in binding IGF-I. J. Biol. Chem. 278, 17859-66. Singh, B., Charkowicz, D., and Mascarenhas, D. (2004) Insulin-like growth factor-independent effects mediated by a C-terminal metal-binding domain of Insulin-like growth factor binding protein-3. J. Biol. Chem. 279, 477–87. Ständker, L., Braulke, T., Mark, S., Mostafavi, H., Meyer, M., Honing, S., Gimenez-Gallego, G., and Forssmann, W.G. (2000) Partial IGF affinity of circulating N- and C-terminal fragments of human insulin-like growth factor binding protein-4 (IGFBP-4) and the disulfide bonding pattern of the C-terminal IGFBP-4 domain. Biochemistry, 39, 5082-8. Stoll, R., Renner, C., Hansen, S., Palme, S., Klein, C., Belling, A., Zeslawski, W., Kamionka, M., Rehm, T., Mühlhahn, P., Schumacher, R., Hesse, F., Kaluza, B., Voelter, W., Engh, R.A., and Holak, T.A. (2001) Chalcone derivatives antagonize interactions between the human oncoprotein MDM2 and p53. Biochemistry, 40, 336-44. Suh, D.Y., Hunt, T.K., and Spencer E.M. (1992) Insulin-like growth factor-I reverses the impairment of wound healing induced by corticosteroids in rats. Endocrinology, 131, 2399-406. Suikkari, A-M., and Baxter, R.C. (1992) Insulin-like growth factor binding protein-3 is functionally normal in pregnancy serum. J. Clin. Endocrinol. Metab. 74, 177–83. Takahashi, H., Nakanishi, T., Kami, K., Arata, Y., Shimada, I. (2000) A novel NMR method for determining the interfaces of large protein-protein complexes. Nature Struct. Biol. 7, 7220-223. Taylor, V.L., and Spencer, E.M. (2001) Characterisation of insulin-like growth factor-binding protein-3 binding to a novel receptor on human platelet membranes. J. Endocrinol. 168, 307-15. Thrailkill, K.M., Quarles, L.D., Nagase, H., Suzuki, K., Serra, D.M., and Fowlkes, J.I. (1995) Characterization of insulin-like growth factor-binding protein-5-degrading proteases produced throughout murine osteoblast differentiation. Endocrinology, 136, 3527–33. Torres, A.M., Forbes, B.E., Aplin, S.E., Wallace, J.C., Francis, G.L., and Norton, R.S. (1995) Solution structure of human insulin-like growth factor II. Relationship to receptor and binding protein interactions. J. Mol. Biol. 248, 385-401. Turner, R., and Tjian, R. (1989) Leucine repeats and an adjacent DNA binding domain mediate the formation of functional cFos-cJun heterodimers. Science, 243, 1689–94.
Chapter 10 References
133
Twigg, S.M., Kiefer, M.C., Zapf, J., and Baxter, R.C. (2000) A central domain binding site in insulin-like growth factor binding protein-5 for the acid-labile subunit. Endocrinology, 141, 454-7. Vajdos, F.F., Ultsch, M., Schaffer, M.L., Deshayes, K.D., Liu, J., Skelton, N.J., and de Vos, A.M. (2001) Crystal structure of human insulin-like growth factor-1: detergent binding inhibits binding protein interactions. Biochemistry, 40, 11022-29. Valentinis, B., Bhala, A., DeAngelis, T., Baserga, R., and Cohen, P. (1995) The human insulin-like growth factor (IGF) binding protein-3 inhibits the growth of .broblasts with a targeted disruption of the IGF-I receptor gene. Mol. Endocrinol. 9, 361–7. Vivian, J.T., and Callis, P.R. (2001) Mechanisms of tryptophan fluorescence shifts in proteins. Biophysical Journal, 80, 2093–109. Vorwerk, P., Hohmann, B., Oh, Y., Rosenfeld, R.G., and Shymko, R.M. (2002) Binding properties of insulin- like growth factor binding protein-3 (IGFBP-3), IGFBP-3 N- and C-terminal fragments, and structurally related proteins mac25 and connective tissue growth factor measured using a biosensor. Endocrinology, 143, 1677-85. Wang, J-F., Hampton, B., Mehlman, T., Burgess, W.H., and Rechler, M.M. (1988) Isolation of a biologically active fragment from the carboxy-terminus of the fetal rat binding protein for insulin-like growth factors. Biochem. Biophys. Res. Commun. 157, 718-26. Weber, T., Baumgartner, R., Renner, C., Marahiel, M.A., and Holak, T.A. (2000) Solution structure of PCP, a prototype for the peptidyl carrier domains of modular peptide synthetases. Struct. Fold. Des. 8, 407-18. Wetterau, L.A., Moore, M.G., Lee, K.W., Shim, M.L., and Cohen, P. (1999) Novel aspects of the insulin-like growth factor binding proteins. Mol. Gen. Metab. 68, 161-81. White, M.F. and Kahn, C.R. (1989) Cascade of autophosphorylation in the beta-subunit of the insulin receptor. J. Cell. Biochem. 39, 429-41. Wu, H.B., Kumar, A., Tsai, W.C., Mascarenhas, D., Healey, J., and Rechler, M. M. (2000) Characterization of the inhibition of DNA synthesis in proliferating mink lung epithelial cells by insulin-like growth factor binding protein-3. J. Cell. Biochem. 77, 288–97. Wu, Y., Cui, K., Miyoshi, K., Hennighausen, L., Green, J.E., Setser, J., LeRoith, D., and Yakar, S. (2003) Reduced circulating insulin-like growth factor I levels delay the onset of chemically and genetically induced mammary tumors. Cancer Res. 63, 4384–8. Wüthrich, K. (1986) NMR of Proteins and Nucleic Acids, Wiley-Interscience, New York. Yamasaki, H., Prager, D., and Melmed, S. (1993) Structure-function of the human insulin-like growth factor-I receptor: a discordance of somatotrophin internalisation and signalling. Mol. Endocrinol. 7, 681-5. Yao, S.G., Headey, S.J., Keizer, D.W., Bach, L.A., and Norton, R.S. (2004. C-terminal domain of insulin-like growth factor (IGF) binding protein 6: Conformational exchange and its correlation with IGF-II binding. Biochemistry. 43, 11187-95. Zeslawski, W., Beisel, H.G., Kamionka, M., Kalus, W., Engh, R.A., Huber, R., Lang, K., and Holak T.A. (2001) The interaction of insulin-like growth factor-I with the N-terminal domain of IGFBP-5. EMBO J. 20, 3638-44.
Chapter 10 References
134
Zhang, X. and Yee, D. (2002) Insulin-like growth factor binding protein-1 (IGFBP-1) inhibits breast cancer cell motility. Cancer research, 62, 4369–75. Zheng, B., Clarke, J.B., Busby, W.H., Duan, C., and Clemmons, D.R. (1998) Insulin-like growth factor-binding protein-5 is cleaved by physiological concentrations of thrombin. Endocrinology, 139, 1708–14. Zhu YF, Wilcoxen K, Gross T, Connors P, Strack N, Gross R, Huang CQ, McCarthy JR, Xie Q, Ling N, Chen C. (2003) 6,7-dihydroxyisoquinoline-3-carboxylic acids are potent inhibitors on the binding of insulin-like growth factor (IGF) to IGF-binding proteins: optimization of the 1-position benzoyl side chain. Bioorg. Med. Chem. Lett.,13,1927-30 Xu, Q., Yan, B., Li, S., and Duan, C. (2004) Fibronectin binds insulin-like growth factor-binding protein 5 and abolishes its ligand-dependent action on cell migration. J. Biol. Chem. 279, 4269–77.