Embed Size (px)
Citation preview
1
STRUCTURAL DESIGN OF SERPENTINE GAS CHANNEL IN
FUEL CELL
Nawras H. Mostafa Qusay R. Al-Hagag
خليت الوقودت في التصميم البنيوي للقناة الغازيت الملتف
الخالصة
الوقوود اات ة, الجوز الرييسول لخميوتعتبر صفيحة تحرير كل من الوقود و الغازات المؤكسدة أو ما يسمى بصفيحة خمية الوقوود التبووادل ألبروتوووولج وتجوول تدوووير أدا صووفيحة خميووة الوقووود مووت تاميوول كمفتقووا, تووم اسووتخدام درياووة العواصوور المحووددة لمتحميوول غشووا
البويوي و الحاسوب عالل الوماجة كأداة وافعة لتحسين صفايح خاليا الوقود فل الوقت الحاللج درجووة ميويووة و بشووكل متكوورر مووت وجووود أحمووال بويويووةج ووا 88الوقووود, يووتم رفووت درجووة حوورارة الصووفايح إلووى خووالل عموول خميووة
الحوورارة تووؤدي بالوتيجووة إلووى تكوووين اجقووادات حراريووة أعمووى موون اجقووادات التحميوول البويووويج لقوواا فووأن ا جقووادات الحراريووة تمعووب دورا أساسيا فل التصميم البويوي لتمك الصفايحج
تم تحميل صفيحة من الووع الممتف باستخدام درياة العواصر المحددة فل حالة المرووة الخدية و الالخديةج تم تدبيو كماليوة التصووميم و الووك لتاميوول أعاووم إجقوواد خوومن صووفيحة خاخووعة لتاييوود فوول اتبعوواد القودسووية وفوول خوووا المووادة كمتغيوورات تصووميميةج
لمدبوعة و درياة تصميم صفيحة خمية الوقودج أاقرت الدراسة مميزات الصفايح ا
ABSTRACT
Fuel and oxidant gas delivery plate, or fuel cell plate, is a key component of a Proton Exchange
Membrane (PEM) fuel cell. To develop low-cost and high performance fuel cell plates, advanced
computer modeling and finite element structure analysis are used as useful tools for the
optimization of the plates at the early design stage.
In a fuel cell application, these fuel cell plates are routinely heated up to 80oC with structure
pressure loads. The temperature induced thermal stresses is found to be much higher that the
structure loading stress. Thus, the thermal stresses plays a key role in the structure design and
optimization of the plates.
To carry out the analysis, a model of the serpentine plate is analyzed using finite element
analysis model for both linear and nonlinear elasticity analysis. Design optimization is applied to
minimize the maximum stress within the plate, subject to constraint with both geometry and
material parameters as design variables. The study reveals the characteristics of the printed plates,
and provides guidelines for the structure and material design of the fuel cell plate.
Keywords / gas channel fuel cell, stresses analysis, design optimization, linear and nonlinear
analyses, FEA model
2
1-INTRODUCTION
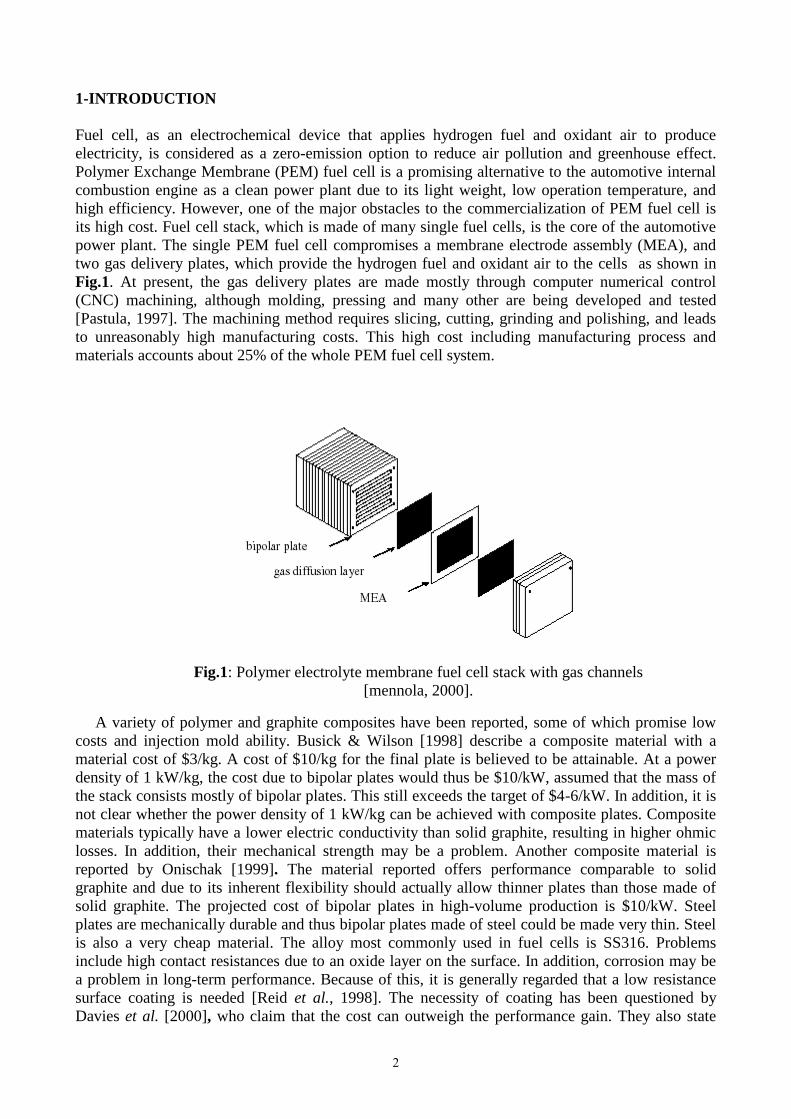
Fuel cell, as an electrochemical device that applies hydrogen fuel and oxidant air to produce
electricity, is considered as a zero-emission option to reduce air pollution and greenhouse effect.
Polymer Exchange Membrane (PEM) fuel cell is a promising alternative to the automotive internal
combustion engine as a clean power plant due to its light weight, low operation temperature, and
high efficiency. However, one of the major obstacles to the commercialization of PEM fuel cell is
its high cost. Fuel cell stack, which is made of many single fuel cells, is the core of the automotive
power plant. The single PEM fuel cell compromises a membrane electrode assembly (MEA), and
two gas delivery plates, which provide the hydrogen fuel and oxidant air to the cells as shown in
Fig.1. At present, the gas delivery plates are made mostly through computer numerical control
(CNC) machining, although molding, pressing and many other are being developed and tested
[Pastula, 1997]. The machining method requires slicing, cutting, grinding and polishing, and leads
to unreasonably high manufacturing costs. This high cost including manufacturing process and
materials accounts about 25% of the whole PEM fuel cell system.
A variety of polymer and graphite composites have been reported, some of which promise low
costs and injection mold ability. Busick & Wilson [1998] describe a composite material with a
material cost of $3/kg. A cost of $10/kg for the final plate is believed to be attainable. At a power
density of 1 kW/kg, the cost due to bipolar plates would thus be $10/kW, assumed that the mass of
the stack consists mostly of bipolar plates. This still exceeds the target of $4-6/kW. In addition, it is
not clear whether the power density of 1 kW/kg can be achieved with composite plates. Composite
materials typically have a lower electric conductivity than solid graphite, resulting in higher ohmic
losses. In addition, their mechanical strength may be a problem. Another composite material is
reported by Onischak [1999]. The material reported offers performance comparable to solid
graphite and due to its inherent flexibility should actually allow thinner plates than those made of
solid graphite. The projected cost of bipolar plates in high-volume production is $10/kW. Steel
plates are mechanically durable and thus bipolar plates made of steel could be made very thin. Steel
is also a very cheap material. The alloy most commonly used in fuel cells is SS316. Problems
include high contact resistances due to an oxide layer on the surface. In addition, corrosion may be
a problem in long-term performance. Because of this, it is generally regarded that a low resistance
surface coating is needed [Reid et al., 1998]. The necessity of coating has been questioned by
Davies et al. [2000], who claim that the cost can outweigh the performance gain. They also state
Fig.1: Polymer electrolyte membrane fuel cell stack with gas channels
[mennola, 2000].
3
that endurance testing of uncoated steel in excess of 3000 hours has been successfully conducted.
Therefore the cost issue dominates the fuel cell plate development. The cost of a new product
consists of the development cost and manufacturing cost. Conventional product development is
carried out through a trial and error process requiring many design and prototyping iterations
[Menon 1998]. The lengthy design lead-time leads to high cost at the early stage of product
development. The manufacturing cost of a product depends on its design, and the material used. All
of these two aspects have to be addressed in order to lower the cost of a fuel cell plate.
This study applies the finite element analysis (FEA), on the fuel cell plate structure design that
covers both plate geometry and plate material. Conventionally, most computational structure design
deals with only geometry, which focuses on the shape of the design for mature materials with
known performance. In this study, the material and its properties for the fuel cell plate is also to be
determined. The purpose of fuel cell plate structure design is to obtain an improved fuel cell gas
delivery plate with certain materials based on the screen-printing manufacturing method. The
optimal design will provide the ideal geometry of structure and broader material performance for
the materials development. The design optimization of plate geometry is carried out using key
geometry parameters as design variables. The material design uses both geometry parameters and
the key material parameter, the Young’s modulus, as design variables. Both of the geometry design
and material design are conducted by minimizing the maximum stress within the plate, subject to
the maximum strain allowed. The FEA structure simulation includes linear elasticity analysis,
nonlinear elasticity analysis, prestress analysis. These analyses are used as measurements of design
objectives and constraints in the optimization.
2. COMPUTATIONAL MODELING
2.1. Solid Modeling
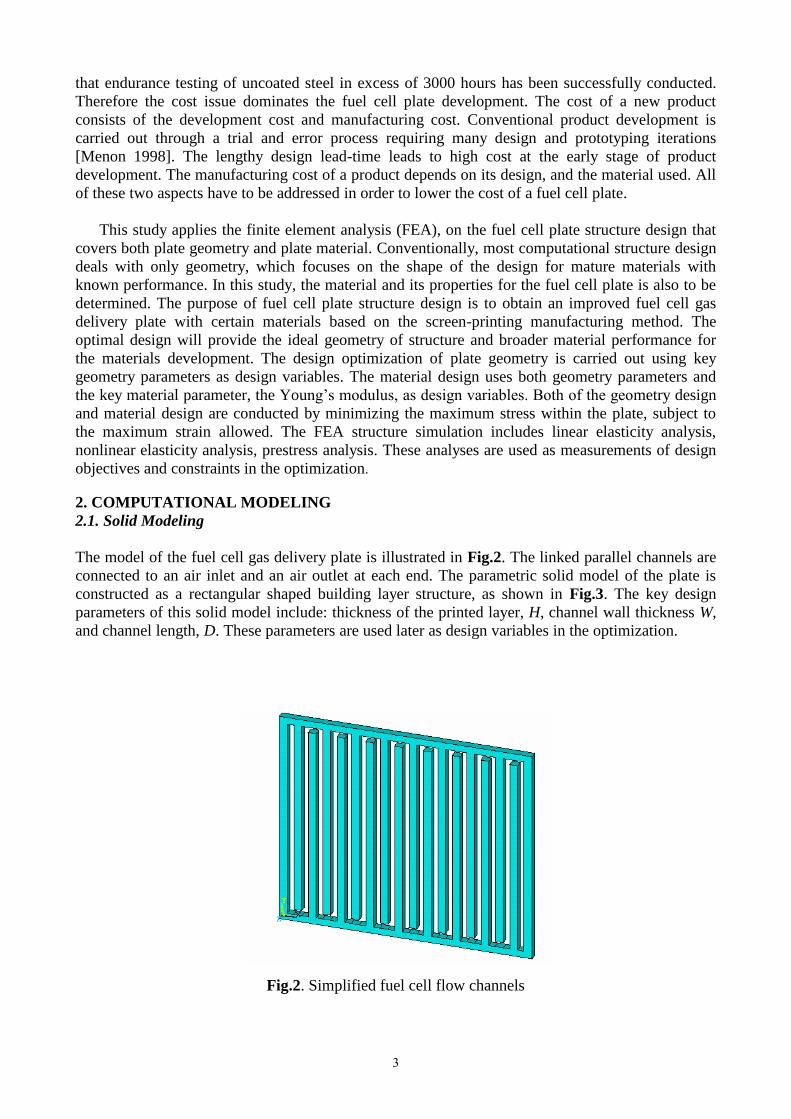
The model of the fuel cell gas delivery plate is illustrated in Fig.2. The linked parallel channels are
connected to an air inlet and an air outlet at each end. The parametric solid model of the plate is
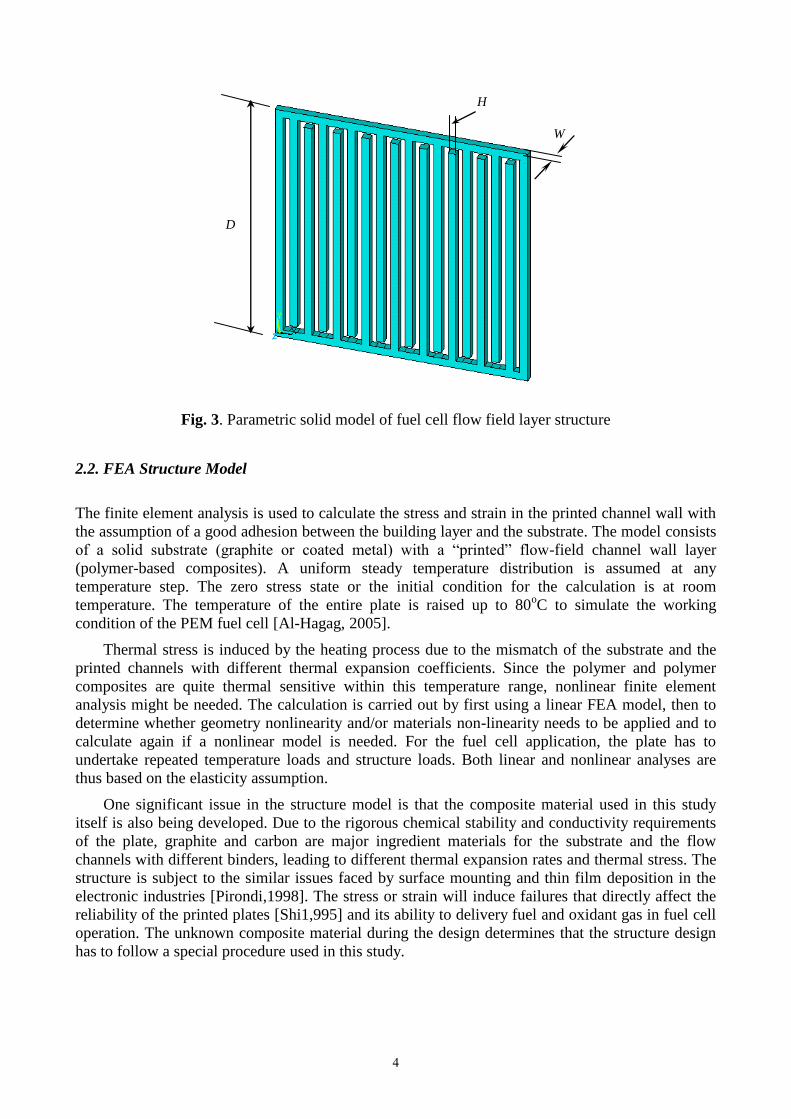
constructed as a rectangular shaped building layer structure, as shown in Fig.3. The key design
parameters of this solid model include: thickness of the printed layer, H, channel wall thickness W,
and channel length, D. These parameters are used later as design variables in the optimization.
Fig.2. Simplified fuel cell flow channels
4
Fig. 3. Parametric solid model of fuel cell flow field layer structure
2.2. FEA Structure Model
The finite element analysis is used to calculate the stress and strain in the printed channel wall with
the assumption of a good adhesion between the building layer and the substrate. The model consists
of a solid substrate (graphite or coated metal) with a “printed” flow-field channel wall layer
(polymer-based composites). A uniform steady temperature distribution is assumed at any
temperature step. The zero stress state or the initial condition for the calculation is at room
temperature. The temperature of the entire plate is raised up to 80oC to simulate the working
condition of the PEM fuel cell [Al-Hagag, 2005].
Thermal stress is induced by the heating process due to the mismatch of the substrate and the
printed channels with different thermal expansion coefficients. Since the polymer and polymer
composites are quite thermal sensitive within this temperature range, nonlinear finite element
analysis might be needed. The calculation is carried out by first using a linear FEA model, then to
determine whether geometry nonlinearity and/or materials non-linearity needs to be applied and to
calculate again if a nonlinear model is needed. For the fuel cell application, the plate has to
undertake repeated temperature loads and structure loads. Both linear and nonlinear analyses are
thus based on the elasticity assumption.
One significant issue in the structure model is that the composite material used in this study
itself is also being developed. Due to the rigorous chemical stability and conductivity requirements
of the plate, graphite and carbon are major ingredient materials for the substrate and the flow
channels with different binders, leading to different thermal expansion rates and thermal stress. The
structure is subject to the similar issues faced by surface mounting and thin film deposition in the
electronic industries [Pirondi,1998]. The stress or strain will induce failures that directly affect the
reliability of the printed plates [Shi1,995] and its ability to delivery fuel and oxidant gas in fuel cell
operation. The unknown composite material during the design determines that the structure design
has to follow a special procedure used in this study.
D
H
W
5
3. DESIGN OPTIMIZATION
In this work, the design optimization is carried out for both plate geometry and material. Two
different design objectives and two different sets of design variables are used in tandem. The most
challenging issues facing the fuel cell plate material development are good conductivity, excellent
electro-chemistry stability, sound structure integrity and low cost. Three key material properties,
maximum stress, maximum strain, and stiffness, are directly related to the structure design
requirement. For composite material development, minimum yield stress, minimum failure strain,
and minimum Young’s modulus will support a broader selection of composite material
composition.
The maximum von Mises stress relates to the lifetime of the structure. By selecting the
minimum maximum von Mises stress, σvm, as the objective function, the optimal design will
provide lowest material strength requirement, which the new developing composite material should
be reached. Another material performance, maximum 1st principal strain, 1 , is defined as a
constraint for the optimization to satisfy material deformation restriction. The selections of design
variables are made for two different considerations, plate geometry and plate materials, as discussed
in the following subsections.
3.1. Geometry Design
In the plate geometry design optimization, traditional geometry parameters are used as design
variables. The material parameters are assumed to be constants with their values determined from
similar materials. The optimization considers the worst-case condition, minimizes the maximum
von Mises stress, σvm, of the structure, subject to the constraint of the maximum strain level [ 1 ],
the maximum allowed 1st principal strain 1 . These stress and strain are evaluated using the
ANSYS finite element analysis model. The optimization is carried out using two key variables for
the plate geometry: the wall thickness, W, and the thickness of the printed layer, H, as shown in
Fig.3. The optimization is defined as:
min σvm (1) W, H
subject to: ε ≤[ε] (2)
where the design variables, X=[W, H]T.
3.2. Materials Design
In the plate material design optimization, both geometry parameters and the material performance
parameter of the plate are used as design variables. By adding the material stiffness as design
variable, the optimal design will find the ideal value of the stiffness (or the Young’s Modulus) of
the composite material. The optimization shares the same objective and constraint functions of the
plate geometry optimization.
The optimization is carried out using three key variables for the plate geometry and material: the
wall thickness, W, and the height of the printed layer, H, and the material stiffness (or Young’s
Modulus), E. The optimization is defined as:
6
min σvm (3) W, H ,E
subject to: ε ≤[ε]
where the design variables, X=[W, H, E]T.
4. RESULTS AND DISCUSSION
4.1. FEA Structure Analysis
The geometry model in Fig.2, is transferred to ANSYS to form the finite element analysis model.
The design parameters of the deposited layer are listed in Tables 1 and 2 below.
Table 1: Dimensions of the plate
Geometrical Parameters
D (m) W (m) H (m)
0.055626 0.001651 0.001778
Table 2: Material properties of epoxy- based composites
Material Parameters
mass density
(Kg/m3)
Young's modulus
(GPa)
Poisson's ratio coefficient of thermal expansion
(m/m K)
1299.52 3 0.37 6*10-5
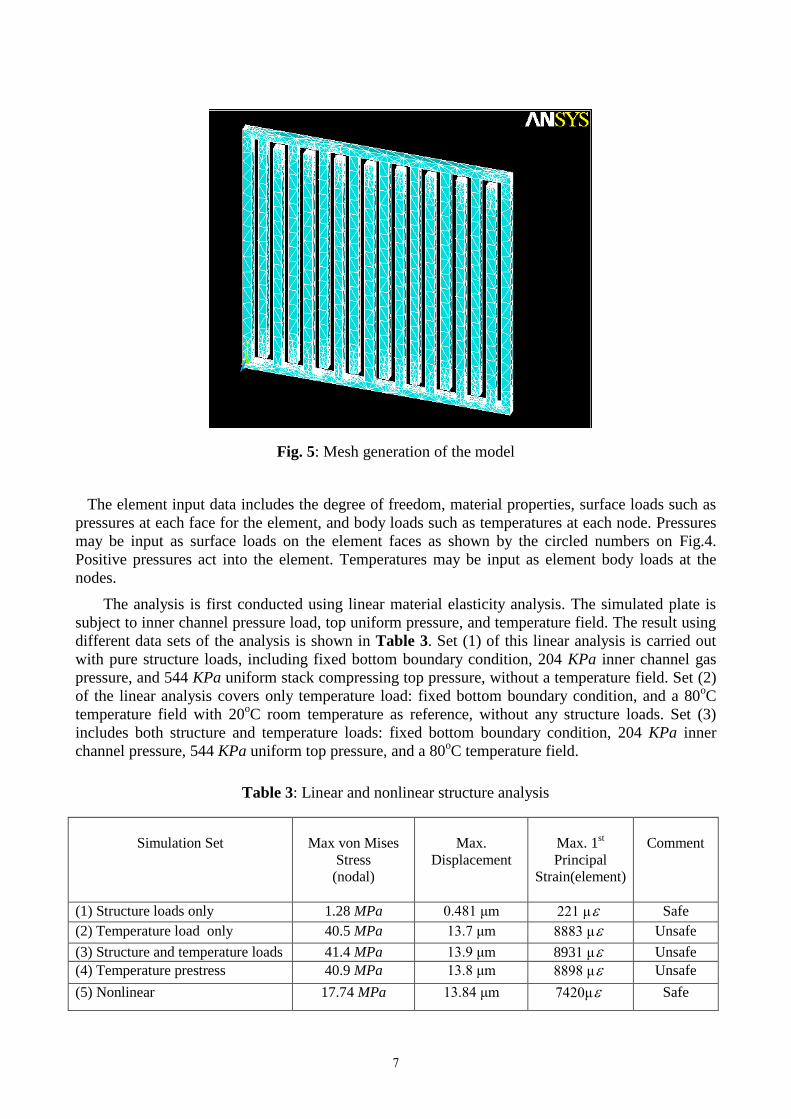
Quadratic 10 node tetrahedral elements called SOLID92 are used for the model as shown in
Fig.4. This element is defined by ten nodes having three degrees of freedom at each node:
translations in the nodal x, y, and z directions. The element also has plasticity, creep, swelling,
stress stiffening, large deflection, and large strain capabilities. Based on the geometry above, the
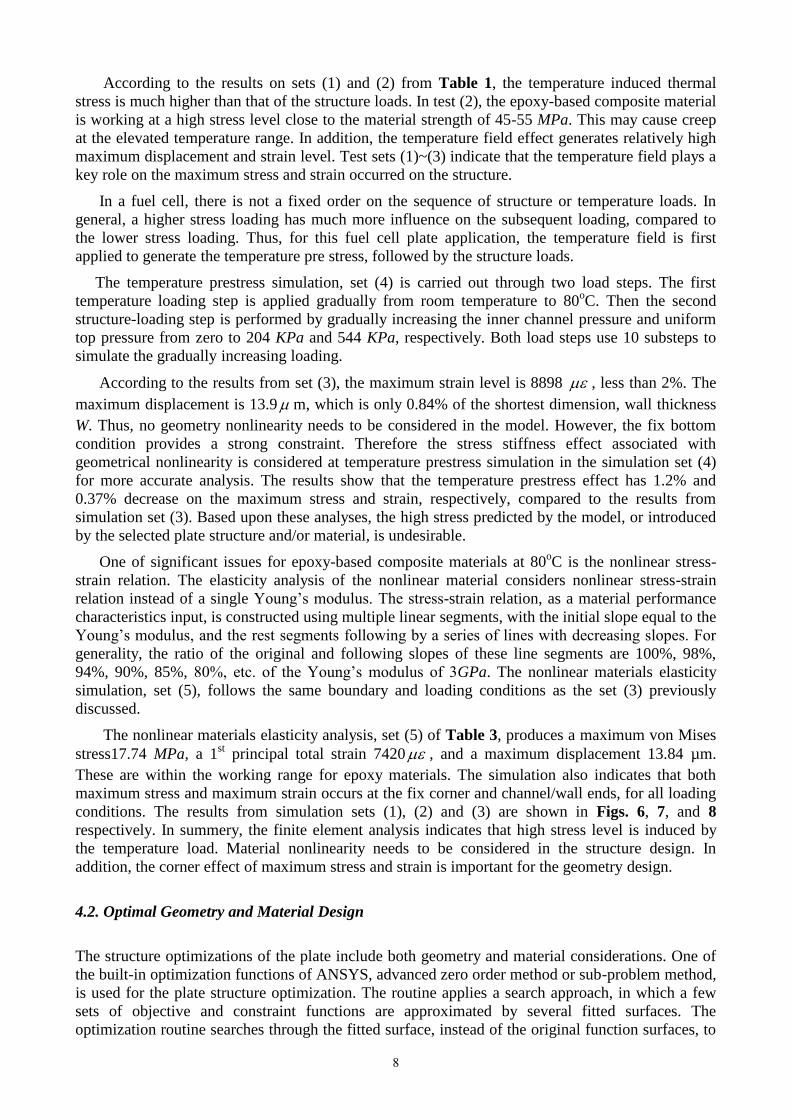
total elements of 16362 are generated with high density at the end and corner areas as shown in
Fig.5.
Fig. 4: SOLID92 Element (ANSYS Element Reference)
7
Fig. 5: Mesh generation of the model
The element input data includes the degree of freedom, material properties, surface loads such as
pressures at each face for the element, and body loads such as temperatures at each node. Pressures
may be input as surface loads on the element faces as shown by the circled numbers on Fig.4.
Positive pressures act into the element. Temperatures may be input as element body loads at the
nodes.
The analysis is first conducted using linear material elasticity analysis. The simulated plate is
subject to inner channel pressure load, top uniform pressure, and temperature field. The result using
different data sets of the analysis is shown in Table 3. Set (1) of this linear analysis is carried out
with pure structure loads, including fixed bottom boundary condition, 204 KPa inner channel gas
pressure, and 544 KPa uniform stack compressing top pressure, without a temperature field. Set (2)
of the linear analysis covers only temperature load: fixed bottom boundary condition, and a 80oC
temperature field with 20oC room temperature as reference, without any structure loads. Set (3)
includes both structure and temperature loads: fixed bottom boundary condition, 204 KPa inner
channel pressure, 544 KPa uniform top pressure, and a 80oC temperature field.
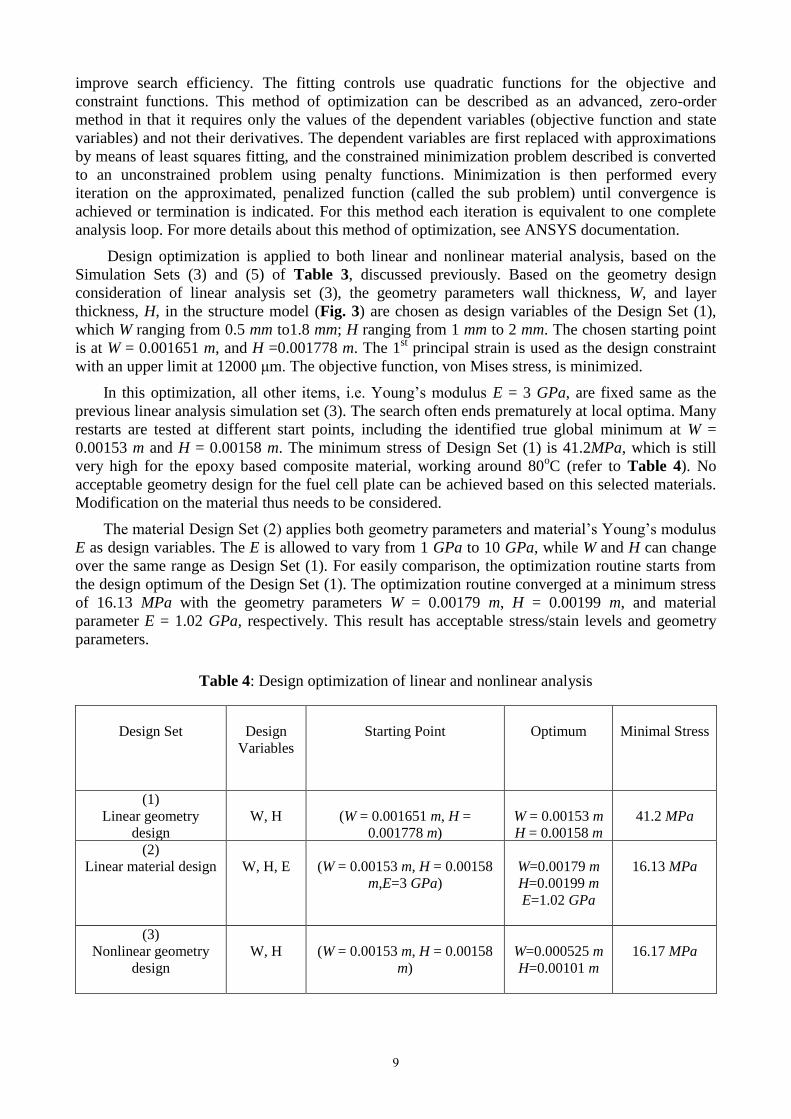
Table 3: Linear and nonlinear structure analysis
Simulation Set
Max von Mises
Stress
(nodal)
Max.
Displacement
Max. 1st
Principal
Strain(element)
Comment
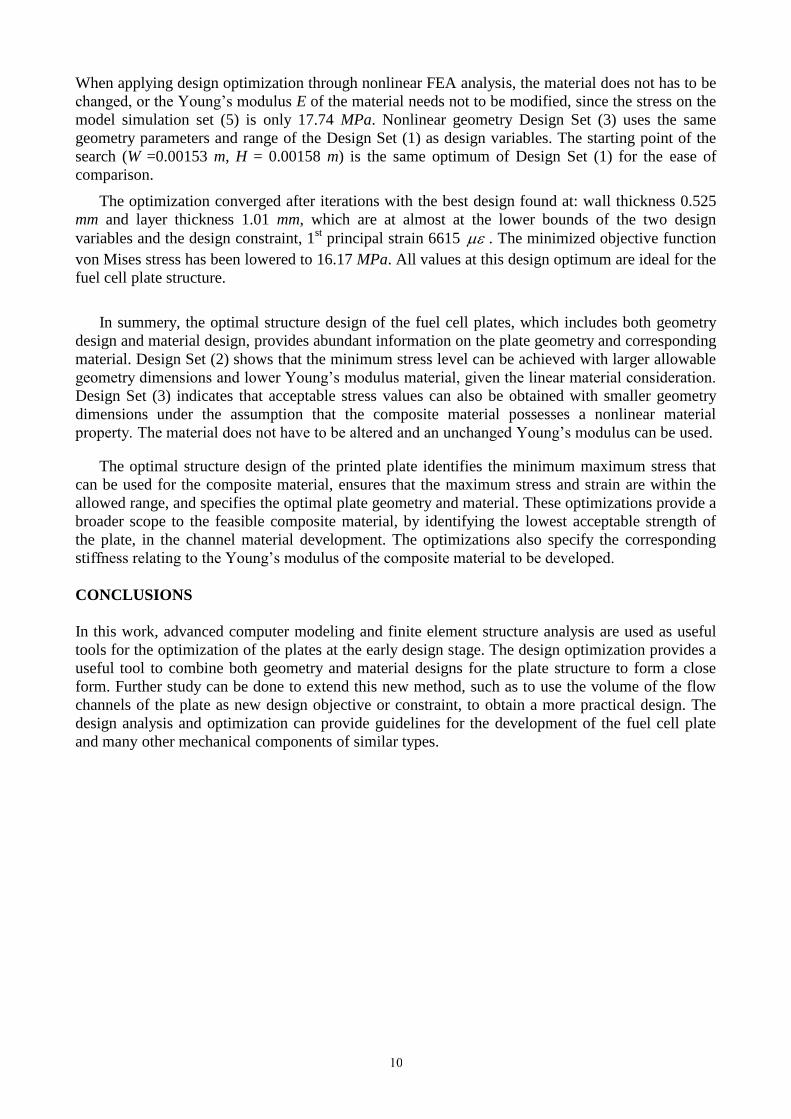
(1) Structure loads only 1.28 MPa 0.481 μm 221 μ Safe
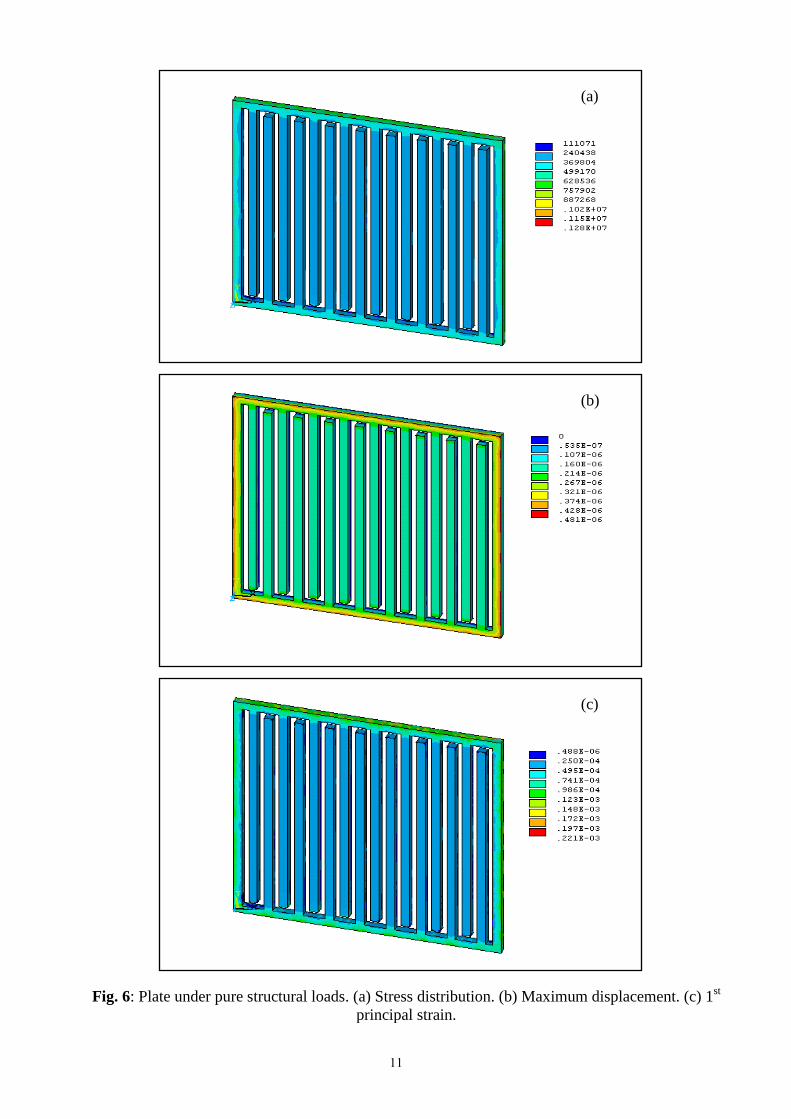
(2) Temperature load only 40.5 MPa 13.7 μm 8883 μ Unsafe
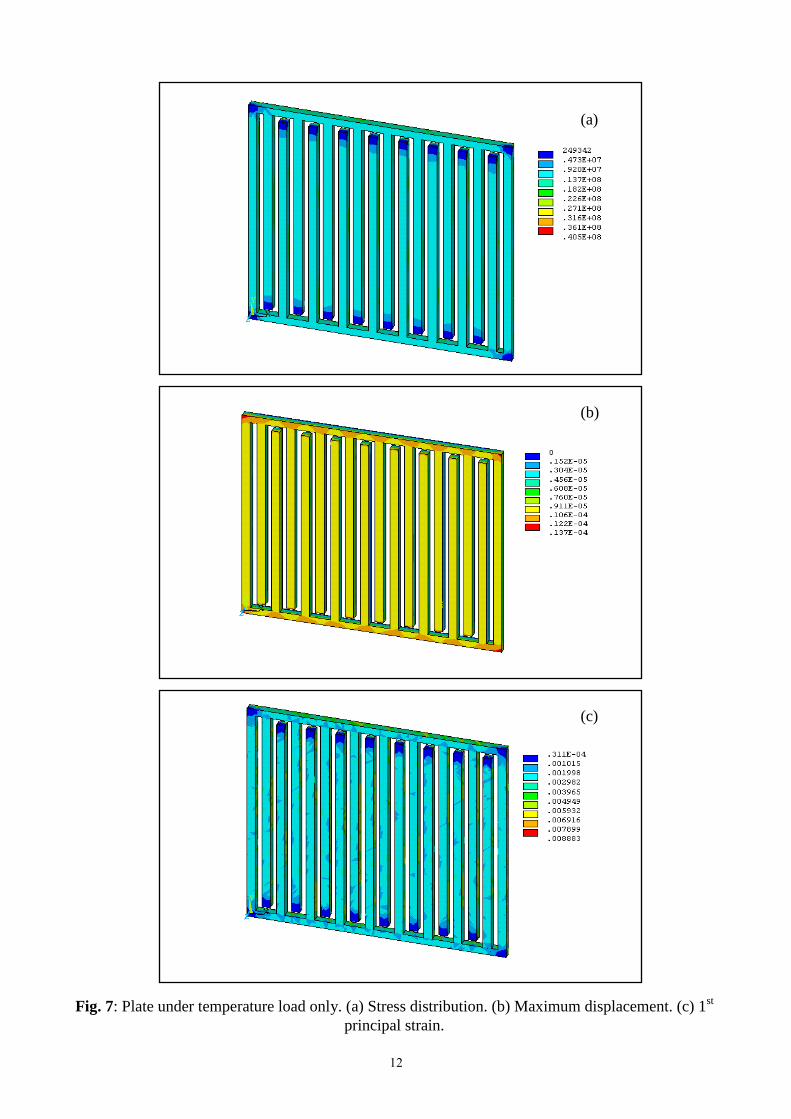
(3) Structure and temperature loads 41.4 MPa 13.9 μm 8931 μ Unsafe
(4) Temperature prestress 40.9 MPa 13.8 μm 8898 μ Unsafe
(5) Nonlinear 17.74 MPa 13.84 μm 7420μ Safe
8
According to the results on sets (1) and (2) from Table 1, the temperature induced thermal
stress is much higher than that of the structure loads. In test (2), the epoxy-based composite material
is working at a high stress level close to the material strength of 45-55 MPa. This may cause creep
at the elevated temperature range. In addition, the temperature field effect generates relatively high
maximum displacement and strain level. Test sets (1)~(3) indicate that the temperature field plays a
key role on the maximum stress and strain occurred on the structure.
In a fuel cell, there is not a fixed order on the sequence of structure or temperature loads. In
general, a higher stress loading has much more influence on the subsequent loading, compared to
the lower stress loading. Thus, for this fuel cell plate application, the temperature field is first
applied to generate the temperature pre stress, followed by the structure loads.
The temperature prestress simulation, set (4) is carried out through two load steps. The first
temperature loading step is applied gradually from room temperature to 80oC. Then the second
structure-loading step is performed by gradually increasing the inner channel pressure and uniform
top pressure from zero to 204 KPa and 544 KPa, respectively. Both load steps use 10 substeps to
simulate the gradually increasing loading.
According to the results from set (3), the maximum strain level is 8898 , less than 2%. The
maximum displacement is 13.9 m, which is only 0.84% of the shortest dimension, wall thickness
W. Thus, no geometry nonlinearity needs to be considered in the model. However, the fix bottom
condition provides a strong constraint. Therefore the stress stiffness effect associated with
geometrical nonlinearity is considered at temperature prestress simulation in the simulation set (4)
for more accurate analysis. The results show that the temperature prestress effect has 1.2% and
0.37% decrease on the maximum stress and strain, respectively, compared to the results from
simulation set (3). Based upon these analyses, the high stress predicted by the model, or introduced
by the selected plate structure and/or material, is undesirable.
One of significant issues for epoxy-based composite materials at 80oC is the nonlinear stress-
strain relation. The elasticity analysis of the nonlinear material considers nonlinear stress-strain
relation instead of a single Young’s modulus. The stress-strain relation, as a material performance
characteristics input, is constructed using multiple linear segments, with the initial slope equal to the
Young’s modulus, and the rest segments following by a series of lines with decreasing slopes. For
generality, the ratio of the original and following slopes of these line segments are 100%, 98%,
94%, 90%, 85%, 80%, etc. of the Young’s modulus of 3GPa. The nonlinear materials elasticity
simulation, set (5), follows the same boundary and loading conditions as the set (3) previously
discussed.
The nonlinear materials elasticity analysis, set (5) of Table 3, produces a maximum von Mises
stress17.74 MPa, a 1st principal total strain 7420 , and a maximum displacement 13.84 µm.
These are within the working range for epoxy materials. The simulation also indicates that both
maximum stress and maximum strain occurs at the fix corner and channel/wall ends, for all loading
conditions. The results from simulation sets (1), (2) and (3) are shown in Figs. 6, 7, and 8
respectively. In summery, the finite element analysis indicates that high stress level is induced by
the temperature load. Material nonlinearity needs to be considered in the structure design. In
addition, the corner effect of maximum stress and strain is important for the geometry design.
4.2. Optimal Geometry and Material Design
The structure optimizations of the plate include both geometry and material considerations. One of
the built-in optimization functions of ANSYS, advanced zero order method or sub-problem method,
is used for the plate structure optimization. The routine applies a search approach, in which a few
sets of objective and constraint functions are approximated by several fitted surfaces. The
optimization routine searches through the fitted surface, instead of the original function surfaces, to
9
improve search efficiency. The fitting controls use quadratic functions for the objective and
constraint functions. This method of optimization can be described as an advanced, zero-order
method in that it requires only the values of the dependent variables (objective function and state
variables) and not their derivatives. The dependent variables are first replaced with approximations
by means of least squares fitting, and the constrained minimization problem described is converted
to an unconstrained problem using penalty functions. Minimization is then performed every
iteration on the approximated, penalized function (called the sub problem) until convergence is
achieved or termination is indicated. For this method each iteration is equivalent to one complete
analysis loop. For more details about this method of optimization, see ANSYS documentation.
Design optimization is applied to both linear and nonlinear material analysis, based on the
Simulation Sets (3) and (5) of Table 3, discussed previously. Based on the geometry design
consideration of linear analysis set (3), the geometry parameters wall thickness, W, and layer
thickness, H, in the structure model (Fig. 3) are chosen as design variables of the Design Set (1),
which W ranging from 0.5 mm to1.8 mm; H ranging from 1 mm to 2 mm. The chosen starting point
is at W = 0.001651 m, and H =0.001778 m. The 1st principal strain is used as the design constraint
with an upper limit at 12000 μm. The objective function, von Mises stress, is minimized.
In this optimization, all other items, i.e. Young’s modulus E = 3 GPa, are fixed same as the
previous linear analysis simulation set (3). The search often ends prematurely at local optima. Many
restarts are tested at different start points, including the identified true global minimum at W =
0.00153 m and H = 0.00158 m. The minimum stress of Design Set (1) is 41.2MPa, which is still
very high for the epoxy based composite material, working around 80oC (refer to Table 4). No
acceptable geometry design for the fuel cell plate can be achieved based on this selected materials.
Modification on the material thus needs to be considered.
The material Design Set (2) applies both geometry parameters and material’s Young’s modulus
E as design variables. The E is allowed to vary from 1 GPa to 10 GPa, while W and H can change
over the same range as Design Set (1). For easily comparison, the optimization routine starts from
the design optimum of the Design Set (1). The optimization routine converged at a minimum stress
of 16.13 MPa with the geometry parameters W = 0.00179 m, H = 0.00199 m, and material
parameter E = 1.02 GPa, respectively. This result has acceptable stress/stain levels and geometry
parameters.
Table 4: Design optimization of linear and nonlinear analysis
Design Set
Design
Variables
Starting Point
Optimum
Minimal Stress
(1)
Linear geometry
design
W, H
(W = 0.001651 m, H =
0.001778 m)
(W = 0.00153 m, H = 0.00158
m) etc
W = 0.00153 m
H = 0.00158 m
41.2 MPa
(2)
Linear material design
W, H, E
(W = 0.00153 m, H = 0.00158
m,E=3 GPa)
W=0.00179 m
H=0.00199 m
E=1.02 GPa
16.13 MPa
(3)
Nonlinear geometry
design
W, H
(W = 0.00153 m, H = 0.00158
m)
W=0.000525 m
H=0.00101 m
16.17 MPa
18
When applying design optimization through nonlinear FEA analysis, the material does not has to be
changed, or the Young’s modulus E of the material needs not to be modified, since the stress on the
model simulation set (5) is only 17.74 MPa. Nonlinear geometry Design Set (3) uses the same
geometry parameters and range of the Design Set (1) as design variables. The starting point of the
search (W =0.00153 m, H = 0.00158 m) is the same optimum of Design Set (1) for the ease of
comparison.
The optimization converged after iterations with the best design found at: wall thickness 0.525
mm and layer thickness 1.01 mm, which are at almost at the lower bounds of the two design
variables and the design constraint, 1st principal strain 6615 . The minimized objective function
von Mises stress has been lowered to 16.17 MPa. All values at this design optimum are ideal for the
fuel cell plate structure.
In summery, the optimal structure design of the fuel cell plates, which includes both geometry
design and material design, provides abundant information on the plate geometry and corresponding
material. Design Set (2) shows that the minimum stress level can be achieved with larger allowable
geometry dimensions and lower Young’s modulus material, given the linear material consideration.
Design Set (3) indicates that acceptable stress values can also be obtained with smaller geometry
dimensions under the assumption that the composite material possesses a nonlinear material
property. The material does not have to be altered and an unchanged Young’s modulus can be used.
The optimal structure design of the printed plate identifies the minimum maximum stress that
can be used for the composite material, ensures that the maximum stress and strain are within the
allowed range, and specifies the optimal plate geometry and material. These optimizations provide a
broader scope to the feasible composite material, by identifying the lowest acceptable strength of
the plate, in the channel material development. The optimizations also specify the corresponding
stiffness relating to the Young’s modulus of the composite material to be developed.
CONCLUSIONS
In this work, advanced computer modeling and finite element structure analysis are used as useful
tools for the optimization of the plates at the early design stage. The design optimization provides a
useful tool to combine both geometry and material designs for the plate structure to form a close
form. Further study can be done to extend this new method, such as to use the volume of the flow
channels of the plate as new design objective or constraint, to obtain a more practical design. The
design analysis and optimization can provide guidelines for the development of the fuel cell plate
and many other mechanical components of similar types.
11
(a)
(b)
(c)
Fig. 6: Plate under pure structural loads. (a) Stress distribution. (b) Maximum displacement. (c) 1st
principal strain.
12
(a)
(b)
(c)
Fig. 7: Plate under temperature load only. (a) Stress distribution. (b) Maximum displacement. (c) 1st
principal strain.
13
(a)
(b)
(c)
Fig. 8: Plate under structural and temperature loads. (a) Stress distribution. (b) Maximum displacement.
(c) 1st principal strain.
14
References Al-Hagag, Q. R., (2005) "Developing a model for thermodynamic analysis of a hydrogen-oxygen
Fuel cell", MSc. Thesis , Babylon University, Iraq.
Busick, D.N. & Wilson, M.S., (1998) "Low-cost bipolar plates for PEFC stacks", Electrochemical
Society Proceedings Volume 98-27. ISBN 1-56677-221-4.
Dong, Z.,( 1999) “Fuel Cell Flow-Field Structure Formed by Layer Deposition,” UK Patent GB
2336 712 A.
Davies, D.P., Adcock, P.L., Turpin, M. & Rowen, S.J., (2000). Stainless steel as bipolar plate
material for solid polymer fuel cells. Journal of Power Sources, Vol. 86, No. 1-2, pp. 237-242.
ISSN 0378-7753.
Larry, J. S.,(1984) "Applied Finite Element Analysis"
Menon, U., (1998) "Rapid Prototyping of Hardware and Software", Concurrent Design of Products,
Manufacturing Processes and Systems, Gordon and Breach Science publishers.
Mennola, T. (2000) "Design and Experimental Characterization of Polymer Electrolyte Membrane
Fuel Cells", MSc. Thesis, Helsinki University of Technology, Finland.
Onischak, M., Fan, Q., Chevrinko, J. & Marianovski, L.G.,(1999) " $10/kW bipolar plates for fuel
cells" DOE/EPRI/GRI Fuel Cell Technology Review Conference. 3.-5.8. Chicago, Illinois, USA.
Pastula, M. E.,(1997)" Radiator Stack PEM Fuel Cell Architecture, System Modeling and Flow
Field Design", M. A. Sc. Thesis, University of Victoria.
Perry, M. L., Newman, J., and Cairns, E. J.,(1998) "Mass Transport in Gas Diffusion Electrodes: A
Diagnostic Tool for Fuel Cell Cathodes", Journal of the Electrochemical Society, v145, n1, p5-15.
Pirondi, A., Nicoletto, G., Cova, P., Pasqualetti, M., Portesine, M., and Zani, P. E.,(1998) "Thermo-
Mechanical Simulation of a Multichip Press-Packed IGBT", Solid-State Electronics, v42, n12,
p2303-2307.
Phong, T. Nguyen, Torston, B., Ned, D.,(2004) "Computential Model of a PEM Fuel Cell
Serpentine Gas Flow Channels" Journal of Power Sources 130, p149-157.
Rao, S. S. , (1988) "The Finite Element Method in Engineering"
Reid C.E., Mérida W.R., McLean G., (1998) "Results and analysis of a PEMFC stack using
metallic bi-polar plates"', In: Proceedings of the 1998 Fuel Cell Seminar, Palm Springs, California,
USA. 16.-19.11.1998. United States Department of Defense.
Shi, L. T., and Tu, K. N.,(1995) "Finite Element Stress Analysis of Failure Mechanisms in a
Multilevel Metallization Structure", Journal of Applied Physics, v77, n7.
NOTATIONS
D channel length
E Young's modulus
H thickness of printed layer
W channel wall thickness

15
X design variable 1 maximum 1
st principal strain
vm maximum von Mises stress