Embed Size (px)
Citation preview
Structure and Reducibility of NiO-MoO3/γ-Al2O3 Catalysts: Effects of Loading andMolar Ratio
Yuguang Wang,† Guang Xiong,*,† Xin Liu,† Xiaochuan Yu,† Liping Liu,† Junying Wang,‡Zhaochi Feng,‡ and Can Li‡
State Key Laboratory of Fine Chemicals, Department of Catalysis Chemistry and Engineering, DalianUniVersity of Technology, P.O. Box 39, No. 158 Zhongshan Road, Dalian 116012, China, and State KeyLaboratory of Catalysis, Dalian Institute of Chemical Physics, Chinese Academy of Science, P.O. Box 110,Dalian 116023, China
ReceiVed: January 9, 2008; ReVised Manuscript ReceiVed: July 7, 2008
The effects of loading and molar ratio on the structure and reducibility of NiO-MoO3/γ-Al2O3 catalysts havebeen investigated. Particular attention is given to the catalysts with excess of Mo. The catalysts were preparedby impregnation method and characterized by Raman spectroscopy, X-ray photoelectron spectroscopy (XPS),X-ray diffraction (XRD), and temperature-programmed reduction techniques. Results from Raman, XPS, andXRD show that different surface species can be formed depending on the loading and molar ratio. At lowloading spinel-like NiAl2O4 and dispersed MoO3 are the major species on γ-Al2O3. With increasing the loadingthe aggregation of the Mo species occurs. Only at high loading are crystalline �-NiMoO4 and MoO3 formedon the surface. For the first time, excess Mo was found to promote the formation of �-NiMoO4 on γ-Al2O3.The change in the structure of the catalysts has a large influence on their reducibility, suggesting that both thestructure and oxidation-reduction properties of the NiO-MoO3/γ-Al2O3 catalysts can be controlled by varyingthe loading and molar ratio.
1. Introduction
Nickel molybdate has been found to be a promising catalystfor many reactions, such as hydrotreatment process, oxidativedehydrogenation (ODH), and selective oxidation of light alkanes.1-16 It is well-known that NiMoO4 has different crystal structuresdepending on the temperature. The R-phase is stable at roomtemperature, whereas the �-phase is stable at high temperature.The Rf� transition can be achieved above 948 K while thereverse transformation occurs when the sample is cooled to 473K. 17-19
Studies revealed that the �-phase is easier to be reduced thanthe R-phase and generally shows better catalytic properties.10,16,17,20 Therefore, stabilization of the �-phase at room tem-perature is very important. It has been found that excess of nickelcan stabilize the metastable �-phase (bulk) at room temperature.However, these catalysts do not show good catalytic perfor-mance for propane ODH. 21,22 The other studies showed that,even without excess NiO, the �-phase can be stabilized on thesupports (such as alumina, silica, and titania) at room temper-ature. 9,11,12,20,23-27 The reducibility and catalytic properties areimproved due to the presence of the �-phase on the supports,in comparison with the bulk R-NiMoO4 catalyst. Furthermore,many studies proved that the catalysts containing excess MoO3
significantly improved the behavior of the catalysts.6,8,28,29 Agood influence of MoO3 on the catalytic performance is ascribedto either a synergetic effect between NiMoO4 and MoO3 phaseor the formation of the fine dispersed MoO3 and NiMoO4 phase.5,8,13-15,29 Therefore, it is of importance to precisely control thesurface Ni and Mo species, especially with excess molybdenum.To the best of our knowledge, the effect of loading and molar
ratio on the structure of NiO-MoO3/γ-Al2O3 catalysts has notbeen well understood.
Raman spectroscopy is an important tool to study thestructures of bulk and supported metal oxides. 30-36 In particular,the different NiMoO4 phase can be well distinguished by theircharacteristic Raman bands.11 In the present study, NiO-MoO3/γ-Al2O3 catalysts have been prepared by impregnation method.The structure and reducibility of the catalysts were investigatedby Raman spectroscopy, X-ray photoelectron spectroscopy(XPS), X-Ray diffraction (XRD), and temperature-programmedreduction (TPR). Special attention was paid to the NiO-MoO3/γ-Al2O3 catalysts with excess molybdenum. The results showedthat the structure and oxidation-reduction properties of the NiO-MoO3/γ-Al2O3 catalysts can be controlled by varying loadingand molar ratio. Furthermore, it was found that sufficiently highloading and excess molybdenum favor the formation of �-Ni-MoO4 phase, which was considered as an important active phasein many reactions.
2. Experimental Section
2.1. Catalyst Preparation. The NiO-MoO3/γ-Al2O3 catalystswere prepared by impregnation of γ-Al2O3 support (300 m2/g)with aqueous solutions of ammonium heptamolybdate and nickelnitrate. After the impregnation at room temperature for an hour,the samples were dried at 80 °C on a water bath. The obtainedsamples were placed in an oven and dried at 110 °C for 12 h.Then the catalysts were calcined at 320 °C for 1.5 h, cooled toroom temperature, and finally calcined in air at 520 °C for 2 h.The surface coverages were expressed as wt % loading in termsof MoO3 and NiO. Mo:Ni refers to molar ratio.
2.2. Catalyst Characterization. Raman Spectroscopy. Ra-man spectra were measured on a Jobin-Yvon U1000 scanningdouble monochromator with the spectral resolution of 4 cm-1.A 532-nm line of DPSS 532 Model 200 532-nm single-
* Towhomcorrespondenceshouldbeaddressed.E-mail:[email protected].† State Key Laboratory of Fine Chemicals.‡ State Key Laboratory of Catalysis.
J. Phys. Chem. C 2008, 112, 17265–17271 17265
10.1021/jp800182j CCC: $40.75 2008 American Chemical SocietyPublished on Web 10/09/2008
frequency laser was used as the excitation source. The powerof the laser line at the sample was below 10 mw. The Ramanspectra were measured under ambient conditions
XPS. XPS data were obtained using a Thermon escalab 250spectrometer (USA). The samples were measured with Al KRX-ray source in an area of 500 µm in diameter. All spectra arereferenced to the carbon 1s binding energy of 284.6 eV.
XRD. XRD patterns were collected at room temperature withan equipment using Cu KR radiation at 40 kV and 30 mA. Themeasurement was carried out in 2θ range of 5-90° at a scanningrate of 10° min-1.
TPR. TPR of the catalysts was performed using a conven-tional apparatus using thermal conductivity (TC) detection. Anamount (0.1 g) of each sample was placed in a U-shaped quartzcell. The sample was calcined in 10% O2 at 500 °C for 2 h andthen cooled to room temperature. TPR profiles were taken fromroom temperature to 850-950 °C at a rate of 10 °C min-1, andthen the temperature was kept isothermal for 30 min. 8% H2 inN2 (30 mL/min) was used as reduction gas.
3. Results
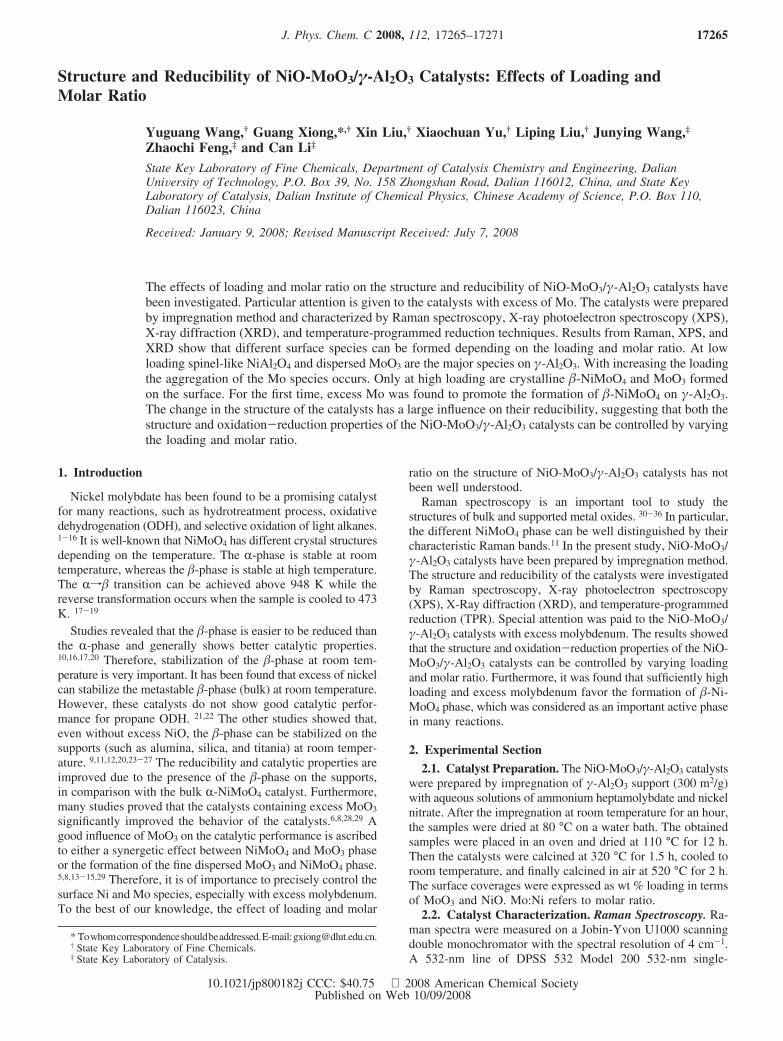
Figure 1 shows the Raman spectra of NiO-MoO3/γ-Al2O3
(Mo:Ni ) 1.27) with different loading. The samples at lowloading show two broad bands at 870 and 960 cm-1, which areassigned to asymmetric stretching mode of MosOsMo bridgeand stretching mode of ModO. 30,31 The weak bands at200-800 cm-1 are associated with γ-Al2O3, which may interferewith the bending and stretching modes of MoO3 in the region.This suggests that the dispersed polymerized molybdenum oxideis formed on γ-Al2O3, but the existence of the tetrahedralmolybdenum species cannot be excluded at this loading. Withincreasing the loading from 8.8 wt % to 27 wt %, the ModOband shows a red shift from 960 to 968 cm-1, indicating anaggregation of the polymerized molybdenum species. It was
reported that crystalline NiO shows two peaks at 460 and 500cm-1, and crystalline NiAl2O4 exhibits the bands at 200, 375,and 600 cm-1. The supported NiO possesses a Raman band at550 cm-1. 37 In Figure 1 no distinct band associated with Nispecies is observed, probably because they are overlapped bythe bands of the support or too weak to be observed. Studyreported elsewhere showed that the Raman bands of NiO appearonly when the loading of MoO3 is low. The Ni peaks are absentas the loading of MoO3 increases. 39 The bands at 828, 899,and 952 cm-1 start to appear in the spectrum of 37 wt % ofNiO-MoO3/γ-Al2O3, indicating the formation of a new structure.These peaks become prominent when the loading reaches 39wt %. The peaks cannot be assigned to R-NiMoO4 phase, whichpossesses the Raman bands at 708, 913, and 961 cm-1.11,38 Ithas been reported that crystalline �-NiMoO4 show the Ramanbands at 827, 900, 945, and 955 cm-1. 11,38 Therefore, it isevident that these peaks are associated with the formation ofcrystalline �-NiMoO4 phase on the support. The overlap of thepeaks at 945 and 955 cm-1 of the supported sample is probablydue to its poor crystalline structure in comparison with bulk�-NiMoO4. With increasing the loading the bands at 899 and952 cm-1 shift to higher wavenumber, and the intensities ofthe peaks increase. At 60 wt % NiO-MoO3/γ-Al2O3 showsadditional peaks at 243, 290, 340, 379, 669, 820, and 996 cm-1,which are characteristic of crystalline MoO3. 39 This indicatesthat both �-NiMoO4 phase and MoO3 phase can be formed athigh loading.
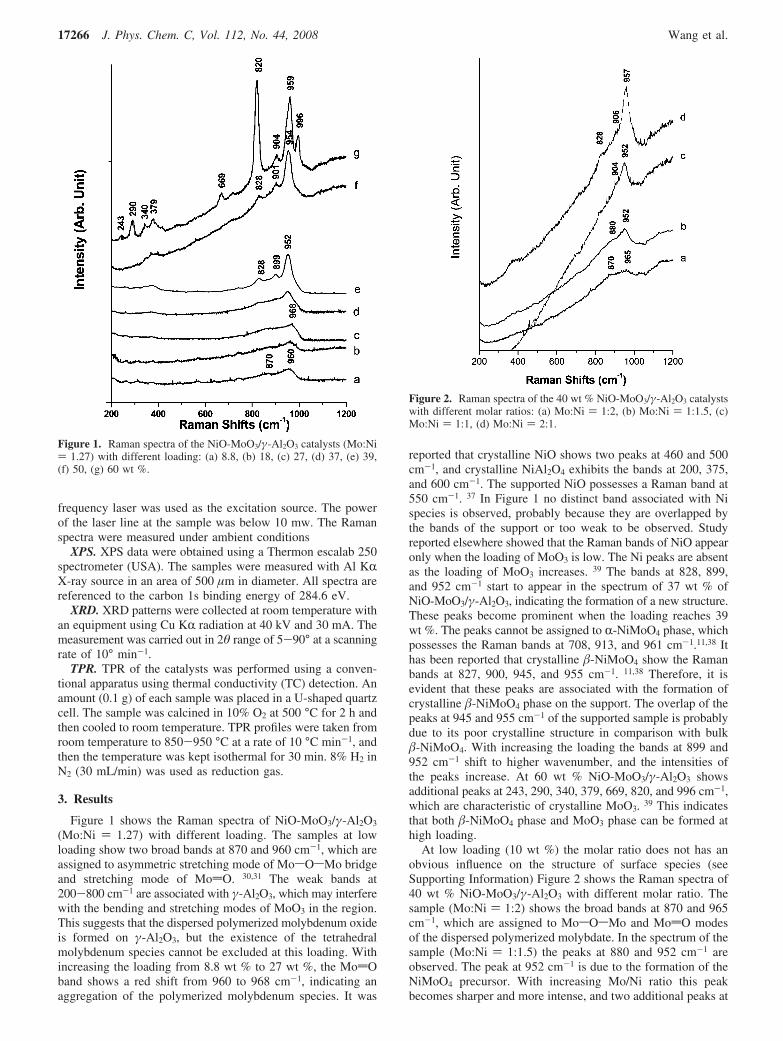
At low loading (10 wt %) the molar ratio does not has anobvious influence on the structure of surface species (seeSupporting Information) Figure 2 shows the Raman spectra of40 wt % NiO-MoO3/γ-Al2O3 with different molar ratio. Thesample (Mo:Ni ) 1:2) shows the broad bands at 870 and 965cm-1, which are assigned to MosOsMo and ModO modesof the dispersed polymerized molybdate. In the spectrum of thesample (Mo:Ni ) 1:1.5) the peaks at 880 and 952 cm-1 areobserved. The peak at 952 cm-1 is due to the formation of theNiMoO4 precursor. With increasing Mo/Ni ratio this peakbecomes sharper and more intense, and two additional peaks at
Figure 1. Raman spectra of the NiO-MoO3/γ-Al2O3 catalysts (Mo:Ni) 1.27) with different loading: (a) 8.8, (b) 18, (c) 27, (d) 37, (e) 39,(f) 50, (g) 60 wt %.
Figure 2. Raman spectra of the 40 wt % NiO-MoO3/γ-Al2O3 catalystswith different molar ratios: (a) Mo:Ni ) 1:2, (b) Mo:Ni ) 1:1.5, (c)Mo:Ni ) 1:1, (d) Mo:Ni ) 2:1.
17266 J. Phys. Chem. C, Vol. 112, No. 44, 2008 Wang et al.
828 and 904-906 cm-1 appear. This suggests that a wellcrystallized NiMoO4 phase is formed as the Mo/Ni ratioincreases. The formation of small amount of MoO3 cannot beexcluded since MoO3 exhibits the peak at 821 cm-1.
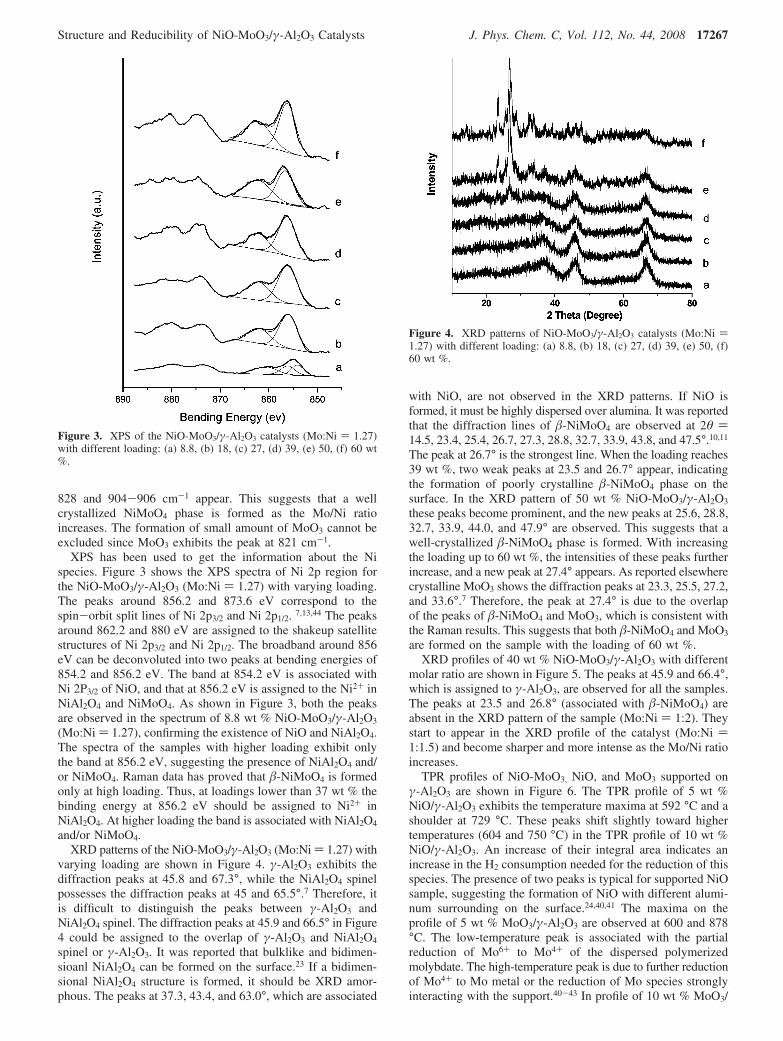
XPS has been used to get the information about the Nispecies. Figure 3 shows the XPS spectra of Ni 2p region forthe NiO-MoO3/γ-Al2O3 (Mo:Ni ) 1.27) with varying loading.The peaks around 856.2 and 873.6 eV correspond to thespin-orbit split lines of Ni 2p3/2 and Ni 2p1/2. 7,13,44 The peaksaround 862.2 and 880 eV are assigned to the shakeup satellitestructures of Ni 2p3/2 and Ni 2p1/2. The broadband around 856eV can be deconvoluted into two peaks at bending energies of854.2 and 856.2 eV. The band at 854.2 eV is associated withNi 2P3/2 of NiO, and that at 856.2 eV is assigned to the Ni2+ inNiAl2O4 and NiMoO4. As shown in Figure 3, both the peaksare observed in the spectrum of 8.8 wt % NiO-MoO3/γ-Al2O3
(Mo:Ni ) 1.27), confirming the existence of NiO and NiAl2O4.The spectra of the samples with higher loading exhibit onlythe band at 856.2 eV, suggesting the presence of NiAl2O4 and/or NiMoO4. Raman data has proved that �-NiMoO4 is formedonly at high loading. Thus, at loadings lower than 37 wt % thebinding energy at 856.2 eV should be assigned to Ni2+ inNiAl2O4. At higher loading the band is associated with NiAl2O4
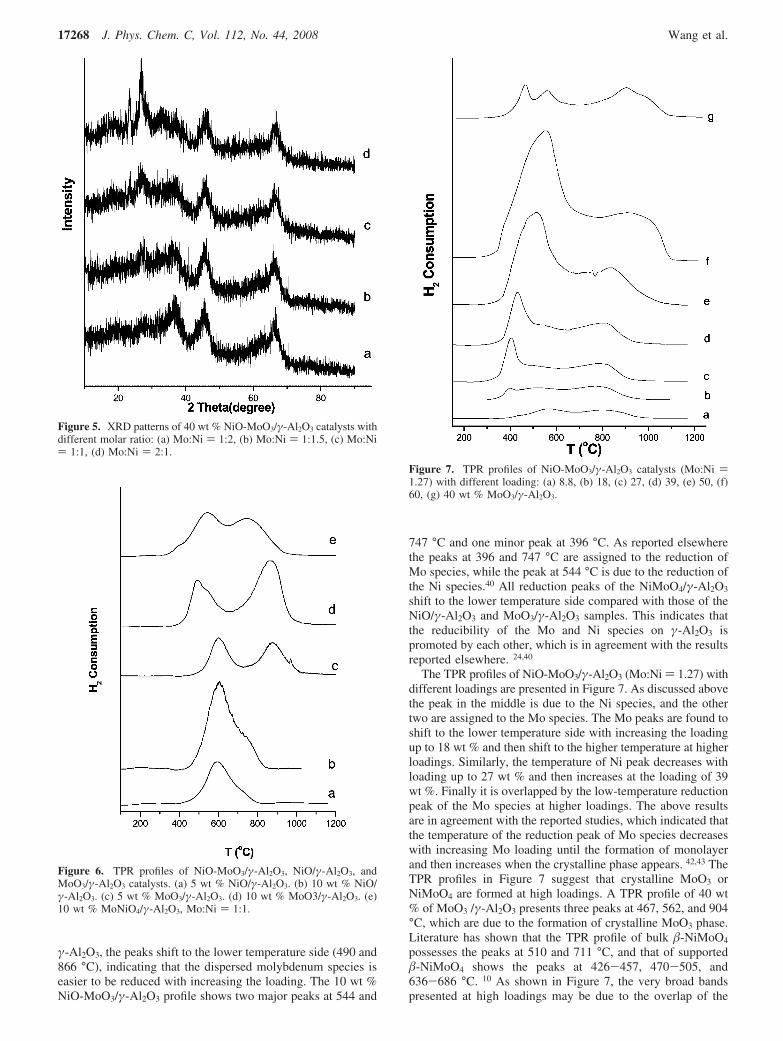
and/or NiMoO4.XRD patterns of the NiO-MoO3/γ-Al2O3 (Mo:Ni ) 1.27) with
varying loading are shown in Figure 4. γ-Al2O3 exhibits thediffraction peaks at 45.8 and 67.3°, while the NiAl2O4 spinelpossesses the diffraction peaks at 45 and 65.5°.7 Therefore, itis difficult to distinguish the peaks between γ-Al2O3 andNiAl2O4 spinel. The diffraction peaks at 45.9 and 66.5° in Figure4 could be assigned to the overlap of γ-Al2O3 and NiAl2O4
spinel or γ-Al2O3. It was reported that bulklike and bidimen-sioanl NiAl2O4 can be formed on the surface.23 If a bidimen-sional NiAl2O4 structure is formed, it should be XRD amor-phous. The peaks at 37.3, 43.4, and 63.0°, which are associated
with NiO, are not observed in the XRD patterns. If NiO isformed, it must be highly dispersed over alumina. It was reportedthat the diffraction lines of �-NiMoO4 are observed at 2θ )14.5, 23.4, 25.4, 26.7, 27.3, 28.8, 32.7, 33.9, 43.8, and 47.5°.10,11
The peak at 26.7° is the strongest line. When the loading reaches39 wt %, two weak peaks at 23.5 and 26.7° appear, indicatingthe formation of poorly crystalline �-NiMoO4 phase on thesurface. In the XRD pattern of 50 wt % NiO-MoO3/γ-Al2O3
these peaks become prominent, and the new peaks at 25.6, 28.8,32.7, 33.9, 44.0, and 47.9° are observed. This suggests that awell-crystallized �-NiMoO4 phase is formed. With increasingthe loading up to 60 wt %, the intensities of these peaks furtherincrease, and a new peak at 27.4° appears. As reported elsewherecrystalline MoO3 shows the diffraction peaks at 23.3, 25.5, 27.2,and 33.6°.7 Therefore, the peak at 27.4° is due to the overlapof the peaks of �-NiMoO4 and MoO3, which is consistent withthe Raman results. This suggests that both �-NiMoO4 and MoO3
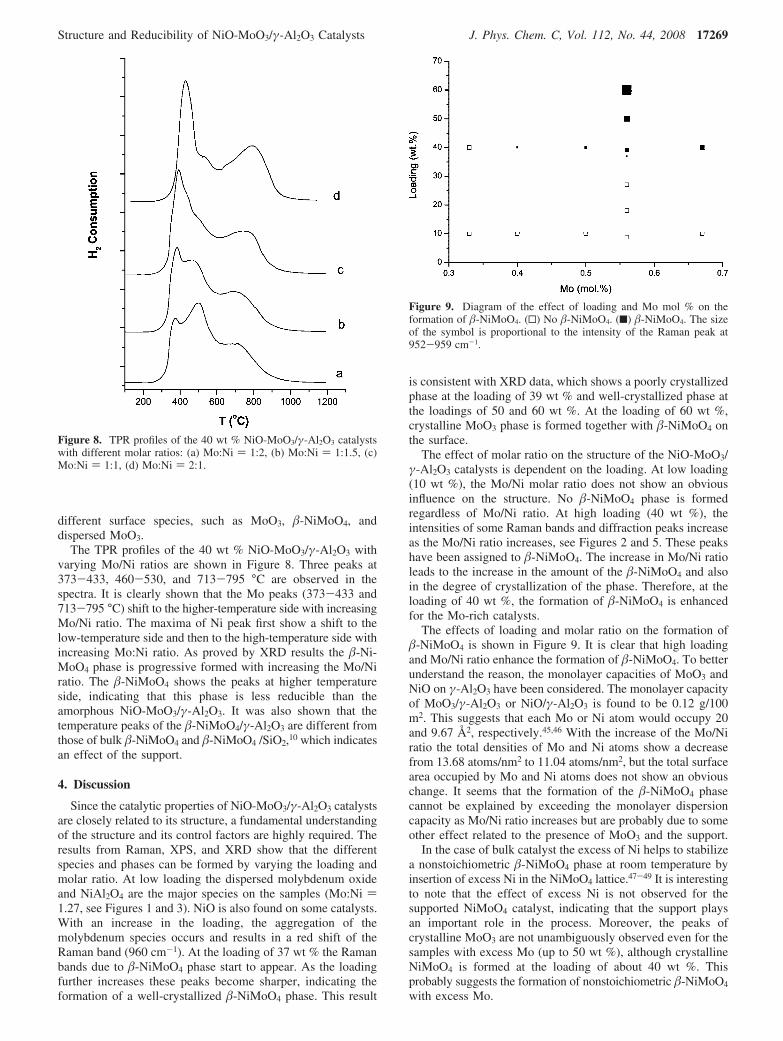
are formed on the sample with the loading of 60 wt %.XRD profiles of 40 wt % NiO-MoO3/γ-Al2O3 with different
molar ratio are shown in Figure 5. The peaks at 45.9 and 66.4°,which is assigned to γ-Al2O3, are observed for all the samples.The peaks at 23.5 and 26.8° (associated with �-NiMoO4) areabsent in the XRD pattern of the sample (Mo:Ni ) 1:2). Theystart to appear in the XRD profile of the catalyst (Mo:Ni )1:1.5) and become sharper and more intense as the Mo/Ni ratioincreases.
TPR profiles of NiO-MoO3, NiO, and MoO3 supported onγ-Al2O3 are shown in Figure 6. The TPR profile of 5 wt %NiO/γ-Al2O3 exhibits the temperature maxima at 592 °C and ashoulder at 729 °C. These peaks shift slightly toward highertemperatures (604 and 750 °C) in the TPR profile of 10 wt %NiO/γ-Al2O3. An increase of their integral area indicates anincrease in the H2 consumption needed for the reduction of thisspecies. The presence of two peaks is typical for supported NiOsample, suggesting the formation of NiO with different alumi-num surrounding on the surface.24,40,41 The maxima on theprofile of 5 wt % MoO3/γ-Al2O3 are observed at 600 and 878°C. The low-temperature peak is associated with the partialreduction of Mo6+ to Mo4+ of the dispersed polymerizedmolybdate. The high-temperature peak is due to further reductionof Mo4+ to Mo metal or the reduction of Mo species stronglyinteracting with the support.40-43 In profile of 10 wt % MoO3/
Figure 3. XPS of the NiO-MoO3/γ-Al2O3 catalysts (Mo:Ni ) 1.27)with different loading: (a) 8.8, (b) 18, (c) 27, (d) 39, (e) 50, (f) 60 wt%.
Figure 4. XRD patterns of NiO-MoO3/γ-Al2O3 catalysts (Mo:Ni )1.27) with different loading: (a) 8.8, (b) 18, (c) 27, (d) 39, (e) 50, (f)60 wt %.
Structure and Reducibility of NiO-MoO3/γ-Al2O3 Catalysts J. Phys. Chem. C, Vol. 112, No. 44, 2008 17267
γ-Al2O3, the peaks shift to the lower temperature side (490 and866 °C), indicating that the dispersed molybdenum species iseasier to be reduced with increasing the loading. The 10 wt %NiO-MoO3/γ-Al2O3 profile shows two major peaks at 544 and
747 °C and one minor peak at 396 °C. As reported elsewherethe peaks at 396 and 747 °C are assigned to the reduction ofMo species, while the peak at 544 °C is due to the reduction ofthe Ni species.40 All reduction peaks of the NiMoO4/γ-Al2O3
shift to the lower temperature side compared with those of theNiO/γ-Al2O3 and MoO3/γ-Al2O3 samples. This indicates thatthe reducibility of the Mo and Ni species on γ-Al2O3 ispromoted by each other, which is in agreement with the resultsreported elsewhere. 24,40
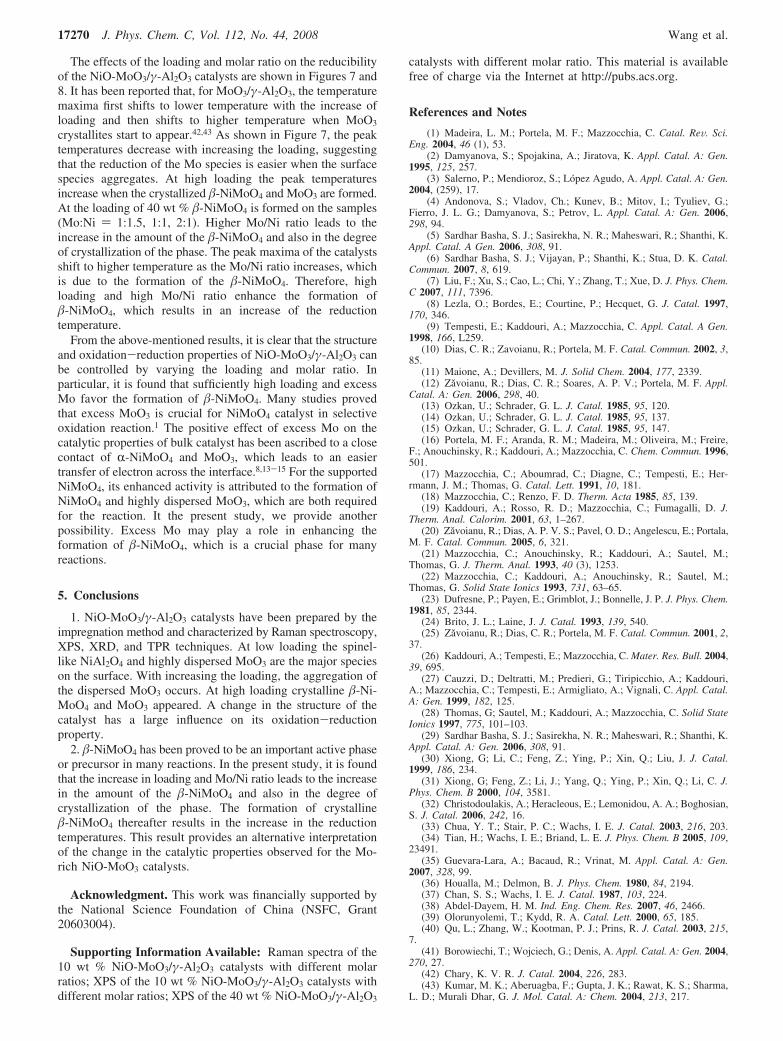
The TPR profiles of NiO-MoO3/γ-Al2O3 (Mo:Ni ) 1.27) withdifferent loadings are presented in Figure 7. As discussed abovethe peak in the middle is due to the Ni species, and the othertwo are assigned to the Mo species. The Mo peaks are found toshift to the lower temperature side with increasing the loadingup to 18 wt % and then shift to the higher temperature at higherloadings. Similarly, the temperature of Ni peak decreases withloading up to 27 wt % and then increases at the loading of 39wt %. Finally it is overlapped by the low-temperature reductionpeak of the Mo species at higher loadings. The above resultsare in agreement with the reported studies, which indicated thatthe temperature of the reduction peak of Mo species decreaseswith increasing Mo loading until the formation of monolayerand then increases when the crystalline phase appears. 42,43 TheTPR profiles in Figure 7 suggest that crystalline MoO3 orNiMoO4 are formed at high loadings. A TPR profile of 40 wt% of MoO3 /γ-Al2O3 presents three peaks at 467, 562, and 904°C, which are due to the formation of crystalline MoO3 phase.Literature has shown that the TPR profile of bulk �-NiMoO4
possesses the peaks at 510 and 711 °C, and that of supported�-NiMoO4 shows the peaks at 426-457, 470-505, and636-686 °C. 10 As shown in Figure 7, the very broad bandspresented at high loadings may be due to the overlap of the
Figure 5. XRD patterns of 40 wt % NiO-MoO3/γ-Al2O3 catalysts withdifferent molar ratio: (a) Mo:Ni ) 1:2, (b) Mo:Ni ) 1:1.5, (c) Mo:Ni) 1:1, (d) Mo:Ni ) 2:1.
Figure 6. TPR profiles of NiO-MoO3/γ-Al2O3, NiO/γ-Al2O3, andMoO3/γ-Al2O3 catalysts. (a) 5 wt % NiO/γ-Al2O3. (b) 10 wt % NiO/γ-Al2O3. (c) 5 wt % MoO3/γ-Al2O3. (d) 10 wt % MoO3/γ-Al2O3. (e)10 wt % MoNiO4/γ-Al2O3, Mo:Ni ) 1:1.
Figure 7. TPR profiles of NiO-MoO3/γ-Al2O3 catalysts (Mo:Ni )1.27) with different loading: (a) 8.8, (b) 18, (c) 27, (d) 39, (e) 50, (f)60, (g) 40 wt % MoO3/γ-Al2O3.
17268 J. Phys. Chem. C, Vol. 112, No. 44, 2008 Wang et al.
different surface species, such as MoO3, �-NiMoO4, anddispersed MoO3.
The TPR profiles of the 40 wt % NiO-MoO3/γ-Al2O3 withvarying Mo/Ni ratios are shown in Figure 8. Three peaks at373-433, 460-530, and 713-795 °C are observed in thespectra. It is clearly shown that the Mo peaks (373-433 and713-795 °C) shift to the higher-temperature side with increasingMo/Ni ratio. The maxima of Ni peak first show a shift to thelow-temperature side and then to the high-temperature side withincreasing Mo:Ni ratio. As proved by XRD results the �-Ni-MoO4 phase is progressive formed with increasing the Mo/Niratio. The �-NiMoO4 shows the peaks at higher temperatureside, indicating that this phase is less reducible than theamorphous NiO-MoO3/γ-Al2O3. It was also shown that thetemperature peaks of the �-NiMoO4/γ-Al2O3 are different fromthose of bulk �-NiMoO4 and �-NiMoO4 /SiO2,10 which indicatesan effect of the support.
4. Discussion
Since the catalytic properties of NiO-MoO3/γ-Al2O3 catalystsare closely related to its structure, a fundamental understandingof the structure and its control factors are highly required. Theresults from Raman, XPS, and XRD show that the differentspecies and phases can be formed by varying the loading andmolar ratio. At low loading the dispersed molybdenum oxideand NiAl2O4 are the major species on the samples (Mo:Ni )1.27, see Figures 1 and 3). NiO is also found on some catalysts.With an increase in the loading, the aggregation of themolybdenum species occurs and results in a red shift of theRaman band (960 cm-1). At the loading of 37 wt % the Ramanbands due to �-NiMoO4 phase start to appear. As the loadingfurther increases these peaks become sharper, indicating theformation of a well-crystallized �-NiMoO4 phase. This result
is consistent with XRD data, which shows a poorly crystallizedphase at the loading of 39 wt % and well-crystallized phase atthe loadings of 50 and 60 wt %. At the loading of 60 wt %,crystalline MoO3 phase is formed together with �-NiMoO4 onthe surface.
The effect of molar ratio on the structure of the NiO-MoO3/γ-Al2O3 catalysts is dependent on the loading. At low loading(10 wt %), the Mo/Ni molar ratio does not show an obviousinfluence on the structure. No �-NiMoO4 phase is formedregardless of Mo/Ni ratio. At high loading (40 wt %), theintensities of some Raman bands and diffraction peaks increaseas the Mo/Ni ratio increases, see Figures 2 and 5. These peakshave been assigned to �-NiMoO4. The increase in Mo/Ni ratioleads to the increase in the amount of the �-NiMoO4 and alsoin the degree of crystallization of the phase. Therefore, at theloading of 40 wt %, the formation of �-NiMoO4 is enhancedfor the Mo-rich catalysts.
The effects of loading and molar ratio on the formation of�-NiMoO4 is shown in Figure 9. It is clear that high loadingand Mo/Ni ratio enhance the formation of �-NiMoO4. To betterunderstand the reason, the monolayer capacities of MoO3 andNiO on γ-Al2O3 have been considered. The monolayer capacityof MoO3/γ-Al2O3 or NiO/γ-Al2O3 is found to be 0.12 g/100m2. This suggests that each Mo or Ni atom would occupy 20and 9.67 Å2, respectively.45,46 With the increase of the Mo/Niratio the total densities of Mo and Ni atoms show a decreasefrom 13.68 atoms/nm2 to 11.04 atoms/nm2, but the total surfacearea occupied by Mo and Ni atoms does not show an obviouschange. It seems that the formation of the �-NiMoO4 phasecannot be explained by exceeding the monolayer dispersioncapacity as Mo/Ni ratio increases but are probably due to someother effect related to the presence of MoO3 and the support.
In the case of bulk catalyst the excess of Ni helps to stabilizea nonstoichiometric �-NiMoO4 phase at room temperature byinsertion of excess Ni in the NiMoO4 lattice.47-49 It is interestingto note that the effect of excess Ni is not observed for thesupported NiMoO4 catalyst, indicating that the support playsan important role in the process. Moreover, the peaks ofcrystalline MoO3 are not unambiguously observed even for thesamples with excess Mo (up to 50 wt %), although crystallineNiMoO4 is formed at the loading of about 40 wt %. Thisprobably suggests the formation of nonstoichiometric �-NiMoO4
with excess Mo.
Figure 8. TPR profiles of the 40 wt % NiO-MoO3/γ-Al2O3 catalystswith different molar ratios: (a) Mo:Ni ) 1:2, (b) Mo:Ni ) 1:1.5, (c)Mo:Ni ) 1:1, (d) Mo:Ni ) 2:1.
Figure 9. Diagram of the effect of loading and Mo mol % on theformation of �-NiMoO4. (0) No �-NiMoO4. (9) �-NiMoO4. The sizeof the symbol is proportional to the intensity of the Raman peak at952-959 cm-1.
Structure and Reducibility of NiO-MoO3/γ-Al2O3 Catalysts J. Phys. Chem. C, Vol. 112, No. 44, 2008 17269
The effects of the loading and molar ratio on the reducibilityof the NiO-MoO3/γ-Al2O3 catalysts are shown in Figures 7 and8. It has been reported that, for MoO3/γ-Al2O3, the temperaturemaxima first shifts to lower temperature with the increase ofloading and then shifts to higher temperature when MoO3
crystallites start to appear.42,43 As shown in Figure 7, the peaktemperatures decrease with increasing the loading, suggestingthat the reduction of the Mo species is easier when the surfacespecies aggregates. At high loading the peak temperaturesincrease when the crystallized �-NiMoO4 and MoO3 are formed.At the loading of 40 wt % �-NiMoO4 is formed on the samples(Mo:Ni ) 1:1.5, 1:1, 2:1). Higher Mo/Ni ratio leads to theincrease in the amount of the �-NiMoO4 and also in the degreeof crystallization of the phase. The peak maxima of the catalystsshift to higher temperature as the Mo/Ni ratio increases, whichis due to the formation of the �-NiMoO4. Therefore, highloading and high Mo/Ni ratio enhance the formation of�-NiMoO4, which results in an increase of the reductiontemperature.
From the above-mentioned results, it is clear that the structureand oxidation-reduction properties of NiO-MoO3/γ-Al2O3 canbe controlled by varying the loading and molar ratio. Inparticular, it is found that sufficiently high loading and excessMo favor the formation of �-NiMoO4. Many studies provedthat excess MoO3 is crucial for NiMoO4 catalyst in selectiveoxidation reaction.1 The positive effect of excess Mo on thecatalytic properties of bulk catalyst has been ascribed to a closecontact of R-NiMoO4 and MoO3, which leads to an easiertransfer of electron across the interface.8,13-15 For the supportedNiMoO4, its enhanced activity is attributed to the formation ofNiMoO4 and highly dispersed MoO3, which are both requiredfor the reaction. It the present study, we provide anotherpossibility. Excess Mo may play a role in enhancing theformation of �-NiMoO4, which is a crucial phase for manyreactions.
5. Conclusions
1. NiO-MoO3/γ-Al2O3 catalysts have been prepared by theimpregnation method and characterized by Raman spectroscopy,XPS, XRD, and TPR techniques. At low loading the spinel-like NiAl2O4 and highly dispersed MoO3 are the major specieson the surface. With increasing the loading, the aggregation ofthe dispersed MoO3 occurs. At high loading crystalline �-Ni-MoO4 and MoO3 appeared. A change in the structure of thecatalyst has a large influence on its oxidation-reductionproperty.
2. �-NiMoO4 has been proved to be an important active phaseor precursor in many reactions. In the present study, it is foundthat the increase in loading and Mo/Ni ratio leads to the increasein the amount of the �-NiMoO4 and also in the degree ofcrystallization of the phase. The formation of crystalline�-NiMoO4 thereafter results in the increase in the reductiontemperatures. This result provides an alternative interpretationof the change in the catalytic properties observed for the Mo-rich NiO-MoO3 catalysts.
Acknowledgment. This work was financially supported bythe National Science Foundation of China (NSFC, Grant20603004).
Supporting Information Available: Raman spectra of the10 wt % NiO-MoO3/γ-Al2O3 catalysts with different molarratios; XPS of the 10 wt % NiO-MoO3/γ-Al2O3 catalysts withdifferent molar ratios; XPS of the 40 wt % NiO-MoO3/γ-Al2O3
catalysts with different molar ratio. This material is availablefree of charge via the Internet at http://pubs.acs.org.
References and Notes
(1) Madeira, L. M.; Portela, M. F.; Mazzocchia, C. Catal. ReV. Sci.Eng. 2004, 46 (1), 53.
(2) Damyanova, S.; Spojakina, A.; Jiratova, K. Appl. Catal. A: Gen.1995, 125, 257.
(3) Salerno, P.; Mendioroz, S.; Lopez Agudo, A. Appl. Catal. A: Gen.2004, (259), 17.
(4) Andonova, S.; Vladov, Ch.; Kunev, B.; Mitov, I.; Tyuliev, G.;Fierro, J. L. G.; Damyanova, S.; Petrov, L. Appl. Catal. A: Gen. 2006,298, 94.
(5) Sardhar Basha, S. J.; Sasirekha, N. R.; Maheswari, R.; Shanthi, K.Appl. Catal. A Gen. 2006, 308, 91.
(6) Sardhar Basha, S. J.; Vijayan, P.; Shanthi, K.; Stua, D. K. Catal.Commun. 2007, 8, 619.
(7) Liu, F.; Xu, S.; Cao, L.; Chi, Y.; Zhang, T.; Xue, D. J. Phys. Chem.C 2007, 111, 7396.
(8) Lezla, O.; Bordes, E.; Courtine, P.; Hecquet, G. J. Catal. 1997,170, 346.
(9) Tempesti, E.; Kaddouri, A.; Mazzocchia, C. Appl. Catal. A Gen.1998, 166, L259.
(10) Dias, C. R.; Zavoianu, R.; Portela, M. F. Catal. Commun. 2002, 3,85.
(11) Maione, A.; Devillers, M. J. Solid Chem. 2004, 177, 2339.(12) Zavoianu, R.; Dias, C. R.; Soares, A. P. V.; Portela, M. F. Appl.
Catal. A: Gen. 2006, 298, 40.(13) Ozkan, U.; Schrader, G. L. J. Catal. 1985, 95, 120.(14) Ozkan, U.; Schrader, G. L. J. Catal. 1985, 95, 137.(15) Ozkan, U.; Schrader, G. L. J. Catal. 1985, 95, 147.(16) Portela, M. F.; Aranda, R. M.; Madeira, M.; Oliveira, M.; Freire,
F.; Anouchinsky, R.; Kaddouri, A.; Mazzocchia, C. Chem. Commun. 1996,501.
(17) Mazzocchia, C.; Aboumrad, C.; Diagne, C.; Tempesti, E.; Her-rmann, J. M.; Thomas, G. Catal. Lett. 1991, 10, 181.
(18) Mazzocchia, C.; Renzo, F. D. Therm. Acta 1985, 85, 139.(19) Kaddouri, A.; Rosso, R. D.; Mazzocchia, C.; Fumagalli, D. J.
Therm. Anal. Calorim. 2001, 63, 1–267.(20) Zavoianu, R.; Dias, A. P. V. S.; Pavel, O. D.; Angelescu, E.; Portala,
M. F. Catal. Commun. 2005, 6, 321.(21) Mazzocchia, C.; Anouchinsky, R.; Kaddouri, A.; Sautel, M.;
Thomas, G. J. Therm. Anal. 1993, 40 (3), 1253.(22) Mazzocchia, C.; Kaddouri, A.; Anouchinsky, R.; Sautel, M.;
Thomas, G. Solid State Ionics 1993, 731, 63–65.(23) Dufresne, P.; Payen, E.; Grimblot, J.; Bonnelle, J. P. J. Phys. Chem.
1981, 85, 2344.(24) Brito, J. L.; Laine, J. J. Catal. 1993, 139, 540.(25) Zavoianu, R.; Dias, C. R.; Portela, M. F. Catal. Commun. 2001, 2,
37.(26) Kaddouri, A.; Tempesti, E.; Mazzocchia, C. Mater. Res. Bull. 2004,
39, 695.(27) Cauzzi, D.; Deltratti, M.; Predieri, G.; Tiripicchio, A.; Kaddouri,
A.; Mazzocchia, C.; Tempesti, E.; Armigliato, A.; Vignali, C. Appl. Catal.A: Gen. 1999, 182, 125.
(28) Thomas, G; Sautel, M.; Kaddouri, A.; Mazzocchia, C. Solid StateIonics 1997, 775, 101–103.
(29) Sardhar Basha, S. J.; Sasirekha, N. R.; Maheswari, R.; Shanthi, K.Appl. Catal. A: Gen. 2006, 308, 91.
(30) Xiong, G; Li, C.; Feng, Z.; Ying, P.; Xin, Q.; Liu, J. J. Catal.1999, 186, 234.
(31) Xiong, G; Feng, Z.; Li, J.; Yang, Q.; Ying, P.; Xin, Q.; Li, C. J.Phys. Chem. B 2000, 104, 3581.
(32) Christodoulakis, A.; Heracleous, E.; Lemonidou, A. A.; Boghosian,S. J. Catal. 2006, 242, 16.
(33) Chua, Y. T.; Stair, P. C.; Wachs, I. E. J. Catal. 2003, 216, 203.(34) Tian, H.; Wachs, I. E.; Briand, L. E. J. Phys. Chem. B 2005, 109,
23491.(35) Guevara-Lara, A.; Bacaud, R.; Vrinat, M. Appl. Catal. A: Gen.
2007, 328, 99.(36) Houalla, M.; Delmon, B. J. Phys. Chem. 1980, 84, 2194.(37) Chan, S. S.; Wachs, I. E. J. Catal. 1987, 103, 224.(38) Abdel-Dayem, H. M. Ind. Eng. Chem. Res. 2007, 46, 2466.(39) Olorunyolemi, T.; Kydd, R. A. Catal. Lett. 2000, 65, 185.(40) Qu, L.; Zhang, W.; Kootman, P. J.; Prins, R. J. Catal. 2003, 215,
7.(41) Borowiechi, T.; Wojciech, G.; Denis, A. Appl. Catal. A: Gen. 2004,
270, 27.(42) Chary, K. V. R. J. Catal. 2004, 226, 283.(43) Kumar, M. K.; Aberuagba, F.; Gupta, J. K.; Rawat, K. S.; Sharma,
L. D.; Murali Dhar, G. J. Mol. Catal. A: Chem. 2004, 213, 217.
17270 J. Phys. Chem. C, Vol. 112, No. 44, 2008 Wang et al.
(44) Hernandez-Huesca, R.; Merida-Robles, J.; Maireles-Torres, P.;Rodrıguez-Castellon, E.; Jimenez-Lpez, A. J. Catal. 2001, 203, 122.
(45) Xie, Y.; Tang, Y. AdV. Catal. 1990, 37, 1.
(46) Wang, X.; Zhao, B.; Jiang, D.; Xie, Y. Appl. Catal. A: Gen. 1999,188, 201.
(47) Plyasova, L. M.; Ivanchenko, L. M.; Yu, I.; Andrushkevich, M. M.;Buyanov, R. A.; Itenberg, I. Sh.; Khramova, G. A.; Karakchiev, L. G.;
Kusyova, G. N.; Stepavov, G. A.; Tsailingol’d, A. L.; Pilipenko, F. S. Kinet.Catal. 1973, 14 (4), 887.
(48) Mazzocchia, C.; Rosso, R. Del.; Centola, P. An. Quim. 1983, 79(1), 108.
(49) Renzo, F. Di; Mazzocchia, C.; Thomas, G.; Vernay, A. M. React.Solids 1988, 6 (2-3), 145.
JP800182J
Structure and Reducibility of NiO-MoO3/γ-Al2O3 Catalysts J. Phys. Chem. C, Vol. 112, No. 44, 2008 17271