Embed Size (px)
Citation preview

TP B5 Struktureinflüsse auf C‐Transformationen, C‐Akkumulation und Mikroorganismen während der initialen Fließgewässergenese
• Struktureinflüsse auf C‐Transformation• Alter org. Kohlenstoff
L. Gerull, A. Frossard, U. Risse‐Buhl, C. Mendoza‐Lera, M.O. Gessner, F. Hagedorn, A. Dümig, W. Schaaf, S. Nii‐Annang, M. Mutz SFB/TR38

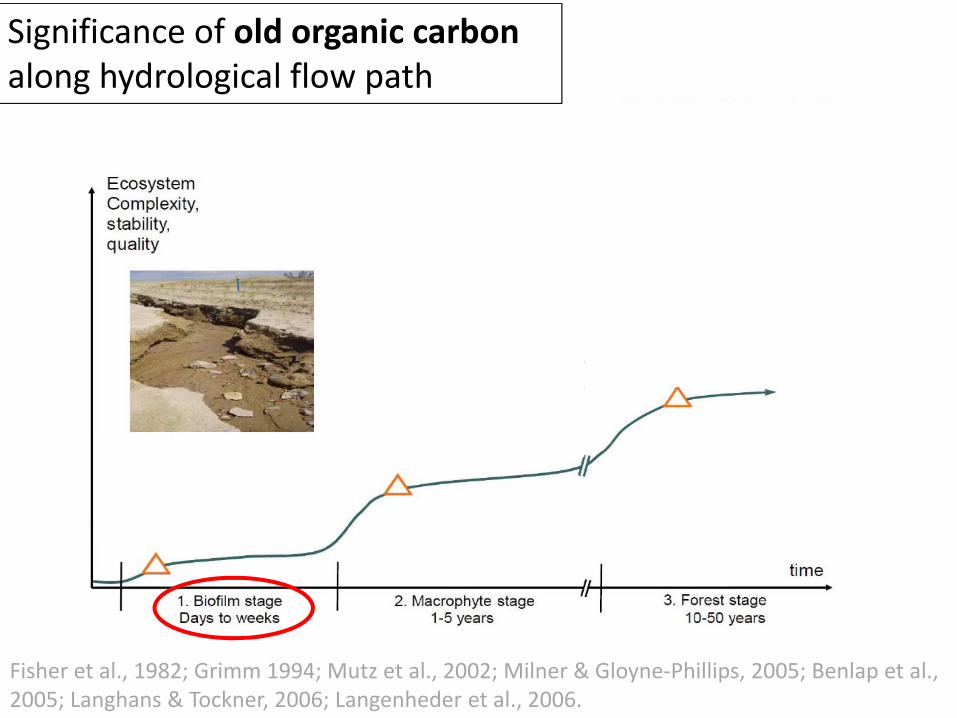
Fisher et al., 1982; Grimm 1994; Mutz et al., 2002; Milner & Gloyne‐Phillips, 2005; Benlap et al., 2005; Langhans & Tockner, 2006; Langenheder et al., 2006.

Fisher et al., 1982; Grimm 1994; Mutz et al., 2002; Milner & Gloyne‐Phillips, 2005; Benlap et al., 2005; Langhans & Tockner, 2006; Langenheder et al., 2006.

• Water availabilityalong flow path
• Sediment disturbance• Sediment sorting
• Quality & quantity org. C

2012
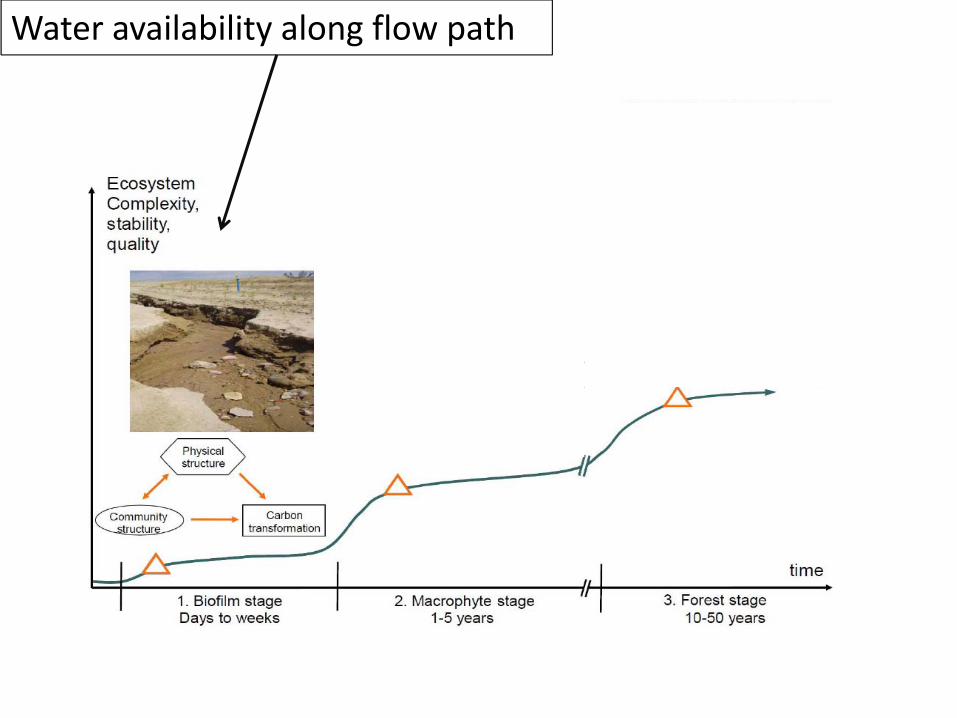
Water availability along flow path

groundwater clay layer
quaternary sands
Significance of water avialability along flow path linking terrestrial andaquatic habitats
Open‐land stage, 2007

Stream 1
Stream 3
Stream 2
GW
GW upwelling
Downwelling
TE
UP
DOPER
3x
Significance of water avialability along flow path

No significance of water avialability along flow path
Gerull, L., A. Frossard, M.O. Gessner & M. Mutz (2011). Variability of heterotrophic metabolism in small stream corridors of an early successional watershed, Journal of Geophysical Research, 116: G02012. DOI:10.1029/2010JG001516.
Sites along flowpath

Low level of overal activity
Gerull, L., A. Frossard, M.O. Gessner & M. Mutz (2011). Variability of heterotrophic metabolism in small stream corridors of an early successional watershed, Journal of Geophysical Research, 116: G02012. DOI:10.1029/2010JG001516.

Stream corridors aremetabolic hot spots
Gerull, L., A. Frossard, M.O. Gessner & M. Mutz (2011). Variability of heterotrophic metabolism in small stream corridors of an early successional watershed, Journal of Geophysical Research, 116: G02012. DOI:10.1029/2010JG001516.
TE
UP
DOPER
Catchment level, comparing terrestrial and aquatic habitats

Catchment level, comparing terrestrial and aquatic habitats
Gerull, L., A. Frossard, M.O. Gessner & M. Mutz (2011). Variability of heterotrophic metabolism in small stream corridors of an early successional watershed, Journal of Geophysical Research, 116: G02012. DOI:10.1029/2010JG001516.
TE
UP
DOPER
Perennial streams ~ 5 % of respiration in catchment
Hot moments in terrestrial soil !!!
(~ 100 days of wet conditions)
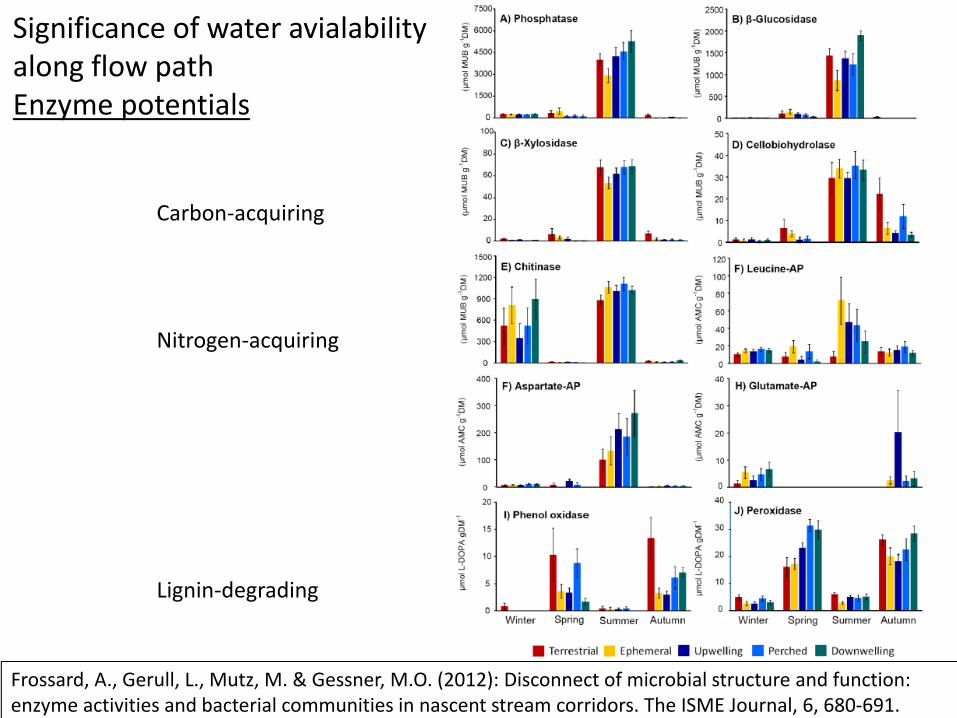
Significance of water avialabilityalong flow pathEnzyme potentials
Frossard, A., Gerull, L., Mutz, M. & Gessner, M.O. (2012): Disconnect of microbial structure and function: enzyme activities and bacterial communities in nascent stream corridors. The ISME Journal, 6, 680‐691.
Lignin‐degrading
Nitrogen‐acquiring
Carbon‐acquiring
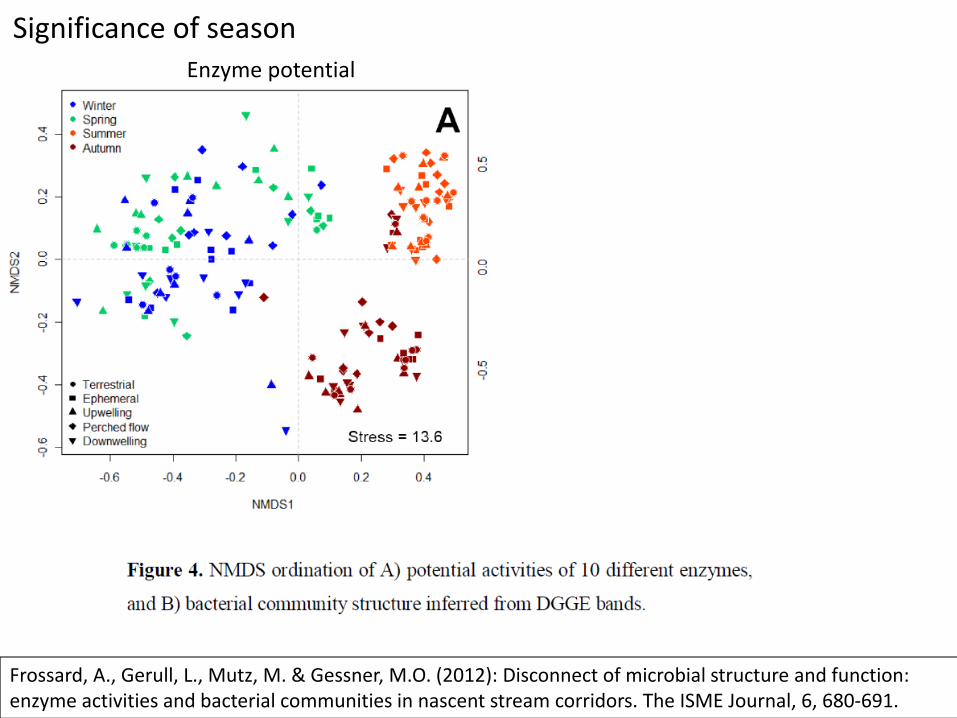
Significance of season
Frossard, A., Gerull, L., Mutz, M. & Gessner, M.O. (2012): Disconnect of microbial structure and function: enzyme activities and bacterial communities in nascent stream corridors. The ISME Journal, 6, 680‐691.
Enzyme potential Comm. structure bacteria

Frossard, A., Gerull, L., Mutz, M. & Gessner, M.O. (2012): Disconnect of microbial structure and function: enzyme activities and bacterial communities in nascent stream corridors. The ISME Journal, 6, 680‐691.
Enzyme potential Comm. structure bacteria
Significance of season
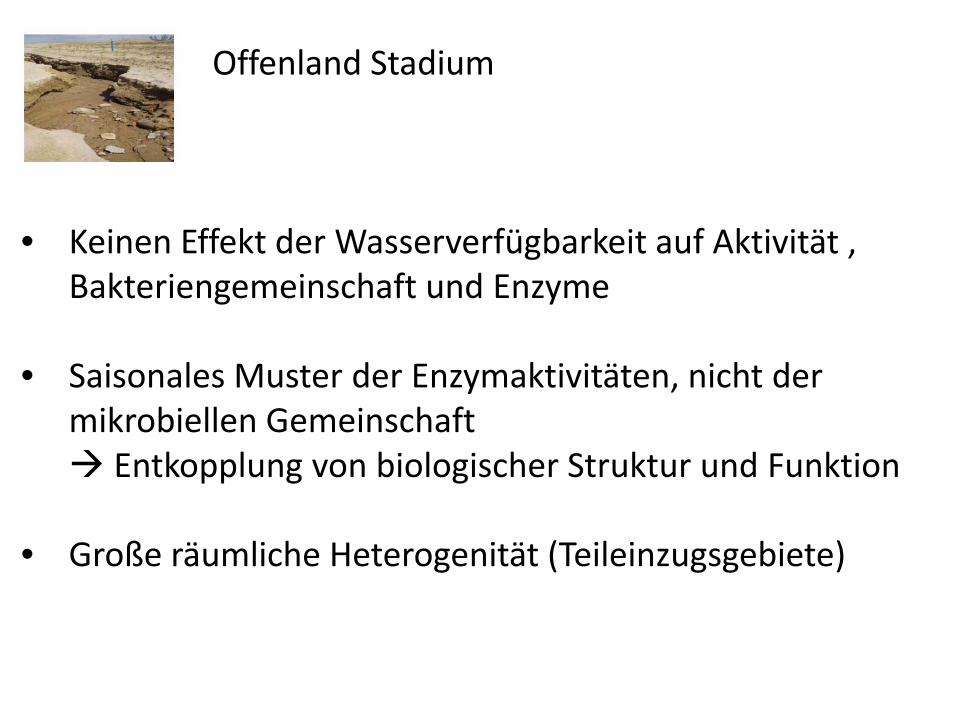
Offenland Stadium
• Keinen Effekt der Wasserverfügbarkeit auf Aktivität , Bakteriengemeinschaft und Enzyme
• Saisonales Muster der Enzymaktivitäten, nicht der mikrobiellen Gemeinschaft Entkopplung von biologischer Struktur und Funktion
• Große räumliche Heterogenität (Teileinzugsgebiete)

• Große räumliche Heterogenität (Teileinzugsgebiete)
Hinweis auf Bedeutung Qualität des OM
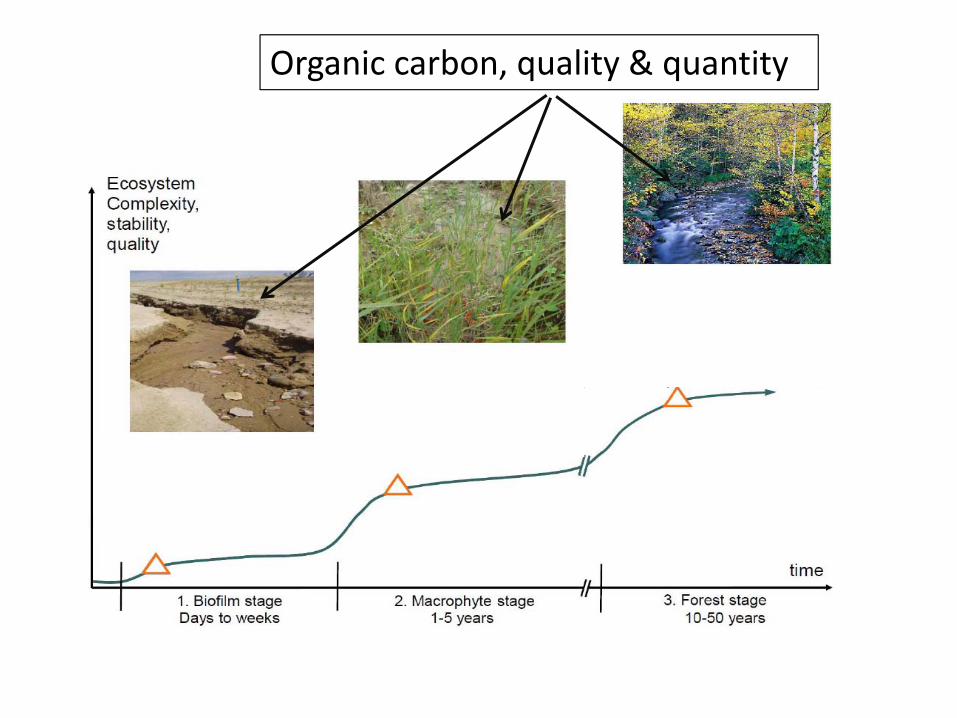
Organic carbon, quality & quantity
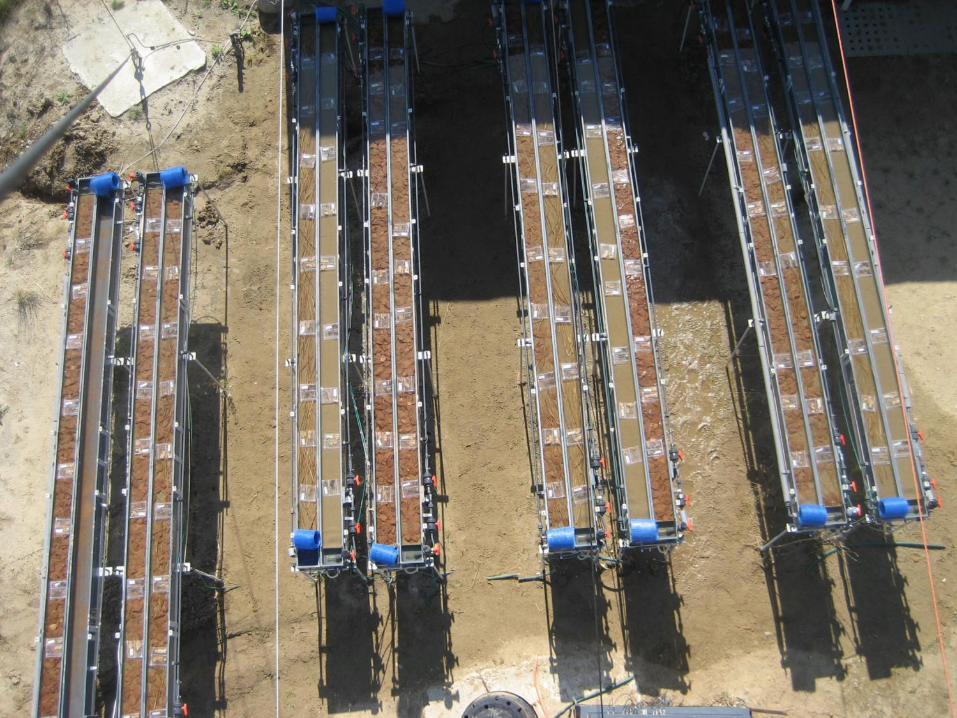

Experimental set‐up
1/5 of the leaves were buried
2
3
4
5
1 No litter
Calamagrostis 100 g/m2
Calamagrostis + Betula 2 x 50 g/m2
Betula 100 g/m2
Betula 250 g/m2
Fall 2009, 3 replicatesSampling after 4, 6, 8 and 10 weeks
4 cm
12 cm

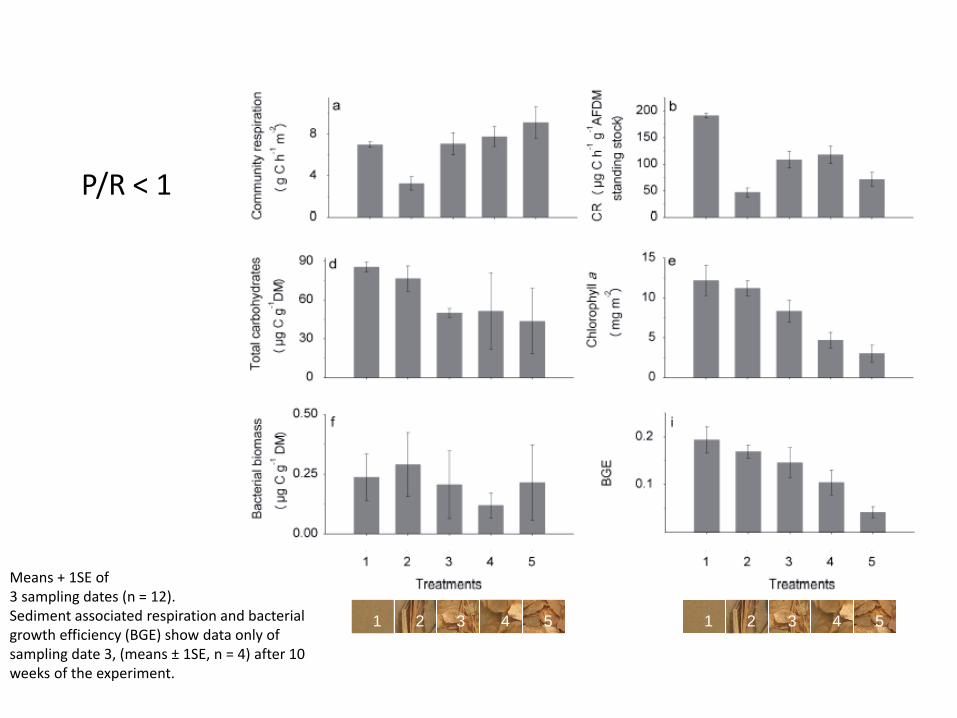
Means + 1SE of3 sampling dates (n = 12).Sediment associated respiration and bacterial growth efficiency (BGE) show data only of sampling date 3, (means ± 1SE, n = 4) after 10 weeks of the experiment.
P/R < 1
2 3 4 512 3 4 51
P/R < 1
2 3 4 512 3 4 51
Means + 1SE of3 sampling dates (n = 12).Sediment associated respiration and bacterial growth efficiency (BGE) show data only of sampling date 3, (means ± 1SE, n = 4) after 10 weeks of the experiment.
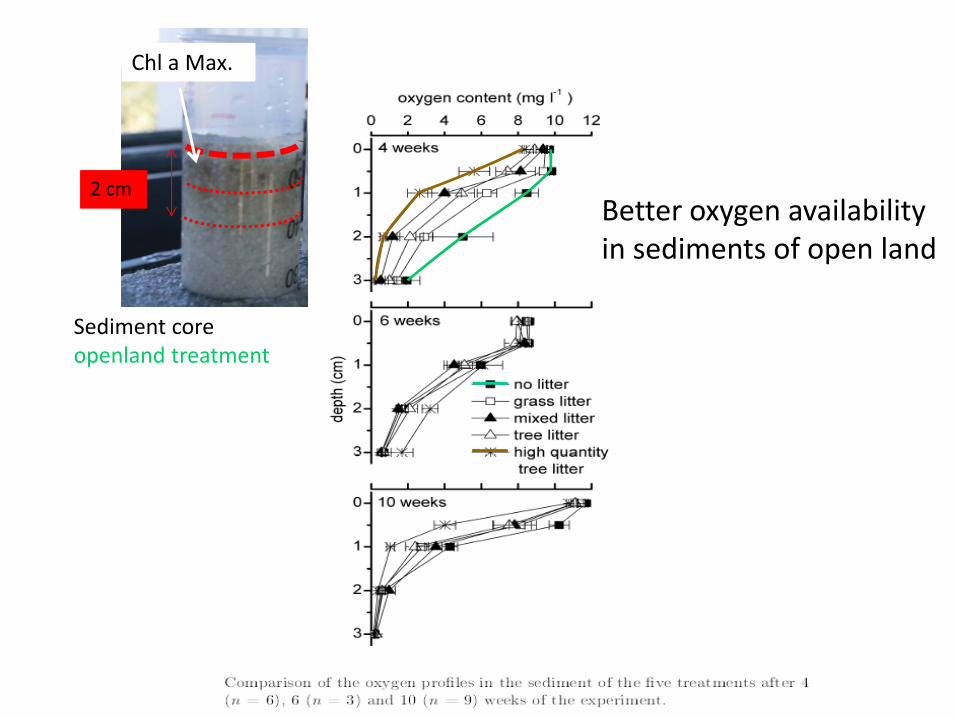
Chl a Max.
2 cm
Sediment coreopenland treatment
Better oxygen availabilityin sediments of open land
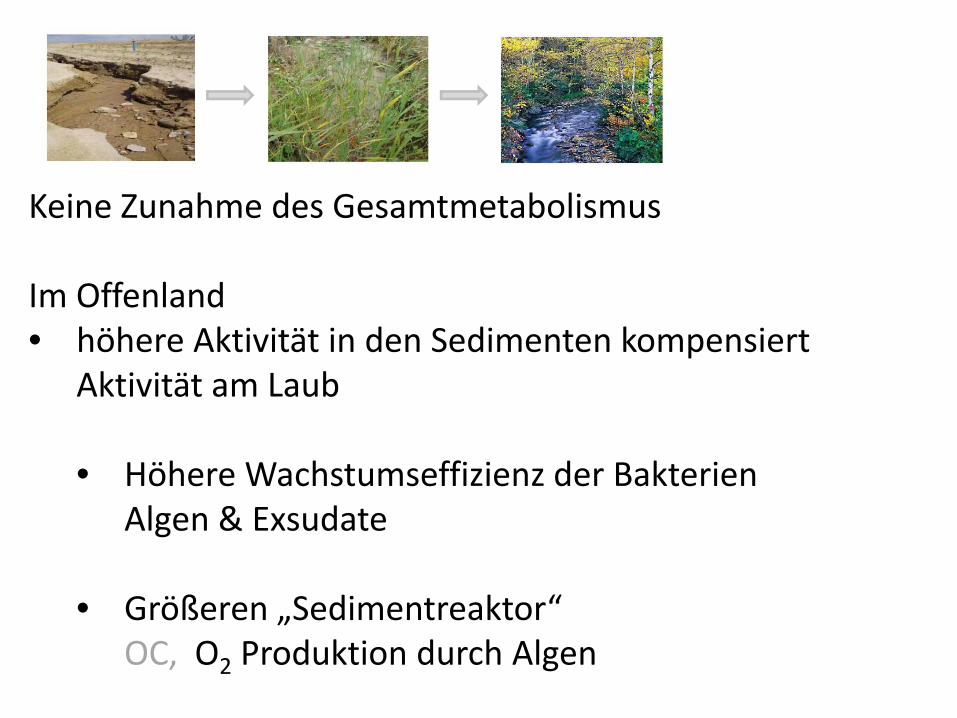
Keine Zunahme des Gesamtmetabolismus
Im Offenland • höhere Aktivität in den Sedimenten kompensiert
Aktivität am Laub
• Höhere Wachstumseffizienz der Bakterien Algen & Exsudate
• Größeren „Sedimentreaktor“ OC, O2 Produktion durch Algen
Fisher et al., 1982; Grimm 1994; Mutz et al., 2002; Milner & Gloyne‐Phillips, 2005; Benlap et al., 2005; Langhans & Tockner, 2006; Langenheder et al., 2006.
Significance of old organic carbonalong hydrological flow path

groundwater clay layer
quaternary sands
Can old organic carbon drive microbial activity in surface watersof a newly created landscape?
soil solution1.6 – 2.2 mg g‐1
(Gerwin et al. 2009)
hyporheic + stream water10.8 – 18.3 mg l‐1
(Gerull et al.2012)
pond water5.1 – 14.6 mg l‐1
(Leßmann et al. 2010)
DOC concentrations
Precipitation 2.8 mg l‐1
(Veste et al., 2010)

Dynamics of DOC concentrations along the hydrological flow path
• Seasonality• DOC increase 2008 ‐ 2010 in pond
(period Feb.‐May, permANOVA MS = 6.37, df = 1, p = 0.03)

Sampling sites in the experimental catchment Chicken Creek
EW central
upwelling groundwater in streamswater passed quaternary sand material
groundwater clay layer
quaternary sands
soil solutiontrickled rain water, 30‐80 cm depth
hyporheic stream water from alluvial fenwater passed streams and hyporheic zonesretention time in streams = ~ 0.01 d
pond watermixture of rain, streamand hyporheic waterretention time in pond= ~300 d (Kleeberg et al. 2009) Late winter / early spring 2010
3.5 weeks for soils solution
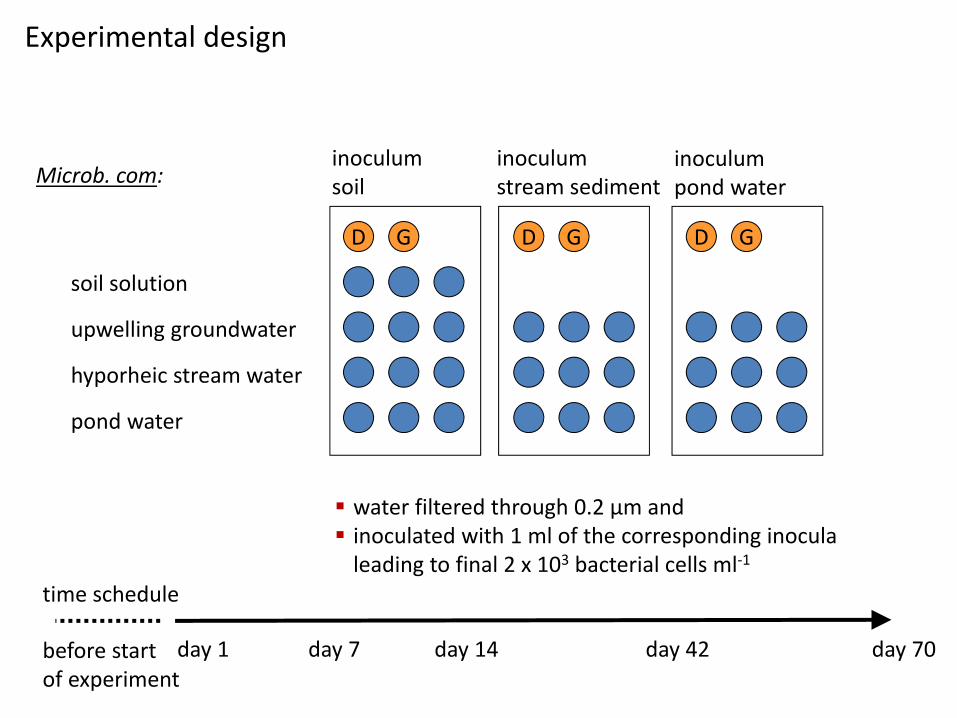
inoculum soil
D G
inoculum stream sediment
D G
inoculum pond water
D G
soil solution
upwelling groundwater
hyporheic stream water
pond water
water filtered through 0.2 µm and inoculated with 1 ml of the corresponding inocula leading to final 2 x 10³ bacterial cells ml‐1
day 7 day 14 day 42 day 70day 1before start of experiment
Experimental design
time schedule
Microb. com:
day 7 day 14 day 42 day 70day 1beforeinoculation
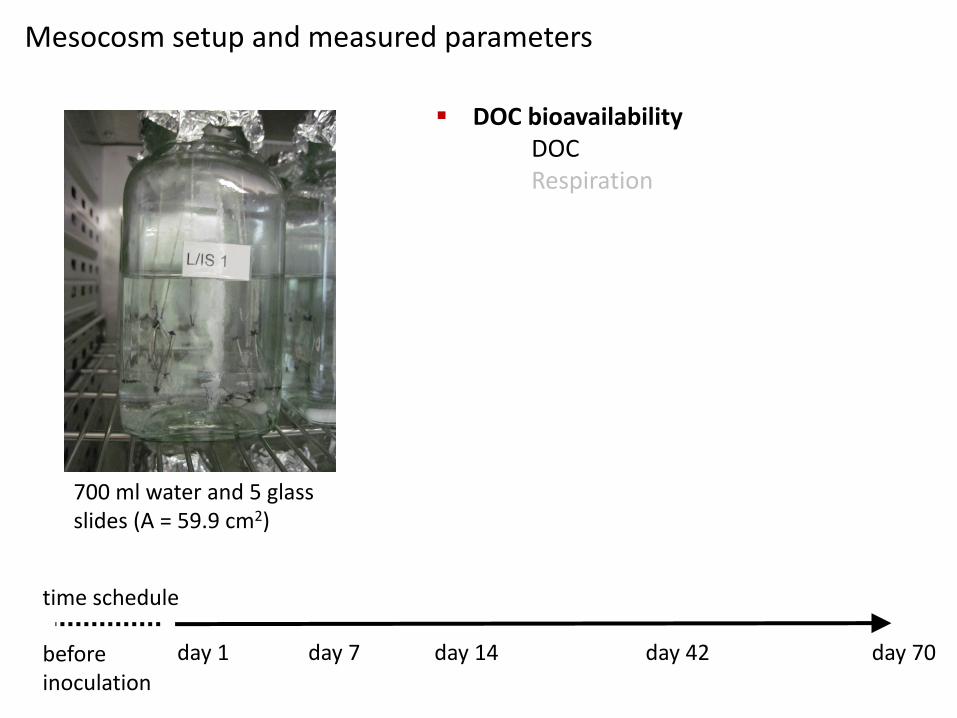
Mesocosm setup and measured parameters
time schedule
DOC bioavailabilityDOCRespiration
700 ml water and 5 glassslides (A = 59.9 cm2)

day 7 day 14 day 42 day 70day 1beforeinoculation
Mesocosm setup and measured parameters
time schedule
DOC bioavailabilityDOCRespiration
Organismsbacterial abundance
700 ml water and 5 glassslides (A = 59.9 cm2)

day 7 day 14 day 42 day 70day 1beforeinoculation
Mesocosm setup and measured parameters
time schedule
DOC bioavailabilityDOCRespiration
Organismsbacterial abundance
DOC‐Qualityspecific UV absorption at 285 nmtotal carbohydrateslow molecular acids13C NMR of initial water700 ml water and 5 glass
slides (A = 59.9 cm2)

0 2 4 6 8 10 12 14 16
pond water
hyporheic water
upwelling groundwater
soil solution
April 2010
* Trumbore S (2009) Radiocarbon and soil carbon dynamics. Annu Rev Earth Planet Sci. 37:47–66.Heimann M, Reichstein M (2008) Terrestrialecosystem carbon dynamics and climate feedbacks. Nature 451:289–292.17. Rumpel C, Kogel‐Knabner I, Bruhn F (2002) Vertical distribution, age, and chemical composition of organic carbon in town forest soils of different pedogenesis. Org. Geochem 33:1131–1142. Fontaine S, et al. (2007) Stability of organic carbon in deep soil layers controlled by fresh carbon supply. Nature 450:277–280.
Quaterny substr.3 000 – 16 000 years
Ground water2 600 – 2 800 years
DOC mean 14C ageInitial DOC (mg l‐1)
* ∼1,800–4,100 years
mean ± SD, n = 3(MS = 8.46, df = 3, p = 0.21)
13C signature of ‐25 to ‐30‰

DOC qualityMean carbohydrate concentration (glucose equivalent mg l-1)
0 2 4 6 8 10 12 14
pond water
hyporheic water
upwelling groundwater
soil solution
Mean specific UV absorption at 285 nm (l mg-1 DOC cm-1)
0 1 2 3 4
pond water
hyporheic water
upwelling groundwater
soil solutionmean of three inocula and time points ± SD, n (soil solution) = 6, n (all other waters) = 18
(MS = 5.19, df = 3, p = 0.03)

April DOC composition 13C NMR
Upwelling GW
Pond water
70
Abun
danc
e of
bio
film
bac
teria
(cel
ls c
m-2
)
105
106
107
108
0 7 70
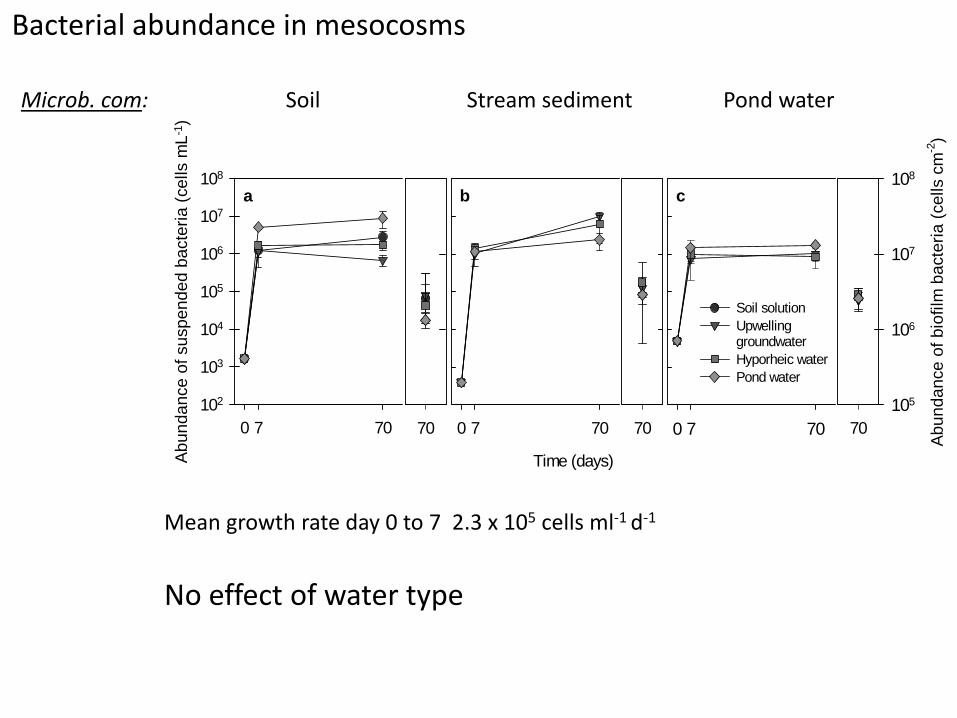
Soil solutionUpwellinggroundwaterHyporheic waterPond water
0 7 70
Abun
danc
e of
sus
pend
ed b
acte
ria (c
ells
mL-1
)
102
103
104
105
106
107
108
70
Time (days)
0 7 70 70
a b c
Mean growth rate day 0 to 7 2.3 x 10⁵ cells ml‐1 d‐1
Soil Stream sediment Pond waterMicrob. com:
Bacterial abundance in mesocosms
No effect of water type

• 20 % DOClabile and 80 % DOCrecalc (SE 0.02). • kL = 0.19 day‐1 (SE 0.09) • No decomposition of DOCrecalc during 70 days
DOC DOC 1 DOC ∙
DO
C (m
g L-1
)
0
5
10
15
20a b c
Time (days)
0.0001 7 14 42 70 01 7 14 42 70 01 7 14 42 70
Soil Stream sediment Pond waterMicrob. com.:
• No effect of water type, microb. com. (3 factorial permAnova)
DOC availability
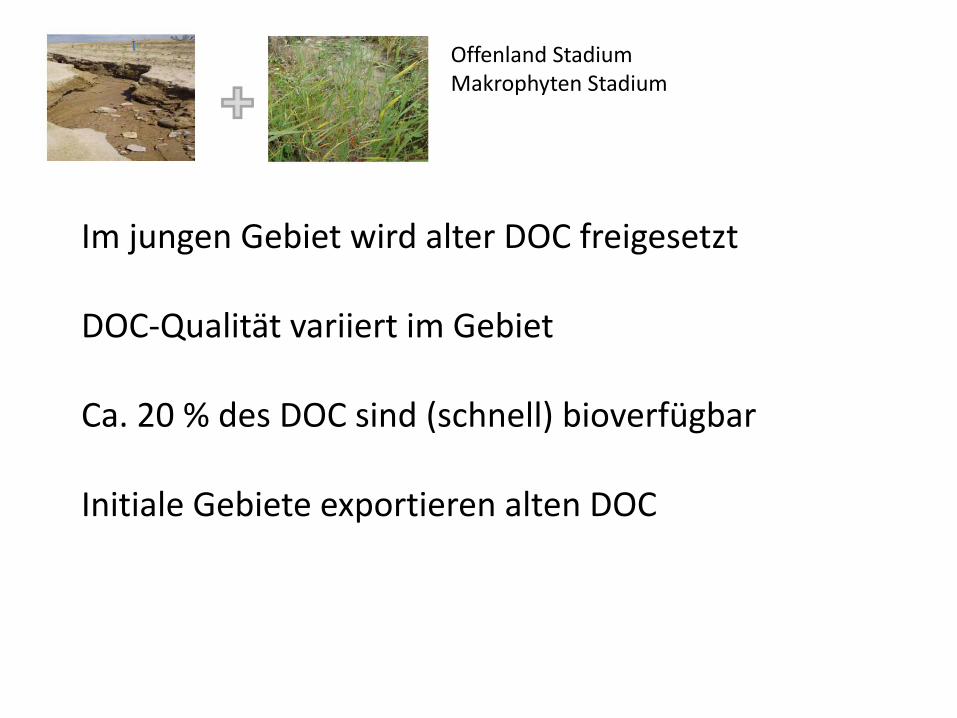
Im jungen Gebiet wird alter DOC freigesetzt
DOC‐Qualität variiert im Gebiet
Ca. 20 % des DOC sind (schnell) bioverfügbar
Initiale Gebiete exportieren alten DOC
Offenland StadiumMakrophyten Stadium

SFB/TR38
FazitSchnelle Differenzierung des anfänglich homogenen HW‐Gebietes
C‐Transformation für Initialgebiet beachtlich
Alter DOC wird mobilisiert
Struktur‐Prozessinteraktionen sind komplex
Homogenisierung im Zuge der weiteren Entwicklung?
Priming? SFB/TR38
Danke an R. EnderTh. WolburgM. KnieJ. AmonatB. RäppleL. Federlein….
German Science FoundationCollaborative research center TRR38Vattenfall Europe Mining
SFB/TR38SFB/TR38
Herzlichen Dank für die Aufmerksamkeit