Embed Size (px)
Citation preview
Study of Single Particle Spectra and Two Particle Correlations in Au+Au
Collisions at 4-11 A GeV
筑波大学 物理学研究科5年 中條達也
2
Outline
1) Introduction• Physics of High Energy Heavy-Ion Collisions
• Features Observed in Pb+Pb at 158 A GeV
• Thesis Motivation
2) AGS-E866 Experiment (Setup & Data Reduction)
3) Experimental Results• Single Particle Spectra (4, 11 A GeV)
• π+π+ Two-Particle Correlations (11 A GeV)
4) Discussions• Finite Expanding Source Model
• Excitation Function of Transverse Velocity and Temperature
5) Summary
3
Physics of High Energy Heavy-Ion Collisions
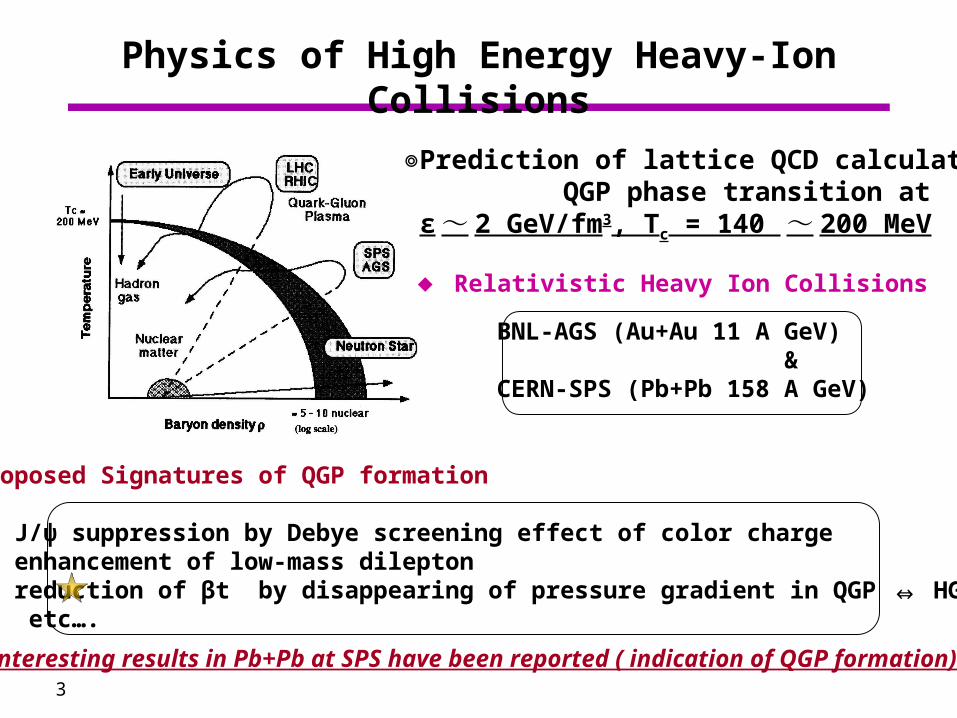
● Proposed Signatures of QGP formation
(1) J/ψ suppression by Debye screening effect of color charge (2) enhancement of low-mass dilepton (3) reduction of βt by disappearing of pressure gradient in QGP ⇔ HG etc….
BNL-AGS (Au+Au 11 A GeV) &CERN-SPS (Pb+Pb 158 A GeV)
◎Prediction of lattice QCD calculation QGP phase transition at ε ~ 2 GeV/fm3, Tc = 140 ~ 200 MeV
◆ Relativistic Heavy Ion Collisions
Interesting results in Pb+Pb at SPS have been reported ( indication of QGP formation)
4
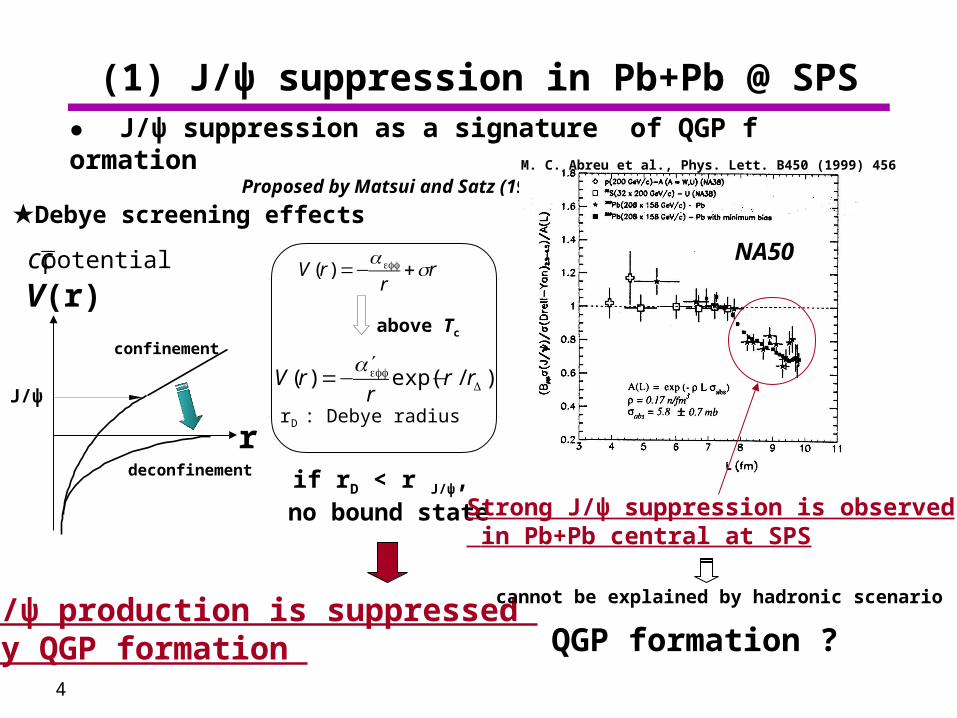
(1) J/ψ suppression in Pb+Pb @ SPS
★Debye screening effects
cc potential
V(r)
r
V rr
r( ) =− +α σeff
V rr
r r( ) exp( / )=−′
−α eff
D
rD : Debye radius
above Tc
● J/ψ suppression as a signature of QGP formation Proposed by Matsui and Satz (1986)
J/ψ
confinement
deconfinement if rD < r J/ψ, no bound state
J/ψ production is suppressed by QGP formation
Strong J/ψ suppression is observed in Pb+Pb central at SPS
M. C. Abreu et al., Phys. Lett. B450 (1999) 456
NA50
QGP formation ?
cannot be explained by hadronic scenario
5
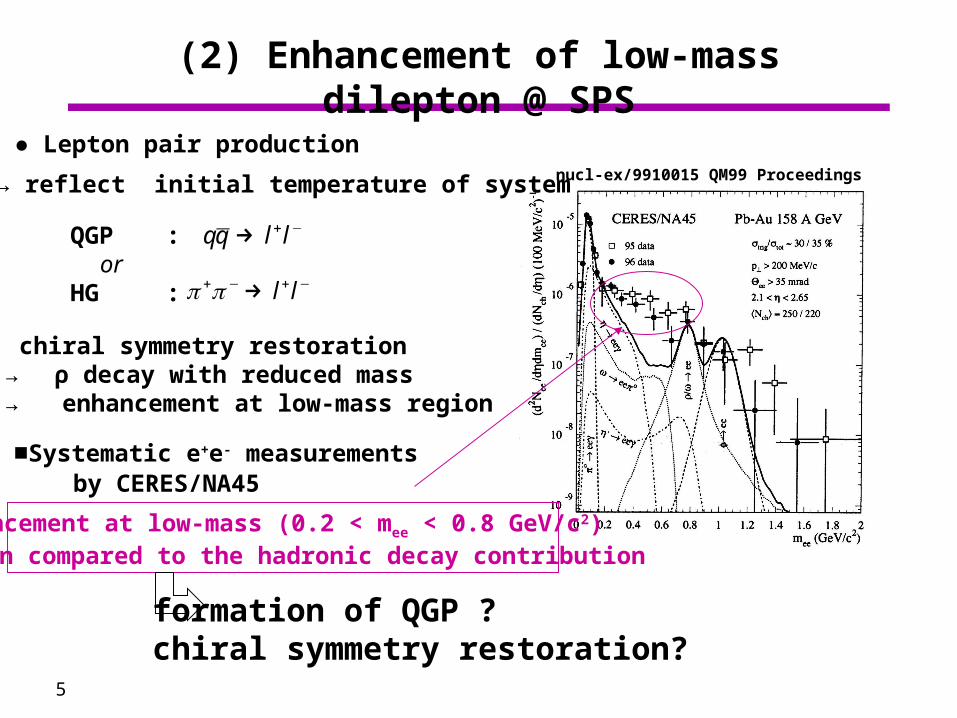
(2) Enhancement of low-mass dilepton @ SPS
nucl-ex/9910015 QM99 Proceedings
Enhancement at low-mass (0.2 < mee < 0.8 GeV/c2) region compared to the hadronic decay contribution
■Systematic e+e- measurements by CERES/NA45
QGP : or HG :
qq l l→ + −
π π+ − + −→ l l
● Lepton pair production
chiral symmetry restoration → ρ decay with reduced mass→ enhancement at low-mass region
→ reflect initial temperature of system
formation of QGP ? chiral symmetry restoration?
6
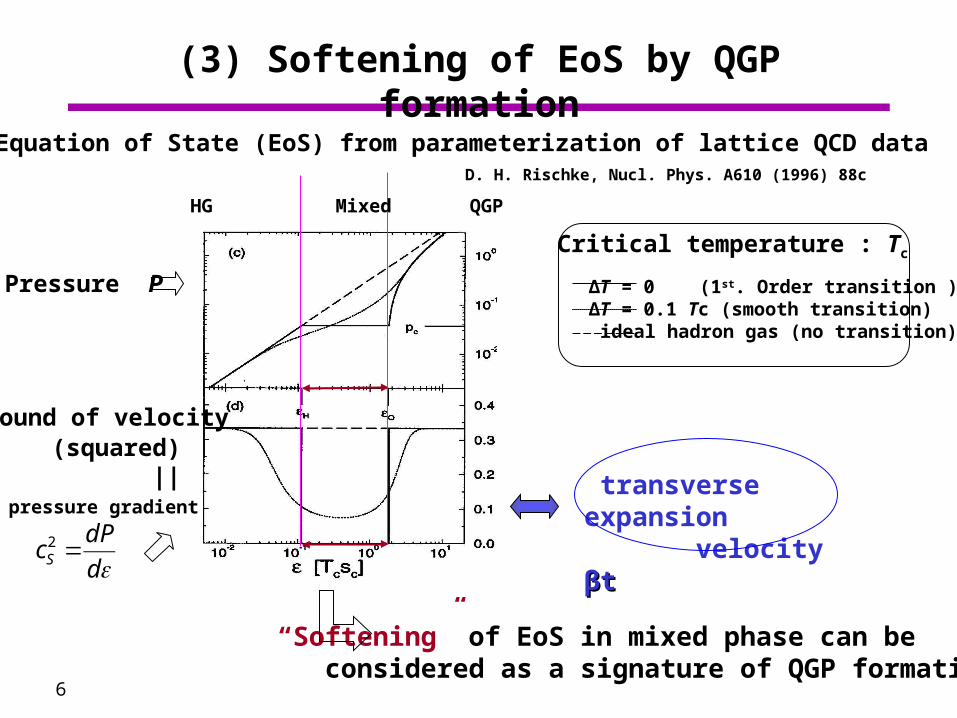
(3) Softening of EoS by QGP formation
D. H. Rischke, Nucl. Phys. A610 (1996) 88c
● Equation of State (EoS) from parameterization of lattice QCD data
“Softening” of EoS in mixed phase can be considered as a signature of QGP formation
Pressure P
HG Mixed QGP
cdP
dS2 =
ε
Sound of velocity (squared) || pressure gradient
Critical temperature : Tc
ΔT = 0 (1st. Order transition )ΔT = 0.1 Tc (smooth transition) ideal hadron gas (no transition)
transverse expansion velocity βtβt
7
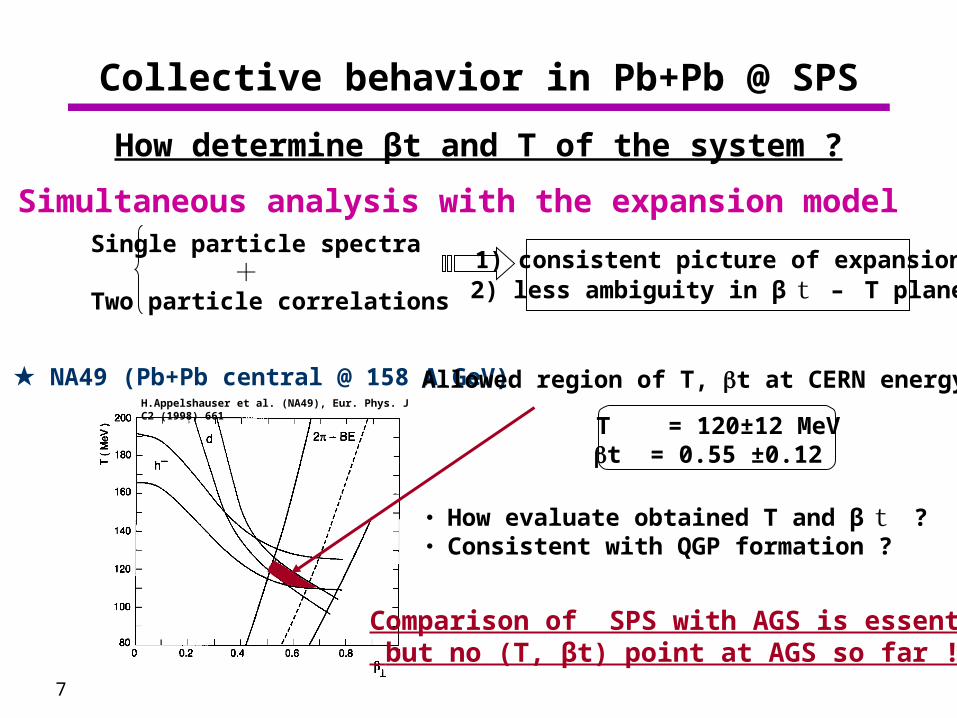
Collective behavior in Pb+Pb @ SPS
★ NA49 (Pb+Pb central @ 158 A GeV) Allowed region of T, t at CERN energy
T = 120±12 MeVt = 0.55 ±0.12
H.Appelshauser et al. (NA49), Eur. Phys. J C2 (1998) 661
● Simultaneous analysis with the expansion modelSingle particle spectra +Two particle correlations
・ How evaluate obtained T and β t ?・ Consistent with QGP formation ?
Comparison of SPS with AGS is essential, but no (T, βt) point at AGS so far !
1) consistent picture of expansion 2) less ambiguity in β t – T plane
How determine βt and T of the system ?
8
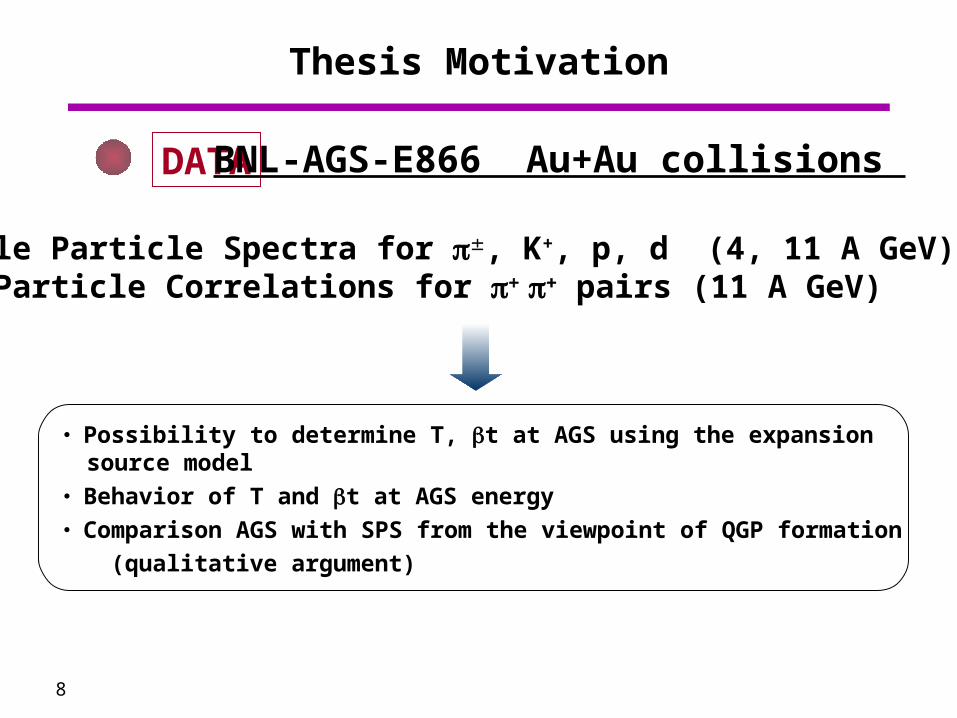
Thesis Motivation
・ Possibility to determine T, t at AGS using the expansion source model
・ Behavior of T and t at AGS energy
・ Comparison AGS with SPS from the viewpoint of QGP formation
(qualitative argument)
DATA
① Single Particle Spectra for π, K+, p, d (4, 11 A GeV) ② Two Particle Correlations for ππ pairs (11 A GeV)
BNL-AGS-E866 Au+Au collisions
9
Contributions of Author
1. Calibrated the TPC, TOF.
2. Analyzed single particle spectra at 4 A GeV beam energyand published the results.
3. Analyzed single particle spectra and two-particle correlations at 11 A GeV beam energy.
10
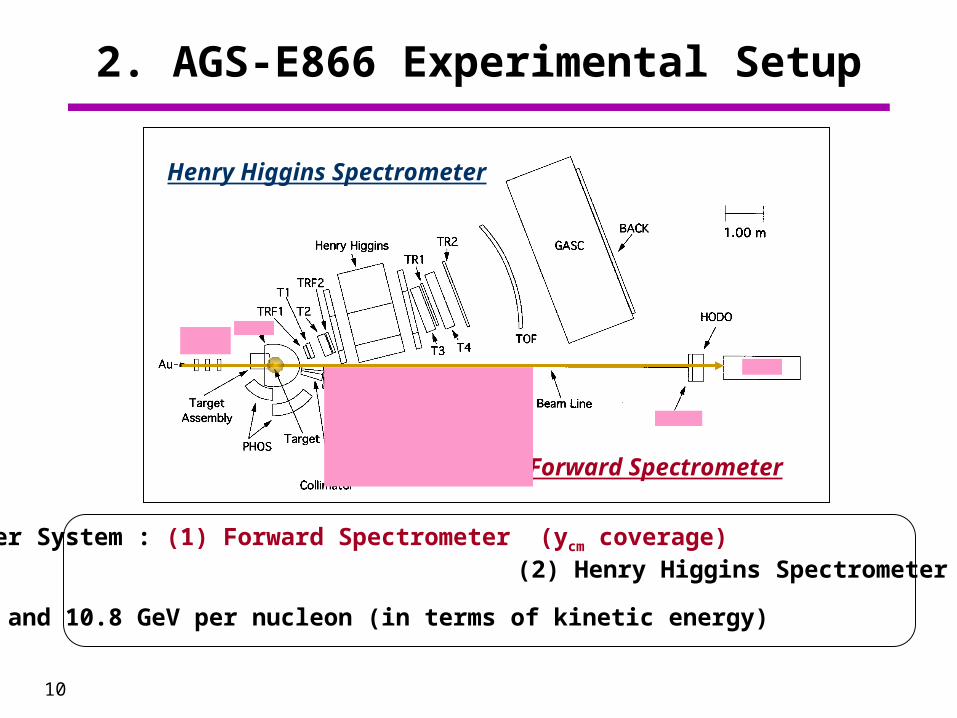
2. AGS-E866 Experimental Setup
Forward Spectrometer
Henry Higgins Spectrometer
● Two Spectrometer System : (1) Forward Spectrometer (ycm coverage) (2) Henry Higgins Spectrometer (not used in this analysis)
● Beam : 4.04 and 10.8 GeV per nucleon (in terms of kinetic energy)
11
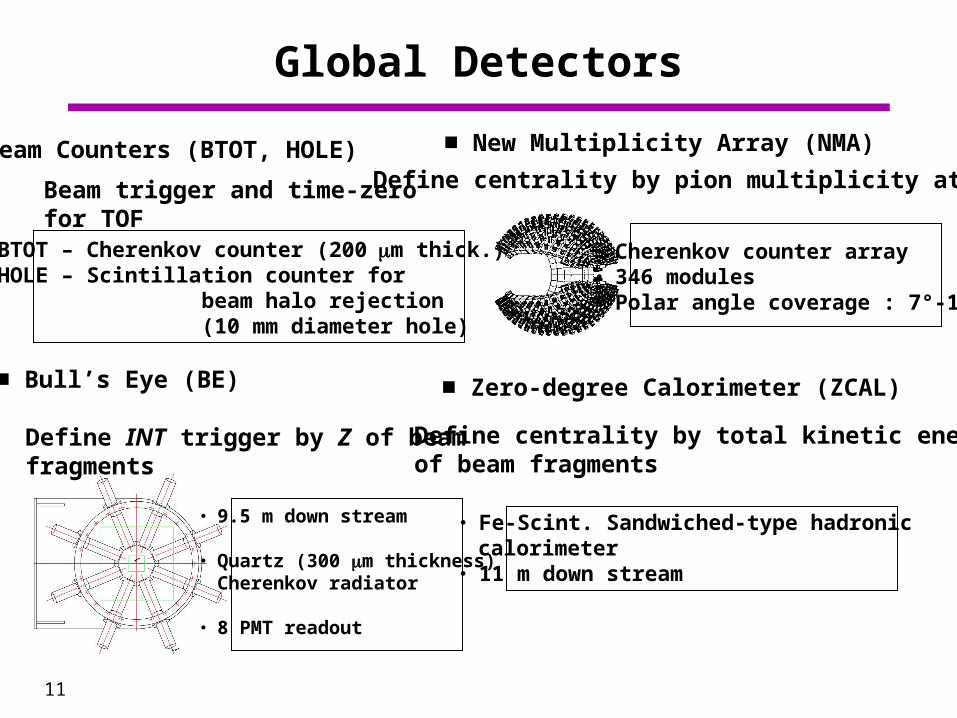
Global Detectors
■ Bull’s Eye (BE)
・ 9.5 m down stream
・ Quartz (300 m thickness) Cherenkov radiator
・ 8 PMT readout
■ New Multiplicity Array (NMA)
・ Cherenkov counter array ・ 346 modules・ Polar angle coverage : 7°-112°
■ Zero-degree Calorimeter (ZCAL)
・ Fe-Scint. Sandwiched-type hadronic calorimeter・ 11 m down stream
■ Beam Counters (BTOT, HOLE)
BTOT – Cherenkov counter (200m thick.)HOLE – Scintillation counter for beam halo rejection (10 mm diameter hole)
Define INT trigger by Z of beam fragments
Beam trigger and time-zero for TOF
Define centrality by total kinetic energy of beam fragments
Define centrality by pion multiplicity at target
12
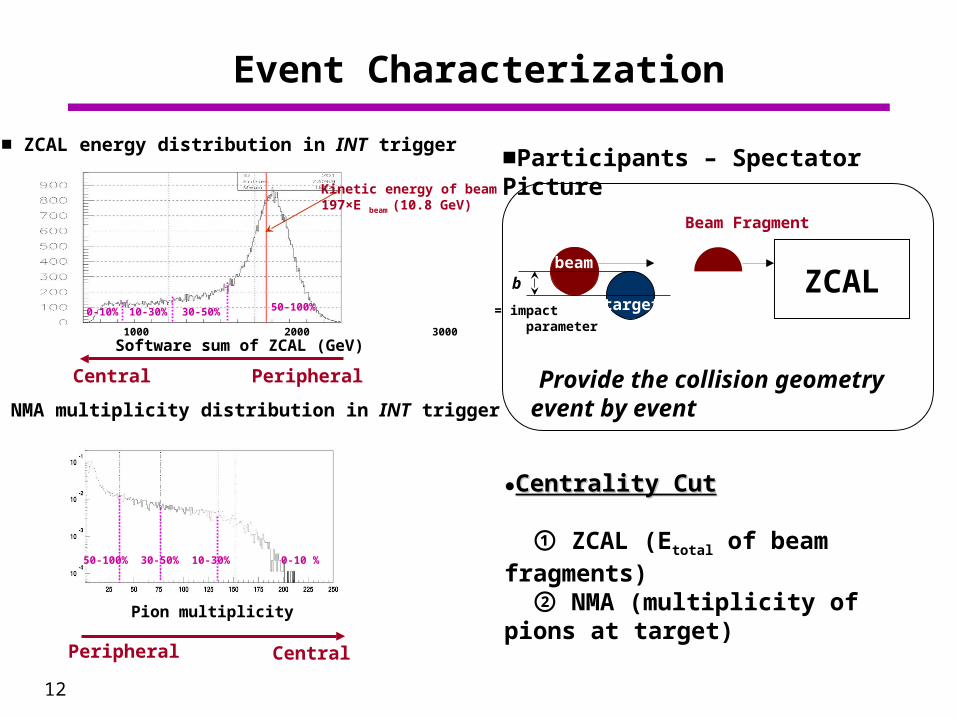
Event Characterization
●Centrality CutCentrality Cut
① ZCAL (Etotal of beam fragments) ② NMA (multiplicity of pions at target)
■Participants – Spectator Picture
target
beam
ZCAL
Beam Fragment
b
■ ZCAL energy distribution in INT trigger
Software sum of ZCAL (GeV)0 1000 2000 3000
Kinetic energy of beam197×E beam (10.8 GeV)
0-10% 10-30% 30-50% 50-100%
Central Peripheral
= impact parameter
Provide the collision geometry event by event■ NMA multiplicity distribution in INT trigger
CentralPeripheral
Pion multiplicity
50-100% 30-50% 10-30% 0-10 %
13
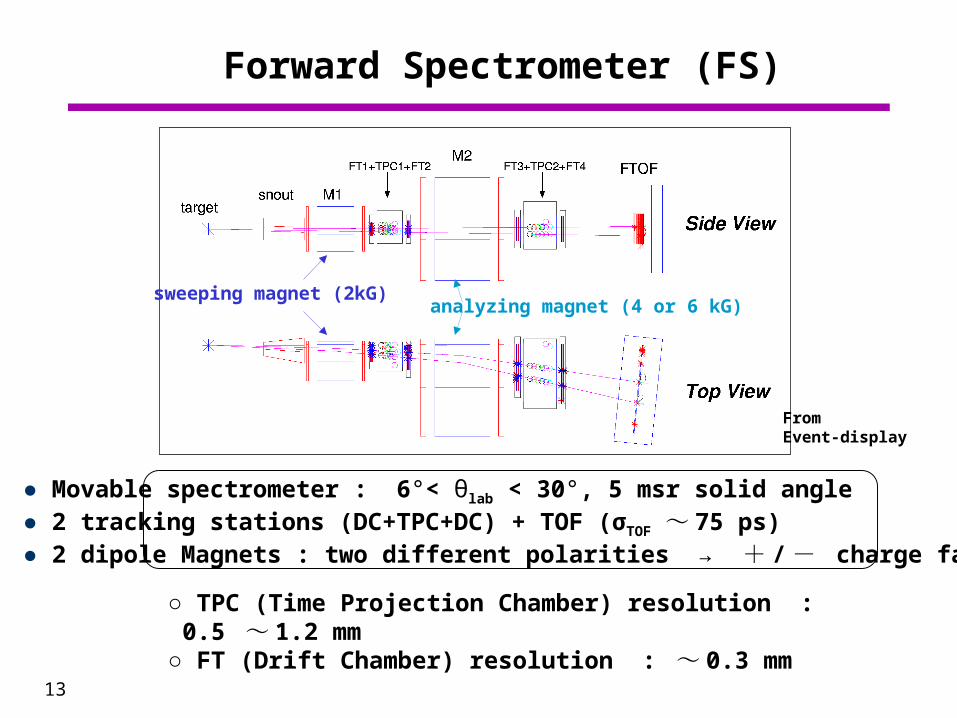
Forward Spectrometer (FS)
● Movable spectrometer : 6°< θlab < 30°, 5 msr solid angle● 2 tracking stations (DC+TPC+DC) + TOF (σTOF ~ 75 ps)● 2 dipole Magnets : two different polarities → + / - charge favor
○ TPC (Time Projection Chamber) resolution : 0.5 ~ 1.2 mm○ FT (Drift Chamber) resolution : ~ 0.3 mm
From Event-display
sweeping magnet (2kG)analyzing magnet (4 or 6 kG)
14
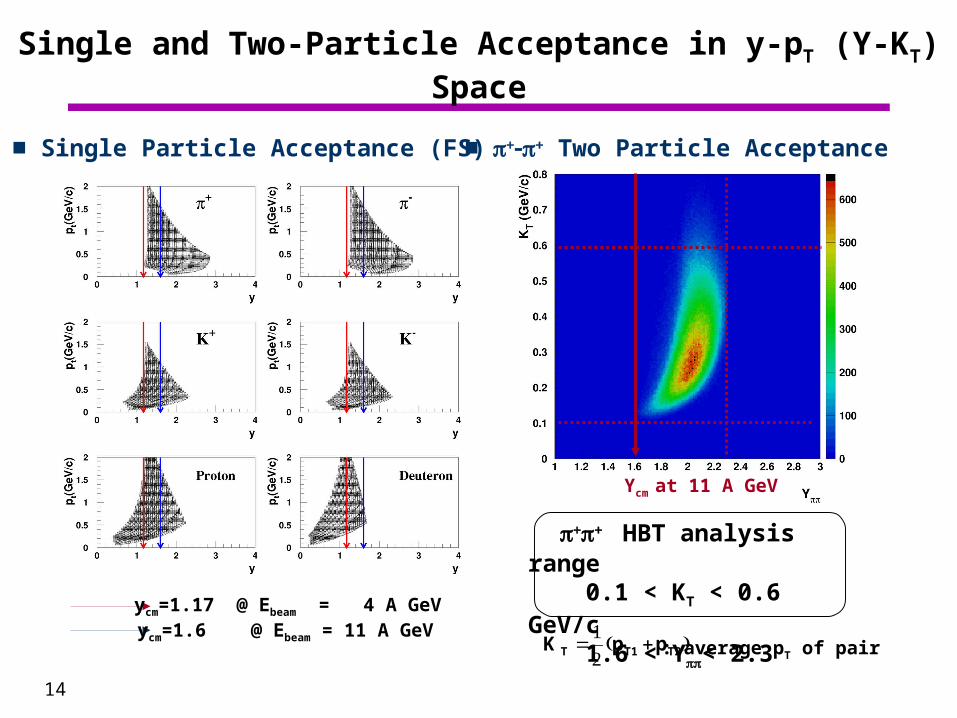
Single and Two-Particle Acceptance in y-pT (Y-KT) Space
ππ HBT analysis range 0.1 < KT < 0.6 GeV/c 1.6 < Yππ< 2.3 ycm=1.17 @ Ebeam = 4 A GeV
ycm=1.6 @ Ebeam = 11 A GeVK p pT T1 T2= +
12( ) : average pT of pair
Ycm at 11 A GeV
■ Single Particle Acceptance (FS) ■ ππ Two Particle Acceptance
15
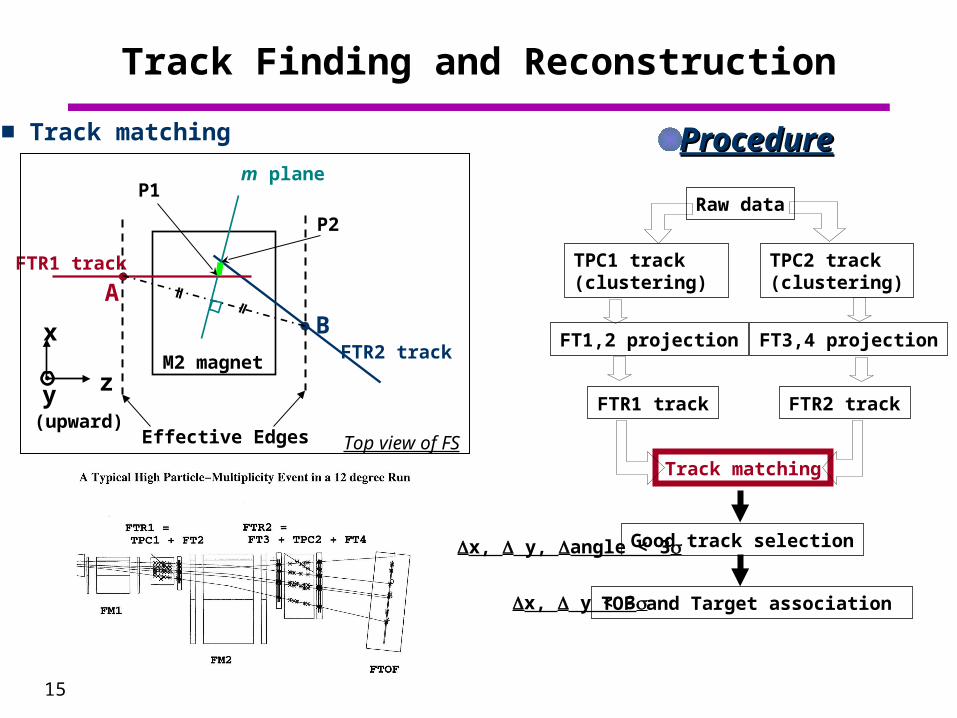
Track Finding and Reconstruction
Raw data
TPC1 track(clustering)
TPC2 track(clustering)
FT1,2 projection FT3,4 projection
FTR1 track FTR2 track
Track matching
Good track selection
TOF and Target association
ProcedureProcedure
x
y (upward)
zM2 magnet
Effective Edges
FTR1 track
FTR2 track
AB
P2
P1 m plane
Top view of FS
■ Track matching
x, y, angle < 3σ
x, y < 3σ
16
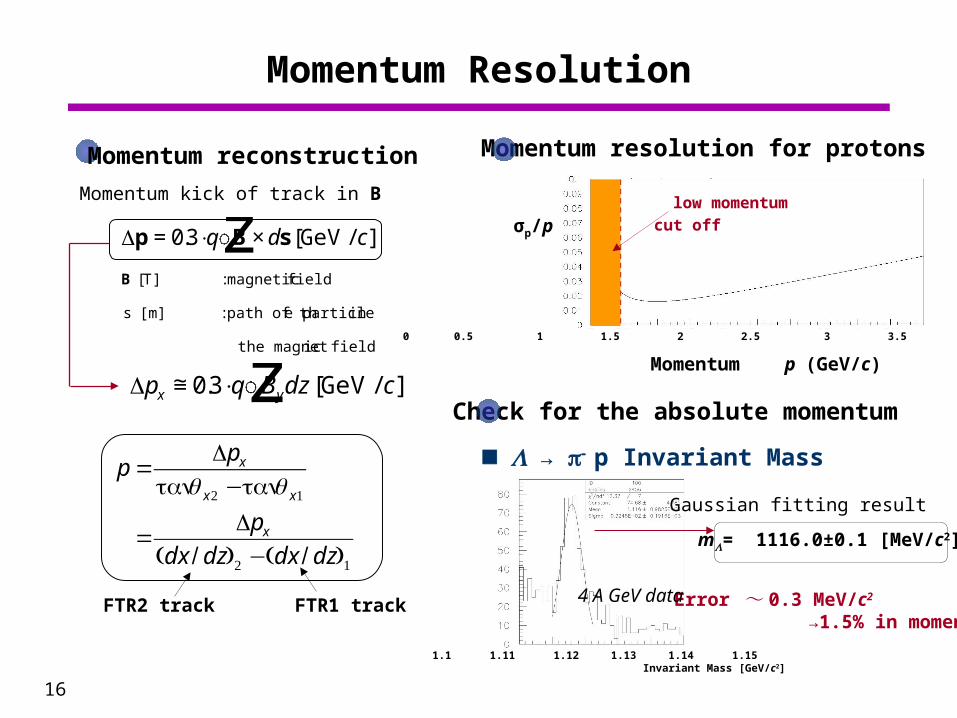
Momentum Resolution
Momentum resolution for protons
σp/p
Momentum p (GeV/c)
Check for the absolute momentum
1.1 1.11 1.12 1.13 1.14 1.15 Invariant Mass [GeV/c2]
Gaussian fitting result
m= 1116.0±0.1 [MeV/c2]
Error ~ 0.3 MeV/c2
→1.5% in momentum
0 0.5 1 1.5 2 2.5 3 3.5 4 4.5 5
low momentum cut off
4 A GeV data
■→ π p Invariant Mass
Momentum reconstruction
p B s
B
= ⋅ ×z03. [ ]
[ ] :
q d cGeV/
T magneticfield
s [m] :path of the particle in
the magnetic field
p q B dz cx y≅ ⋅ z03. [ ]GeV/
Momentum kick of track in B
pp
p
dx dz dx dz
x
x x
x
=−
=−
tan tan
( / ) ( / )
θ θ2 1
2 1
FTR2 track FTR1 track
17
Squared Mass m2 (GeV2/c4)
-1 0 1 2 3 4 5 6
Sig
ned
Mom
entu
m p
(G
eV/c
)
6
4
2
0
-6
-4
-2
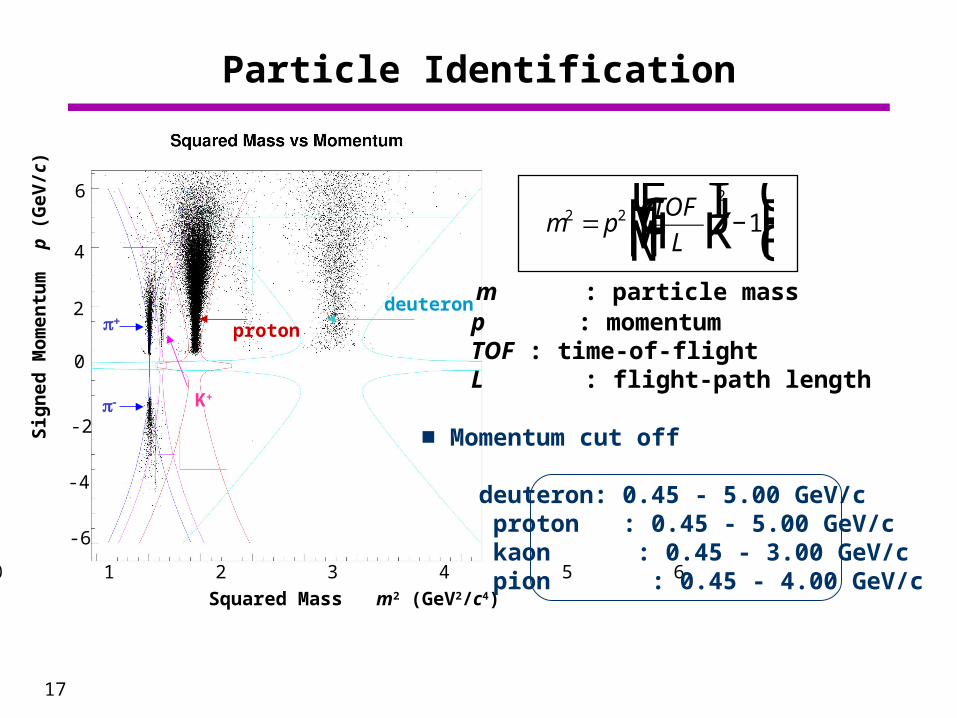
Particle Identification
■ Momentum cut off
deuteron: 0.45 - 5.00 GeV/c proton : 0.45 - 5.00 GeV/c kaon : 0.45 - 3.00 GeV/c pion : 0.45 - 4.00 GeV/c
m pTOF
L2 2
2
1= FHG
IKJ −
LNMM
OQPP
m : particle mass p : momentum TOF : time-of-flight L : flight-path length
proton deuteron
K+
π
π
18
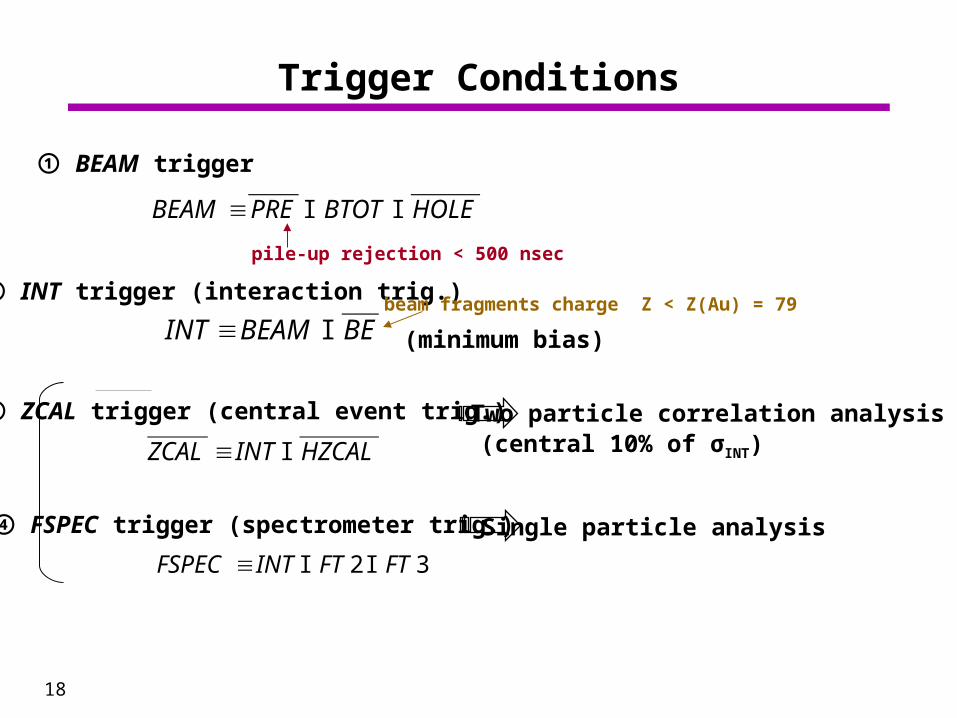
Trigger Conditions
BEAM PRE BTOT HOLE≡ I I
INT BEAM BE≡ I
ZCAL INT HZCAL≡ I
FSPEC INT FT FT≡ I I2 3
① BEAM trigger
② INT trigger (interaction trig.)
③ ZCAL trigger (central event trig.)
④ FSPEC trigger (spectrometer trig.)
Two particle correlation analysis (central 10% of σINT)
Single particle analysis
pile-up rejection < 500 nsec
beam fragments charge Z < Z(Au) = 79
(minimum bias)
19
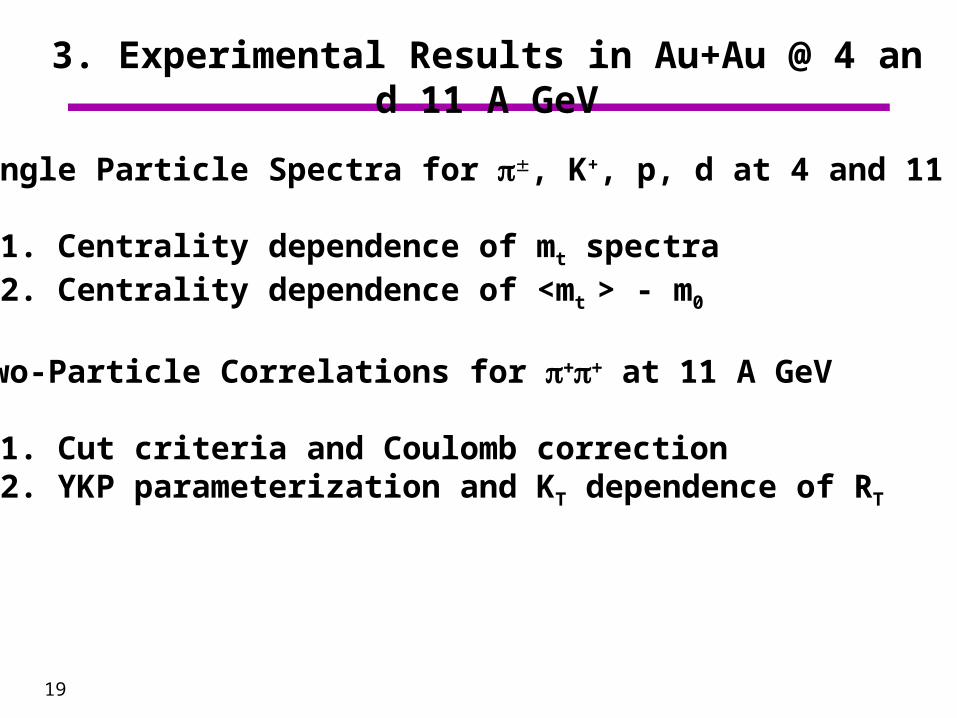
3. Experimental Results in Au+Au @ 4 and 11 A GeV
1) Single Particle Spectra for π, K+, p, d at 4 and 11 A GeV
1-1. Centrality dependence of mt spectra1-2. Centrality dependence of <mt > - m0
2) Two-Particle Correlations for ππ at 11 A GeV
2-1. Cut criteria and Coulomb correction2-2. YKP parameterization and KT dependence of RT
20
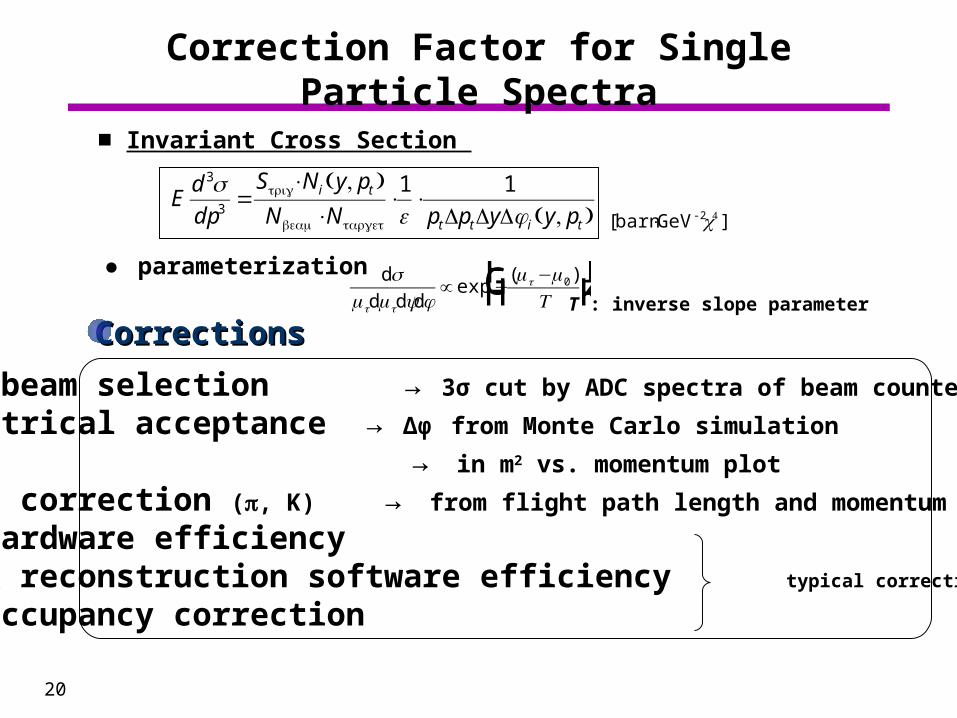
Correction Factor for Single Particle Spectra
CorrectionsCorrections
• Good beam selection → 3σ cut by ADC spectra of beam counter
• Geometrical acceptance → Δφ from Monte Carlo simulation
• PID → in m2 vs. momentum plot
• Decay correction (π, K) → from flight path length and momentum
• TPC hardware efficiency• Track reconstruction software efficiency typical correction factor
• TOF occupancy correction ~ 12% (inclusive)
Ed
dp
S N y p
N N p p y y pi t
t t i t
3
3
1 1σε φ
=⋅⋅
⋅ ⋅trig
beam target
( , )( , )
■ Invariant Cross Section
[ ]barn GeV-2⋅ c4
d
d d d
σφm m y
m mTt t
t∝ −−F
HGIKJexp
( )0
T : inverse slope parameter
● parameterization
21
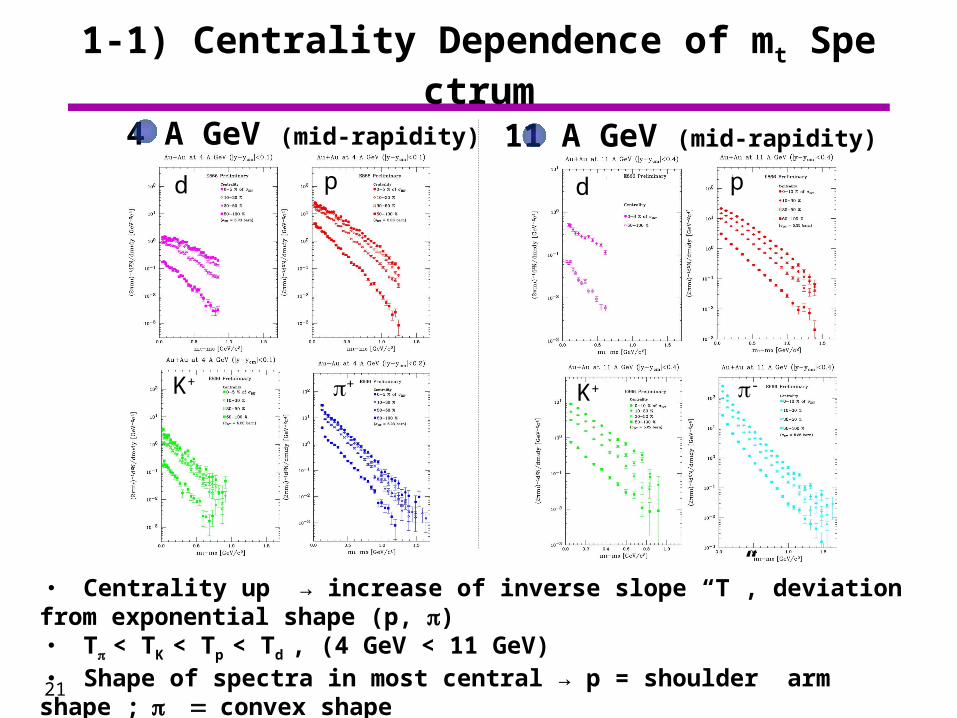
1-1) Centrality Dependence of mt Spectrum
4 A GeV (mid-rapidity) 11 A GeV (mid-rapidity)
d
K+
p
-
・ Centrality up → increase of inverse slope “T”, deviation from exponential shape (p, π)・ Tπ< TK < Tp < Td , (4 GeV < 11 GeV)・ Shape of spectra in most central → p = shoulder arm shape ;πconvex shape
+
p
K+
d
22
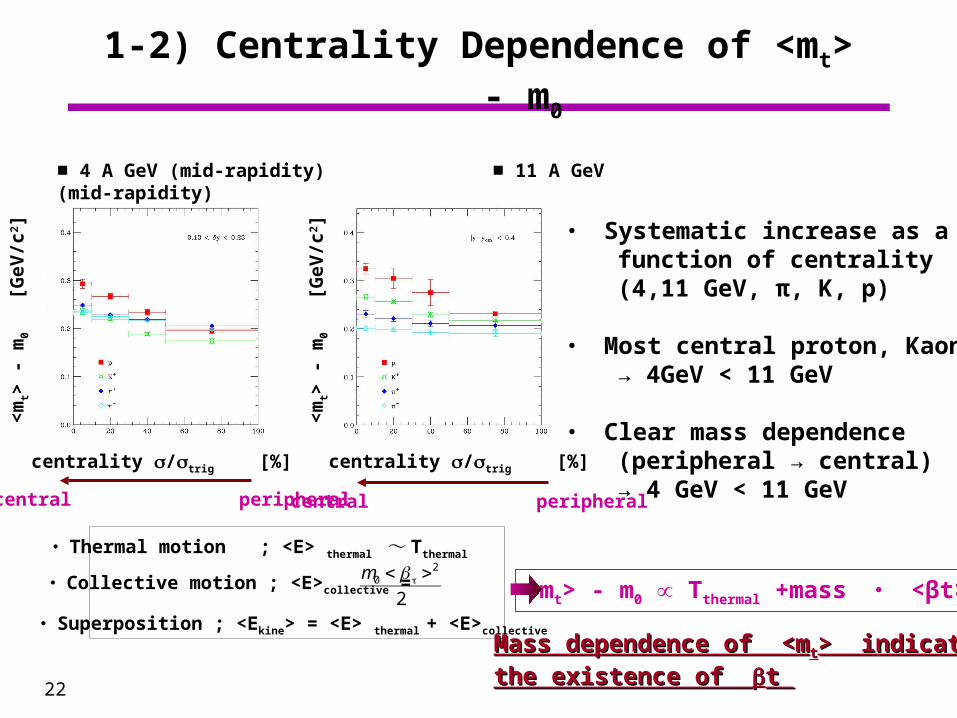
1-2) Centrality Dependence of <mt> - m0
・ Systematic increase as a function of centrality (4,11 GeV, π, K, p)
・ Most central proton, Kaon → 4GeV < 11 GeV
・ Clear mass dependence (peripheral → central) → 4 GeV < 11 GeV
■ 4 A GeV (mid-rapidity) ■ 11 A GeV (mid-rapidity)
central peripheral central peripheral
centrality σ/σtrig [%] centrality σ/σtrig [%]
<m
t> -
m0
[G
eV/c
2 ]
<m
t> -
m0
[G
eV/c
2 ]
・ Thermal motion ; <E> thermal ~ Tthermal
m02
2
< > t
・ Superposition ; <Ekine> = <E> thermal + <E>collective
・ Collective motion ; <E>collective = <mt> - m0 T∝ thermal +mass ・ <βt>2
Mass dependence of <mMass dependence of <mtt> indicates > indicates
the existence of the existence of t t
23
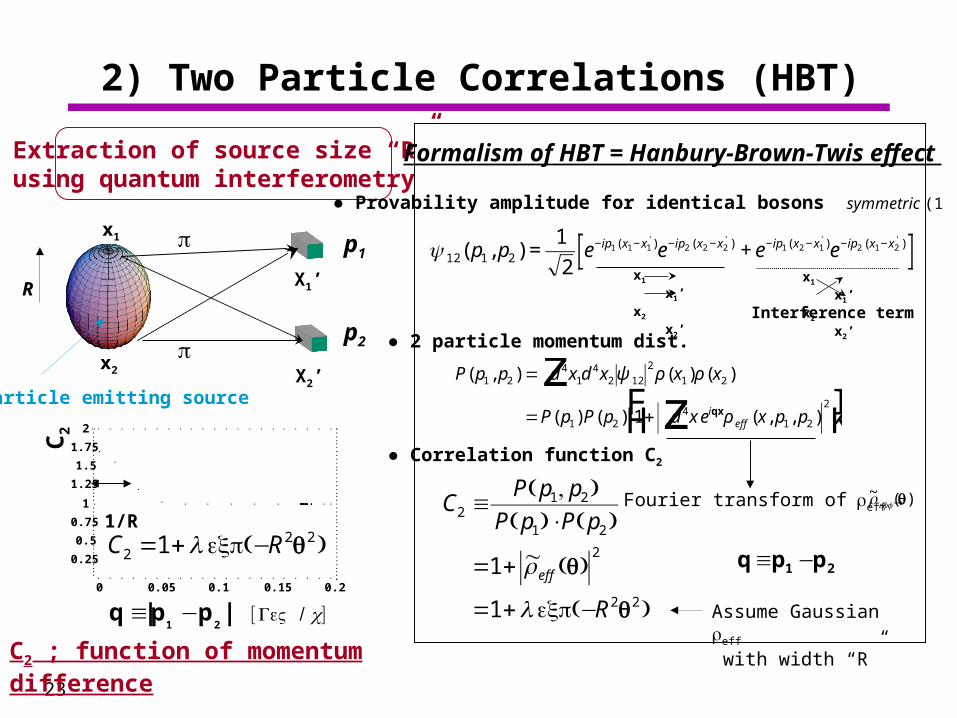
2) Two Particle Correlations (HBT)
Particle emitting source
x1
Extraction of source size “R”using quantum interferometry
x2
0 0.05 0.1 0.15 0.2
0.25
0.5
0.75
1
1.25
1.5
1.75
2
1/RC R2
2 21= + −λ (exp )q
C2
q |p p |1 2
≡ − [ / ]GεV c
p1
p2
X1’
X2’
R
CP p p
P p P p
R
eff
21 2
1 2
2
2 2
1
1
≡⋅
= +
= + −
( , )( ) ( )~ ( )
(exp )
ρ
λ
q
q
ψ 12 1 2
1
21 1 1 2 2 2 1 2 1 2 1 2( , ) ( ) ( ) ( ) ( )' ' ' '
p p e e e eip x x ip x x ip x x ip x x= +− − − − − − − −
P p p d x d x x x
P p P p d x e x p pieff
( , ) ( ) ( )
( ) ( ) ( , , )
1 24
14
2 12
2
1 2
1 24
1 2
2
1
=
= +FH IKz
zψ ρ ρ
ρqx
● Provability amplitude for identical bosons symmetric (1 ⇔ 2)
● 2 particle momentum dist.
q p p1 2≡ −
Assume Gaussian ρeff
with width “R”
Formalism of HBT = Hanbury-Brown-Twis effect
Interference term
● Correlation function C2
Fourier transform ofρeff →~ ( )ρeff q
x1 x1’ x2 x2’
x1 x1’ x2 x2’
C2 ; function of momentum difference
24
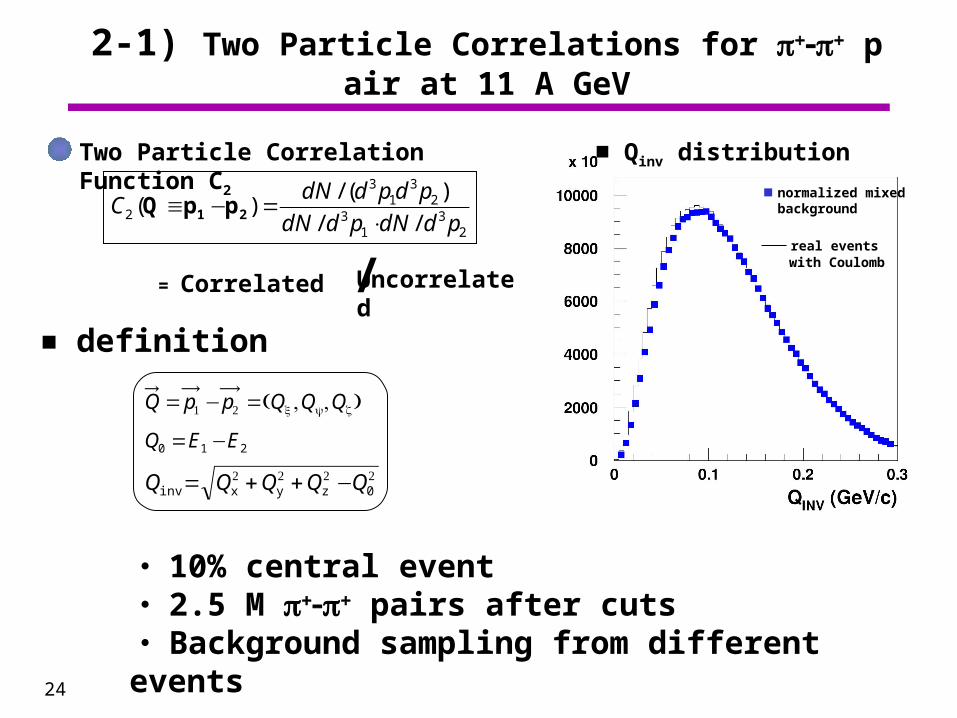
2-1) Two Particle Correlations for ππ pair at 11 A GeV
■ Qinv distribution
real events with Coulomb
normalized mixed background
・ 10% central event・ 2.5 M ππ pairs after cuts・ Background sampling from different events
Q Q Q Q Qinv x y z 0= + + −2 2 2 2
Q p p Q Q Q= − =1 2 ( , , )x y z
Q E E0 1 2= −
Two Particle Correlation Function C2
CdN d p d p
dN d p dN d p2
31
32
31
32
( )/ ( )
/ /Q p p1 2≡ − =
⋅
Uncorrelated= Correlated /
■ definition
25
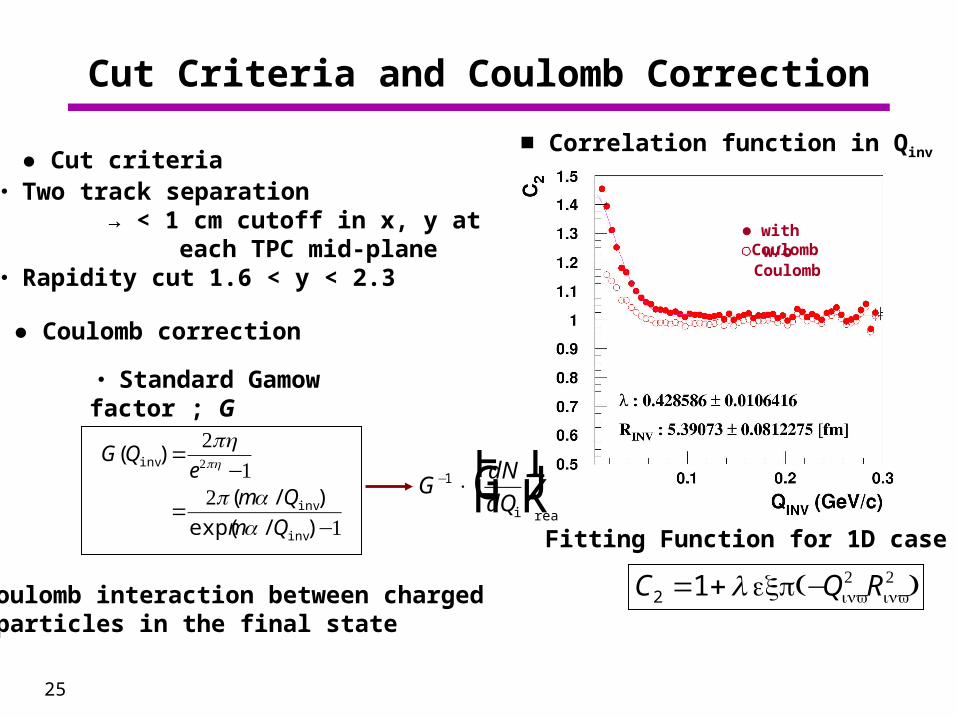
Cut Criteria and Coulomb Correction
● Cut criteria・ Two track separation → < 1 cm cutoff in x, y at each TPC mid-plane・ Rapidity cut 1.6 < y < 2.3
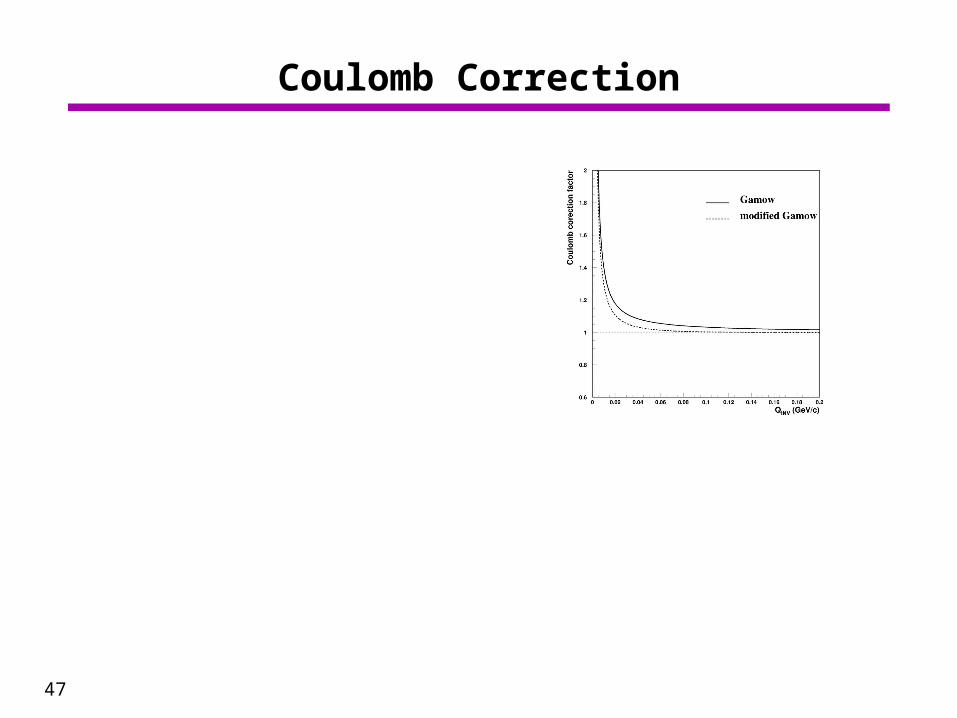
・ Standard Gamow factor ; G
● Coulomb correction
G Qe
m Q
m Q
( )
( / )
exp( / )
inv
inv
inv
=−
=−
21
21
2
πη
π αα
πη
■ Correlation function in Qinv
with Coulomb w/o Coulomb
Fitting Function for 1D case
C Q R2 1= + −λ (exp )inv2
inv2
GdN
dQ− ×
FHG
IKJ
1
i real
Coulomb interaction between charged particles in the final state
26
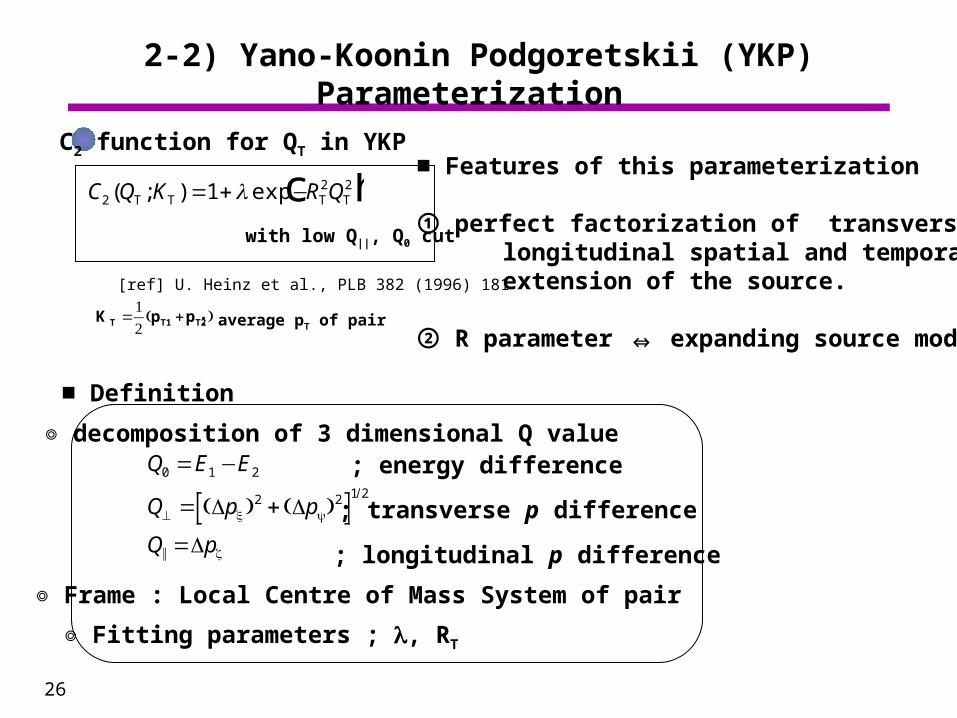
2-2) Yano-Koonin Podgoretskii (YKP) Parameterization
C2 function for QT in YKP
■ Definition
Q E E
Q p p
Q p
0 1 2
2 2 1 2
= −
= +
=⊥ ( ) ( )
/
||
x y
z
; energy difference
; transverse p difference
; longitudinal p difference
◎ decomposition of 3 dimensional Q value
◎ Frame : Local Centre of Mass System of pair
C Q K R Q22 21( ; ) expT T T T= + −λ c h
[ref] U. Heinz et al., PLB 382 (1996) 181
with low Q||, Q0 cut
K p pT T1 T2= +12( ) : average pT of pair
■ Features of this parameterization
① perfect factorization of transverse, longitudinal spatial and temporal extension of the source.
② R parameter ⇔ expanding source model
◎ Fitting parameters ; λ, RT
27
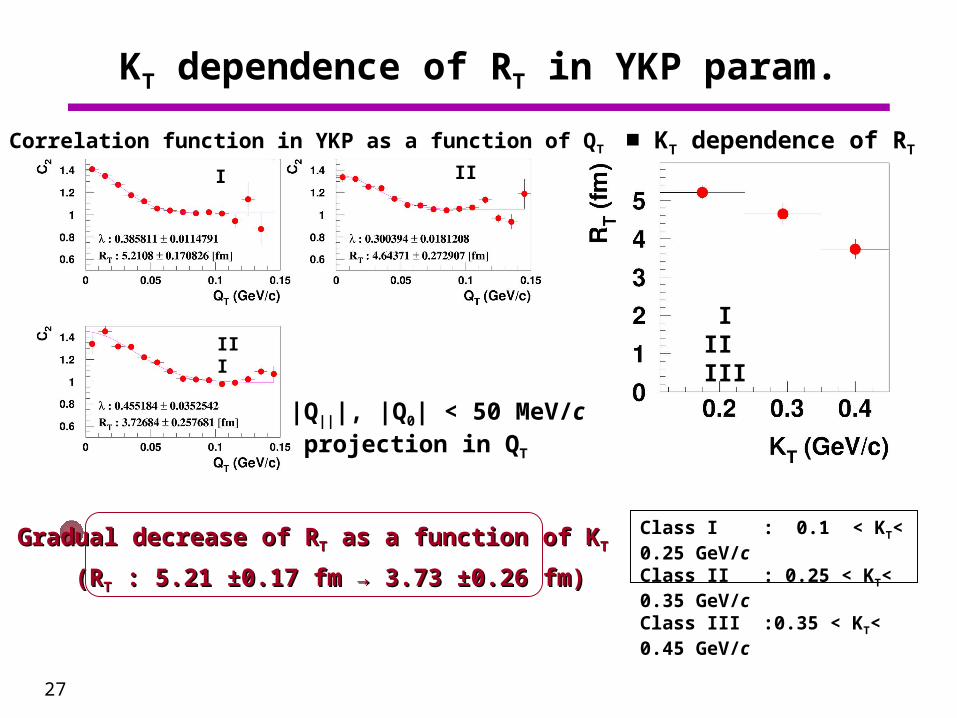
KT dependence of RT in YKP param.
Gradual decrease of RGradual decrease of RTT as a function of K as a function of KTT
(R(RTT : 5.21 ±0.17 fm → 3.73 ±0.26 fm) : 5.21 ±0.17 fm → 3.73 ±0.26 fm)
■ KT dependence of RT
I II III
Class I : 0.1 < KT< 0.25 GeV/cClass II : 0.25 < KT< 0.35 GeV/cClass III :0.35 < KT< 0.45 GeV/c
I II
III
|Q|||, |Q0| < 50 MeV/c projection in QT
■ Correlation function in YKP as a function of QT
28
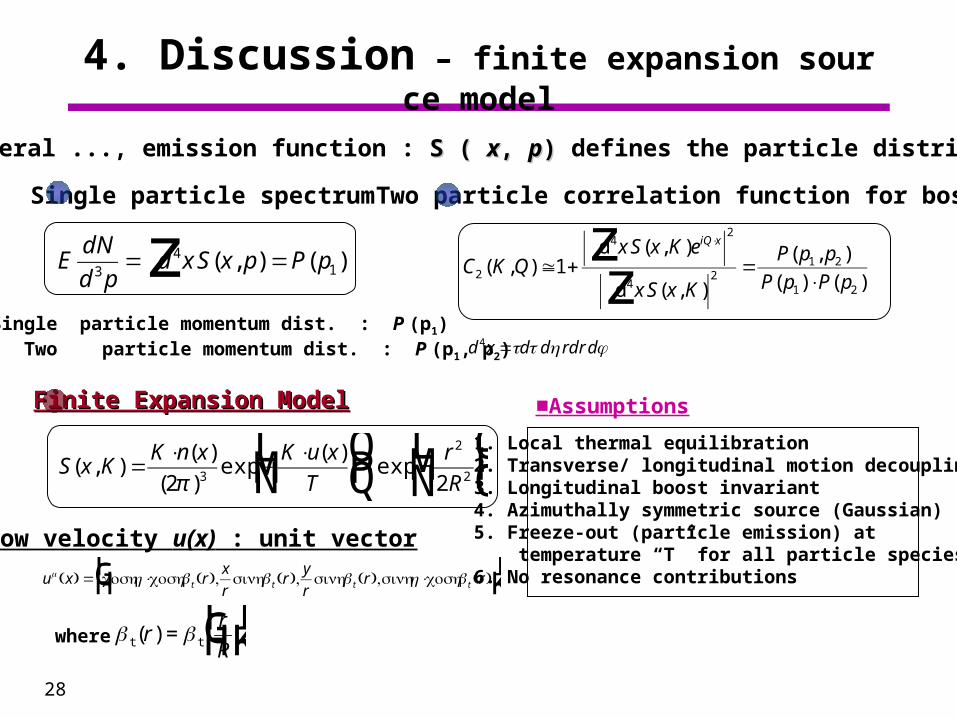
4. Discussion – finite expansion source model
■ In general ..., emission function : S ( S ( xx, , pp)) defines the particle distributions
Single particle spectrum
EdN
d pd x S x p P p
34
1= =z ( , ) ( )
Two particle correlation function for boson
C K Qx S x K e
x S x K
P p p
P p P p
iQ x
2
42
42
1 2
1 2
1( , )( , )
( , )
( , )
( ) ( )≅ + =
⋅zz
⋅d
d
※Single particle momentum dist. : P (p1) Two particle momentum dist. : P (p1, p2) d x d d rdr d4 =τ τ η φ
Finite Expansion ModelFinite Expansion Model
S x KK n x K u x
T
r
R( , )
( )
( )exp
( )exp=
⋅−
⋅LNM
OQP× −
LNM
OQP2 23
2
2π
u x rx
rr
y
rr rt t t t
η η ( ) cosh cosh ( ), sinh ( ), sinh ( ),sinh cosh ( )= ⋅ ⋅FHG
IKJ
t t( )rr
R= F
HGIKJ
1. Local thermal equilibration2. Transverse/ longitudinal motion decoupling3. Longitudinal boost invariant 4. Azimuthally symmetric source (Gaussian)5. Freeze-out (particle emission) at temperature “T” for all particle species6. No resonance contributions
Flow velocity u(x) : unit vector
where
■Assumptions
29
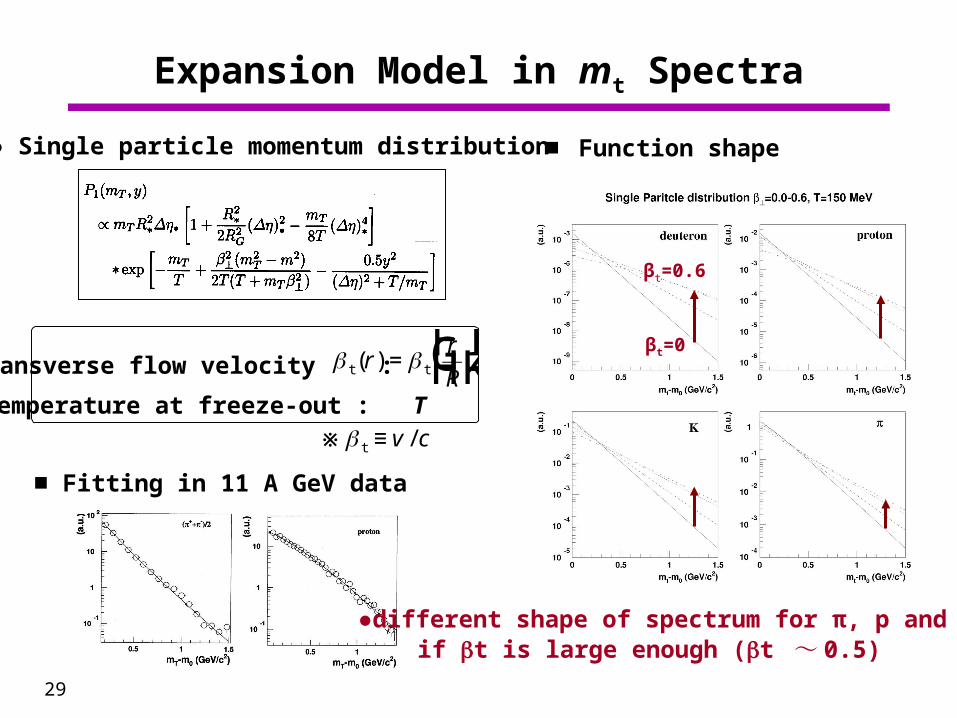
Expansion Model in mt Spectra
■ Function shape
t t( )rr
R= F
HGIKJ
● Single particle momentum distribution
Transverse flow velocity :
Temperature at freeze-out : T
βt=0.6
βt=0
■ Fitting in 11 A GeV data
●different shape of spectrum for π, p and d, if t is large enough (t ~ 0.5)
t ≡ v c/※
30
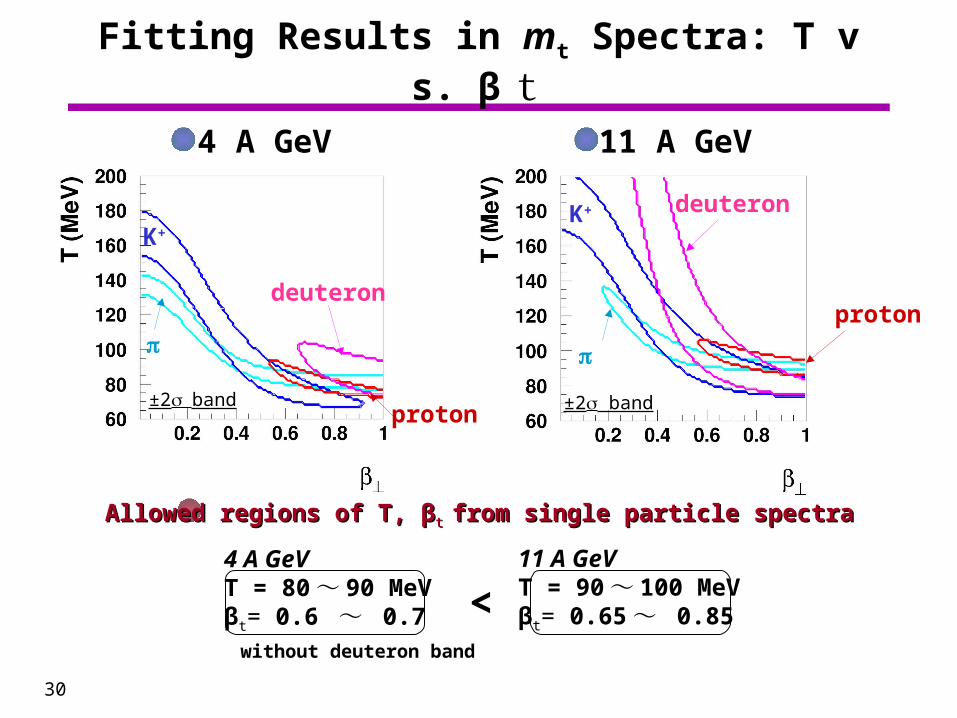
Fitting Results in mt Spectra: T vs. β t
4 A GeV 11 A GeV
proton
deuteron
K+
πproton
deuteronK+
π
±2σband ±2σ band
Allowed regions of T, βAllowed regions of T, βt t from single particle spectrafrom single particle spectra
4 A GeVT = 80 ~ 90 MeVβt= 0.6 ~ 0.7
11 A GeVT = 90 ~ 100 MeVβt= 0.65 ~ 0.85<
without deuteron band
31
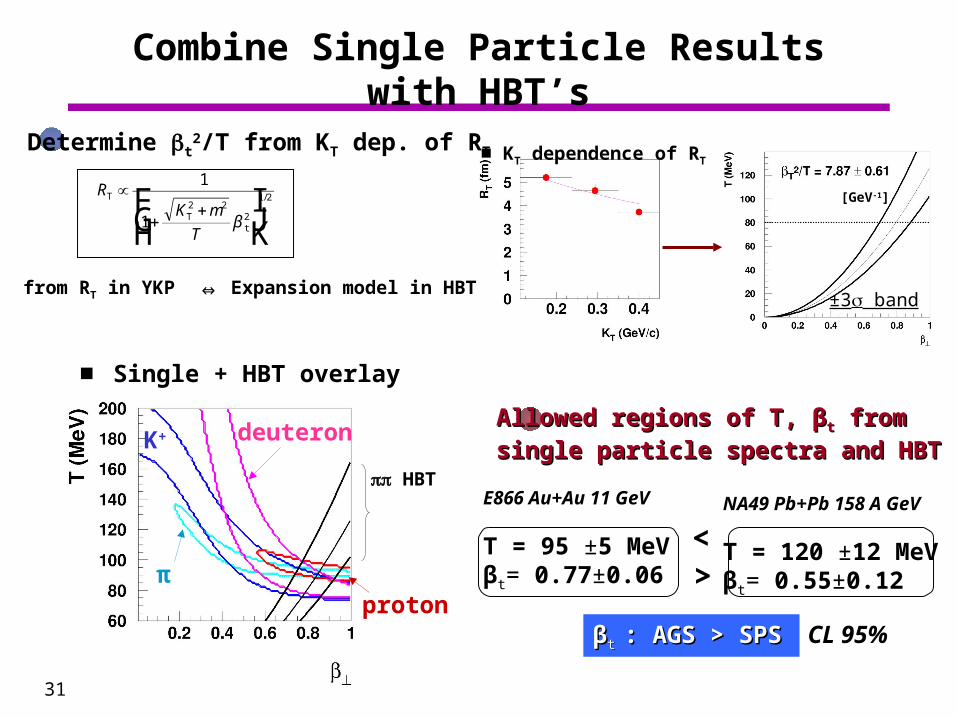
Combine Single Particle Results with HBT’s
[GeV-1]
proton
deuteronK+
π
±3σ band
Allowed regions of T, βAllowed regions of T, βtt from from
single particle spectra and HBTsingle particle spectra and HBT
E866 Au+Au 11 GeV
T = 95 ±5 MeVβt= 0.77±0.06
NA49 Pb+Pb 158 A GeV
T = 120 ±12 MeVβt= 0.55±0.12
<>
ββt t : AGS > SPS: AGS > SPS
ππ HBT
from RT in YKP ⇔ Expansion model in HBT
■ Single + HBT overlay
■ KT dependence of RT
RK m
T
T
Tt
∝
++F
HGIKJ
1
12 2
2
1 2
β
/
Determine t2/T from KT dep. of RT
CL 95%
32
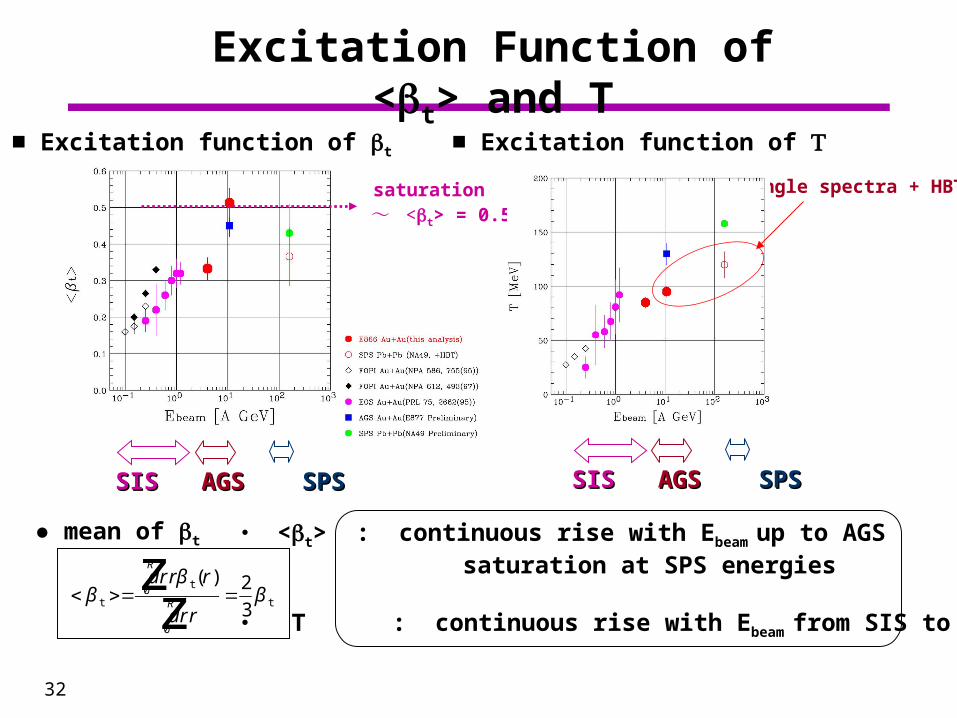
Excitation Function of <t> and T
■ Excitation function of t ■ Excitation function of
SISSIS AGSAGS SPSSPS SISSIS AGSAGS SPSSPS
Single spectra + HBT saturation ~ <t> = 0.5
● mean of t
< >= =zzββ
βt
t
t
dr r r
dr r
R
R
( )0
0
2
3
・ <t> : continuous rise with Ebeam up to AGS saturation at SPS energies
・ T : continuous rise with Ebeam from SIS to SPS
33
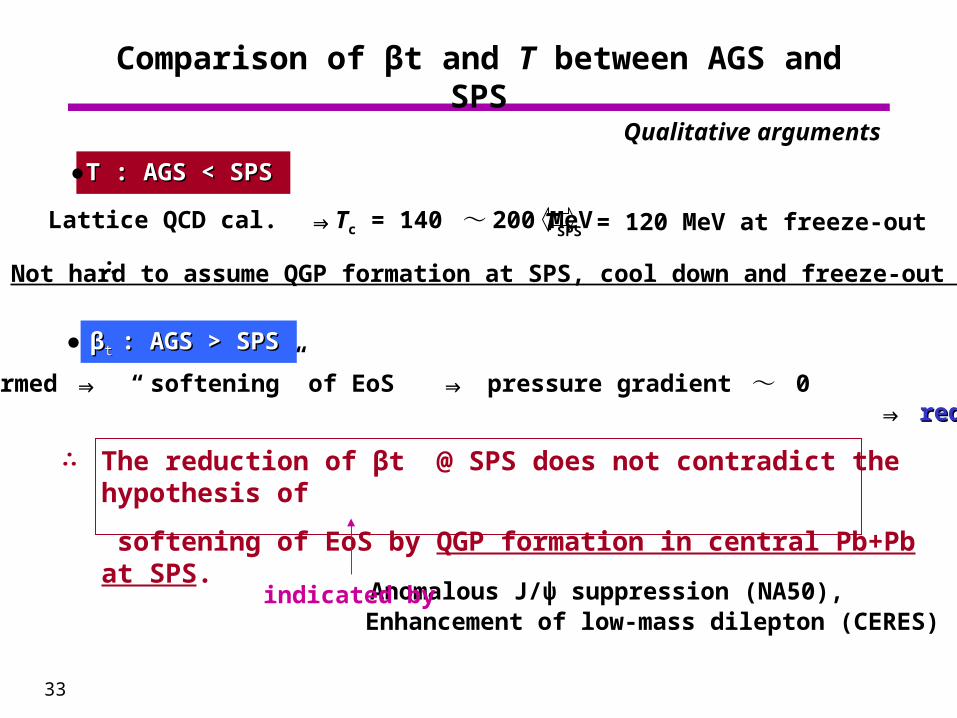
Comparison of βt and T between AGS and SPS
Qualitative arguments
The reduction of βt @ SPS does not contradict the hypothesis of
softening of EoS by QGP formation in central Pb+Pb at SPS.
Anomalous J/ψ suppression (NA50), Enhancement of low-mass dilepton (CERES)
indicated by
Lattice QCD cal. ⇒Tc = 140 ~ 200 MeV
If QGP formed ⇒ “ softening” of EoS ⇒ pressure gradient ~ 0 ⇒ reduced βtreduced βt
ββt t : AGS > SPS: AGS > SPS
∴
T : AGS < SPST : AGS < SPS
∴
TSPS = 120 MeV at freeze-out
Not hard to assume QGP formation at SPS, cool down and freeze-out at TSPS
●
●
34
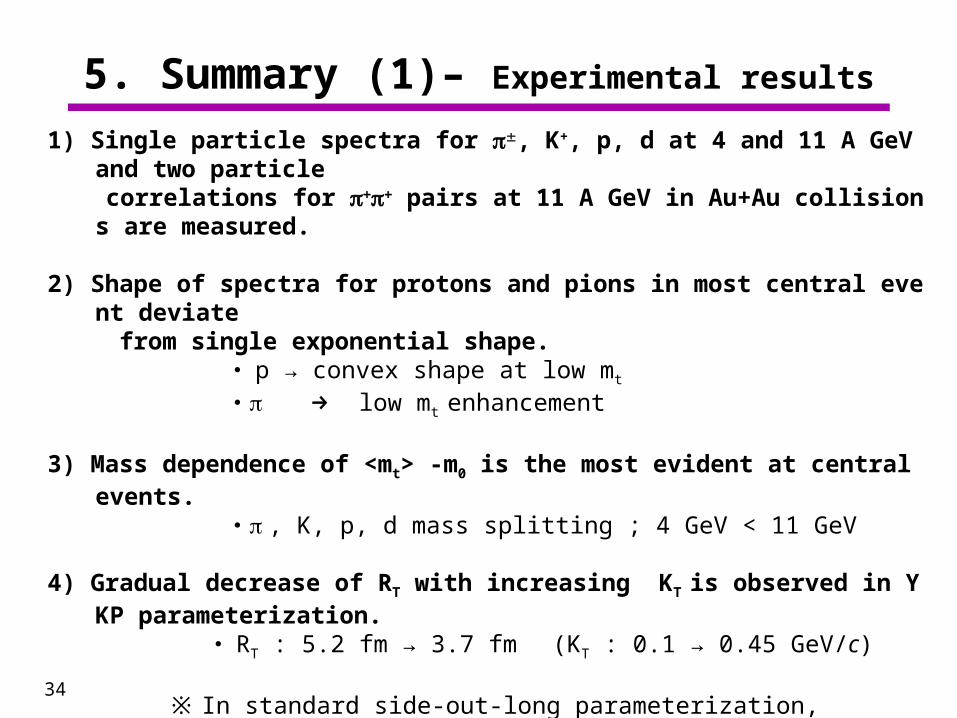
5. Summary (1)– Experimental results
1) Single particle spectra for π, K+, p, d at 4 and 11 A GeV and two particle correlations for ππ pairs at 11 A GeV in Au+Au collisions are measured.
2) Shape of spectra for protons and pions in most central event deviate from single exponential shape. ・ p → convex shape at low mt ・π → low mt enhancement
3) Mass dependence of <mt> -m0 is the most evident at central events. ・π , K, p, d mass splitting ; 4 GeV < 11 GeV
4) Gradual decrease of RT with increasing KT is observed in YKP parameterization. ・ RT : 5.2 fm → 3.7 fm (KT : 0.1 → 0.45 GeV/c)
※ In standard side-out-long parameterization, decrease of RT as a function KT is also observed.
5) These observations in single particle spectra and HBT are consistent with the expanding source scenario.
35
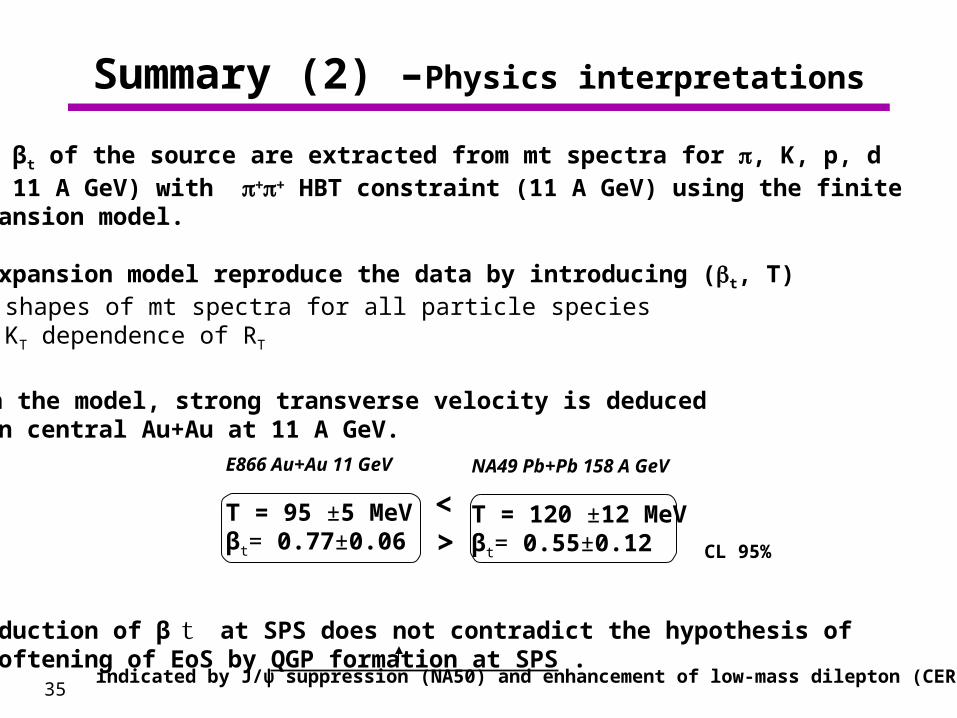
Summary (2) –Physics interpretations
6) T and βt of the source are extracted from mt spectra for π, K, p, d (4, 11 A GeV) with ππ HBT constraint (11 A GeV) using the finite expansion model.
7) The expansion model reproduce the data by introducing (t, T) ・ shapes of mt spectra for all particle species ・ KT dependence of RT
8) Within the model, strong transverse velocity is deduced in central Au+Au at 11 A GeV.
9) The reduction of β t at SPS does not contradict the hypothesis of the softening of EoS by QGP formation at SPS .
E866 Au+Au 11 GeV
T = 95 ±5 MeVβt= 0.77±0.06
NA49 Pb+Pb 158 A GeV
T = 120 ±12 MeVβt= 0.55±0.12
<> CL 95%
indicated by J/ψ suppression (NA50) and enhancement of low-mass dilepton (CERES)
36
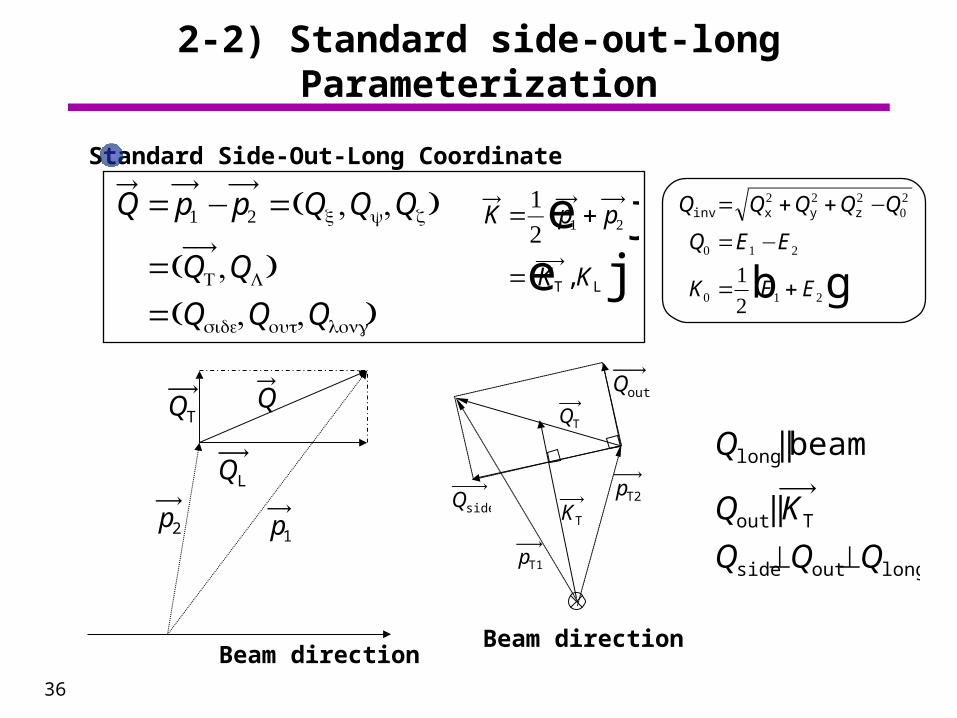
2-2) Standard side-out-long Parameterization
Beam direction
p2 p1
QQT
QL
Beam direction
QT
Qout
Qside KT
pT1
pT2
Q p p Q Q Q
Q Q
Q Q Q
= − =
==
1 2 ( , , )
( , )( , , )
x y z
T L
side out long
K p p
K K
= +
=
12 1 2e je jT L,
Standard Side-Out-Long Coordinate
Q Q Q Q Q
Q E E
K E E
inv x y z= + + −
= −
= +
2 2 202
0 1 2
0 1 212b g
Q
Q K
Q Q Q
long
out T
side out long
beam||
||
⊥ ⊥
37
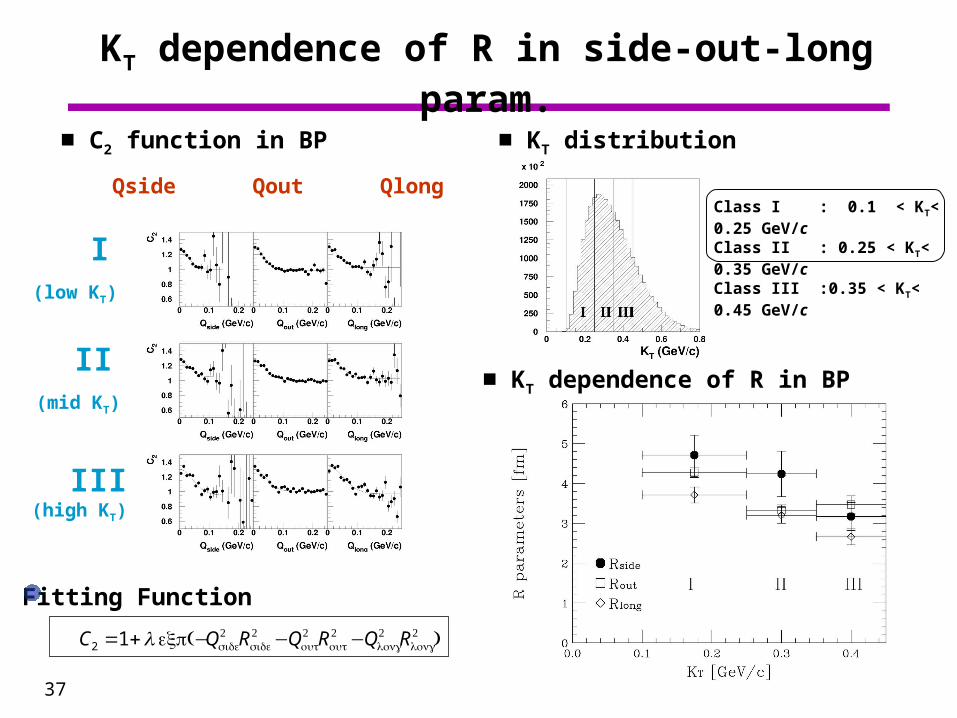
KT dependence of R in side-out-long param.
■ KT distribution ■ C2 function in BP
Qside Qout QlongClass I : 0.1 < KT< 0.25 GeV/cClass II : 0.25 < KT< 0.35 GeV/cClass III :0.35 < KT< 0.45 GeV/c I
(low KT)
II (mid KT)
III (high KT)
■ KT dependence of R in BP
C Q R Q R Q R2 1= + − − −λ (exp )side2
side2
out2
out2
long2
long2
Fitting Function
38
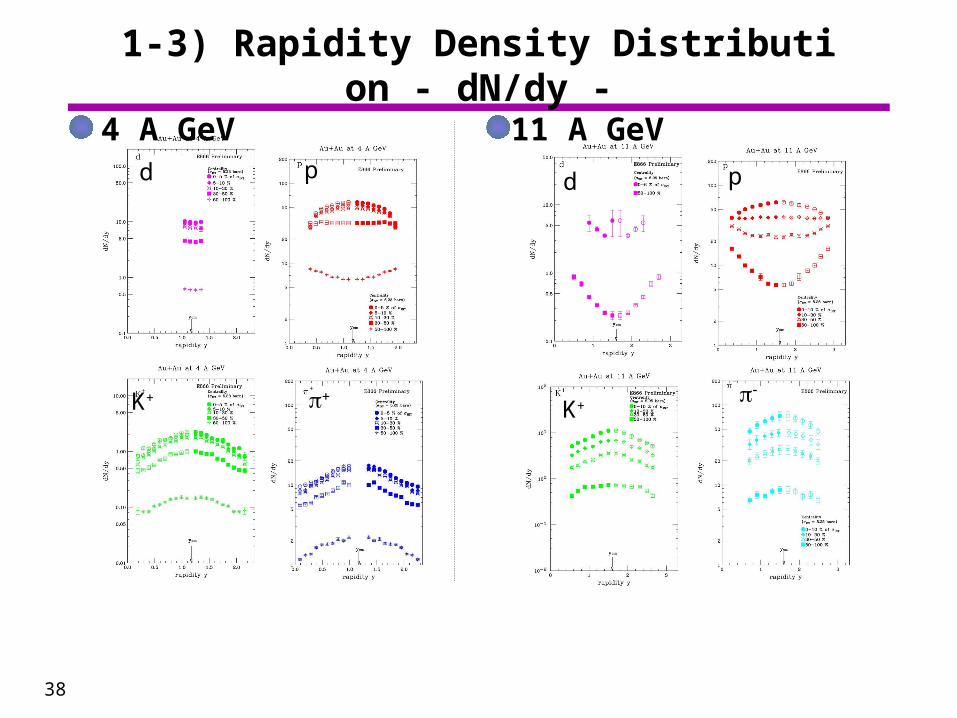
1-3) Rapidity Density Distribution - dN/dy -
4 A GeV 11 A GeV d p
K+K+
pd
39
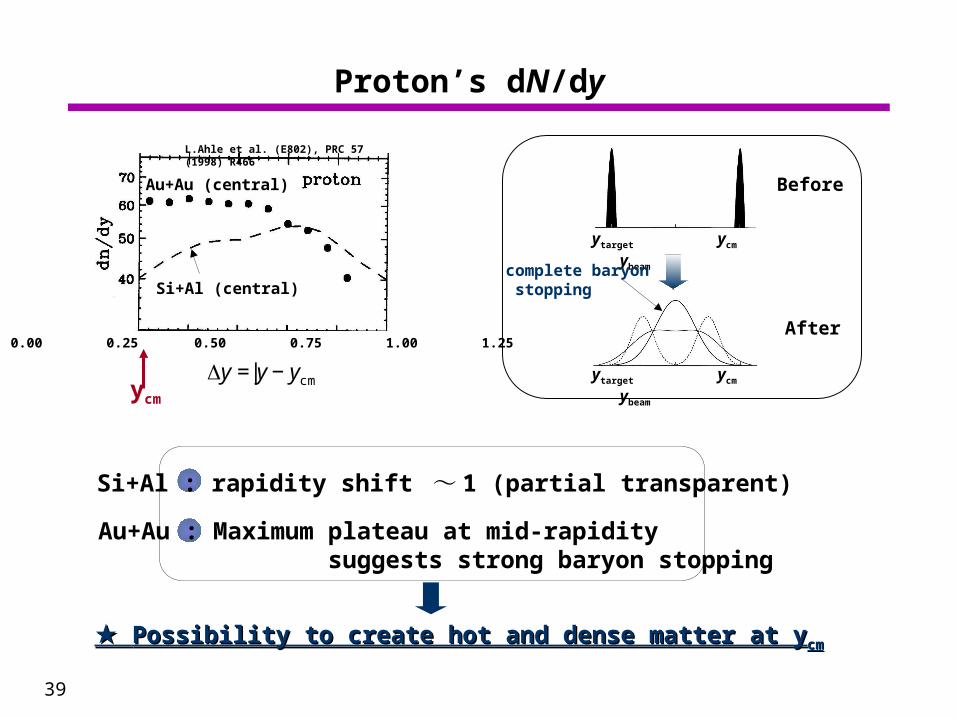
Proton’s dN/dy
ycm
y y y= −| |cm
L.Ahle et al. (E802), PRC 57 (1998) R466
Si+Al (central)
Au+Au (central)
0.00 0.25 0.50 0.75 1.00 1.25
Au+Au : Maximum plateau at mid-rapidity suggests strong baryon stopping
Si+Al : rapidity shift ~ 1 (partial transparent)
★ ★ Possibility to create hot and dense matter at yPossibility to create hot and dense matter at ycmcm
Before
After
ytarget ycm ybeam
ytarget ycm ybeam
complete baryon stopping
40
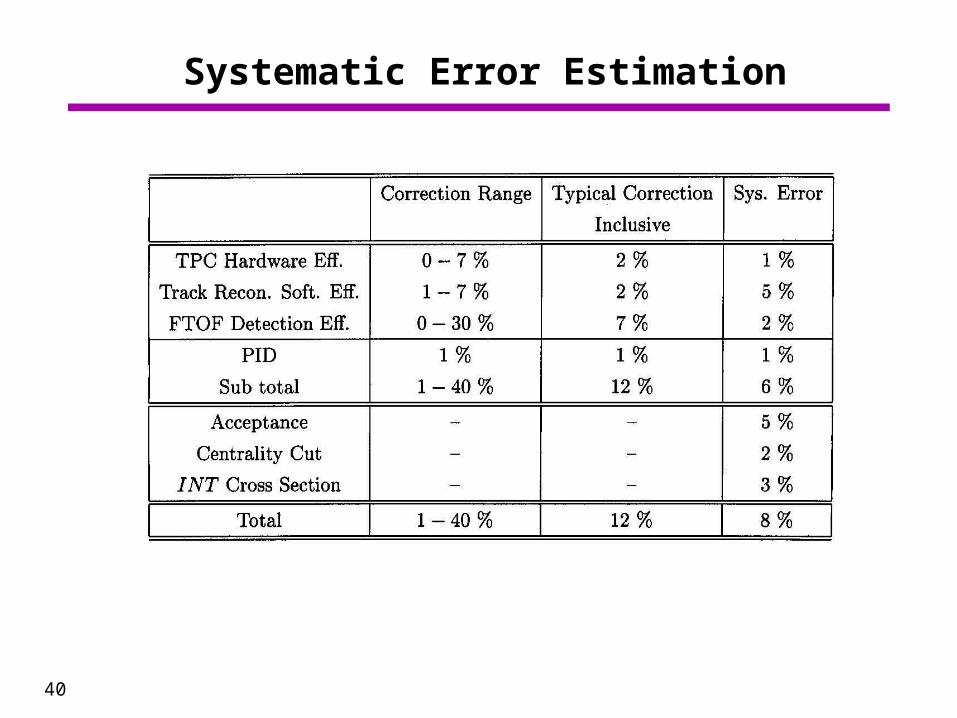
Systematic Error Estimation
41
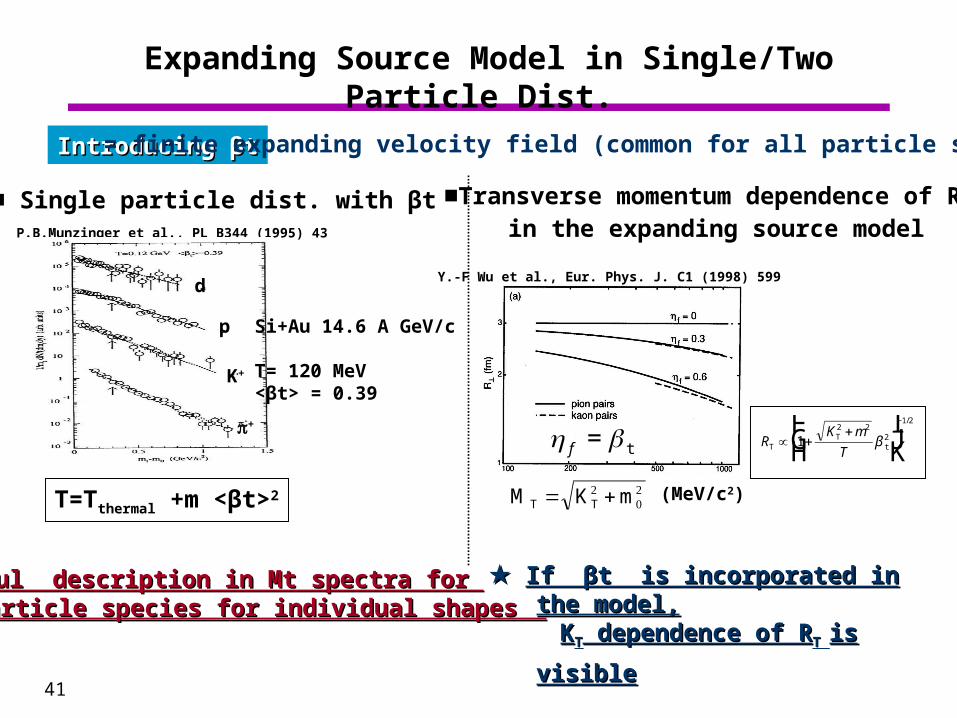
Expanding Source Model in Single/Two Particle Dist.
★ ★ Successful description in Mt spectra for Successful description in Mt spectra for all particle species for individual shapes all particle species for individual shapes
Introducing βtIntroducing βt = finite expanding velocity field (common for all particle species)
T=Tthermal +m <βt>2
P.B.Munzinger et al., PL B344 (1995) 43
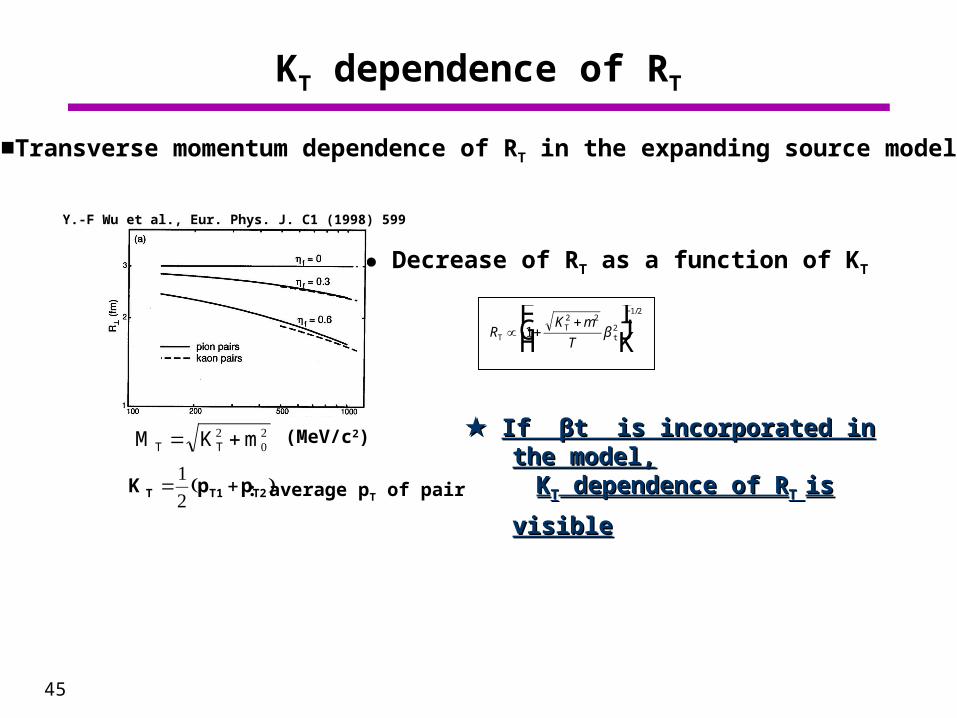
Y.-F Wu et al., Eur. Phys. J. C1 (1998) 599
■ Single particle dist. with βt ■Transverse momentum dependence of RT
in the expanding source model
η f = t
★ ★ If βt is incorporated in the model,If βt is incorporated in the model,
KKTT dependence of R dependence of RT T is visibleis visible
RK m
TTT
t∝ ++F
HGIKJ
−
12 2
2
1 2
β
/
Si+Au 14.6 A GeV/c
T= 120 MeV<βt> = 0.39
d
p
K+
π+
M K mT T= +2 02 (MeV/c2)
42
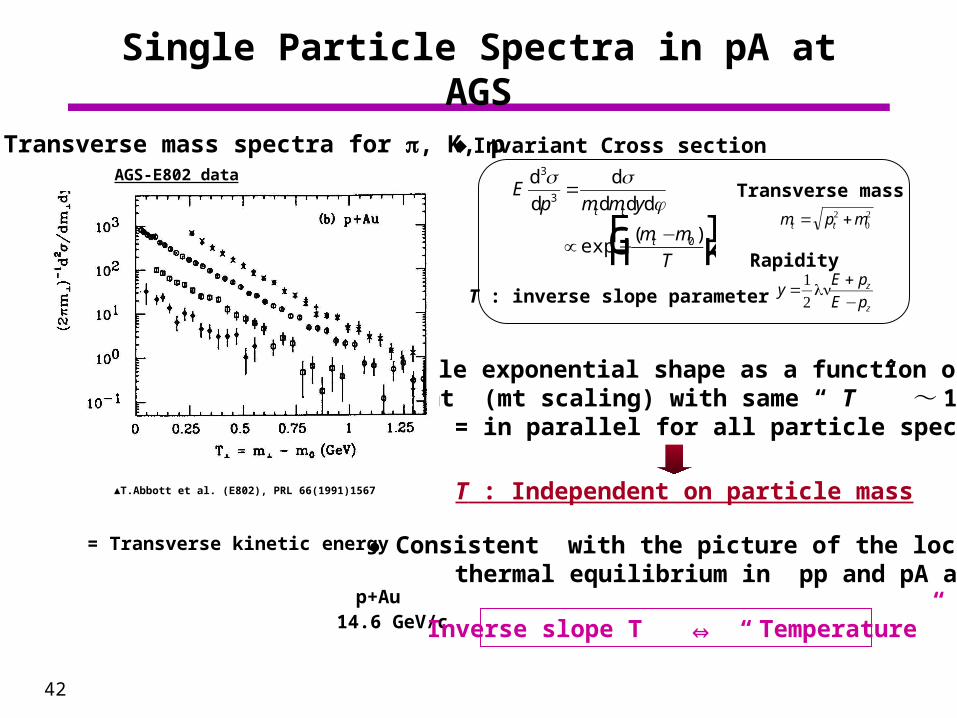
Single Particle Spectra in pA at AGS
● Single exponential shape as a function of mt (mt scaling) with same “ T ” ~ 150MeV = in parallel for all particle species
m p mt t= +2 02
Ep m m y
m m
T
t t
t
d
d
d
d d d
3
3
0
σ σφ
=
∝ −−F
HGIKJexp
( )
T : inverse slope parameter yE p
E pz
z
=+−
12
ln
◆Invariant Cross section
● Consistent with the picture of the local thermal equilibrium in pp and pA at AGS
T : Independent on particle mass▲T.Abbott et al. (E802), PRL 66(1991)1567
p+Au 14.6 GeV/c
AGS-E802 data
= Transverse kinetic energy
■ Transverse mass spectra for π, K, p
Transverse mass
Rapidity
Inverse slope T ⇔ “ Temperature”
43
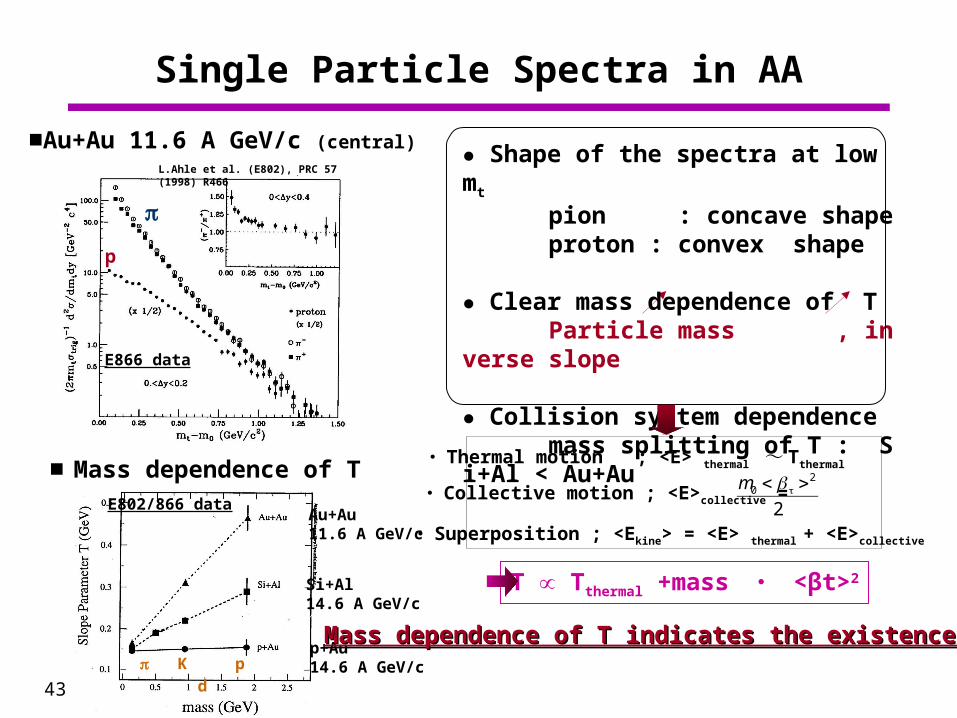
Single Particle Spectra in AA
L.Ahle et al. (E802), PRC 57 (1998) R466
■Au+Au 11.6 A GeV/c (central)
E866 data
● Shape of the spectra at low mt
pion : concave shape proton : convex shape
● Clear mass dependence of T Particle mass , inverse slope
● Collision system dependence mass splitting of T : Si+Al < Au+Au
T T∝ thermal +mass ・ <βt>2
■ Mass dependence of TE802/866 data
Au+Au 11.6 A GeV/c
Si+Al 14.6 A GeV/c
p+Au 14.6 A GeV/c π K p d
π
p
Mass dependence of T indicates the existence of Mass dependence of T indicates the existence of t t
・ Thermal motion ; <E> thermal ~ Tthermal
m02
2
< > t
・ Superposition ; <Ekine> = <E> thermal + <E>collective
・ Collective motion ; <E>collective =
44
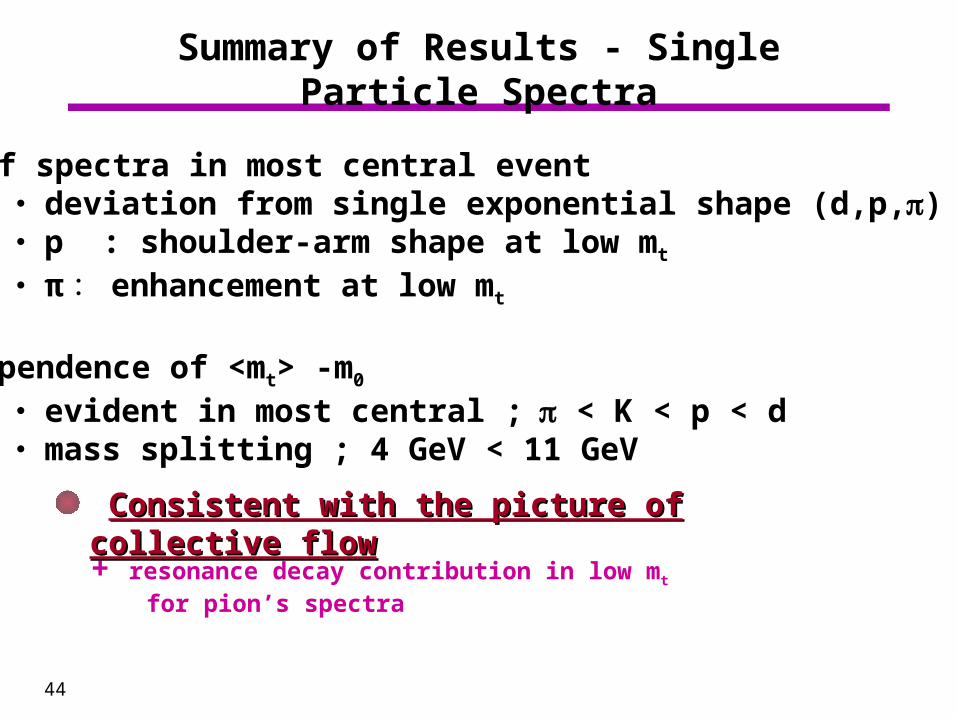
Summary of Results - Single Particle Spectra
1) Shape of spectra in most central event ・ deviation from single exponential shape (d,p,π) ・ p : shoulder-arm shape at low mt ・ π : enhancement at low mt
2) Mass dependence of <mt> -m0 ・ evident in most central ;π < K < p < d ・ mass splitting ; 4 GeV < 11 GeV
+ resonance decay contribution in low mt
for pion’s spectra
Consistent with the picture of collective flowConsistent with the picture of collective flow
45
KT dependence of RT
● Decrease of RT as a function of KT
■Transverse momentum dependence of RT in the expanding source model
RK m
TTT
t∝ ++F
HGIKJ
−
12 2
2
1 2
β
/
K p pT T1 T2= +12( ) : average pT of pair
Y.-F Wu et al., Eur. Phys. J. C1 (1998) 599
M K mT T= +2 02 (MeV/c2) ★ ★ If βt is incorporated in the model,If βt is incorporated in the model,
KKTT dependence of R dependence of RT T is visibleis visible
46
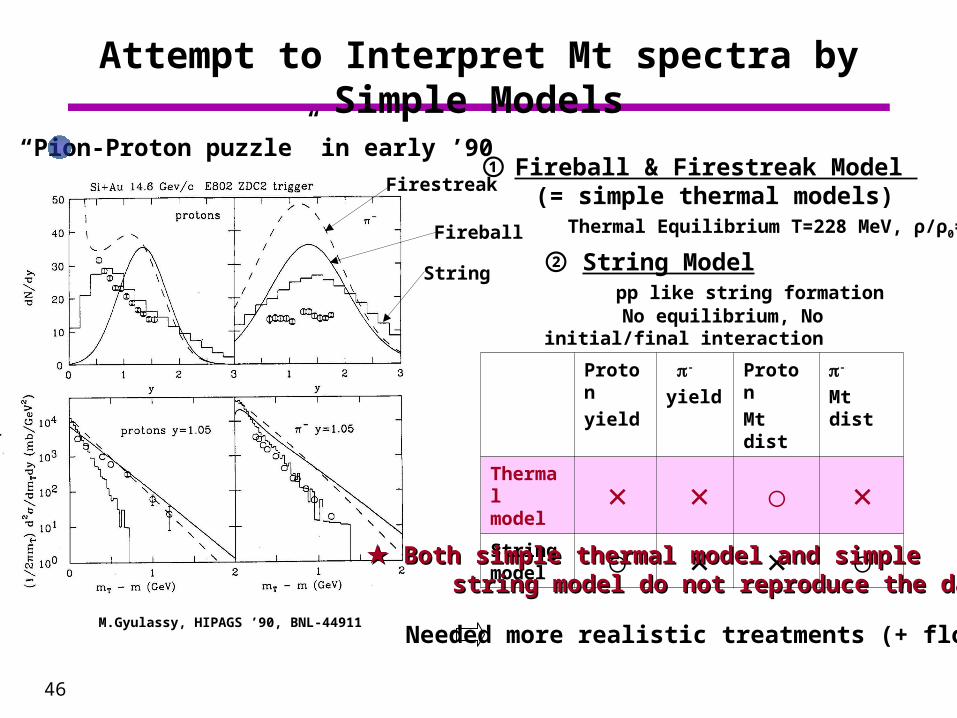
Attempt to Interpret Mt spectra by Simple Models
“Pion-Proton puzzle” in early ’90
M.Gyulassy, HIPAGS ’90, BNL-44911
① Fireball & Firestreak Model (= simple thermal models) Thermal Equilibrium T=228 MeV, ρ/ρ0= 4.8
Firestreak
Fireball
String
Proton
yield
π-
yield
Proton
Mt dist
π-
Mt dist
Thermal model × × ○ ×String model ○ × × ○
② String Model pp like string formation No equilibrium, No initial/final interaction
★ ★ Both simple thermal model and simpleBoth simple thermal model and simple string model do not reproduce the datastring model do not reproduce the data
Needed more realistic treatments (+ flow?)
47
Coulomb Correction
48
0 0.05 0.1 0.15 0.2
0.25
0.5
0.75
1
1.25
1.5
1.75
2
1/R
C Q R2 1= + ⋅(cos )C2
Q |p p |1 2
≡ − [ / ]GεV c
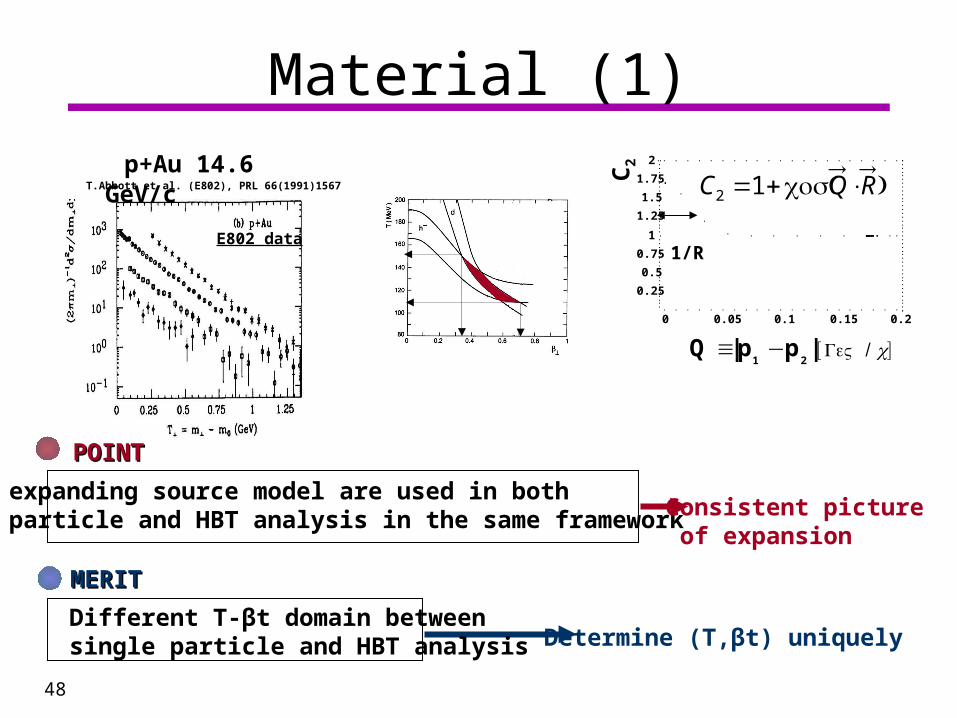
T.Abbott et al. (E802), PRL 66(1991)1567
p+Au 14.6 GeV/c
E802 data
Material (1)
Finite expanding source model are used in both single particle and HBT analysis in the same framework Consistent picture
of expansion
Determine (T,βt) uniquely
POINTPOINT
MERITMERIT
Different T-βt domain between single particle and HBT analysis
49
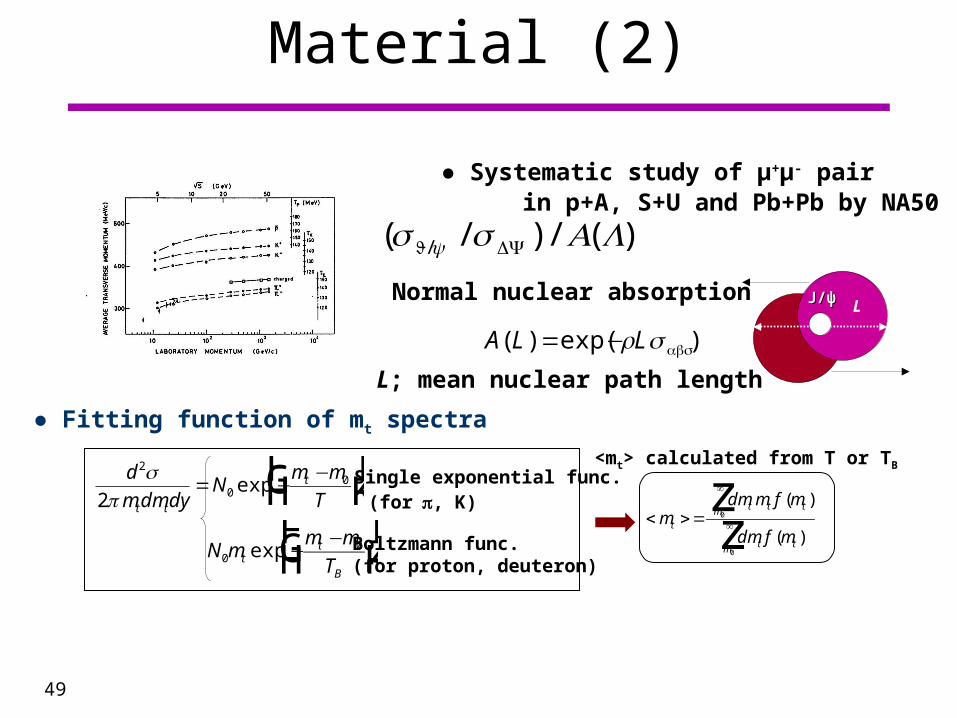
Material (2)
<mt> calculated from T or TB
● Fitting function of mt spectra
d
m dm dyN
m m
Tt t
t2
00
2
σπ
= −−F
HGIKJexp
N mm m
Ttt
B0
0exp −−F
HGIKJ
Single exponential func. (forπ, K)
Boltzmann func.(for proton, deuteron)
< >=
∞
∞
zzm
dm m f m
dm f mt
t t tm
t tm
( )
( )
0
0
J/ψJ/ψ L
L; mean nuclear path length
● Systematic study of μ+μ- pair in p+A, S+U and Pb+Pb by NA50
Normal nuclear absorption
A L L( ) exp( )= −ρ σ abs
( / ) / ( )/σ σψJ DY A L
50
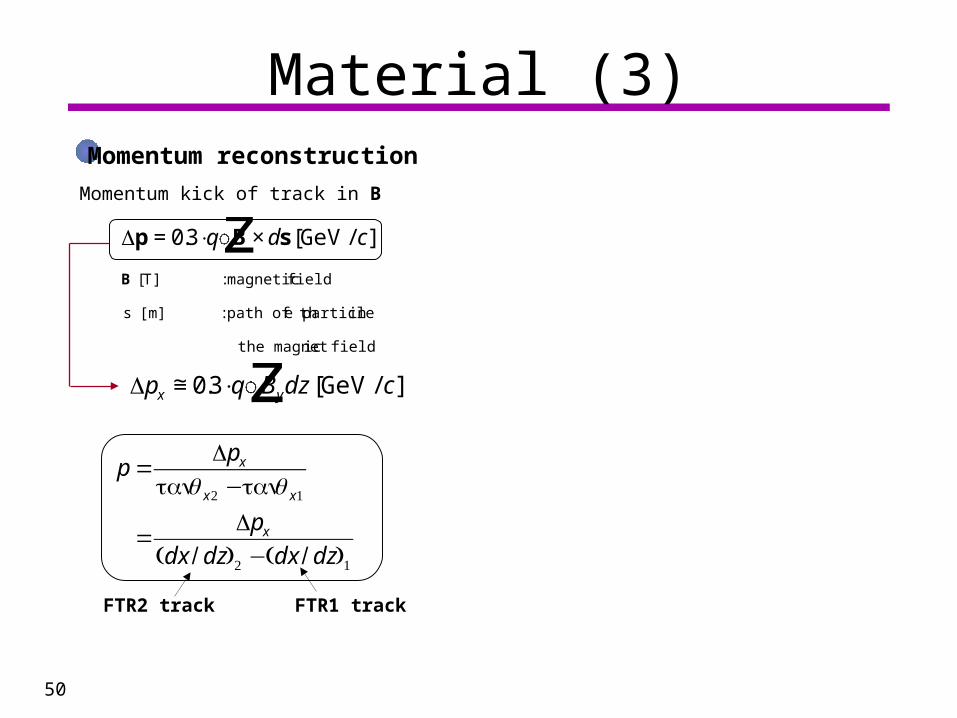
Material (3)Momentum reconstruction
p B s
B
= ⋅ ×z03. [ ]
[ ] :
q d cGeV/
T magneticfield
s [m] :path of the particle in
the magnetic field
p q B dz cx y≅ ⋅ z03. [ ]GeV/
Momentum kick of track in B
pp
p
dx dz dx dz
x
x x
x
=−
=−
tan tan
( / ) ( / )
θ θ2 1
2 1
FTR2 track FTR1 track