Embed Size (px)
Citation preview
Instructions for use
Title Study on the calcium carbonate precipitation and anion diffusion in compacted bentonite for performance assessment ofengineered barrier in the geological disposal
Author(s) Rachmadetin, Jaka
Citation 北海道大学. 博士(工学) 甲第13790号
Issue Date 2019-09-25
DOI 10.14943/doctoral.k13790
Doc URL http://hdl.handle.net/2115/75918
Type theses (doctoral)
File Information Jaka_Rachmadetin.pdf
Hokkaido University Collection of Scholarly and Academic Papers : HUSCAP
Study on the calcium carbonate precipitation and anion diffusion in
compacted bentonite for performance assessment of engineered
barrier in the geological disposal
by
Jaka Rachmadetin
A dissertation submitted in partial fulfilment of the requirements for the degree of
Doctor of Philosophy in Engineering
Division of Energy and Environmental Systems
Graduate School of Engineering
Hokkaido University
Sapporo, Japan
2019

Abstract
Compacted bentonite is expected to be used as one of engineered barriers in
geological disposal of high-level radioactive waste. For the safety assessment of the
geological disposal, it is important to understand fate and transport of radionuclides in
compacted bentonite in order to predict long term migration behavior of radionuclides at
the radioactive waste repository. Although extensive studies have been conducted to
improve the knowledge regarding the performance of bentonite as the engineered barrier,
the widely accepted model which can predict long-term transport of radionuclides in
bentonite has not been established due to its complexities. Therefore, this thesis intends
to improve our understanding in this context in terms of three factors which affects the
fate and transport of radionuclides in bentonite; the porewater chemistry, the precipitation
processes, and the diffusion mechanism of ions in bentonite.
The porewater chemistry of bentonite was studied from the view of activity
coefficient of dissolved ions in the porewater. In this study, the mean activity coefficient
of Ca2+ and CO32- ions was obtained from the estimated concentrations of each ion in the
porewater in which CaCO3 precipitation occurred. The CaCO3 precipitation was
enhanced by electromigration method in which Ca2+ and HCO3-/CO3
2- ions were
introduced from the opposite sides of the compacted Na-bentonite under electrical
potential gradient. A sequential extraction method using radioisotopes as tracer and
saturated CaCO3 solution as extractant was developed to distinctly determine the
concentrations in the porewater as free ions and in solid phase in bentonite. The results
show that the exchangeable Na+ ions were progressively replaced by the incoming Ca2+
ions. The compacted bentonite sample can be divided into three zones: Ca-bentonite, a
mixture of Ca-/Na- bentonite, and Na-bentonite zones, depending on the degree of
replacement of the exchangeable Na+ by Ca2+ ions. Precipitates of CaCO3 were observed
both in Ca-bentonite and Ca/Na-bentonite zones. The experimentally determined mean
activity coefficients were at least smaller by a factor of three compared to the theoretical
approximation calculated using PHREEQC code assuming dilute-solution conditions
with no electrostatic interactions between ions and bentonite surface.
The precipitation processes were studied for CaCO3 which was enhanced to form
in bentonite by the same electromigration method at different experimental periods of
time. Electromigration experiments with thin layer source were also carried out to obtain
the electromigration parameters of Ca2+ and HCO3-/CO3
2- in compacted bentonite. The
results showed that the reaction front of CaCO3 precipitation under the experimental
conditions moved from the anode side towards the cathode side. This advancing reaction
front can be attributed to the faster mobility of Ca2+ compared to HCO3-/CO3
2- ions. The
CaCO3 precipitates which were formed during the electromigration were found to have
negligible effect on the transport of Ca2+ and HCO3-/CO3
2- ions.
The anions diffusion mechanism was studied for 35SO42- ions in Na-bentonite at
different dry densities and NaCl concentrations using back-to-back diffusion method. The
results showed that the Ea values were smaller than that in free water in bentonite at dry
density of 1 kg/dm3 with NaCl concentration up to 0.3 M. When the NaCl concentrations
increased above 0.3 M, the Ea value increased and be equal to that in free water. This
indicate that diffusion in porewater is predominant for SO42- ions in compacted bentonite
at dry density of 1 kg/dm3 with NaCl concentration higher than 0.3 M. However, lower
Ea values than that in free water at NaCl concentration lower than 0.3 M cannot be
explained by the diffusion in porewater, suggesting the presence of different diffusion
path than porewater for anions in compacted bentonite.
The results of this study have important sequences in defining solubility,
chemical reaction and mass transport in bentonite which are important for safety
assessment of disposal of high-level radioactive waste.

i
Table of Contents
Table of Contents .............................................................................................................. i
Table of Figures ............................................................................................................... iv
1. Introduction ............................................................................................................... 1
1.1. Generation and classification of radioactive waste ....................................................... 1
1.2. Bentonite in geological disposal of high-level waste .................................................... 5
1.3. Properties of bentonite ................................................................................................ 10
1.3.1. Crystal and micro- structure of bentonite ............................................................ 10
1.3.2. Cation exchange reaction in bentonite ................................................................ 13
1.3.3. Porewater of Bentonite ........................................................................................ 14
1.3.4. Hydraulic conductivity of water and diffusivities of radionuclides in bentonite 16
1.4. Long-term durability of bentonite in geological disposal ........................................... 18
1.4.1. Alteration due to waste form and cementitious materials ................................... 18
1.4.2. Effect of CaCO3 precipitation in geological disposal .......................................... 20
1.5. Calcium carbonate precipitation .................................................................................. 22
1.5.1. Dissolved carbonate equilibria ............................................................................ 22
1.5.2. CaCO3 precipitation in bulk solution ................................................................... 23
1.5.3. CaCO3 precipitation in bentonite ......................................................................... 26
1.6. Objective and experimental approach ......................................................................... 28
1.6.1. Objective ............................................................................................................. 28
1.6.2. CaCO3 precipitation enhanced by electrokinetic method .................................... 29
1.6.3. Determination of diffusion coefficient by back-to-back diffusion ...................... 32
1.7. Outline of this thesis .................................................................................................... 34
1.8. References ................................................................................................................... 36
2. Calcium carbonate precipitation in compacted bentonite using electromigration
reaction method and its application to estimate the ion activity coefficient in the
porewater ................................................................................................................. 55
2.1. Introduction ................................................................................................................. 55
2.2. Method ........................................................................................................................ 57
2.2.1. Materials .............................................................................................................. 57
2.2.2. Preparation of Saturated Compacted Na-Bentonite ............................................ 58
2.2.3. Electromigration Experiment .............................................................................. 58
2.2.4. Sequential extraction of Ca ................................................................................. 60
2.2.5. Concentration profiles of other ions .................................................................... 62
ii
2.2.6. XRD and SEM/EDS Analysis ............................................................................. 62
2.3. Results ......................................................................................................................... 63
2.3.1. Sequential extraction test .................................................................................... 63
2.3.2. Spatial distribution of ions in bentonite after the electromigration ..................... 64
2.3.3. pH profile ............................................................................................................ 68
2.4.1. XRD and SEM-EDS analysis .............................................................................. 69
2.4. Discussion ................................................................................................................... 74
2.4.1. Estimation of mean activity coefficient from electromigration experiment ........ 74
2.4.2. Porewater chemistry in bentonite ........................................................................ 79
2.5. Conclusions ................................................................................................................. 80
2.6. References ................................................................................................................... 81
3. Migration behavior of Ca2+ and carbonate ions in compacted bentonite under
electrical potential gradient ..................................................................................... 88
3.1. Introduction ................................................................................................................. 88
3.2. Method ........................................................................................................................ 90
3.2.1. Preparation of Saturated Compacted Na-Bentonite ............................................ 90
3.2.2. Determination of electromigration parameters of Ca2+ and HCO3-/CO3
2- ions ... 91
3.2.3. Electromigration of Ca2+ with HCO3-/CO3
2- ions during precipitation of CaCO3 92
3.3. Result ........................................................................................................................... 95
3.3.1. Electromigration parameters of Ca2+ and HCO3-/CO3
2- ions ............................... 95
3.3.2. Spatial distributions of ions after electromigration reaction ............................... 99
3.3.3. Spatial distribution of pH after electromigration reaction ................................. 103
3.4. Discussion ................................................................................................................. 104
3.4.1. Moving reaction front of CaCO3 precipitation .................................................. 104
3.4.2. Transport process to the site of reaction front ................................................... 106
3.5. Conclusion ................................................................................................................. 108
3.6. References ................................................................................................................. 109
4. Diffusion behavior of sulphate ions in compacted bentonite at different dry density
and salinity ............................................................................................................ 113
4.1. Introduction ............................................................................................................... 113
4.2. Method ...................................................................................................................... 115
4.3. Result ......................................................................................................................... 118
4.3.1. Diffusivity of 35SO42- ions in compacted bentonite ........................................... 118
4.3.2. Ea values of 35SO42- in compacted bentonite ...................................................... 122
4.4. Discussion ................................................................................................................. 124
iii
Effect of dry density on the diffusion of 35SO42- ions ....................................... 124
Effect of salinity on the diffusion of 35SO42- ions ............................................. 126
4.5. Conclusion ................................................................................................................. 128
4.6. References ................................................................................................................. 129
5. Conclusion ............................................................................................................. 133
Acknowledgement ........................................................................................................ 136
iv
Table of Figures
Figure 1-1. Illustration of disposal types in Japan [10,11]. .............................................. 5
Figure 1-2 Inventory of radionuclides in a typical vitrified waste. The waste is assumed
to be generated from reprocessing of spent fuel at a 45000 MWd/ton burn-up, 38
MW/MTU specific output, 1184.2 days operation time in a pressurized water reactor,
and 4 years cooling period. Each canister loading is 0.8 MTU/canister. The ratios of
U and Pu transferred from the spent fuel to the vitrified waste trough reprocessing
are 0.442 and 0.548%, respectively. The cooling period after reprocessing is 50 years
[20]. ........................................................................................................................... 7
Figure 1-3. The concept of geological disposal of high-level waste in Japan [28]. ......... 8
Figure 1-4 Processes describing model for migration of radionuclides in geological
disposal [20]. ........................................................................................................... 10
Figure 1-5. Structure of montmorillonite layer and conceptual model of a montmorillonite
particle and aggregate. ............................................................................................ 11
Figure 1-6. Speciation of U(VI) in the presence of Ca2+, HCO3/CO32-, and SiO2. The
figure is for the total concentration of dissolved U(VI), Ca, and SiO2 are10-5, 10-2,
and 10-2.5 M, respectively, and CO2 partial pressure 10-2.5 atm [98]. ...................... 21
Figure 1-7. Distribution of dissolved carbonate species as a function of pH in (a) a closed
system and (b) an open system at a constant CO2 partial pressure of 10-2 atm. ...... 23
Figure 1-8. Solubility products of CaCO3 polymorphs: calcite, aragonite, vaterite [113],
monohydrocalcite [114,115], ikaite [116,117], and amorphous CaCO3 [117–119].25
Figure 1-9 Schematic of the main phenomena during electrokinetic process [141,142].
................................................................................................................................. 30
Figure 1-10. Schematic of back-to-back diffusion method (a) and typical concentration
profile in each of bentonite (b). ............................................................................... 34
Figure 2-1. Schematic electromigration experiment set up. ........................................... 59
Figure 2-2. Spatial distribution of Ca2+ and Na+ ions in compacted montmorillonite after
16 hours of electromigration experiment. The free Ca2+ and Na+ ions are their
respective concentration from extraction with saturated CaCO3 solution. The figure
has the plotting concentrations (meq/g-dry bentonite) per sliced bentonite sample
versus the position of the distance of the center of each slice from the anode side.
The acid extractable Ca2+ and Na+ from sequential extraction are the concentration
of Ca2+ and Na+ ions as exchangeable cations and solid phases. The horizontal
straight line is the CEC value of bentonite sample which equals 1.05 meq/g-dry
bentonite. The error bars are calculated from the standard deviation of average value
in triplicate experiments. ......................................................................................... 65
Figure 2-3. Spatial distribution of carbonate as free ions and solid phase in compacted
bentonite after 16 hours of electromigration. .......................................................... 67
Figure 2-4. Spatial distribution of pH of sliced bentonite sample dispersed in 10 ml
deionized water. ...................................................................................................... 68
v
Figure 2-5. SEM/EDS images of initial bentonite sample in different closed-view
positions. ................................................................................................................. 70
Figure 2-6. SEM/EDS images of sliced bentonite sample at x = 3.25 mm with
magnification of 5000 (a) and 15000 times (b). The (b) image is magnification of an
area of white square in the image (a). The bright spots in Ca-map in the images show
rich areas with relatively higher concentration of Ca. ............................................ 71
Figure 2-7. SEM/EDS images of sliced bentonite sample at x = 7.75 mm with
magnification of 2200 (a) and 15000 times (b). The (b) image is magnification of an
area of white square in the image (a). The bright spots in Ca-map in the images show
rich areas with relatively higher concentration of Ca. ............................................ 72
Figure 2-8. X-ray diffraction patterns of bentonite sample at x = 0.5 mm distance from
the anode side after the electromigration experiment compared with Ca-bentonite
(M: Ca-montmorillonite, C: calcite). ...................................................................... 73
Figure 2-9. Experimentally determined and theoretical mean activity coefficients
calculated using PHREEQC code in the porewater at x = 5.25 and 5.75 mm. The
vertical dash lines are the pH of dispersed bentonite in deionized water which were
obtained from the experiment. ................................................................................ 78
Figure 3-1. Schematic tracer arrangement ...................................................................... 91
Figure 3-2. Schematic electromigration experiment set up. ........................................... 93
Figure 3-3. Spatial distribution of relative concentration of 45Ca2+ and H14CO3-/14CO3
2-
ions after 6 hours of electromigration experiment with constant electrical current of
15 mA. The initial positions of radiotracers are at x = 0. The solid lines are the least
square fit of the concentration profile of each ion. ................................................. 97
Figure 3-4. Spatial distribution of solid carbonate ......................................................... 99
Figure 3-5. Spatial distribution dissolved carbonate at 6 and 16 hours electromigration
reaction time. ......................................................................................................... 101
Figure 3-6. Spatial distribution of calcium extracted by saturated CaCO3 solution and
HCl in sequential extraction at 6 and 16 hours electromigration time. Horizontal dash
line is calculated from CEC value of bentonite (1.05 meq/g bentonite [37]) ....... 102
Figure 3-7. Spatial distribution of pH of sliced bentonite sample dispersed in 10 ml
deionized water. .................................................................................................... 103
Figure 4-1. Schematic of diffusion experiment. ........................................................... 116
Figure 4-2. The Da values of SO42- (this study) and Cl- ions [22,23] in water saturated
compacted bentonite at 298 K as a function of dry density. ................................. 120
Figure 4-3. The temperature dependence of the Da values of SO42- in compacted bentonite
at dry density of 1 kg/dm3 under various NaCl concentrations. ........................... 121
Figure 4-4. Ea values of 35SO42- ions in compacted bentonite as a function of dry density
and NaCl concentration. The horizontal dash line is the Ea value of SO42- ions in free
water (20.7 kJ/mol [42]). ....................................................................................... 123
vi
Figure 4-5. The Ea of 35SO42- (present study) and Cl- [22,23] ions in compacted bentonite
at different dry densities. The horizontal dash line is the Ea in free water (20.7 and
17.4 kJ/mol for SO42- and Cl- ions, respectively [42]. ........................................... 125

1
1. Introduction
1.1. Generation and classification of radioactive waste
Nuclear energy is an important source for present and future energy supply, even
after re-evaluation of national nuclear energy policies throughout the world after the
Fukushima nuclear accident. While some countries, such as Germany, Belgium and
Switzerland, are going to phase out nuclear power generation, other countries, such as
UAE, Belarus, Turkey, and Bangladesh have started constructing their first nuclear power
plants (NPP). In 2017, the global share of nuclear in total electricity generation was
approximately 10.4%. The nuclear share in Japan is 6.2% due to late re-operation of
NPPs, but it is projected to be increased to about 20% by 2030 [1].
One of the major issues in the utilization of nuclear for power generation is the
generation of radioactive waste [2]. NPPs are not the only source of radioactive waste.
Radioactive waste is also generated from other applications, such as medical, research,
agricultural and industrial. In principle, this radioactive waste must be managed in such
a way as to ensure no burdens on future generations [3]. However, there are various
radioactive waste with wide variety of physical, chemical, and radioactive properties.
Therefore, the proper classification of radioactive waste is necessary to establish a safe
and structured radioactive waste management [4,5].
International Atomic Energy Agency (IAEA) has provided general classification
scheme in which radioactive waste is classified into six categories: exempt waste, very
short-lived waste (VSLW), very low-level waste (VLLW), low-level waste (LLW),
intermediate-level waste (ILW), and high-level waste (HLW) [4,5]. The classification of
radioactive waste, however, varies among countries. For example, the types of HLW
2
depend on national policies on the nuclear fuel cycle. In countries which adopt a once-
through fuel cycle policy, the HLW is the spent nuclear fuel (SNF) generated from nuclear
reactor operation. In contrast, the SNF is not considered as a waste in countries which
adopt a closed cycle, most notably Japan, France, Russia, and China. The SNF in these
countries is reprocessed to retrieve the fissile products, resulting in vitrified waste as
HLW [2].
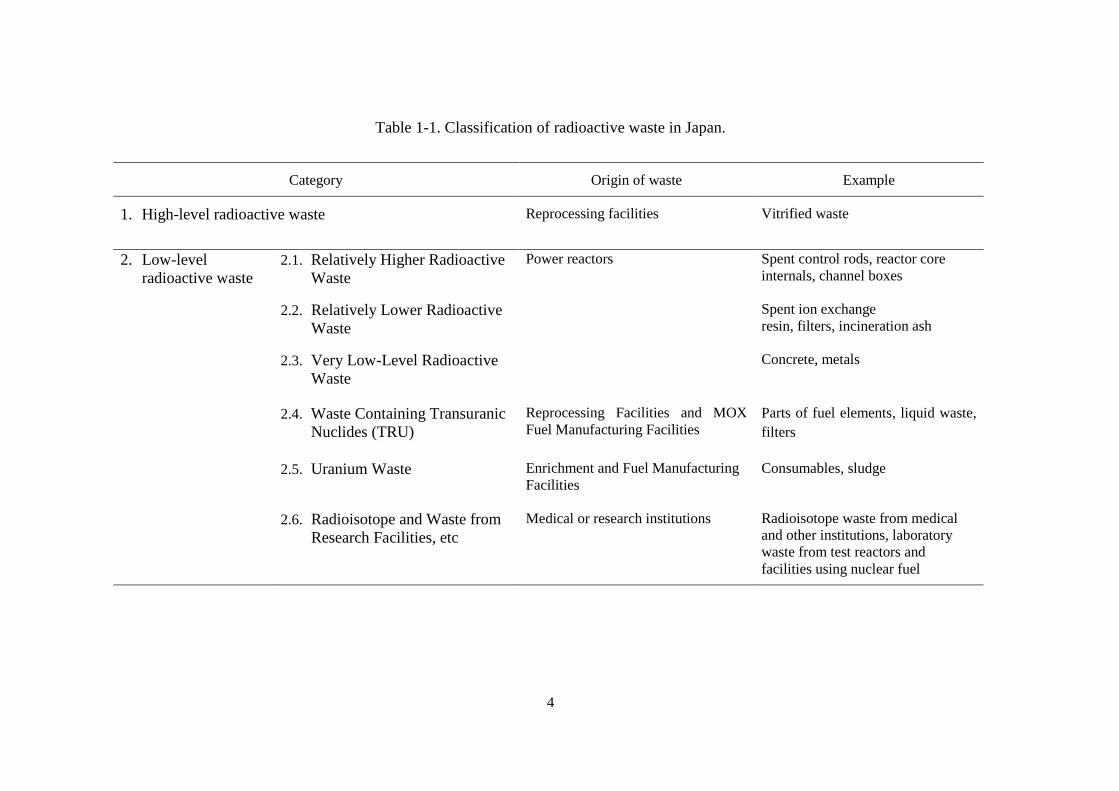
The classification of radioactive waste in Japan based on the Reactor Regulation
Law is shown in Table 1-1. Radioactive waste is classified into two categories: LLW and
HLW. The LLW is further classified into six sub-categories based on the origin of the
waste, which may limit kinds of radionuclides, and their levels of radioactivity in the
waste. The LLW generated from NPP is classified into three sub-categories: very low-
level radioactive waste, relatively lower radioactive waste, and relatively higher
radioactive waste. The other sub-categories of LLW are: waste containing transuranic
(TRU) nuclides, uranium waste, and radioactive waste from medical and research
facilities [6]. In addition to this classification, the waste generated from nuclear facilities
which has radioactivity below the clearance level is not considered as radioactive waste
and is manage as general waste. The method to determine this clearance level has been
approved in 2011 [7].
As of 2013, the worldwide inventory of solid radioactive waste which has been
disposed of, and in storage is approximately 21.4 and 6.3 million m3, respectively. ILW
and HLW contribute only small portions of this volume, which are 567,000 and 22,000
m3, respectively. The majority of ILW and all HLW are currently in storage waiting for
disposal facilities. In addition, there are an estimated 370,000 tHM of the SNF discharged
from NPP and 3,193 tHM of the SNF from research and other reactors in the world. Note
3
that the characteristics of the SNF from NPP and research reactor may differ because of
the difference in the fuel quantities and the enrichment of uranium [8]. In Japan, there are
2,485 containers of vitrified HLW which have been processed, about 88% of which are
stored in the HLW interim storage facilities at the Japan Nuclear Fuel Limited (JNFL)
and the remaining are at Japan Nuclear Energy Agency (JAEA). Additionally, there are
SNF temporary stored in the NPPs throughout the country. The total amount of vitrified
waste and SNF is approximately equivalent to 25,000 containers [9].
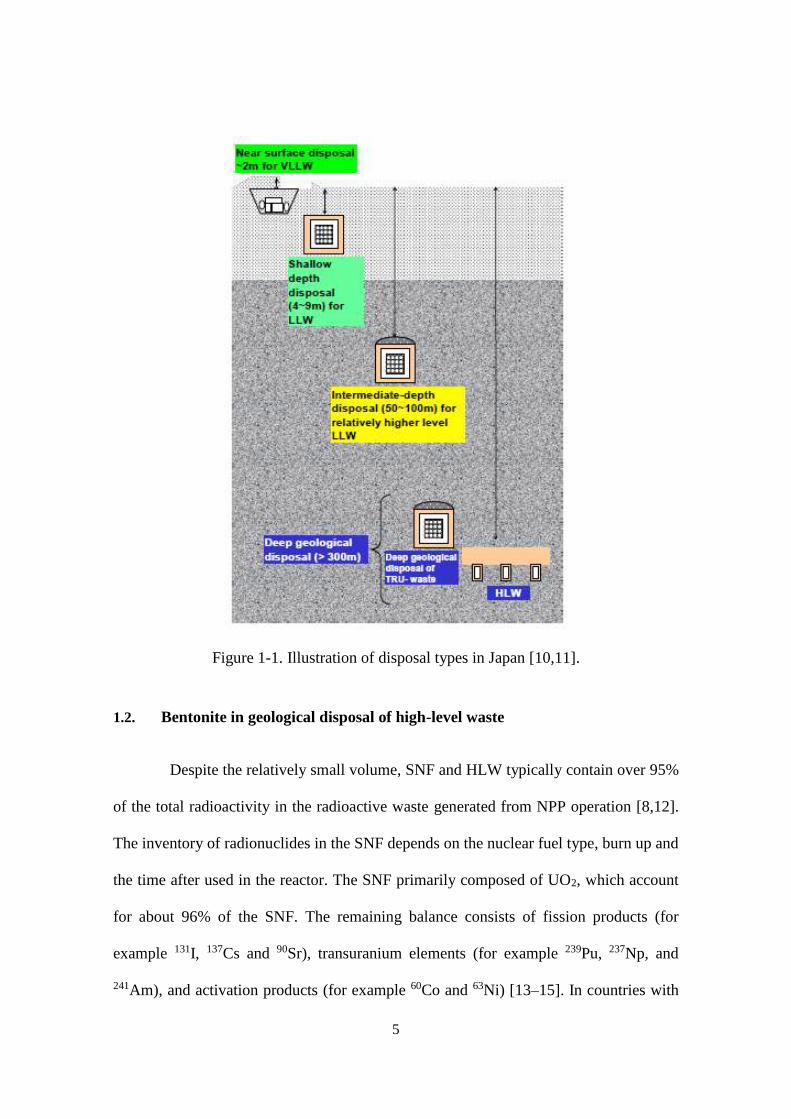
The classified radioactive waste will be disposed of in the way which is suitable
for each of radioactive waste classes. In Japan, basically radioactive waste disposal
facilities are classified into four types based on their burial concepts. Near surface
disposal, the unlined trench type, is used to dispose of very low-level radioactive waste.
Shallow depth disposal, constructed in 4 to 9 m depth underground, is used to dispose of
relatively lower activity LLW. Intermediate-depth disposal, constructed in 50-100 m
underground, will be used to dispose of relatively higher low-level radioactive waste.
Geological disposal, constructed at deeper than 300 m underground, is to be used to
dispose of TRU waste and HLW [10].
4
Table 1-1. Classification of radioactive waste in Japan.
Category Origin of waste Example
1. High-level radioactive waste Reprocessing facilities Vitrified waste
2. Low-level
radioactive waste
2.1. Relatively Higher Radioactive
Waste
Power reactors Spent control rods, reactor core
internals, channel boxes
2.2. Relatively Lower Radioactive
Waste
Spent ion exchange
resin, filters, incineration ash
2.3. Very Low-Level Radioactive
Waste
Concrete, metals
2.4. Waste Containing Transuranic
Nuclides (TRU)
Reprocessing Facilities and MOX
Fuel Manufacturing Facilities
Parts of fuel elements, liquid waste,
filters
2.5. Uranium Waste Enrichment and Fuel Manufacturing
Facilities
Consumables, sludge
2.6. Radioisotope and Waste from
Research Facilities, etc
Medical or research institutions Radioisotope waste from medical
and other institutions, laboratory
waste from test reactors and
facilities using nuclear fuel
5
Figure 1-1. Illustration of disposal types in Japan [10,11].
1.2. Bentonite in geological disposal of high-level waste
Despite the relatively small volume, SNF and HLW typically contain over 95%
of the total radioactivity in the radioactive waste generated from NPP operation [8,12].
The inventory of radionuclides in the SNF depends on the nuclear fuel type, burn up and
the time after used in the reactor. The SNF primarily composed of UO2, which account
for about 96% of the SNF. The remaining balance consists of fission products (for
example 131I, 137Cs and 90Sr), transuranium elements (for example 239Pu, 237Np, and
241Am), and activation products (for example 60Co and 63Ni) [13–15]. In countries with
6
once-through fuel cycle policy, this SNF is considered as HLW and is destined for final
disposal. However, the thermal output from radioactive decay in SNF is very high after
discharge from reactors. The SNF must be stored in water pools on reactor sites prior to
disposal. In some cases, temporary storage in dry cask after the SNF is cooled in the water
pool is necessary because no repository facilities are available to dispose of the SNF
[15,16].
In countries adopting closed fuel cycle policy, chemical process is applied to
recover the 235U and 239Pu from SNF. The recovered materials can be used as a mixed-
oxide fuel. This process generates high-level liquid waste, which contains most of the
fission products that were in the SNF, unrecovered uranium, and TRU nuclides.
Vitrification is adopted by many countries which have SNF reprocessing program as the
best method for treatment and immobilization of the high-level liquid waste because of
the durability of glass and its ability to provide host-phase containment for wide range of
radionuclides [17,18]. In this method, the high-level liquid waste is mixed with glass
materials and melted together into the molten glass phase. Borosilicate glass has been
universally selected except for alumino-phosphate glass used in Russia. The molten glass
is then placed in a container typically made of steel, copper, or corrosion resistant alloys,
and solidified [19]. The container used in Japan is made of stainless steel with the
dimensions of 1340 mm in height, 430 mm in outer diameter, and 6 mm in wall thickness.
The initial inventory of radionuclides in the vitrified waste depends on the
inventory of radionuclides in the SNF subjected to reprocessing and the reprocessing
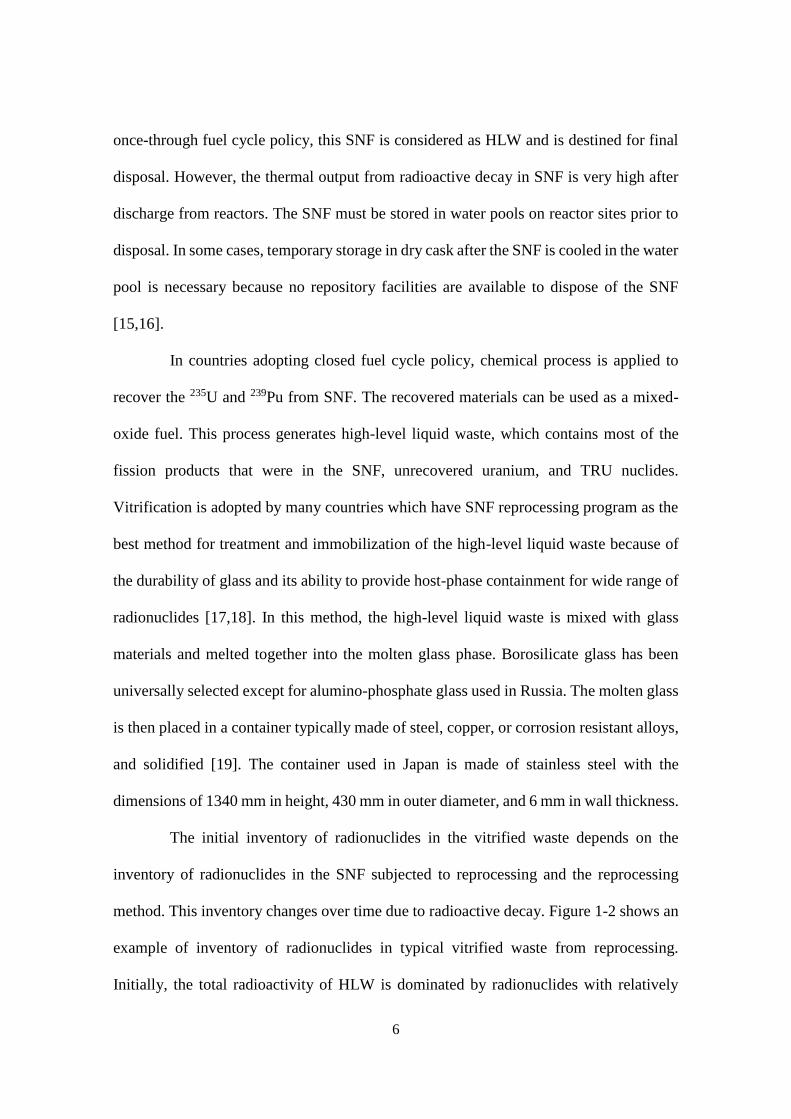
method. This inventory changes over time due to radioactive decay. Figure 1-2 shows an
example of inventory of radionuclides in typical vitrified waste from reprocessing.
Initially, the total radioactivity of HLW is dominated by radionuclides with relatively
7
short half-lives, such as 137Cs and 90Sr. After a few hundreds of years, the radioactivity is
dominated by radionuclides with long-half-lives [20]. Although the radioactivity of
vitrified waste is smaller than SNF, it still requires several hundred thousand years to
reach the level of radioactivity of natural uranium [21]. Therefore, disposal facility of
HLW must be ensured to contain radionuclides for this long period of time.
Figure 1-2 Inventory of radionuclides in a typical vitrified waste. The waste is assumed
to be generated from reprocessing of spent fuel at a 45000 MWd/ton burn-up, 38
MW/MTU specific output, 1184.2 days operation time in a pressurized water reactor,
and 4 years cooling period. Each canister loading is 0.8 MTU/canister. The ratios of U
and Pu transferred from the spent fuel to the vitrified waste trough reprocessing are
0.442 and 0.548%, respectively. The cooling period after reprocessing is 50 years [20].
8
Geological disposal has been a preferred method for HLW since it is expected
to have long-term safety for waste isolation [12,22]. A concept of multiple safety
functions is required to isolate the radioactive waste from geosphere for long period of
time [23]. A multi barrier approach with a series of engineered barriers and natural
barriers is adopted. The engineered barriers consist of waste form, waste package, and
backfill materials, whereas natural barriers are the rocks surrounding the repository [24].
The potential host rock that widely recognized for geological disposal are granite [25],
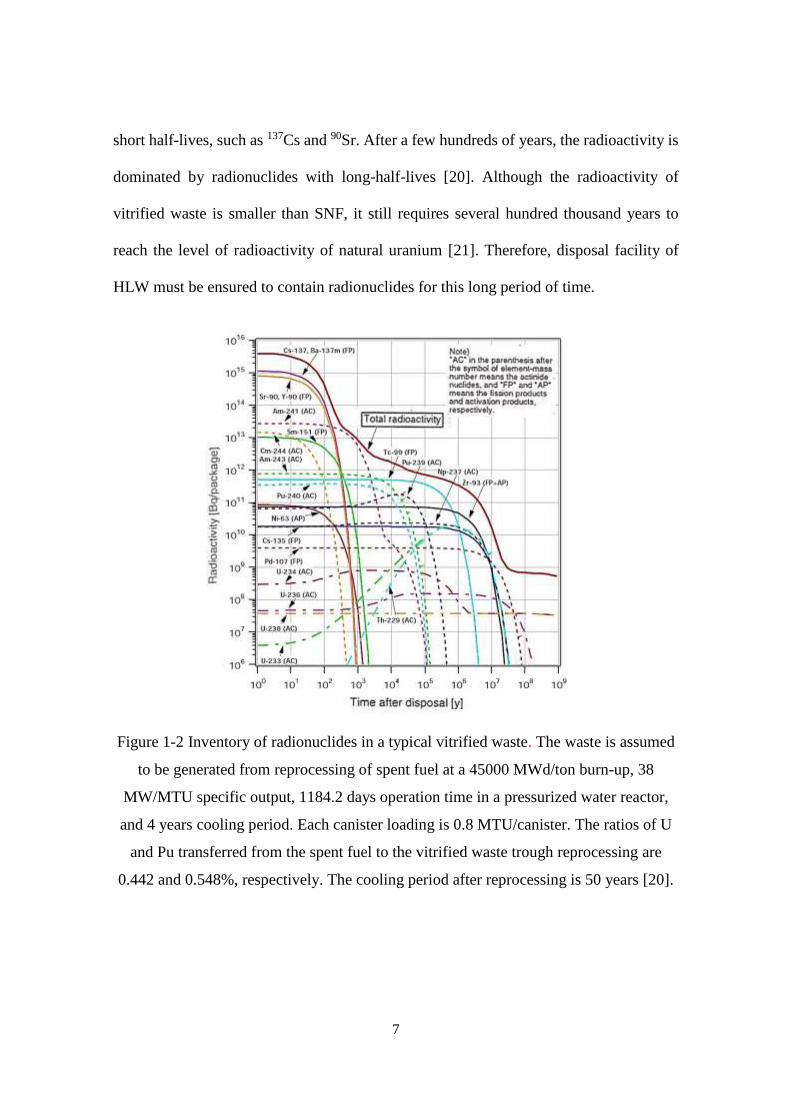
clay [26], and rock salt [27]. The basic concept of geological disposal in Japan is depicted
in Figure 1-3. As previously mentioned, the waste form for HLW is borosilicate glass
while the container is made of stainless steel. This waste is placed inside a thick metal
container called “overpack”. The HLW in the overpack is then surrounded by compacted
bentonite as buffer material. The repository will be located in stable formation of granite
or sedimentary rock at 300 m or deeper from the surface [10,28].
Figure 1-3. The concept of geological disposal of high-level waste in Japan [28].
9
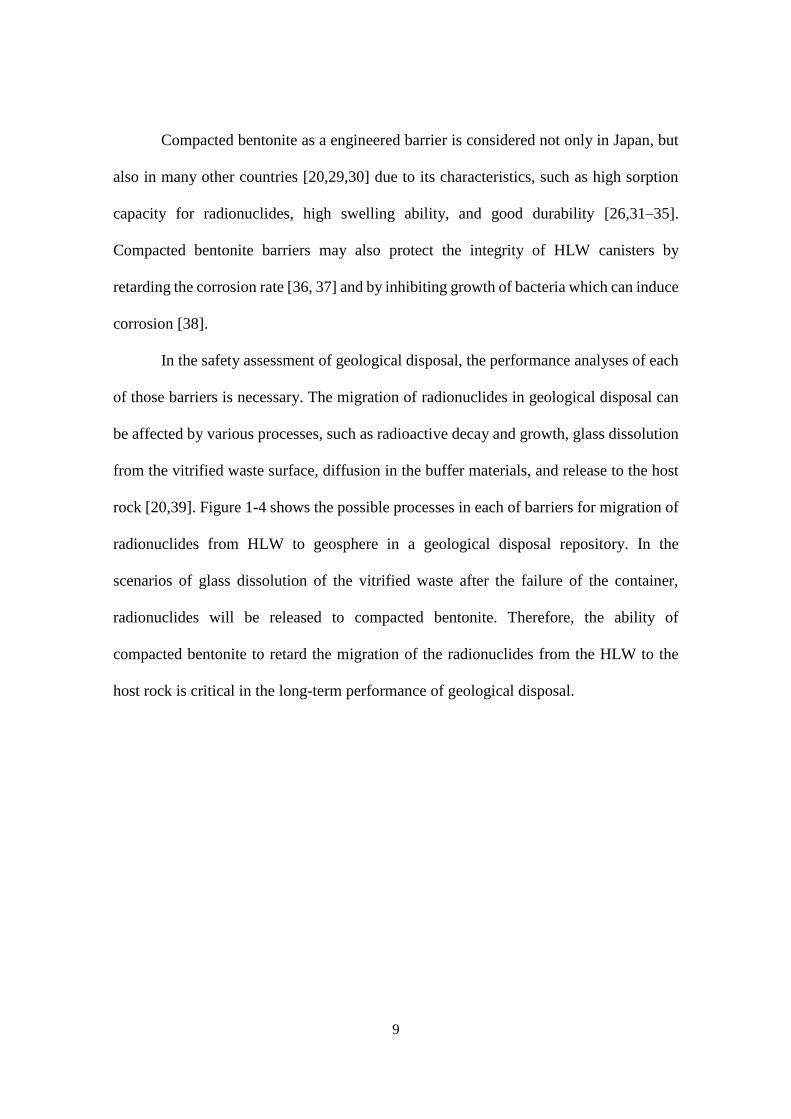
Compacted bentonite as a engineered barrier is considered not only in Japan, but
also in many other countries [20,29,30] due to its characteristics, such as high sorption
capacity for radionuclides, high swelling ability, and good durability [26,31–35].
Compacted bentonite barriers may also protect the integrity of HLW canisters by
retarding the corrosion rate [36, 37] and by inhibiting growth of bacteria which can induce
corrosion [38].
In the safety assessment of geological disposal, the performance analyses of each
of those barriers is necessary. The migration of radionuclides in geological disposal can
be affected by various processes, such as radioactive decay and growth, glass dissolution
from the vitrified waste surface, diffusion in the buffer materials, and release to the host
rock [20,39]. Figure 1-4 shows the possible processes in each of barriers for migration of
radionuclides from HLW to geosphere in a geological disposal repository. In the
scenarios of glass dissolution of the vitrified waste after the failure of the container,
radionuclides will be released to compacted bentonite. Therefore, the ability of
compacted bentonite to retard the migration of the radionuclides from the HLW to the
host rock is critical in the long-term performance of geological disposal.
10
Figure 1-4 Processes describing model for migration of radionuclides in geological
disposal [20].
1.3. Properties of bentonite
1.3.1. Crystal and micro- structure of bentonite
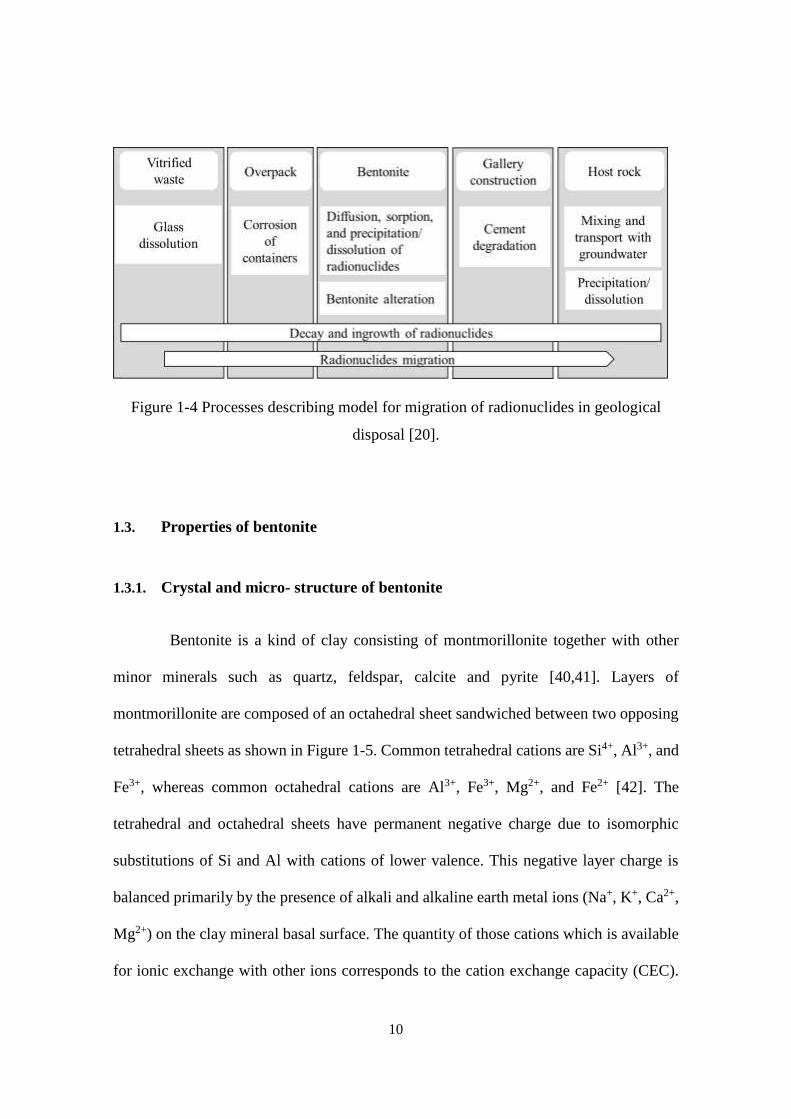
Bentonite is a kind of clay consisting of montmorillonite together with other
minor minerals such as quartz, feldspar, calcite and pyrite [40,41]. Layers of
montmorillonite are composed of an octahedral sheet sandwiched between two opposing
tetrahedral sheets as shown in Figure 1-5. Common tetrahedral cations are Si4+, Al3+, and
Fe3+, whereas common octahedral cations are Al3+, Fe3+, Mg2+, and Fe2+ [42]. The
tetrahedral and octahedral sheets have permanent negative charge due to isomorphic
substitutions of Si and Al with cations of lower valence. This negative layer charge is
balanced primarily by the presence of alkali and alkaline earth metal ions (Na+, K+, Ca2+,
Mg2+) on the clay mineral basal surface. The quantity of those cations which is available
for ionic exchange with other ions corresponds to the cation exchange capacity (CEC).
11
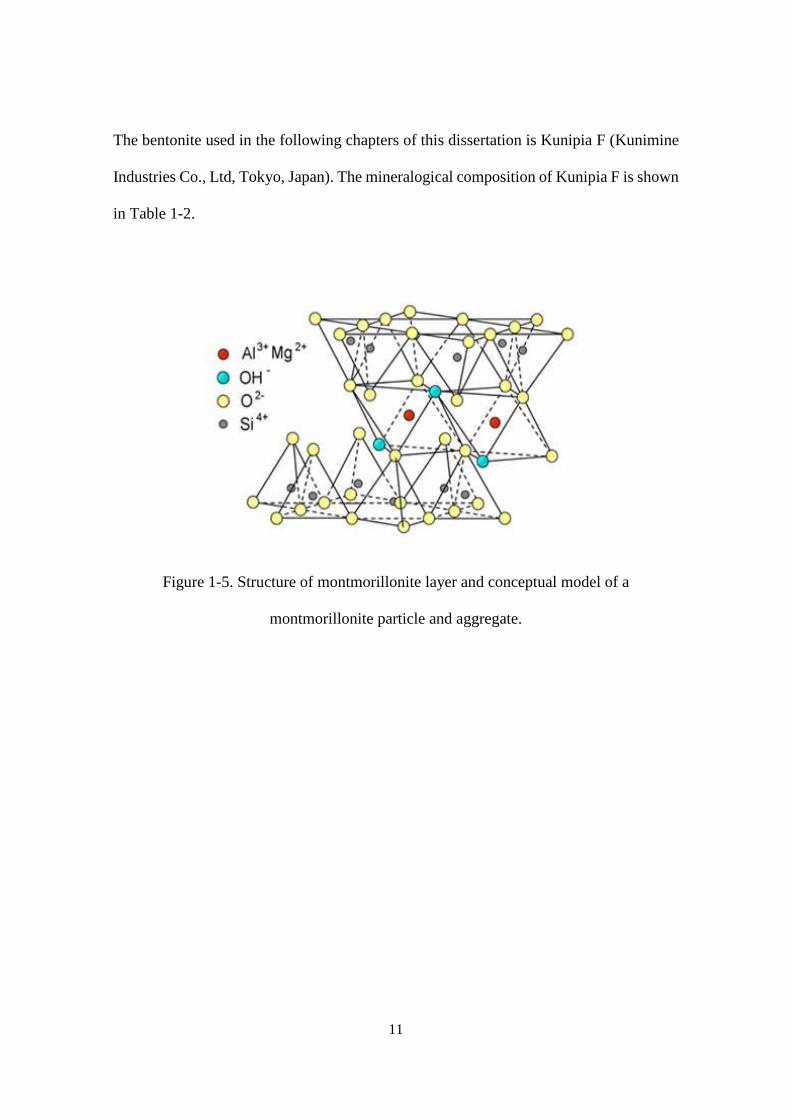
The bentonite used in the following chapters of this dissertation is Kunipia F (Kunimine
Industries Co., Ltd, Tokyo, Japan). The mineralogical composition of Kunipia F is shown
in Table 1-2.
Figure 1-5. Structure of montmorillonite layer and conceptual model of a
montmorillonite particle and aggregate.
12
Table 1-2. Mineralogical composition of Kunipia F [43]
Minerals Composition (% by weight)
SiO2 58.0
TiO2 0.2
Al2O3 21.9
Fe2O3 1.9
MnO 0.2
MgO 3.4
CaO 0.5
Na2O 3.0
K2O 0.1
H2O 10.8
Montmorillonite in bentonite stacks to form particles. Therefore, two types of
pore spaces conceptually exist: the spaces between internal surfaces of parallel
montmorillonite layers (interlayer spaces) and the spaces between external surfaces of
montmorillonite layers on different montmorillonite particles (interparticle spaces). The
total surface area of bentonite can be determined EGME measurement method while the
external surface area by BET method. Their respective values for Kunipia-F bentonite
were reported to be 750 and 45 m2/g, respectively [44]. The internal surface area of
bentonite was estimated by substracting the total with the external surface area for dry
powder of bentonite [45].
13
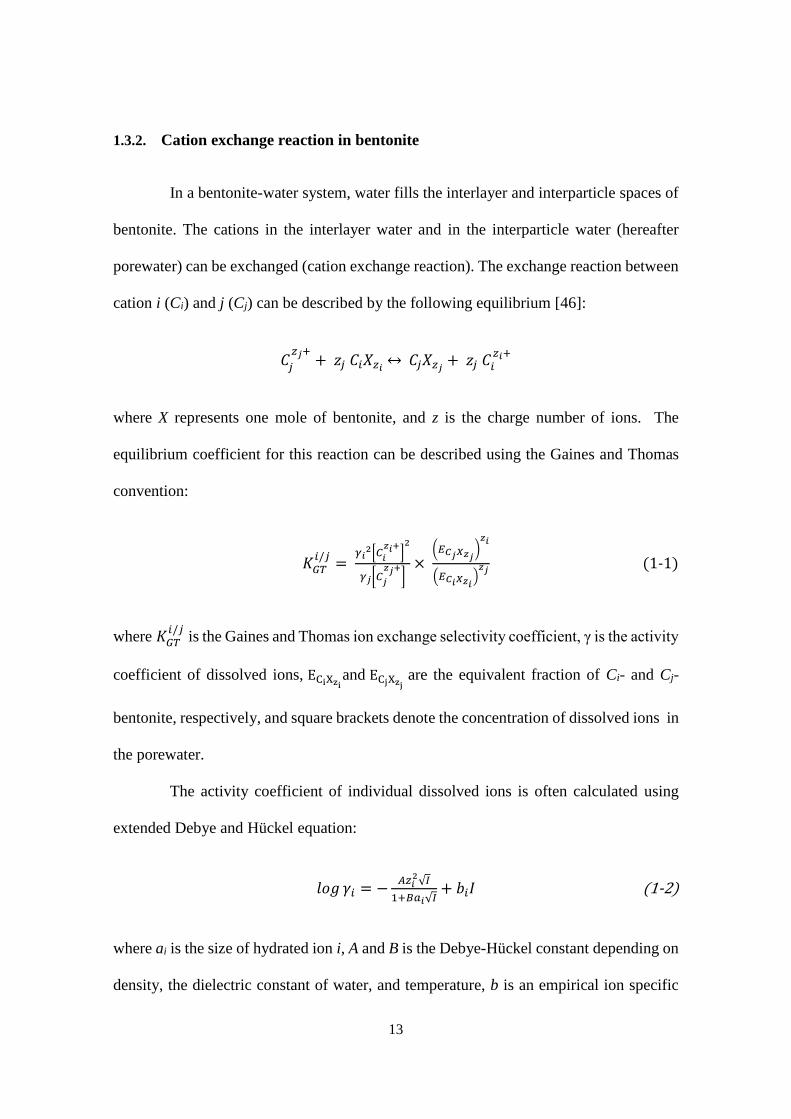
1.3.2. Cation exchange reaction in bentonite
In a bentonite-water system, water fills the interlayer and interparticle spaces of
bentonite. The cations in the interlayer water and in the interparticle water (hereafter
porewater) can be exchanged (cation exchange reaction). The exchange reaction between
cation i (Ci) and j (Cj) can be described by the following equilibrium [46]:
𝐶𝑗
𝑧𝑗+ + 𝑧𝑗 𝐶𝑖𝑋𝑧𝑖 ↔ 𝐶𝑗𝑋𝑧𝑗 + 𝑧𝑗 𝐶𝑖𝑧𝑖+
where X represents one mole of bentonite, and z is the charge number of ions. The
equilibrium coefficient for this reaction can be described using the Gaines and Thomas
convention:
𝐾𝐺𝑇𝑖/𝑗=
𝛾𝑖2[𝐶
𝑖
𝑧𝑖+]2
𝛾𝑗[𝐶𝑗
𝑧𝑗+]×
(𝐸𝐶𝑗𝑋𝑧𝑗)𝑧𝑖
(𝐸𝐶𝑖𝑋𝑧𝑖)𝑧𝑗
(1-1)
where 𝐾𝐺𝑇𝑖/𝑗
is the Gaines and Thomas ion exchange selectivity coefficient, γ is the activity
coefficient of dissolved ions, ECiXziand ECjXzj
are the equivalent fraction of Ci- and Cj-
bentonite, respectively, and square brackets denote the concentration of dissolved ions in
the porewater.
The activity coefficient of individual dissolved ions is often calculated using
extended Debye and Hückel equation:
𝑙𝑜𝑔 𝛾𝑖 = −𝐴𝑧𝑖2√𝐼
1+𝐵𝑎𝑖√𝐼+ 𝑏𝑖𝐼 (1-2)
where ai is the size of hydrated ion i, A and B is the Debye-Hückel constant depending on
density, the dielectric constant of water, and temperature, b is an empirical ion specific
14
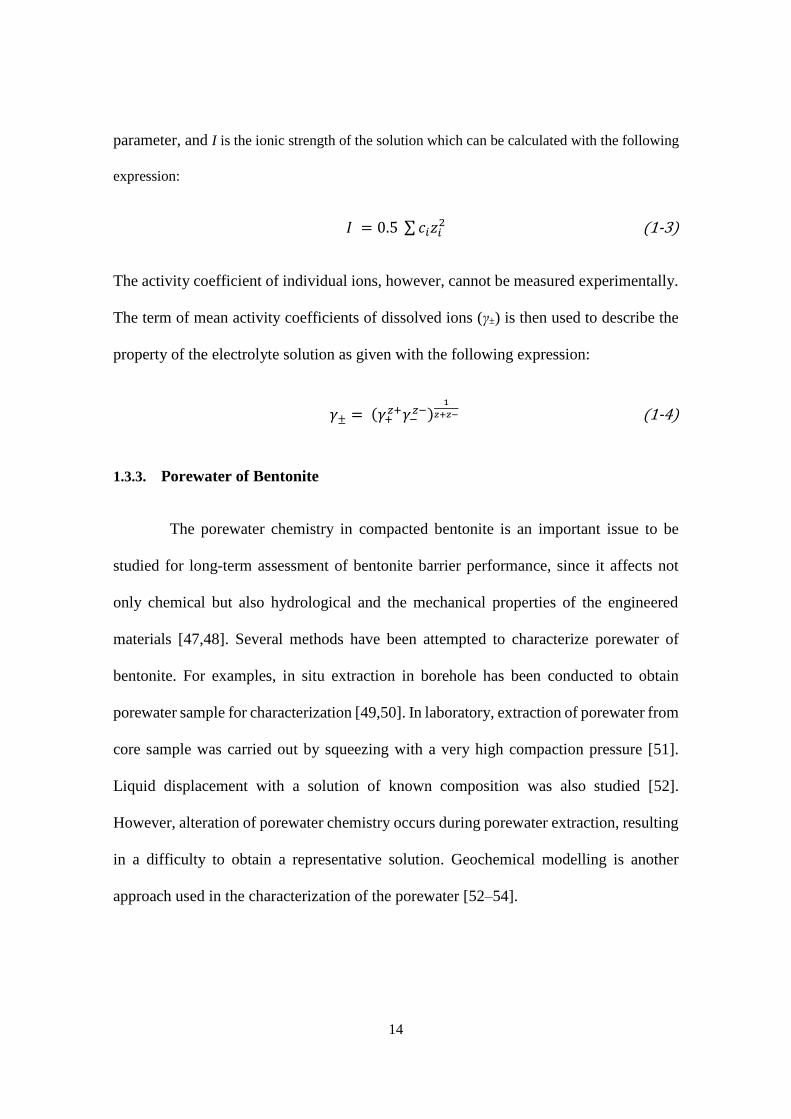
parameter, and I is the ionic strength of the solution which can be calculated with the following
expression:
𝐼 = 0.5 ∑ 𝑐𝑖𝑧𝑖2 (1-3)
The activity coefficient of individual ions, however, cannot be measured experimentally.
The term of mean activity coefficients of dissolved ions (γ±) is then used to describe the
property of the electrolyte solution as given with the following expression:
𝛾± = (𝛾+𝑧+𝛾−
𝑧−)1
𝑧+𝑧− (1-4)
1.3.3. Porewater of Bentonite
The porewater chemistry in compacted bentonite is an important issue to be
studied for long-term assessment of bentonite barrier performance, since it affects not
only chemical but also hydrological and the mechanical properties of the engineered
materials [47,48]. Several methods have been attempted to characterize porewater of
bentonite. For examples, in situ extraction in borehole has been conducted to obtain
porewater sample for characterization [49,50]. In laboratory, extraction of porewater from
core sample was carried out by squeezing with a very high compaction pressure [51].
Liquid displacement with a solution of known composition was also studied [52].
However, alteration of porewater chemistry occurs during porewater extraction, resulting
in a difficulty to obtain a representative solution. Geochemical modelling is another
approach used in the characterization of the porewater [52–54].
15
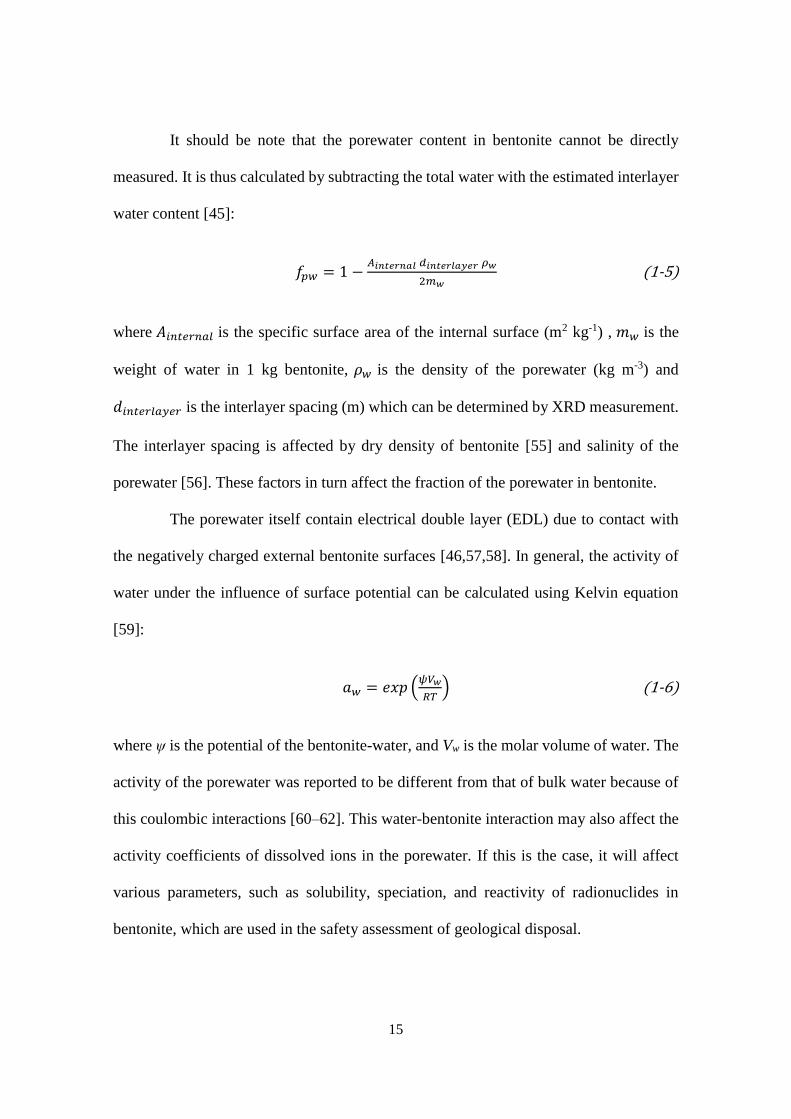
It should be note that the porewater content in bentonite cannot be directly
measured. It is thus calculated by subtracting the total water with the estimated interlayer
water content [45]:
𝑓𝑝𝑤 = 1 −𝐴𝑖𝑛𝑡𝑒𝑟𝑛𝑎𝑙 𝑑𝑖𝑛𝑡𝑒𝑟𝑙𝑎𝑦𝑒𝑟 𝜌𝑤
2𝑚𝑤 (1-5)
where 𝐴𝑖𝑛𝑡𝑒𝑟𝑛𝑎𝑙 is the specific surface area of the internal surface (m2 kg-1) , 𝑚𝑤 is the
weight of water in 1 kg bentonite, 𝜌𝑤 is the density of the porewater (kg m-3) and
𝑑𝑖𝑛𝑡𝑒𝑟𝑙𝑎𝑦𝑒𝑟 is the interlayer spacing (m) which can be determined by XRD measurement.
The interlayer spacing is affected by dry density of bentonite [55] and salinity of the
porewater [56]. These factors in turn affect the fraction of the porewater in bentonite.
The porewater itself contain electrical double layer (EDL) due to contact with
the negatively charged external bentonite surfaces [46,57,58]. In general, the activity of
water under the influence of surface potential can be calculated using Kelvin equation
[59]:
𝑎𝑤 = 𝑒𝑥𝑝 (𝜓𝑉𝑤
𝑅𝑇) (1-6)
where ψ is the potential of the bentonite-water, and Vw is the molar volume of water. The
activity of the porewater was reported to be different from that of bulk water because of
this coulombic interactions [60–62]. This water-bentonite interaction may also affect the
activity coefficients of dissolved ions in the porewater. If this is the case, it will affect
various parameters, such as solubility, speciation, and reactivity of radionuclides in
bentonite, which are used in the safety assessment of geological disposal.
16
1.3.4. Hydraulic conductivity of water and diffusivities of radionuclides in
bentonite
One of the most important properties of bentonite as the engineered barrier is its
very low hydraulic conductivity. The requirement for hydraulic conductivity of backfill
materials in geological disposal is smaller than 4.5 × 10⁻¹³ m/s [63]. At such low hydraulic
conductivity, mass transport by advection can be negligibly small and diffusion becomes
the dominant process for migration of radionuclides [34,64,65]. Therefore, understanding
diffusion processes in bentonite is essential to evaluate bentonite performance in isolating
the radioactive waste from geosphere.
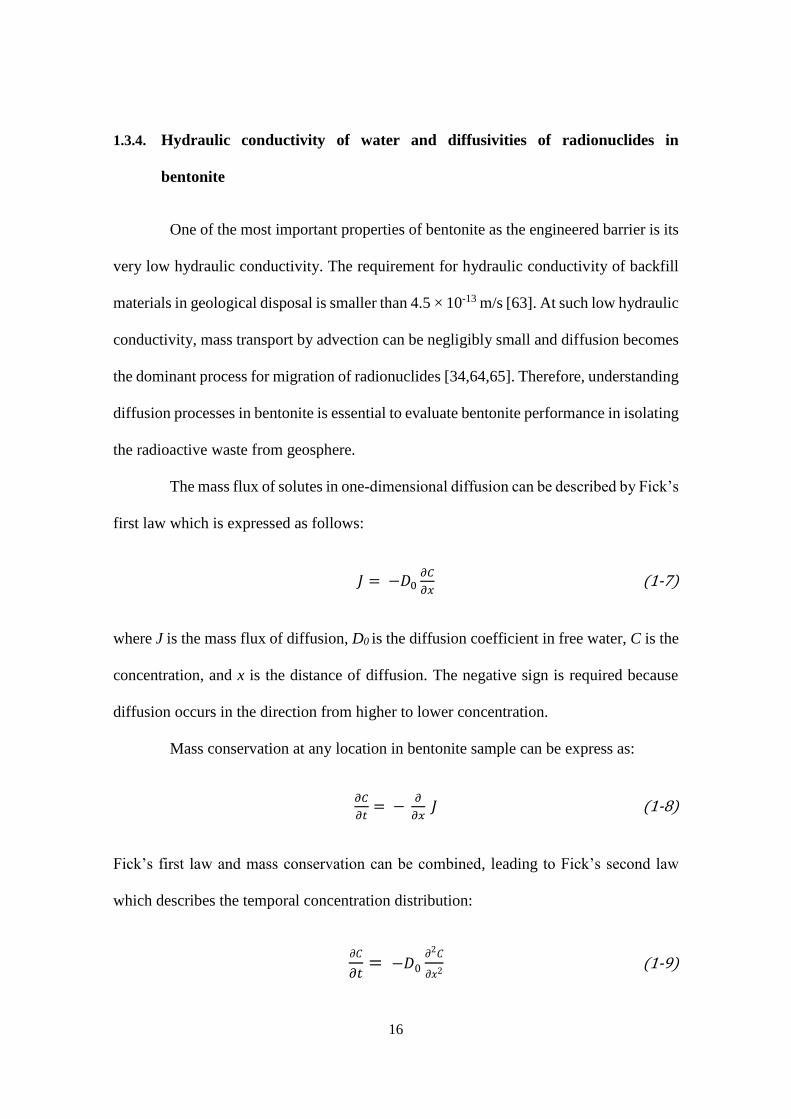
The mass flux of solutes in one-dimensional diffusion can be described by Fick’s
first law which is expressed as follows:
𝐽 = −𝐷0𝜕𝐶
𝜕𝑥 (1-7)
where J is the mass flux of diffusion, D0 is the diffusion coefficient in free water, C is the
concentration, and x is the distance of diffusion. The negative sign is required because
diffusion occurs in the direction from higher to lower concentration.
Mass conservation at any location in bentonite sample can be express as:
𝜕𝐶
𝜕𝑡= −
𝜕
𝜕𝑥 𝐽 (1-8)
Fick’s first law and mass conservation can be combined, leading to Fick’s second law
which describes the temporal concentration distribution:
𝜕𝐶
𝜕𝑡= −𝐷0
𝜕2𝐶
𝜕𝑥2 (1-9)
17
A lot of experimental data of diffusion coefficients of water, cations, and anions
in different types of bentonite have been reported. The data suggests that anions are
considered as key radionuclides in the safety assessment of geological disposal [48,66].,
since diffusivities of anions are higher than that of cations [67]. Experimental data on
anions diffusion in bentonite, such as Cl- [45,68–70], I- [71–74], SO42- [75,76], and SeO3
2-
ions [77], show that their diffusion coefficients decreased as the dry density of bentonite
increased. On the other hand, their diffusion coefficients increased as a function of salinity
which was attributed to the increase of porosity that is accessible for anions [70,78], but
the total porosity stayed constant [78,79].
Due to the microstructure of compacted bentonite, three diffusion pathways in
bentonite may be available for radionuclides: the porewater, the external surface of
bentonite or the EDL, and the interlayer. Cations and neutral chemical species can diffuse
through all of those pathways [80–82], whereas anions can only diffuse through the
former two pathways because they are completely restricted in the interlayer spaces by
the negatively charge of bentonite layers [83,84]. However, the diffusion mechanisms are
still not clearly understood because they are influenced by physical and chemical states
of bentonite, such as the existence of electrical double layer (EDL) from the negatively
charged bentonite surface, the type of exchangeable cations, microstructure, and the
porewater chemistry [26,56,85,86].
18
1.4. Long-term durability of bentonite in geological disposal
1.4.1. Alteration due to waste form and cementitious materials
Prediction of the long-term durability of bentonite is important for the safety
assessment of geological disposal [48,52]. In a geological disposal facility, alteration of
bentonite due to contacts with surrounding environment is inevitable. In addition,
bentonite may be altered by gamma radiation and thermal loading from HLW, and
corrosion products of waste canisters. Radiation from HLW is expected to have minor
effect because of adequate radiation shielding provided by waste canisters. Although heat
transferred from the waste form may affect density, water content and mineral
composition of bentonite, this thermal loading was reported to have no negative effects
on favorable bentonite properties [87]. Anaerobic corrosion of iron-based canisters will
generate Fe2+ ions and H2 gas, which can be accelerated in the presence of sulfate reducing
bacteria. The Fe2+ ions will be deposited into bentonite which eventually can convert
bentonite to non-swelling silicates [88,89]. The alteration of bentonite by Fe2+ ions may
also increase the hydraulic conductivity [37,90]. The breakthrough of H2 gas generated
from corrosion can make pathways for migration, resulting in enhancement of
radionuclide transport in bentonite.
Another potential alteration is induced by the interaction between bentonite and
cementitious materials. Degradation of cement generates alkali leachate rich in K+, Na+,
and Ca2+ ions [91]. Chemical reaction between this leachate and bentonite will occur,
resulting in the mineralogical changes of bentonite over time. Alteration of bentonite
begins with ion exchange processes which means conversion of Na-bentonite to Ca- and
19
K-bentonite. The alteration process eventually end up with complete transformation of
bentonite to secondary mineral like zeolite and calcium silicate hydrate [92,93].
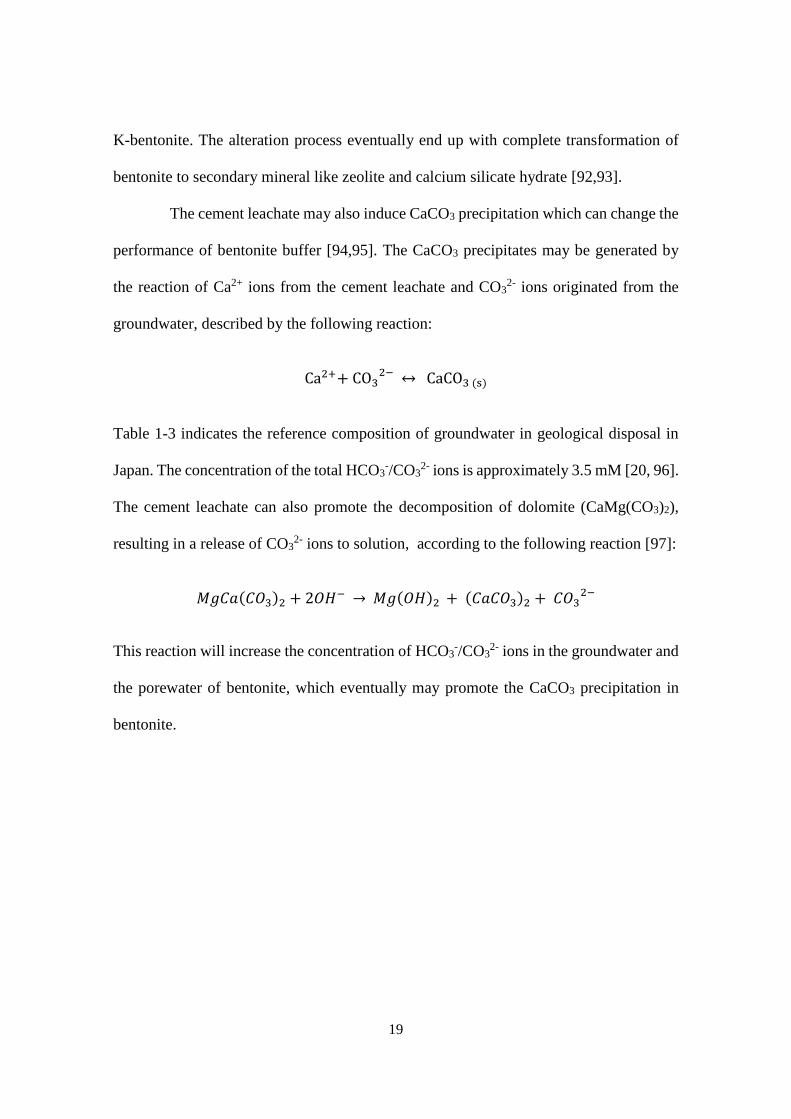
The cement leachate may also induce CaCO3 precipitation which can change the
performance of bentonite buffer [94,95]. The CaCO3 precipitates may be generated by
the reaction of Ca2+ ions from the cement leachate and CO32- ions originated from the
groundwater, described by the following reaction:
Ca2++ CO32− ↔ CaCO3 (s)
Table 1-3 indicates the reference composition of groundwater in geological disposal in
Japan. The concentration of the total HCO3-/CO3
2- ions is approximately 3.5 mM [20, 96].
The cement leachate can also promote the decomposition of dolomite (CaMg(CO3)2),
resulting in a release of CO32- ions to solution, according to the following reaction [97]:
𝑀𝑔𝐶𝑎(𝐶𝑂3)2 + 2𝑂𝐻− → 𝑀𝑔(𝑂𝐻)2 + (𝐶𝑎𝐶𝑂3)2 + 𝐶𝑂3
2−
This reaction will increase the concentration of HCO3-/CO3
2- ions in the groundwater and
the porewater of bentonite, which eventually may promote the CaCO3 precipitation in
bentonite.
20
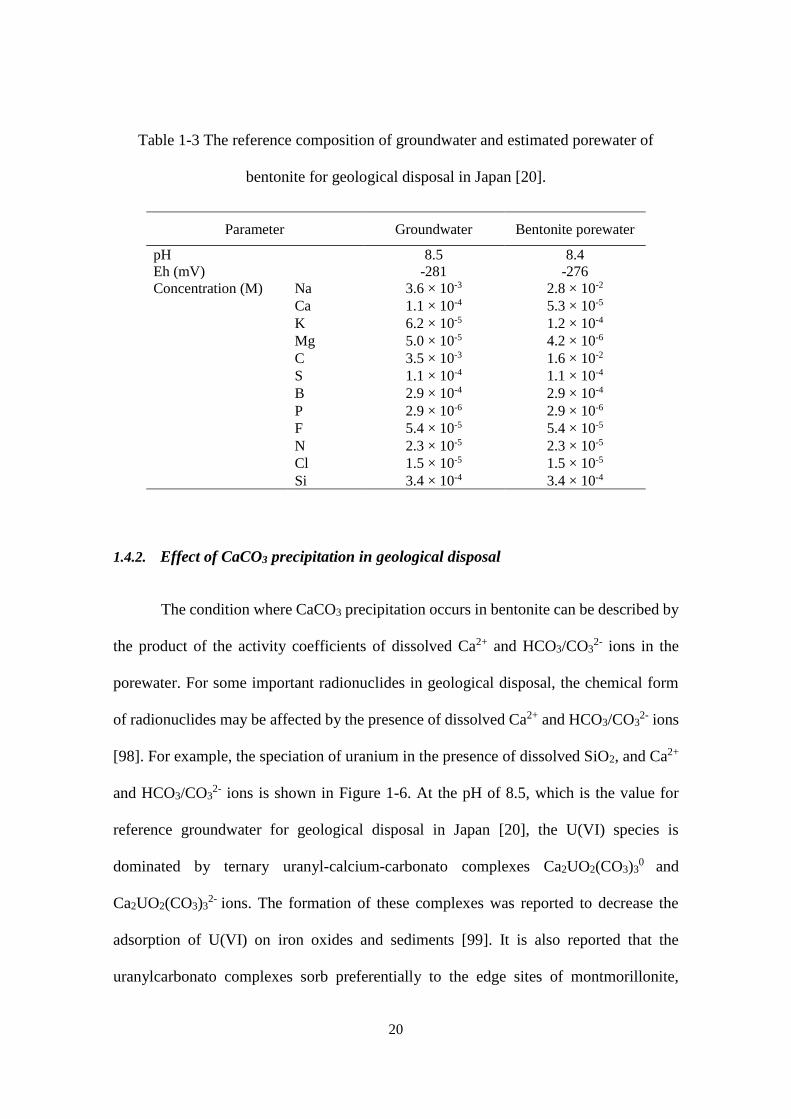
Table 1-3 The reference composition of groundwater and estimated porewater of
bentonite for geological disposal in Japan [20].
Parameter Groundwater Bentonite porewater
pH
Eh (mV)
8.5 8.4
-281 -276
Concentration (M) Na 3.6 × 10⁻³ 2.8 × 10⁻²
Ca 1.1 × 10⁻⁴ 5.3 × 10⁻⁵
K 6.2 × 10⁻⁵ 1.2 × 10⁻⁴
Mg 5.0 × 10⁻⁵ 4.2 × 10⁻⁶
C 3.5 × 10⁻³ 1.6 × 10⁻²
S 1.1 × 10⁻⁴ 1.1 × 10⁻⁴
B 2.9 × 10⁻⁴ 2.9 × 10⁻⁴
P 2.9 × 10⁻⁶ 2.9 × 10⁻⁶
F 5.4 × 10⁻⁵ 5.4 × 10⁻⁵
N 2.3 × 10⁻⁵ 2.3 × 10⁻⁵
Cl 1.5 × 10⁻⁵ 1.5 × 10⁻⁵
Si 3.4 × 10⁻⁴ 3.4 × 10⁻⁴
1.4.2. Effect of CaCO3 precipitation in geological disposal
The condition where CaCO3 precipitation occurs in bentonite can be described by
the product of the activity coefficients of dissolved Ca2+ and HCO3/CO32- ions in the
porewater. For some important radionuclides in geological disposal, the chemical form
of radionuclides may be affected by the presence of dissolved Ca2+ and HCO3/CO32- ions
[98]. For example, the speciation of uranium in the presence of dissolved SiO2, and Ca2+
and HCO3/CO32- ions is shown in Figure 1-6. At the pH of 8.5, which is the value for
reference groundwater for geological disposal in Japan [20], the U(VI) species is
dominated by ternary uranyl-calcium-carbonato complexes Ca2UO2(CO3)30
and
Ca2UO2(CO3)32-
ions. The formation of these complexes was reported to decrease the
adsorption of U(VI) on iron oxides and sediments [99]. It is also reported that the
uranylcarbonato complexes sorb preferentially to the edge sites of montmorillonite,
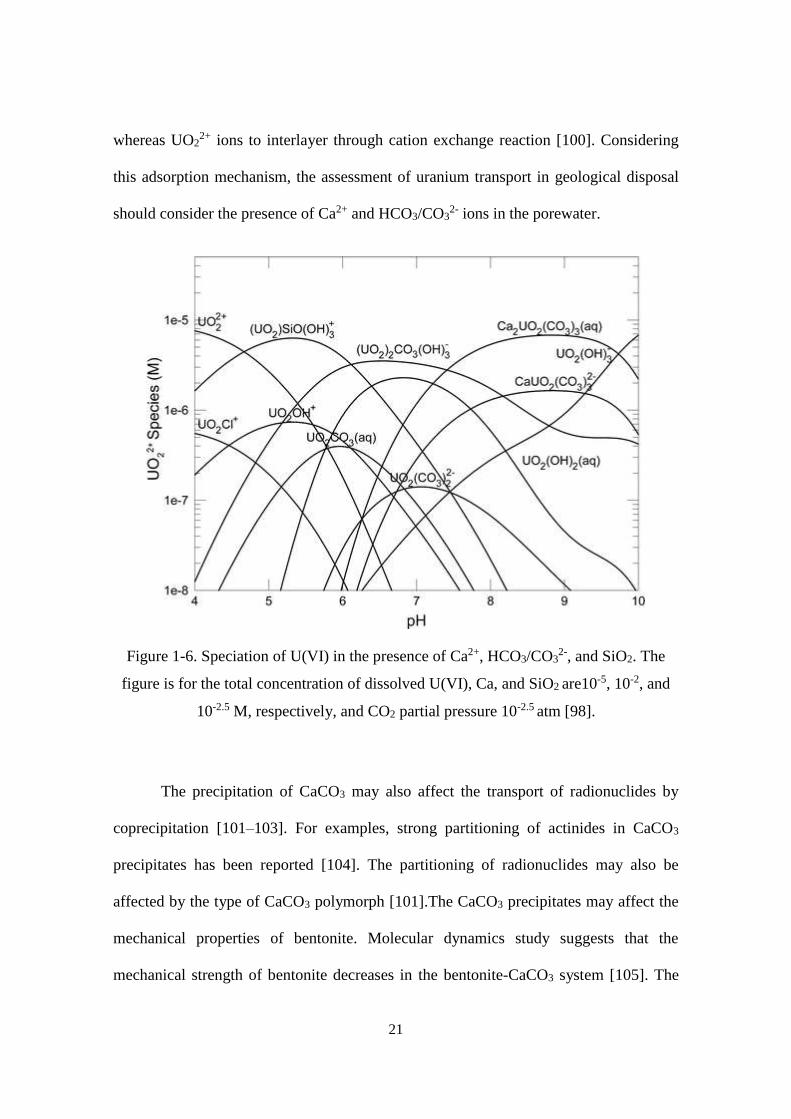
21
whereas UO22+ ions to interlayer through cation exchange reaction [100]. Considering
this adsorption mechanism, the assessment of uranium transport in geological disposal
should consider the presence of Ca2+ and HCO3/CO32- ions in the porewater.
Figure 1-6. Speciation of U(VI) in the presence of Ca2+, HCO3/CO32-, and SiO2. The
figure is for the total concentration of dissolved U(VI), Ca, and SiO2 are10-5, 10-2, and
10-2.5 M, respectively, and CO2 partial pressure 10-2.5 atm [98].
The precipitation of CaCO3 may also affect the transport of radionuclides by
coprecipitation [101–103]. For examples, strong partitioning of actinides in CaCO3
precipitates has been reported [104]. The partitioning of radionuclides may also be
affected by the type of CaCO3 polymorph [101].The CaCO3 precipitates may affect the
mechanical properties of bentonite. Molecular dynamics study suggests that the
mechanical strength of bentonite decreases in the bentonite-CaCO3 system [105]. The
22
formation of CaCO3 precipitates in bentonite may also affect the transport of
radionuclides by porosity clogging. Study on the precipitation of CaCO3 in quartz sand
revealed that only 5% amount of precipitates was enough to create impermeable layer
[106]. Considering large amount of CaCO3 precipitates are predicted to form in
compacted bentonite and their importance in affecting the transport of radionuclides,
understanding the CaCO3 precipitation phenomena in bentonite is an important issue to
be studied for the long-term performance assessment of geological disposal of HLW.
1.5. Calcium carbonate precipitation
1.5.1. Dissolved carbonate equilibria
It is important to note that dissolved carbonate exists as four different chemical
species: CO2, H2CO3, HCO3-, and CO3
2-, the distribution of which depends on pH. The
equilibrium of dissolved carbonate can be written as:
𝐻2𝐶𝑂3 𝐾𝑎1↔ 𝐻++ 𝐻𝐶𝑂3
− 𝐾𝑎2↔ 2 𝐻++ 𝐶𝑂3
2−
The equilibrium shows that two protons are stepwisely released from dissociation of
H2CO3, of which the dissociation constants are given by 𝐾𝑎1 = 2.5 × 10⁻⁴ and 𝐾𝑎2 =
4.6 × 10⁻⁷ [107–109]. The activity of each carbonate species can be calculated by
solving the equilibrium equation:
[𝐻2𝐶𝑂3] = [𝐻+]2
[𝐻+]2+ [𝐻+]𝐾𝑎1+𝐾𝑎1𝐾𝑎2 (1-10)
[𝐻𝐶𝑂3−] =
[𝐻+]𝐾𝑎1
[𝐻+]2+ [𝐻+]𝐾𝑎1+𝐾𝑎1𝐾𝑎2 (1-11)
23
[𝐶𝑂32−] =
𝐾𝑎1𝐾𝑎2
[𝐻+]2+ [𝐻+]𝐾𝑎1+𝐾𝑎1𝐾𝑎2 (1-12)
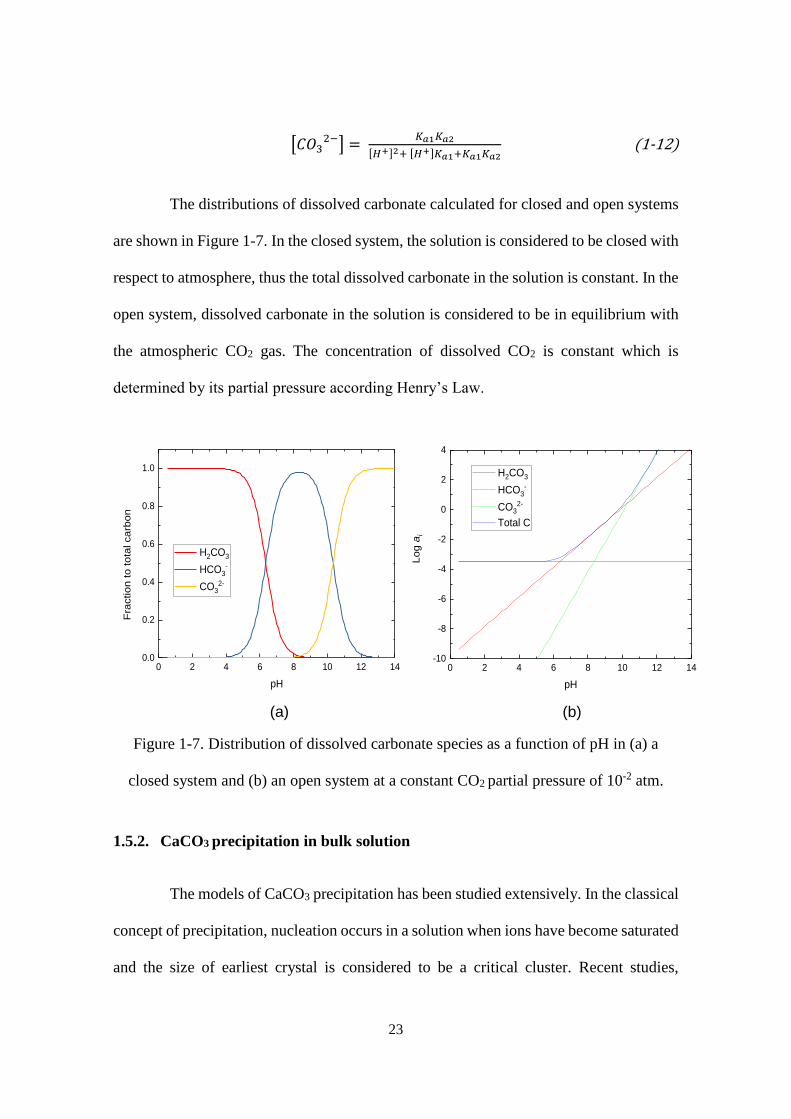
The distributions of dissolved carbonate calculated for closed and open systems
are shown in Figure 1-7. In the closed system, the solution is considered to be closed with
respect to atmosphere, thus the total dissolved carbonate in the solution is constant. In the
open system, dissolved carbonate in the solution is considered to be in equilibrium with
the atmospheric CO2 gas. The concentration of dissolved CO2 is constant which is
determined by its partial pressure according Henry’s Law.
Figure 1-7. Distribution of dissolved carbonate species as a function of pH in (a) a
closed system and (b) an open system at a constant CO2 partial pressure of 10-2 atm.
1.5.2. CaCO3 precipitation in bulk solution
The models of CaCO3 precipitation has been studied extensively. In the classical
concept of precipitation, nucleation occurs in a solution when ions have become saturated
and the size of earliest crystal is considered to be a critical cluster. Recent studies,
(b)(a)
0 2 4 6 8 10 12 140.0
0.2
0.4
0.6
0.8
1.0
Fra
ction to tota
l carb
on
pH
H2CO3
HCO3-
CO32-
0 2 4 6 8 10 12 14-10
-8
-6
-4
-2
0
2
4
Log a
i
pH
H2CO3
HCO3-
CO32-
Total C
24
however, suggests that CaCO3 precipitation is non-classical; stable prenucleation clusters
of CaCO3 are formed and act as precursors for precipitation [110,111]. Furthermore, in
situ TEM study revealed that the formation of CaCO3 precipitates occurs through multiple
pathways, starting from amorphous then transforming into crystalline phase [112].
There are six types of polymorphs for CaCO3 in nature; three are anhydrous and
the other three are hydrous states. The anhydrous polymorphs are calcite, aragonite, and
vaterite, while the hydrous polymorphs are monohydrocalcite (CaCO3·H2O), ikaite
(CaCO3·6H2O) and amorphous CaCO3. Of these CaCO3 polymorphs, calcite (hexagonal
crystal) and aragonite (orthorhombic) are dominant in nature, whereas others are less
stable and easily transform into calcite or aragonite in a solution at ambient conditions.
This is because the radius of Ca2+ ion is 0.98 Å which is close to the limiting value of
rhombohedral (<0.99 Å) and orthorhombic (>0.99 Å). Vaterite is the least stable
unhydrated polymorph which occur under a specific condition and subsequently
transform to calcite or aragonite. All the hydrated CaCO3 polymorphs are unstable
towards the conversion to calcite or aragonite.
The solubility of CaCO3 is represented by its solubility product constant values
(Ksp), which is the equilibrium constant between dissolved ions and the solid phase in an
aqueous solution. The Ksp of CaCO3 precipitates can be written as:
𝐾𝑠𝑝 CaCO3 = 𝑎𝐶𝑎2+ 𝑎𝐶𝑂32− (1-13)
Saturation index (log Ω) is often used to express whether the solution is undersaturated,
at equilibrium, or supersaturated with respect to CaCO3 precipitates.
𝛺CaCO3 =𝑎𝐶𝑎2+
𝑎𝐶𝑂3
2−
𝐾𝑠𝑝 CaCO3 (1-14)
25
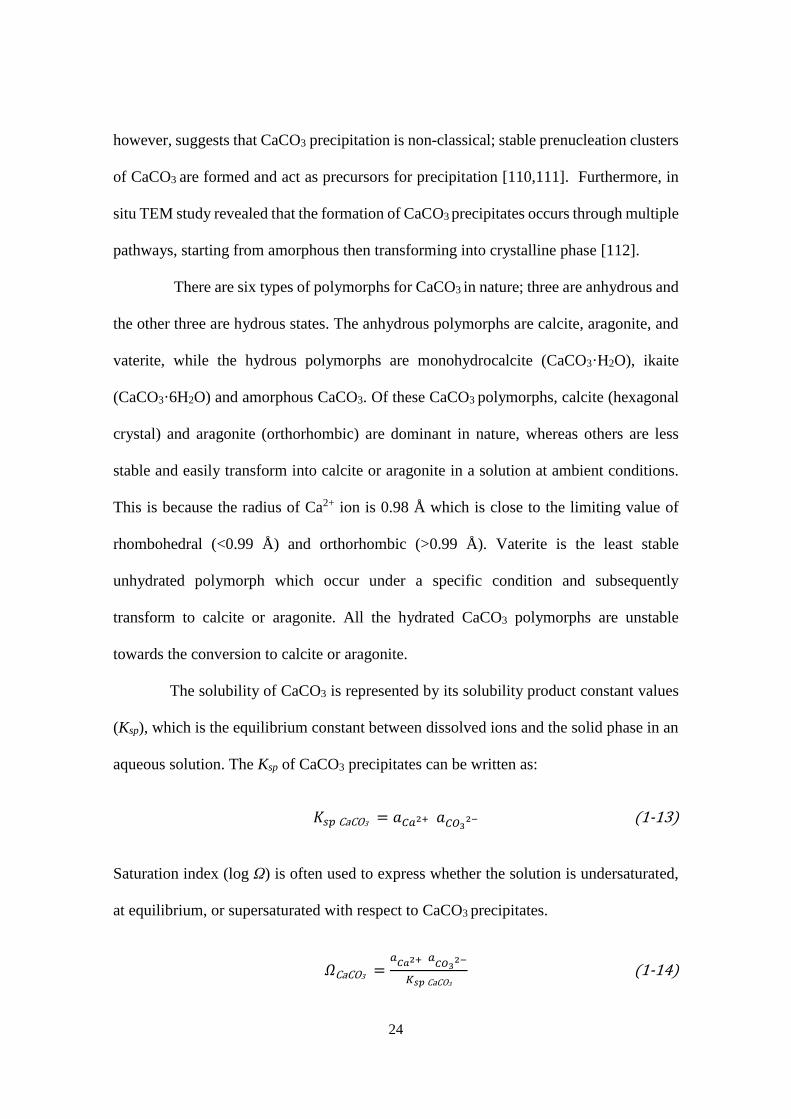
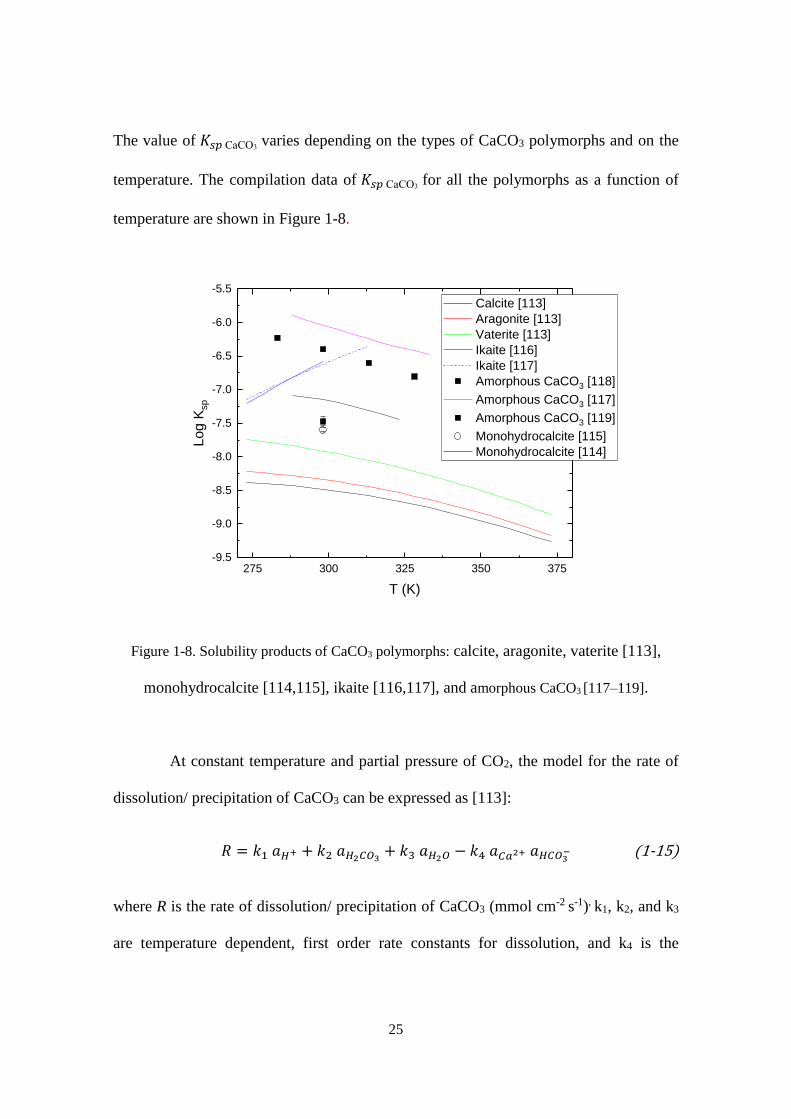
The value of 𝐾𝑠𝑝 CaCO3 varies depending on the types of CaCO3 polymorphs and on the
temperature. The compilation data of 𝐾𝑠𝑝 CaCO3 for all the polymorphs as a function of
temperature are shown in Figure 1-8.
275 300 325 350 375-9.5
-9.0
-8.5
-8.0
-7.5
-7.0
-6.5
-6.0
-5.5
Calcite [113]
Aragonite [113]
Vaterite [113]
Ikaite [116]
Ikaite [117]
Amorphous CaCO3 [118]
Amorphous CaCO3 [117]
Amorphous CaCO3 [119]
Monohydrocalcite [115]
Monohydrocalcite [114]
Log
Ksp
T (K)
Figure 1-8. Solubility products of CaCO3 polymorphs: calcite, aragonite, vaterite [113],
monohydrocalcite [114,115], ikaite [116,117], and amorphous CaCO3 [117–119].
At constant temperature and partial pressure of CO2, the model for the rate of
dissolution/ precipitation of CaCO3 can be expressed as [113]:
𝑅 = 𝑘1 𝑎𝐻+ + 𝑘2 𝑎𝐻2𝐶𝑂3 + 𝑘3 𝑎𝐻2𝑂 − 𝑘4 𝑎𝐶𝑎2+ 𝑎𝐻𝐶𝑂3− (1-15)
where R is the rate of dissolution/ precipitation of CaCO3 (mmol cm-2 s-1), k1, k2, and k3
are temperature dependent, first order rate constants for dissolution, and k4 is the
26
precipitation rate constant as the solution approaches saturation with respect to calcite.
The expression of k1, k2, k3, and k4 are as follows:
𝑙𝑜𝑔 𝑘1 = 0.198 − 444 𝑇⁄ (1-16)
𝑙𝑜𝑔 𝑘2 = 2.84 − 2177 𝑇⁄ (1-17)
𝑙𝑜𝑔 𝑘3 = −5.86 − 317 𝑇 ⁄ (𝑇 < 298.15 𝐾) (1-18)
𝑙𝑜𝑔 𝑘3 = 1.10 − 1737 𝑇⁄ (𝑇 > 298.15 𝐾) (1-19)
𝑙𝑜𝑔 𝑘4 = −7.5 + 0.016 𝑇 − 0.64 𝑙𝑜𝑔 𝑃𝐶𝑂2 (𝑃𝐶𝑂2 < 10−1.5 𝑏𝑎𝑟𝑠) (1-20)
1.5.3. CaCO3 precipitation in bentonite
Precipitation of minerals in porous media is important for the safety assessment
of geological disposal of HLW because it may affect the porosity, permeability and
particle size distributions [120–122]. The pore-scale CaCO3 precipitation is a major
interest because of its importance in the context of geological disposal as well as geologic
carbon sequestration, permeable reactive barriers and contaminant host phase in
environmental remediation. The processes are regarded very complex because it is
affected by multiple factors, such as mineral reactivity, pore size, surface charges, and
transport [123,124]. In natural systems, the heterogeneous nucleation for CaCO3
precipitation is likely to be more favorable than homogenous nucleation. This is because
the critical radius and the interfacial energy governing heterogeneous nucleation are
significantly lower than those of homogenous nucleation [125,126]. This nucleation
processes may also influence the transport of aqueous chemical species [127].
27
Precipitation of CaCO3 in porous media has been studied for well mixed,
homogenous and non-reactive systems. Even in the idealized systems, there are many
factors affecting the CaCO3 precipitation processes. For examples, the small pore effect
can make the solubility of minerals higher than that in bulk solution [128,129]. Similarly,
study on CaCO3 precipitation in glass beads revealed that it preferentially occurs in larger
pores [130]. The study on CaCO3 precipitation in gelatin gel suggested that porosity can
change the characteristics of CaCO3 precipitates. Smaller porosity leads to the formation
of smaller CaCO3 crystal sizes with more complex morphology, which tend to develop
as aggregates rather than a single crystal [131]. The study on CaCO3 precipitation in
polyacrylamide gel by diffusion mixing suggested that slower rate of CaCO3 precipitation
is needed to match the simulation of precipitation width with the experimental result
[132].
Surface charge affects the composition of solution near the surface. The
concentration profile of cations (C+) and anions (C-) as a function of distance from
charged surface can be described with the following expressions:
𝐶+ = 𝐶 ∞ 𝑒𝑥𝑝 (−𝑧𝐹𝜓
𝑅𝑇) (1-21)
𝐶− = 𝐶 ∞ 𝑒𝑥𝑝 (𝑧𝐹𝜓
𝑅𝑇) (1-22)
where 𝐶 ∞ is the concentration in bulk solution, z is charge of the ion, F is the Faraday
constant (96,485 C/mol), R is the ideal gas constant (8.314 J/mol/K). It has been reported
that the CaCO3 precipitation is affected by the ratio of Ca2+ and CO32- ions in the solution
[133]; high ratio of Ca2+ to CO32- ions may suppress the CaCO3 precipitation [134]. This
28
seems to agree with a finding that precipitation of CaCO3 is inhibited in the small pore of
glass beads [123].
There can be similar pore size effect on CaCO3 precipitation in compacted
bentonite. The reaction rate of CaCO3 precipitation may be different than those in bulk
water because the transport in bentonite is very slow. It has been reported that the reaction
rate in diffusion-limited conditions may be different from the rate in bulk solution
[132,135]. Furthermore, complete mixing in porous media may not occur, resulting in the
overestimation of precipitation product in the reactive transport model [136]. The
heterogeneous composition of ions in the porewater due to the negative charge of
bentonite surface may also influence the CaCO3 precipitation. Another factor which may
affect the CaCO3 precipitation in compacted bentonite is the competition between solid
formation and cation exchange reaction [137]. The observation of CaCO3 precipitates in
bentonite is more difficult than the above mentioned simple systems, such as column
filled with glass beads. Therefore, no data has been reported about the study of CaCO3
precipitation in compacted bentonite. Considering its importance in long-term assessment
of geological disposal, the study on CaCO3 precipitation in bentonite is essential.
1.6. Objective and experimental approach
1.6.1. Objective
The objective of this thesis is to improve the understanding of the fate and
transport of radionuclides in compacted bentonite. This thesis can contribute to the safety
assessment of the geological disposal of HLW. This thesis is composed of three aspects
regarding to the fate and transport of radionuclides in bentonite; the porewater chemistry,
29
the precipitation processes, and the diffusion mechanism of ions in bentonite. This study
was carried out by the following approaches:
1. Develop a sequential extraction method as a practical method to distinguish
dissolved ions and precipitates species in compacted bentonite.
2. Determine the activity coefficients of dissolved ions in the porewater of
compacted bentonite during CaCO3 precipitation processes. The values of activity
coefficients of reacting ions were compared with those of ions in bulk solution.
3. Observe the transport of ions in compacted bentonite during the precipitation of
CaCO3. Effects of precipitation on the transport of ions in bentonite are discussed.
4. Determine the Da and Ea values for diffusion of 35SO42- ions in compacted
bentonite as a function of dry density and NaCl concentration. Diffusion
mechanism for anions in compacted bentonite is discussed from the viewpoints of
dry density and salinity.
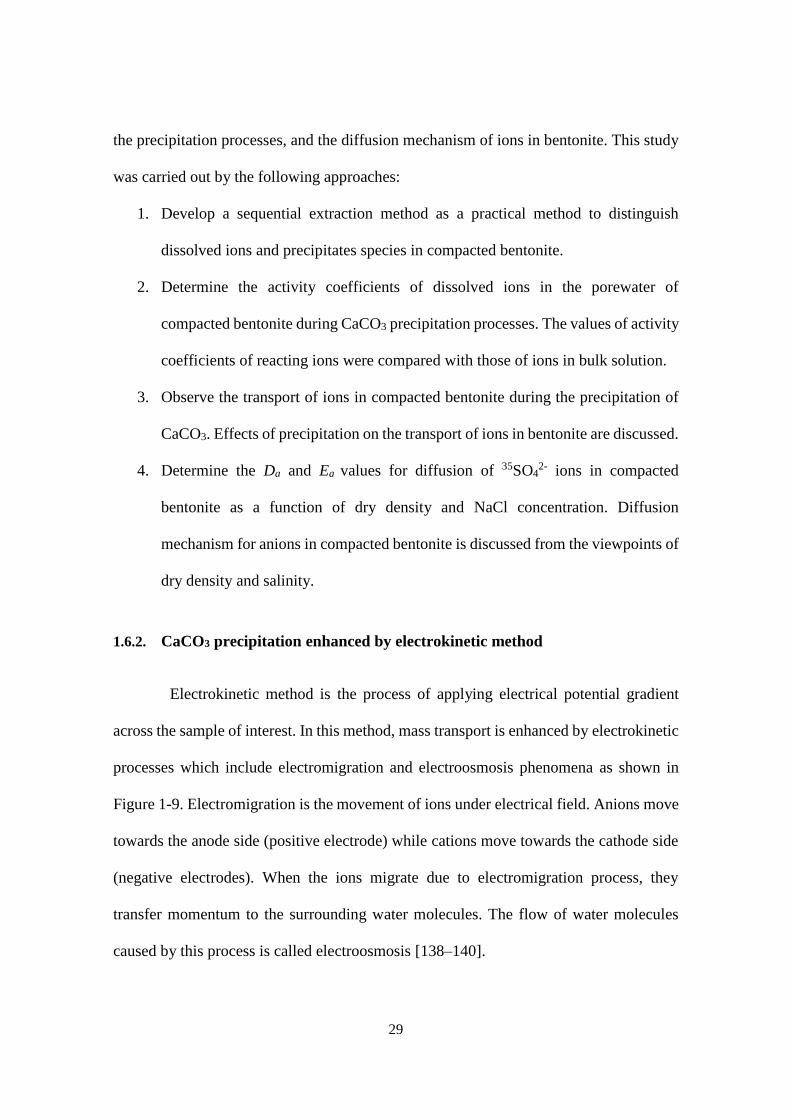
1.6.2. CaCO3 precipitation enhanced by electrokinetic method
Electrokinetic method is the process of applying electrical potential gradient
across the sample of interest. In this method, mass transport is enhanced by electrokinetic
processes which include electromigration and electroosmosis phenomena as shown in
Figure 1-9. Electromigration is the movement of ions under electrical field. Anions move
towards the anode side (positive electrode) while cations move towards the cathode side
(negative electrodes). When the ions migrate due to electromigration process, they
transfer momentum to the surrounding water molecules. The flow of water molecules
caused by this process is called electroosmosis [138–140].
30
Figure 1-9 Schematic of the main phenomena during electrokinetic process [141,142].
Under electrical gradient, the mobility of neutral ions is influenced only by
electroosmosis. On the other hand, the mobility of charged ions is affected by both of
electromigration and electroosmosis. The apparent mobility of individual ions (𝜇𝑎𝑖 ) can
thus be expressed as the sum of their electromigration mobility (μemi ) and electroosmosis
flow (μEOFi ):
𝜇𝑎𝑖 = 𝜇𝑒𝑚
𝑖 + 𝜇𝐸𝑂𝐹𝑖 (1-23)
The equation implies that the anions can move from anode to cathode regardless of their
negative charge when the electroosmotic flow is higher than electromigration.
The electromigration may cause reduction-oxidation reaction as well. When
electrical field is applied, electrolysis of water occurs at the electrodes. The reaction
generates oxygen gas and hydrogen ions due to oxidation at the anode, and hydrogen gas
and hydroxyl ions due to reduction at the cathode, according to the following reactions:
2 𝐻2𝑂 → 𝑂2 + 4 𝐻+ + 4 𝑒− 𝐸0 = −1.229 (𝐴𝑛𝑜𝑑𝑒)
2 𝐻2𝑂 + 2 𝑒− → 𝐻2 + 2 𝑂𝐻
− 𝐸0 = −0.828 𝑉 (𝐶𝑎𝑡ℎ𝑜𝑑𝑒)
31
In the experimental setup, the effect of H+ and OH- generated by water electrolysis in the
electrodes can be avoided by are continuously circulating the electrolyte solutions in the
anode and the cathode side to neutralize the H+ and OH- [143]. Another method to avoid
the effect of the generation of H+ and OH- is by separating electrodes with the anode and
cathode reservoirs using salt bridge [143,144].
The electrical potential gradient can enhance mass transport as given by Nernst-
Planck equation:
𝐽𝑖 = −𝐷𝑖𝜕𝑐𝑖
𝜕𝑥− 𝐷𝑖𝑧𝑖𝑐𝑖
𝐹
𝑅𝑇 𝜕𝑉
𝜕𝑥 (1-24)
where Ji is the flux of ion i, 𝐷𝑖 is the diffusion coefficient, c is the concentration (mol/m3),
x is the distance (m), z is the charge number, F is the Faraday constant (96485.3 C/eq), R
is the gas constant (8.3145 VC/eq/K), T is the temperature (K), and V is the potential (V).
The electrokinetic method enables enhanced transport resulting in the decrease of the time
scale of the experiments [145]. The method has been applied in soil remediation
[138,141,146], cement decontamination [147], determination of sorption in rock samples
[148], and investigating pore connectivity [149]. In the context of bentonite, this method
has been used as an alternative method to obtain diffusion coefficients of ions and
radionuclides. The diffusion coefficients obtained by using this method were in
agreement with those obtained by conventional in-diffusion method [143].
The migration of water and ions under electrical potential gradient was well
produced to follow an advection-dispersion which described as [144,150–152]:
𝜕𝑐𝑖
𝜕𝑥= 𝐷𝑖
𝜕𝑐𝑖
𝜕𝑥2− 𝑉𝑐
𝜕𝐶
𝜕𝑥 (1-25)
32
Therefore, this method can also be used to study the chemical speciation in compacted
bentonite, since different chemical species will have different migration behavior, which
in turn can be distinguished from the concentration profile after the electromigration
experiment [153]. The application of electrokinetic method has also been used to study
precipitation generated by diffusion-reaction in porous media [154,155]. A study on
gypsum precipitation in compacted bentonite using this method showed that the
selectivity coefficient of two order magnitude higher than that previously reported is
needed to explain the precipitation condition [156].
In this study, the electrokinetic method was used to enhance CaCO3 precipitation
in compacted bentonite, of which the hydraulic conductivity is very low. Under the
electrical potential gradient, Ca2+ ions migrate towards the cathode side while HCO3-
/CO32- ions migrate towards the anode side in the opposite direction. As the process
continues, CaCO3 precipitates may occur by a chemical reaction between Ca2+ and HCO3-
/CO32- ions when the solution is oversaturated with respect to CaCO3 precipitates.
1.6.3. Determination of diffusion coefficient by back-to-back diffusion
Three types of diffusion coefficients, pore diffusion coefficient (Dp), effective
diffusion coefficient (𝐷𝑒) and apparent diffusion coefficient (Da), are often defined for
porous media. The relationships among three different diffusion coefficients can be
expressed as:
𝐷𝑎 =𝐷𝑒
𝜀+𝜌𝐾𝑑=
𝜀𝐷𝑝
𝜀+𝜌𝐾𝑑 (1-26)
33
where ε is the porosity, ρ is the dry density, and Kd is the distribution coefficient (dm3/g).
The common experimental methodologies to obtain the De and Da values are back-to-
back diffusion, through-diffusion, and reservoir-depletion method [157,158].
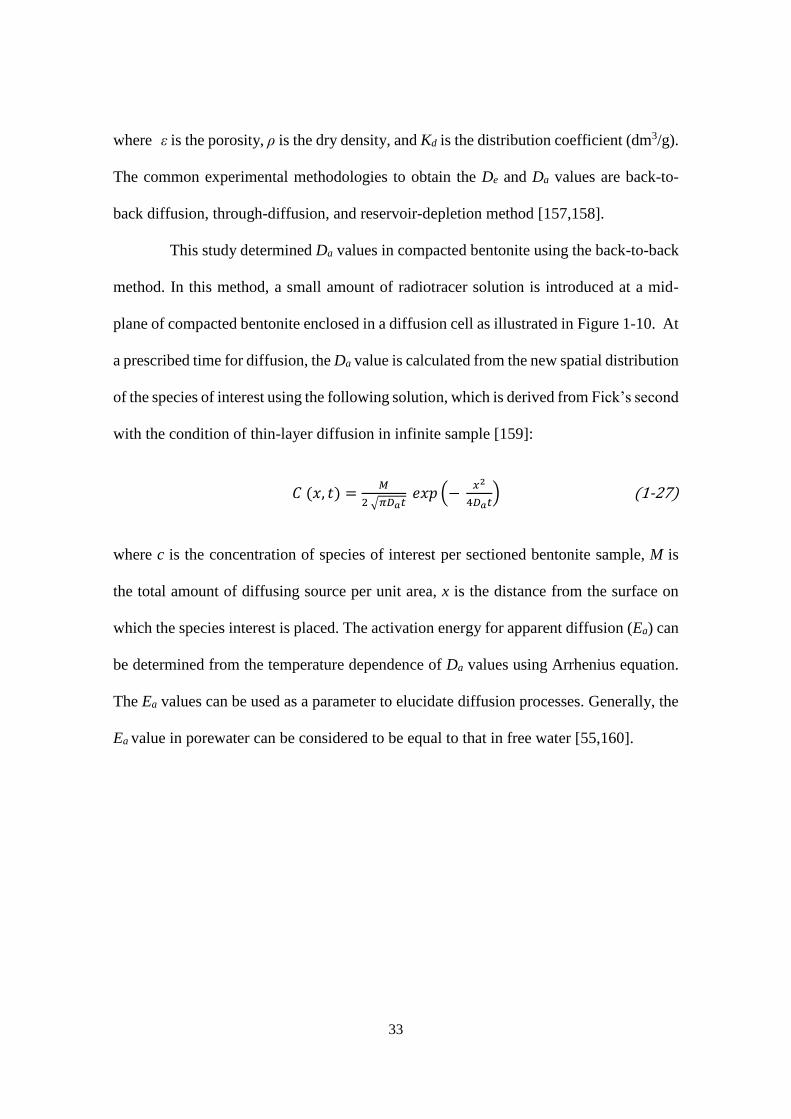
This study determined Da values in compacted bentonite using the back-to-back
method. In this method, a small amount of radiotracer solution is introduced at a mid-
plane of compacted bentonite enclosed in a diffusion cell as illustrated in Figure 1-10. At
a prescribed time for diffusion, the Da value is calculated from the new spatial distribution
of the species of interest using the following solution, which is derived from Fick’s second
with the condition of thin-layer diffusion in infinite sample [159]:
𝐶 (𝑥, 𝑡) =𝑀
2 √𝜋𝐷𝑎𝑡 𝑒𝑥𝑝 (−
𝑥2
4𝐷𝑎𝑡) (1-27)
where c is the concentration of species of interest per sectioned bentonite sample, M is
the total amount of diffusing source per unit area, x is the distance from the surface on
which the species interest is placed. The activation energy for apparent diffusion (Ea) can
be determined from the temperature dependence of Da values using Arrhenius equation.
The Ea values can be used as a parameter to elucidate diffusion processes. Generally, the
Ea value in porewater can be considered to be equal to that in free water [55,160].
34
Figure 1-10. Schematic of back-to-back diffusion method (a) and typical concentration
profile in each of bentonite (b).
1.7. Outline of this thesis
Chapter 2 is entitled “Precipitation of CaCO3 enhanced by electrokinetic method
and its application to determine the activity coefficient of dissolved ions in the porewater
of compacted bentonite”. It describes the estimation of the activity coefficients of
dissolved ions in the porewater of compacted bentonite from the conditions at which
CaCO3 precipitation occurred. The formation of CaCO3 precipitates was carried out in
compacted Na-bentonite enhanced by electrokinetic method. The resulting CaCO3
precipitates were analyzed by SEM/EDS images and X-ray diffraction. A sequential
extraction has been developed to provide a practical method to determine the
concentration of dissolved ions in the porewater and solid phase ions in the form of
exchangeable cations and precipitates. The mean activity coefficients of Ca2+ and CO32-
ions was calculated using the concentrations of dissolved Ca2+ and HCO3-/CO3
2- ions and
assuming the porewater is in equilibrium with the CaCO3 precipitates. The resulting
values were compared to the theoretical approximation in bulk solution.
35
Chapter 3 is entitled “Travelling reaction front of CaCO3 precipitation in
compacted bentonite under electrical potential gradient”. In this chapter, the
electromigration parameters of Ca2+ and HCO3-/CO3
2- ions in compacted Na-bentonite
were determined. The time dependence of CaCO3 precipitation in compacted bentonite
under electrical potential gradient was studied using the same method as in Chapter 2.
The electromigration parameters values and the temporal spatial distributions of Ca2+ and
HCO3-/CO3
2- ions were then used to discuss CaCO3 precipitation in bentonite under the
experimental conditions. Finally, the transport mechanism of Ca2+ and HCO3-/CO3
2- ions
during the CaCO3 precipitation reaction in bentonite is discussed.
Chapter 4 is entitled “Diffusion behavior of sulphate ions in compacted Na-
montmorillonite at different dry density and salinity”. It provides the determination of Da
values of 35SO42- ions in compacted bentonite using back-to-back diffusion method. The
Da values were obtained as a function of different dry density and NaCl concentrations.
The Ea values of 35SO42- ions were determined from the temperature dependence on the
Da values. The diffusion behavior of 35SO42- ions in was then discussed from the Da and
Ea data.
Chapter 5 provides summary for main results and conclusions for the overall
study, and their importance for safety assessment of geological disposal of HLW.
36
1.8. References
[1] International Atomic Energy Agency. The Power Reactor Information System
(PRIS). [accessed 2019 Jun 23]; <https://pris.iaea.org/PRIS/home.aspx>
[2] Ewing RC. The nuclear fuel cycle: A role for mineralogy and geochemistry.
Elements. 2006;2(6):331–334.
[3] International Atomic Energy Agency. Fundamental Safety Principles: Safety
Fundamentals. Safety Standards for protecting people and the environment.
Fundamental Safety Principles. Vienna: IAEA; 2006. (IAEA Safety Standards
Series No.SF-1).
[4] Lowenthal MD. Waste-acceptance criteria and risk-based thinking for radioactive-
waste classification. Waste Manag. 1998;18:249–256.
[5] International Atomic Energy Agency. Classification of Radioactive Waste:
General Safety Guide. Vienna: IAEA; 2009. (IAEA Safety Standards Series No.
GSG-1).
[6] Nakayama S. Radioactive Waste Management. In: Nagasaki S, Nakayama S,
editors. Radioactive Waste Engineering and Management, An Advance Course in
Nuclear Engineering. Tokyo: Springer; 2015.p.1–16.
[7] Satoyama T, Kishimoto K, Hoshi A, et al. Clearance of Concrete Generated from
Modification Activities of JRR-3 - Method for Measuring and Evaluating of
Radioactivity Concentration -. Tokai: Japan Atomic Energy Agency; 2010.
(JAEA-Technology 2011-003).
[8] International Atomic Energy Agency. Status and Trends in Spent Fuel and
37
Radioactive Waste Management. Vienna: IAEA; 2018. (IAEA Nuclear Energy
Series No. NW-T-1.14).
[9] Nuclear Waste Management Organization. Frequently Asked Questions. [accessed
2019 Jul 4]; <www.numo.or.jp/q_and_a/>
[10] Niibori Y. Radioactive Waste Disposal. In: Nagasaki S, Nakayama S, editors.
Radioactive Waste Engineering and Management, An Advance Course in Nuclear
Engineering. Tokyo: Springer; 2015.p.153–174.
[11] Japan Atomic Energy Agency, The Federation of Electric Power Companies of
Japan. Second progress report on research and development for TRU waste
disposal in japan − repository design, safety assessment and means of
implementation in the generic phase. Tokai: JAEA; 2007. (JAEA-Review 2007-
010).
[12] Ewing RC, Whittleston RA, Yardley BWD. Geological disposal of nuclear waste:
A primer. Elements. 2016;12(4):233–237.
[13] Hedin A. Spent nuclear fuel - how dangerous is it? A report from the project
“Description of risk.” SKB Technical Report TR 97-13. Stockholm: Swedish
Nuclear Fuel and Waste Management; 1997. (SKB Technical Report 97-13).
[14] Bruno J, Ewing RC. Spent Nuclear Fuel. Elements. 2006;2(6):343–349.
[15] Ewing RC. Long-term storage of spent nuclear fuel. Nat. Mater. 2015;14(3):252–
257.
[16] Ewing RC, Hippel FN von. Nuclear Waste Management in the United States —
Starting Over. Science (80-. ). 2009;325:151–152.
38
[17] Grambow B. Nuclear Waste Glasses - how durable. Elements. 2006;2(6):357–364.
[18] Donald IW. Waste immobilization in glass and ceramic based hosts: radioactive,
toxic and hazardous waste. Chichester: John Wiley & Sons; 2010.
[19] Gin S, Abdelouas A, Criscenti LJ, et al. An international initiative on long-term
behavior of high-level nuclear waste glass. Mater. Today. 2013;16(6):243–248.
[20] Japan Nuclear Cycle Development Institute. H12: Project to establish the scientific
and technical basis for HLW disposal in Japan, Supporting Report 3 Safety
Assessment of the Geological Disposal System. JNC TN1410 2000-004. Tokai:
JNC; 2000. (JNC TN1410 2000-004).
[21] Poinssot C, Bourg S, Ouvrier N, et al. Assessment of the environmental footprint
of nuclear energy systems . Comparison between closed and open fuel cycles.
2014;69.
[22] Chapman N, Hooper A. The disposal of radioactive wastes underground. Proc.
Geol. Assoc. 2012;123(1):46–63.
[23] International Atomic Energy Agency. Disposal of radioactive waste: Specific
safety requirements. Vienna: IAEA; 2011. (IAEA Safety Standards Series No.
SSR-5).
[24] Apted MJ, Ahn J. Multiple-barrier geological repository design and operation
strategies for safe disposal of radioactive materials. In: Apted MJ, Ahn J, editors.
Geological Repository Systems for Safe Disposal of Spent Nuclear Fuels and
Radioactive Waste (Second Edition). Cambridge: Woodhead Publishing;
2017.p.3–26.
39
[25] Hedin A, Olsson O. Crystalline rock as a repository for Swedish spent nuclear fuel.
Elements. 2016;12(4):247–252.
[26] Grambow B. Geological disposal of radioactive waste in clay. Elements.
2016;12(4):239–245.
[27] Von Berlepsch T, Haverkamp B. Salt as a host rock for the geological repository
for nuclear waste. Elements. 2016;12(4):257–262.
[28] Japan Nuclear Cycle Development Institute. H12: Project to Establish Technical
Basis for HLW Disposal in Japan, Project Overview Report. JNC TN1410 2000-
001. Tokai: JNC; 2000. (JNC TN1410 2000-001).
[29] Nuclear Waste Management Organization. Preliminary Assessment for Siting a
Deep Geological Repository for Canada ’s Used Nuclear Fuel: The corporation of
the town of Blind River, Ontario. NWMO; 2013. (APM-REP-06144-0001).
[30] Madsen FT. Clay Mineralogical Investigations Related to Nuclear Waste Disposal.
Clay Miner. 1998;33(1):109–129.
[31] Higgo JJW. Clay as a barrier to radionuclide migration. Prog. Nucl. Energy.
1987;19(2):173–207.
[32] Pusch R. Use of bentonite for isolation of radioactive waste products. Clay Miner.
1992;27(3):353–361.
[33] Pusch R. Chapter 11.4 Clays and nuclear waste management. In: Bergaya F, Theng
BKG, Lagaly G, editors. Handbook of clay science. Amsterdam: Elsevier;
2006.p.703–716.
[34] Altmann S, Tournassat C, Goutelard F, et al. Diffusion-driven transport in clayrock
40
formations. Appl. Geochemistry. 2012;27(2):463–478.
[35] Sellin P, Leupin OX. The use of clay as an engineered barrier in radioactive-waste
management - A review. Clays Clay Miner. 2014;61(6):477–498.
[36] Xia X, Idemitsu K, Arima T, et al. Corrosion of carbon steel in compacted
bentonite and its effect on neptunium diffusion under reducing condition. Appl.
Clay Sci. 2005;28:89–100.
[37] Carlson L, Karnland O, Oversby VM, et al. Experimental studies of the interactions
between anaerobically corroding iron and bentonite. Phys. Chem. Earth.
2007;32(1–7):334–345.
[38] Motamedi M, Karland O, Pedersen K. Survival of sulfate reducing bacteria at
different water activities in compacted bentonite. FEMS Microbiol. Lett.
1996;141(1):83–87.
[39] Ahn J. Integrated Radionuclide Transport Model for a High-Level Waste
Repository in Water-Saturated Geologic Formations. Nucl. Technol.
1998;121(1):24–39.
[40] Murray HH. Applied Clay Mineralogy: Occurrences, Processing and Applications
of Kaolins, Bentonites, Palygorskitesepiolite, and Common Clays. Amsterdam
(Netherlands): Elsevier; 2007.
[41] Grim RE, Guven N. Bentonites: Geology, mineralogy, properties and uses.
Amsterdam (Netherlands): Elsevier; 1978.
[42] Brigatti MF, Galan E, Theng BKG. Chapter 2 Structures and Mineralogy of Clay
Minerals. In: Bergaya F, Theng BKG, Lagaly G, editors. Handbook of Clay
41
Science. Amsterdam: Elsevier; 2006.p.19–86.
[43] Sato H, Ashida T, Kohara Y, et al. Effect of dry density on diffusion of some
radionuclides in compacted sodium bentonite. J. Nucl. Sci. Technol.
1992;29(9):873–882.
[44] Kozaki T, Sato Y, Nakajima M, et al. Effect of particle size on the diffusion
behavior of some radionuclides in compacted bentonite. Nucl. Mater.
1999;270:265–272.
[45] Kozaki T, Inada K, Sato S, et al. Diffusion mechanism of chloride ions in sodium
montmorillonite. J. Contam. Hydrol. 2001;47(2–4):159–170.
[46] Tournassat C, Bourg IC, Steefel CI, et al. Chapter 1 - Surface Properties of Clay
Minerals. In: Tournassat C, Steefel CI, Bourg IC, et al., editors. Natural and
Engineered Clay Barriers. Elsevier; 2015.p.5–31.
[47] Ochs M, Lothenbach B, Shibata M, et al. Thermodynamic modeling and sensitivity
analysis of porewater chemistry in compacted bentonite. Phys. Chem. Earth.
2004;29(1):129–136.
[48] Altmann S. ’Geo’chemical research: A key building block for nuclear waste
disposal safety cases. J. Contam. Hydrol. 2008;102(3–4):174–179.
[49] Delay J, Vinsot A, Krieguer JM, et al. Making of the underground scientific
experimental programme at the Meuse/Haute-Marne underground research
laboratory, North Eastern France. Phys. Chem. Earth. 2007;32(1–7):2–18.
[50] Tournassat C, Vinsot A, Gaucher EC, et al. Chapter 3 - Chemical conditions in
clay-rocks. In: Tournassat C, Steefel CI, Bourg IC, et al., editors. Natural and
42
Engineered Clay Barriers. Amsterdam (Netherlands): Elsevier; 2015.p.71–100.
[51] Fernández AM, Sánchez-Ledesma DM, Tournassat C, et al. Applying the
squeezing technique to highly consolidated clayrocks for pore water
characterisation: Lessons learned from experiments at the Mont Terri Rock
Laboratory. Appl. Geochemistry. 2014;49:2–21.
[52] Grambow B, Landesman C, Ribet S. Nuclear waste disposal: I. Laboratory
simulation of repository properties. Appl. Geochemistry. 2014;49:237–246.
[53] Appelo CAJ, Vinsot A, Mettler S, et al. Obtaining the porewater composition of a
clay rock by modeling the in- and out-diffusion of anions and cations from an in-
situ experiment. J. Contam. Hydrol. 2008;101(1–4):67–76.
[54] Fernández AM, Baeyens B, Bradbury MH, et al. Analysis of the porewater
chemical composition of a Spanish compacted bentonite used in an engineered
barrier. Phys. Chem. Earth, Parts A/B/C. 2004;29(1):105–118.
[55] Kozaki T, Sato H, Fujishima A, et al. Effect of dry density on activation energy for
diffusion of strontium in compacted sodium montmorillonite. Material Resources
Symposium Proceeding Volume 465 (Symposium II – Scienfific Basis for Nuclear
Waste Management XX). 1997.p.893–900.
[56] Kozaki T, Liu J, Sato S. Diffusion mechanism of sodium ions in compacted
montmorillonite under different NaCl concentration. Phys. Chem. Earth, Parts
A/B/C. 2008;33(14–16):957–961.
[57] Bradbury MH, Baeyens B. Porewater chemistry in compacted re-saturated MX-80
bentonite. J. Contam. Hydrol. 2003;61(1–4):329–338.
43
[58] Bergaya F, Lagaly G. Chapter 1 General introduction: Clays, clay minerals, and
clay science. In: Bergaya F, Theng BKG, Lagaly G, editors. Handbook of clay
science. Elsevier; 2006.p.1–18.
[59] Scanlon BR, Andraski BJ, Bilskie J. Chapter 3.2.4 Miscellaneous methods for
measuring matric or water potential. Methods of Soil Analysis: Part 4 Physical
Methods. Soil Science Society of America; 2002.p.643–670.
[60] Serafeimidis K, Anagnostou G. The solubilities and thermodynamic equilibrium
of anhydrite and gypsum. Rock Mech. Rock Eng. 2014;48(1):15–31.
[61] Torikai Y, Sato S, Ohashi H. Thermodynamic properties of water in compacted
sodium montmorillonite. Nucl. Technol. 1996;115(1):73–80.
[62] Sato H. Thermodynamic model on swelling of bentonite buffer and backfill
materials. Phys. Chem. Earth. 2008;33:538–543.
[63] Japan Nuclear Cycle Development Institute. H12: Project to establish the scientific
and technical basis for HLW disposal in Japan, Supporting Report 2 Repository
design and Engineering Technology. JNC TN1410 2000-003. Tokai: JNC; 2000.
(JNC TN1410 2000-003).
[64] Shackelford CD. Diffusion as a transport process in fine-grained barrier materials.
Geotech. News. 1998;6(2):24–27.
[65] Mazurek M, Alt-Epping P, Bath A, et al. Natural tracer profiles across argillaceous
formations. Appl. Geochemistry. 2011;26(7):1035–1064.
[66] Grambow B. Mobile fission and activation products in nuclear waste disposal. J.
Contam. Hydrol. 2008;102(3–4):180–186.
44
[67] Gimmi T, Leupin OX, Eikenberg J, et al. Anisotropic diffusion at the field scale in
a 4-year multi-tracer diffusion and retention experiment – I: Insights from the
experimental data. Geochim. Cosmochim. Acta. 2014;125:373–393.
[68] Kozaki T, Saito N, Fujishima A, et al. Activation energy for diffusion of chloride
ions in compacted sodium montmorillonite. J. Contam. Hydrol. 1998;35(1–3):67–
75.
[69] Molera M, Eriksen T, Jansson M. Anion diffusion pathways in bentonite clay
compacted to different dry densities. Appl. Clay Sci. 2003;23(1–4):69–76.
[70] Van Loon LR, Glaus MA, Müller W. Anion exclusion effects in compacted
bentonites: Towards a better understanding of anion diffusion. Appl.
Geochemistry. 2007;22(11):2536–2552.
[71] Oscarson DW, Hume HB, Sawatsky NG, et al. Diffusion of iodide in compacted
bentonite. Soil Sci. Soc. Am. J. 1992;56(5):1400–1406.
[72] Yukio Tachi, Kenji Yotsuji, Yoshimi Seida MY. Diffusion of cesium and iodine
in compacted sodium montmorillonite under different saline conditions. Scientific
Basis for Nuclear Waste Management XXXIII. Materials Research Society
Proceeding. 2009.p.542–552.
[73] Tian W, Li C, Liu X, et al. The effect of ionic strength on the diffusion of 125I in
Gaomiaozi bentonite. J. Radioanal. Nucl. Chem. 2013;295(2):1423–1430.
[74] Ishidera T, Miyamotoy S, Sato H. Effect of sodium nitrate on the diffusion of Cl-
and I- in compacted bentonite. J. Nucl. Sci. Technol. 2008;45(7):610–616.
[75] Aldaba D, Glaus MA, Van Loon LR, et al. Diffusion of radiosulphate and
45
radiocaesium in kaolinite clay (KGa-2): Testing the applicability of the pore water
diffusion model. Appl. Geochemistry. 2017;86:84–91.
[76] Van Loon LR, Leupin OX, Cloet V. The diffusion of SO42- in Opalinus Clay :
Measurements of effective diffusion coefficients and evaluation of their
importance in view of microbial mediated reactions in the near field of radioactive
waste repositories. Appl. Geochemistry. 2018;95:19–24.
[77] Idemitsu K, Kozaki H, Yuhara M, et al. Diffusion behavior of selenite in purified
bentonite. Prog. Nucl. Energy. 2016;92:279–285.
[78] Wigger C, Van Loon LR. Effect of the pore water composition on the diffusive
anion transport in argillaceous, low permeability sedimentary rocks. J. Contam.
Hydrol. 2018;213(September 2017):40–48.
[79] Wigger C, Kennell-Morrison L, Jensen M, et al. A comparative anion diffusion
study on different argillaceous, low permeability sedimentary rocks with various
pore waters. Appl. Geochemistry. 2018;92(September 2017):157–165.
[80] Appelo CAJ, Wersin P. Multicomponent diffusion modeling in clay systems with
application to the diffusion of tritium, iodide, and sodium in Opalinus Clay.
Environ. Sci. Technol. 2007;41(14):5002–5007.
[81] Appelo CAJ, Van Loon LR, Wersin P. Multicomponent diffusion of a suite of
tracers (HTO, Cl, Br, I, Na, Sr, Cs) in a single sample of Opalinus Clay. Geochim.
Cosmochim. Acta. 2010;74(4):1201–1219.
[82] Van Loon LR, Mibus J. A modified version of Archie’s law to estimate effective
diffusion coefficients of radionuclides in argillaceous rocks and its application in
46
safety analysis studies. Appl. Geochemistry. 2015;59:85–94.
[83] Chagneau A, Tournassat C, Steefel CI, et al. Complete restriction of 36Cl- diffusion
by celestite precipitation in densely compacted illite. Environ. Sci. Technol. Lett.
2015;2(5):139–143.
[84] Wigger C, Van Loon LR. Importance of interlayer equivalent pores for anion
diffusion in clay-rich sedimentary rocks. Environ. Sci. Technol. 2017;51(4):1998–
2006.
[85] Leroy P, Revil A, Coelho D. Diffusion of ionic species in bentonite. J. Colloid
Interface Sci. 2006;296(1):248–255.
[86] Shackelford CD, Moore SM. Fickian diffusion of radionuclides for engineered
containment barriers: Diffusion coefficients, Porosities, And complicating issues.
Eng. Geol. 2013;152(1):133–147.
[87] Zhang CL, Conil N, Armand G. Thermal effects on clay rocks for deep disposal of
high-level radioactive waste. J. Rock Mech. Geotech. Eng. 2017;9(3):463–478.
[88] Bildstein O, Trotignon L, Perronnet M, et al. Modelling iron-clay interactions in
deep geological disposal conditions. Phys. Chem. Earth. 2006;31(10–14):618–
625.
[89] Savage D, Watson C, Benbow S, et al. Modelling iron-bentonite interactions. Appl.
Clay Sci. 2010;47(1–2):91–98.
[90] Ito H, Miyasaka N, Kozaki T, et al. A study on hydraulic properties of compacted
Fe(III)-montmorillonite. J. Nucl. Sci. Technol. 2010;47(11):1005–1010.
[91] Atkinson A, Everitt NM, Guppy RM. Time Dependence of pH in a Cementitious
47
Repository. Materials Research Society Symposium Proceedings. Cambridge
University Press; 1988.p.439–446.
[92] Gaucher EC, Blanc P. Cement/clay interactions - A review: Experiments, natural
analogues, and modeling. Waste Manag. 2006;26(7):776–788.
[93] Gaucher EC, Robelin C, Matray JM, et al. ANDRA underground research
laboratory: Interpretation of the mineralogical and geochemical data acquired in
the Callovian-Oxfordian formation by investigative drilling. Phys. Chem. Earth.
2004;29(1):55–77.
[94] Jenni A, Mäder U, Lerouge C, et al. In situ interaction between different concretes
and Opalinus Clay. Phys. Chem. Earth. 2014;70–71:71–83.
[95] Gaboreau S, Prêt D, Tinseau E, et al. 15 years of in situ cement-argillite interaction
from Tournemire URL: Characterisation of the multi-scale spatial heterogeneities
of pore space evolution. Appl. Geochemistry. 2011;26(12):2159–2171.
[96] Sasamoto H, Yui M, Arthur RC. Status of geochemical modeling of groundwater
evolution at the Tono in-situ tests site, Japan. Tokai: Japan Nuclear Cycle
Development Institute; 1999. (JNC TN8400 99-074).
[97] Moyce EBA, Rochelle C, Morris K, et al. Rock alteration in alkaline cement waters
over 15 years and its relevance to the geological disposal of nuclear waste. Appl.
Geochemistry. 2014;50:91–105.
[98] Maher K, Bargar JR, Brown GE. Environmental speciation of actinides. Inorg.
Chem. 2013;52(7):3510–3532.
[99] Stewart BD, Mayes MA, Scott Fendorf. Impact of Complexes on Uranium ( VI )
48
Adsorption to Synthetic and Natural Sediments. Environ. Sci. Technol.
2010;44:928–934.
[100] Catalano JG, Brown GE. Uranyl adsorption onto montmorillonite: Evaluation of
binding sites and carbonate complexation. Geochim. Cosmochim. Acta.
2005;69(12):2995–3005.
[101] Kitano Y, Oomori T. The coprecipitation of uranium with calcium carbonate. J.
Oceanogr. Soc. Japan. 1971;27(1):34–42.
[102] Meece DE, Benninger LK. The coprecipitation of Pu and other radionuclides with
CaCO3. Geochim. Cosmochim. Acta. 1993;57(7):1447–1458.
[103] Hellebrandt SE, Hofmann S, Jordan N, et al. Incorporation of Eu(III) into calcite
under recrystallization conditions. Sci. Rep. 2016;6:1–10.
[104] Curti E. Coprecipitation of radionuclides with calcite: estimation of partition
coecients based on a review of laboratory investigations and geochemical data.
Appl. Geochemistry. 1999;14:433–445.
[105] Zaoui A, Sekkal W. Can clays ensure nuclear waste repositories? Sci. Rep.
2015;5:1–5.
[106] Tartakovsky AM, Redden G, Lichtner PC, et al. Mixing-induced precipitation :
Experimental study and multiscale numerical analysis. Water Resour. Res.
2008;44:1–19.
[107] Benjamin MM. Water Chemistry. Waveland Press; 2010.
[108] Gebauer D, Völkel A, Cölfen H. Supporting Materials: Stable prenucleation
calcium carbonate clusters. Science. 2008;322(5909):1819–1822.
49
[109] Appelo CAJ, Postma D. Geochemistry, Groundwater and Pollution. 2nd Editio.
London: A.A. Balkema Publishers; 2004.
[110] Gebauer D. Stable Prenucleation Calcium Carbonate Clusters.
2008;120(December):1819–1822.
[111] Gebauer D, Cölfen H. Prenucleation clusters and non-classical nucleation. Nano
Today. 2011;6(6):564–584.
[112] Nielsen MH, Aloni S, De Yoreo JJ. In situ TEM imaging of CaCO<inf>3</inf>
nucleation reveals coexistence of direct and indirect pathways. Science (80-. ).
2014;345(6201):1158–1162.
[113] Plummer LN, Busenberg E. The solubilities of calcite, aragonite and vaterite in
CO2-H2O solutions between 0 and 90°C, and an evaluation of the aqueous model
for the system CaCO3-CO2-H2O. Geochim. Cosmochim. Acta. 1982;46(6):1011–
1040.
[114] Hull H, Turnbull AG. A thermochemical study of monohydrocalcite. Geochim.
Cosmochim. Acta. 1973;37(3):685–694.
[115] Kralj D, Brečević L. Dissolution kinetics and solubility of calcium carbonate
monohydrate. Colloids Surfaces A Physicochem. Eng. Asp. 1995;96(3):287–293.
[116] Bischoff JL, Fitzpatrick JA, Rosenbauer RJ. The Solubility and Stabilization of
Ikaite (CaCO3.6H2O) from 0° to 25°C: Environmental and Paleoclimatic
Implications for Thinolite Tufa. J. Geol. 1993;101(1):21–33.
[117] Clarkson JR, Price TJ, Adams CJ. Role of metastable phases in the spontaneous
precipitation of calcium carbonate. J. Chem. Soc. Faraday Trans. 1992;88(2):243–
50
249.
[118] Brečević L, Nielsen AE. Solubility of amorphous calcium carbonate. J. Cryst.
Growth. 1989;98(3):504–510.
[119] Kellermeier M, Picker A, Kempter A, et al. A straightforward treatment of activity
in aqueous CaCO3 solutions and the consequences for nucleation theory. Adv.
Mater. 2014;26(5):752–757.
[120] Saripalli KP, Meyer PD, Bacon DH, et al. Changes in Hydrologic Properties of
Aquifer Media Due to Chemical Reactions : A Review. Crit. Rev. Environ. Sci.
Technol. 2001;31(4):311–349.
[121] Chagneau A, Claret F, Enzmann F, et al. Mineral precipitation-induced porosity
reduction and its effect on transport parameters in diffusion-controlled porous
media. Geochem. Trans. 2015;16(1):1–16.
[122] Mackenzie PD, Horney DP, Sivavec TM. Mineral precipitation and porosity losses
in granular iron columns. J. Hazard. Mater. 1999;68(1–2):1–17.
[123] Stack AG. Precipitation in Pores : A Geochemical Frontier. Rev. Mineral.
Geochemistry. 2015;80(1):165–190.
[124] Noiriel C, Daval D. Pore-Scale Geochemical Reactivity Associated with CO2
Storage: New Frontiers at the Fluid-Solid Interface. Acc. Chem. Res.
2017;50(4):759–768.
[125] Jun YS, Kim D, Neil CW. Heterogeneous Nucleation and Growth of Nanoparticles
at Environmental Interfaces. Acc. Chem. Res. 2016;49(9):1681–1690.
[126] De Yoreo JJ, Vekilov PG. Principles of crystal nucleation and growth. Rev.
51
Mineral. Geochemistry. 2003;54(1):57–93.
[127] Waychunas GA. In Situ Observations of Nanoparticle Early Development Kinetics
at Mineral - Water Interfaces. 2010;44(21):8182–8189.
[128] Rijniers LA, Huinink HP, Pel L, et al. Experimental evidence of crystallization
pressure inside porous media. Phys. Rev. Lett. 2005;94(7):23–26.
[129] Prieto M. Nucleation and supersaturation in porous media (revisited). Mineral.
Mag. 2014;78(6):1437–1447.
[130] Stack AG, Fernandez-Martinez A, Allard LF, et al. Pore-size-dependent calcium
carbonate precipitation controlled by surface chemistry. Environ. Sci. Technol.
2014;48(11):6177–6183.
[131] Nindiyasari F, Fernández-Díaz L, Griesshaber E, et al. Influence of gelatin
hydrogel porosity on the crystallization of CaCO 3. Cryst. Growth Des.
2014;14(4):1531–1542.
[132] Gebrehiwet TA, Guo L, Fox D, et al. Precipitation of calcium carbonate and
calcium phosphate under diffusion controlled mixing. Appl. Geochemistry.
2014;46:43–56.
[133] Gebrehiwet TA, Redden GD, Fujita Y, et al. The Effect of the CO32- to Ca2+ Ion
activity ratio on calcite precipitation kinetics and Sr2+ partitioning. Geochem.
Trans. 2012;13(1):1.
[134] Stack AG. Next generation models of carbonate mineral growth and dissolution.
2014;288:278–288.
[135] Giammar DE, Wang F, Guo B, et al. Impacts of diffusive transport on carbonate
52
mineral formation from magnesium silicate-CO2-water reactions. Environ. Sci.
Technol. 2014;48(24):14344–14351.
[136] Gramling CM, Harvey CF, Meigs LC. Reactive transport in porous media: A
comparison of model prediction with laboratory visualization. Environ. Sci.
Technol. 2002;36(11):2508–2514.
[137] Shao H, Kulik DA, Berner U, et al. Modeling the competition between solid
solution formation and cation exchange on the retardation of aqueous radium in an
idealized bentonite column. Geochem. J. 2009;43(6):37–42.
[138] Acar YB, Alshawabkeh AN. Principles of Electrokinetic Remediation. Environ.
Sci. Technol. 1993;27(13):2638–2647.
[139] Kim BK, Baek K, Ko SH, et al. Research and field experiences on electrokinetic
remediation in South Korea. Sep. Purif. Technol. 2011;79(2):116–123.
[140] Dziubakiewicz EBB. Principles of Electromigration Techniques. In: Buszewski B,
Dziubakiewicz E, Szumski M, editors. Electromigration Techniques : Theory and
Practice. Heidelberg: Springer; 2013.p.5–26.
[141] Virkutyte J, Sillanpää M, Latostenmaa P. Electrokinetic soil remediation - Critical
overview. Sci. Total Environ. 2002;289(1–3):97–121.
[142] Gingine V, Shah R, Venkata Koteswara RP, et al. A review on study of
Electrokinetic stabilization of expansive soil. Int. J. Earth Sci. Eng. 2013;6(2):176–
181.
[143] Maes N, Moors H, Dierckx A, et al. The assessment of electromigration as a new
technique to study diffusion of radionuclides in clayey soils. J. Contam. Hydrol.
53
1999;36(3–4):231–247.
[144] Higashihara T, Kinoshita K, Sato S, et al. Electromigration of sodium ions and
electro-osmotic flow in water-saturated, compacted Na-montmorillonite. Appl.
Clay Sci. 2004;26(1–4):91–98.
[145] Gomes HI, Dias-Ferreira C, Ribeiro AB, et al. Enhanced transport and
transformation of zerovalent nanoiron in clay using direct electric current. Water.
Air. Soil Pollut. 2013;224(12):1–12.
[146] Yang J-S, Kwon MJ, Choi J, et al. The transport behavior of As, Cu, Pb, and Zn
during electrokinetic remediation of a contaminated soil using electrolyte
conditioning. Chemosphere. 2014;117C:79–86.
[147] Kim C, Choi S, Shin M. Review—Electro-Kinetic Decontamination of
Radioactive Concrete Waste from Nuclear Power Plants. J. Electrochem. Soc.
2018;165(9):E330–E344.
[148] André M, Malmström ME, Neretnieks I. Determination of sorption properties of
intact rock samples: new methods based on electromigration. J. Contam. Hydrol.
2009;103(3–4):71–81.
[149] Löfgren M, Neretnieks I. Through-electromigration: a new method of investigating
pore connectivity and obtaining formation factors. J. Contam. Hydrol. 2006;87(3–
4):237–252.
[150] Tanaka S, Noda N, Higashihara T, et al. Kinetic behavior of water as migration
media in compacted montmorillonite using H218O and applying electric potential
gradient. Phys. Chem. Earth, Parts A/B/C. 2008;33:S163–S168.
54
[151] Tanaka S, Noda N, Sato S, et al. Electrokinetic study of migration of anions,
cations, and water in water-saturated compacted sodium montmorillonite. J. Nucl.
Sci. Technol. 2011;48(3):454–462.
[152] Higashihara T, Kinoshita K, Akagi Y, et al. Transport number of sodium ions in
water-saturated, compacted Na-montmorillonite. Phys. Chem. Earth, Parts A/B/C.
2008;33:S142–S148.
[153] Beauwens T, De Cannière P, Moors H, et al. Studying the migration behaviour of
selenate in Boom Clay by electromigration. Eng. Geol. 2005;77(3–4):285–293.
[154] Deman J. Precipitation during Electromigration of Ions. 1970;42(3):321–324.
[155] Cao C-X, Fan L, Zhang W. Review on the theory of moving reaction boundary,
electromigration reaction methods and applications in isoelectric focusing and
sample pre-concentration. Analyst. 2008;133:1139–1157.
[156] Tanaka S. Gypsum precipitation enhanced by electrokinetic method and porewater
chemistry in compacted montmorillonite. Appl. Clay Sci. 2018;161:482–493.
[157] Shackelford CD. Laboratory diffusion testing for waste disposal - A review. J.
Contam. Hydrol. 1990;7:177–217.
[158] Bourg IC, Tournassat C. Chapter 6 - Self-Diffusion of Water and Ions in Clay
Barriers. In: Tournassat C, Steefel CI, Bourg IC, et al., editors. Natural and
Engineered Clay Barriers. Elsevier; 2015.p.189–226.
[159] Crank J. The mathematics of diffusion. 2nd ed. Oxford: Clarendon Press; 1975.
[160] Kozaki T, Sato H, Sato S, et al. Diffusion mechanism of cesium ions in compacted
montmorillonite. Eng. Geol. 1999;54:223–230.
55
2. Calcium carbonate precipitation in compacted bentonite using
electromigration reaction method and its application to estimate the
ion activity coefficient in the porewater
2.1. Introduction
Geological disposal is recognized as safe and secure means to dispose of high-
level radioactive waste [1]. It requires multiple safety functions to isolate radionuclides
in the waste forms from the biosphere [2]. A multi-barrier approach consisting of a series
of engineered and natural barriers is adopted to contain the waste for a long period of
time. Compacted bentonite is one part of the engineered barrier system, which is expected
to provide the protection for the waste forms from the physical and chemical processes
and to limit the rate of transport of radionuclides that may be released from the waste
forms.
In the actual radioactive waste disposal facilities, perturbation of bentonite
buffer may occur over time due to interactions with the surrounding materials. One of the
potential perturbations is CaCO3 precipitation [3,4]. Cementitious materials are used in
the structure of radioactive waste repository, and the leachate from them is rich with Ca2+
ions [3,5]. This leachate may also raise the pH of the surrounding environment and
promote rock alteration that results in the release of CO32- ions [6]. The reaction of these
two ions can generate CaCO3 precipitates, which may affect the transport of radionuclides
by porosity clogging [5,7,8] and/or incorporation of radionuclides in the precipitates
[9,10]. Although CaCO3 precipitation has been studied extensively in bulk solution
[11,12] and in porous media [13–16], little is known about its behavior in compacted
bentonite.
56
Montmorillonite, which is the major component of bentonite clays, has two types
of pore spaces: interlayer space which is filled with interlayer water containing cations to
compensate the excess negative charge of montmorillonite layers, and interparticle space
which is filled with free porewater [17–20]. Due to the negative charge of
montmorillonite layers, anions, including HCO3-/CO3
2- ions, are excluded from the
interlayer space, thus the precipitation of CaCO3 is expected to occur only in the
interparticle space where both Ca2+ and CO32- ions can be present in the porewater.
Moreover, concentrations of ions in the interparticle porewater are also heterogeneous
due to electric double layer effect. The ion activity product of Ca2+ and CO32- may not
be high enough to form CaCO3 precipitates near the surface of the clay, and as a result,
precipitation preferentially occurs in larger pores [15,21]. Micro-scale porewater
chemistry controls the precipitation of CaCO3 in compacted bentonite, or reversely,
analysis of the conditions under which precipitation takes place in compacted bentonite
may provide insight into micro-scale porewater chemistry.
Studying the porewater chemistry in compacted bentonite is challenging because
it is difficult to directly analyze it in-situ, and to sample it without potential alteration
[22]. Experimental data of porewater composition have been obtained by water sampling
with borehole instrumentation [23], extraction using squeezing techniques [24], liquid
displacement with a solution of known composition [25]. These data are often
complemented with geochemical modelling assuming that the dissolved ions in porewater
have the same activity coefficients as in bulk water [25–29]. However, it has been
reported that the porewater behaves like solutions with high ionic strength due to
interactions between the ions in porewater and montmorillonite surfaces [30]. This
contradicts with the basic assumption that the ionic strength in compacted bentonite
57
system is the same as in bulk water, and the lack of quantitative understanding on the
activities of the ions in porewater in compacted bentonite system is limiting the advance
of the discussion on migration behaviors and chemical reactions of ions.
The objective of this study is to determine the activity coefficients of dissolved
ions in the porewater of compacted montmorillonite using CaCO3 precipitation processes
as an indicator of activities of reacting ions. Electrokinetic method was used to enhance
the migration of reacting ions because the hydraulic conductivity in compacted bentonite
is very low (less than 10-11 m/s). This method has been used to study radionuclides
migration [31–34] and gypsum (CaSO4) precipitation in compacted bentonite [35]. Under
the electrical potential gradient, Ca2+ ions migrate towards the cathode side while HCO3-
/CO32- ions migrate towards the anode side in the opposite direction. As the process
continues, CaCO3 precipitates are produced by a chemical reaction between Ca2+ and
HCO3-/CO3
2- ions when the solution is oversaturated with respect to CaCO3 precipitates.
A sequential extraction method was developed to separately quantify cations in the
porewater in ionic forms from the precipitates in the solid phase. Activity coefficients
were estimated assuming that after precipitation, the ionic activity product (IAP) is equal
to the solubility product (Ksp).
2.2. Method
2.2.1. Materials
Kunipia F (Kunimine Industries Co., Tokyo, Japan), which contains more than
95% montmorillonite, was used as a starting bentonite material. All chemicals used in
this study were of analytical grade (Junsei Chemical Co., Tokyo, Japan). Deionized water
58
was prepared using EYELA Still Ace SA-2100E1 (Tokyo Rikakikai Co., Tokyo, Japan).
The radioisotopes 45CaCl2 and NaH14CO3 (PerkinElmer, Boston, USA) were obtained
from Japan Radioisotope Association.
2.2.2. Preparation of Saturated Compacted Na-Bentonite
Kunipia F was purified to obtain a homoionized Na-montmorillonite with
particle size between 75 and 150 μm using the method described in detail elsewhere [36].
Compacted Na-montmorillonite was prepared to have the dry density of 1.0 kg/dm3 in
acrylic resin cells with both inner diameter and length of 20 mm. The one end of the inner
cylindrical cell was closed with stainless steel sintered filter having a pore size of 2 μm.
Dry homoionized Na-bentonite was weighed to have a predetermined density and was
placed into the cell from the other open end. A pressure was applied to pack the bentonite
powder in the inner cylinder of the acrylic cell, then the open end was closed with the
stainless-steel filter. The cells containing compacted bentonite sample were immersed in
0.7 M NaHCO3 solution in a closed container for 30 days at room temperature and
atmospheric pressure.
2.2.3. Electromigration Experiment
The saturated sample was subjected to electromigration to enhance the migration
of Ca2+ and HCO3-/CO3
2- ions in compacted montmorillonite so that they form precipitate
CaCO3. The experimental setup is shown in Figure 2-1. The sample was set in a sample
holder between the anode and the cathode reservoir containing 1 M CaCl2 and 0.7 M
NaHCO3, respectively. Saturated ZnSO4 solution and salt bridges were used so that the
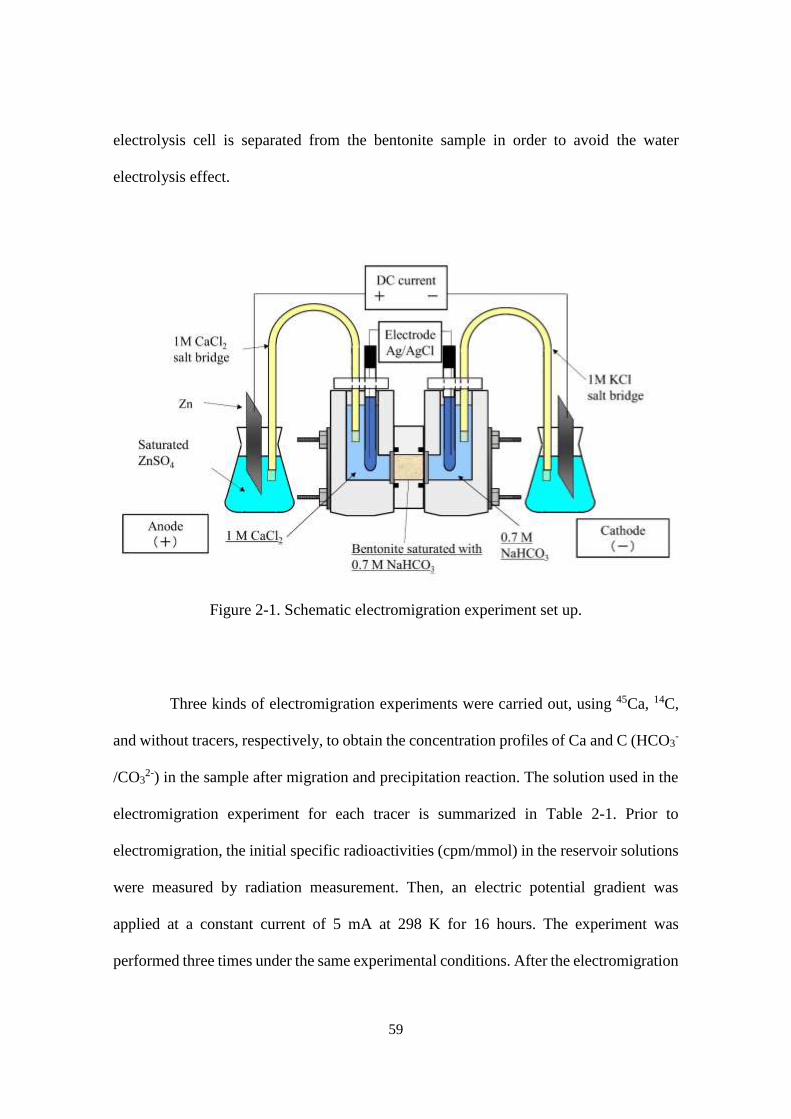
59
electrolysis cell is separated from the bentonite sample in order to avoid the water
electrolysis effect.
Figure 2-1. Schematic electromigration experiment set up.
Three kinds of electromigration experiments were carried out, using 45Ca, 14C,
and without tracers, respectively, to obtain the concentration profiles of Ca and C (HCO3-
/CO32-) in the sample after migration and precipitation reaction. The solution used in the
electromigration experiment for each tracer is summarized in Table 2-1. Prior to
electromigration, the initial specific radioactivities (cpm/mmol) in the reservoir solutions
were measured by radiation measurement. Then, an electric potential gradient was
applied at a constant current of 5 mA at 298 K for 16 hours. The experiment was
performed three times under the same experimental conditions. After the electromigration
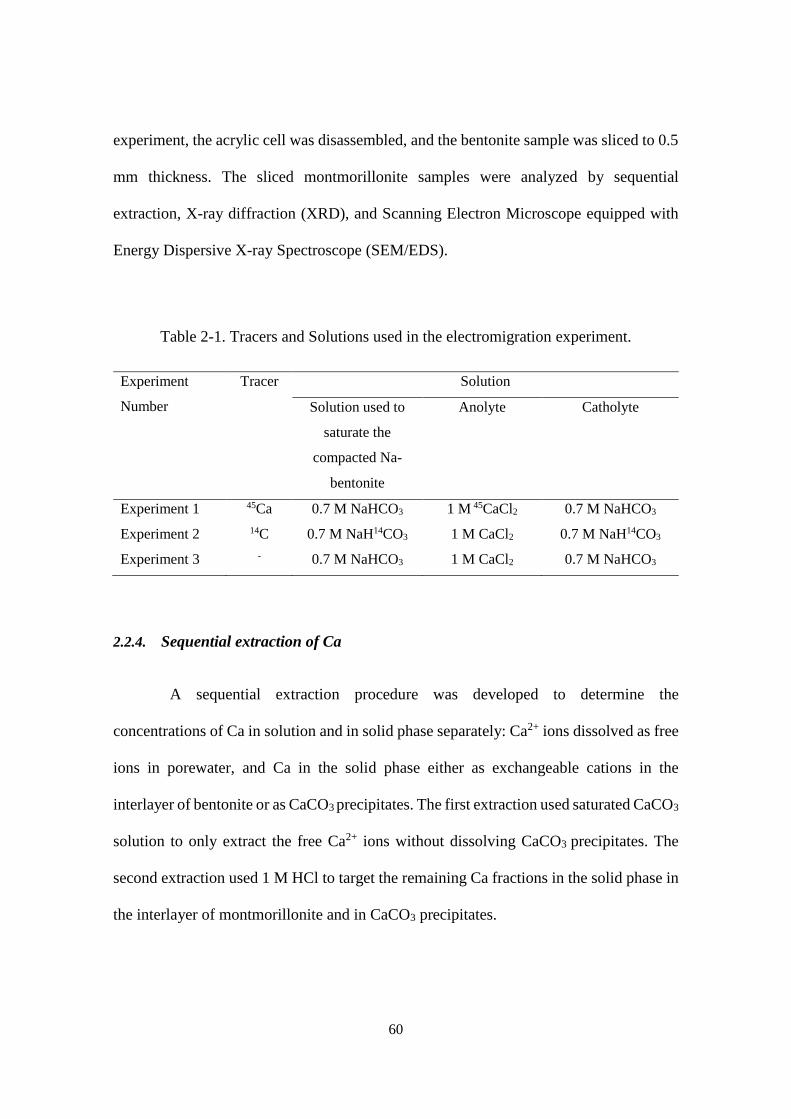
60
experiment, the acrylic cell was disassembled, and the bentonite sample was sliced to 0.5
mm thickness. The sliced montmorillonite samples were analyzed by sequential
extraction, X-ray diffraction (XRD), and Scanning Electron Microscope equipped with
Energy Dispersive X-ray Spectroscope (SEM/EDS).
Table 2-1. Tracers and Solutions used in the electromigration experiment.
Experiment
Number
Tracer Solution
Solution used to
saturate the
compacted Na-
bentonite
Anolyte Catholyte
Experiment 1 45Ca 0.7 M NaHCO3 1 M 45CaCl2 0.7 M NaHCO3
Experiment 2 14C 0.7 M NaH14CO3 1 M CaCl2 0.7 M NaH14CO3
Experiment 3 - 0.7 M NaHCO3 1 M CaCl2 0.7 M NaHCO3
2.2.4. Sequential extraction of Ca
A sequential extraction procedure was developed to determine the
concentrations of Ca in solution and in solid phase separately: Ca2+ ions dissolved as free
ions in porewater, and Ca in the solid phase either as exchangeable cations in the
interlayer of bentonite or as CaCO3 precipitates. The first extraction used saturated CaCO3
solution to only extract the free Ca2+ ions without dissolving CaCO3 precipitates. The
second extraction used 1 M HCl to target the remaining Ca fractions in the solid phase in
the interlayer of montmorillonite and in CaCO3 precipitates.
61
Prior to using this method with the samples after the electromigration
experiment, recoveries of the Ca2+ ions in porewater and in the interlayer of
montmorillonite were tested. Saturated CaCO3 solution was prepared by stirring CaCO3
powder in deionized water for 1 day at room temperature and atmospheric pressure. The
resulting solution was filtered with a 0.45 µm membrane (Advantec, Tokyo, Japan) prior
to use. Suspensions of 0.25 g dry Ca-bentonite and 1 ml CaCl2 solution was prepared with
a known radioactivity distribution of 45Ca2+ as free and as exchangeable ions. They were
mixed with 10 ml saturated CaCO3 solution and shaked for 1 hour, then the supernatant
was collected after centrifuging at 10,000 rpm (12,000 g) for 10 minutes. Extraction with
10 ml saturated CaCO3 solution was repeated one more time, similarly the supernatant
was collected. After saturated CaCO3 solution was removed, 10 ml of 1 M HCl were
added to the sample and mixed in a shaker for 24 hours. The supernatant was then
collected by centrifuging the sample at 10,000 rpm (12,000 g) for 10 minutes. The
extraction with 1 M HCl was repeated one more time as well. Each of the supernatants
was then ultra-filtered (USY-1 MWCO 10,000, Advantec, Tokyo, Japan) to remove
colloidal particles of bentonite prior to radiation measurement of the 45Ca2+ radioactivities
with Aloka AccuFlex LSC-8000 (Hitachi, Tokyo, Japan). The recovery tests were
conducted in duplicate.
This sequential extraction was applied to each of the sliced bentonite samples
from experiment 1 which used 45Ca as a tracer. The concentration of Ca2+ ions were
calculated using the ratio of the 45Ca2+ radioactivities in the filtrates to the initial specific
radioactivities previously determined by radiation measurement.
62
2.2.5. Concentration profiles of other ions
The same supernatant from sequential extraction in experiment 1 was subjected
to ICP-AES measurement (ICPE-9000, Shimadzu, Kyoto, Japan) to determine the
concentration of Na+ ions. Each of the sliced bentonite samples was mixed with 10 ml
deionized water for 30 minutes in a closed bottle at room temperature and atmospheric
pressure. The pH of the slurry was measured using a glass electrode (Laqua F-72, Horiba,
Kyoto, Japan).
Free and total H14CO3-/14CO3
2- concentrations were determined by extraction
with saturated CaCO3 solution and 0.5 M NaHCO3, respectively. The total H14CO3-
/14CO32- concentrations were checked with direct measurement of the 14C radioactivities.
The sliced bentonite sample from experiment 2 with 14C was divided into two. A portion
of each was added with 5 ml saturated CaCO3 solution and 0.5 M NaHCO3, then they are
mixed in a shaker for 1 and 24 hour, respectively. Centrifugation, filtration, and
measurement of the concentration of H14CO3-/14CO3
2- was carried out with the same
procedure for 45Ca2+.
2.2.6. XRD and SEM/EDS Analysis
XRD analysis was carried out to get the information about the polymorph of
CaCO3 precipitates. Sliced bentonite samples from experiment 3 without tracers were
vacuum dried at 378K and then ground into powder with mortar and pestle. The XRD
analyses of the powdered samples were conducted using Rigaku RU-300 X-ray
diffractometer with Cu Kα radiation (Rigaku, Tokyo, Japan). The scanning range was 2θ
= 5 to 80 degrees with a step scan 0.05 and scanning speed of 1 s per scan.
63
The deposit of CaCO3 precipitates was analyzed with a SEM/EDS. A portion of
sliced bentonite sample from experiment 3 without tracers was placed onto a piece of
double-sided carbon tape on a SEM stub. The morphology and elemental mapping for Si,
Ca, Al, Mg and Na on sliced bentonite samples were observed in perpendicular to the
electromigration direction using JSM-7001FA (JEOL, Tokyo, Japan) with beam energy
of 15 kV.
2.3. Results
2.3.1. Sequential extraction test
Table 2-2 summarizes the result of the tested sequential extraction. The
recoveries of the free 45Ca2+ ions in the solution phase from the first and second extraction
were 92.9 and 1.3% in average, respectively. Majority of 45Ca2+ ions were extracted in
the first extraction with saturated CaCO3 solution. The amount of 45Ca2+ extracted in the
first extraction can be approximated as the free ions in the porewater. The recoveries of
extraction of exchangeable 45Ca2+ ions by HCl was 97.1% in average. This result shows
that only free Ca2+ ions were extracted in the first extraction with saturated CaCO3
solution, while exchangeable 45Ca2+ ions remained in the interlayer of montmorillonite.
Therefore, the proposed sequential extraction can be applied to distinctly determine the
amount of 45Ca2+ ions in the liquid and in the solid phase.
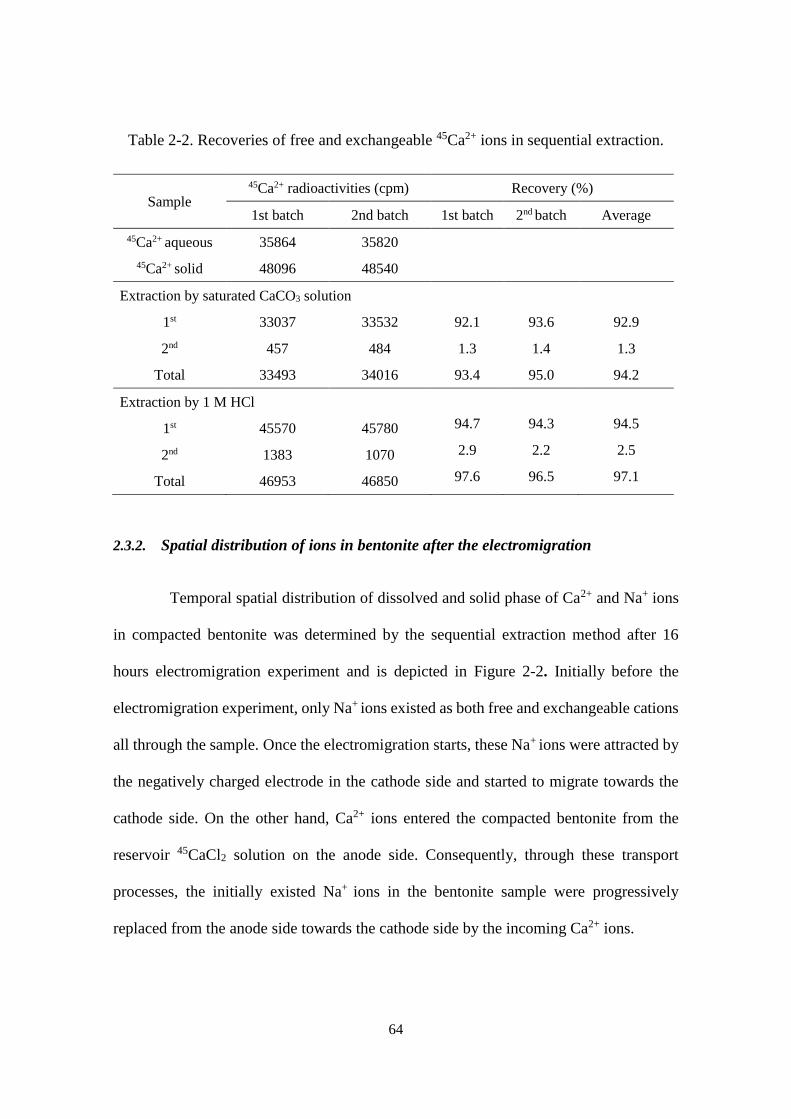
64
Table 2-2. Recoveries of free and exchangeable 45Ca2+ ions in sequential extraction.
Sample
45Ca2+ radioactivities (cpm) Recovery (%)
1st batch 2nd batch 1st batch 2nd batch Average
45Ca2+ aqueous 35864 35820
45Ca2+ solid 48096 48540
Extraction by saturated CaCO3 solution
1st 33037 33532 92.1 93.6 92.9
2nd 457 484 1.3 1.4 1.3
Total 33493 34016 93.4 95.0 94.2
Extraction by 1 M HCl
1st 45570 45780 94.7 94.3 94.5
2nd 1383 1070 2.9 2.2 2.5
Total 46953 46850 97.6 96.5 97.1
2.3.2. Spatial distribution of ions in bentonite after the electromigration
Temporal spatial distribution of dissolved and solid phase of Ca2+ and Na+ ions
in compacted bentonite was determined by the sequential extraction method after 16
hours electromigration experiment and is depicted in Figure 2-2. Initially before the
electromigration experiment, only Na+ ions existed as both free and exchangeable cations
all through the sample. Once the electromigration starts, these Na+ ions were attracted by
the negatively charged electrode in the cathode side and started to migrate towards the
cathode side. On the other hand, Ca2+ ions entered the compacted bentonite from the
reservoir 45CaCl2 solution on the anode side. Consequently, through these transport
processes, the initially existed Na+ ions in the bentonite sample were progressively
replaced from the anode side towards the cathode side by the incoming Ca2+ ions.
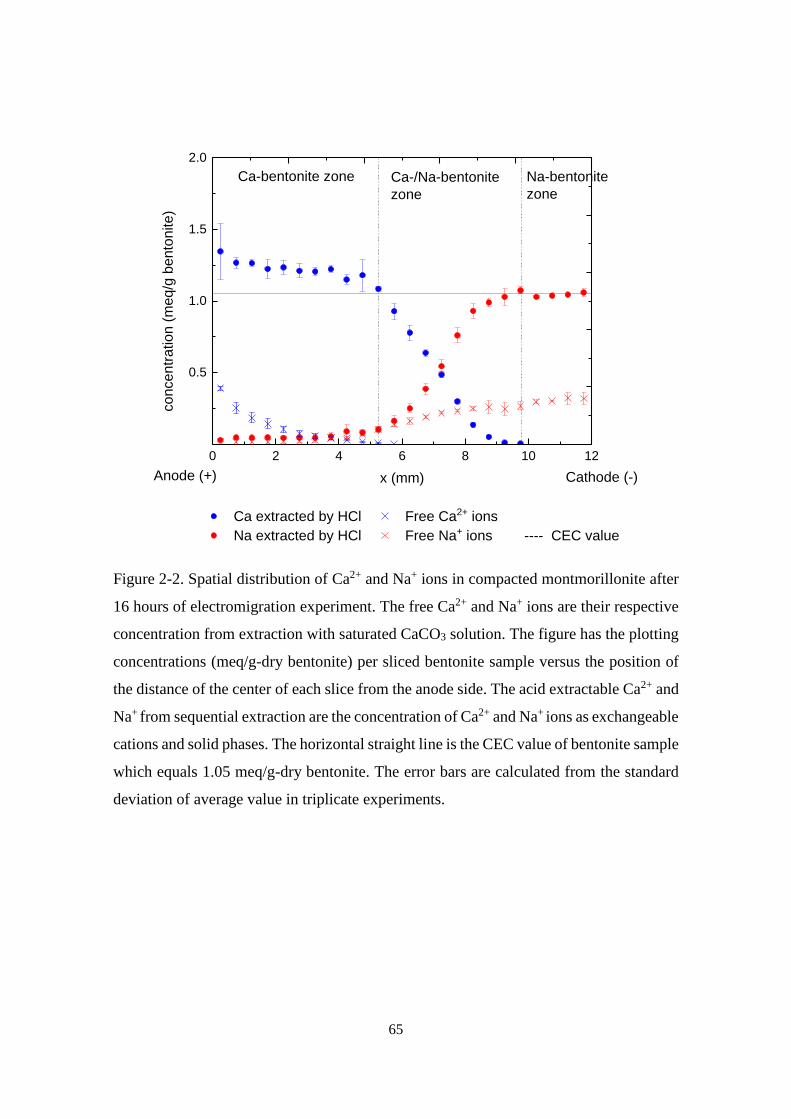
65
0 2 4 6 8 10 12
0.5
1.0
1.5
2.0
Cathode (-)Anode (+)
Ca extracted by HCl Free Ca2+ ions
Na extracted by HCl Free Na+ ions ---- CEC value
co
nce
ntr
atio
n (
me
q/g
be
nto
nite
)
x (mm)
Na-bentonite
zone
Ca-bentonite zone Ca-/Na-bentonite
zone
Figure 2-2. Spatial distribution of Ca2+ and Na+ ions in compacted montmorillonite after
16 hours of electromigration experiment. The free Ca2+ and Na+ ions are their respective
concentration from extraction with saturated CaCO3 solution. The figure has the plotting
concentrations (meq/g-dry bentonite) per sliced bentonite sample versus the position of
the distance of the center of each slice from the anode side. The acid extractable Ca2+ and
Na+ from sequential extraction are the concentration of Ca2+ and Na+ ions as exchangeable
cations and solid phases. The horizontal straight line is the CEC value of bentonite sample
which equals 1.05 meq/g-dry bentonite. The error bars are calculated from the standard
deviation of average value in triplicate experiments.
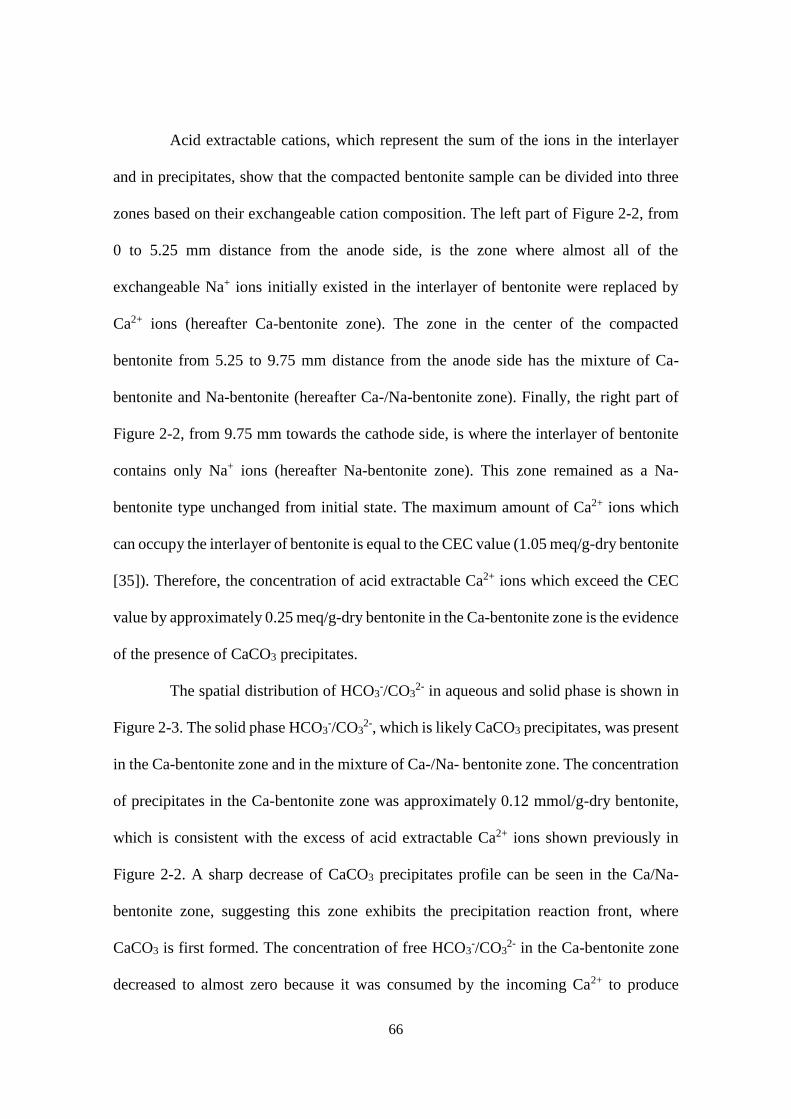
66
Acid extractable cations, which represent the sum of the ions in the interlayer
and in precipitates, show that the compacted bentonite sample can be divided into three
zones based on their exchangeable cation composition. The left part of Figure 2-2, from
0 to 5.25 mm distance from the anode side, is the zone where almost all of the
exchangeable Na+ ions initially existed in the interlayer of bentonite were replaced by
Ca2+ ions (hereafter Ca-bentonite zone). The zone in the center of the compacted
bentonite from 5.25 to 9.75 mm distance from the anode side has the mixture of Ca-
bentonite and Na-bentonite (hereafter Ca-/Na-bentonite zone). Finally, the right part of
Figure 2-2, from 9.75 mm towards the cathode side, is where the interlayer of bentonite
contains only Na+ ions (hereafter Na-bentonite zone). This zone remained as a Na-
bentonite type unchanged from initial state. The maximum amount of Ca2+ ions which
can occupy the interlayer of bentonite is equal to the CEC value (1.05 meq/g-dry bentonite
[35]). Therefore, the concentration of acid extractable Ca2+ ions which exceed the CEC
value by approximately 0.25 meq/g-dry bentonite in the Ca-bentonite zone is the evidence
of the presence of CaCO3 precipitates.
The spatial distribution of HCO3-/CO3
2- in aqueous and solid phase is shown in
Figure 2-3. The solid phase HCO3-/CO3
2-, which is likely CaCO3 precipitates, was present
in the Ca-bentonite zone and in the mixture of Ca-/Na- bentonite zone. The concentration
of precipitates in the Ca-bentonite zone was approximately 0.12 mmol/g-dry bentonite,
which is consistent with the excess of acid extractable Ca2+ ions shown previously in
Figure 2-2. A sharp decrease of CaCO3 precipitates profile can be seen in the Ca/Na-
bentonite zone, suggesting this zone exhibits the precipitation reaction front, where
CaCO3 is first formed. The concentration of free HCO3-/CO3
2- in the Ca-bentonite zone
decreased to almost zero because it was consumed by the incoming Ca2+ to produce
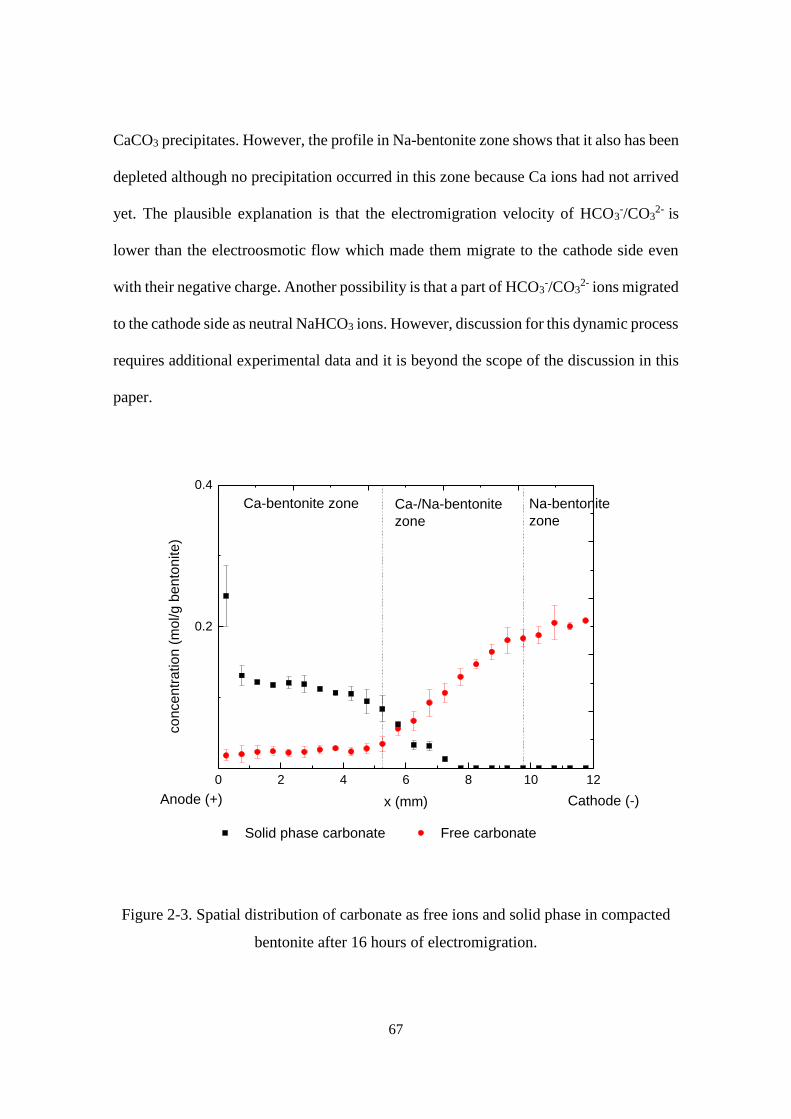
67
CaCO3 precipitates. However, the profile in Na-bentonite zone shows that it also has been
depleted although no precipitation occurred in this zone because Ca ions had not arrived
yet. The plausible explanation is that the electromigration velocity of HCO3-/CO3
2- is
lower than the electroosmotic flow which made them migrate to the cathode side even
with their negative charge. Another possibility is that a part of HCO3-/CO3
2- ions migrated
to the cathode side as neutral NaHCO3 ions. However, discussion for this dynamic process
requires additional experimental data and it is beyond the scope of the discussion in this
paper.
0 2 4 6 8 10 12
0.2
0.4
Cathode (-)Anode (+)
Solid phase carbonate Free carbonate
co
ncen
tratio
n (
mol/g b
ento
nite)
x (mm)
Na-bentonite
zone
Ca-bentonite zone Ca-/Na-bentonite
zone
Figure 2-3. Spatial distribution of carbonate as free ions and solid phase in compacted
bentonite after 16 hours of electromigration.
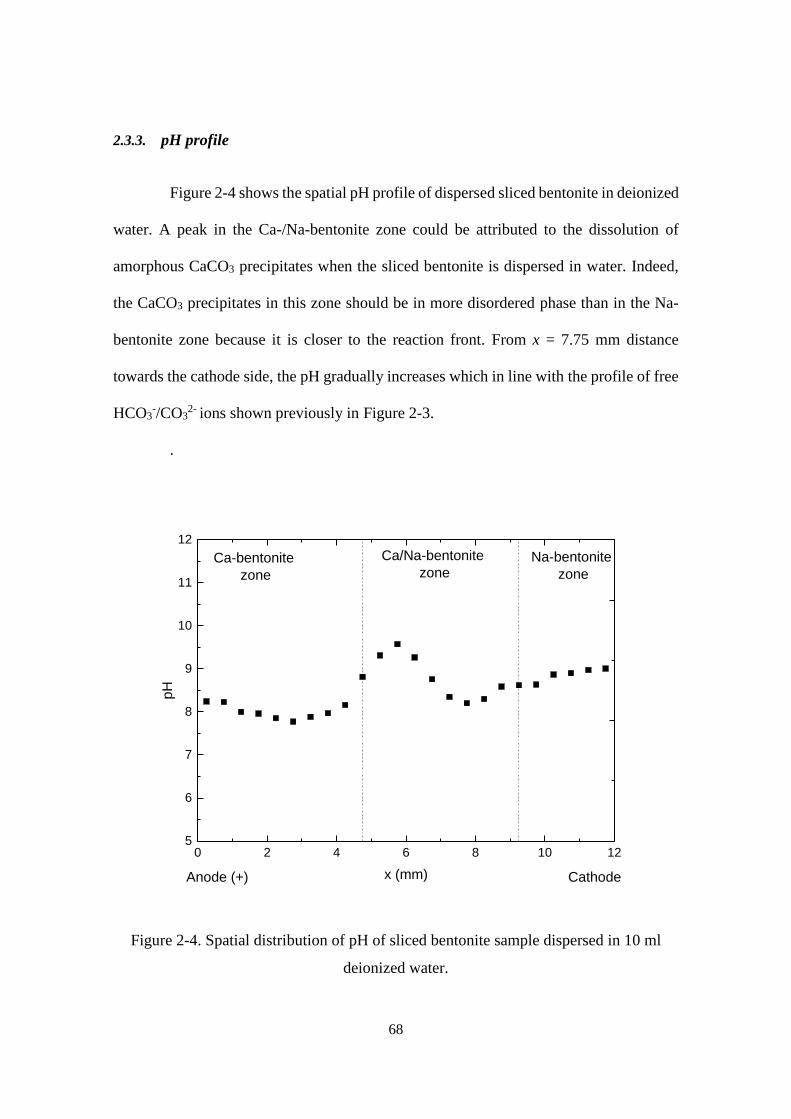
68
2.3.3. pH profile
Figure 2-4 shows the spatial pH profile of dispersed sliced bentonite in deionized
water. A peak in the Ca-/Na-bentonite zone could be attributed to the dissolution of
amorphous CaCO3 precipitates when the sliced bentonite is dispersed in water. Indeed,
the CaCO3 precipitates in this zone should be in more disordered phase than in the Na-
bentonite zone because it is closer to the reaction front. From x = 7.75 mm distance
towards the cathode side, the pH gradually increases which in line with the profile of free
HCO3-/CO3
2- ions shown previously in Figure 2-3.
.
0 2 4 6 8 10 125
6
7
8
9
10
11
12
Na-bentonite
zoneCa-bentonite
zone
Ca/Na-bentonite
zone
CathodeAnode (+)
pH
x (mm)
Figure 2-4. Spatial distribution of pH of sliced bentonite sample dispersed in 10 ml
deionized water.
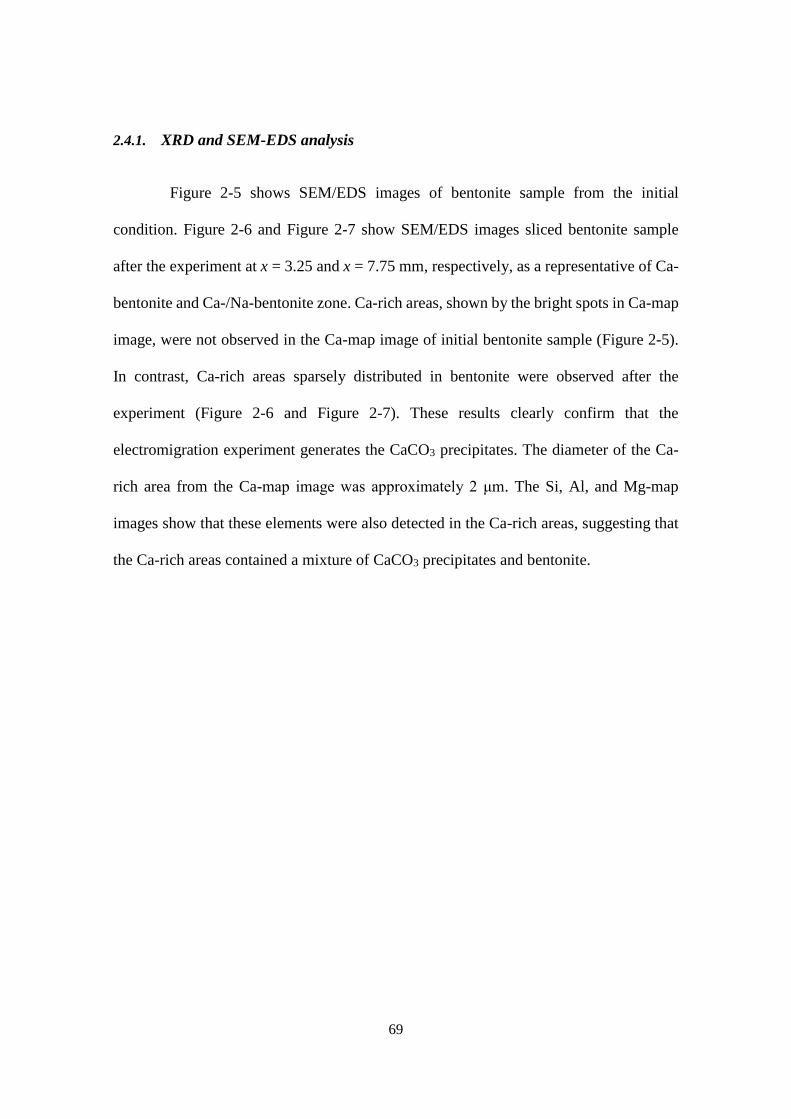
69
2.4.1. XRD and SEM-EDS analysis
Figure 2-5 shows SEM/EDS images of bentonite sample from the initial
condition. Figure 2-6 and Figure 2-7 show SEM/EDS images sliced bentonite sample
after the experiment at x = 3.25 and x = 7.75 mm, respectively, as a representative of Ca-
bentonite and Ca-/Na-bentonite zone. Ca-rich areas, shown by the bright spots in Ca-map
image, were not observed in the Ca-map image of initial bentonite sample (Figure 2-5).
In contrast, Ca-rich areas sparsely distributed in bentonite were observed after the
experiment (Figure 2-6 and Figure 2-7). These results clearly confirm that the
electromigration experiment generates the CaCO3 precipitates. The diameter of the Ca-
rich area from the Ca-map image was approximately 2 μm. The Si, Al, and Mg-map
images show that these elements were also detected in the Ca-rich areas, suggesting that
the Ca-rich areas contained a mixture of CaCO3 precipitates and bentonite.
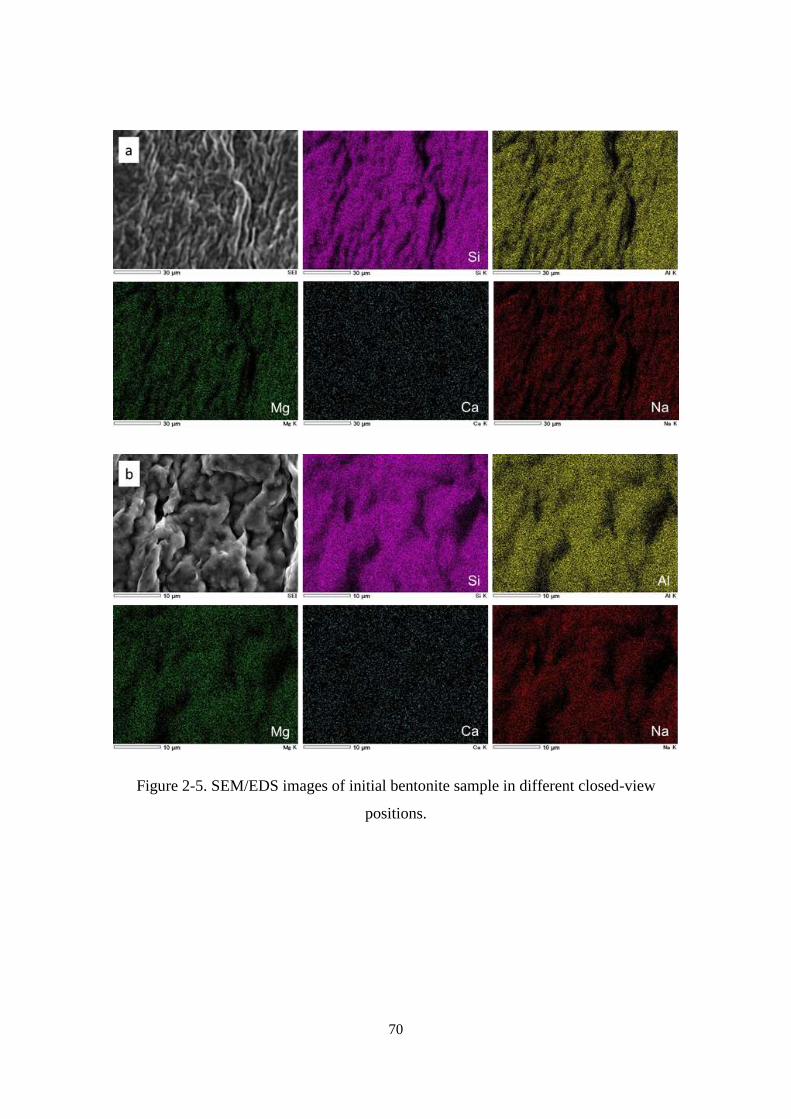
70
Figure 2-5. SEM/EDS images of initial bentonite sample in different closed-view
positions.
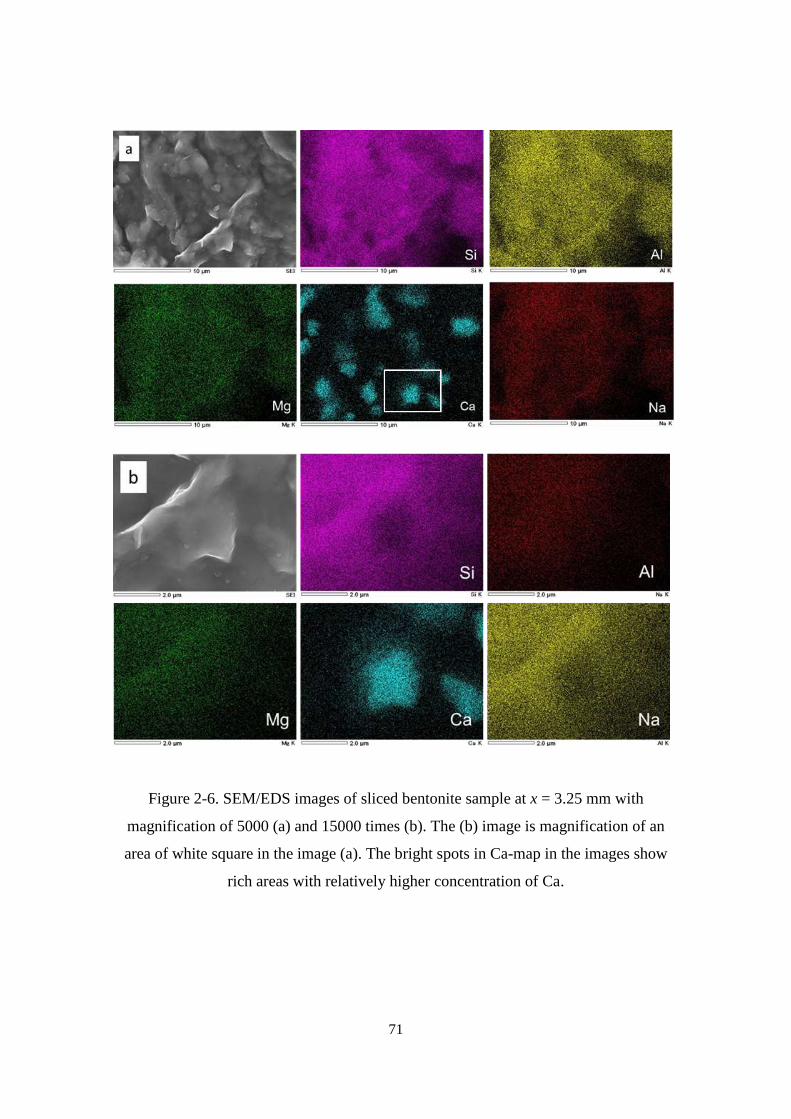
71
Figure 2-6. SEM/EDS images of sliced bentonite sample at x = 3.25 mm with
magnification of 5000 (a) and 15000 times (b). The (b) image is magnification of an
area of white square in the image (a). The bright spots in Ca-map in the images show
rich areas with relatively higher concentration of Ca.
72
Figure 2-7. SEM/EDS images of sliced bentonite sample at x = 7.75 mm with
magnification of 2200 (a) and 15000 times (b). The (b) image is magnification of an
area of white square in the image (a). The bright spots in Ca-map in the images show
rich areas with relatively higher concentration of Ca.
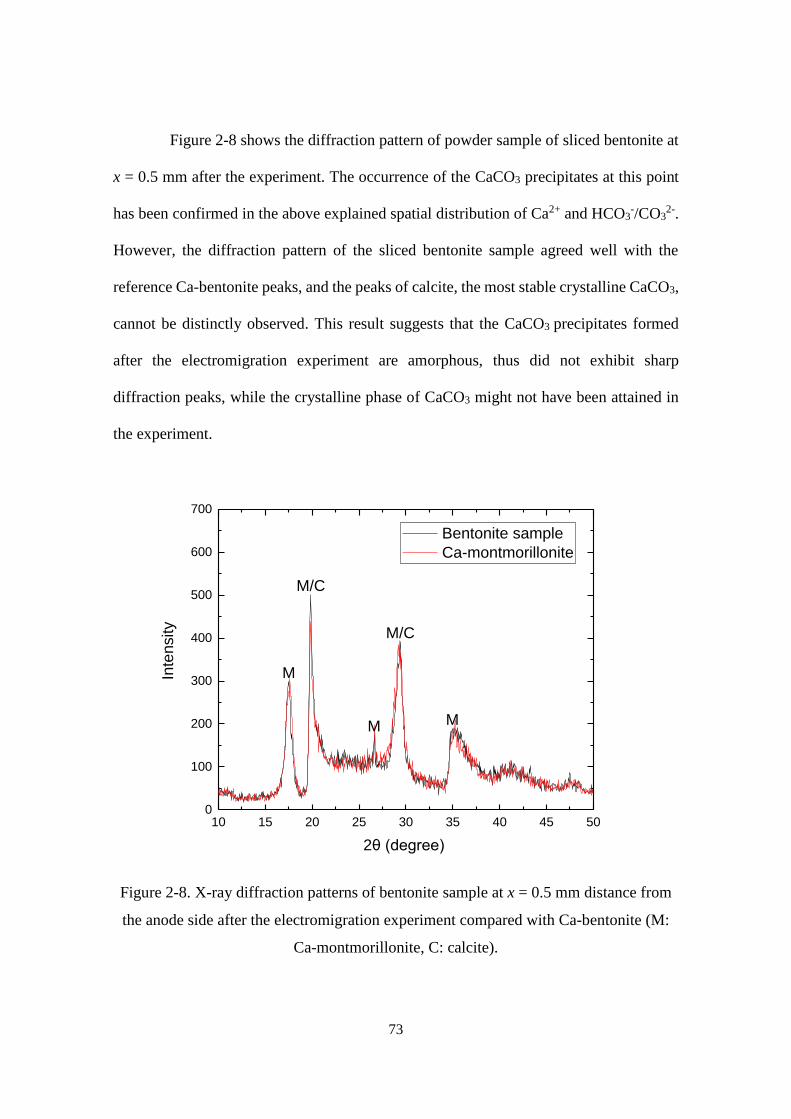
73
Figure 2-8 shows the diffraction pattern of powder sample of sliced bentonite at
x = 0.5 mm after the experiment. The occurrence of the CaCO3 precipitates at this point
has been confirmed in the above explained spatial distribution of Ca2+ and HCO3-/CO3
2-.
However, the diffraction pattern of the sliced bentonite sample agreed well with the
reference Ca-bentonite peaks, and the peaks of calcite, the most stable crystalline CaCO3,
cannot be distinctly observed. This result suggests that the CaCO3 precipitates formed
after the electromigration experiment are amorphous, thus did not exhibit sharp
diffraction peaks, while the crystalline phase of CaCO3 might not have been attained in
the experiment.
10 15 20 25 30 35 40 45 500
100
200
300
400
500
600
700
M
M/C
M
M/C
M
Inte
nsity
2θ (degree)
Bentonite sample
Ca-montmorillonite
Figure 2-8. X-ray diffraction patterns of bentonite sample at x = 0.5 mm distance from
the anode side after the electromigration experiment compared with Ca-bentonite (M:
Ca-montmorillonite, C: calcite).
74
2.4. Discussion
2.4.1. Estimation of mean activity coefficient from electromigration experiment
After CaCO3 precipitated, the porewater should be in equillibrium with respect
to CaCO3 precipitates. It implies that the IAP of Ca2+ and CO32- is equal to the Ksp of
CaCO3 precipitates when assuming the activity of solid phase CaCO3 is unity, expressed
by:
𝐼𝐴𝑃 = [𝐶𝑎2+]𝛾𝐶𝑎2+ [𝐶𝑂32−] 𝛾𝐶𝑂32− = 𝐾𝑠𝑝 CaCO3 (2-1)
where [Ca2+] and [CO32-] are the concentration of Ca2+ and CO3
2- ions, respectively,
𝛾𝐶𝑎2+and 𝛾𝐶𝑂32− are their respective activity coefficients.
According to Equation (2-1), the mean activity coefficients (γ±) of Ca2+ and
CO32- ions can be directly obtained once the concentrations of Ca2+ and CO3
2- ions, and
the value of 𝐾𝑠𝑝 CaCO3 are known. For this purpose, recalculation of the concentrations of
Ca2+ and CO32- ions expressed in units per dry weight of bentonite to molarity in
porewater is necessary. An important issue for this calculation is the distribution of water
types for estimation of the fraction of porewater in water-compacted bentonite system.
The porewater fraction for compacted bentonite with dry density of 1.0 kg/dm3 was
reported to be 0.36 ml/g dry bentonite [18]. The recalculation of the concentration of
CO32- ions is, however, not as straightforward as Ca2+ ions since the speciation of HCO3
-
/CO32- depend on the pH value. For this consideration, the concentration of CO3
2- ions is
calculated in a range of pH value for dispersed bentonite in water measured in this study.
The value for Ksp depends on the mineral type and the temperature. There are six
CaCO3 polymorphs: calcite, aragonite, vaterite, monohydrocalcite (CaCO3·H2O), ikaite
75
(CaCO3·6H2O) and amorphous CaCO3 with the solubility decreasing from the former to
the latter [37–41]. Of these CaCO3 polymorphs, the SEM/EDS images and diffraction
patterns results strongly suggest that the amorphous CaCO3 is the most likely candidate
polymorph. Recent study also reported that precipitation of CaCO3 occurred via
amorphous CaCO3 as a pre-nucleation [12]. Moreover, confinement effect could stabilize
amorphous CaCO3 [42]. The amorphous phase was also often used as solubility-limiting
solid phase in the calculation of radionuclides solubilities and speciation for a
conservative estimation [43,44]. The commonly employed Ksp value of amorphous
CaCO3 is 10-6.4 [40]. However, recent study reported that the value is 10-7.54 which is
about an order of magnitude lower than the previously reported. The author reasoned that
the previously higher Ksp value might be due to the polyamorphism of CaCO3 [45].
Therefore, those two Ksp values are used in the mean activity coefficient calculation.
The small pore effect could make the value of the Ksp value higher than in bulk
solution [46,47]. The pore size effect to the value of Ksp can be estimated as [15,48]:
𝐾𝑠𝑝𝑝𝑜𝑟𝑒
𝐾𝑠𝑝𝑏𝑢𝑙𝑘= 𝑒𝑥𝑝 (
2 𝑉𝑚 𝛾𝑠𝑙
𝑅𝑇𝑟 ) (2-2)
where Vm is the molar volume of the precipitates (m3/mol), γsl is the interfacial free energy
(J/m2), R is the ideal gas constant (J/mol·K), T is the absolute temperature (K), and r is
the radius of the pore (m). Using Vm = 3.69 × 10⁻⁵ m3/mol which calculated from calcite
density = 2.645 g/cm3 , γsl = 0.094 J/m2 [49], and r = 15.9 nm from the average pore
spacing of compacted bentonite at dry density of 1.0 kg/dm3 [18], the solubility of CaCO3
in the porewater should be increased by a factor of 1.2. This value corresponds to a
76
saturation index of 0.08 which means that the small pore effect to the value of 𝐾𝑠𝑝 CaCO3
in the porewater under the experimental conditions can be neglected.
Based thereon, the γ± values in the porewater are estimated and the resulting
values are shown in Figure 2-9. The values are estimated for the porewater composition
in the precipitation zone at x = 5.25 and 5.75 mm. Beyond x = 5.75 mm the concentration
of free Ca2+ ions were below detection limit, thus the γ± values cannot be obtained. Figure
2-9 also shows the theoretical approximation of γ± values for a direct comparison with
the experimental result. The theoretical γ± values are obtained from the average of
individual activity coefficients of Ca2+ and CO32- ions which calculated using PHREEQC
code [50]. The equilibrium constants used for speciation calculation are listed in Table
2-3. Note that the concentration of free ions corresponding to the ionic strength of the
porewater after the electromigration experiment are different than that of the initial
condition. The theoretical γ± values are different depending on the location because the
ionic strength of the porewater after the experiment is not spatially uniform. Nonetheless,
it is evident that the experimentally determined γ± values within the range of pH under
the experimental conditions are smaller than the theoretical values approximately by a
factor of three and eight, using Ksp value of 10-6.4 and 10-7.54, respectively.
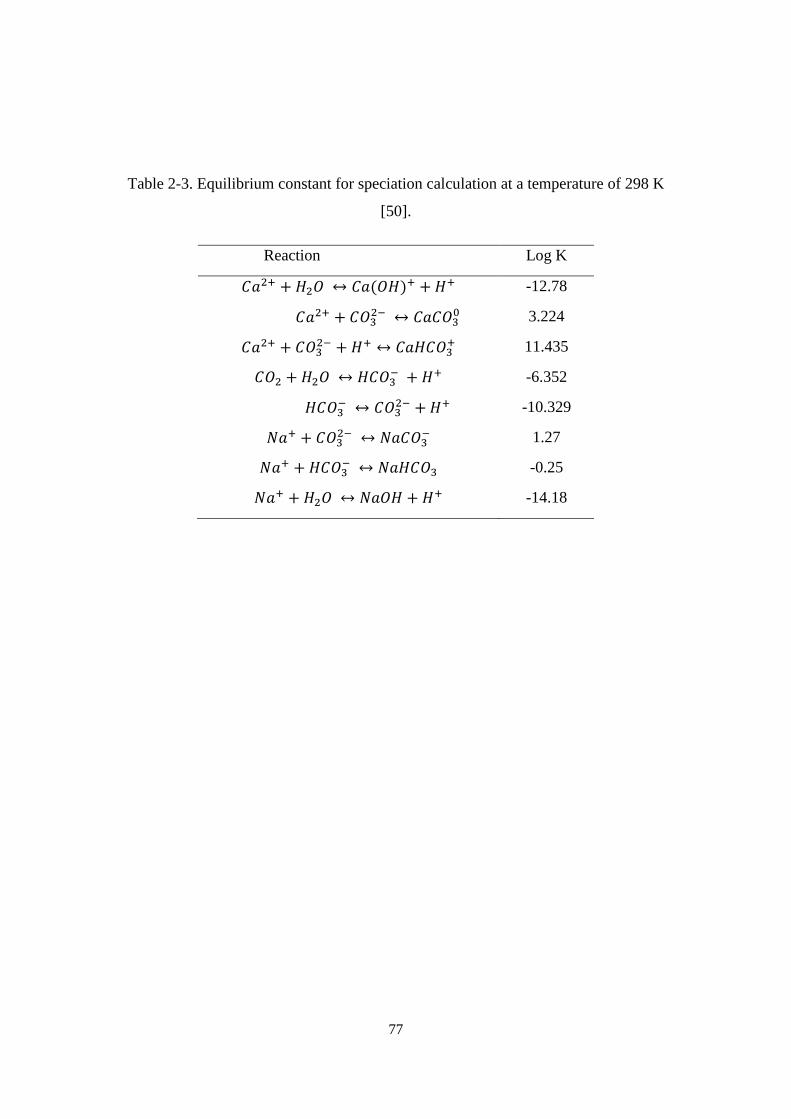
77
Table 2-3. Equilibrium constant for speciation calculation at a temperature of 298 K
[50].
Reaction Log K
𝐶𝑎2+ + 𝐻2𝑂 ↔ 𝐶𝑎(𝑂𝐻)+ +𝐻+ -12.78
𝐶𝑎2+ + 𝐶𝑂32− ↔ 𝐶𝑎𝐶𝑂3
0 3.224
𝐶𝑎2+ + 𝐶𝑂32− + 𝐻+ ↔ 𝐶𝑎𝐻𝐶𝑂3
+ 11.435
𝐶𝑂2 + 𝐻2𝑂 ↔ 𝐻𝐶𝑂3− + 𝐻+ -6.352
𝐻𝐶𝑂3− ↔ 𝐶𝑂3
2− +𝐻+ -10.329
𝑁𝑎+ + 𝐶𝑂32− ↔ 𝑁𝑎𝐶𝑂3
− 1.27
𝑁𝑎+ + 𝐻𝐶𝑂3− ↔ 𝑁𝑎𝐻𝐶𝑂3 -0.25
𝑁𝑎+ + 𝐻2𝑂 ↔ 𝑁𝑎𝑂𝐻 + 𝐻+ -14.18
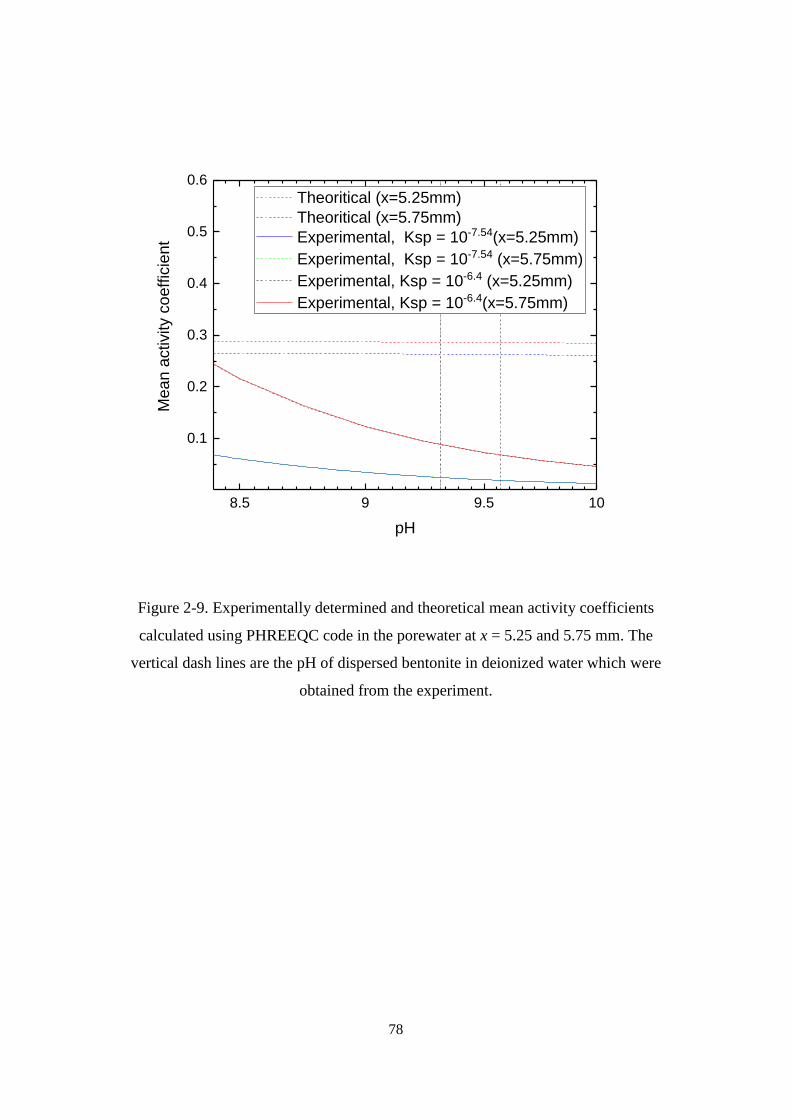
78
8.5 9 9.5 10
0.1
0.2
0.3
0.4
0.5
0.6
Mea
n a
ctivity c
oeff
icie
nt
pH
Theoritical (x=5.25mm)
Theoritical (x=5.75mm)
Experimental, Ksp = 10-7.54(x=5.25mm)
Experimental, Ksp = 10-7.54 (x=5.75mm)
Experimental, Ksp = 10-6.4 (x=5.25mm)
Experimental, Ksp = 10-6.4(x=5.75mm)
Figure 2-9. Experimentally determined and theoretical mean activity coefficients
calculated using PHREEQC code in the porewater at x = 5.25 and 5.75 mm. The
vertical dash lines are the pH of dispersed bentonite in deionized water which were
obtained from the experiment.
79
2.4.2. Porewater chemistry in bentonite
In line with previous studies [30,51], the lower activity coefficient than the
theoretical approximation could be attributed to the interaction of the bentonite surface
with the porewater. Therefore, the ions in the porewater experience stronger coulombic
interactions than in the bulk water. For example, previous study reported that the activity
of the porewater becomes less than unity when the total water content is less than 0.40
[52]. On the other hand, the results of this study show that such deviation was found for
dissolved Ca2+ and CO32- ions in bentonite with total water content of 0.65, which
corresponds to the dry density of 1.0 kg/dm3 used in this study. This difference is possibly
because of the charged ions experiencing stronger effects of the bentonite surface than
water molecules and/or the difference in ionic strength of the porewater. Nevertheless,
this result confirms that the activity coefficient in the porewater is significantly lower
than that in free water.
The fact that the experimental value of activity coefficient in the porewater is
lower than the theoretical approximation has important implications in the safety
assessment for radioactive waste geological disposal. For example, lower activity
coefficient directly related to higher solubilities of radionuclides in the porewater. The
solubilities of radionuclides are the source term for modelling fate and transport of
radionuclides through engineered barriers. Knowing the solubilities of key radionuclides
is one of the most important issues for performance assessment [53]. The activity
coefficient also has deeper impact in transport, chemical speciation and reaction in
bentonite. Therefore, further reexamination of activity coefficient approximation in the
80
porewater is critical for safety assessment in engineered barrier of radioactive waste
disposal.
2.5. Conclusions
The precipitation of CaCO3 in compacted Na-bentonite with dry density of 1.0
kg/dm3 from counter diffusion of Ca2+ and HCO3-/CO3
2- ions enhanced by electrokinetic
method were successfully achieved. The sequential extraction developed in this study
provide a practical method to distinguish the free Ca2+ions from the exchangeable and
precipitates species. After the experiment, the Na-bentonite sample changed to three
different types: Ca-, Ca-/Na-, and Na-bentonite. The occurrence of CaCO3 precipitates
was observed in the Ca- and Ca-/Na-bentonite zone. SEM/EDS images and X-ray
diffraction patterns suggested that the CaCO3 precipitates was likely amorphous phase.
The experimentally determined mean activity coefficients of Ca2+ and CO32- were at least
smaller by a factor of three than the theoretical approximation. This result raised the
importance of reexamination of the activity coefficient in the porewater, because it is a
critical parameter in safety assessment of geological disposal.
81
2.6. References
[1] Japan Atomic Energy Agency, The Federation of Electric Power Companies of
Japan. Second progress report on research and development for TRU waste
disposal in japan − repository design, safety assessment and means of
implementation in the generic phase. Tokai: JAEA; 2007. (JAEA-Review 2007-
010).
[2] International Atomic Energy Agency. Disposal of radioactive waste: Specific
safety requirements. Vienna: IAEA; 2011. (IAEA Safety Standards Series No.
SSR-5).
[3] Tinseau E, Bartier D, Hassouta L, et al. Mineralogical characterization of the
Tournemire argillite after in situ interaction with concretes. Waste Manag.
2006;26(7):789–800.
[4] Gaucher EC, Blanc P. Cement/clay interactions - A review: Experiments, natural
analogues, and modeling. Waste Manag. 2006;26(7):776–788.
[5] Jenni A, Mäder U, Lerouge C, et al. In situ interaction between different concretes
and Opalinus Clay. Phys. Chem. Earth. 2014;70–71:71–83.
[6] Moyce EBA, Rochelle C, Morris K, et al. Rock alteration in alkaline cement waters
over 15 years and its relevance to the geological disposal of nuclear waste. Appl.
Geochemistry. 2014;50:91–105.
[7] Steefel CI, Lichtner PC. Diffusion and reaction in rock matrix bordering a
hyperalkaline fluid-filled fracture. Geochim. Cosmochim. Acta.
1994;58(17):3595–3612.
82
[8] Gaboreau S, Prêt D, Tinseau E, et al. 15 years of in situ cement-argillite interaction
from Tournemire URL: Characterisation of the multi-scale spatial heterogeneities
of pore space evolution. Appl. Geochemistry. 2011;26(12):2159–2171.
[9] Smith KF, Bryan ND, Swinburne AN, et al. U(VI) behaviour in hyperalkaline
calcite systems. Geochim. Cosmochim. Acta. 2015;148:343–359.
[10] Hellebrandt SE, Hofmann S, Jordan N, et al. Incorporation of Eu(III) into calcite
under recrystallization conditions. Sci. Rep. 2016;6:1–10.
[11] Morse JW, Arvidson RS, Lüttge A. Calcium carbonate formation and dissolution.
Chem. Rev. 2007;107(2):342–381.
[12] Gebauer D, Völkel A, Cölfen H. Supporting Materials: Stable prenucleation
calcium carbonate clusters. Science. 2008;322(5909):1819–1822.
[13] Tartakovsky AM, Redden G, Lichtner PC, et al. Mixing-induced precipitation :
Experimental study and multiscale numerical analysis. Water Resour. Res.
2008;44:1–19.
[14] Redden G, Fox D, Zhang C, et al. CaCO3 precipitation, transport and sensing in
porous media with in situ generation of reactants. Environ. Sci. Technol.
2014;48(1):542–549.
[15] Stack AG, Fernandez-Martinez A, Allard LF, et al. Pore-size-dependent calcium
carbonate precipitation controlled by surface chemistry. Environ. Sci. Technol.
2014;48(11):6177–6183.
[16] Genovese D, Montalti M, Otálora F, et al. Role of CaCO3° neutral pair in calcium
carbonate crystallization. Cryst. Growth Des. 2016;16(8):4173–4177.
83
[17] Bourg IC, Bourg ACM, Sposito G. Modeling diffusion and adsorption in
compacted bentonite: A critical review. J. Contam. Hydrol. 2003;61(1–4):293–
302.
[18] Kozaki T, Inada K, Sato S, et al. Diffusion mechanism of chloride ions in sodium
montmorillonite. J. Contam. Hydrol. 2001;47(2–4):159–170.
[19] Van Loon LR, Glaus MA, Müller W. Anion exclusion effects in compacted
bentonites: Towards a better understanding of anion diffusion. Appl.
Geochemistry. 2007;22(11):2536–2552.
[20] Glaus MA, Frick S, Rossé R, et al. Comparative study of tracer diffusion of HTO,
22Na+ and 36Cl− in compacted kaolinite, illite and montmorillonite. Geochim.
Cosmochim. Acta. 2010;74(7):1999–2010.
[21] Stack AG. Precipitation in Pores : A Geochemical Frontier. Rev. Mineral.
Geochemistry. 2015;80(1):165–190.
[22] Tournassat C, Vinsot A, Gaucher EC, et al. Chapter 3 - Chemical conditions in
clay-rocks. In: Tournassat C, Steefel CI, Bourg IC, et al., editors. Natural and
Engineered Clay Barriers. Amsterdam (Netherlands): Elsevier; 2015.p.71–100.
[23] Vinsot A, Mettler S, Wechner S. In situ characterization of the Callovo-Oxfordian
pore water composition. Phys. Chem. Earth. 2008;33:S75–S86.
[24] Muurinen A. Development and testing of analysis methods for bentonite
porewater. Helsinki: Posiva Oy; 2001. (Working Report 2001-07).
[25] Grambow B, Landesman C, Ribet S. Nuclear waste disposal: I. Laboratory
simulation of repository properties. Appl. Geochemistry. 2014;49:237–246.
84
[26] Fernández AM, Baeyens B, Bradbury MH, et al. Analysis of the porewater
chemical composition of a Spanish compacted bentonite used in an engineered
barrier. Phys. Chem. Earth, Parts A/B/C. 2004;29(1):105–118.
[27] Appelo CAJ, Vinsot A, Mettler S, et al. Obtaining the porewater composition of a
clay rock by modeling the in- and out-diffusion of anions and cations from an in-
situ experiment. J. Contam. Hydrol. 2008;101(1–4):67–76.
[28] Fernández AM, Sánchez-Ledesma DM, Tournassat C, et al. Applying the
squeezing technique to highly consolidated clayrocks for pore water
characterisation: Lessons learned from experiments at the Mont Terri Rock
Laboratory. Appl. Geochemistry. 2014;49:2–21.
[29] Tachi Y, Ochs M, Suyama T. Integrated sorption and diffusion model for
bentonite. Part 1: clay–water interaction and sorption modeling in dispersed
systems. J. Nucl. Sci. Technol. 2014;51(10):1177–1190.
[30] Torikai Y, Sato S, Ohashi H. Thermodynamic properties of water in compacted
sodium montmorillonite. Nucl. Technol. 1996;115(1):73–80.
[31] Maes N, Moors H, Dierckx A, et al. The assessment of electromigration as a new
technique to study diffusion of radionuclides in clayey soils. J. Contam. Hydrol.
1999;36(3–4):231–247.
[32] Higashihara T, Kinoshita K, Sato S, et al. Electromigration of sodium ions and
electro-osmotic flow in water-saturated, compacted Na-montmorillonite. Appl.
Clay Sci. 2004;26(1–4):91–98.
[33] Beauwens T, De Cannière P, Moors H, et al. Studying the migration behaviour of
85
selenate in Boom Clay by electromigration. Eng. Geol. 2005;77(3–4):285–293.
[34] Tanaka S, Noda N, Sato S, et al. Electrokinetic study of migration of anions,
cations, and water in water-saturated compacted sodium montmorillonite. J. Nucl.
Sci. Technol. 2011;48(3):454–462.
[35] Tanaka S. Gypsum precipitation enhanced by electrokinetic method and porewater
chemistry in compacted montmorillonite. Appl. Clay Sci. 2018;161:482–493.
[36] Kozaki T, Fujishima A, Sato S, et al. Self-diffusion of sodium ions in compacted
sodium montmorillonite. Nucl. Technol. 1998;121(1):63–69.
[37] Plummer LN, Busenberg E. The solubilities of calcite, aragonite and vaterite in
CO2-H2O solutions between 0 and 90°C, and an evaluation of the aqueous model
for the system CaCO3-CO2-H2O. Geochim. Cosmochim. Acta. 1982;46(6):1011–
1040.
[38] Hull H, Turnbull AG. A thermochemical study of monohydrocalcite. Geochim.
Cosmochim. Acta. 1973;37(3):685–694.
[39] Kralj D, Brečević L. Dissolution kinetics and solubility of calcium carbonate
monohydrate. Colloids Surfaces A Physicochem. Eng. Asp. 1995;96(3):287–293.
[40] Brečević L, Nielsen AE. Solubility of amorphous calcium carbonate. J. Cryst.
Growth. 1989;98(3):504–510.
[41] Clarkson JR, Price TJ, Adams CJ. Role of metastable phases in the spontaneous
precipitation of calcium carbonate. J. Chem. Soc. Faraday Trans. 1992;88(2):243–
249.
[42] Wang Y, Zeng M, Meldrum FC, et al. Using confinement to study the
86
crystallisation pathway of calcium carbonate. Cryst. Growth Des.
2017;17(12):6787–6792.
[43] Takeda S, Shima S, Kimura H, et al. The aqueous solubility and speciation analysis
for uranium, neptunium and selenium by the geochemical code (EQ3/6). Tokai:
JAERI; 1995. (JAERI Research 95-069).
[44] Kim SS, Baik MH, Kang KC, et al. Solubilities of actinides in a domestic
groundwater and a bentonite porewater calculated by using PHREEQC. J. Ind.
Eng. Chem. 2008;14(6):739–746.
[45] Kellermeier M, Picker A, Kempter A, et al. A straightforward treatment of activity
in aqueous CaCO3 solutions and the consequences for nucleation theory. Adv.
Mater. 2014;26(5):752–757.
[46] Rijniers LA, Huinink HP, Pel L, et al. Experimental evidence of crystallization
pressure inside porous media. Phys. Rev. Lett. 2005;94(7):23–26.
[47] Prieto M. Nucleation and supersaturation in porous media (revisited). Mineral.
Mag. 2014;78(6):1437–1447.
[48] De Yoreo JJ, Vekilov PG. Principles of crystal nucleation and growth. Rev.
Mineral. Geochemistry. 2003;54(1):57–93.
[49] Stumm W, Morgan JJ. Aquatic chemistry: Chemical equilibria and rates in natural
waters. 3rd ed. New York (NY): Wiley; 1995.
[50] Parkhurst DL, Appelo CAJ. Description of input and examples for PHREEQC
version 3--A computer program for speciation, batch-reaction, one-dimensional
transport, and inverse geochemical calculations. Denver (CO): U.S. Geological
87
Survey; 2013.
[51] Serafeimidis K, Anagnostou G. The solubilities and thermodynamic equilibrium
of anhydrite and gypsum. Rock Mech. Rock Eng. 2014;48(1):15–31.
[52] Sato H. Thermodynamic model on swelling of bentonite buffer and backfill
materials. Phys. Chem. Earth. 2008;33:538–543.
[53] McKinley IG, Savage D. Comparison of solubility databases used for HLW
performance assessment. J. Contam. Hydrol. 1996;21(1–4):335–350.
88
3. Migration behavior of Ca2+ and carbonate ions in compacted
bentonite under electrical potential gradient
3.1. Introduction
Geological disposal is considered to be the safe and reasonable method to
dispose of high-level radioactive waste since it has an ability to isolate the waste from
geosphere for long-term [1,2]. The performance of the isolation of geological repository
relies on the multi barrier systems, which are composed of engineered and natural
barriers. Compacted bentonite is expected as buffer material in the engineered barriers
due to its favorable properties, such as high sorption capacity for radionuclides, high
swelling ability, and good durability [3–8]. However, the properties of bentonite may be
altered over time due to interaction with surrounding materials in the repository, resulting
in lower performance as a barrier [8,9].
Cementitious materials are considered as one of the important alteration sources
which can interact with the compacted bentonite. Large quantities of cementitious
materials which are used for tunnel construction in the repository will release alkali
cations, such as K+, Na+, and Ca2+ ions, to groundwater [10,11]. Chemical reaction
between bentonite and this leachate of alkali cations will lead to the mineralogical
changes of bentonite over long-period of time [12]. The leachate is also able to promote
considerable amount of CaCO3 precipitates in compacted bentonite due to reaction with
CO32- ions which can be provided from the groundwater [13]. The CaCO3 precipitation
at the interface of cement and bentonite has been studied not only in laboratory
experiment [14,15], but also in the field study [16,17].
89
The CaCO3 precipitation may affect the fate and transport of radionuclides in
bentonite. For examples, the precipitation limits the concentration of Ca2+ and
HCO3/CO32- ions in the porewater of bentonite. For some important radionuclides, their
chemical speciation, and so in turn their mobilities, are affected by the concentration of
Ca2+ and HCO3/CO32- ions [18,19]. The formation of CaCO3 precipitates in bentonite may
also affect the transport of radionuclides by porosity clogging [20–22] and coprecipitation
[23–26]. Furthermore, molecular dynamics study suggests that the mechanical strength
of bentonite decrease in the bentonite-CaCO3 system [27]. Despite this importance,
however, no study on CaCO3 precipitation in bentonite has been reported.
Precipitation of CaCO3 in porous media has been studied in well mixed,
homogenous and non-reactive systems, such as a column filling with glass beads. Even
in the idealized systems, many factors are potentially affect the CaCO3 precipitation
processes, including pore size, precipitation kinetics and transport of ions [28]. For
examples, the study on CaCO3 precipitation in glass beads revealed that the precipitation
preferentially occurs in larger pores [29], which may be caused by the high ratio of Ca2+
to CO32- ions in the solution due to the effect of negatively surface charge [28,30,31]. On
the other hand, the study on CaCO3 precipitation in gelatin gel suggested that smaller
pores lead to the formation of smaller size of CaCO3 crystal with more complex
morphology and tend to have aggregates rather than a single crystal [32]. The study on
CaCO3 precipitation in polyacrylamide gel formed by diffusion mixing suggested that
slower rate of CaCO3 precipitation is needed to explain the relatively wider precipitation
zone in the experiment than that is predicted by simulation [33].
The objective of this study is to investigate the transport of ions in compacted
bentonite during the precipitation of CaCO3. Two kinds of electromigration experiments
90
were carried out. The first experiment was using thin-layer 45Ca2+ and H14CO3/14CO3
2-
radiotracer sources to determine electromigration parameters of individual Ca2+ and
HCO3/CO32- ions. The second experiment was carried out using the same method as in
Chapter 2 to form CaCO3 precipitation in compacted bentonite. The Ca2+ ions from the
anode reservoir were introduced to compacted bentonite sample initially saturated with a
solution containing HCO3-/CO3
2- ions. The reaction occurred as the two ions come in
contact in bentonite, forming CaCO3 precipitates. The experiments were carried out at
different duration times, after which the spatial distributions of ions in bentonite sample
were determined. The dynamics of reaction front of the CaCO3 precipitation in compacted
bentonite under was investigated and the transport of Ca2+ and HCO3/CO32- as the reacting
ions during the precipitation were discussed.
3.2. Method
3.2.1. Preparation of Saturated Compacted Na-Bentonite
Kunipia F (Kunimine Industries Co., Tokyo, Japan) was mixed with 1 M NaCl to
obtain a homoionized Na-bentonite. The excess salt was removed by dialysis method in
deionized water. The detailed procedure is described elsewhere [34]. Dry Na-bentonite
with particle size 75-150 μm was packed in an acrylic resin cells with both inner diameter
and length of 20 mm to have the dry density of 1.0 kg/dm3. Each one end of the inner
cylindrical cell was closed with stainless steel sintered filter having a pore size of 2 μm.
The cells containing compacted bentonite sample were immersed in 0.7 M NaHCO3
solution in a closed container for 30 days at room temperature and atmospheric pressure.
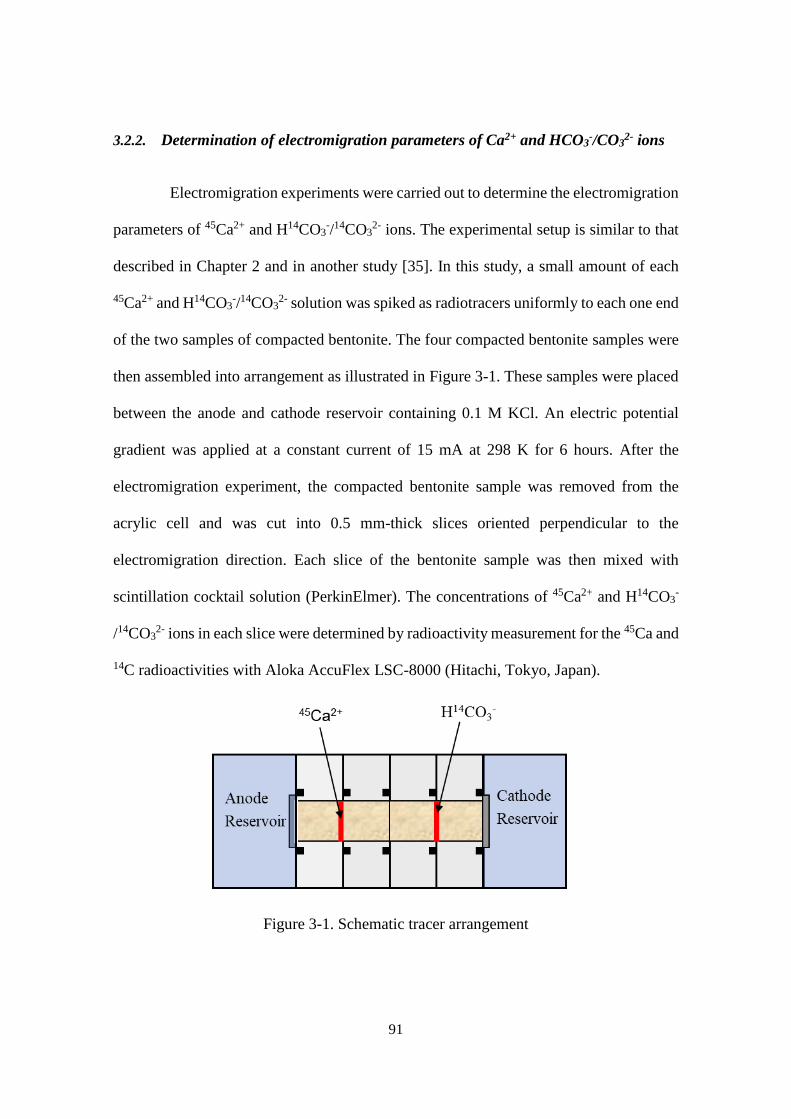
91
3.2.2. Determination of electromigration parameters of Ca2+ and HCO3-/CO3
2- ions
Electromigration experiments were carried out to determine the electromigration
parameters of 45Ca2+ and H14CO3-/14CO3
2- ions. The experimental setup is similar to that
described in Chapter 2 and in another study [35]. In this study, a small amount of each
45Ca2+ and H14CO3-/14CO3
2- solution was spiked as radiotracers uniformly to each one end
of the two samples of compacted bentonite. The four compacted bentonite samples were
then assembled into arrangement as illustrated in Figure 3-1. These samples were placed
between the anode and cathode reservoir containing 0.1 M KCl. An electric potential
gradient was applied at a constant current of 15 mA at 298 K for 6 hours. After the
electromigration experiment, the compacted bentonite sample was removed from the
acrylic cell and was cut into 0.5 mm-thick slices oriented perpendicular to the
electromigration direction. Each slice of the bentonite sample was then mixed with
scintillation cocktail solution (PerkinElmer). The concentrations of 45Ca2+ and H14CO3-
/14CO32- ions in each slice were determined by radioactivity measurement for the 45Ca and
14C radioactivities with Aloka AccuFlex LSC-8000 (Hitachi, Tokyo, Japan).
Figure 3-1. Schematic tracer arrangement
92
The spatial distribution of Ca2+ and HCO3-/CO32- ions at a certain time in
electromigration experiment can be expressed by the one-dimensional advection
dispersion equation as follows [35,36]:
𝐶𝑟 = 1
2√𝜋𝐷ℎ𝑡𝑒𝑥𝑝 {−
(𝑥−𝑉𝑎𝑡)2
4𝐷ℎ𝑡} (3- 1)
where Cr is the relative concentration, Dh is the hydrodynamic dispersion (m2/s), and Va
is the apparent migration velocity (m/s). The Dh and Va values were obtained from least
square fits of Equation (3-1).
3.2.3. Electromigration of Ca2+ with HCO3-/CO3
2- ions during precipitation of CaCO3
Electromigration reaction experiments of Ca2+ with HCO3-/CO3
2- ions, as
illustrated in Figure 3-2, were carried out to form CaCO3 precipitates in compacted
montmorillonite. The Na-bentonite which saturated with 0.7 M NaHCO3 was placed
between two reservoirs containing 1 M CaCl2 and 0.7 M NaHCO3 solutions, respectively.
A constant current of 5 mA was applied from CaCl2 reservoir (anode side) to NaHCO3
reservoir (cathode side) at a temperature of 298 K. Two kinds of electromigration
experiments were carried out, using 45Ca and 14C radio-tracers. After the prescribed time,
the bentonite sample was sliced into 5 mm thickness perpendicular to electromigration
direction. The detail procedure of the electromigration reaction has been described
previously in Chapter 2.
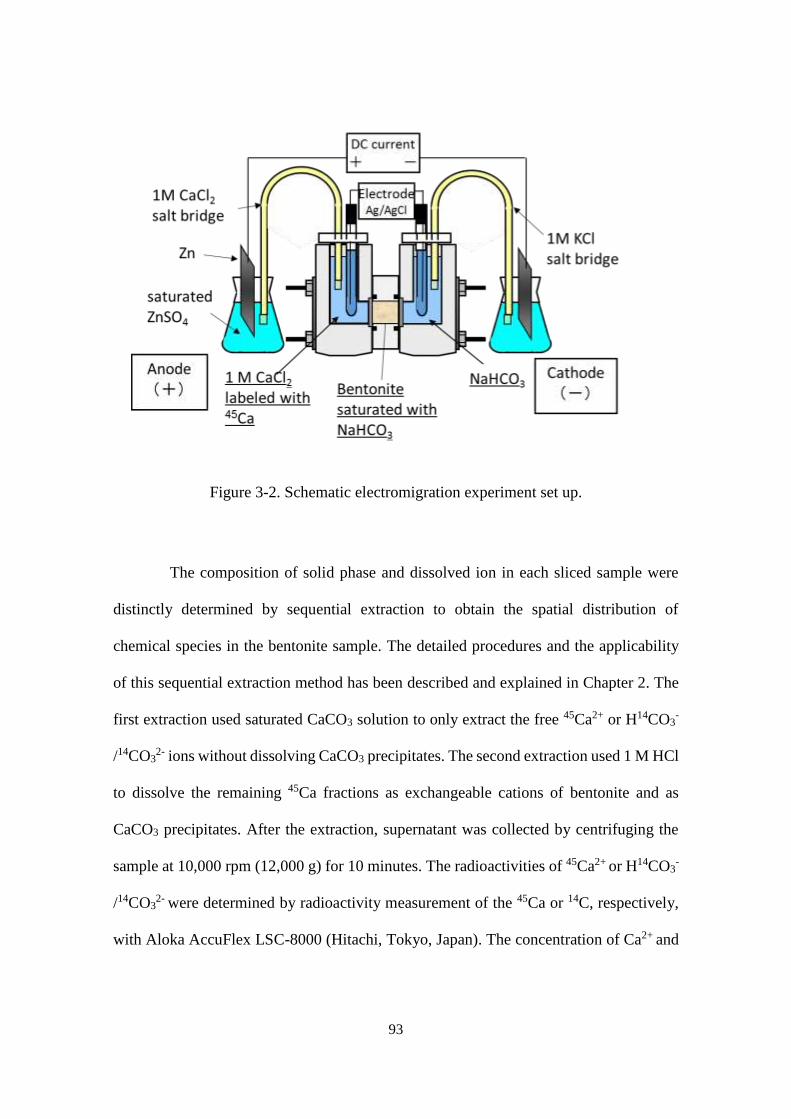
93
Figure 3-2. Schematic electromigration experiment set up.
The composition of solid phase and dissolved ion in each sliced sample were
distinctly determined by sequential extraction to obtain the spatial distribution of
chemical species in the bentonite sample. The detailed procedures and the applicability
of this sequential extraction method has been described and explained in Chapter 2. The
first extraction used saturated CaCO3 solution to only extract the free 45Ca2+ or H14CO3-
/14CO32- ions without dissolving CaCO3 precipitates. The second extraction used 1 M HCl
to dissolve the remaining 45Ca fractions as exchangeable cations of bentonite and as
CaCO3 precipitates. After the extraction, supernatant was collected by centrifuging the
sample at 10,000 rpm (12,000 g) for 10 minutes. The radioactivities of 45Ca2+ or H14CO3-
/14CO32- were determined by radioactivity measurement of the 45Ca or 14C, respectively,
with Aloka AccuFlex LSC-8000 (Hitachi, Tokyo, Japan). The concentration of Ca2+ and
94
HCO3-/CO3
2- ions were calculated using their initial specific radioactivities, which was
determined before uses.
The pH value in the porewater of compacted bentonite was estimated from the
pH value measured for bentonite slurry. For this purpose, the same electromigration
experiments without radiotracer was conducted under the same experimental conditions
as the precipitation experiment. Each of the sliced bentonite samples was mixed with 10
ml deionized water for 30 minutes in a closed bottle at room temperature and atmospheric
pressure. The pH of the slurry was measured using a glass electrode (Laqua F-72, Horiba,
Kyoto, Japan).
95
3.3. Result
3.3.1. Electromigration parameters of Ca2+ and HCO3-/CO3
2- ions
Spatial distribution of concentration of 45Ca2+ and H14CO3-/14CO3
2- ions after
electromigration is depicted in Figure 3-3. The figure shows that under the influence of
electrical potential gradient, Ca2+ ions migrate towards the cathode side due to their
positive charge. On the other hand, HCO3-/CO3
2- ions relatively unmoved from their
initial position despite their negative charge. It can be explained because migration of
ions under the influence of electrical potential gradient is governed not only by
electromigration, but also electroosmosis flow as described as follows:
𝑣𝑎 = 𝑣𝑒𝑚 + 𝑣𝐸𝑂𝐹 (3- 2)
where va is the apparent migration velocity, vem is the electromigration velocity and v𝐸𝑂𝐹
is the electroosmosis flow. The equation implies that the H14CO3-/14CO3
2- ions can stay
on the initial position or move from anode to cathode regardless of their negative charge
if the electroosmotic flow is equal or higher than electromigration velocity.
96
Table 3-1 summarizes the electromigration parameters of 45Ca2+ and H14CO3-
/14CO32- ions in compacted bentonite. The values were obtained from least-square fit of
Equation (3-1) to the corresponding concentration profile in Figure 3-3. The apparent
migration velocity (𝜇𝑎) of individual Ca2+ and HCO3-/CO3
2- ions is calculated by the
following expression:
𝑣𝑎 = 𝜇𝑎 𝐸 (3- 3)
where E is the electrical potential gradient (v/m). The apparent mobility of 45Ca2+ ions
under the experimental conditions is approximately one order of magnitude greater than
that of HCO3-/CO3
2- ions.
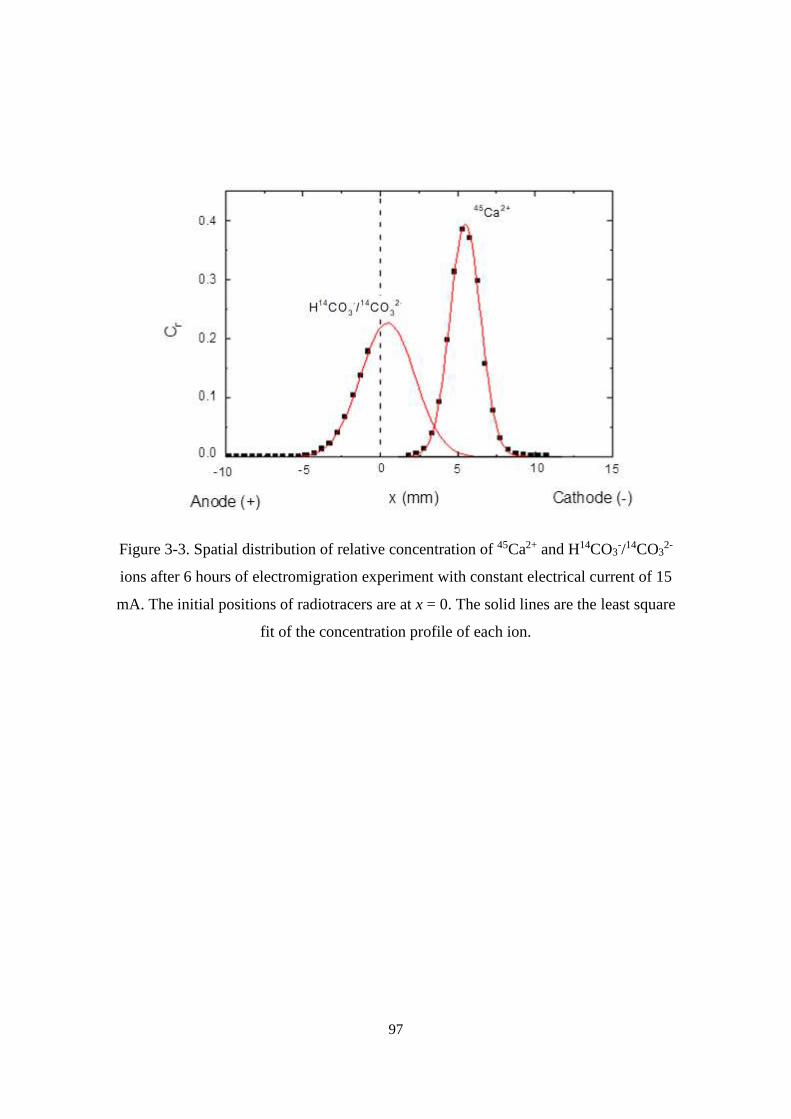
97
Figure 3-3. Spatial distribution of relative concentration of 45Ca2+ and H14CO3-/14CO3
2-
ions after 6 hours of electromigration experiment with constant electrical current of 15
mA. The initial positions of radiotracers are at x = 0. The solid lines are the least square
fit of the concentration profile of each ion.
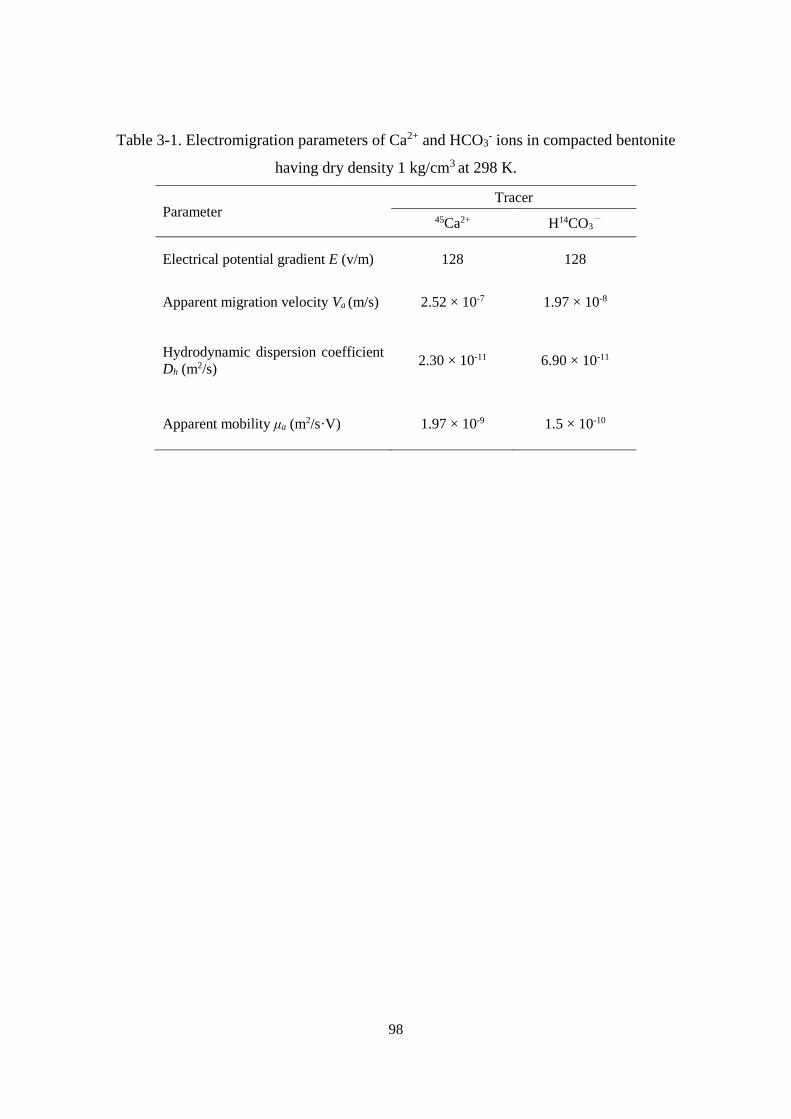
98
Table 3-1. Electromigration parameters of Ca2+ and HCO3- ions in compacted bentonite
having dry density 1 kg/cm3 at 298 K.
Parameter Tracer
45Ca2+ H14CO3-
Electrical potential gradient E (v/m) 128 128
Apparent migration velocity Va (m/s) 2.52 × 10⁻⁷ 1.97 × 10⁻⁸
Hydrodynamic dispersion coefficient
Dh (m2/s) 2.30 × 10⁻¹¹ 6.90 × 10⁻¹¹
Apparent mobility μa (m2/s·V) 1.97 × 10⁻⁹ 1.5 × 10⁻¹⁰
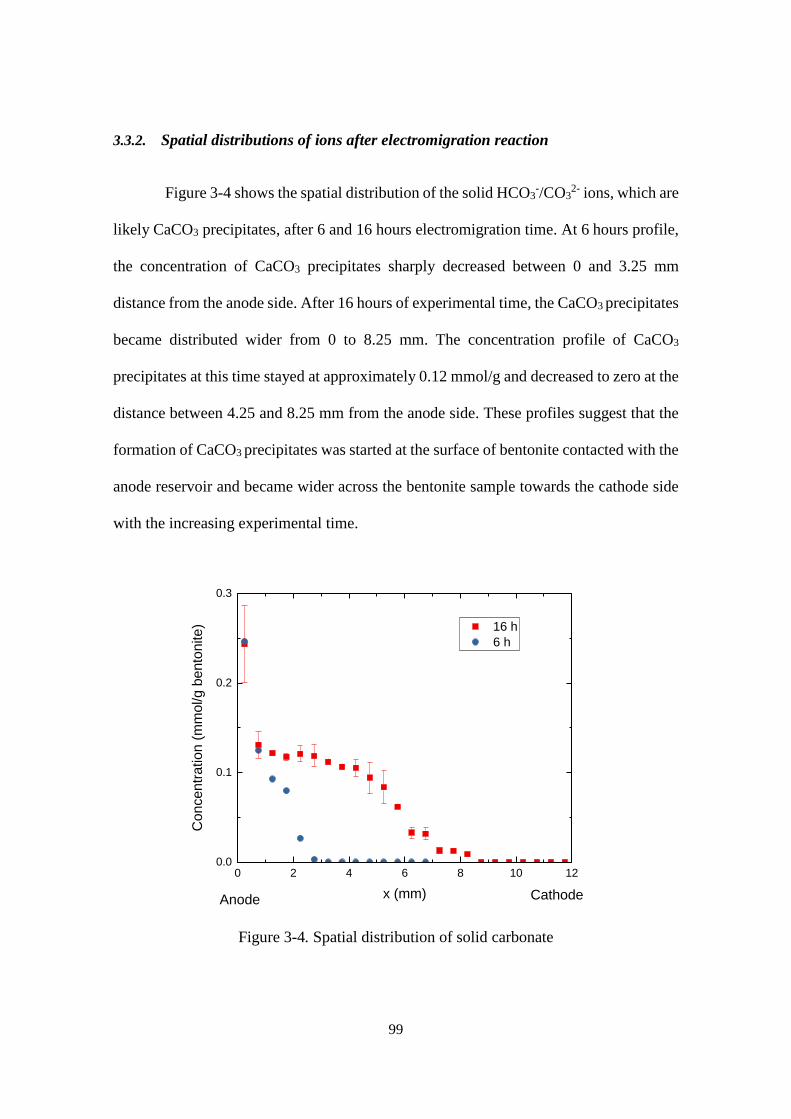
99
3.3.2. Spatial distributions of ions after electromigration reaction
Figure 3-4 shows the spatial distribution of the solid HCO3-/CO3
2- ions, which are
likely CaCO3 precipitates, after 6 and 16 hours electromigration time. At 6 hours profile,
the concentration of CaCO3 precipitates sharply decreased between 0 and 3.25 mm
distance from the anode side. After 16 hours of experimental time, the CaCO3 precipitates
became distributed wider from 0 to 8.25 mm. The concentration profile of CaCO3
precipitates at this time stayed at approximately 0.12 mmol/g and decreased to zero at the
distance between 4.25 and 8.25 mm from the anode side. These profiles suggest that the
formation of CaCO3 precipitates was started at the surface of bentonite contacted with the
anode reservoir and became wider across the bentonite sample towards the cathode side
with the increasing experimental time.
0 2 4 6 8 10 120.0
0.1
0.2
0.3
Anode Cathode
16 h
6 h
Co
ncen
tra
tion
(m
mol/g
be
nto
nite
)
x (mm)
Figure 3-4. Spatial distribution of solid carbonate
100
Figure 3-5 shows the concentration distributions of dissolved HCO3-/CO3
2- ions
after 6 and 16 hours electromigration time. The concentration profiles of dissolved HCO3-
/CO32- ions at 6 and 16 hours were similar in shape, but advanced towards the cathode
side in the 16 hours result. The bentonite sample can be divided into three zones based on
these concentration profiles. The first zone is where the concentration of HCO3-/CO3
2-
ions is very low. This zone is located at 0 ≤ x ≤ 1.75 and at 0 ≤ x ≤ 4.25 mm for 6 and 16
hours electromigration time, respectively. The very low concentration of HCO3-/CO3
2-
ions suggesting that in this zone the HCO3-/CO3
2- ions available for the CaCO3
precipitation have been consumed by the precipitation reaction and no further reaction is
occurring in this zone (hereafter reacted zone). The second zone is where the
concentration profiles of HCO3-/CO3
2- ions show steep gradient which located at1.75 ≤ x
≤ 5.25 mm and 4.25 ≤ x ≤ 8.75 mm for 6 and 16 hours electromigration time, respectively.
The profiles suggest that HCO3-/CO3
2- ions in this zone is being consumed by the reaction
of CaCO3 precipitation (hereafter reaction zone). The third zone is where the
concentration profiles of HCO3-/CO3
2- ions approximately constant at high concentration.
This zone is located from x ≥ 5.25 and x ≥ 9.25 mm for 6 and 16 hours experimental time,
respectively. This zone is the unreacted bentonite zone where the reaction of CaCO3
precipitation has not been started (hereafter unreacted zone).
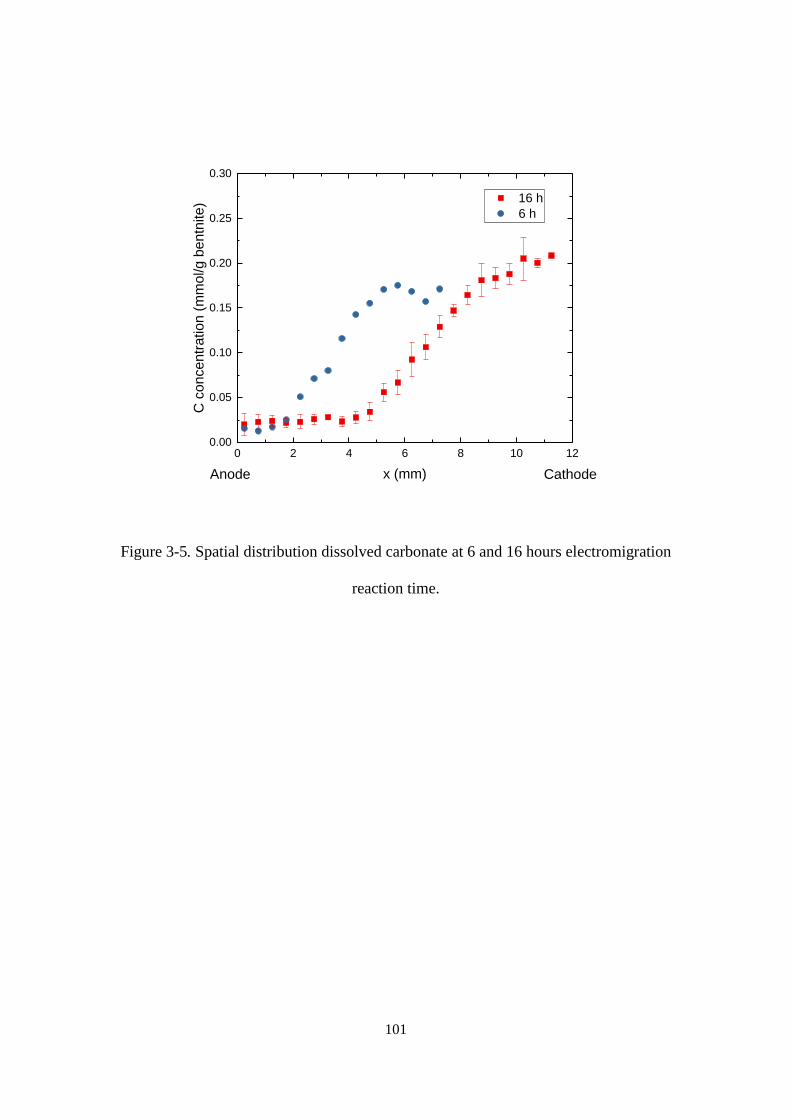
101
0 2 4 6 8 10 120.00
0.05
0.10
0.15
0.20
0.25
0.30
Anode Cathode
16 h
6 h
C c
once
ntr
atio
n (
mm
ol/g
be
ntn
ite)
x (mm)
Figure 3-5. Spatial distribution dissolved carbonate at 6 and 16 hours electromigration
reaction time.
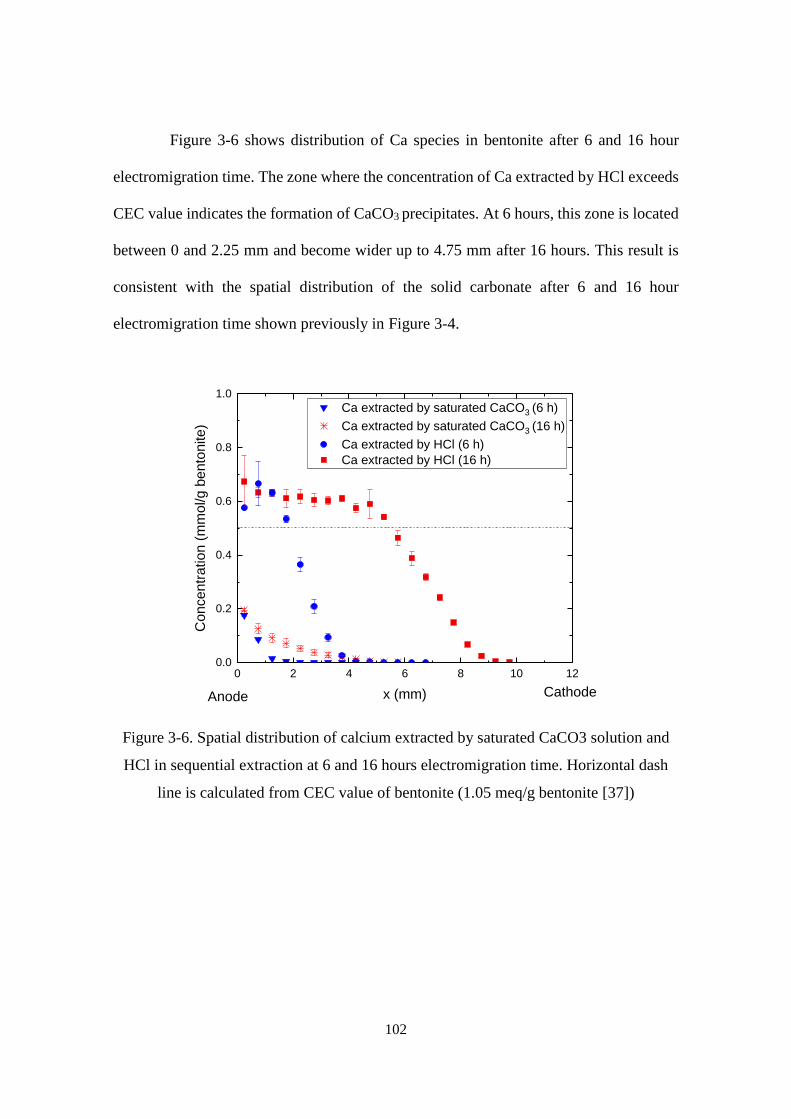
102
Figure 3-6 shows distribution of Ca species in bentonite after 6 and 16 hour
electromigration time. The zone where the concentration of Ca extracted by HCl exceeds
CEC value indicates the formation of CaCO3 precipitates. At 6 hours, this zone is located
between 0 and 2.25 mm and become wider up to 4.75 mm after 16 hours. This result is
consistent with the spatial distribution of the solid carbonate after 6 and 16 hour
electromigration time shown previously in Figure 3-4.
0 2 4 6 8 10 120.0
0.2
0.4
0.6
0.8
1.0
CathodeAnode
Ca extracted by saturated CaCO3 (6 h)
Ca extracted by saturated CaCO3 (16 h)
Ca extracted by HCl (6 h)
Ca extracted by HCl (16 h)
Co
ncen
tra
tion
(m
mol/g
be
nto
nite
)
x (mm)
Figure 3-6. Spatial distribution of calcium extracted by saturated CaCO3 solution and
HCl in sequential extraction at 6 and 16 hours electromigration time. Horizontal dash
line is calculated from CEC value of bentonite (1.05 meq/g bentonite [37])
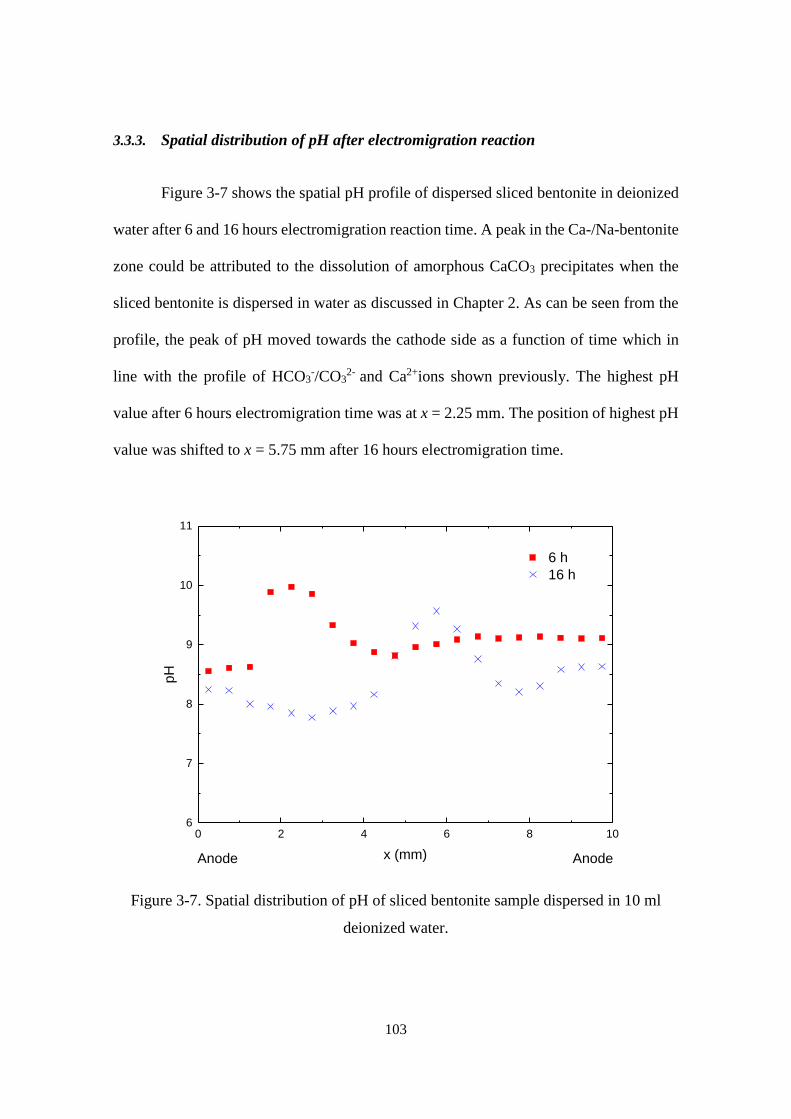
103
3.3.3. Spatial distribution of pH after electromigration reaction
Figure 3-7 shows the spatial pH profile of dispersed sliced bentonite in deionized
water after 6 and 16 hours electromigration reaction time. A peak in the Ca-/Na-bentonite
zone could be attributed to the dissolution of amorphous CaCO3 precipitates when the
sliced bentonite is dispersed in water as discussed in Chapter 2. As can be seen from the
profile, the peak of pH moved towards the cathode side as a function of time which in
line with the profile of HCO3-/CO3
2- and Ca2+ions shown previously. The highest pH
value after 6 hours electromigration time was at x = 2.25 mm. The position of highest pH
value was shifted to x = 5.75 mm after 16 hours electromigration time.
0 2 4 6 8 106
7
8
9
10
11
6 h
16 h
AnodeAnode
pH
x (mm)
Figure 3-7. Spatial distribution of pH of sliced bentonite sample dispersed in 10 ml
deionized water.
104
3.4. Discussion
3.4.1. Moving reaction front of CaCO3 precipitation
CaCO3 precipitates, as neutral chemical species, should not mobile under
electrical potential gradient. Therefore, the broadening precipitation zones of CaCO3
precipitates as was indicated in Figure 3-5 and Figure 3-6 suggests that the reaction front
between Ca2+ and HCO3-/CO3
2- ions moved from the anode side towards the cathode side.
The advancing reaction front can be attributed to the difference in mobility between Ca2+
and HCO3-/CO3
2- ions as the reacting ions. As shown in Table 3-1, the apparent mobility
of Ca2+ is about one order magnitude greater than that of HCO3-/CO3
2- ions. This
significant difference implies that HCO3-/CO3
2- ions should not migrate significantly
before reacting with Ca2+ ions. The incoming Ca2+ ions convert HCO3-/CO3
2- ions at their
initial position into CaCO3 precipitates. Once the available HCO3-/CO3
2- ions is
completely consumed, the reaction stops and the incoming Ca2+ ions passing through to
create a new reaction front further towards the cathode side.
The relatively constant position of HCO3-/CO3
2- ions compared to that of Ca2+
ions under the influence of electrical potential gradient as shown previously in Figure 3-3
also suggest that the initial concentration of HCO3-/CO3
2- ions determines the amount of
CaCO3 precipitates which can be formed. Considering the range of experimental pH
shown in Figure 3-7, the HCO3-/CO3
2- ions in bentonite is dominated by HCO3- species.
The reaction of CaCO3 precipitation can be expressed with the following equilibrium:
𝐶𝑎2+ + 2𝐻𝐶𝑂3− ↔ 𝐶𝑎𝐶𝑂3 (𝑠) + 𝐻2𝑂 + 𝐶𝑂2
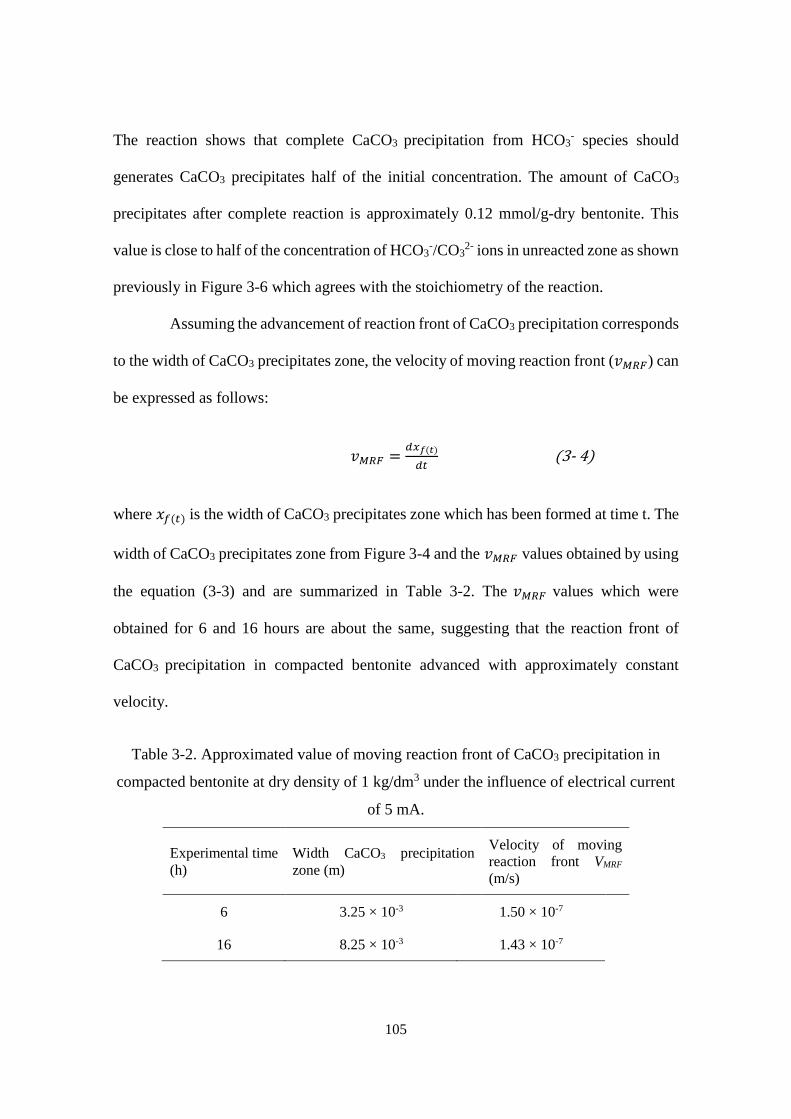
105
The reaction shows that complete CaCO3 precipitation from HCO3- species should
generates CaCO3 precipitates half of the initial concentration. The amount of CaCO3
precipitates after complete reaction is approximately 0.12 mmol/g-dry bentonite. This
value is close to half of the concentration of HCO3-/CO3
2- ions in unreacted zone as shown
previously in Figure 3-6 which agrees with the stoichiometry of the reaction.
Assuming the advancement of reaction front of CaCO3 precipitation corresponds
to the width of CaCO3 precipitates zone, the velocity of moving reaction front (𝑣𝑀𝑅𝐹) can
be expressed as follows:
𝑣𝑀𝑅𝐹 =𝑑𝑥𝑓(𝑡)
𝑑𝑡 (3- 4)
where 𝑥𝑓(𝑡) is the width of CaCO3 precipitates zone which has been formed at time t. The
width of CaCO3 precipitates zone from Figure 3-4 and the 𝑣𝑀𝑅𝐹 values obtained by using
the equation (3-3) and are summarized in Table 3-2. The 𝑣𝑀𝑅𝐹 values which were
obtained for 6 and 16 hours are about the same, suggesting that the reaction front of
CaCO3 precipitation in compacted bentonite advanced with approximately constant
velocity.
Table 3-2. Approximated value of moving reaction front of CaCO3 precipitation in
compacted bentonite at dry density of 1 kg/dm3 under the influence of electrical current
of 5 mA.
Experimental time
(h)
Width CaCO3 precipitation
zone (m)
Velocity of moving
reaction front VMRF
(m/s)
6 3.25 × 10⁻³ 1.50 × 10⁻⁷
16 8.25 × 10⁻³ 1.43 × 10⁻⁷
106
3.4.2. Transport process to the site of reaction front
Porosity clogging may occur due to precipitates formation in porous media. The
amount of precipitates may have non-linear effect to the permeability. The study on
CaCO3 precipitation in quartz sand revealed that CaCO3 precipitates occupying only 5%
of porosity was sufficient enough to create impermeable layer [38]. In this study, the
amount of CaCO3 precipitates in compacted bentonite generated from the
electromigration experiment was about 0.12 mmol/g-bentonite. Using molar volume of
calcite (31.20 cm3/mol) and interparticle porosity of compacted bentonite at dry density
of 1 g/cm3 (0.36) [39], CaCO3 precipitates occupy approximately 10% of the interparticle
porosity. However, the relatively constant 𝑣𝑀𝑅𝐹 as listed in Table 3-2 suggests that the
effect of CaCO3 precipitates on the transport of Ca2+ and HCO3-/CO3
2- ions under the
experimental condition is negligible even at higher CaCO3-occupied porosity.
Further evidence on the negligible porosity clogging in the experiment is shown
by the approximately constant of CaCO3 precipitates near the anode side. When the
reaction front of CaCO3 precipitation moved toward the cathode side, the Ca2+ ions from
supplied from the anode reservoir need to pass through the CaCO3 precipitate zone in
order to reach the reaction front. If the CaCO3 precipitates block the transport of Ca2+
ions, the solution surrounding the precipitates will become undersaturated and then
dissolution of precipitates will occur. However, the profile of CaCO3 precipitates near the
anode side was constant, indicating no dissolution occurred between 6 and 16 hours
electromigration time.
A plausible explanation for the discrepancy effect of CaCO3 precipitates in
compacted bentonite and in quartz sand is due to their microstructure difference. Unlike
107
quartz sand which exhibits single pore type, compacted bentonite is considered to exhibit
two types of pores: interparticle and interlayer pores. Both pores are accessible for
cations, including Ca2+ ions. Therefore, the negligible effect of CaCO3 precipitates to the
transport of Ca2+ ions suggests that Ca2+ ions can migrate through not only the
interparticle but also the interlayer pores, resulting in the fact that are not affected by the
presence of CaCO3 precipitates. It is assumed that the interlayer Ca2+ ions can react with
HCO3-/CO3
2- ions in the interparticle spaces through cation exchange reaction with Na+
ions. If this is the case, the transport of cations in compacted bentonite will not be affected
by porosity clogging regardless the amount of precipitates in the interparticle spaces. This
result also suggests the importance of CaCO3 precipitates formation mechanism through
cation exchange reaction in compacted bentonite.
108
3.5. Conclusion
The electromigration parameters for Ca2+ and HCO3-/CO3
2- ions and the time
dependence of CaCO3 precipitation in compacted Na-bentonite with dry density of 1.0
kg/dm3 from counter diffusion of Ca2+ and HCO3-/CO3
2- ions enhanced by electrokinetic
method have been studied. The reaction front of CaCO3 precipitation under the
experimental conditions was found to move from the anode side towards the cathode side.
This advancing reaction front can be attributed to the faster mobility of Ca2+ compared to
HCO3-/CO3
2- ions. The velocity of the reaction front of CaCO3 precipitation was obtained
to be constant during the experiments, unaffected by CaCO3 formation. The results
suggest that major migration pathways of cations in compacted bentonite include the
interlayers and the formation of precipitates may not affect migration of cationic
radionuclides.
109
3.6. References
[1] Chapman N, Hooper A. The disposal of radioactive wastes underground. Proc.
Geol. Assoc. 2012;123(1):46–63.
[2] Ewing RC, Whittleston RA, Yardley BWD. Geological disposal of nuclear waste:
A primer. Elements. 2016;12(4):233–237.
[3] Higgo JJW. Clay as a barrier to radionuclide migration. Prog. Nucl. Energy.
1987;19(2):173–207.
[4] Pusch R. Use of bentonite for isolation of radioactive waste products. Clay Miner.
1992;27(3):353–361.
[5] Pusch R. Chapter 11.4 Clays and nuclear waste management. In: Bergaya F, Theng
BKG, Lagaly G, editors. Handbook of clay science. Amsterdam: Elsevier;
2006.p.703–716.
[6] Altmann S, Tournassat C, Goutelard F, et al. Diffusion-driven transport in clayrock
formations. Appl. Geochemistry. 2012;27(2):463–478.
[7] Sellin P, Leupin OX. The use of clay as an engineered barrier in radioactive-waste
management - A review. Clays Clay Miner. 2014;61(6):477–498.
[8] Grambow B. Geological disposal of radioactive waste in clay. Elements.
2016;12(4):239–245.
[9] Japan Nuclear Cycle Development Institute. H12: Project to establish the scientific
and technical basis for HLW disposal in Japan, Supporting Report 3 Safety
Assessment of the Geological Disposal System. JNC TN1410 2000-004. Tokai:
JNC; 2000. (JNC TN1410 2000-004).
[10] Atkinson A, Everitt NM, Guppy RM. Time Dependence of pH in a Cementitious
Repository. Materials Research Society Symposium Proceedings. Cambridge
University Press; 1988.p.439–446.
[11] Alonso MC, García Calvo JL, Cuevas J, et al. Interaction processes at the concrete-
bentonite interface after 13 years of FEBEX-Plug operation. Part I: Concrete
alteration. Phys. Chem. Earth. 2017;99:38–48.
110
[12] Gaucher EC, Blanc P. Cement/clay interactions - A review: Experiments, natural
analogues, and modeling. Waste Manag. 2006;26(7):776–788.
[13] Arcos D, Grandia F, Domènech C. Geochemical evolution of the near field of a
KBS-3 repository. SKB Technical Report. Stockholm; 2006. (SKB Tecknical
Report TR-06016).
[14] Dauzères A, Le Bescop P, Cau-Dit-Coumes C, et al. On the physico-chemical
evolution of low-pH and CEM i cement pastes interacting with Callovo-Oxfordian
pore water under its in situ CO2 partial pressure. Cem. Concr. Res. 2014;58:76–
88.
[15] Yamaguchi T, Sawaguchi T, Tsukada M, et al. Mineralogical changes and
associated decrease in tritiated water diffusivity after alteration of cement–
bentonite interfaces. Clay Miner. 2016;51(2):279–287.
[16] Techer I, Bartier D, Boulvais P, et al. Tracing interactions between natural
argillites and hyper-alkaline fluids from engineered cement paste and concrete:
Chemical and isotopic monitoring of a 15-years old deep-disposal analogue. Appl.
Geochemistry. 2012;27(7):1384–1402.
[17] Fernández R, Torres E, Ruiz AI, et al. Interaction processes at the concrete-
bentonite interface after 13 years of FEBEX-Plug operation. Part II: Bentonite
contact. Phys. Chem. Earth. 2017;99:49–63.
[18] Maher K, Bargar JR, Brown GE. Environmental speciation of actinides. Inorg.
Chem. 2013;52(7):3510–3532.
[19] Catalano JG, Brown GE. Uranyl adsorption onto montmorillonite: Evaluation of
binding sites and carbonate complexation. Geochim. Cosmochim. Acta.
2005;69(12):2995–3005.
[20] Steefel CI, Lichtner PC. Diffusion and reaction in rock matrix bordering a
hyperalkaline fluid-filled fracture. Geochim. Cosmochim. Acta.
1994;58(17):3595–3612.
[21] Gaboreau S, Prêt D, Tinseau E, et al. 15 years of in situ cement-argillite interaction
from Tournemire URL: Characterisation of the multi-scale spatial heterogeneities
111
of pore space evolution. Appl. Geochemistry. 2011;26(12):2159–2171.
[22] Jenni A, Mäder U, Lerouge C, et al. In situ interaction between different concretes
and Opalinus Clay. Phys. Chem. Earth. 2014;70–71:71–83.
[23] Kitano Y, Oomori T. The coprecipitation of uranium with calcium carbonate. J.
Oceanogr. Soc. Japan. 1971;27(1):34–42.
[24] Meece DE, Benninger LK. The coprecipitation of Pu and other radionuclides with
CaCO3. Geochim. Cosmochim. Acta. 1993;57(7):1447–1458.
[25] Hellebrandt SE, Hofmann S, Jordan N, et al. Incorporation of Eu(III) into calcite
under recrystallization conditions. Sci. Rep. 2016;6:1–10.
[26] Smith KF, Bryan ND, Swinburne AN, et al. U(VI) behaviour in hyperalkaline
calcite systems. Geochim. Cosmochim. Acta. 2015;148:343–359.
[27] Zaoui A, Sekkal W. Can clays ensure nuclear waste repositories? Sci. Rep.
2015;5:1–5.
[28] Stack AG. Precipitation in Pores : A Geochemical Frontier. Rev. Mineral.
Geochemistry. 2015;80(1):165–190.
[29] Stack AG, Fernandez-Martinez A, Allard LF, et al. Pore-size-dependent calcium
carbonate precipitation controlled by surface chemistry. Environ. Sci. Technol.
2014;48(11):6177–6183.
[30] Gebrehiwet TA, Redden GD, Fujita Y, et al. The Effect of the CO32- to Ca2+ Ion
activity ratio on calcite precipitation kinetics and Sr2+ partitioning. Geochem.
Trans. 2012;13(1):1.
[31] Stack AG. Next generation models of carbonate mineral growth and dissolution.
2014;288:278–288.
[32] Nindiyasari F, Fernández-Díaz L, Griesshaber E, et al. Influence of gelatin
hydrogel porosity on the crystallization of CaCO 3. Cryst. Growth Des.
2014;14(4):1531–1542.
[33] Gebrehiwet TA, Guo L, Fox D, et al. Precipitation of calcium carbonate and
calcium phosphate under diffusion controlled mixing. Appl. Geochemistry.
112
2014;46:43–56.
[34] Kozaki T, Fujishima A, Sato S, et al. Self-diffusion of sodium ions in compacted
sodium montmorillonite. Nucl. Technol. 1998;121(1):63–69.
[35] Tanaka S, Noda N, Sato S, et al. Electrokinetic study of migration of anions,
cations, and water in water-saturated compacted sodium montmorillonite. J. Nucl.
Sci. Technol. 2011;48(3):454–462.
[36] Maes N, Moors H, Dierckx A, et al. The assessment of electromigration as a new
technique to study diffusion of radionuclides in clayey soils. J. Contam. Hydrol.
1999;36(3–4):231–247.
[37] Tanaka S. Gypsum precipitation enhanced by electrokinetic method and porewater
chemistry in compacted montmorillonite. Appl. Clay Sci. 2018;161:482–493.
[38] Tartakovsky AM, Redden G, Lichtner PC, et al. Mixing-induced precipitation :
Experimental study and multiscale numerical analysis. Water Resour. Res.
2008;44:1–19.
[39] Kozaki T, Inada K, Sato S, et al. Diffusion mechanism of chloride ions in sodium
montmorillonite. J. Contam. Hydrol. 2001;47(2–4):159–170.
113
4. Diffusion behavior of sulphate ions in compacted bentonite at
different dry density and salinity
4.1. Introduction
Geological disposal is recognized as safe and secure means to dispose of high-
level radioactive waste. Its concept is based on multi-barrier system consisting of a series
of engineered and natural barriers which ensure to inhibit the release of radionuclides
from waste form for long period of time [1–4]. Compacted bentonite is considered to be
used as a one part of the multi-barrier systems because of its several advantageous
properties, such as low hydraulic conductivity, high sorption capacity for radionuclides,
high swelling ability, and good durability [5,6]. Low diffusivity of bentonite is considered
to be advantageous, since it can retards the radionuclides transport [7]. Therefore,
diffusion is one of important issue to be studied for the safety assessment of geological
disposal. However, the diffusion processes are still not clearly understood because the
diffusion is influenced by several phenomena, such as the existence of electrical double
layer (EDL) from the negatively charged bentonite surface, the type of exchangeable
cations, and the porewater chemistry [8–10].
Compacted bentonite is considered to have two types of pore spaces: the spaces
between bentonite layer (interlayer spaces) and the spaces between external surfaces
(interparticle spaces). The interlayer spaces contain interlayer water and exchangeable
cations, while the interparticle spaces contain porewater which or part of which is affected
by the EDL due to permanent negative charge of montmorillonite, which is the major clay
mineral in bentonite [11–13]. Radionuclides in compacted bentonite thus can diffuse
through three different pathways: the porewater, the external surface of bentonite or the
114
EDL, and the interlayer. Cations and neutral chemical species can diffuse through all of
those pathways [14–16], whereas anions can only diffuse through the former two
pathways due to the negative charge of montmorillonite layers [17,18]. The activation
energy for diffusion (Ea) can be used as a parameter to distinguish diffusion processes
among those pathways. Generally, diffusion in the porewater can be considered to have
the same Ea values as that in free water, whereas the diffusion in other two ways may
have different Ea values from that in free water [19,20].
Diffusion of anion in bentonite is an important issue to studied for the safety
assessment of geological disposal [2,21]. It is reported that diffusion coefficients in
bentonite decrease as the dry density of bentonite increase for Cl- [22–25], I- [26–29],
SO42- [30,31], and SeO3
2- ions [32]. On the other hand, the diffusion coefficients of anions
were reported to be increased by the increase of the salinity. In the previous work, this
salinity effect was attributed to the increase of accessible porosity for anions [25,33],
although the total porosity kept constant [33,34]. From the viewpoint of the Ea, almost
the same Ea value as those in free water were reported for I- [26] and SeO32- ions [32],
suggesting that these anions diffuse predominantly in the porewater. However, it was
reported that diffusion of Cl- ions has both lower and higher Ea values than that in free
water, suggesting that their predominant diffusion mechanism is different from that in
free water [22,23].
The purpose of this study is to investigate the diffusion mechanism of 35SO42-
ions in compacted bentonite. This anion is relatively stable as compared with carbonate,
which easily associate according to the chemical environment. It is considered that
diffusion of SO42- ions is closely related to the activities of sulphate-reducing bacteria,
which can reduce SO42- ions to S2- ions and can enhance the corrosion of copper canister
115
[35,36]. The SO42- ions also may contribute to the formation of pyrite (FeS2) which have
strong association with 79Se [37]. In this study, back-to-back diffusion experiments were
carried out to obtained apparent diffusion coefficient (Da) of 35SO42- in compacted
bentonite at various dry densities. The effect of NaCl concentration on the diffusion of
35SO42- ions was studied at dry density of 1 kg/dm3, at which salinity dependence on
diffusion coefficients of anions is reported to be relatively significant [9,38]. The Ea
values were determined from the dependences of Da on temperatures. Based on the
experimental data of Da and Ea, the diffusion mechanism of 35SO42- ions in compacted
bentonite is discussed from the viewpoints of microstructure of compacted bentonite
which can be changed by dry density and/or salinity.
4.2. Method
Homoionized Na-bentonite with particle size between 75 and 150 μm was
prepared by mixing Kunipia F (Kunimine Industries Co., Tokyo, Japan) and 1 M NaCl
solution with ratio of 1:100 g/ml. The mixing was carried out three times with fresh 1 M
NaCl solution in each step. The excess salt was removed by dialysis method in
demineralized water prepared using EYELA Still Ace SA-2100E1 (Tokyo Rikakikai Co.,
Tokyo, Japan). Detailed procedure of hominization is described in previous studies
[39,40].
Dry Na-bentonite was packed in acrylic resin cells with inner diameter and
length of 20 mm to dry density of 0.8, 1.0, 1.2, 1.4, and 1.6 kg/dm3. Each pair of the cells
containing bentonite sample was immersed in deionized water in a closed container for
30 days at room temperature and atmospheric pressure. For sample with dry density of
1.0 kg/dm3, the cells were also immersed in 0.3 or 0.5 M NaCl.
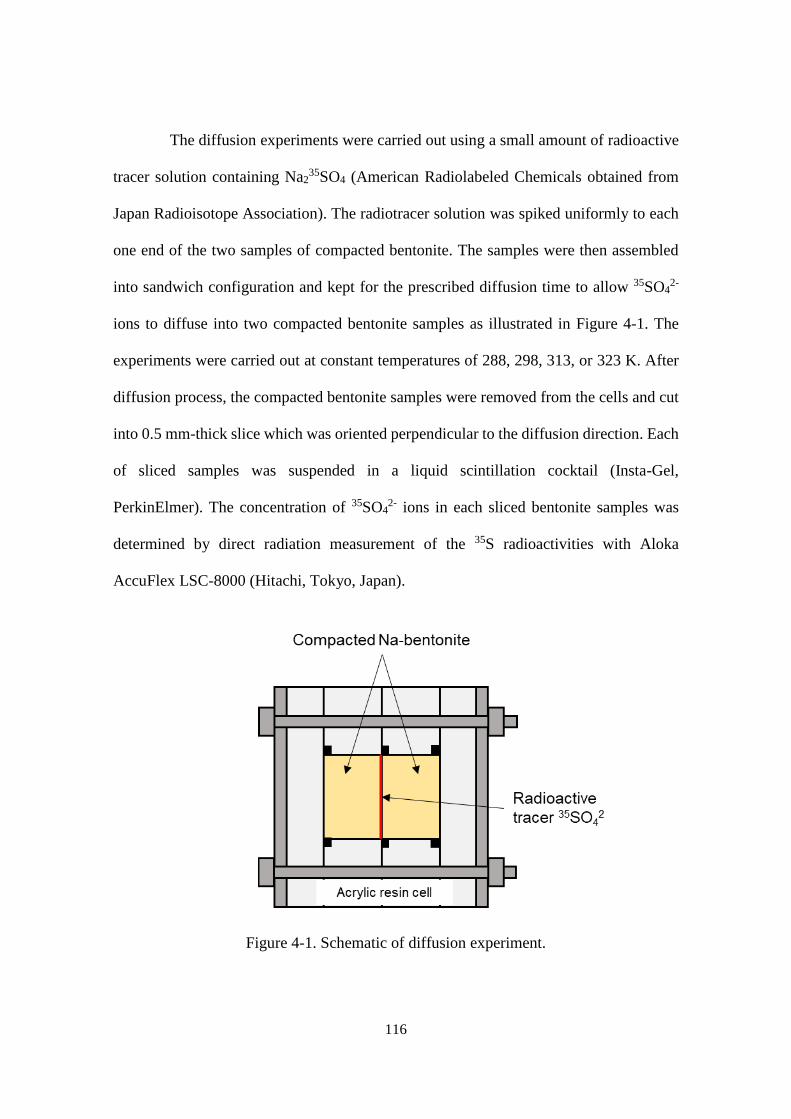
116
The diffusion experiments were carried out using a small amount of radioactive
tracer solution containing Na235SO4 (American Radiolabeled Chemicals obtained from
Japan Radioisotope Association). The radiotracer solution was spiked uniformly to each
one end of the two samples of compacted bentonite. The samples were then assembled
into sandwich configuration and kept for the prescribed diffusion time to allow 35SO42-
ions to diffuse into two compacted bentonite samples as illustrated in Figure 4-1. The
experiments were carried out at constant temperatures of 288, 298, 313, or 323 K. After
diffusion process, the compacted bentonite samples were removed from the cells and cut
into 0.5 mm-thick slice which was oriented perpendicular to the diffusion direction. Each
of sliced samples was suspended in a liquid scintillation cocktail (Insta-Gel,
PerkinElmer). The concentration of 35SO42- ions in each sliced bentonite samples was
determined by direct radiation measurement of the 35S radioactivities with Aloka
AccuFlex LSC-8000 (Hitachi, Tokyo, Japan).
Figure 4-1. Schematic of diffusion experiment.
117
The Da values of 35SO42- were calculated assuming the spiked radiotracer diffuse
from thin diffusion source in infinite length of sample in both directions. The spatial
distribution of 35SO42- ions after the prescribed period of time for diffusion can be
described by the following equation, which is derived from Fick’s second law with
boundary conditions for diffusant occupying half-spaces are -∞ < x < 0 and 0 < x < ∞
[41]:
𝑐 (𝑥, 𝑡) =𝑀
2 √𝜋𝐷𝑎𝑡 𝑒𝑥𝑝 (−
𝑥2
4𝐷𝑎𝑡) (4-5)
where c is the radioactivities of 35SO42- ions per sliced compacted bentonite sample
(Bq/m3), M is the total amount of the spiked radiotracer per unit area (Bq/m2), x is the
distance between the center of the sliced bentonite sample and the surface on which the
radiotracer was spiked (m), and t is the diffusion time (s). Two Da values were obtained
from each pair bentonite samples which were calculated from the slope of least-square
fitting ln C against x2.
The Ea values of 35SO42- ions were determined from the temperature dependence
of Da values by using the following Arrhenius law:
𝐷𝑎 = 𝐷0 𝑒𝑥𝑝 −𝐸𝑎
𝑅𝑇 (4-6)
where D0 is the constant for a given diffusion system (m2/s), R is the gas constant (8.314
× 10-3 kJ/mol·K), and T is the absolute temperature in which the diffusion experiment
was carried out (K). The Ea values (kJ/mol) were then calculated from the slope of least-
square fitting of ln Da against reciprocal T.
118
4.3. Result
4.3.1. Diffusivity of 35SO42- ions in compacted bentonite
Table 4-1 summarizes experimental results of the diffusion coefficients of
35SO42- ions in compacted bentonite under different dry densities, diffusion temperatures
and NaCl concentrations. When the bentonite was saturated with deionized water (at NaCl
concentration of zero), the Da values at each diffusion temperature significantly decreased
as the dry density of compacted bentonite increased from 0.8 to 1.6 kg/dm3. Figure 4-2
shows the Da values at 298 K as a function of dry density, together with those of Cl- ions
[22,23]. The Da of SO42- ions were smaller than those of Cl- ions by approximately a factor
of three in average.
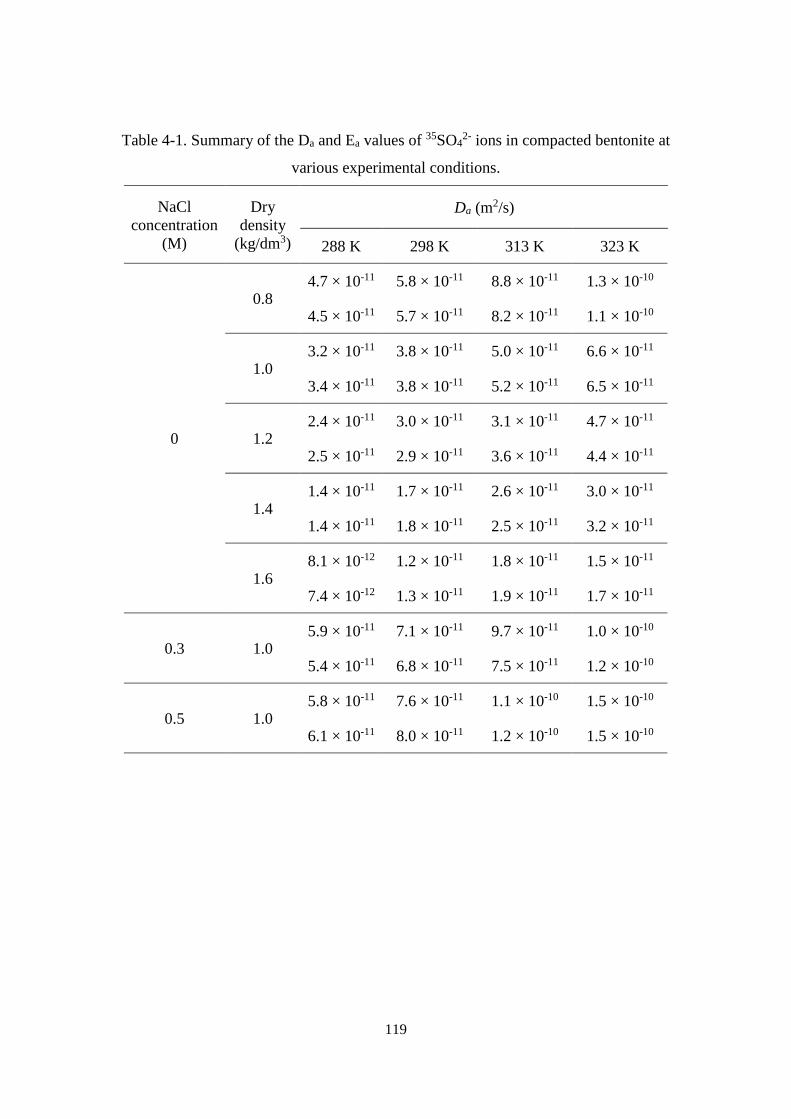
119
Table 4-1. Summary of the Da and Ea values of 35SO42- ions in compacted bentonite at
various experimental conditions.
NaCl
concentration
(M)
Dry
density
(kg/dm3)
Da (m2/s)
288 K 298 K 313 K 323 K
0
0.8 4.7 × 10⁻¹¹ 5.8 × 10⁻¹¹ 8.8 × 10⁻¹¹ 1.3 × 10⁻¹⁰
4.5 × 10⁻¹¹ 5.7 × 10⁻¹¹ 8.2 × 10⁻¹¹ 1.1 × 10⁻¹⁰
1.0 3.2 × 10⁻¹¹ 3.8 × 10⁻¹¹ 5.0 × 10⁻¹¹ 6.6 × 10⁻¹¹
3.4 × 10⁻¹¹ 3.8 × 10⁻¹¹ 5.2 × 10⁻¹¹ 6.5 × 10⁻¹¹
1.2 2.4 × 10⁻¹¹ 3.0 × 10⁻¹¹ 3.1 × 10⁻¹¹ 4.7 × 10⁻¹¹
2.5 × 10⁻¹¹ 2.9 × 10⁻¹¹ 3.6 × 10⁻¹¹ 4.4 × 10⁻¹¹
1.4 1.4 × 10⁻¹¹ 1.7 × 10⁻¹¹ 2.6 × 10⁻¹¹ 3.0 × 10⁻¹¹
1.4 × 10⁻¹¹ 1.8 × 10⁻¹¹ 2.5 × 10⁻¹¹ 3.2 × 10⁻¹¹
1.6 8.1 × 10⁻¹² 1.2 × 10⁻¹¹ 1.8 × 10⁻¹¹ 1.5 × 10⁻¹¹
7.4 × 10⁻¹² 1.3 × 10⁻¹¹ 1.9 × 10⁻¹¹ 1.7 × 10⁻¹¹
0.3 1.0 5.9 × 10⁻¹¹ 7.1 × 10⁻¹¹ 9.7 × 10⁻¹¹ 1.0 × 10⁻¹⁰
5.4 × 10⁻¹¹ 6.8 × 10⁻¹¹ 7.5 × 10⁻¹¹ 1.2 × 10⁻¹⁰
0.5 1.0 5.8 × 10⁻¹¹ 7.6 × 10⁻¹¹ 1.1 × 10⁻¹⁰ 1.5 × 10⁻¹⁰
6.1 × 10⁻¹¹ 8.0 × 10⁻¹¹ 1.2 × 10⁻¹⁰ 1.5 × 10⁻¹⁰
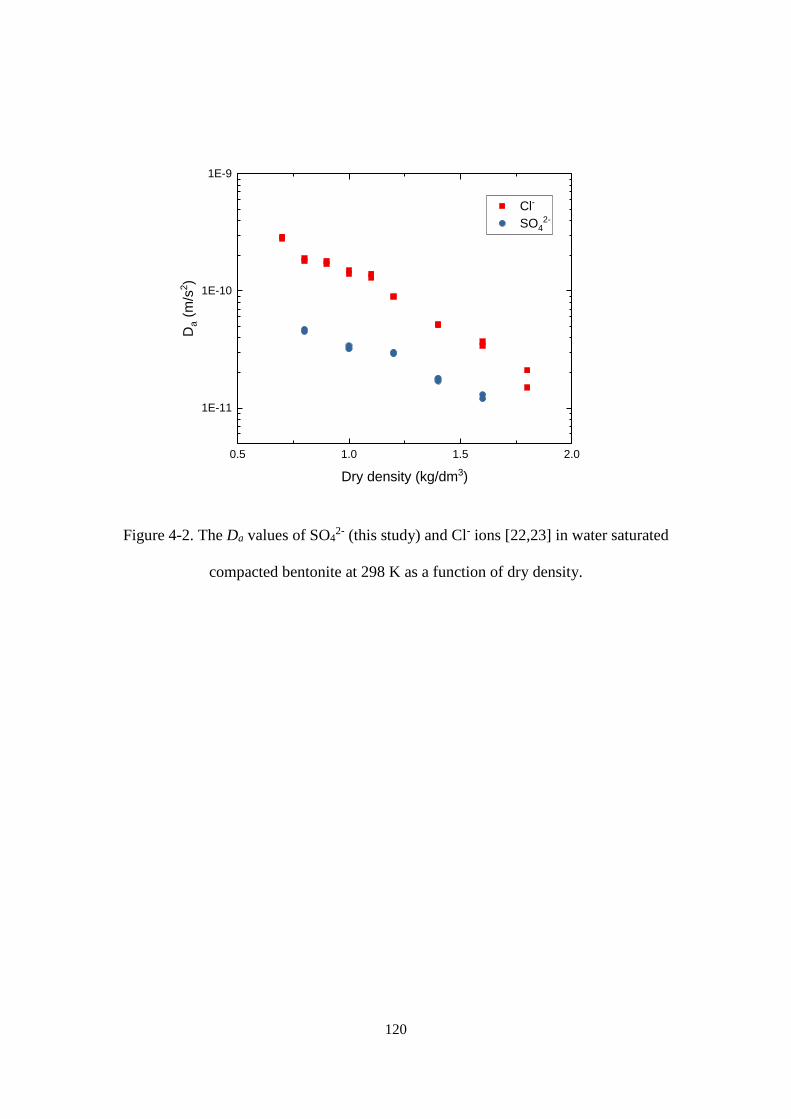
120
0.5 1.0 1.5 2.0
1E-11
1E-10
1E-9
Cl-
SO42-
Da (
m/s
2)
Dry density (kg/dm3)
Figure 4-2. The Da values of SO42- (this study) and Cl- ions [22,23] in water saturated
compacted bentonite at 298 K as a function of dry density.
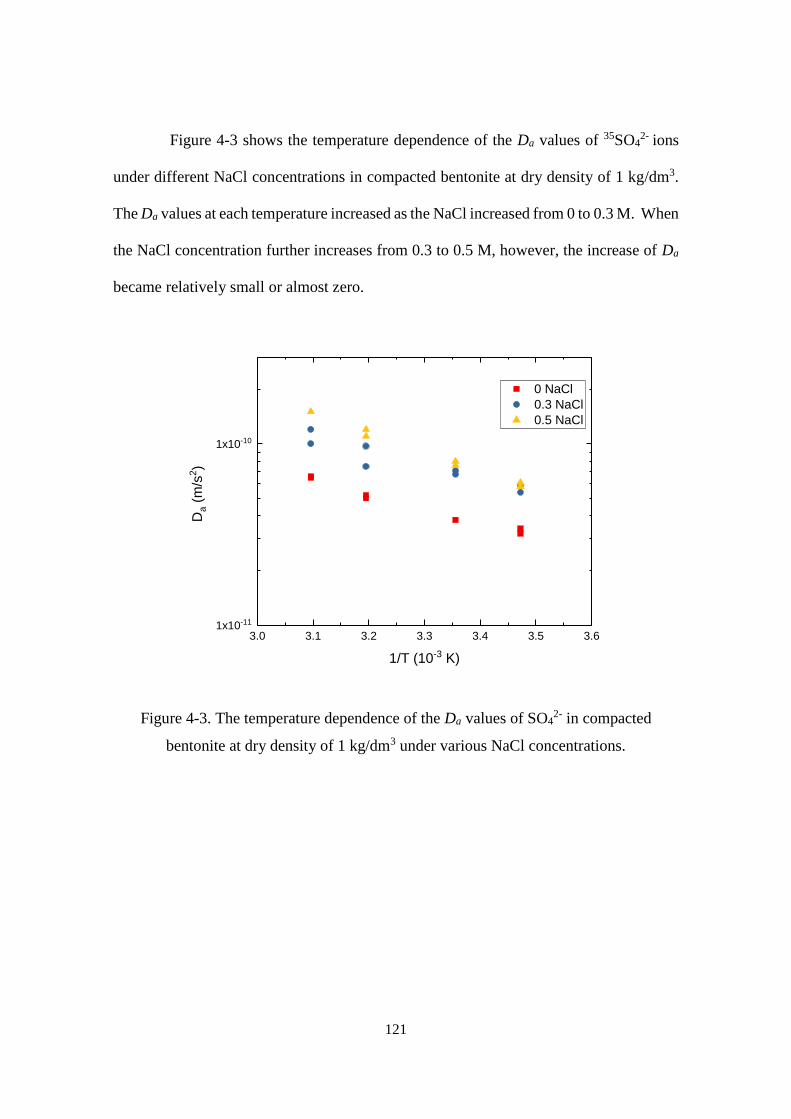
121
Figure 4-3 shows the temperature dependence of the Da values of 35SO42- ions
under different NaCl concentrations in compacted bentonite at dry density of 1 kg/dm3.
The Da values at each temperature increased as the NaCl increased from 0 to 0.3 M. When
the NaCl concentration further increases from 0.3 to 0.5 M, however, the increase of Da
became relatively small or almost zero.
3.0 3.1 3.2 3.3 3.4 3.5 3.61x10⁻¹¹
1x10⁻¹⁰
0 NaCl
0.3 NaCl
0.5 NaCl
Da (
m/s
2)
1/T (10-3 K)
Figure 4-3. The temperature dependence of the Da values of SO42- in compacted
bentonite at dry density of 1 kg/dm3 under various NaCl concentrations.
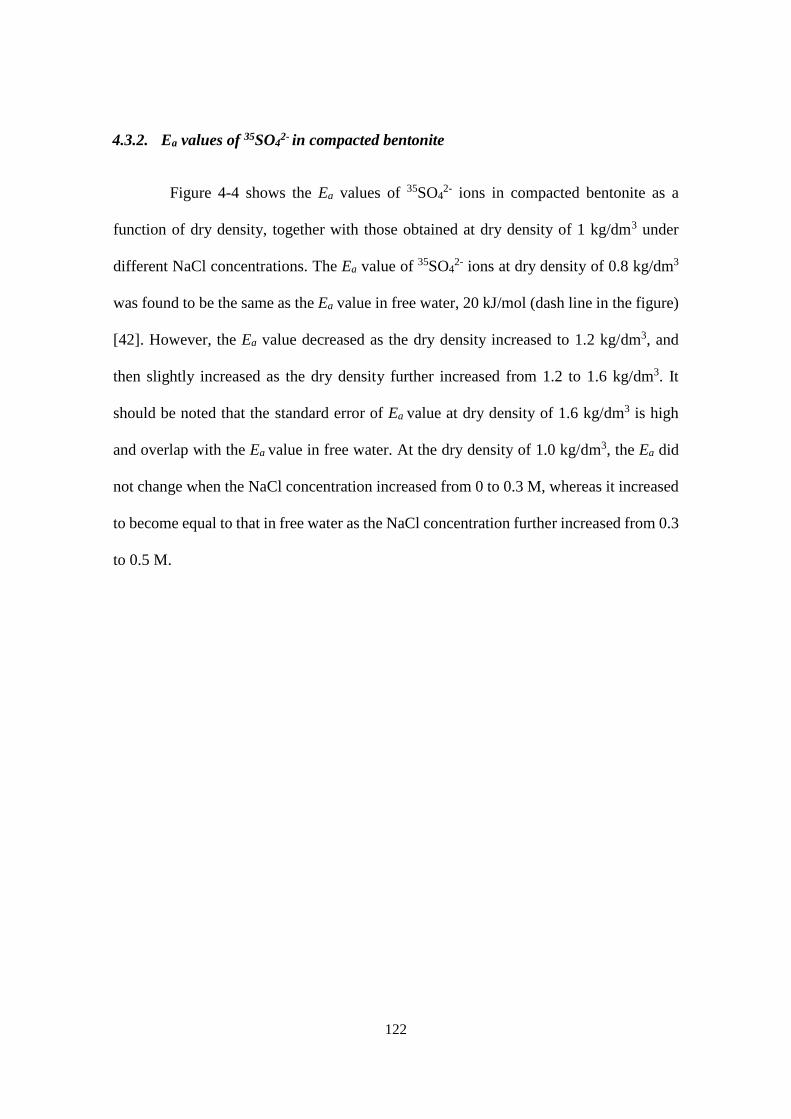
122
4.3.2. Ea values of 35SO42- in compacted bentonite
Figure 4-4 shows the Ea values of 35SO42- ions in compacted bentonite as a
function of dry density, together with those obtained at dry density of 1 kg/dm3 under
different NaCl concentrations. The Ea value of 35SO42- ions at dry density of 0.8 kg/dm3
was found to be the same as the Ea value in free water, 20 kJ/mol (dash line in the figure)
[42]. However, the Ea value decreased as the dry density increased to 1.2 kg/dm3, and
then slightly increased as the dry density further increased from 1.2 to 1.6 kg/dm3. It
should be noted that the standard error of Ea value at dry density of 1.6 kg/dm3 is high
and overlap with the Ea value in free water. At the dry density of 1.0 kg/dm3, the Ea did
not change when the NaCl concentration increased from 0 to 0.3 M, whereas it increased
to become equal to that in free water as the NaCl concentration further increased from 0.3
to 0.5 M.
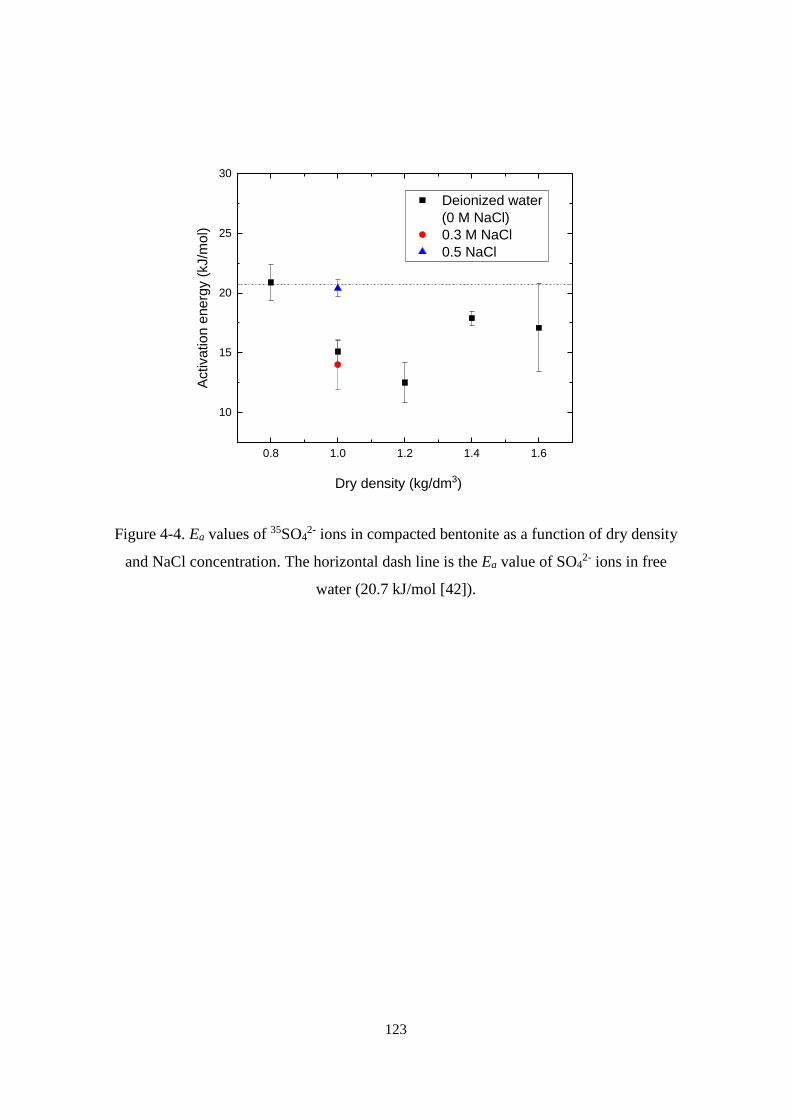
123
0.8 1.0 1.2 1.4 1.6
10
15
20
25
30
Deionized water
(0 M NaCl)
0.3 M NaCl
0.5 NaCl
Activa
tio
n e
ne
rgy (
kJ/m
ol)
Dry density (kg/dm3)
Figure 4-4. Ea values of 35SO42- ions in compacted bentonite as a function of dry density
and NaCl concentration. The horizontal dash line is the Ea value of SO42- ions in free
water (20.7 kJ/mol [42]).
124
4.4. Discussion
Effect of dry density on the diffusion of 35SO42- ions
There are at least three possible diffusion pathways as above mentioned in
Section 4.1, and also been discussed from the Ea values elsewhere [19,20]. According to
the concept of diffusion pathways, the same Ea value of 35SO42- ions in compacted
bentonite at dry density of 0.8 kg/dm3 to that in free water suggests that the diffusion of
35SO42- ions occurs predominantly through the porewater at this dry density. The same
predominant porewater diffusion has also been reported for Cl- ions albeit at lower dry
density of 0.7 kg/dm3 as shown in Figure 4-5 [23]. This predominantly porewater
diffusion for anions at low dry density is reasonable because of the high porosity of
compacted bentonite at this dry density. The porewater fraction accounts for more than
55% at the dry density of bentonite lower than 1 kg/dm3.
At dry density of 1 kg/dm3 and higher, the Ea values became smaller than that in
free water. This decrease of Ea can be attributed to the change of diffusion mechanism
from predominantly through porewater to another. Surface diffusion is possible
alternative pathway for cations, but not for anions. This surface diffusion can be
contradictive to EDL theory, such as Stern and Gouy-Chapman, which expected anions
are completely excluded from the negatively charged surface of bentonite. Kozaki et al.
[23] pointed out that surface diffusion can be predominant if the structure of EDL follows
the Grahame model. This result, nonetheless, suggests that the diffusion of 35SO42- ions
in compacted bentonite at dry density higher than 1 kg/dm3 cannot be explained solely by
the porewater diffusion.
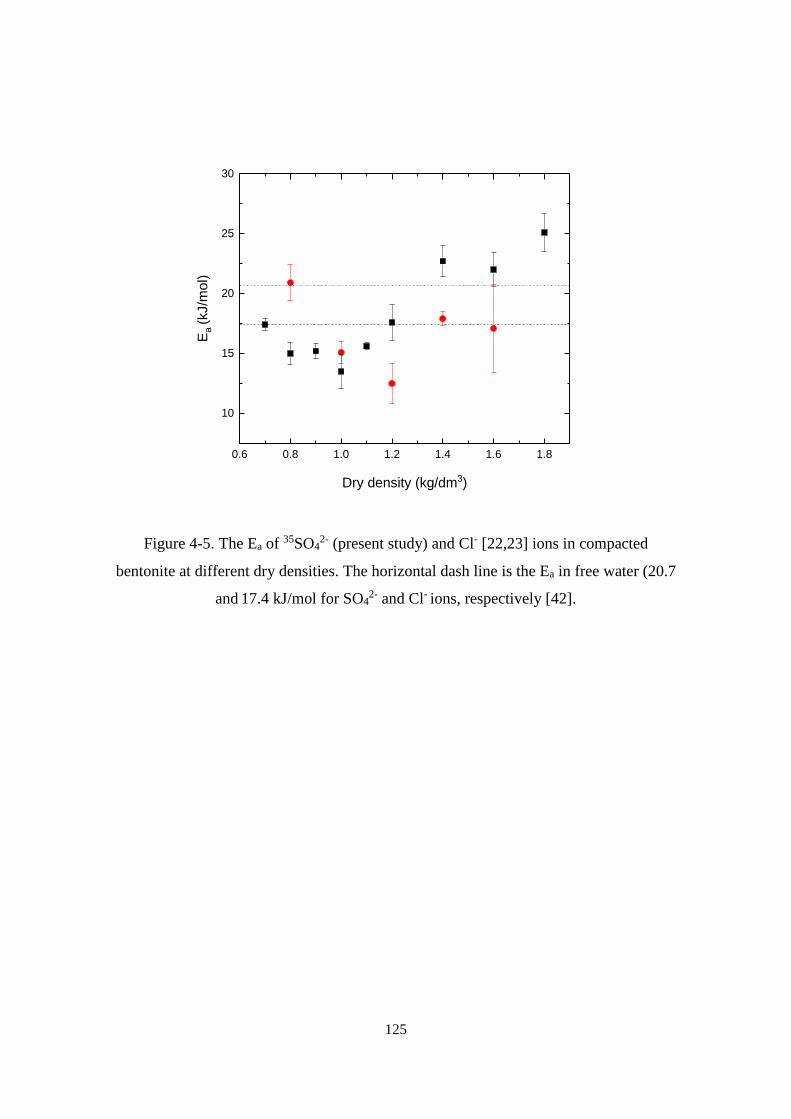
125
0.6 0.8 1.0 1.2 1.4 1.6 1.8
10
15
20
25
30
Ea
(kJ/m
ol)
Dry density (kg/dm3)
Figure 4-5. The Ea of 35SO42- (present study) and Cl- [22,23] ions in compacted
bentonite at different dry densities. The horizontal dash line is the Ea in free water (20.7
and 17.4 kJ/mol for SO42- and Cl- ions, respectively [42].
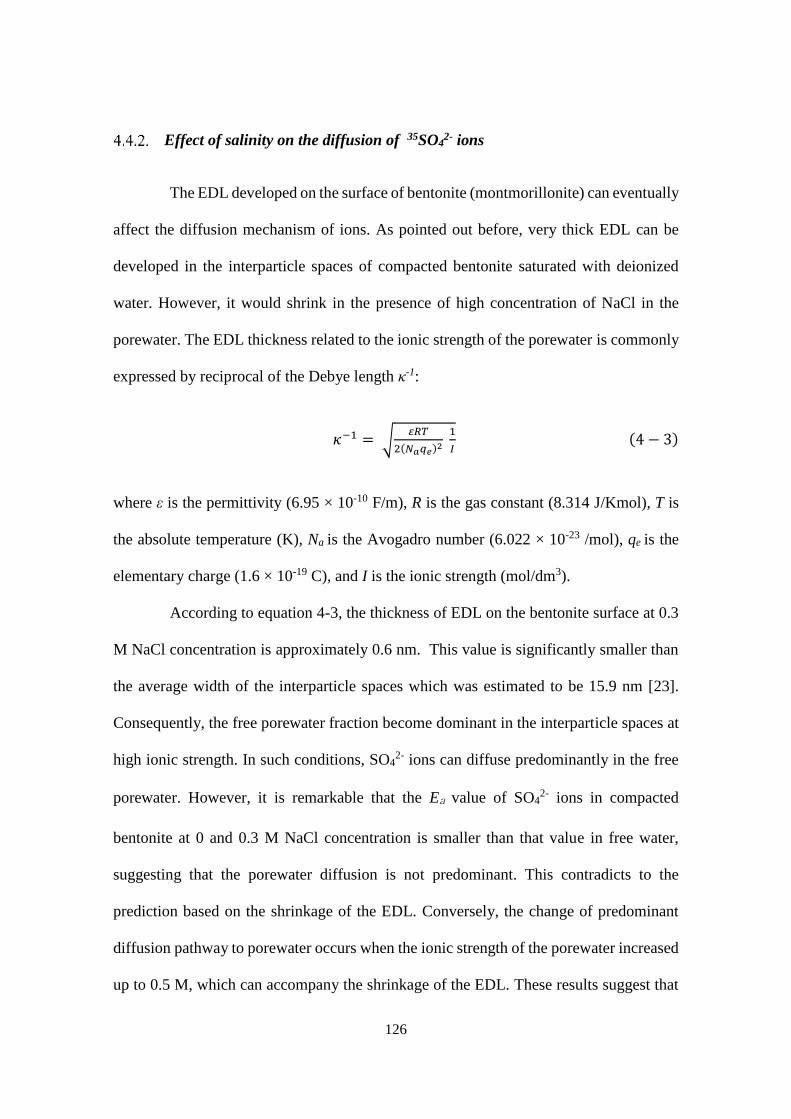
126
Effect of salinity on the diffusion of 35SO42- ions
The EDL developed on the surface of bentonite (montmorillonite) can eventually
affect the diffusion mechanism of ions. As pointed out before, very thick EDL can be
developed in the interparticle spaces of compacted bentonite saturated with deionized
water. However, it would shrink in the presence of high concentration of NaCl in the
porewater. The EDL thickness related to the ionic strength of the porewater is commonly
expressed by reciprocal of the Debye length κ-1:
𝜅−1 = √𝜀𝑅𝑇
2(𝑁𝑎𝑞𝑒)2 1
𝐼 (4 − 3)
where ε is the permittivity (6.95 × 10⁻¹⁰ F/m), R is the gas constant (8.314 J/Kmol), T is
the absolute temperature (K), Na is the Avogadro number (6.022 × 10⁻²³ /mol), qe is the
elementary charge (1.6 × 10⁻¹⁹ C), and I is the ionic strength (mol/dm3).
According to equation 4-3, the thickness of EDL on the bentonite surface at 0.3
M NaCl concentration is approximately 0.6 nm. This value is significantly smaller than
the average width of the interparticle spaces which was estimated to be 15.9 nm [23].
Consequently, the free porewater fraction become dominant in the interparticle spaces at
high ionic strength. In such conditions, SO42- ions can diffuse predominantly in the free
porewater. However, it is remarkable that the Ea value of SO42- ions in compacted
bentonite at 0 and 0.3 M NaCl concentration is smaller than that value in free water,
suggesting that the porewater diffusion is not predominant. This contradicts to the
prediction based on the shrinkage of the EDL. Conversely, the change of predominant
diffusion pathway to porewater occurs when the ionic strength of the porewater increased
up to 0.5 M, which can accompany the shrinkage of the EDL. These results suggest that

127
other factors than the fraction of porewater may influence the diffusion mechanism of
35SO42- ions in compacted bentonite.
Previous study on diffusion of Cl- ions suggested that their diffusion behavior
might be affected by charge compensation mechanism with Na+ ions [23]. Indeed, when
anions or cations diffuse in one direction, other chemical species with the opposite charge
should follow to preserve electroneutrality. If this is the case, the diffusion behavior of
Na+ ions, which are the most possible cations to play important role in the charge
compensation mechanism, should be considered as the pair ions for 35SO42- ions.
Interestingly, diffusion behavior of Na+ ions was reported to have similar dependency on
NaCl concentration as SO42- ions. The diffusion of Na+ ions was suggested to be
predominantly through interlayer in the range of 0.1 to 0.3 M NaCl concentration, and
changed to porewater diffusion at the NaCl concentration higher than 0.3 M [9]. Therefore,
the dependency of diffusion of 35SO42- ions on NaCl concentration might be explained by
the charge compensation process, although the evidence to support the interaction
between SO42- and Na+ ions is limited. In spite of that, we can conclude that the free
porewater is not the solely possible predominant pathway for diffusion of 35SO42- ions.
128
4.5. Conclusion
Back-to-back diffusion experiments of 35SO42- ions in Na- bentonite were carried
out to obtain their Da and Ea values at various dry densities and NaCl concentrations. The
Da values decrease as the dry density of bentonite increases. The Ea values in water
saturated compacted bentonite at dry density of 0.8, 1.0, 1.2, 1.4, and 1.6 kg/dm3 were
20.9, 15.1, 12.5, 17.9, and 17.1 kJ/mol, respectively. The values at dry density of 1 kg/dm3
with 0.3 and 0.5 M NaCl concentrations were 14.0 and 20.4 kJ/mol, respectively. These
experimental data suggest that porewater diffusion is predominant in water saturated
compacted bentonite at dry density of 0.8 kg/dm3 and at dry density of 1 kg/dm3 with
NaCl concentration higher than 0.5 M. However, in water saturated compacted bentonite
at dry density higher than 1 kg/dm3 and at dry density of 1 kg/dm3 with NaCl
concentration lower than 0.3 M, the smaller Ea values than that in free water cannot be
explained by the porewater diffusion process. This finding suggests dominant diffusion
pathways for anions in compacted bentonite can be affected by salinity, indicating the
possible involvement of the EDL on montmorillonite surface.
129
4.6. References
[1] Japan Nuclear Cycle Development Institute. H12: Project to Establish Technical
Basis for HLW Disposal in Japan, Project Overview Report. JNC TN1410 2000-
001. Tokai: JNC; 2000. (JNC TN1410 2000-001).
[2] Altmann S. ’Geo’chemical research: A key building block for nuclear waste
disposal safety cases. J. Contam. Hydrol. 2008;102(3–4):174–179.
[3] Chapman N, Hooper A. The disposal of radioactive wastes underground. Proc.
Geol. Assoc. 2012;123(1):46–63.
[4] International Atomic Energy Agency. Disposal of radioactive waste: Specific
safety requirements. Vienna: IAEA; 2011. (IAEA Safety Standards Series No.
SSR-5).
[5] Pusch R. Chapter 11.4 Clays and nuclear waste management. In: Bergaya F, Theng
BKG, Lagaly G, editors. Handbook of clay science. Amsterdam: Elsevier;
2006.p.703–716.
[6] Sellin P, Leupin OX. The use of clay as an engineered barrier in radioactive-waste
management - A review. Clays Clay Miner. 2014;61(6):477–498.
[7] Altmann S, Tournassat C, Goutelard F, et al. Diffusion-driven transport in clayrock
formations. Appl. Geochemistry. 2012;27(2):463–478.
[8] Leroy P, Revil A, Coelho D. Diffusion of ionic species in bentonite. J. Colloid
Interface Sci. 2006;296(1):248–255.
[9] Kozaki T, Liu J, Sato S. Diffusion mechanism of sodium ions in compacted
montmorillonite under different NaCl concentration. Phys. Chem. Earth, Parts
A/B/C. 2008;33(14–16):957–961.
[10] Shackelford CD, Moore SM. Fickian diffusion of radionuclides for engineered
containment barriers: Diffusion coefficients, Porosities, And complicating issues.
Eng. Geol. 2013;152(1):133–147.
[11] Bradbury MH, Baeyens B. Porewater chemistry in compacted re-saturated MX-80
bentonite. J. Contam. Hydrol. 2003;61(1–4):329–338.
130
[12] Bergaya F, Lagaly G. Chapter 1 General introduction: Clays, clay minerals, and
clay science. In: Bergaya F, Theng BKG, Lagaly G, editors. Handbook of clay
science. Elsevier; 2006.p.1–18.
[13] Tournassat C, Bourg IC, Steefel CI, et al. Chapter 1 - Surface Properties of Clay
Minerals. In: Tournassat C, Steefel CI, Bourg IC, et al., editors. Natural and
Engineered Clay Barriers. Elsevier; 2015.p.5–31.
[14] Appelo CAJ, Wersin P. Multicomponent diffusion modeling in clay systems with
application to the diffusion of tritium, iodide, and sodium in Opalinus Clay.
Environ. Sci. Technol. 2007;41(14):5002–5007.
[15] Appelo CAJ, Van Loon LR, Wersin P. Multicomponent diffusion of a suite of
tracers (HTO, Cl, Br, I, Na, Sr, Cs) in a single sample of Opalinus Clay. Geochim.
Cosmochim. Acta. 2010;74(4):1201–1219.
[16] Van Loon LR, Mibus J. A modified version of Archie’s law to estimate effective
diffusion coefficients of radionuclides in argillaceous rocks and its application in
safety analysis studies. Appl. Geochemistry. 2015;59:85–94.
[17] Chagneau A, Tournassat C, Steefel CI, et al. Complete restriction of 36Cl- diffusion
by celestite precipitation in densely compacted illite. Environ. Sci. Technol. Lett.
2015;2(5):139–143.
[18] Wigger C, Van Loon LR. Importance of interlayer equivalent pores for anion
diffusion in clay-rich sedimentary rocks. Environ. Sci. Technol. 2017;51(4):1998–
2006.
[19] Kozaki T, Sato H, Fujishima A, et al. Effect of dry density on activation energy for
diffusion of strontium in compacted sodium montmorillonite. Material Resources
Symposium Proceeding Volume 465 (Symposium II – Scienfific Basis for Nuclear
Waste Management XX). 1997.p.893–900.
[20] Kozaki T, Sato H, Sato S, et al. Diffusion mechanism of cesium ions in compacted
montmorillonite. Eng. Geol. 1999;54:223–230.
[21] Grambow B. Mobile fission and activation products in nuclear waste disposal. J.
Contam. Hydrol. 2008;102(3–4):180–186.
131
[22] Kozaki T, Saito N, Fujishima A, et al. Activation energy for diffusion of chloride
ions in compacted sodium montmorillonite. J. Contam. Hydrol. 1998;35(1–3):67–
75.
[23] Kozaki T, Inada K, Sato S, et al. Diffusion mechanism of chloride ions in sodium
montmorillonite. J. Contam. Hydrol. 2001;47(2–4):159–170.
[24] Molera M, Eriksen T, Jansson M. Anion diffusion pathways in bentonite clay
compacted to different dry densities. Appl. Clay Sci. 2003;23(1–4):69–76.
[25] Van Loon LR, Glaus MA, Müller W. Anion exclusion effects in compacted
bentonites: Towards a better understanding of anion diffusion. Appl.
Geochemistry. 2007;22(11):2536–2552.
[26] Oscarson DW, Hume HB, Sawatsky NG, et al. Diffusion of iodide in compacted
bentonite. Soil Sci. Soc. Am. J. 1992;56(5):1400–1406.
[27] Yukio Tachi, Kenji Yotsuji, Yoshimi Seida MY. Diffusion of cesium and iodine
in compacted sodium montmorillonite under different saline conditions. Scientific
Basis for Nuclear Waste Management XXXIII. Materials Research Society
Proceeding. 2009.p.542–552.
[28] Tian W, Li C, Liu X, et al. The effect of ionic strength on the diffusion of 125I in
Gaomiaozi bentonite. J. Radioanal. Nucl. Chem. 2013;295(2):1423–1430.
[29] Ishidera T, Miyamotoy S, Sato H. Effect of sodium nitrate on the diffusion of Cl-
and I- in compacted bentonite. J. Nucl. Sci. Technol. 2008;45(7):610–616.
[30] Aldaba D, Glaus MA, Van Loon LR, et al. Diffusion of radiosulphate and
radiocaesium in kaolinite clay (KGa-2): Testing the applicability of the pore water
diffusion model. Appl. Geochemistry. 2017;86:84–91.
[31] Van Loon LR, Leupin OX, Cloet V. The diffusion of SO42- in Opalinus Clay :
Measurements of effective diffusion coefficients and evaluation of their
importance in view of microbial mediated reactions in the near field of radioactive
waste repositories. Appl. Geochemistry. 2018;95:19–24.
[32] Idemitsu K, Kozaki H, Yuhara M, et al. Diffusion behavior of selenite in purified
bentonite. Prog. Nucl. Energy. 2016;92:279–285.
132
[33] Wigger C, Van Loon LR. Effect of the pore water composition on the diffusive
anion transport in argillaceous, low permeability sedimentary rocks. J. Contam.
Hydrol. 2018;213(September 2017):40–48.
[34] Wigger C, Kennell-Morrison L, Jensen M, et al. A comparative anion diffusion
study on different argillaceous, low permeability sedimentary rocks with various
pore waters. Appl. Geochemistry. 2018;92(September 2017):157–165.
[35] Standish T, Chen J, Jacklin R, et al. Corrosion of copper-coated steel high level
nuclear waste containers under permanent disposal conditions. Electrochim. Acta.
2016;211:331–342.
[36] King F, Chen J, Qin Z, et al. Sulphide-transport control of the corrosion of copper
canisters. Corros. Eng. Sci. Technol. 2017;52:210–216.
[37] Liu X, Fattahi M, Montavon G, et al. Selenide retention onto pyrite under reducing
conditions. Radiochim. Acta. 2008;96(8):473–479.
[38] Bourg IC, Tournassat C. Chapter 6 - Self-Diffusion of Water and Ions in Clay
Barriers. In: Tournassat C, Steefel CI, Bourg IC, et al., editors. Natural and
Engineered Clay Barriers. Elsevier; 2015.p.189–226.
[39] Kozaki T, Fujishima A, Sato S, et al. Self-diffusion of sodium ions in compacted
sodium montmorillonite. Nucl. Technol. 1998;121(1):63–69.
[40] Kozaki T, Sato Y, Nakajima M, et al. Effect of particle size on the diffusion
behavior of some radionuclides in compacted bentonite. Nucl. Mater.
1999;270:265–272.
[41] Crank J. The mathematics of diffusion. 2nd ed. Oxford: Clarendon Press; 1975.
[42] Parsons R. Handbook of electrochemical constants. Academic Press; 1959.
133
5. Conclusion
For safety assessment of geological disposal, it is necessary to demonstrate the
ability of compacted bentonite, which is considered to be one of the engineered barriers,
in retaining/retarding migration of radionuclide for a long period of time. In this context,
understanding the fate and transport of radionuclides in compacted bentonite is critical.
Although extensive effort has been made to study the performance of compacted
bentonite regarding its application in geological disposal, resulting in a significant
progress and large experimental data, there are still many uncertainties. This study
provides the insight into the porewater chemistry, as well as the mechanism of migration
and reaction in a compacted bentonite system. The conclusions from this thesis are
summarized as follows:
Chapter 1 reviewed the overall background for this thesis, including the
background information on geological disposal of high-level radioactive waste, especially
on the importance of gaining understanding on fate and transport of ions in compacted
bentonite, porewater chemistry in compacted bentonite, and alternation of bentonite
including precipitation of CaCO3. The main objectives of this thesis were provided in this
chapter.
Chapter 2 presented the estimation of the activity coefficients of dissolved ions
in the porewater of compacted bentonite based on the experimental results of CaCO3
precipitation in compacted bentonite using an electromigration method. Solutions
containing 1 M CaCl2 and 0.7M NaHCO3 were introduced under electrical potential
gradient from the opposite sides of the compacted Na-bentonite packed at the dry density
of 1.0 kg/dm3 and saturated with 0.7 M NaHCO3. After the electromigration, the spatial
distribution of chemical species along the compacted bentonite sample was determined.
134
A sequential extraction method was developed to determine the concentrations of
different chemical species involved in CaCO3 precipitation in compacted bentonite. The
XRD analysis of CaCO3 precipitates showed no peaks suggesting a possibility of the
precipitate in amorphous phase. The mean activity coefficients were calculated from the
concentrations of free Ca2+ and HCO3-/CO3
2- ions at the zone where the precipitation
reaction was occurring. The resulting values were compared to the theoretical
approximation calculated using PHREEQC code assuming dilute-solution conditions
with no electrostatic interactions between ions and bentonite surface. The activity
coefficients of dissolved ions in compacted bentonite were determined to be smaller than
the theoretical approximation in bulk water by at least a factor of three. The smaller
activity coefficient suggests a higher solubility, thus a higher mobility of radionuclides in
compacted bentonite.
Chapter 3 presented the migration behavior of Ca2+ and HCO3-/CO3
2- ions in
compacted Na-bentonite packed at the dry density of 1.0 kg/dm3 under electrical potential
gradient. Two kinds of electromigration experiments were carried out in this study. The
first was the electromigration using thin layer source to obtain electromigration
parameters of Ca2+ and HCO3-/CO3
2- ions. The second was the same a in Chapter 2 but
with the variation of electromigration time. The results showed that under the
experimental conditions, the mobility of Ca2+ ions was approximately an order of
magnitude faster compared to that of HCO3-/CO3
2- ions. The reaction front of CaCO3
precipitation under the experimental conditions was found to move from the anode side
towards the cathode side. The velocity of this reaction front was obtained to be constant
during the experiments, unaffected by the formation of CaCO3. The results suggest that
major migration pathways of cations in compacted bentonite may be the interlayers,
135
whereas the precipitates are formed in inter-particle pores, thus the migration of cationic
radionuclides may be unaffected by precipitate formation.
Chapter 4 presented the mechanisms of anions diffusion from the diffusion
experiments of 35SO42- ions in Na-bentonite at various dry densities, diffusion
temperatures, and NaCl concentrations. Back-to-back diffusion experiments were
conducted to obtain the Da values. The Ea values were calculated from the experimental
Da values as a function of temperature using Arrhenius equation. The Ea value of SO42-
ions in water saturated compacted bentonite at dry density of 0.8 kg/dm3 was close to that
in free water, suggesting that the porewater diffusion is predominant. This Ea value
decreased to become lower than that in free water when the dry densities of compacted
bentonite were higher than 1.0 kg/dm3, showing that the porewater diffusion process may
not be able to explain the dominant diffusion process. The Ea value increased to be equal
to that in free water when salinity was increased up to 0.5 M at the dry density of 1.0
kg/dm3, suggesting the increased pore space produced by the higher salinity may have
made the pore diffusion dominant again. This finding suggests porewater diffusion may
not be the dominant pathway for anions at high dry densities. It also suggests that
dominant diffusion pathways for anions in compacted bentonite can be affected by
salinity, indicating the possible involvement of the EDL on montmorillonite surface.
This thesis focused on the compacted bentonite system, which will be used as an
engineered barrier in geological disposal. Major findings include estimation of activity
coefficient, dominant migration pathways of cations and anions, and effects of precipitate
formation on ion migration in the compacted bentonite system. These findings are
expected to contribute to improvements of accuracy and confidence in safety assessment
of geological disposal by enhancing the scientific understanding of the system.
136
Acknowledgement
I would like to express my sincere gratitude to my supervisor, Prof. Tamotsu
Kozaki for his countless support and guidance throughout my study. My gratitude also
goes to Associate Prof. Naoko Watanabe for her kind help and discussion, not only in
study and research but also in daily life. My grateful thanks also to Assistant Prof. Shingo
Tanaka for sharing his knowledge and helping in the experiment.
I would also like to thank to Prof. Michitsugu Mori, Prof. Takashi Kamiyama,
and Associate Prof. Ryoko Fujiyoshi for their valuable comments that improved the
contents of this thesis. My appreciation goes to all members in Laboratory of Nuclear and
Environmental Materials: laboratory secretary Keiyaki-san, Carlos, Mizukami, Kitazawa,
Kubota, Takenaka, Hiroaki, Sato, Kimoto, Akiyama, Ishii, Senga, and others who have
graduated that I cannot mentioned here for their help and the pleasant atmosphere at the
laboratory. The help from E3 Program for the administration of my study is also greatly
appreciated.
The experiment with radiotracer was performed at the Central Institute of Isotope
Science, Hokkaido University. The SEM/EDS analysis was conducted at the High
Voltage Electron Microscope Laboratory, Center for Advanced Research of Energy and
Materials, Hokkaido University. Powder X-ray diffraction experiment was carried out in
Material Analysis and Material Analysis and Structure Analysis Open Unit (MASAOU),
Hokkaido University.
My grateful acknowledgement goes to Radioactive Waste Technology Center,
National Nuclear Energy Agency of Indonesia (PTLR-BATAN), my direct supervisor
Pak Yayak, and Head of the Center Pak Husen. The administration for my temporary
leave for study is supported by Pusdiklat-BATAN. Financial support for my study is
137
provided by Ministry of Research, Technology and Higher Education of Indonesia
(Kemenristekdikti) through RISET-Pro program.
I am grateful to my children Zikri and Harumi, and their mother Reni for their
support and understanding. Finally, to my parents, there are no words to sufficiently
express my gratitude.