Embed Size (px)
DESCRIPTION
thesis
Citation preview
Passive Tracking and System Interfacesfor Interventional MRI
Inauguraldissertation
zur Erlangung der Wurde eines Doktors der Philosophie
vorgelegt der
Philosophisch-Naturwissenschaftlichen Fakultat
der Universitat Basel
von
Sunil Patilaus Mumbai, Indien
Basel, 2009
Genehmigt von der Philosophisch-Naturwissenschaftlichen Fakultat
auf Antrag von:
Prof. Dr. Klaus Scheffler
Referent
Prof. Dr. Mark Ladd
Korreferent
Basel, den 23.06.2009
Prof. Dr. Eberhard Parlow
Dekan
Abstract
One of the major pre-requisite of MR-guided interventions is the visualiza-tion and localization of interventional devices relative to the vascular systemand surrounding tissues. A number of approaches have been proposed fordevice visualization in an MR environment that are categorized into active,passive and semi-active techniques. In spite of considerable growth of thesetechniques, there is a scope to investigate and develop new pulse sequencesand system interfaces for these techniques to make clinically feasible. Inthis thesis fast and novel passive tracking approaches to efficiently visualizeand track the interventional guidewire tip using positive contrast are pro-vided and highly miniaturized active micro-coils with built-in pre-amplifierare introduced.
In passive tracking techniques, the paramagnetic markers are utilizedhaving susceptibility differences with respect to surrounding water protons.When this marker is placed in a uniform main magnetic field B0, it causesignificant field inhomogeneities leading to dual effect of local frequencyshifts and local gradient induction in marker’s immediate surrounding.
The first method introduced in this thesis exploit the local frequencyshifts induced by paramagnetic marker to create positive contrast. Thebinomial spatial-spectral (SPSP) excitation pulse that selectively excitesthe spectral component of the off-resonant tissues in the close proximityof the marker material and within the selected spatial region is incorpo-rated into a temporally efficient steady state free precession (SSFP)-echosequence. In this work, the principle of off-resonance excitation of tis-sues using SPSP pulse is explained theoretically. The in-vitro experimentsdemonstrate the proper localization and feasibility of paramagnetic markerdetection mounted on the interventional guidewire tip. The analysis of thesignal and localization characteristics of the SPSP pulse is done theoreticallyand verified experimentally.
The next novel positive contrast method for passive localization andvisualization of paramagnetic susceptibility markers is based on an echo-dephased SSFP sequence. Gradients dephase any signal by ±π at the cen-tered echo-time (TE=TR/2) and induce a total dephasing of ±2π per pixelwithin TR. This ensures that background tissues do not contribute to signalformation and thus appear dark. However, within the close vicinity of the
iii
paramagnetic marker, local gradient fields compensate for the intrinsic de-phasing to form an echo. Conceptual issues of gradient compensation and itsvisualization characteristics are analyzed. The flow phantom experimentsconcluded that reliable tracking of the interventional guidewire is feasibleusing echo-dephased SSFP. Finally utilization of echo-dephased SSFP forpositive contrast visualization of SPIO-labeled islet cells is demonstratedboth in vitro and in vivo.
A novel and fast approach for passive real-time tracking of interven-tional devices using paramagnetic markers termed Projection Reconstruc-tion Imaging with Echo-Dephasing (PRIDE) is also presented in this thesis.PRIDE is based on the acquisition of echo-dephased projections along allthree physical axes. Dephasing is preferably set to 4π within each projec-tion ensuring that background tissues do not contribute to signal formationand thus appear heavily suppressed. However, within the close vicinity ofthe paramagnetic marker, local gradient fields compensate for the intrin-sic dephasing to form an echo. Successful localization of the paramagneticmarker with PRIDE is demonstrated in-vitro and in-vivo in the presenceof different types of off-resonance (air/tissue interfaces, main magnetic fieldinhomogeneities, etc). In order to utilize the PRIDE sequence for vascu-lar interventional applications, it was interleaved with balanced steady-statefree precession (bSSFP) to provide positional updates to the imaged slice us-ing a dedicated real-time feedback link. Active slice positioning with PRIDEis demonstrated in vitro requiring approximately 20 ms for the positionalupdate to the imaging sequence comparable to existing active tracking meth-ods.
The active tracking method of device visualization utilizes locally sensi-tive transmit/receive coils for localization and visualization of its tip. Thelocalization of the coil is achieved in few milliseconds through acquisitionof one dimensional (1D) projections along all three spatial directions (X, Yand Z). However, the dimensions of these coils are bulky in nature therebyincreasing the size of normal interventional devices (for e.g. catheter). Inorder to overcome this disadvantage in the last part of this thesis, highlyminiaturized micro coils with built-in amplifier are introduced and experi-mentally tested.
iv
Acknowledgment
During the persuit of my PhD degree, I have been graciously affected by somany people in my life. I would like to take this opportunity to express mydeepest gratitude towards them.
The first person I would like to thank is my research supervisor Prof.Klaus Scheffler for giving me an opportunity to pursue doctoral work underhis guidance. I also would like to thank him for giving me means, toolsand freedom to pursue my research directions. He showed utmost desire toestablish collaborations to forward the research work. Its been steep butsmooth learning curve to work under his able leadership.
Its been a sheer joy and a privilege to share office with Oliver Bieri andsee him working so closely. I definitely look up to him as one of the finest,dedicated and intelligent researcher I have ever come across. It was fromhim that I learned so much about physical principles of SSFP.
Many many thanks to my dearest friend, Francesco Santini. We startedthe journey of PhD on the same day and bonded well since then. We sharea great camaraderie not only at work place but also outside of the lab. Mygratitude extends to his wonderful family as well, who always made me feelat home whenever I visited them.
I owe a great deal of gratitude to Markus Klarhofer. His altruistic naturecoupled with kindness means that he is been always there for me to help.He is THE MRI guy with keenness to learn all aspects MRI from anyonewho might know. Its been great to work with him.
Oliver Weber has been good friend, office-mate and a mentor for me.He is one of the kindest and gentlest person I have come across. Over theyears, I have started admiring his professional style of working and his vastknowledge in the field. He is been great source of advice and encouragement.Oliver, thanks for everything.
I express my kind gratitude to Permi Jhooti for helping me during myinitial stages of work and offering me valuable tips throughout my work.
I also acknowledge the support of Christian Boller for helping me tosettle in Switzerland, for offering many tips on sequence programming aswell as basics of MR-physics.
The work on interventional project always requires skilled technicianshelp. Special thanks to Tanja Haas for her help with setting up the flow
v
phantom, handling different devices, offering tips on setting up protocolsetc.
A lively and charming environment in our group has been wonderfullyset, thanks to Claudia’s warm nature, quiet yet smiling Monika, cool andcalm Christoph, Henk-Joost with his side-splitting remarks. Thanks to allof you for having such a wonderful time together.
I would also like to thank my academic collaborators outside of my group.I thank Harald H. Quick from Essen for helping me to try out my sequenceson a pig model. My special thanks also go to Michael Bock and ReinerUmathum from Heidelberg for helping me with pig studies, having fruitfuldiscussions ranging from sequences to coils. I would also like to acknowledgeJens Anders and Giovanni Boero from Lausanne for helping me with coilwork. Special thanks also to Daniel Jirak from Institute of Clinical andExperimental Medicine in Prague. His expertise in islet labeling coupledwith his generous and warm nature has been immensely helpful to get thesome of the results presented in this thesis.
Being landed in a country like Switzerland, it was natural to look forIndian friends to feel at home. Abiraj, to whom I consider as my elderbrother aptly filled that place. I would also like to thank Prasad, Navratnaand all members of Humlog; Basel Indian community for giving so manygood memories to cherish through organization of events.
Although personally the journey of PhD was started three and half yearsago, I had started sowing the seeds right after my Bachelors degree. Un-doubtedly that was the toughest experience I had in my life so far. Myheartfelt thanks to a friend and mentor Shrikant Masurekar, who supportedand encouraged me during my initial struggling days. My close and dearfriends who are been always there with me through thick and thin are: Amit,Nikhil, Abhishek, Hrishikesh, Manish, Smita, Mrudula and Manohar. Yourlove and unwavering support means a lot to me.
I would not have been successful in this endeavor without the bless-ings of my parents. The amount of affection that my mom, dad and myyoung sisters; Anandi and Sadhana is been showering on me is immeasur-able. Their rock solid support is been largely responsible for strengtheningmy ambitions. I dedicate this thesis to them.
Sunil Patil
vi
Publications Arising FromThis Thesis
Papers in international Journals
• S. Patil, O.Bieri, P. Jhooti, K. Scheffler, “An Automatic Slice Posi-tioning for Passive Real-Time Tracking of Interventional Devices UsingProjection Reconstruction Imaging with Echo-Dephasing (PRIDE)”,Magn. Reson. in Med., In Press, 2009.
• S. Patil, O. Bieri, and K. Scheffler, “Echo-dephased steady state freeprecession”, Magma (New York, N.Y.), May 2009. PMID: 19449047
• F. Santini, S. Patil, S. Meckel, K. Scheffler, SG. Wetzel, “DoubleReference Cross-Correlation Algorithm for Separation of the Arteriesand Veins from 3D MRA Time Series”, J. Magn. Reson. Imaging,28(4):646-54, 2008.
• O. Bieri, S. Patil, H. Quick, and K. Scheffler, “Morphing steady-statefree precession”, Magn Reson Med, vol. 58, p. 1242-8, Dec. 2007.
• F. Santini, T. Schubert, S. Patil, S. Meckel, S.G. Wetzel, K. Scheffler,“Automatic reference selection for artery/vein separation from time-resolved 3D contrast-enhanced MRA datasets”, Journal of MagneticResonance Imaging, under review.
• S. Patil, D. Jirak, M. Hajek, K. Scheffler, “Positive Contrast Vi-sualization of the SPIO-labled Pancreatic Islets using Echo-dephasedSteady State Free Precession”, Mangetic Resonance in Medicine, inpreparation.
Conference Contributions
• S. Patil, R. Umathum, M. Bock, J. Anders, G. Boero, K. Scheffler,“Highly miniaturized micro coil for tracking of the interventional de-vices”, Proceedings of the 17th Scientific meeting of ISMRM, Hawaii,pp. 2009.
vii
• S. Patil, O. Bieri, P. Jhooti, K. Scheffler, “Automatic slice positioningof the interventional device using passive paramagnetic markers”, Pro-ceedings of the 17th Scientific meeting of ISMRM, Hawaii, pp. 2009.
• S. Patil, O. Sabrowski, F. Santini, O. Bieri, K. Scheffler, “Posi-tive contrast visualization of SPIO labeled cells using Echo dephasedSSFP”, ESMRMB 2008 Congress, Valencia, Spain, 2-4 October: EPOSGao Posters/Info-RESO. Magma:775;21 Suppl 1:235-489, 2008.
• S. Patil, R. Umathum, M. Bock, J. Anders, G. Boero, K. Scheffler,“Highly miniaturised micro coil for tracking of the interventional de-vices”, Proceedings of the 7th Interventional MRI Symposium (OralPresentation), 2008.
• S. Patil, O. Bieri, P. Jhooti, K. Scheffler, “Automatic slice position-ing of the interventional device using passive paramagnetic markers”,Proceedings of the 7th Interventional MRI Symposium, 2008.
• P. Jhooti, S. Blanco, S. Patil, K. Scheffler, “MRI scanner controlusing foot controllers during MR-guided interventions: when one pairof hands just isn’t enough”, Proceedings of the 7th Interventional MRISymposium, 2008.
• S. Patil, O. Bieri, P. Jhooti, D. Bilecen, K. Scheffler, “Passive guidewire visualization in an interventional MRI using dephased SSFP”,Proceedings of the 19th International Conference on Magnetic Reso-nance Angiography (Oral Presenation), 2007.
• O. Bieri, S. Patil, K. Scheffler, “Morphing-SSFP: A new method forfast detection of strong magnetic field inhomogeneities and its appli-cation for tracking ferromagnetic devices”, Proceedings of 15th jointannual meeting ISMRM-ESMRMB, Berlin,Germany, pp. 294, 2007.
• S. Patil, C. Boller, D. Bilecen, K. Scheffler, “Visualization of theparamagnetic markers in interventional MRI using spatial-spectralpulses”, Proceedings of 15th joint annual meeting ISMRM-ESMRMB,Berlin,Germany, pp. 1122, 2007.
• S. Patil, O. Bieri, D. Bilecen, K. Scheffler, “An Echo-dephased SPGRapproach to generate positive contrast due to paramagnetic marker:an interventional MRI application”, Proceedings of 15th joint annualmeeting ISMRM-ESMRMB, Berlin,Germany, pp. 1119, 2007.
• F Santini, S. Patil, S. Meckel, K. Scheffler, S. Wetzel, “Artery/veinseparation and fistula detection in MR angiography through double-reference correlation analysis”, Proceedings of the 31st Congress ofESNR (Oral Presentation), Geneva, Switzerland, 2006.
viii

• F. Santini, S. Patil, S. Meckel, S. Wetzel, K. Scheffler, “Double-reference correlation algorithm for artery and vein separation in con-trast enhanced MR angiography”, Proceedings of the 23rd annual sci-entific meeting of ESMRMB, Warsaw, Poland, pp. 47-48, 2006.
• S. Patil, D. Bilecen, K. Scheffler, “Efficient Marker Detection UsingVariable Dephasing Gradient Double Echo Sequence-an InterventionalMRI Application”, Proceedings of the 23rd annual scientific meetingof ESMRMB (Oral Presentation), Warsaw, Poland, pp. 173-174, 2006.
ix
Contents
Abstract iii
Acknowledgment v
List of Publications vii
1 Introduction to MR device Tracking 1
1.1 Introduction . . . . . . . . . . . . . . . . . . . . . . . . . . . . 2
1.2 Active Tracking . . . . . . . . . . . . . . . . . . . . . . . . . . 3
1.3 Semi-active Tracking . . . . . . . . . . . . . . . . . . . . . . . 4
1.4 Passive Tracking . . . . . . . . . . . . . . . . . . . . . . . . . 5
1.4.1 Morphing SSFP . . . . . . . . . . . . . . . . . . . . . 9
1.5 Aim of this Thesis . . . . . . . . . . . . . . . . . . . . . . . . 13
1.6 Outline of the Thesis . . . . . . . . . . . . . . . . . . . . . . . 14
2 Positive Contrast Imaging of the Paramagnetic Markers Us-
ing Spatial-Spectral Excitation Pulse 23
2.1 Introduction . . . . . . . . . . . . . . . . . . . . . . . . . . . . 24
2.2 Theory . . . . . . . . . . . . . . . . . . . . . . . . . . . . . . . 25
2.2.1 Local Frequency Shifts . . . . . . . . . . . . . . . . . . 25
2.2.2 Spatial-Spectral RF Pulses . . . . . . . . . . . . . . . 25
2.3 Materials And Methods . . . . . . . . . . . . . . . . . . . . . 28
2.3.1 In Vitro Experiments . . . . . . . . . . . . . . . . . . 28
2.3.2 Imaging Experiments . . . . . . . . . . . . . . . . . . 29
2.3.3 Signal Characteristics of the SPSP pulse . . . . . . . . 29
2.4 Results . . . . . . . . . . . . . . . . . . . . . . . . . . . . . . . 29
2.4.1 In-Vitro Imaging . . . . . . . . . . . . . . . . . . . . . 31
2.4.2 Off-resonant Excitation Frequency Dependence . . . . 32
2.4.3 RF Pulse Count Dependence . . . . . . . . . . . . . . 32
2.5 Discussion . . . . . . . . . . . . . . . . . . . . . . . . . . . . . 34
2.6 Conclusion . . . . . . . . . . . . . . . . . . . . . . . . . . . . 36
x
3 Echo-dephased Steady State Free Precession 39
3.1 Introduction . . . . . . . . . . . . . . . . . . . . . . . . . . . . 40
3.2 Materials and Methods . . . . . . . . . . . . . . . . . . . . . . 41
3.2.1 Local Gradient Field Effect . . . . . . . . . . . . . . . 41
3.2.2 Echo-dephased SSFP . . . . . . . . . . . . . . . . . . 41
3.2.3 Guidewire and Phantom . . . . . . . . . . . . . . . . . 44
3.2.4 Passive Tracking Experiments . . . . . . . . . . . . . . 45
3.2.5 Pancreatic Islet Cell Transplantation . . . . . . . . . . 45
3.3 Results . . . . . . . . . . . . . . . . . . . . . . . . . . . . . . . 46
3.3.1 Signal Characteristics of echo-dephased SSFP . . . . . 46
3.3.2 Phantom Experiments . . . . . . . . . . . . . . . . . . 47
3.3.3 Localization Characteristics of echo-dephased SSFP . 49
3.3.4 Passive Tracking . . . . . . . . . . . . . . . . . . . . . 49
3.3.5 Pancreatic Islet Cell Visualization . . . . . . . . . . . 52
3.4 Discussion . . . . . . . . . . . . . . . . . . . . . . . . . . . . . 56
3.5 Conclusion . . . . . . . . . . . . . . . . . . . . . . . . . . . . 59
4 Projection-Reconstruction Imaging with Echo-Dephasing 63
4.1 Introduction . . . . . . . . . . . . . . . . . . . . . . . . . . . . 64
4.2 Materials and Methods . . . . . . . . . . . . . . . . . . . . . . 66
4.2.1 Local Gradient Fields . . . . . . . . . . . . . . . . . . 66
4.2.2 Projection Reconstruction Imaging withEcho-Dephasing (PRIDE) . . . . . . . . . . . . . . . . 66
4.2.3 Guidewire and Phantom . . . . . . . . . . . . . . . . . 67
4.2.4 PRIDE and Imaging Experiments . . . . . . . . . . . 69
4.2.5 Automatic Slice Positioning . . . . . . . . . . . . . . 69
4.2.6 Slice Position Calculation . . . . . . . . . . . . . . . . 70
4.2.7 In Vivo Measurements . . . . . . . . . . . . . . . . . . 71
4.3 Results . . . . . . . . . . . . . . . . . . . . . . . . . . . . . . . 71
4.3.1 In-Vitro Measurements . . . . . . . . . . . . . . . . . 71
4.3.2 Localization Accuracy of PRIDE . . . . . . . . . . . . 73
4.3.3 Automatic Slice Positioning . . . . . . . . . . . . . . . 73
4.3.4 In Vivo Validation . . . . . . . . . . . . . . . . . . . . 76
4.4 Discussion . . . . . . . . . . . . . . . . . . . . . . . . . . . . . 76
4.5 Conclusion . . . . . . . . . . . . . . . . . . . . . . . . . . . . 79
5 Highly Miniaturized Micro coils To Track Interventional De-
vices 83
5.1 Overview . . . . . . . . . . . . . . . . . . . . . . . . . . . . . 84
5.2 Experimental Setup . . . . . . . . . . . . . . . . . . . . . . . 84
5.2.1 Probe sample . . . . . . . . . . . . . . . . . . . . . . . 85
5.2.2 Acquisition Details . . . . . . . . . . . . . . . . . . . . 86
5.3 Results and Discussions . . . . . . . . . . . . . . . . . . . . . 87
5.3.1 Spectrum Measurement . . . . . . . . . . . . . . . . . 88
xi

5.3.2 Susceptibility Influence . . . . . . . . . . . . . . . . . 885.3.3 Imaging . . . . . . . . . . . . . . . . . . . . . . . . . . 905.3.4 Peak Detection . . . . . . . . . . . . . . . . . . . . . . 91
5.4 Conclusion . . . . . . . . . . . . . . . . . . . . . . . . . . . . 91
6 Summary And Future Outlook 95
6.1 Future Outlook . . . . . . . . . . . . . . . . . . . . . . . . . . 97
xii
Chapter 1
Introduction to MR deviceTracking
1
Introduction to MR device Tracking
1.1 Introduction
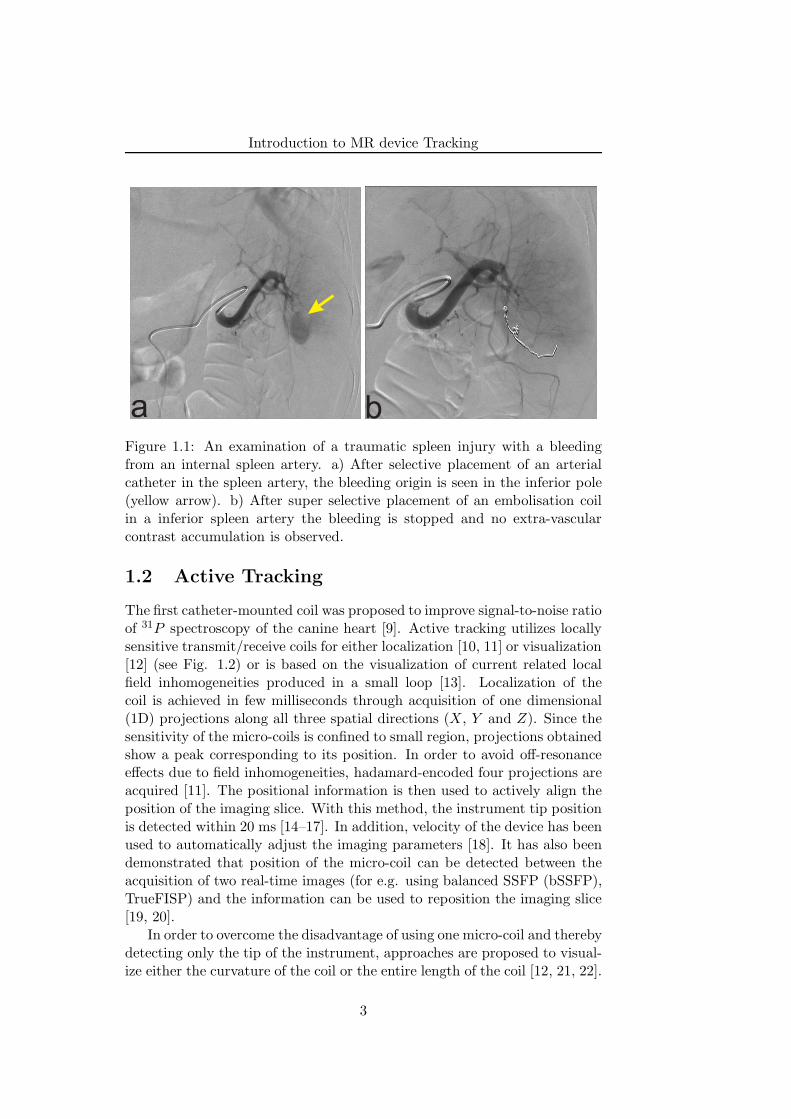
Adequate visualization of the vascular structure and surrounding anatomyas well as the devices inside the body is required to perform endovascularinterventions. Currently X-ray fluoroscopy and digital subtraction angiogra-phy (DSA) are used to visualize endovascular devices and contrast media inthe vessel lumen (see Fig. 1.1). This modality provides sufficient temporalresolution and a spatial resolution of the order of 0.1 mm, enough to resolveany vessel that can possibly be operated. Thus, this modality has provento be extremely successful with millions of patients annually diagnosed andtreated worldwide. X-ray fluoroscopy, however, provides poor soft-tissuecontrast and little functional information. The (iodinated) contrast agentsused under X-ray fluoroscopy cause adverse reactions in a significant num-ber of patients. Both medical personnel and patients are exposed to ionizingradiation [1].
Historically, MRI has not been considered as an alternative imagingmodality for endovascular procedures, primarily due to its relatively longimage acquisition times and the closed nature of the magnets. However, anumber of properties of MRI distinguish itself from other clinical modalities(for e.g. X-ray, PET) such as its lack of ionizing radiation, three-dimensionalimaging, arbitrary scan plane positioning, excellent soft-tissue and bone con-trast, its capability to acquire both anatomic and physiologic informationand the exploitation of the many functional parameters of MRI such as per-fusion, flow, diffusion, thermal imaging, and the blood oxygenation level-dependent (BOLD) effect. These broad variety of available techniques makeMRI an attractive imaging method for diagnostic and therapeutic proce-dures. Due to the continued development of MR hardware for faster imageacquisition and reconstruction, along with developments such as steady statefree precession (SSFP) and parallel imaging techniques, real-time MR imag-ing is now a clinical reality[2, 3]. With the trend toward shorter and moreopen magnet designs, endovascular MR-guided interventions have evolvedfrom a research tool to a preclinical method over the last decade with a fewapplications that have entered the clinical arena [4].
In clinical practice, however, one of MRI’s drawbacks is the difficultyin localization and high-contrast visualization of interventional devices (fore.g., guidewires, catheters, and needles). In addition, fast localization andautomatic adjustment of scan plane position is highly desirable. As a result,considerable efforts are being undertaken towards achieving these objectives.In the following, general overview of the strategies that are exploited tolocalize and/or visualize them is described in detail. Much of this overviewhas been inspired from existing literature [5–8]. Current methodologies forMR-guided interventions can be broadly classified into active, semi-activeand passive tracking.
2
Introduction to MR device Tracking
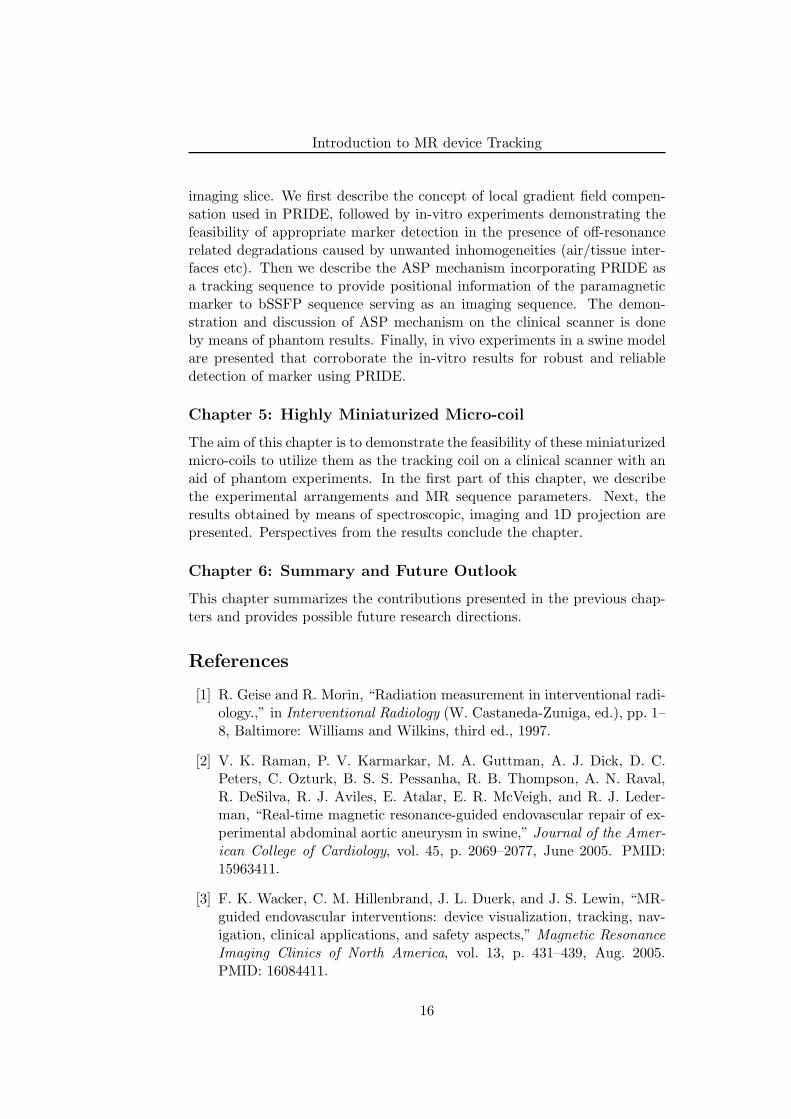
a bFigure 1.1: An examination of a traumatic spleen injury with a bleedingfrom an internal spleen artery. a) After selective placement of an arterialcatheter in the spleen artery, the bleeding origin is seen in the inferior pole(yellow arrow). b) After super selective placement of an embolisation coilin a inferior spleen artery the bleeding is stopped and no extra-vascularcontrast accumulation is observed.
1.2 Active Tracking
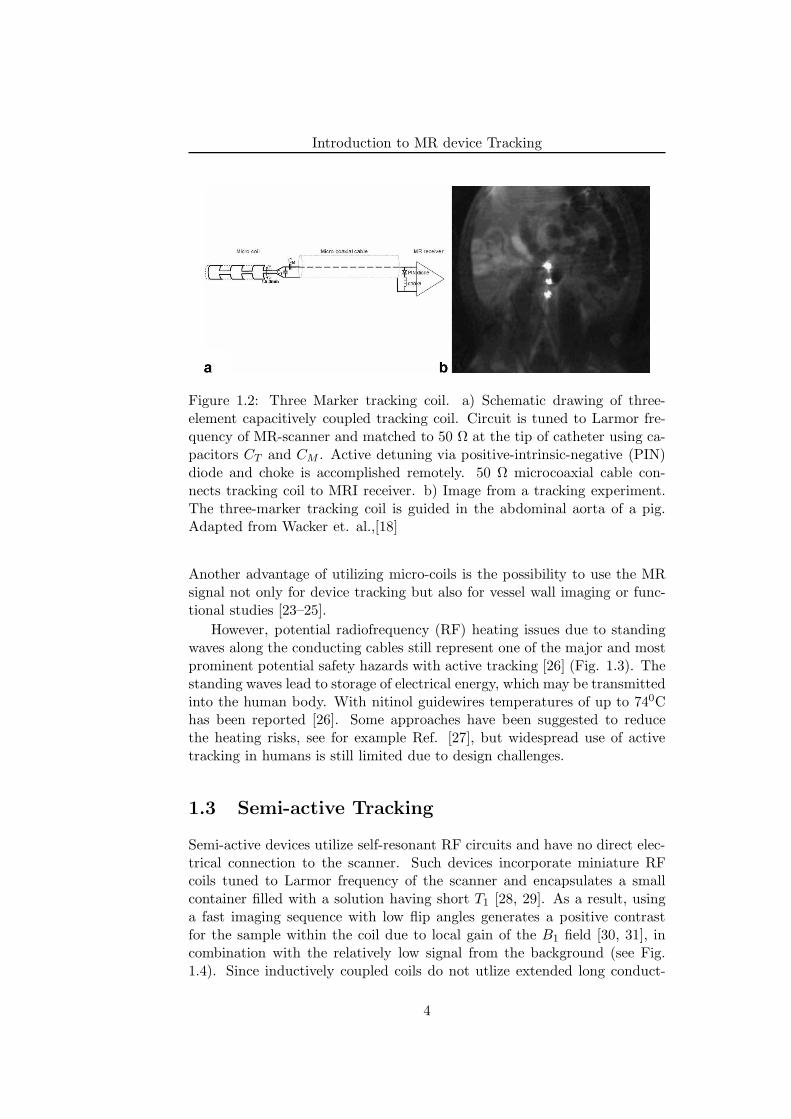
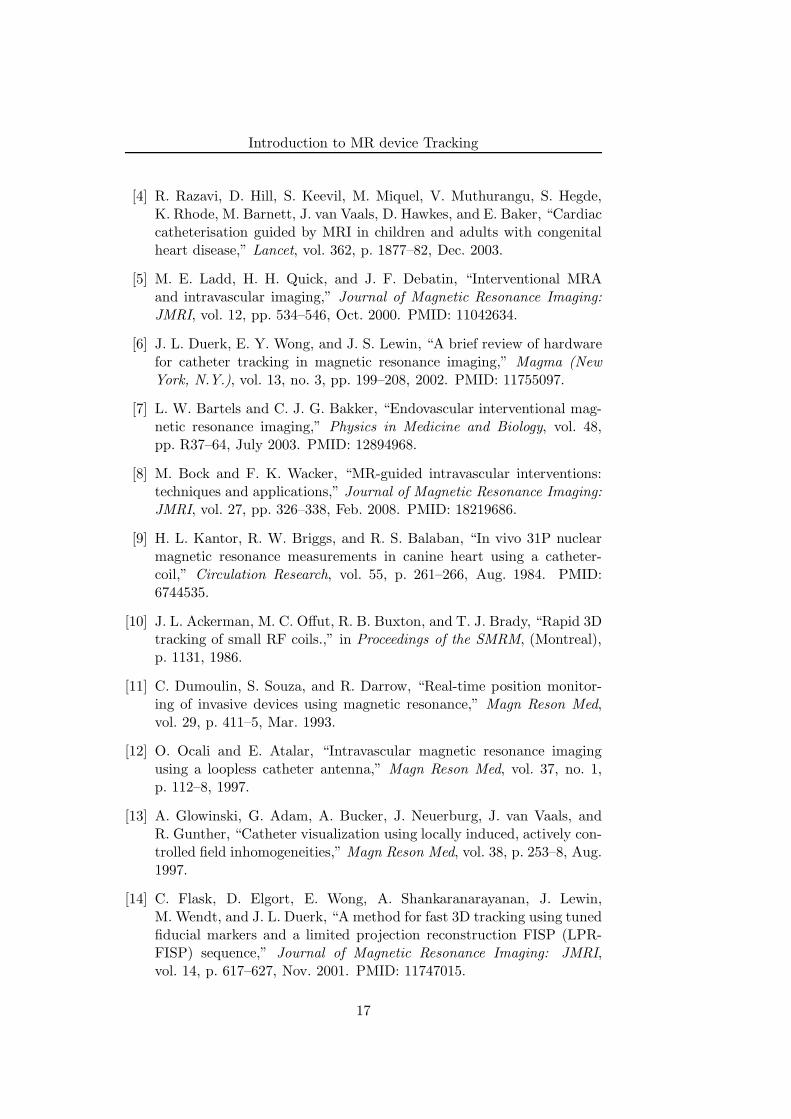
The first catheter-mounted coil was proposed to improve signal-to-noise ratioof 31P spectroscopy of the canine heart [9]. Active tracking utilizes locallysensitive transmit/receive coils for either localization [10, 11] or visualization[12] (see Fig. 1.2) or is based on the visualization of current related localfield inhomogeneities produced in a small loop [13]. Localization of thecoil is achieved in few milliseconds through acquisition of one dimensional(1D) projections along all three spatial directions (X, Y and Z). Since thesensitivity of the micro-coils is confined to small region, projections obtainedshow a peak corresponding to its position. In order to avoid off-resonanceeffects due to field inhomogeneities, hadamard-encoded four projections areacquired [11]. The positional information is then used to actively align theposition of the imaging slice. With this method, the instrument tip positionis detected within 20 ms [14–17]. In addition, velocity of the device has beenused to automatically adjust the imaging parameters [18]. It has also beendemonstrated that position of the micro-coil can be detected between theacquisition of two real-time images (for e.g. using balanced SSFP (bSSFP),TrueFISP) and the information can be used to reposition the imaging slice[19, 20].
In order to overcome the disadvantage of using one micro-coil and therebydetecting only the tip of the instrument, approaches are proposed to visual-ize either the curvature of the coil or the entire length of the coil [12, 21, 22].
3
Introduction to MR device Tracking
Figure 1.2: Three Marker tracking coil. a) Schematic drawing of three-element capacitively coupled tracking coil. Circuit is tuned to Larmor fre-quency of MR-scanner and matched to 50 Ω at the tip of catheter using ca-pacitors CT and CM . Active detuning via positive-intrinsic-negative (PIN)diode and choke is accomplished remotely. 50 Ω microcoaxial cable con-nects tracking coil to MRI receiver. b) Image from a tracking experiment.The three-marker tracking coil is guided in the abdominal aorta of a pig.Adapted from Wacker et. al.,[18]
Another advantage of utilizing micro-coils is the possibility to use the MRsignal not only for device tracking but also for vessel wall imaging or func-tional studies [23–25].
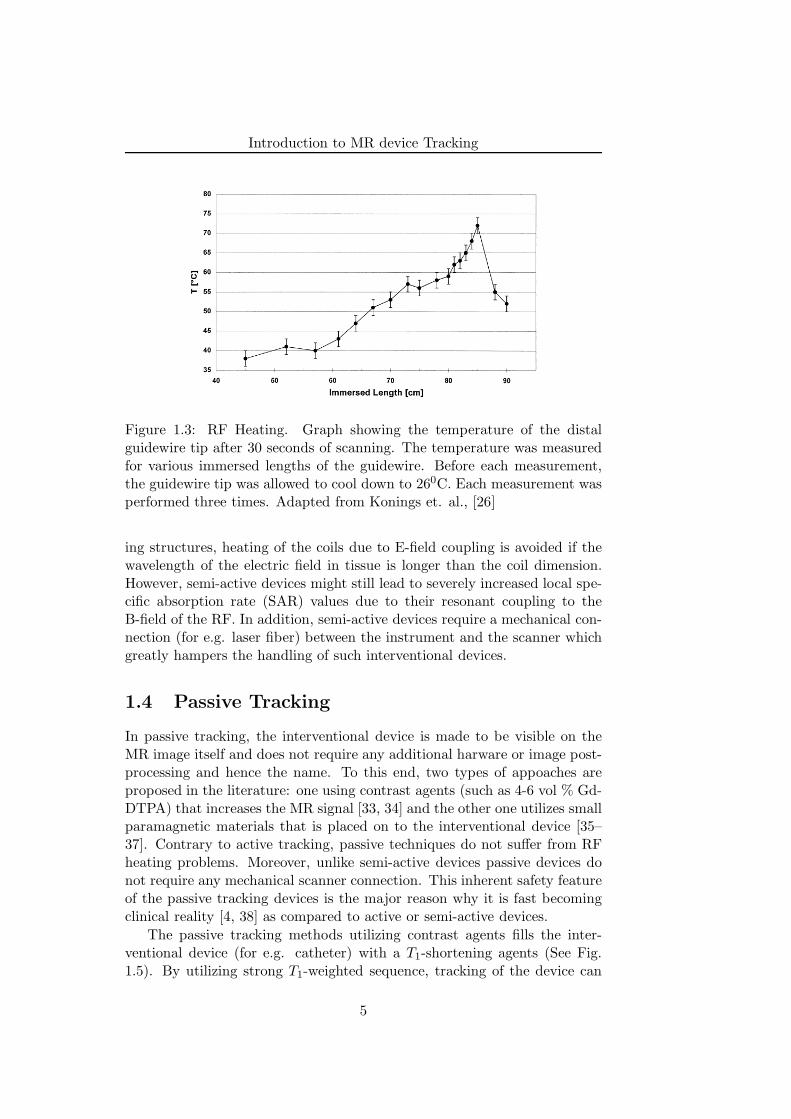
However, potential radiofrequency (RF) heating issues due to standingwaves along the conducting cables still represent one of the major and mostprominent potential safety hazards with active tracking [26] (Fig. 1.3). Thestanding waves lead to storage of electrical energy, which may be transmittedinto the human body. With nitinol guidewires temperatures of up to 740Chas been reported [26]. Some approaches have been suggested to reducethe heating risks, see for example Ref. [27], but widespread use of activetracking in humans is still limited due to design challenges.
1.3 Semi-active Tracking
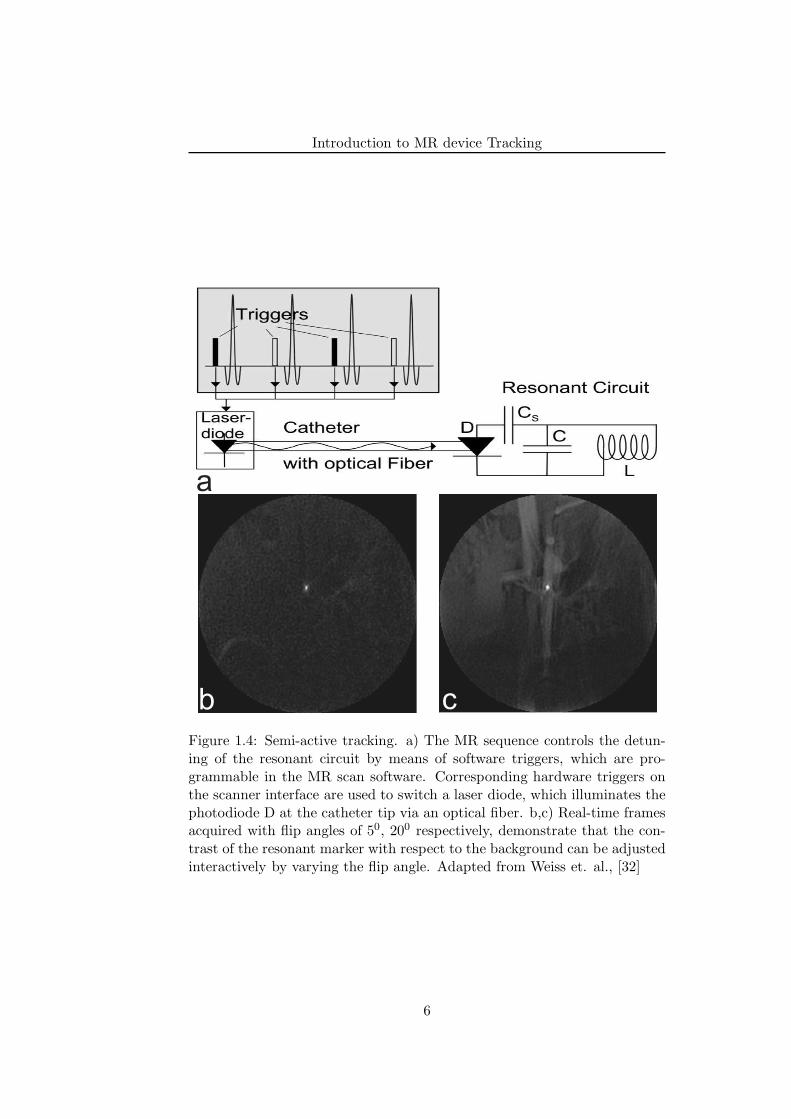
Semi-active devices utilize self-resonant RF circuits and have no direct elec-trical connection to the scanner. Such devices incorporate miniature RFcoils tuned to Larmor frequency of the scanner and encapsulates a smallcontainer filled with a solution having short T1 [28, 29]. As a result, usinga fast imaging sequence with low flip angles generates a positive contrastfor the sample within the coil due to local gain of the B1 field [30, 31], incombination with the relatively low signal from the background (see Fig.1.4). Since inductively coupled coils do not utlize extended long conduct-
4
Introduction to MR device Tracking
Figure 1.3: RF Heating. Graph showing the temperature of the distalguidewire tip after 30 seconds of scanning. The temperature was measuredfor various immersed lengths of the guidewire. Before each measurement,the guidewire tip was allowed to cool down to 260C. Each measurement wasperformed three times. Adapted from Konings et. al., [26]
ing structures, heating of the coils due to E-field coupling is avoided if thewavelength of the electric field in tissue is longer than the coil dimension.However, semi-active devices might still lead to severely increased local spe-cific absorption rate (SAR) values due to their resonant coupling to theB-field of the RF. In addition, semi-active devices require a mechanical con-nection (for e.g. laser fiber) between the instrument and the scanner whichgreatly hampers the handling of such interventional devices.
1.4 Passive Tracking
In passive tracking, the interventional device is made to be visible on theMR image itself and does not require any additional harware or image post-processing and hence the name. To this end, two types of appoaches areproposed in the literature: one using contrast agents (such as 4-6 vol % Gd-DTPA) that increases the MR signal [33, 34] and the other one utilizes smallparamagnetic materials that is placed on to the interventional device [35–37]. Contrary to active tracking, passive techniques do not suffer from RFheating problems. Moreover, unlike semi-active devices passive devices donot require any mechanical scanner connection. This inherent safety featureof the passive tracking devices is the major reason why it is fast becomingclinical reality [4, 38] as compared to active or semi-active devices.
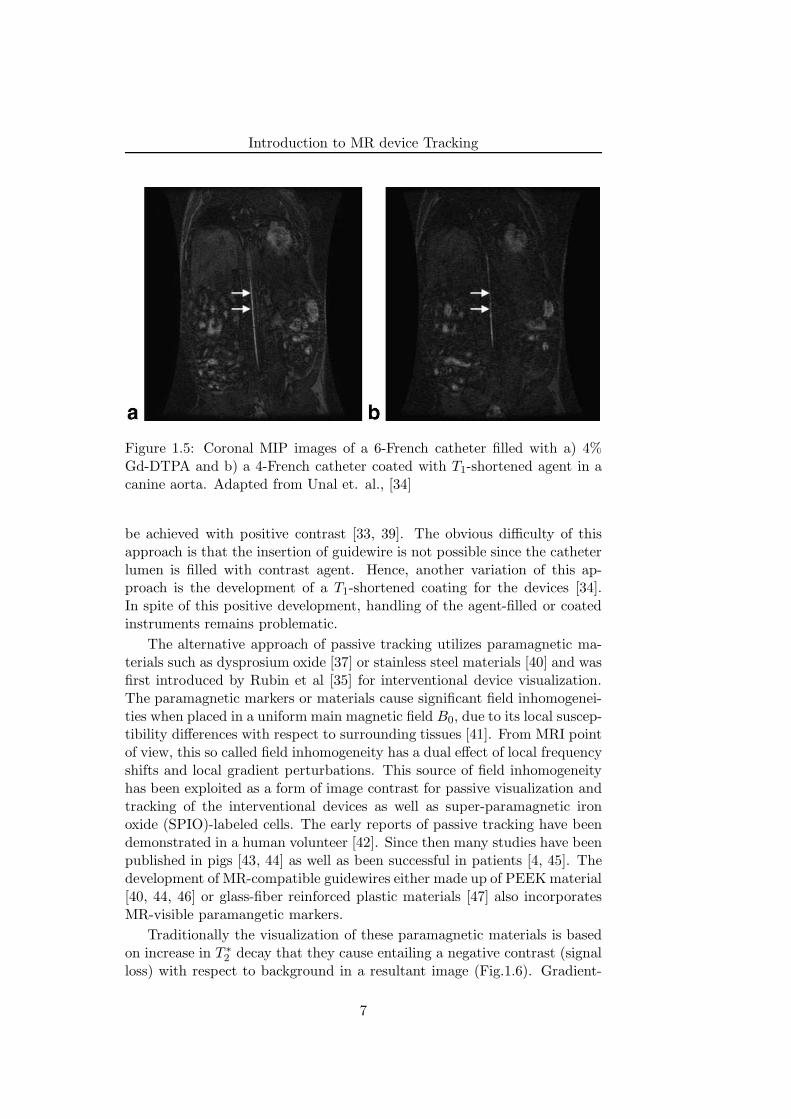
The passive tracking methods utilizing contrast agents fills the inter-ventional device (for e.g. catheter) with a T1-shortening agents (See Fig.1.5). By utilizing strong T1-weighted sequence, tracking of the device can
5
Introduction to MR device Tracking
a
b c
Figure 1.4: Semi-active tracking. a) The MR sequence controls the detun-ing of the resonant circuit by means of software triggers, which are pro-grammable in the MR scan software. Corresponding hardware triggers onthe scanner interface are used to switch a laser diode, which illuminates thephotodiode D at the catheter tip via an optical fiber. b,c) Real-time framesacquired with flip angles of 50, 200 respectively, demonstrate that the con-trast of the resonant marker with respect to the background can be adjustedinteractively by varying the flip angle. Adapted from Weiss et. al., [32]
6
Introduction to MR device Tracking
Figure 1.5: Coronal MIP images of a 6-French catheter filled with a) 4%Gd-DTPA and b) a 4-French catheter coated with T1-shortened agent in acanine aorta. Adapted from Unal et. al., [34]
be achieved with positive contrast [33, 39]. The obvious difficulty of thisapproach is that the insertion of guidewire is not possible since the catheterlumen is filled with contrast agent. Hence, another variation of this ap-proach is the development of a T1-shortened coating for the devices [34].In spite of this positive development, handling of the agent-filled or coatedinstruments remains problematic.
The alternative approach of passive tracking utilizes paramagnetic ma-terials such as dysprosium oxide [37] or stainless steel materials [40] and wasfirst introduced by Rubin et al [35] for interventional device visualization.The paramagnetic markers or materials cause significant field inhomogenei-ties when placed in a uniform main magnetic field B0, due to its local suscep-tibility differences with respect to surrounding tissues [41]. From MRI pointof view, this so called field inhomogeneity has a dual effect of local frequencyshifts and local gradient perturbations. This source of field inhomogeneityhas been exploited as a form of image contrast for passive visualization andtracking of the interventional devices as well as super-paramagnetic ironoxide (SPIO)-labeled cells. The early reports of passive tracking have beendemonstrated in a human volunteer [42]. Since then many studies have beenpublished in pigs [43, 44] as well as been successful in patients [4, 45]. Thedevelopment of MR-compatible guidewires either made up of PEEK material[40, 44, 46] or glass-fiber reinforced plastic materials [47] also incorporatesMR-visible paramangetic markers.
Traditionally the visualization of these paramagnetic materials is basedon increase in T ∗
2 decay that they cause entailing a negative contrast (signalloss) with respect to background in a resultant image (Fig.1.6). Gradient-
7
Introduction to MR device Tracking
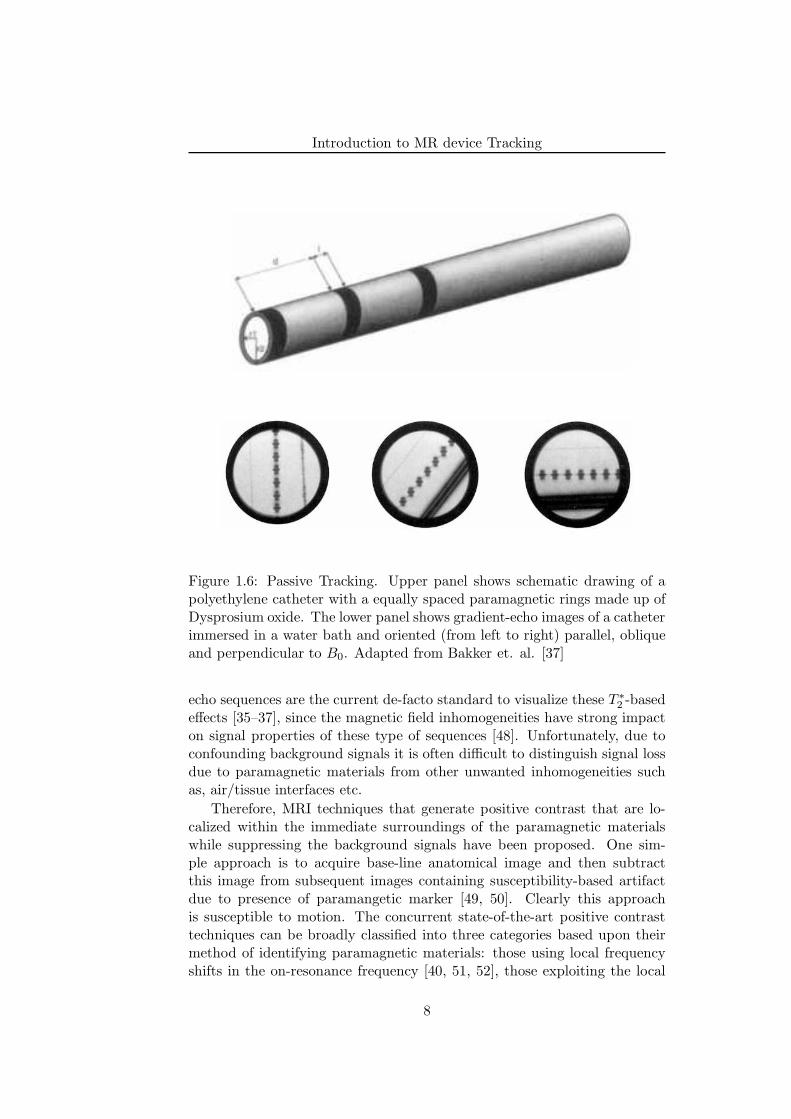
Figure 1.6: Passive Tracking. Upper panel shows schematic drawing of apolyethylene catheter with a equally spaced paramagnetic rings made up ofDysprosium oxide. The lower panel shows gradient-echo images of a catheterimmersed in a water bath and oriented (from left to right) parallel, obliqueand perpendicular to B0. Adapted from Bakker et. al. [37]
echo sequences are the current de-facto standard to visualize these T ∗
2 -basedeffects [35–37], since the magnetic field inhomogeneities have strong impacton signal properties of these type of sequences [48]. Unfortunately, due toconfounding background signals it is often difficult to distinguish signal lossdue to paramagnetic materials from other unwanted inhomogeneities suchas, air/tissue interfaces etc.
Therefore, MRI techniques that generate positive contrast that are lo-calized within the immediate surroundings of the paramagnetic materialswhile suppressing the background signals have been proposed. One sim-ple approach is to acquire base-line anatomical image and then subtractthis image from subsequent images containing susceptibility-based artifactdue to presence of paramangetic marker [49, 50]. Clearly this approachis susceptible to motion. The concurrent state-of-the-art positive contrasttechniques can be broadly classified into three categories based upon theirmethod of identifying paramagnetic materials: those using local frequencyshifts in the on-resonance frequency [40, 51, 52], those exploiting the local
8
Introduction to MR device Tracking
ba
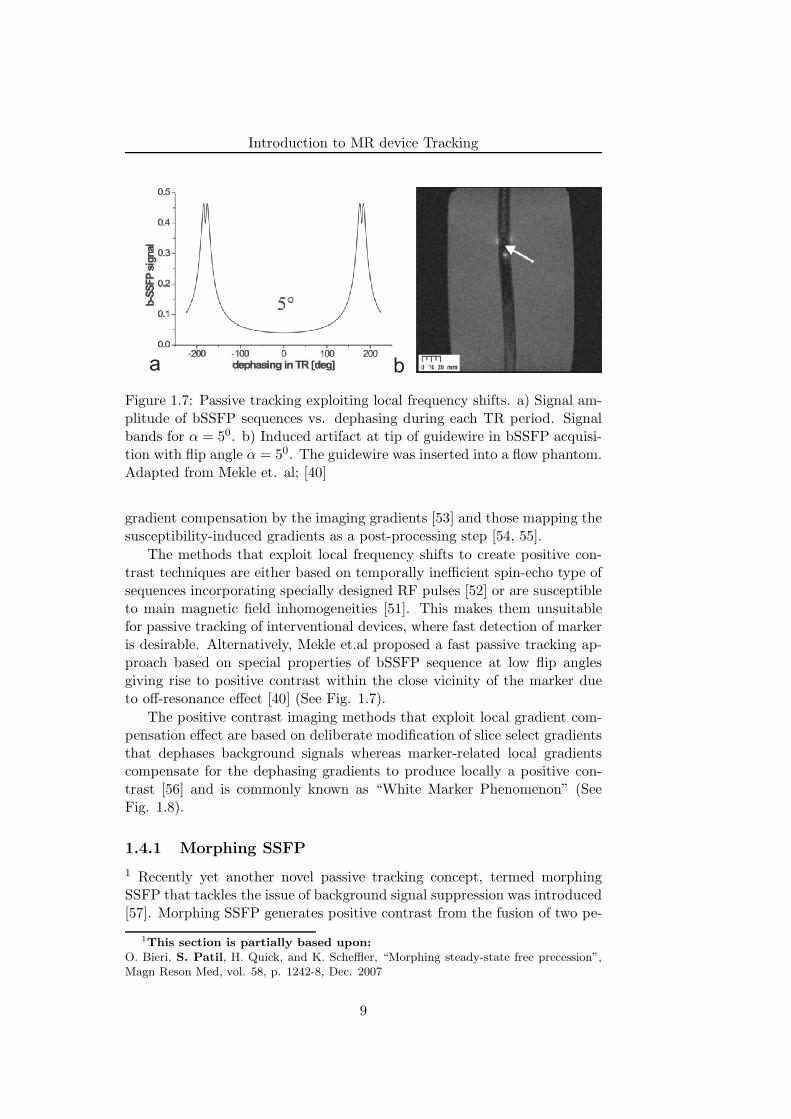
Figure 1.7: Passive tracking exploiting local frequency shifts. a) Signal am-plitude of bSSFP sequences vs. dephasing during each TR period. Signalbands for α = 50. b) Induced artifact at tip of guidewire in bSSFP acquisi-tion with flip angle α = 50. The guidewire was inserted into a flow phantom.Adapted from Mekle et. al; [40]
gradient compensation by the imaging gradients [53] and those mapping thesusceptibility-induced gradients as a post-processing step [54, 55].
The methods that exploit local frequency shifts to create positive con-trast techniques are either based on temporally inefficient spin-echo type ofsequences incorporating specially designed RF pulses [52] or are susceptibleto main magnetic field inhomogeneities [51]. This makes them unsuitablefor passive tracking of interventional devices, where fast detection of markeris desirable. Alternatively, Mekle et.al proposed a fast passive tracking ap-proach based on special properties of bSSFP sequence at low flip anglesgiving rise to positive contrast within the close vicinity of the marker dueto off-resonance effect [40] (See Fig. 1.7).
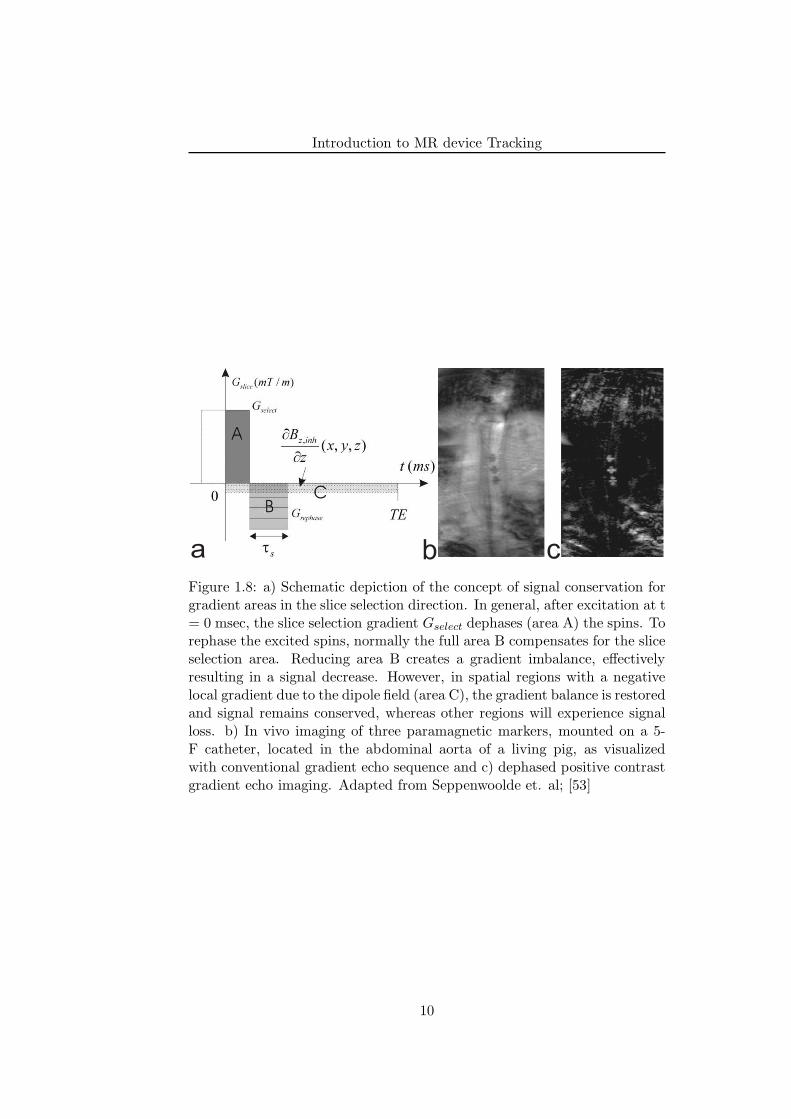
The positive contrast imaging methods that exploit local gradient com-pensation effect are based on deliberate modification of slice select gradientsthat dephases background signals whereas marker-related local gradientscompensate for the dephasing gradients to produce locally a positive con-trast [56] and is commonly known as “White Marker Phenomenon” (SeeFig. 1.8).
1.4.1 Morphing SSFP
1 Recently yet another novel passive tracking concept, termed morphingSSFP that tackles the issue of background signal suppression was introduced[57]. Morphing SSFP generates positive contrast from the fusion of two pe-
1This section is partially based upon:
O. Bieri, S. Patil, H. Quick, and K. Scheffler, “Morphing steady-state free precession”,Magn Reson Med, vol. 58, p. 1242-8, Dec. 2007
9
Introduction to MR device Tracking
a b cFigure 1.8: a) Schematic depiction of the concept of signal conservation forgradient areas in the slice selection direction. In general, after excitation at t= 0 msec, the slice selection gradient Gselect dephases (area A) the spins. Torephase the excited spins, normally the full area B compensates for the sliceselection area. Reducing area B creates a gradient imbalance, effectivelyresulting in a signal decrease. However, in spatial regions with a negativelocal gradient due to the dipole field (area C), the gradient balance is restoredand signal remains conserved, whereas other regions will experience signalloss. b) In vivo imaging of three paramagnetic markers, mounted on a 5-F catheter, located in the abdominal aorta of a living pig, as visualizedwith conventional gradient echo sequence and c) dephased positive contrastgradient echo imaging. Adapted from Seppenwoolde et. al; [53]
10
Introduction to MR device Tracking
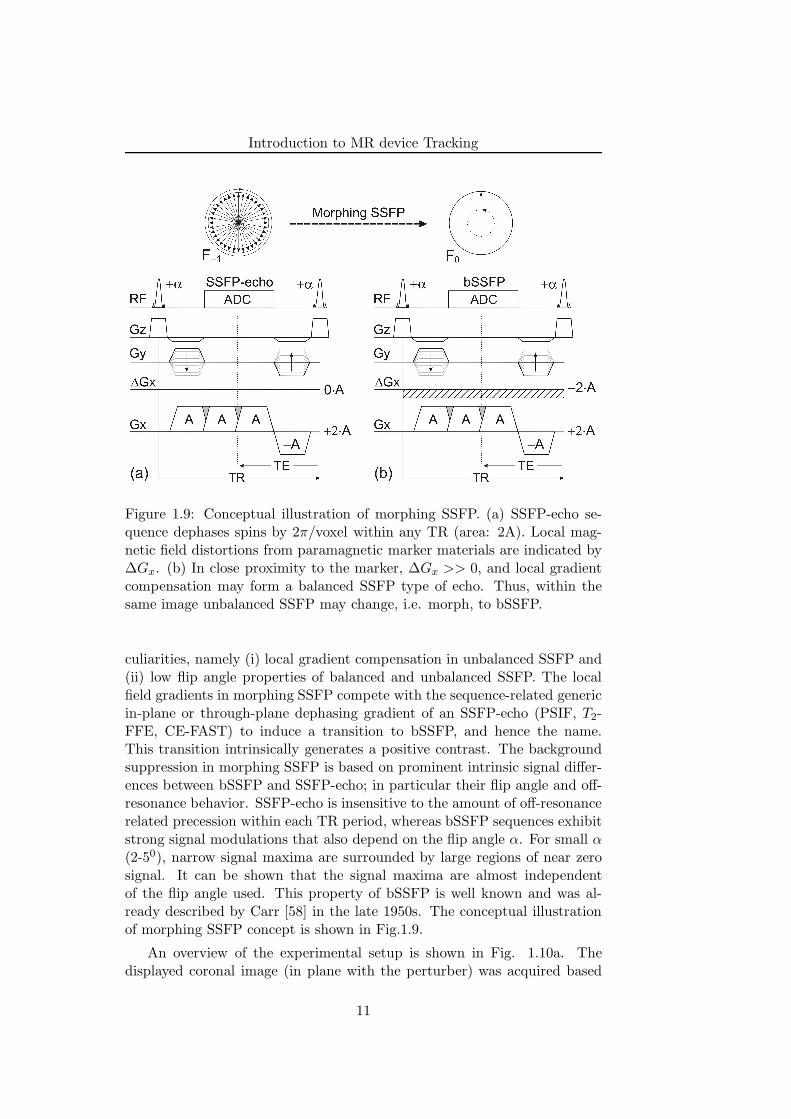
Figure 1.9: Conceptual illustration of morphing SSFP. (a) SSFP-echo se-quence dephases spins by 2π/voxel within any TR (area: 2A). Local mag-netic field distortions from paramagnetic marker materials are indicated by∆Gx. (b) In close proximity to the marker, ∆Gx >> 0, and local gradientcompensation may form a balanced SSFP type of echo. Thus, within thesame image unbalanced SSFP may change, i.e. morph, to bSSFP.
culiarities, namely (i) local gradient compensation in unbalanced SSFP and(ii) low flip angle properties of balanced and unbalanced SSFP. The localfield gradients in morphing SSFP compete with the sequence-related genericin-plane or through-plane dephasing gradient of an SSFP-echo (PSIF, T2-FFE, CE-FAST) to induce a transition to bSSFP, and hence the name.This transition intrinsically generates a positive contrast. The backgroundsuppression in morphing SSFP is based on prominent intrinsic signal differ-ences between bSSFP and SSFP-echo; in particular their flip angle and off-resonance behavior. SSFP-echo is insensitive to the amount of off-resonancerelated precession within each TR period, whereas bSSFP sequences exhibitstrong signal modulations that also depend on the flip angle α. For small α(2-50), narrow signal maxima are surrounded by large regions of near zerosignal. It can be shown that the signal maxima are almost independentof the flip angle used. This property of bSSFP is well known and was al-ready described by Carr [58] in the late 1950s. The conceptual illustrationof morphing SSFP concept is shown in Fig.1.9.
An overview of the experimental setup is shown in Fig. 1.10a. Thedisplayed coronal image (in plane with the perturber) was acquired based
11
Introduction to MR device Tracking
(3) (4)
(5)
b c
SSFP-echo (localizer):a=40°, TR=4ms, d=20mm
morphing SSFP:a=2°, TR=30ms, d=4mm
morphing SSFP:a=2°, TR=30ms, d=40mm
a
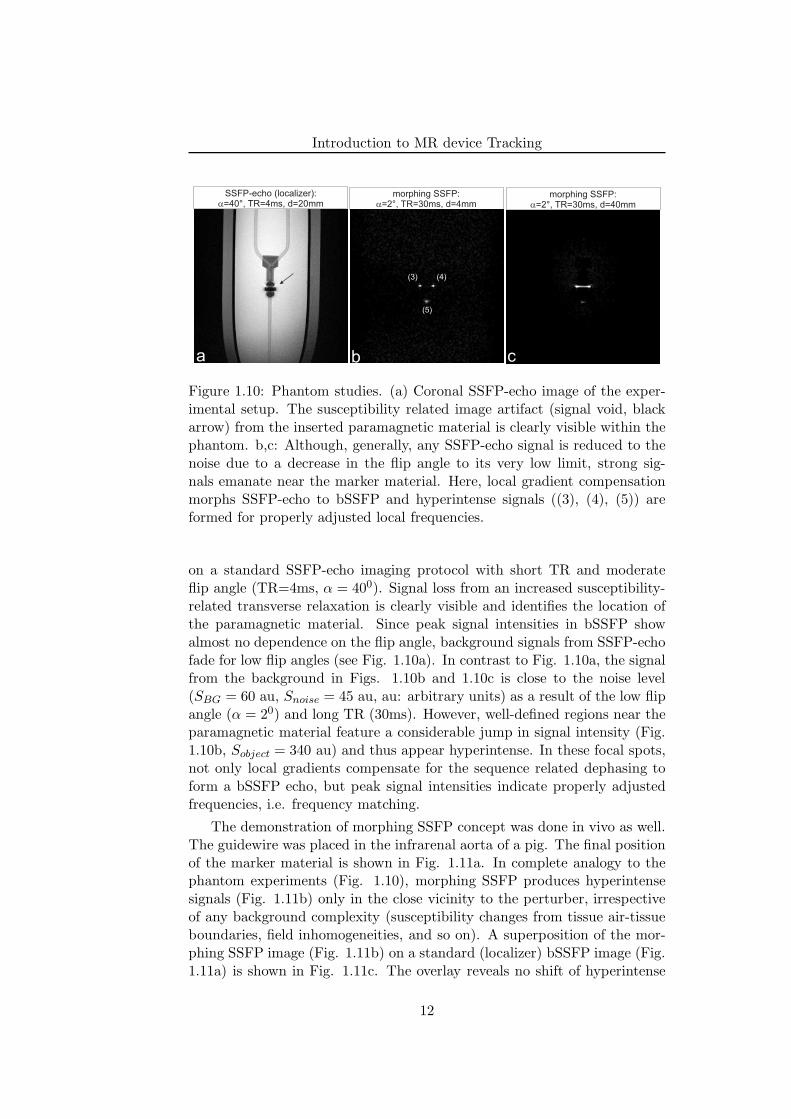
Figure 1.10: Phantom studies. (a) Coronal SSFP-echo image of the exper-imental setup. The susceptibility related image artifact (signal void, blackarrow) from the inserted paramagnetic material is clearly visible within thephantom. b,c: Although, generally, any SSFP-echo signal is reduced to thenoise due to a decrease in the flip angle to its very low limit, strong sig-nals emanate near the marker material. Here, local gradient compensationmorphs SSFP-echo to bSSFP and hyperintense signals ((3), (4), (5)) areformed for properly adjusted local frequencies.
on a standard SSFP-echo imaging protocol with short TR and moderateflip angle (TR=4ms, α = 400). Signal loss from an increased susceptibility-related transverse relaxation is clearly visible and identifies the location ofthe paramagnetic material. Since peak signal intensities in bSSFP showalmost no dependence on the flip angle, background signals from SSFP-echofade for low flip angles (see Fig. 1.10a). In contrast to Fig. 1.10a, the signalfrom the background in Figs. 1.10b and 1.10c is close to the noise level(SBG = 60 au, Snoise = 45 au, au: arbitrary units) as a result of the low flipangle (α = 20) and long TR (30ms). However, well-defined regions near theparamagnetic material feature a considerable jump in signal intensity (Fig.1.10b, Sobject = 340 au) and thus appear hyperintense. In these focal spots,not only local gradients compensate for the sequence related dephasing toform a bSSFP echo, but peak signal intensities indicate properly adjustedfrequencies, i.e. frequency matching.
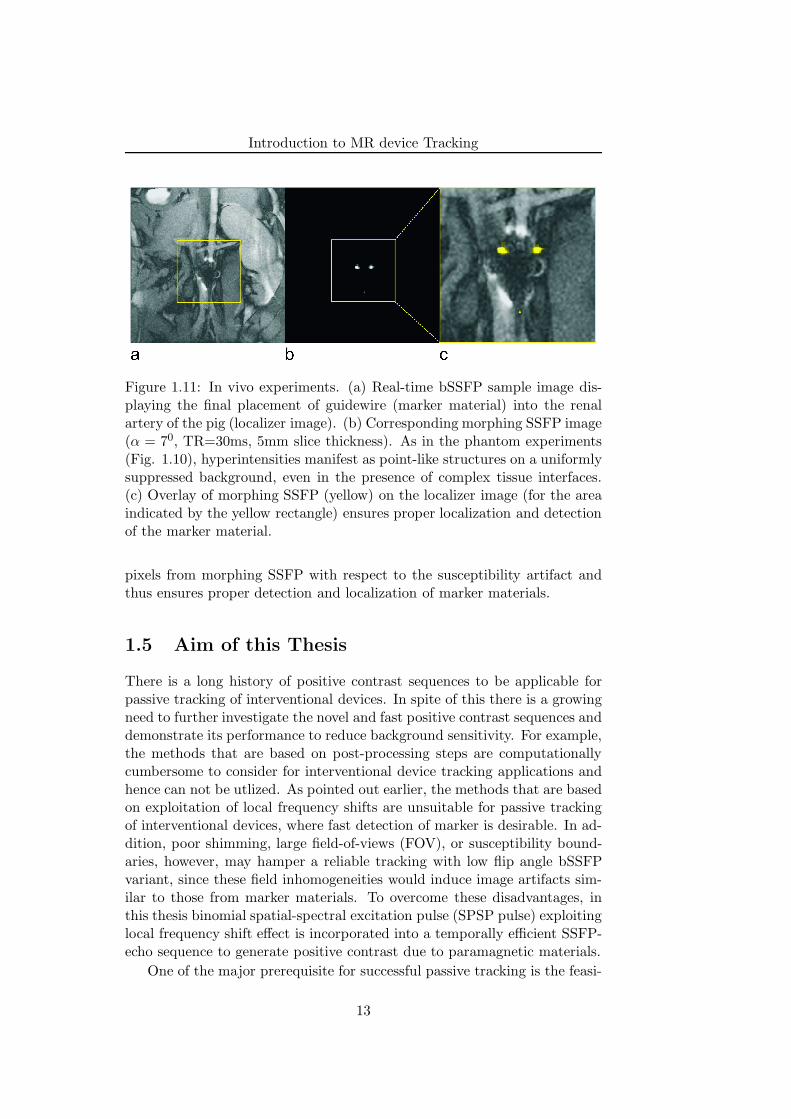
The demonstration of morphing SSFP concept was done in vivo as well.The guidewire was placed in the infrarenal aorta of a pig. The final positionof the marker material is shown in Fig. 1.11a. In complete analogy to thephantom experiments (Fig. 1.10), morphing SSFP produces hyperintensesignals (Fig. 1.11b) only in the close vicinity to the perturber, irrespectiveof any background complexity (susceptibility changes from tissue air-tissueboundaries, field inhomogeneities, and so on). A superposition of the mor-phing SSFP image (Fig. 1.11b) on a standard (localizer) bSSFP image (Fig.1.11a) is shown in Fig. 1.11c. The overlay reveals no shift of hyperintense
12
Introduction to MR device Tracking
Figure 1.11: In vivo experiments. (a) Real-time bSSFP sample image dis-playing the final placement of guidewire (marker material) into the renalartery of the pig (localizer image). (b) Corresponding morphing SSFP image(α = 70, TR=30ms, 5mm slice thickness). As in the phantom experiments(Fig. 1.10), hyperintensities manifest as point-like structures on a uniformlysuppressed background, even in the presence of complex tissue interfaces.(c) Overlay of morphing SSFP (yellow) on the localizer image (for the areaindicated by the yellow rectangle) ensures proper localization and detectionof the marker material.
pixels from morphing SSFP with respect to the susceptibility artifact andthus ensures proper detection and localization of marker materials.
1.5 Aim of this Thesis
There is a long history of positive contrast sequences to be applicable forpassive tracking of interventional devices. In spite of this there is a growingneed to further investigate the novel and fast positive contrast sequences anddemonstrate its performance to reduce background sensitivity. For example,the methods that are based on post-processing steps are computationallycumbersome to consider for interventional device tracking applications andhence can not be utlized. As pointed out earlier, the methods that are basedon exploitation of local frequency shifts are unsuitable for passive trackingof interventional devices, where fast detection of marker is desirable. In ad-dition, poor shimming, large field-of-views (FOV), or susceptibility bound-aries, however, may hamper a reliable tracking with low flip angle bSSFPvariant, since these field inhomogeneities would induce image artifacts sim-ilar to those from marker materials. To overcome these disadvantages, inthis thesis binomial spatial-spectral excitation pulse (SPSP pulse) exploitinglocal frequency shift effect is incorporated into a temporally efficient SSFP-echo sequence to generate positive contrast due to paramagnetic materials.
One of the major prerequisite for successful passive tracking is the feasi-
13
Introduction to MR device Tracking
bility of image acquisitions with extended slab thickness (40-50 mm) to guar-antee that the marker material always lies within the plane being imaged.However, application of dephasing gradients using extended slice thicknessas suggested by “White Marker Phenomenon” [53] may also enhance otherunwanted background signals, e.g. from air/tissue interfaces and therebyhampering proper marker localization and visualization. The previously pro-posed method; morphing SSFP [57] requires long TR and hence may proveto be temporally inefficient for interventional applications. To overcomethese advantages, in this thesis we develop the idea of gradient compensa-tion in SSFP to locally induce high signal intensities. In the close vicinityof paramagnetic materials, strong local gradient fields may compensate forany sequence-related gradients to locally induce signal transitions from anecho-dephased to an echo-rephased type of SSFP (mainly bSSFP) sequence.
Although positive contrast imaging enhances the conspicuity of themarker as compared to the background, it results in a loss of anatomicalstructure. Thus, passive tracking or localization of the guidewire can beachieved using a baseline subtraction method or a positive contrast imageoverlaid on either anatomical reference images or a vascular roadmap (i.e.,an angiogram). However, relatively long image acquisition times, leads toan undesired increased sensitivity to motion and/or flow with such over-lay techniques. In the third part of this thesis a novel projection-basedpassive tracking technique is proposed, termed Projection ReconstructionImaging with Echo-DEphasing (PRIDE). PRIDE is based on an acquisi-tion of projections using dephasing gradients along all three spatial (X, Yand Z) dimensions. Using PRIDE, 3D position of the interventional devicetip containing paramagnetic marker is localized, which in turn is used toautomatically adjust the scan plane of the imaging slice.
The dimensions of the coils proposed for active tracking approaches arebulky in nature thereby increasing the size of normal interventional devices(for e.g. catheter). In addition, the sensitivity of the coil and hence, thespatial resolution is directly proportional to coil dimensions. As comparedto x-ray fluoroscopy that offers a device localization resolution in the rangeof the order of 0.1 mm, the current device dimensions limit the resolution inMRI. Hence the final aim of this thesis is to introduce and experimentallytest the highly miniaturized planar micro coils with built-in amplifier.
1.6 Outline of the Thesis
The main content of the thesis is divided into several different parts. Inthe first part, two novel positive contrast imaging approaches to visualizeparamagnetic marker materials are described. Next, real-time tracking ofinterventional devices is examined in detail and the results are presented.Finally, highly miniaturized micro-coils are experimentally tested that could
14
Introduction to MR device Tracking
be used to visualize interventional catheters.This thesis is organized as follows:
Chapter 2: Spatial-spectral SSFP
In this chapter, firstly the principle of off-resonance excitation of tissues us-ing SPSP pulse is explained theoretically. The in-vitro experiments demon-strate the proper localization and feasibility of paramagnetic marker detec-tion mounted on the interventional guidewire tip. The signal and localiza-tion characteristics of the SPSP pulse are analyzed theoretically and verifiedexperimentally.
Chapter 3: Echo-dephased SSFP
In the close vicinity of paramagnetic materials, strong local gradient fieldsmay compensate for any sequence-related gradients to locally induce signaltransitions from an echo-dephased to an echo-rephased type of SSFP (mainlybalanced SSFP (bSSFP)) sequence. Generically resembling an unbalancedSSFP, in echo-dephased SSFP echoes are preferably dephased by ±π priorto readout. This not only ensures excellent cancellation of any backgroundsignals but also generic dephasing from unbalanced SSFP greatly reducesunwanted background signal enhancements. It will be demonstrated thatdue to the higher in-plane resolution as compared to slice resolution, localgradient compensation in echo-dephased SSFP is likely to take place onlywithin the close vicinity of the paramagnetic marker material. The concep-tual issues of gradient compensation and its signal properties are analyzedand discussed. To demonstrate the feasibility of proper marker visualiza-tion and localization using echo-dephased SSFP, reliable tracking of MRcompatible interventional guidewire having paramagnetic material on it isdemonstrated in a simple flow phantom. The utility of the echo-dephasedSSFP is also shown for positive contrast visualization of human pancreaticislets labeled with superparamagnetic iron oxide (SPIO) contrast agent invitro. Finally in vivo experiments in a rat model demonstrates the robustand reliable visualization of transplanted SPIO-labeled pancreatic islets ina rat chamber.
Chapter 4: Projection Reconstruction Imaging with Echo-Dephasing (PRIDE)
In this chapter a novel projection-based passive tracking technique is pro-posed, termed Projection Reconstruction Imaging with Echo-DEphasing(PRIDE). PRIDE is based on an acquisition of projections using dephasinggradients along all three spatial (X, Y and Z) dimensions. Using PRIDE, 3Dposition of the interventional device tip containing paramagnetic marker islocalized, which in turn is used to automatically adjust the scan plane of the
15
Introduction to MR device Tracking
imaging slice. We first describe the concept of local gradient field compen-sation used in PRIDE, followed by in-vitro experiments demonstrating thefeasibility of appropriate marker detection in the presence of off-resonancerelated degradations caused by unwanted inhomogeneities (air/tissue inter-faces etc). Then we describe the ASP mechanism incorporating PRIDE asa tracking sequence to provide positional information of the paramagneticmarker to bSSFP sequence serving as an imaging sequence. The demon-stration and discussion of ASP mechanism on the clinical scanner is doneby means of phantom results. Finally, in vivo experiments in a swine modelare presented that corroborate the in-vitro results for robust and reliabledetection of marker using PRIDE.
Chapter 5: Highly Miniaturized Micro-coil
The aim of this chapter is to demonstrate the feasibility of these miniaturizedmicro-coils to utilize them as the tracking coil on a clinical scanner with anaid of phantom experiments. In the first part of this chapter, we describethe experimental arrangements and MR sequence parameters. Next, theresults obtained by means of spectroscopic, imaging and 1D projection arepresented. Perspectives from the results conclude the chapter.
Chapter 6: Summary and Future Outlook
This chapter summarizes the contributions presented in the previous chap-ters and provides possible future research directions.
References
[1] R. Geise and R. Morin, “Radiation measurement in interventional radi-ology.,” in Interventional Radiology (W. Castaneda-Zuniga, ed.), pp. 1–8, Baltimore: Williams and Wilkins, third ed., 1997.
[2] V. K. Raman, P. V. Karmarkar, M. A. Guttman, A. J. Dick, D. C.Peters, C. Ozturk, B. S. S. Pessanha, R. B. Thompson, A. N. Raval,R. DeSilva, R. J. Aviles, E. Atalar, E. R. McVeigh, and R. J. Leder-man, “Real-time magnetic resonance-guided endovascular repair of ex-perimental abdominal aortic aneurysm in swine,” Journal of the Amer-ican College of Cardiology, vol. 45, p. 2069–2077, June 2005. PMID:15963411.
[3] F. K. Wacker, C. M. Hillenbrand, J. L. Duerk, and J. S. Lewin, “MR-guided endovascular interventions: device visualization, tracking, nav-igation, clinical applications, and safety aspects,” Magnetic ResonanceImaging Clinics of North America, vol. 13, p. 431–439, Aug. 2005.PMID: 16084411.
16
Introduction to MR device Tracking
[4] R. Razavi, D. Hill, S. Keevil, M. Miquel, V. Muthurangu, S. Hegde,K. Rhode, M. Barnett, J. van Vaals, D. Hawkes, and E. Baker, “Cardiaccatheterisation guided by MRI in children and adults with congenitalheart disease,” Lancet, vol. 362, p. 1877–82, Dec. 2003.
[5] M. E. Ladd, H. H. Quick, and J. F. Debatin, “Interventional MRAand intravascular imaging,” Journal of Magnetic Resonance Imaging:JMRI, vol. 12, pp. 534–546, Oct. 2000. PMID: 11042634.
[6] J. L. Duerk, E. Y. Wong, and J. S. Lewin, “A brief review of hardwarefor catheter tracking in magnetic resonance imaging,” Magma (NewYork, N.Y.), vol. 13, no. 3, pp. 199–208, 2002. PMID: 11755097.
[7] L. W. Bartels and C. J. G. Bakker, “Endovascular interventional mag-netic resonance imaging,” Physics in Medicine and Biology, vol. 48,pp. R37–64, July 2003. PMID: 12894968.
[8] M. Bock and F. K. Wacker, “MR-guided intravascular interventions:techniques and applications,” Journal of Magnetic Resonance Imaging:JMRI, vol. 27, pp. 326–338, Feb. 2008. PMID: 18219686.
[9] H. L. Kantor, R. W. Briggs, and R. S. Balaban, “In vivo 31P nuclearmagnetic resonance measurements in canine heart using a catheter-coil,” Circulation Research, vol. 55, p. 261–266, Aug. 1984. PMID:6744535.
[10] J. L. Ackerman, M. C. Offut, R. B. Buxton, and T. J. Brady, “Rapid 3Dtracking of small RF coils.,” in Proceedings of the SMRM, (Montreal),p. 1131, 1986.
[11] C. Dumoulin, S. Souza, and R. Darrow, “Real-time position monitor-ing of invasive devices using magnetic resonance,” Magn Reson Med,vol. 29, p. 411–5, Mar. 1993.
[12] O. Ocali and E. Atalar, “Intravascular magnetic resonance imagingusing a loopless catheter antenna,” Magn Reson Med, vol. 37, no. 1,p. 112–8, 1997.
[13] A. Glowinski, G. Adam, A. Bucker, J. Neuerburg, J. van Vaals, andR. Gunther, “Catheter visualization using locally induced, actively con-trolled field inhomogeneities,” Magn Reson Med, vol. 38, p. 253–8, Aug.1997.
[14] C. Flask, D. Elgort, E. Wong, A. Shankaranarayanan, J. Lewin,M. Wendt, and J. L. Duerk, “A method for fast 3D tracking using tunedfiducial markers and a limited projection reconstruction FISP (LPR-FISP) sequence,” Journal of Magnetic Resonance Imaging: JMRI,vol. 14, p. 617–627, Nov. 2001. PMID: 11747015.
17
Introduction to MR device Tracking
[15] S. Zuehlsdorff, R. Umathum, S. Volz, P. Hallscheidt, C. Fink, W. Semm-ler, and M. Bock, “MR coil design for simultaneous tip tracking andcurvature delineation of a catheter,” Magn Reson Med, vol. 52, p. 214–8,July 2004.
[16] M. E. Ladd, G. G. Zimmermann, G. C. McKinnon, G. K. vonSchulthess, C. L. Dumoulin, R. D. Darrow, E. Hofmann, and J. F. De-batin, “Visualization of vascular guidewires using MR tracking,” Jour-nal of Magnetic Resonance Imaging: JMRI, vol. 8, pp. 251–253, Feb.1998. PMID: 9500289.
[17] M. Wendt, M. Busch, R. Wetzler, Q. Zhang, A. Melzer, F. Wacker,J. L. Duerk, and J. S. Lewin, “Shifted rotated keyhole imaging andactive tip-tracking for interventional procedure guidance,” Journal ofMagnetic Resonance Imaging: JMRI, vol. 8, p. 258–261, Feb. 1998.PMID: 9500291.
[18] F. Wacker, D. Elgort, C. Hillenbrand, J. Duerk, and J. Lewin, “Thecatheter-driven MRI scanner: a new approach to intravascular cathetertracking and imaging-parameter adjustment for interventional MRI,”AJR Am J Roentgenol, vol. 183, p. 391–5, Aug. 2004.
[19] J. L. Duerk, J. S. Lewin, M. Wendt, and C. Petersilge, “Remember trueFISP? a high SNR, near 1-second imaging method for t2-like contrastin interventional MRI at .2 t,” Journal of Magnetic Resonance Imaging:JMRI, vol. 8, p. 203–208, Feb. 1998. PMID: 9500281.
[20] V. Rasche, D. Holz, J. Kohler, R. Proksa, and P. Roschmann,“Catheter tracking using continuous radial MRI,” Magnetic Resonancein Medicine, vol. 37, pp. 963–968, June 1997. PMID: 9178250.
[21] M. E. Ladd, G. G. Zimmermann, H. H. Quick, J. F. Debatin, P. Boe-siger, G. K. von Schulthess, and G. C. McKinnon, “Active MR visual-ization of a vascular guidewire in vivo,” Journal of Magnetic ResonanceImaging: JMRI, vol. 8, pp. 220–225, Feb. 1998. PMID: 9500284.
[22] H. H. Quick, H. Kuehl, G. Kaiser, D. Hornscheidt, K. P. Mikolajczyk,S. Aker, J. F. Debatin, and M. E. Ladd, “Interventional MRA usingactively visualized catheters, TrueFISP, and real-time image fusion,”Magnetic Resonance in Medicine: Official Journal of the Society ofMagnetic Resonance in Medicine / Society of Magnetic Resonance inMedicine, vol. 49, no. 1, p. 129–137, 2003. PMID: 12509828.
[23] G. C. Hurst, J. Hua, J. L. Duerk, and A. M. Cohen, “Intravascular(catheter) NMR receiver probe: preliminary design analysis and appli-cation to canine iliofemoral imaging,” Magnetic Resonance in Medicine:Official Journal of the Society of Magnetic Resonance in Medicine /
18
Introduction to MR device Tracking
Society of Magnetic Resonance in Medicine, vol. 24, pp. 343–357, Apr.1992. PMID: 1569872.
[24] H. H. Quick, M. E. Ladd, G. G. Zimmermann-Paul, P. Erhart, E. Hof-mann, G. K. von Schulthess, and J. F. Debatin, “Single-loop coil con-cepts for intravascular magnetic resonance imaging,” Magnetic Reso-nance in Medicine: Official Journal of the Society of Magnetic Res-onance in Medicine / Society of Magnetic Resonance in Medicine,vol. 41, pp. 751–758, Apr. 1999. PMID: 10332851.
[25] L. V. Hofmann, R. P. Liddell, J. Eng, B. A. Wasserman, A. Arepally,D. S. Lee, and D. A. Bluemke, “Human peripheral arteries: feasibility oftransvenous intravascular MR imaging of the arterial wall,” Radiology,vol. 235, pp. 617–622, May 2005. PMID: 15858101.
[26] M. Konings, L. Bartels, H. Smits, and C. Bakker, “Heating around in-travascular guidewires by resonating RF waves,” J Magn Reson Imag-ing, vol. 12, p. 79–85, July 2000.
[27] M. Ladd and H. Quick, “Reduction of resonant RF heating in in-travascular catheters using coaxial chokes,” Magn Reson Med, vol. 43,p. 615–9, Apr. 2000.
[28] T. Kuehne, S. Weiss, F. Brinkert, J. Weil, S. Yilmaz, B. Schmitt, P. Ew-ert, P. Lange, and M. Gutberlet, “Catheter visualization with resonantmarkers at MR imaging-guided deployment of endovascular stents inswine,” Radiology, vol. 233, p. 774–80, Dec. 2004.
[29] S. Hegde, M. Miquel, R. Boubertakh, D. Gilderdale, V. Muthurangu,S. Keevil, I. Young, D. Hill, and R. Razavi, “Interactive MR imagingand tracking of catheters with multiple tuned fiducial markers,” J VascInterv Radiol, vol. 17, p. 1175–9, July 2006.
[30] M. Burl, G. Coutts, and I. Young, “Tuned fiducial markers to iden-tify body locations with minimal perturbation of tissue magnetization,”Magn Reson Med, vol. 36, p. 491–3, Sept. 1996.
[31] H. H. Quick, M. O. Zenge, H. Kuehl, G. Kaiser, S. Aker, S. Massing,S. Bosk, and M. E. Ladd, “Interventional magnetic resonance angiog-raphy with no strings attached: wireless active catheter visualization,”Magnetic Resonance in Medicine: Official Journal of the Society ofMagnetic Resonance in Medicine / Society of Magnetic Resonance inMedicine, vol. 53, pp. 446–455, Feb. 2005. PMID: 15678524.
[32] S. Weiss, T. Kuehne, F. Brinkert, G. Krombach, M. Katoh, T. Scha-effter, R. W. Guenther, and A. Buecker, “In vivo safe catheter visualiza-tion and slice tracking using an optically detunable resonant marker,”
19
Introduction to MR device Tracking
Magnetic Resonance in Medicine: Official Journal of the Society ofMagnetic Resonance in Medicine / Society of Magnetic Resonance inMedicine, vol. 52, pp. 860–868, Oct. 2004. PMID: 15389956.
[33] O. Unal, F. Korosec, R. Frayne, C. Strother, and C. Mistretta, “Arapid 2D time-resolved variable-rate k-space sampling MR techniquefor passive catheter tracking during endovascular procedures,” MagnReson Med, vol. 40, p. 356–62, Sept. 1998.
[34] O. Unal, J. Li, W. Cheng, H. Yu, and C. M. Strother, “MR-visiblecoatings for endovascular device visualization,” Journal of MagneticResonance Imaging: JMRI, vol. 23, pp. 763–769, May 2006. PMID:16555229.
[35] D. Rubin, A. Ratner, and S. Young, “Magnetic susceptibility effects andtheir application in the development of new ferromagnetic catheters formagnetic resonance imaging,” Invest Radiol, vol. 25, p. 1325–32, Dec.1990.
[36] V. Kochli, G. McKinnon, E. Hofmann, and G. von Schulthess, “Vascu-lar interventions guided by ultrafast MR imaging: evaluation of differ-ent materials,” Magn Reson Med, vol. 31, p. 309–14, Mar. 1994.
[37] C. Bakker, R. Hoogeveen, J. Weber, J. van Vaals, M. Viergever, andW. Mali, “Visualization of dedicated catheters using fast scanning tech-niques with potential for MR-guided vascular interventions,” Magn Re-son Med, vol. 36, p. 816–20, Dec. 1996.
[38] M. Miquel, S. Hegde, V. Muthurangu, B. Corcoran, S. Keevil, D. Hill,and R. Razavi, “Visualization and tracking of an inflatable ballooncatheter using SSFP in a flow phantom and in the heart and greatvessels of patients,” Magn Reson Med, vol. 51, p. 988–95, May 2004.
[39] R. A. Omary, R. Frayne, O. Unal, T. Warner, F. R. Korosec, C. A.Mistretta, C. M. Strother, and T. M. Grist, “MR-guided angioplastyof renal artery stenosis in a pig model: a feasibility study,” Journalof Vascular and Interventional Radiology: JVIR, vol. 11, pp. 373–381,Mar. 2000. PMID: 10735435.
[40] R. Mekle, E. Hofmann, K. Scheffler, and D. Bilecen, “A polymer-basedMR-compatible guidewire: a study to explore new prospects for in-terventional peripheral magnetic resonance angiography (ipMRA),” JMagn Reson Imaging, vol. 23, p. 145–55, Feb. 2006.
[41] J. F. Schenck, “The role of magnetic susceptibility in magnetic reso-nance imaging: MRI magnetic compatibility of the first and secondkinds,” Medical Physics, vol. 23, pp. 815–850, June 1996. PMID:8798169.
20
Introduction to MR device Tracking
[42] C. J. Bakker, R. M. Hoogeveen, W. F. Hurtak, J. J. van Vaals, M. A.Viergever, and W. P. Mali, “MR-guided endovascular interventions:susceptibility-based catheter and near-real-time imaging technique,”Radiology, vol. 202, no. 1, pp. 273–276, 1997. PMID: 8988223.
[43] L. W. Bartels, C. Bos, R. van Der Weide, H. F. Smits, C. J. Bakker,and M. A. Viergever, “Placement of an inferior vena cava filter in apig guided by high-resolution MR fluoroscopy at 1.5 t,” Journal ofMagnetic Resonance Imaging: JMRI, vol. 12, pp. 599–605, Oct. 2000.PMID: 11042643.
[44] S. Kos, R. Huegli, E. Hofmann, H. H. Quick, H. Kuehl, S. Aker, G. M.Kaiser, P. J. Borm, A. L. Jacob, and D. Bilecen, “Feasibility of real-time magnetic resonance-guided angioplasty and stenting of renal arter-ies in vitro and in swine, using a new polyetheretherketone-based mag-netic resonance-compatible guidewire,” Investigative Radiology, vol. 44,pp. 234–241, Apr. 2009. PMID: 19252440.
[45] H. F. Smits, C. Bos, R. van der Weide, and C. J. Bakker, “InterventionalMR: vascular applications,” European Radiology, vol. 9, no. 8, pp. 1488–1495, 1999. PMID: 10525856.
[46] S. Kos, R. Huegli, E. Hofmann, H. Quick, H. Kuehl, S. Aker,G. Kaiser, P. Borm, A. Jacob, and D. Bilecen, “MR-compatiblepolyetheretherketone-based guide wire assisting MR-guided stenting ofiliac and supraaortic arteries in swine: Feasibility study,” MinimallyInvasive Therapy & Allied Technologies: MITAT: Official Journal ofthe Society for Minimally Invasive Therapy, pp. 181–188, 2009. PMID:19431070.
[47] S. Krueger, S. Schmitz, S. Weiss, D. Wirtz, M. Linssen, H. Schade,N. Kraemer, E. Spuentrup, G. Krombach, and A. Buecker, “An MRguidewire based on micropultruded fiber-reinforced material,” MagneticResonance in Medicine: Official Journal of the Society of MagneticResonance in Medicine / Society of Magnetic Resonance in Medicine,vol. 60, pp. 1190–1196, Nov. 2008. PMID: 18958856.
[48] J. Reichenbach, R. Venkatesan, D. Yablonskiy, M. Thompson, S. Lai,and E. Haacke, “Theory and application of static field inhomogene-ity effects in gradient-echo imaging,” J Magn Reson Imaging, vol. 7,p. 266–79, Apr. 1997.
[49] R. van der Weide, K. J. Zuiderveld, C. J. Bakker, T. Hoogenboom,J. J. van Vaals, and M. A. Viergever, “Image guidance of endovascularinterventions on a clinical MR scanner,” IEEE Transactions on MedicalImaging, vol. 17, pp. 779–785, Oct. 1998. PMID: 9874302.
21
Introduction to MR device Tracking
[50] J. Seppenwoolde, L. Bartels, R. van der Weide, J. Nijsen, A. van hetSchip, and C. Bakker, “Fully MR-guided hepatic artery catheterizationfor selective drug delivery: a feasibility study in pigs,” J Magn ResonImaging, vol. 23, p. 123–9, Feb. 2006.
[51] M. Stuber, W. Gilson, M. Schar, D. Kedziorek, L. Hofmann, S. Shah,E. Vonken, J. Bulte, and D. Kraitchman, “Positive contrast visual-ization of iron oxide-labeled stem cells using inversion-recovery withON-resonant water suppression (IRON),” Magn Reson Med, vol. 58,p. 1072–7, Nov. 2007.
[52] C. Cunningham, T. Arai, P. Yang, M. McConnell, J. Pauly, andS. Conolly, “Positive contrast magnetic resonance imaging of cellslabeled with magnetic nanoparticles,” Magn Reson Med, vol. 53,p. 999–1005, May 2005.
[53] J. Seppenwoolde, M. Viergever, and C. Bakker, “Passive tracking ex-ploiting local signal conservation: the white marker phenomenon,”Magn Reson Med, vol. 50, p. 784–90, Oct. 2003.
[54] E. Vonken, M. Schar, and M. Stuber, “Positive contrast visualizationof nitinol devices using susceptibility gradient mapping,” Magn ResonMed, vol. 60, p. 588–94, Sept. 2008.
[55] H. Dahnke, W. Liu, D. Herzka, J. Frank, and T. Schaeffter, “Suscepti-bility gradient mapping (SGM): a new postprocessing method for pos-itive contrast generation applied to superparamagnetic iron oxide par-ticle (SPIO)-labeled cells,” Magn Reson Med, vol. 60, p. 595–603, Sept.2008.
[56] J. Seppenwoolde, K. Vincken, and C. Bakker, “White-marker imaging-Separating magnetic susceptibility effects from partial volume effects,”Magn Reson Med, July 2007.
[57] O. Bieri, S. Patil, H. Quick, and K. Scheffler, “Morphing steady-statefree precession,” Magn Reson Med, vol. 58, p. 1242–8, Dec. 2007.
[58] H. Y. Carr, “Steady-State free precession in nuclear magnetic reso-nance,” Phys. Rev., vol. 112, p. 1693–1701, Dec. 1958.
22
Chapter 2
Positive Contrast Imaging ofthe Paramagnetic MarkersUsing Spatial-SpectralExcitation Pulse
This chapter has been partially presented as:
S. Patil, C. Boller, D. Bilecen, K. Scheffler, “Visualization of the paramagnetic markersin interventional MRI using spatial-spectral pulses”, Proceedings of 15th joint annualmeeting ISMRM-ESMRMB, Berlin,Germany, pp. 1122, 2007.
23
Spatial-Spectral SSFP
2.1 Introduction
The paramagnetic markers or materials cause significant field inhomogenei-ties when placed in a uniform main magnetic field B0, due to its local sus-ceptibility differences with respect to surrounding tissues. In many cases,these inhomogeneities result in undesired imaging effect, known as suscep-tibility artifacts. Nevertheless this source of field inhomogeneity has beenexploited as a form of image contrast for passive visualization and track-ing of the interventional devices (catheters and guidewires) [1, 2] and forsuper-paramagnetic iron oxide (SPIO)-labeled cells [3]. Traditionally thevisualization of these paramagnetic materials is based on increase in T ∗
2 de-cay that they cause entailing a negative contrast (signal loss) with respectto background in a resultant image. Unfortunately, due to confoundingbackground signals it is often difficult to distinguish signal loss due to para-magnetic materials from other unwanted inhomogeneities such as, air/tissueinterfaces etc.
Therefore, MRI techniques that generate positive contrast that are local-ized within the immediate surroundings of the paramagnetic materials havebeen proposed [4–6]. The state-of-the-art positive contrast techniques canbe broadly classified into three categories based upon their method of iden-tifying paramagnetic materials: those using local frequency shifts in the on-resonance frequency [6–8], those exploiting the local gradient compensationby the imaging gradients [4, 5] and those mapping the susceptibility-inducedgradients as a post-processing step [9].
In one of the method that exploits local frequency shifts to create posi-tive contrast uses specially designed RF pulses to spectrally excite the off-resonant water protons within the close vicinity of the paramagnetic markerwith a reported theoretical background suppression of approximately 120dB [8]. However, clear limitation of this technique is the use of temporallyinefficient spin-echo type of sequences and requires special knowledge of RFdesigning. Another method, known as inversion recovery with ON-resonantwater suppression (IRON) method [7] selectively saturates the backgroundon-resonant water protons and leaving off-resonant water protons availablefor excitation during normal imaging experiment. In IRON method, on-resonant spectrally suppressive pulse is applied only at the start of the 2Dor 3D imaging and may potentially lead to recovery of on-resonant waterprotons thereby decreasing background suppression.
In order to overcome these disadvantages, we propose a new off-resonanceexcitation-based positive contrast method for passive tracking of interven-tional devices, where fast detection of marker is desirable. In this work, bi-nomial spatial-spectral excitation pulse (SPSP pulse) was incorporated intoa fast SSFP-echo (reversed fast imaging with steady-state precession [PSIF],T2-fast field echo [T2-FFE], contrast-enhanced Fourier-acquired steady-state[CE-FAST]) type of sequence to generate positive contrast due to para-
24
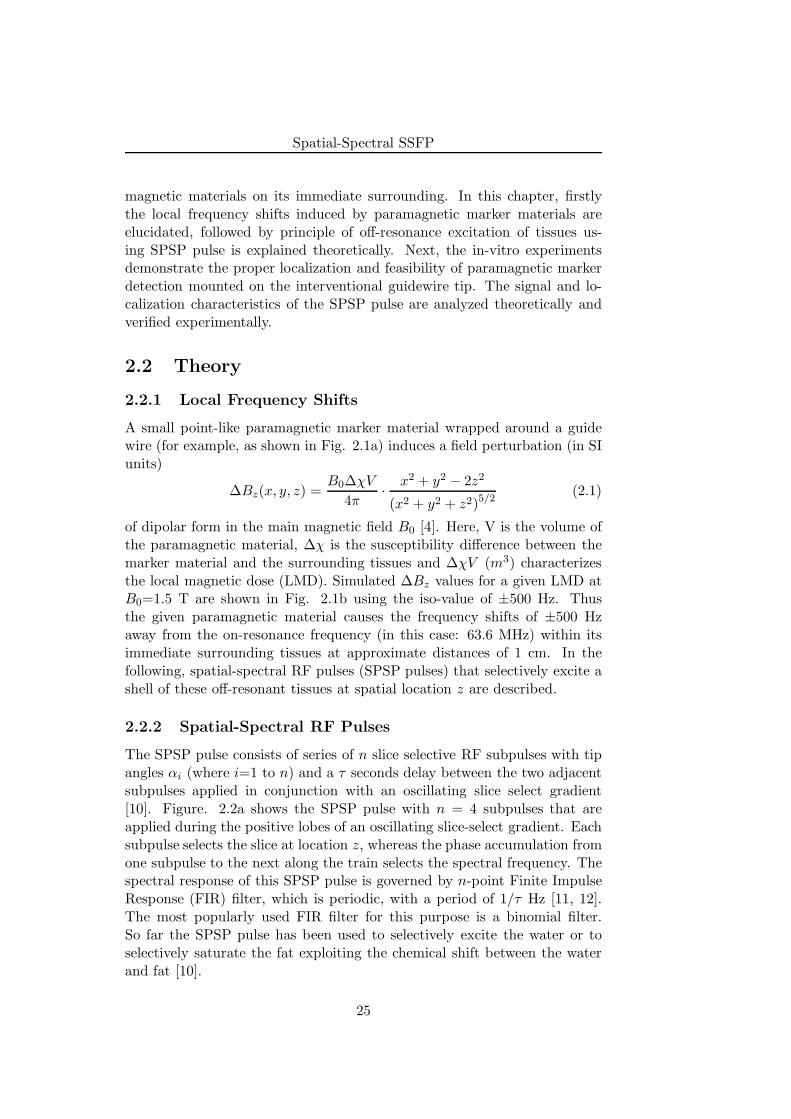
Spatial-Spectral SSFP
magnetic materials on its immediate surrounding. In this chapter, firstlythe local frequency shifts induced by paramagnetic marker materials areelucidated, followed by principle of off-resonance excitation of tissues us-ing SPSP pulse is explained theoretically. Next, the in-vitro experimentsdemonstrate the proper localization and feasibility of paramagnetic markerdetection mounted on the interventional guidewire tip. The signal and lo-calization characteristics of the SPSP pulse are analyzed theoretically andverified experimentally.
2.2 Theory
2.2.1 Local Frequency Shifts
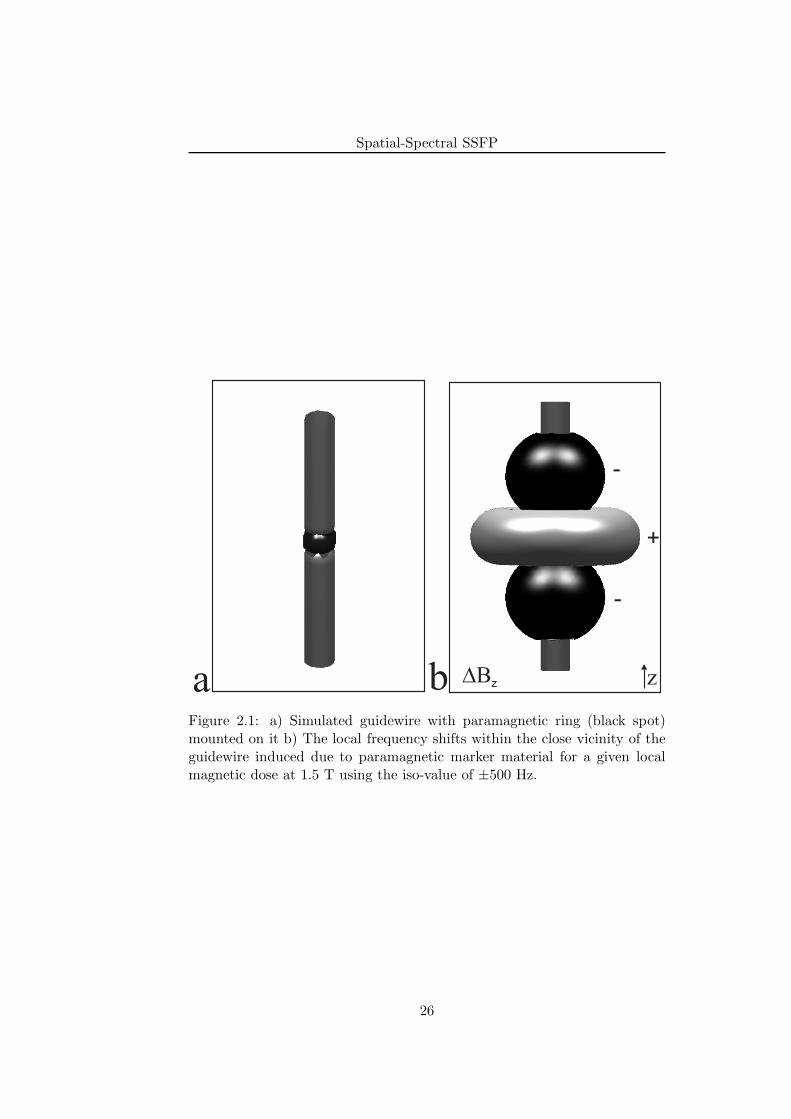
A small point-like paramagnetic marker material wrapped around a guidewire (for example, as shown in Fig. 2.1a) induces a field perturbation (in SIunits)
∆Bz(x, y, z) =B0∆χV
4π· x2 + y2 − 2z2
(x2 + y2 + z2)5/2(2.1)
of dipolar form in the main magnetic field B0 [4]. Here, V is the volume ofthe paramagnetic material, ∆χ is the susceptibility difference between themarker material and the surrounding tissues and ∆χV (m3) characterizesthe local magnetic dose (LMD). Simulated ∆Bz values for a given LMD atB0=1.5 T are shown in Fig. 2.1b using the iso-value of ±500 Hz. Thusthe given paramagnetic material causes the frequency shifts of ±500 Hzaway from the on-resonance frequency (in this case: 63.6 MHz) within itsimmediate surrounding tissues at approximate distances of 1 cm. In thefollowing, spatial-spectral RF pulses (SPSP pulses) that selectively excite ashell of these off-resonant tissues at spatial location z are described.
2.2.2 Spatial-Spectral RF Pulses
The SPSP pulse consists of series of n slice selective RF subpulses with tipangles αi (where i=1 to n) and a τ seconds delay between the two adjacentsubpulses applied in conjunction with an oscillating slice select gradient[10]. Figure. 2.2a shows the SPSP pulse with n = 4 subpulses that areapplied during the positive lobes of an oscillating slice-select gradient. Eachsubpulse selects the slice at location z, whereas the phase accumulation fromone subpulse to the next along the train selects the spectral frequency. Thespectral response of this SPSP pulse is governed by n-point Finite ImpulseResponse (FIR) filter, which is periodic, with a period of 1/τ Hz [11, 12].The most popularly used FIR filter for this purpose is a binomial filter.So far the SPSP pulse has been used to selectively excite the water or toselectively saturate the fat exploiting the chemical shift between the waterand fat [10].
25
Spatial-Spectral SSFP
a b DBz z
+
-
-
Figure 2.1: a) Simulated guidewire with paramagnetic ring (black spot)mounted on it b) The local frequency shifts within the close vicinity of theguidewire induced due to paramagnetic marker material for a given localmagnetic dose at 1.5 T using the iso-value of ±500 Hz.
26
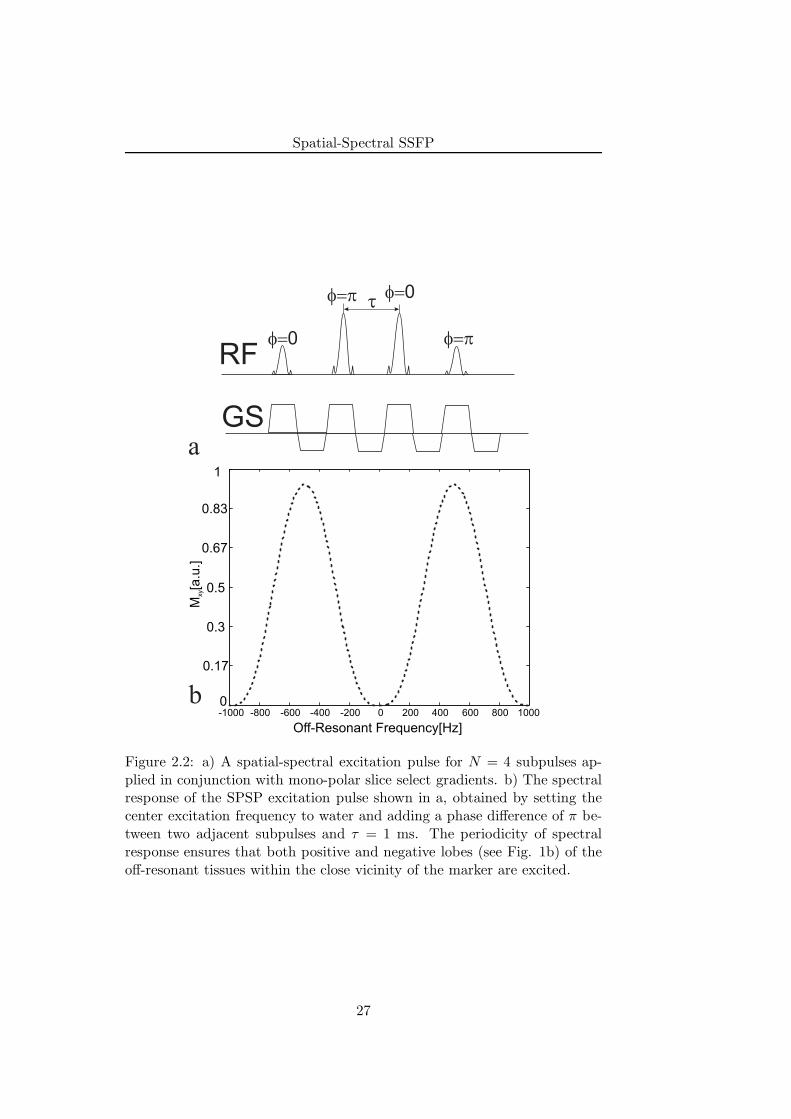
Spatial-Spectral SSFP
RF
GS
t
f=0
f=p f=0
f=p
a
-1000 -800 -600 -400 -200 0 200 400 600 800 10000
0.17
0.3
0.5
0.67
0.83
1
M[a
.u.]
xy
Off-Resonant Frequency[Hz]
b
Figure 2.2: a) A spatial-spectral excitation pulse for N = 4 subpulses ap-plied in conjunction with mono-polar slice select gradients. b) The spectralresponse of the SPSP excitation pulse shown in a, obtained by setting thecenter excitation frequency to water and adding a phase difference of π be-tween two adjacent subpulses and τ = 1 ms. The periodicity of spectralresponse ensures that both positive and negative lobes (see Fig. 1b) of theoff-resonant tissues within the close vicinity of the marker are excited.
27
Spatial-Spectral SSFP
In this work, the SPSP pulse is used to selectively excite the off-resonanttissues (see Fig. 2.1b) within the immediate surrounding of the paramag-netic marker only, within the selected slice. If we want to excite these off-resonant tissues without touching water then we must ensure that: 1/τ ≥2B0γ∆χ with γ being gyromagnetic ratio of water protons. In the presentcase, the center frequency of excitation of SPSP pulse is set on water reso-nance and a phase of π radians is added between the two adjacent subpulses,which shifts the frequency response by ∆f = 500 Hz, when the separationbetween two spectral lobes is 1 kHz (τ=1 ms). The simulated off-resonancefrequency response of the SPSP pulse for binomial filter of order three isshown (dotted) in Fig. 2.2b. Due to periodicity of the spectral response,both positive and negative lobes (see Fig. 1b) of the off-resonant tissuesare excited. It can be also noticed that, because of relatively broader band-width, fat with a chemical-shift difference of 3.4 ppm (approximately 217Hz at 1.5 T) also excited. The incorporation of SPSP pulse in a SSFP typeof sequence, its signal characteristics and its application for passive trackingof interventional guidewire is a part of present study and is illustrated inthe following sections.
2.3 Materials And Methods
Phantom measurements and calibrations were performed on a Siemens 1.5T Espree system (Siemens Healthcare, Erlangen, Germany) employing max-imum gradient strength of 33 mT/m and a slew rate of 170 mT/(m×ms).Imaging was done using integrated spine coils and body phased array coils.All images were acquired using coronal orientation with readout appliedalong the main magnetic field. A matrix of 128×128 covering an FOV of300 mm was used with slice thickness of 40 mm. The maximum availablebandwidth/pixel for a given TR was utilized. No averages were taken forany of the images displayed. Numerical simulations, data analysis and visu-alization were done using Matlab 2006a (The MathWorks, Inc.).
2.3.1 In Vitro Experiments
An MR-compatible guidewire made up of Polyetherethertone synthetic poly-mer core with a diameter of 0.7 mm and compatible with 0.035
′′
catheterwas used. The paramagnetic material made up of stainless steel alloy waswrapped around the guidewire near its tip with approximate dimensions1mm in height and diameter. Frequency measurements yield an LMD of∆χV = 1 × 10⁻¹¹ m3 (in SI units). The guidewire was inserted into acustom-built phantom with 16 mm diameter tubes to model the blood flow,positioning and tracking of the guidewire in large vessels. The tubes wereimmersed in a gadolinium (Gd)-doped water and were surrounded by a 2%
28
Spatial-Spectral SSFP
agarose gel (v/v) doped with 0.5 mM copper sulphate (CuSO4) concen-tration to closely resemble the relaxation times of muscle tissues for whichT1=900 ms and T2=50 ms. A 7F introducer sheath was attached to the tubesto facilitate the introduction and manipulation of the guidewire within thetubes.
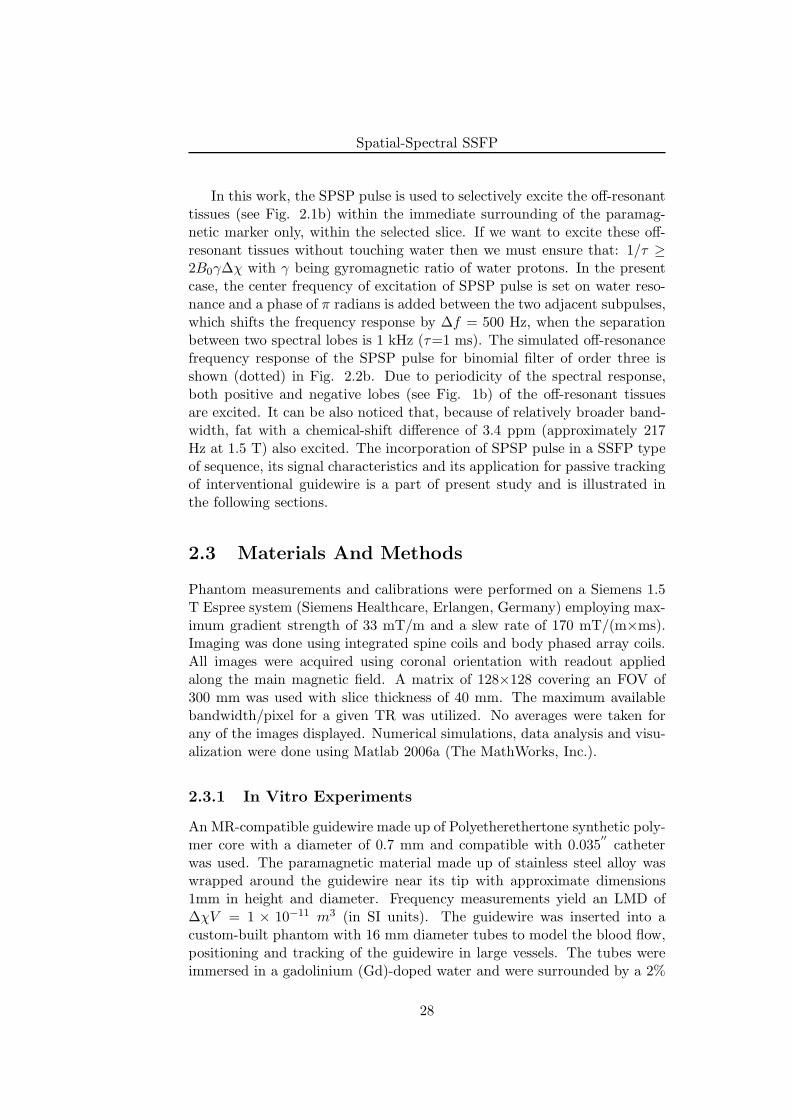
2.3.2 Imaging Experiments
The excitation scheme of standard SSFP-echo type of sequence was modifiedto incorporate the SPSP excitation pulse (n = 4) shown in Fig. 2.3. Toobtain a positive contrast image the center frequency of excitation of SPSPpulse was set 500 Hz (∆f) away from the water resonance. The values ofn and ∆f were chosen empirically for the current paramagnetic marker.It can be perceived that either SSFP-echo or SSFP-FID might be equallysuited as a template for SPSP pulse. However, empirically SSFP-echo wasfound to be better than SSFP-FID in terms of contrast-to-noise (CNR) ratioperformance. In addition, selective adiabatic short tau inversion recovery(STIR) pre-pulse [13, 14] was applied to achieve efficient fat suppression.In order to reduce the inversion time (TI) between inversion recovery pulseand the image acquisition, centric reordering scheme was employed.
2.3.3 Signal Characteristics of the SPSP pulse
For SPSP pulse, a change in the off-resonance excitation frequency (∆f)as well as the number of RF sub-pulses in it expected to have an effect onlocalization characteristics as well as positive contrast generation. Hence, inorder to analyze the positive contrast properties of the SPSP pulse, ∆f wasvaried from 200 Hz to 900 Hz away from the water resonance and number ofRF sub-pulses within the composite SPSP pulse was varied from 2 to 10. Atheoretical simulation was performed to calculate the normalized bandwidthof FIR filter for varying number of filter taps from 2 to 10.
2.4 Results
In this section, we describe the results obtained using flow phantom and MR-compatible interventional guidewire (See Materials and Methods). Next,we provide description of the off-resonant frequency dependent localizationcharacteristics of the SPSP pulse. This is followed by analysis of volume ofpositive contrast signal as a function of RF pulse count within the SPSPpulse.
29
Spatial-Spectral SSFP
GR A A A
-A
GP
TE
SSFP-echo
RF
GS
TR
1800
FATSUPPRESSION
ACQUISITION
TI
ADC
Figure 2.3: Pulse Sequence diagram of the SPSP SSFP-echo sequence. Theexcitation scheme of the standard SSFP-echo sequence was modified to in-corporate SPSP composite pulse (n = 4). To obtain a positive contrastimage the center frequency of excitation of SPSP pulse was set 500 Hz (∆f)away from the water resonance. To suppress concomitant fat signal selec-tive adiabatic short tau inversion recovery pulse (1800) was applied beforethe actual positive contrast image acquisition. TI was kept to minimum byemploying centric reordering scheme
30
Spatial-Spectral SSFP
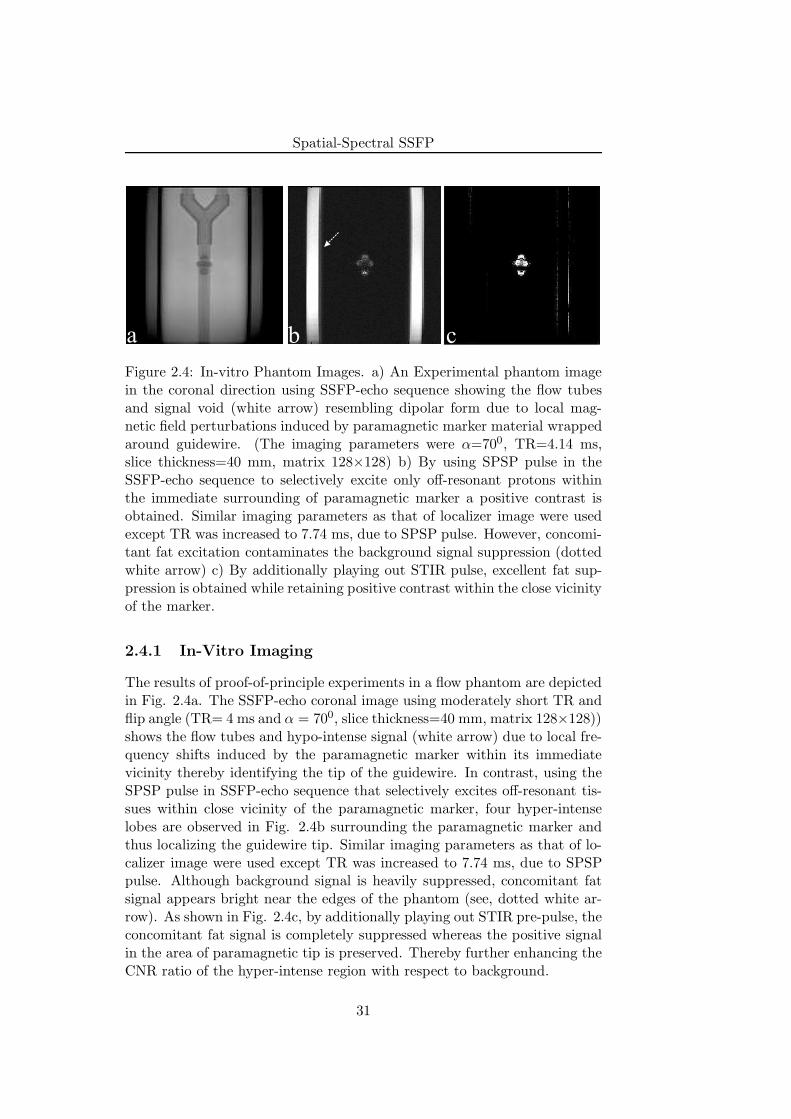
a b c
Figure 2.4: In-vitro Phantom Images. a) An Experimental phantom imagein the coronal direction using SSFP-echo sequence showing the flow tubesand signal void (white arrow) resembling dipolar form due to local mag-netic field perturbations induced by paramagnetic marker material wrappedaround guidewire. (The imaging parameters were α=700, TR=4.14 ms,slice thickness=40 mm, matrix 128×128) b) By using SPSP pulse in theSSFP-echo sequence to selectively excite only off-resonant protons withinthe immediate surrounding of paramagnetic marker a positive contrast isobtained. Similar imaging parameters as that of localizer image were usedexcept TR was increased to 7.74 ms, due to SPSP pulse. However, concomi-tant fat excitation contaminates the background signal suppression (dottedwhite arrow) c) By additionally playing out STIR pulse, excellent fat sup-pression is obtained while retaining positive contrast within the close vicinityof the marker.
2.4.1 In-Vitro Imaging
The results of proof-of-principle experiments in a flow phantom are depictedin Fig. 2.4a. The SSFP-echo coronal image using moderately short TR andflip angle (TR= 4 ms and α = 700, slice thickness=40 mm, matrix 128×128))shows the flow tubes and hypo-intense signal (white arrow) due to local fre-quency shifts induced by the paramagnetic marker within its immediatevicinity thereby identifying the tip of the guidewire. In contrast, using theSPSP pulse in SSFP-echo sequence that selectively excites off-resonant tis-sues within close vicinity of the paramagnetic marker, four hyper-intenselobes are observed in Fig. 2.4b surrounding the paramagnetic marker andthus localizing the guidewire tip. Similar imaging parameters as that of lo-calizer image were used except TR was increased to 7.74 ms, due to SPSPpulse. Although background signal is heavily suppressed, concomitant fatsignal appears bright near the edges of the phantom (see, dotted white ar-row). As shown in Fig. 2.4c, by additionally playing out STIR pre-pulse, theconcomitant fat signal is completely suppressed whereas the positive signalin the area of paramagnetic tip is preserved. Thereby further enhancing theCNR ratio of the hyper-intense region with respect to background.
31
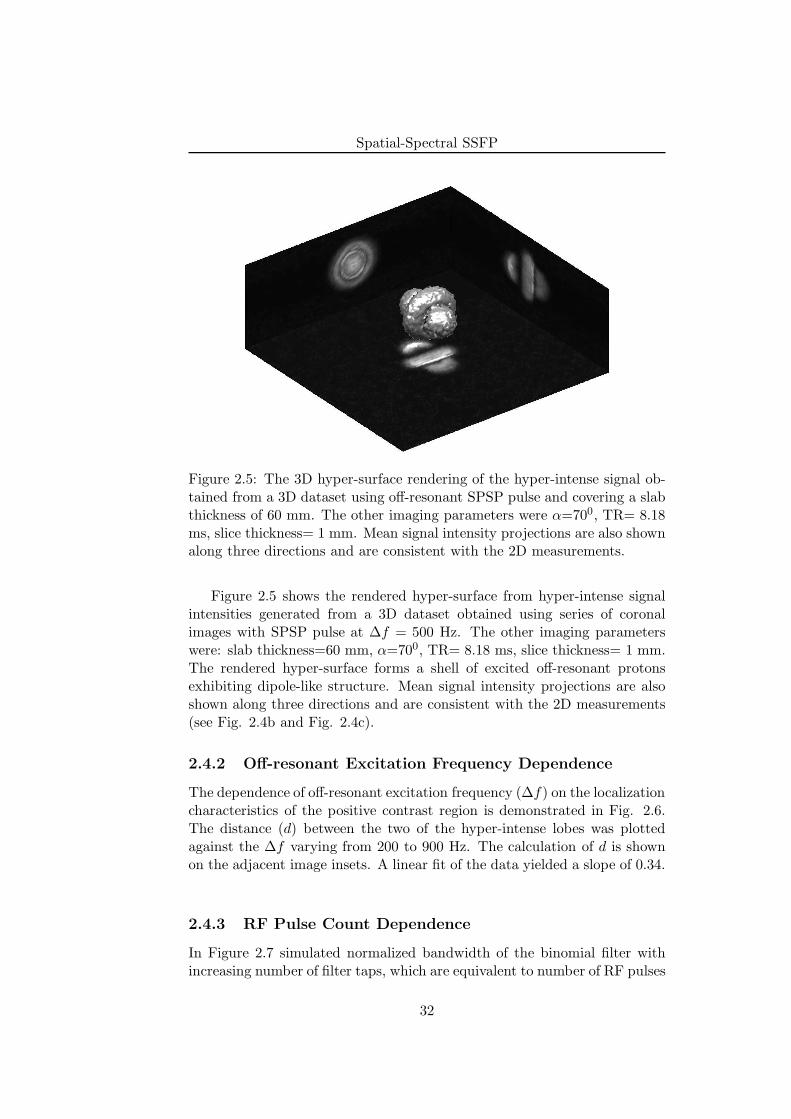
Spatial-Spectral SSFP
Figure 2.5: The 3D hyper-surface rendering of the hyper-intense signal ob-tained from a 3D dataset using off-resonant SPSP pulse and covering a slabthickness of 60 mm. The other imaging parameters were α=700, TR= 8.18ms, slice thickness= 1 mm. Mean signal intensity projections are also shownalong three directions and are consistent with the 2D measurements.
Figure 2.5 shows the rendered hyper-surface from hyper-intense signalintensities generated from a 3D dataset obtained using series of coronalimages with SPSP pulse at ∆f = 500 Hz. The other imaging parameterswere: slab thickness=60 mm, α=700, TR= 8.18 ms, slice thickness= 1 mm.The rendered hyper-surface forms a shell of excited off-resonant protonsexhibiting dipole-like structure. Mean signal intensity projections are alsoshown along three directions and are consistent with the 2D measurements(see Fig. 2.4b and Fig. 2.4c).
2.4.2 Off-resonant Excitation Frequency Dependence
The dependence of off-resonant excitation frequency (∆f) on the localizationcharacteristics of the positive contrast region is demonstrated in Fig. 2.6.The distance (d) between the two of the hyper-intense lobes was plottedagainst the ∆f varying from 200 to 900 Hz. The calculation of d is shownon the adjacent image insets. A linear fit of the data yielded a slope of 0.34.
2.4.3 RF Pulse Count Dependence
In Figure 2.7 simulated normalized bandwidth of the binomial filter withincreasing number of filter taps, which are equivalent to number of RF pulses
32
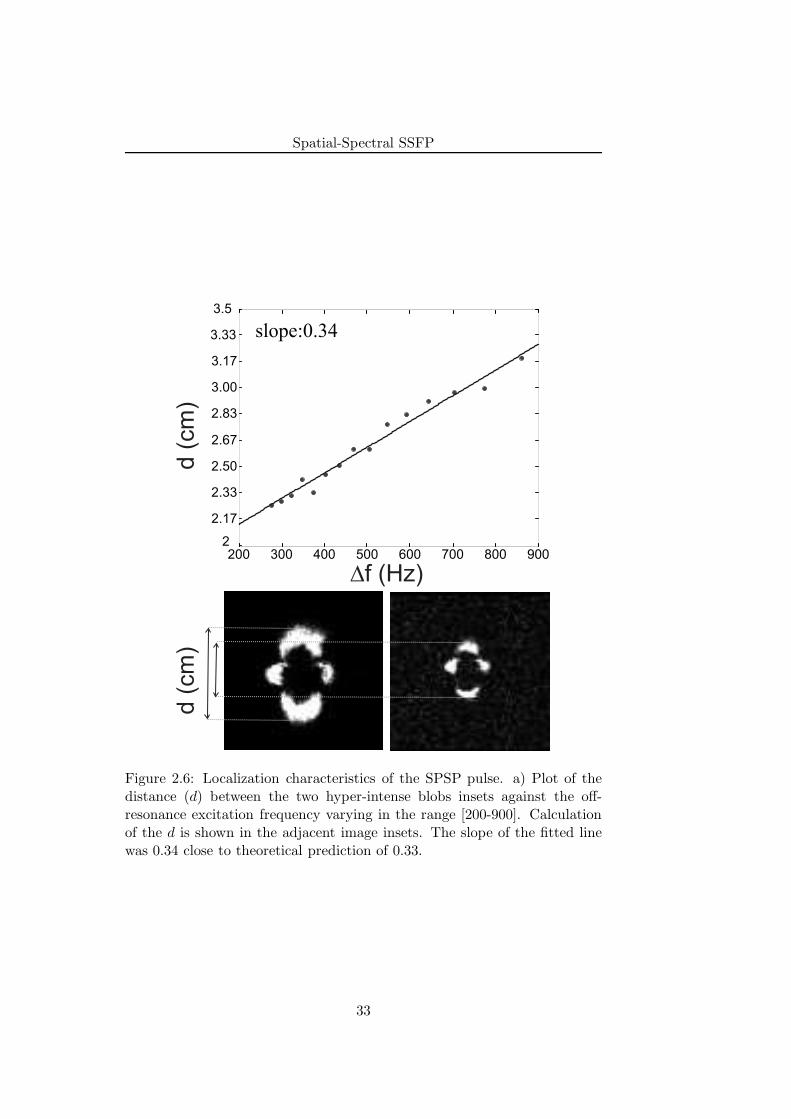
Spatial-Spectral SSFP
2
2.17
2.33
2.50
2.67
2.83
3.00
3.17
3.33
3.5
200 300 400 500 600 700 800 900
slope:0.34
Df (Hz)
d (
cm
)d (
cm
)
Figure 2.6: Localization characteristics of the SPSP pulse. a) Plot of thedistance (d) between the two hyper-intense blobs insets against the off-resonance excitation frequency varying in the range [200-900]. Calculationof the d is shown in the adjacent image insets. The slope of the fitted linewas 0.34 close to theoretical prediction of 0.33.
33
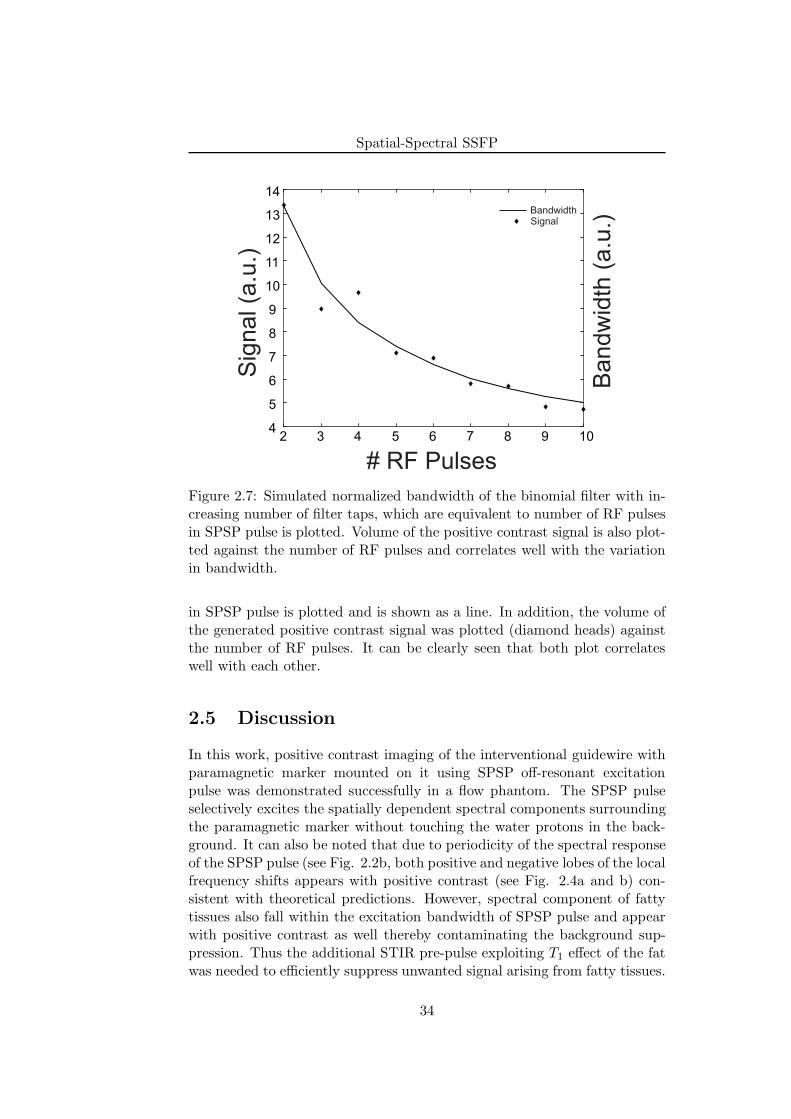
Spatial-Spectral SSFP
2 3 4 5 6 7 8 9 104
5
6
7
8
9
10
11
12
13
14
# RF Pulses
Sig
nal (a
.u.)
Bandw
idth
(a.u
.)SignalBandwidth
Figure 2.7: Simulated normalized bandwidth of the binomial filter with in-creasing number of filter taps, which are equivalent to number of RF pulsesin SPSP pulse is plotted. Volume of the positive contrast signal is also plot-ted against the number of RF pulses and correlates well with the variationin bandwidth.
in SPSP pulse is plotted and is shown as a line. In addition, the volume ofthe generated positive contrast signal was plotted (diamond heads) againstthe number of RF pulses. It can be clearly seen that both plot correlateswell with each other.
2.5 Discussion
In this work, positive contrast imaging of the interventional guidewire withparamagnetic marker mounted on it using SPSP off-resonant excitationpulse was demonstrated successfully in a flow phantom. The SPSP pulseselectively excites the spatially dependent spectral components surroundingthe paramagnetic marker without touching the water protons in the back-ground. It can also be noted that due to periodicity of the spectral responseof the SPSP pulse (see Fig. 2.2b, both positive and negative lobes of the localfrequency shifts appears with positive contrast (see Fig. 2.4a and b) con-sistent with theoretical predictions. However, spectral component of fattytissues also fall within the excitation bandwidth of SPSP pulse and appearwith positive contrast as well thereby contaminating the background sup-pression. Thus the additional STIR pre-pulse exploiting T1 effect of the fatwas needed to efficiently suppress unwanted signal arising from fatty tissues.
34
Spatial-Spectral SSFP
The SPSP excitation pulse excites a shell of off-resonant protons forminga dipole-like structure, which is evident from rendered hyper-surface in Fig.2.5 and is consistent with theoretical simulations shown in Fig 2.1b.
From Eq. 2.1 we can infer that the local frequency offsets (∆Bz) arespatially dependent and are directly proportional to its distance from theparamagnetic marker i.e., ∆Bz ∝ r−3 (Eq. 2.1, distance r). Thereforethe localization of positive contrast region using SPSP RF pulses can alsobe expected to scale with off-resonant excitation frequency (∆f ∝ r−3).To this end, the slope of the line plotting these power functions should beequal to their power value i.e., 0.33. Measurements shown in Fig. 2.6 yielda slope value of 0.34 and correlate well with the theoretical predictions.The proximity of the positive contrast region to the marker may thus becontrolled by using ∆f to a lower value for this paramagnetic marker. Thismay however, lead to excitation of nearby on-resonant water protons (seeFig. 2.2b) thereby contaminating efficient background suppression. Hence,a good compromise for ∆f dependent on size of marker material needs tobe obtained.
It is well-known that the bandwidth of n-point FIR scales with the in-crease in filter taps (number of filter points), although not necessarily in alinear manner [11]. Since SPSP composite pulse also consists of series ofRF pulses, its spectral response is governed by number of RF pulses con-taining in it. Thus the volume of the positive contrast region (region ofexcited off-resonance frequencies) is also expected to scale with the numberof RF pulses used in SPSP pulse. This is clearly evident from Fig. 2.7 inwhich theoretical predictions (normalized bandwidth) and experimentallymeasured values (volume of positive contrast) are in good agreement witheach other. The effectiveness of the background suppression and thus theCNR of the positive contrast could effectively be controlled by increasingthe number of RF pulses. However, this may also lead to increase in TRand thereby losing the signal as SSFP-echo signal decreases with increase inTR.
Based on similar findings of others [7, 8], further potential applicationof SPSP pulse includes the positive contrast visualization and tracking ofSPIO-labeled cells.
The other sources of B0 inhomogeneities such as air-tissue interfaces mayalso inevitably lead to positive contrast thereby causing unnecessary back-ground signal contamination. However, by using volumetric shimming thiscontamination can be minimized as indicated previously [7]. Due to com-posite SPSP pulse TR of SSFP-echo sequence increases considerably therebypartially losing the temporal efficiency. In spite of this, by using additionalmeans of acceleration techniques such as parallel imaging, passive trackingof interventional guidewire can be done at sufficient temporal and spatialresolution. Another considerable limitation of the proposed method is ad-ditional use of STIR pre-pulse. Yet another way of suppressing the signal
35
Spatial-Spectral SSFP
from fatty tissues is based on its chemical shift effect [15]. However, thisapproach may irreversibly compete with the proposed SPSP pulse approachand may hamper the positive contrast enhancement. Although the positivecontrast generation using SPSP pulse for paramagnetic marker was success-fully demonstrated in a flow phantom, its performance in in-vivo studies stillneeds to be explored.
2.6 Conclusion
In this work, a new concept of positive contrast imaging within the closevicinity of the paramagnetic marker was presented and its use to visualizeinterventional guidewire tip was demonstrated. The SPSP pulse, which isboth spatially as well as spectrally selective, was used to excite off-resonanttissues within the immediate surrounding of the paramagnetic marker togenerate positive contrast. By additionally playing out STIR pre-pulse ef-ficient fat suppression was achieved, whilst retaining the positive contrast.The proximity of the positive contrast to the marker tip was dependent onoff-resonance excitation frequency of the SPSP pulse, whereas volume of thepositive contrast was dependent on the number of RF sub-pulses within theSPSP pulse.
References
[1] D. Rubin, A. Ratner, and S. Young, “Magnetic susceptibility effects andtheir application in the development of new ferromagnetic catheters formagnetic resonance imaging,” Invest Radiol, vol. 25, p. 1325–32, Dec.1990.
[2] C. Bakker, R. Hoogeveen, J. Weber, J. van Vaals, M. Viergever, andW. Mali, “Visualization of dedicated catheters using fast scanning tech-niques with potential for MR-guided vascular interventions,” Magn Re-son Med, vol. 36, p. 816–20, Dec. 1996.
[3] M. H. M. Dias and P. C. Lauterbur, “Ferromagnetic particles ascontrast agents for magnetic resonance imaging of liver and spleen,”Magnetic Resonance in Medicine: Official Journal of the Society ofMagnetic Resonance in Medicine / Society of Magnetic Resonance inMedicine, vol. 3, pp. 328–330, Apr. 1986. PMID: 3713497.
[4] J. Seppenwoolde, M. Viergever, and C. Bakker, “Passive tracking ex-ploiting local signal conservation: the white marker phenomenon,”Magn Reson Med, vol. 50, p. 784–90, Oct. 2003.
[5] O. Bieri, S. Patil, H. Quick, and K. Scheffler, “Morphing steady-statefree precession,” Magn Reson Med, vol. 58, p. 1242–8, Dec. 2007.
36
Spatial-Spectral SSFP
[6] R. Mekle, E. Hofmann, K. Scheffler, and D. Bilecen, “A polymer-basedMR-compatible guidewire: a study to explore new prospects for in-terventional peripheral magnetic resonance angiography (ipMRA),” JMagn Reson Imaging, vol. 23, p. 145–55, Feb. 2006.
[7] M. Stuber, W. Gilson, M. Schar, D. Kedziorek, L. Hofmann, S. Shah,E. Vonken, J. Bulte, and D. Kraitchman, “Positive contrast visual-ization of iron oxide-labeled stem cells using inversion-recovery withON-resonant water suppression (IRON),” Magn Reson Med, vol. 58,p. 1072–7, Nov. 2007.
[8] C. Cunningham, T. Arai, P. Yang, M. McConnell, J. Pauly, andS. Conolly, “Positive contrast magnetic resonance imaging of cellslabeled with magnetic nanoparticles,” Magn Reson Med, vol. 53,p. 999–1005, May 2005.
[9] E. Vonken, M. Schar, and M. Stuber, “Positive contrast visualizationof nitinol devices using susceptibility gradient mapping,” Magn ResonMed, vol. 60, p. 588–94, Sept. 2008.
[10] Y. Zur, “Design of improved spectral-spatial pulses for routine clinicaluse,” Magn Reson Med, vol. 43, p. 410–20, Mar. 2000.
[11] J. Proakis and D. Manolakis, Digital Signal Processing (4th Edition).Prentice Hall, Mar. 2006.
[12] A. Oppenheim, R. Schafer, and J. Buck, Discrete-Time Signal Process-ing (2nd Edition). Prentice Hall, Feb. 1999.
[13] G. Bydder, R. Steiner, L. Blumgart, S. Khenia, and I. Young, “MRimaging of the liver using short TI inversion recovery sequences,” JComput Assist Tomogr, vol. 9, p. 1084–9, Dec. 1985.
[14] G. Bydder and I. Young, “MR imaging: clinical use of the inversionrecovery sequence,” J Comput Assist Tomogr, vol. 9, p. 659–75, Aug.1985.
[15] A. Haase, J. Frahm, W. Hanicke, and D. Matthaei, “1H NMR chemicalshift selective (CHESS) imaging,” Physics in Medicine and Biology,vol. 30, p. 341–344, Apr. 1985. PMID: 4001160.
37

Spatial-Spectral SSFP
38
Chapter 3
Echo-dephased Steady StateFree Precession
Major part of this chapter has been published as:
S. Patil, O. Bieri, and K. Scheffler, “Echo-dephased steady state free precession”, Magma(New York, N.Y.), May 2009. PMID: 19449047
39
Echo-dephased Steady State Free Precession
3.1 Introduction
Magnetic field inhomogeneities, for example as generated by susceptibil-ity differences, have a strong impact on signal properties of gradient-echosequences [1]. It is well known that strong field inhomogeneities appearas black voids (signal loss) in a typical GRE image entailing a negativecontrast with respect to background signal. On the other hand, positivecontrast from local susceptibility changes was first proposed by Frahm etal [2] using local gradient compensation. Positive contrast, also known aswhite marker imaging has found application in interventional MRI for pas-sive depiction and tracking of the interventional devices [3] or to visualizemagnetically labeled cells [4]. Generally a gradient in slice direction is usedto dephase background signals, whereas marker-related local gradients com-pensate for the dephasing to produce locally a positive contrast. One ofthe major prerequisites for successful passive tracking is the feasibility ofimage acquisitions with extended slab thickness (40–50 mm) to guaranteethat the marker material always lies within the plane being imaged. How-ever, application of dephasing gradients using extended slice thickness mayalso enhance other unwanted background signals, e.g. from air/tissue inter-faces and thereby hampering proper marker localization and visualization.Sequence developments that further reduce background sensitivity are thusdesirable and only recently a promising concept for the generation of positivecontrast from local susceptibilities was proposed which is based on morphingof steady-state free precession (SSFP) [5].
In this chapter, we further develop the idea of gradient compensationin SSFP to locally induce high signal intensities. In the close vicinity ofparamagnetic materials, strong local gradient fields may compensate forany sequence-related gradients to locally induce signal transitions from anecho-dephased to an echo-rephased type of SSFP (mainly balanced SSFP(bSSFP)) sequence. Generically resembling an unbalanced SSFP, in echo-dephased SSFP echoes are preferably dephased by ±π prior to readout. Thisnot only ensures excellent cancellation of any background signals but alsogeneric dephasing from unbalanced SSFP greatly reduces unwanted back-ground signal enhancements. It will be demonstrated that due to the higherin-plane resolution as compared to slice resolution, local gradient compen-sation in echo-dephased SSFP is likely to take place only within the closevicinity of the paramagnetic marker material. Conceptual issues of gradi-ent compensation and its signal properties are analyzed and discussed. Todemonstrate the feasibility of proper marker visualization and localizationusing echo-dephased SSFP, reliable tracking of MR compatible interven-tional guidewire having paramagnetic material on it is demonstrated in asimple flow phantom. The utility of the echo-dephased SSFP is also shownfor positive contrast visualization of human pancreatic islets labeled withsuperparamagnetic iron oxide (SPIO) contrast agent in vitro. Finally in
40

Echo-dephased Steady State Free Precession
vivo experiments in a rat model demonstrates the robust and reliable visu-alization of transplanted SPIO-labeled pancreatic islets in a rat chamber.
3.2 Materials and Methods
In order to illustrate the conceptual issues of echo-dephased SSFP, numericalsimulations, data analysis and visualization were done using Matlab 2006a(The MathWorks, Inc.). Flow phantom measurements and calibrations wereperformed on a Siemens 1.5 T Espree system (Siemens Healthcare, Erlan-gen, Germany), whereas the human islet cell visualization in a phantom andin vivo rat studies were done on a Siemens 3 T Trio system. Unless oth-erwise stated, images were acquired in the coronal direction with readoutand dephasing gradients applied along the main magnetic field. A matrix of256×256 covering a FOV of 200 mm was used with a slice thickness of 40mm. The maximum available bandwidth/pixel for a given TR was utilized.
3.2.1 Local Gradient Field Effect
A small paramagnetic material (for example, stainless steel) induces spa-tially dependent local gradient perturbations (∆G) derived from the partialderivatives of the field offsets (∆Bz) according to [3]
∆Gz = −3cz−3x2−3y2+2z2
(x2+y2+z2)7/2; (3.1)
∆Gx = −3cx x2+y2−4z2
(x2+y2+z2)7/2
with c = B0 ·∆χ ·V4π , B0 is the main magnetic field, ∆χ is the susceptibility
difference between the marker material and the surrounding tissues and∆χV (m3) characterizes the local magnetic dose (LMD) [6]. The ∆Gy showssimilar spatial dependence as that of ∆Gx due to radial symmetry of the∆Bz.
Depending upon the direction of the slice orientation one of these fieldperturbations may compensate for imaging related dephasing gradients. Forexample, if the slice orientation is along coronal direction, ∆Gz may act asa compensating gradient for any gradient applied along the main magneticfield. In the following, we will further develop the idea of compensation ofecho-dephasing gradients in SSFP.
3.2.2 Echo-dephased SSFP
Generally within any repetition time the phase evolution φG of an isochro-mat at position r(x, y, z) in the presence of a gradient G is given by [7]
φG = γ
∫ TR
0G(t) · rdt, (3.2)
41
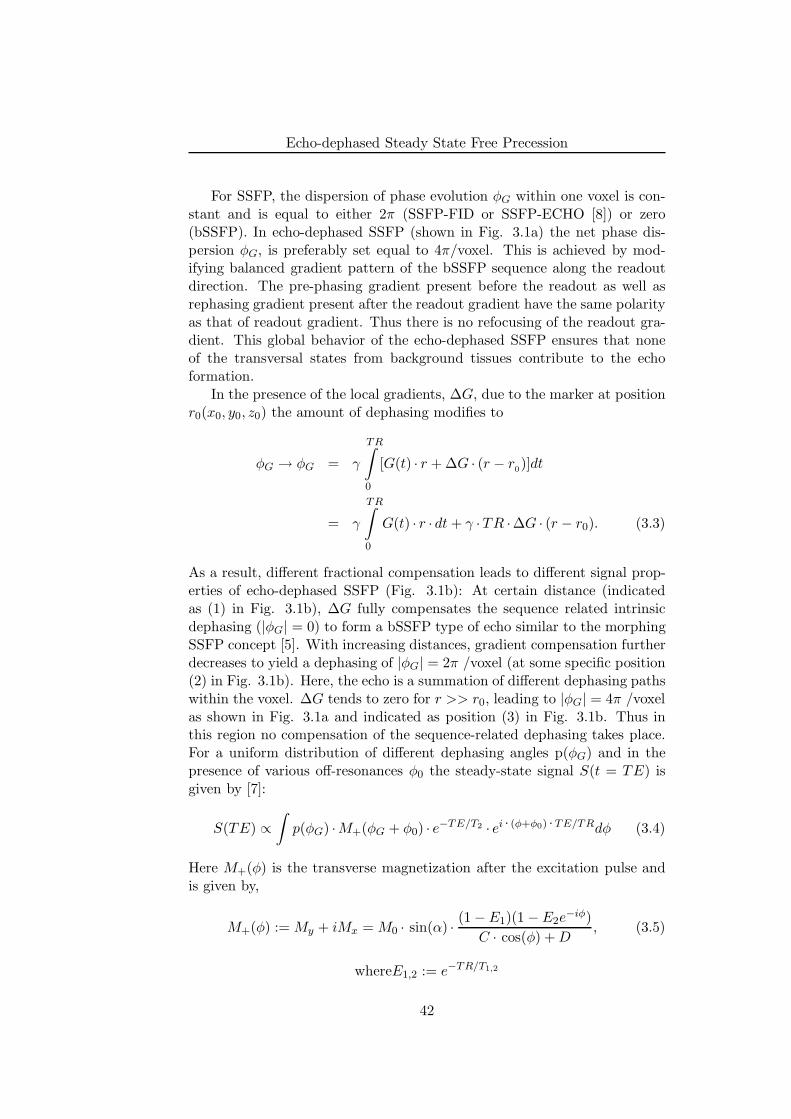
Echo-dephased Steady State Free Precession
For SSFP, the dispersion of phase evolution φG within one voxel is con-stant and is equal to either 2π (SSFP-FID or SSFP-ECHO [8]) or zero(bSSFP). In echo-dephased SSFP (shown in Fig. 3.1a) the net phase dis-persion φG, is preferably set equal to 4π/voxel. This is achieved by mod-ifying balanced gradient pattern of the bSSFP sequence along the readoutdirection. The pre-phasing gradient present before the readout as well asrephasing gradient present after the readout gradient have the same polarityas that of readout gradient. Thus there is no refocusing of the readout gra-dient. This global behavior of the echo-dephased SSFP ensures that noneof the transversal states from background tissues contribute to the echoformation.
In the presence of the local gradients, ∆G, due to the marker at positionr0(x0, y0, z0) the amount of dephasing modifies to
φG → φG = γ
TR∫
0
[G(t) · r + ∆G · (r − r0)]dt
= γ
TR∫
0
G(t) · r · dt + γ ·TR ·∆G · (r − r0). (3.3)
As a result, different fractional compensation leads to different signal prop-erties of echo-dephased SSFP (Fig. 3.1b): At certain distance (indicatedas (1) in Fig. 3.1b), ∆G fully compensates the sequence related intrinsicdephasing (|φG| = 0) to form a bSSFP type of echo similar to the morphingSSFP concept [5]. With increasing distances, gradient compensation furtherdecreases to yield a dephasing of |φG| = 2π /voxel (at some specific position(2) in Fig. 3.1b). Here, the echo is a summation of different dephasing pathswithin the voxel. ∆G tends to zero for r >> r0, leading to |φG| = 4π /voxelas shown in Fig. 3.1a and indicated as position (3) in Fig. 3.1b. Thus inthis region no compensation of the sequence-related dephasing takes place.For a uniform distribution of different dephasing angles p(φG) and in thepresence of various off-resonances φ0 the steady-state signal S(t = TE) isgiven by [7]:
S(TE) ∝∫
p(φG) ·M+(φG + φ0) · e−TE/T2 · ei · (φ+φ0) ·TE/TRdφ (3.4)
Here M+(φ) is the transverse magnetization after the excitation pulse andis given by,
M+(φ) := My + iMx = M0 · sin(α) · (1 − E1)(1 − E2e−iφ)
C · cos(φ) + D, (3.5)
whereE1,2 := e−TR/T1,2
42
Echo-dephased Steady State Free Precession
Figure 3.1: The working principle of echo-dephased SSFP. a) Sequence dia-gram. Echo-dephased SSFP dephases spins by 4π/voxel along the readoutdirection (total area: 4A). This ensures complete suppression of the back-ground. b) The signal behavior at TE=TR in the presence of local gradientfields (∆G), e.g. as induced by the paramagnetic ring marker. At certainspatial locations (1, 2, 3), ∆G may fully, partially or not compensate thesequence-related dephasing gradient to form different types of SSFP echo:At (1): balanced SSFP (∆G may fully compensate an amount equal to G),at (2): averaged balanced SSFP (at location further away from marker, ∆Gmay compensate an amount equal to G/2) and at (3): echo-dephased SSFP(with further increase in the distance away from the marker, the sequencemay exhibit global behavior shown in Fig. 3.1a).
43
Echo-dephased Steady State Free Precession
and
C : = E2(E1 − 1)(1 + cos(α)), (3.6)
D : = (1 − E1 cos(α)) − (E1 − cos(α))E22
In order to guide the development of echo-dephased SSFP, simulationsof S(TE) using Eq. 3.4 were performed at different TE values resem-bling the well-known SSFP sequences namely SSFP-FID (TE = 0), bSSFP(TE = TR/2) and SSFP-ECHO (TE = TR) as a function of fractional gra-dient compensation (φG) varying in the range of [−4π : 4π] and off-resonance(φ0 varying from -540 Hz to 540 Hz. The other imaging parameters usedfor simulations were: TR=3 ms, T1 = 300 ms and T2 = 100 ms. To furtherdemonstrate the signal characteristics of the echo-dephased SSFP dependen-cies of the steady state signal on different TRs and relaxation times wereevaluated. This was achieved by plotting the difference between the steady-state signal, S(TE) obtained at two different TRs (TR = 3 ms and 20 ms)and at two different sets of relaxation times (T1 = 1200 ms, T2 = 400 msand T1 = 300 ms, T2 = 100 ms). In all simulations, the near optimal flipangles (αopt ≈ cos−1[ ǫ−1
ǫ+1 ], ǫ = T1/T2; see (10,11)) were used.To visualize the effect of local gradient fields (see Eq. 3.1) surrounding
the paramagnetic marker during typical 2-dimensional (2D) magnitude im-age acquisition, numerical simulations were carried out for a coronal slice.The paramagnetic marker of radius 1 mm was assumed to be placed at thecenter. The signal intensity calculations for bSSFP (|φG| = 0/voxel) andecho-dephased SSFP (|φG| = 4π /voxel) were carried out over the FOV of40 mm and slice thickness 40 mm using Eq. 3.4 in the presence of ∆G.The readout was placed along the main magnetic field. The other imagingparameters were: TE/TR=2.5/5.0 ms and T1/T2= 300/200 ms.
3.2.3 Guidewire and Phantom
An MR-compatible guidewire made up of Polyetherethertone synthetic poly-mer core with a diameter of 0.7 mm and compatible with 0.035
′′
catheterwas used [9]. The paramagnetic material made up of stainless steel alloywas wrapped around the guidewire near its tip with approximate dimen-sions 1 mm in height and diameter. Frequency measurements yield a LMDof ∆χV = 1 × 10⁻¹¹ m3 (in SI units). The guidewire was inserted intoa custom-built phantom with 11 mm diameter tubes to model the bloodflow, positioning and tracking of the guidewire in large vessels. The tubeswere immersed in a gadolinium (Gd)-doped water and were surrounded by a2% agarose gel (v/v) doped with 0.5 mM copper sulphate (CuSO4) concen-tration to closely resemble the relaxation times of muscle tissues for whichT1=900 ms and T2=50 ms. A 7F introducer sheath was attached to the tubesto facilitate the introduction and manipulation of the guidewire within thetubes.
44
Echo-dephased Steady State Free Precession
3.2.4 Passive Tracking Experiments
The passive tracking experiments followed a standard procedure: First, aroadmap of the flow phantom was obtained resembling the vasculature struc-ture of human leg (see Fig. 3.6). Second, positive contrast images fromecho-dephased SSFP are merged with the roadmap in near real time in thefollowing manner: In a first step, both roadmap and echo-dephased SSFPimages were converted into binary masks by thresholding. In a second step,the two masks were multiplied to confine the marker position within theroadmap, which was finally merged with the original roadmap image. Thetubes of the phantom were connected to a pump (14-166; Cobe LaboratoriesInc., Lakewood, CO, USA) and the flow was set to 4mL/sec. The circulatingwater was doped with 0.5mL Gd-DOTA (Dotarem; Guerbet, Roissy CDGCedex, France) having a T1 relaxation time similar to blood (1270 ms).
The 2D roadmap was generated based on an inversion-recovery SSFP-FID sequence, as described in [9] using FOV = 30 cm, TR/TE=4.21/2.11ms, α = 400 and bandwidth/pixel=720 Hz. Echo-dephased SSFP imageswere acquired with essentially the same FOV having TR/TE=3.5/1.75 ms,bandwidth/pixel=590 Hz and partial Fourier factor of 5/8. Parallel imag-ing technique, GRAPPA with an acceleration factor of 3 and 12 referencelines were also utilized, yielding a total image acquisition time for positionalmarker update of around 250 ms.
3.2.5 Pancreatic Islet Cell Transplantation
Human pancreas were removed from brain-dead donors. Donors were se-lected according to the results of a multivariate analysis of factors thatinfluence the success of islet isolation. To isolate the islets, the ducts wereperfused in a controlled fashion with a cold enzyme. The islets were thenseparated by gentle mechanical dissociation and purified with the use ofcontinuous gradients of Ficoll–diatrizoic acid (Seromed-Biochrom). Isolatedislets were incubated in CMRL-1066 medium (Sigma, USA) (370C, 5% at-mospheric CO2) with the liver-specific magnetic resonance contrast agentResovist R©(5µl of contrast agent/ml of the media, Schering, Czech Repub-lic) for 24-48 hours. Resovist R©is a commercially available SPIO contrastagent based on carbodextran-coated iron-oxide nanoparticles. This contrastagent has been widely studied experimentally and is also approved for hu-man use. After removal from the tissue culture medium, the islets werecentrifuged and washed two times in HBSS (Sigma, USA) solution. A totalof approximately 2000 islets were embedded in a 4% gelatin (Sigma, USA)
Rat pancreatic islets were isolated from adult male Lewis rats. Four ratswere used as islet donors for one recipient. Isolated islets were incubated inCMRL-1066 medium (Sigma, USA) (370C, 5% atmospheric CO2) with theliver-specific magnetic resonance contrast agent Resovist R©(Schering, Czech
45
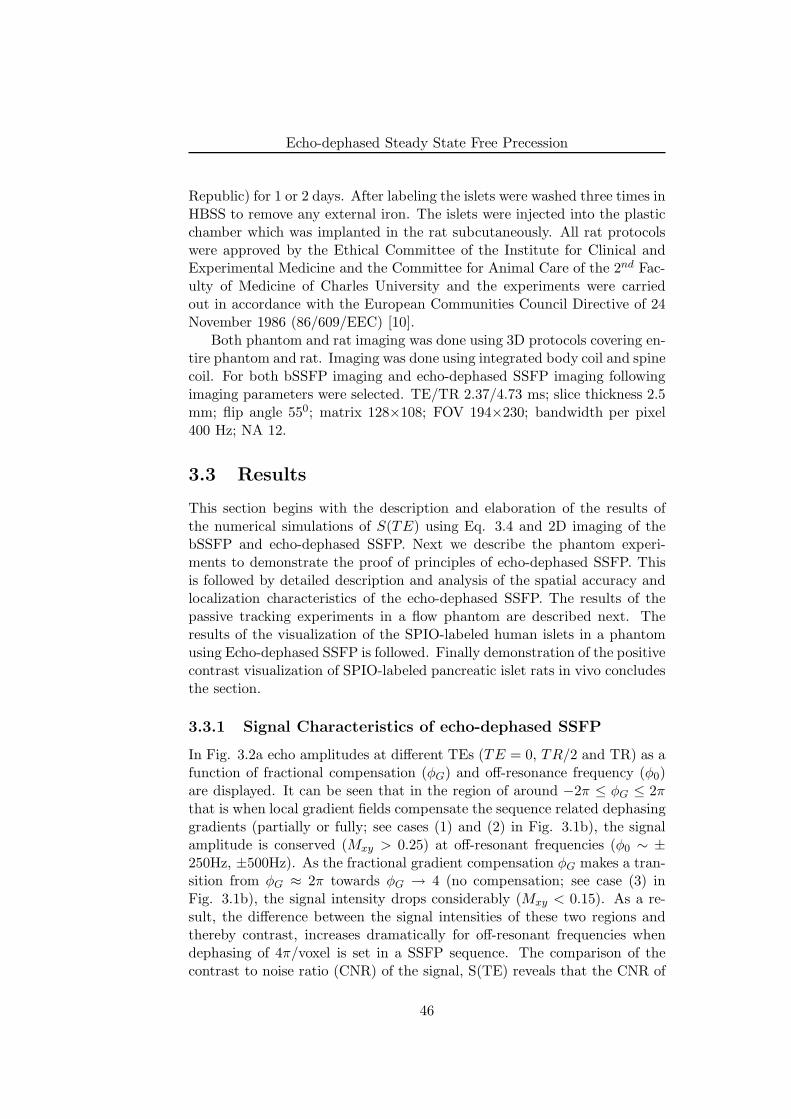
Echo-dephased Steady State Free Precession
Republic) for 1 or 2 days. After labeling the islets were washed three times inHBSS to remove any external iron. The islets were injected into the plasticchamber which was implanted in the rat subcutaneously. All rat protocolswere approved by the Ethical Committee of the Institute for Clinical andExperimental Medicine and the Committee for Animal Care of the 2nd Fac-ulty of Medicine of Charles University and the experiments were carriedout in accordance with the European Communities Council Directive of 24November 1986 (86/609/EEC) [10].
Both phantom and rat imaging was done using 3D protocols covering en-tire phantom and rat. Imaging was done using integrated body coil and spinecoil. For both bSSFP imaging and echo-dephased SSFP imaging followingimaging parameters were selected. TE/TR 2.37/4.73 ms; slice thickness 2.5mm; flip angle 550; matrix 128×108; FOV 194×230; bandwidth per pixel400 Hz; NA 12.
3.3 Results
This section begins with the description and elaboration of the results ofthe numerical simulations of S(TE) using Eq. 3.4 and 2D imaging of thebSSFP and echo-dephased SSFP. Next we describe the phantom experi-ments to demonstrate the proof of principles of echo-dephased SSFP. Thisis followed by detailed description and analysis of the spatial accuracy andlocalization characteristics of the echo-dephased SSFP. The results of thepassive tracking experiments in a flow phantom are described next. Theresults of the visualization of the SPIO-labeled human islets in a phantomusing Echo-dephased SSFP is followed. Finally demonstration of the positivecontrast visualization of SPIO-labeled pancreatic islet rats in vivo concludesthe section.
3.3.1 Signal Characteristics of echo-dephased SSFP
In Fig. 3.2a echo amplitudes at different TEs (TE = 0, TR/2 and TR) as afunction of fractional compensation (φG) and off-resonance frequency (φ0)are displayed. It can be seen that in the region of around −2π ≤ φG ≤ 2πthat is when local gradient fields compensate the sequence related dephasinggradients (partially or fully; see cases (1) and (2) in Fig. 3.1b), the signalamplitude is conserved (Mxy > 0.25) at off-resonant frequencies (φ0 ∼ ±250Hz, ±500Hz). As the fractional gradient compensation φG makes a tran-sition from φG ≈ 2π towards φG → 4 (no compensation; see case (3) inFig. 3.1b), the signal intensity drops considerably (Mxy < 0.15). As a re-sult, the difference between the signal intensities of these two regions andthereby contrast, increases dramatically for off-resonant frequencies whendephasing of 4π/voxel is set in a SSFP sequence. The comparison of thecontrast to noise ratio (CNR) of the signal, S(TE) reveals that the CNR of
46
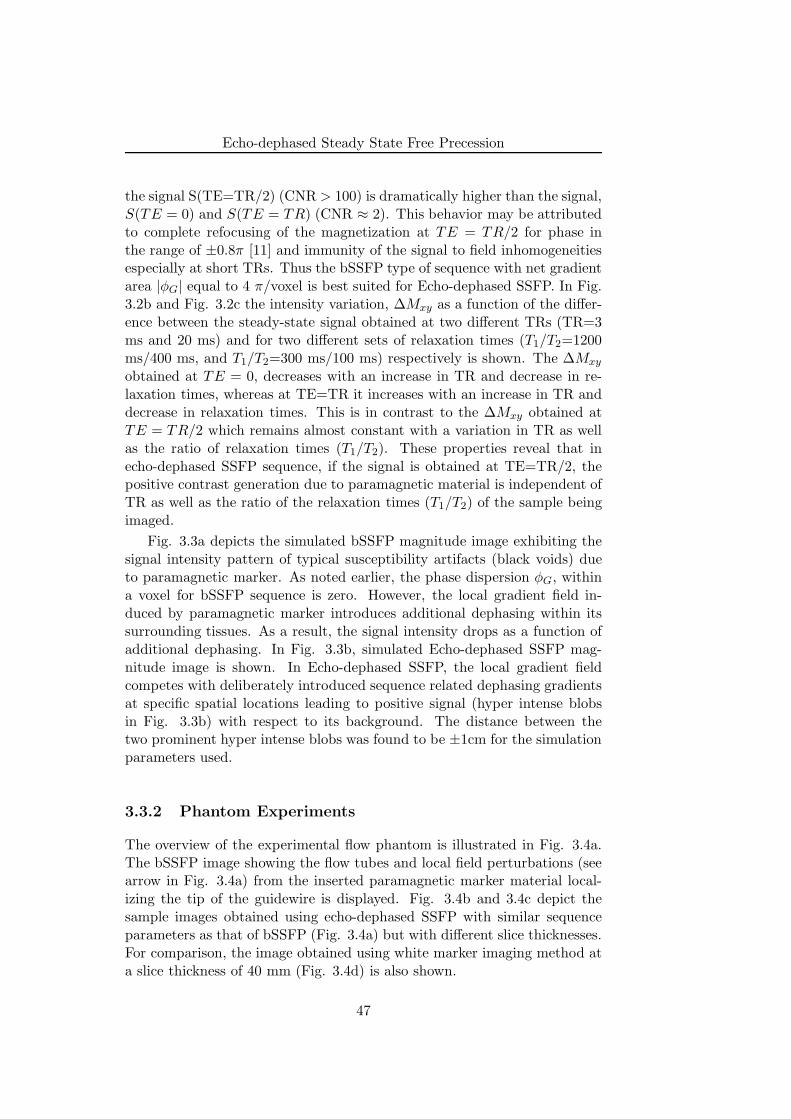
Echo-dephased Steady State Free Precession
the signal S(TE=TR/2) (CNR > 100) is dramatically higher than the signal,S(TE = 0) and S(TE = TR) (CNR ≈ 2). This behavior may be attributedto complete refocusing of the magnetization at TE = TR/2 for phase inthe range of ±0.8π [11] and immunity of the signal to field inhomogeneitiesespecially at short TRs. Thus the bSSFP type of sequence with net gradientarea |φG| equal to 4 π/voxel is best suited for Echo-dephased SSFP. In Fig.3.2b and Fig. 3.2c the intensity variation, ∆Mxy as a function of the differ-ence between the steady-state signal obtained at two different TRs (TR=3ms and 20 ms) and for two different sets of relaxation times (T1/T2=1200ms/400 ms, and T1/T2=300 ms/100 ms) respectively is shown. The ∆Mxy
obtained at TE = 0, decreases with an increase in TR and decrease in re-laxation times, whereas at TE=TR it increases with an increase in TR anddecrease in relaxation times. This is in contrast to the ∆Mxy obtained atTE = TR/2 which remains almost constant with a variation in TR as wellas the ratio of relaxation times (T1/T2). These properties reveal that inecho-dephased SSFP sequence, if the signal is obtained at TE=TR/2, thepositive contrast generation due to paramagnetic material is independent ofTR as well as the ratio of the relaxation times (T1/T2) of the sample beingimaged.
Fig. 3.3a depicts the simulated bSSFP magnitude image exhibiting thesignal intensity pattern of typical susceptibility artifacts (black voids) dueto paramagnetic marker. As noted earlier, the phase dispersion φG, withina voxel for bSSFP sequence is zero. However, the local gradient field in-duced by paramagnetic marker introduces additional dephasing within itssurrounding tissues. As a result, the signal intensity drops as a function ofadditional dephasing. In Fig. 3.3b, simulated Echo-dephased SSFP mag-nitude image is shown. In Echo-dephased SSFP, the local gradient fieldcompetes with deliberately introduced sequence related dephasing gradientsat specific spatial locations leading to positive signal (hyper intense blobsin Fig. 3.3b) with respect to its background. The distance between thetwo prominent hyper intense blobs was found to be ±1cm for the simulationparameters used.
3.3.2 Phantom Experiments
The overview of the experimental flow phantom is illustrated in Fig. 3.4a.The bSSFP image showing the flow tubes and local field perturbations (seearrow in Fig. 3.4a) from the inserted paramagnetic marker material local-izing the tip of the guidewire is displayed. Fig. 3.4b and 3.4c depict thesample images obtained using echo-dephased SSFP with similar sequenceparameters as that of bSSFP (Fig. 3.4a) but with different slice thicknesses.For comparison, the image obtained using white marker imaging method ata slice thickness of 40 mm (Fig. 3.4d) is also shown.
47
Echo-dephased Steady State Free Precession
Figure 3.2: a) Signal amplitudes S(TE) at various TEs (TE = 0, TR/2, TR)resembling the well-known SSFP sequences namely SSFP-FID, bSSFP andSSFP-ECHO respectively as a function of φG varying in the range of [−4π :4π] and off-resonance frequencies (φ0) varying from -540 Hz to 540 Hz atoptimal flip angle. The other imaging parameters were: TR=3 ms, T1 = 300ms and T2 = 100 ms. In the region of around −2π ≤ φG ≤ 2π that is whenlocal gradient fields compensate the sequence related dephasing gradients(partially or fully), the signal amplitude is conserved (Mxy > 0.25) at off-resonant frequencies (φ0 ≈ ±250 Hz, ±500 Hz). As the fractional gradientcompensation φG makes a transition from φG = 2π towards φG → 4(nocompensation), the signal intensity (S(TE)) drops considerably (Mxy <0.15). b) The signal difference between S(TE) at two different TRs (TR=3ms and 20 ms) and c) at two different sets of relaxation times (T1/T2 = 1200ms/400 ms and T1/T2 = 300 ms/100 ms). Thus, if the signal is obtained atTE = TR/2, the positive contrast generation due to paramagnetic materialis independent of TR as well as the ratio of relaxation times (T1/T2) of thesample being imaged.
48
Echo-dephased Steady State Free Precession
Figure 3.3: Numerical simulation of the a) balanced SSFP and b) Echo-dephased SSFP sequence for a coronal slice with readout along the mainmagnetic field over the FOV of 40 mm at optimal flip angle in the presenceof the paramagnetic marker located at the center. The other imaging param-eters were: TE/TR=2.5 ms/5 ms, T1/T2= 300 ms/200 ms, slice thickness40 mm. The signal level (S) is shown in arbitrary units (a.u.).
3.3.3 Localization Characteristics of echo-dephased SSFP
To characterize the localization accuracy of echo-dephased SSFP, the dis-tance d between the centers of the two prominent hyper-intense blobs wasanalyzed as a function of TR within about 4.7 ms to 100 ms.
From Eq. 3.3, phase evolution from local gradients as induced by para-magnetic marker materials are directly proportional to TR. Thus, with in-creasing TR, gradient compensation is located further and further away fromthe marker’s position according to [5]
r(TR) =4√
TR (3.7)
In Fig. 3.5, localization accuracy of echo-dephased SSFP is analyzed.From Eq. 3.7, the distance (r) from the perturbation source, where localgradient compensation takes place, is expected to scale proportional to TRin a double logarithmic plot with a slope of 1/4. This is in good correspon-dence with the experimental results from hyper intensity distance analysisdisplayed in Fig. 3.5, yielding a slope of 0.287 close to expected value.
3.3.4 Passive Tracking
Selective frames of passive guidewire tracking from echo-dephased SSFP areshown in Fig. 3.6 at various stages of the guidewire marker positions. Here,Fig. 3.6a shows the images obtained by applying the echo-dephased SSFP
49
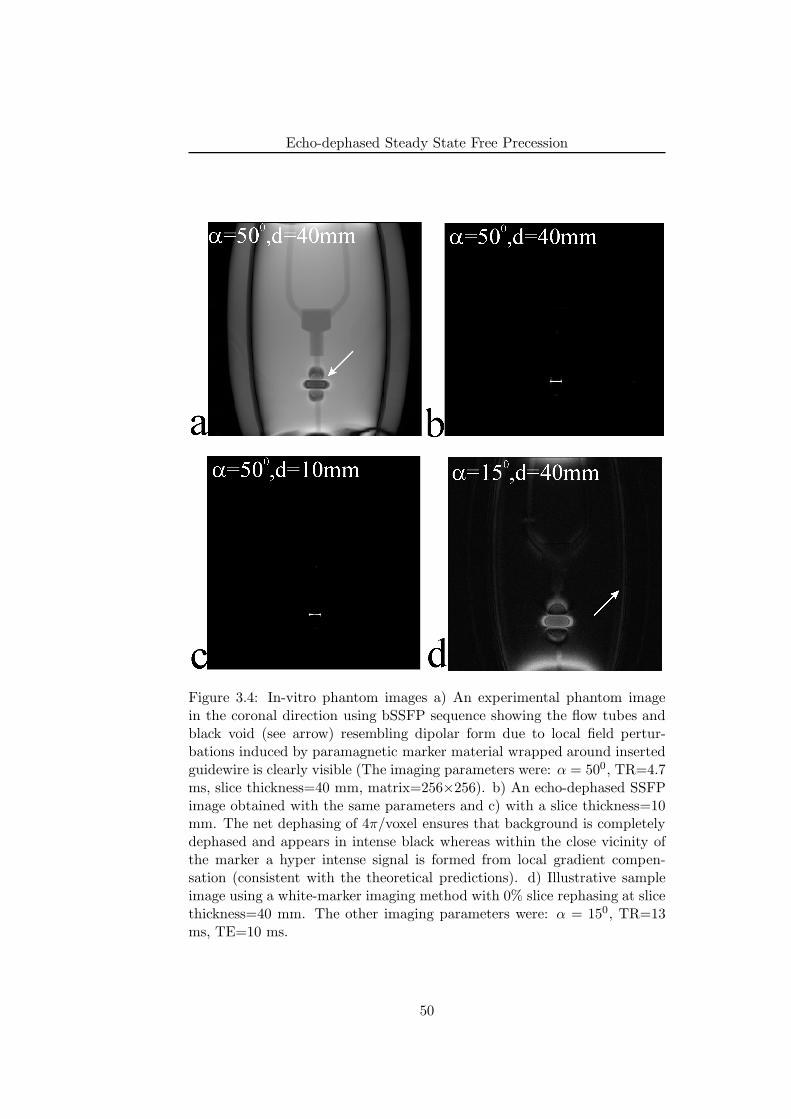
Echo-dephased Steady State Free Precession
Figure 3.4: In-vitro phantom images a) An experimental phantom imagein the coronal direction using bSSFP sequence showing the flow tubes andblack void (see arrow) resembling dipolar form due to local field pertur-bations induced by paramagnetic marker material wrapped around insertedguidewire is clearly visible (The imaging parameters were: α = 500, TR=4.7ms, slice thickness=40 mm, matrix=256×256). b) An echo-dephased SSFPimage obtained with the same parameters and c) with a slice thickness=10mm. The net dephasing of 4π/voxel ensures that background is completelydephased and appears in intense black whereas within the close vicinity ofthe marker a hyper intense signal is formed from local gradient compen-sation (consistent with the theoretical predictions). d) Illustrative sampleimage using a white-marker imaging method with 0% slice rephasing at slicethickness=40 mm. The other imaging parameters were: α = 150, TR=13ms, TE=10 ms.
50
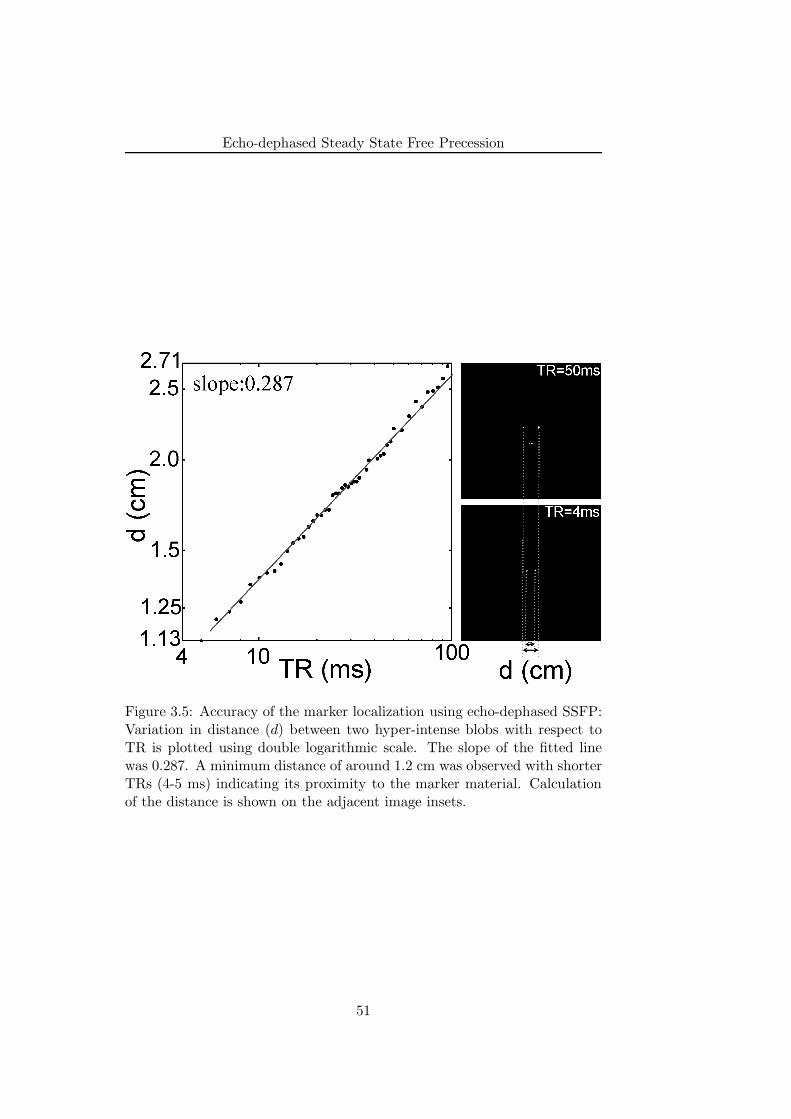
Echo-dephased Steady State Free Precession
Figure 3.5: Accuracy of the marker localization using echo-dephased SSFP:Variation in distance (d) between two hyper-intense blobs with respect toTR is plotted using double logarithmic scale. The slope of the fitted linewas 0.287. A minimum distance of around 1.2 cm was observed with shorterTRs (4-5 ms) indicating its proximity to the marker material. Calculationof the distance is shown on the adjacent image insets.
51
Echo-dephased Steady State Free Precession
only. It may be interesting to note that because of the ring-like structure ofthe marker material its visualization is independent of its orientation withrespect to main magnetic field (B0). This is clearly evident from the middlepanel of the Fig. 3.6a in which positive contrast generated by the markermaterial is clearly visible even though it is aligned at an acute angle withrespect to main magnetic field. The corresponding fusion of the previouslyacquired roadmap and the echo-dephased SSFP image are shown in Fig.3.6b. Here, the position of the marker was updated at about four framesper second. The temporal resolution could be increased up to eight framesper second by maintaining the FOV only over vessel region and reducing thein-plane resolution without significant degradation of the marker depiction.
3.3.5 Pancreatic Islet Cell Visualization
In the following, application of echo-dephased SSFP for positive contrastvisualization of the SPIO-labeled isolated pancreatic islets is explored in de-tail. Visualization of the human pancreatic islets in a phantom using bSSFPand echo-dephased SSFP protocols is demonstrated in Fig. 3.7. The upperpanel shows the selective consecutive frames (cropped) of a 3D dataset ob-tained using bSSFP protocol. The hypointense regions depicting localizationof the pancreatic islets (yellow arrows) is clearly visible. The lower panelshows the selective consecutive frames (cropped) of a 3D dataset obtainedusing echo-dephased SSFP protocol and essentially using the same parame-ters as that of bSSFP. Distributed hyperintensities (see yellow arrows) areclearly visible within the close vicinity of the islets. Also the plastic tubewhich appears as black circle in bSSFP images do not appear with posi-tive contrast indicating selective localization of the islets. However, edgesof the phantom also appear as hyperintensities (yellow arrow head) due tounwanted gradient compensation in that region.
Visualization of the rat pancreatic islets subcutaneously transplantedinto a chamber (in vivo) is demonstrated in Fig. 3.8. As in the phantom ex-periments the upper panel shows the selective consecutive frames (cropped)of a 3D dataset obtained using bSSFP protocol. Hypointense region depict-ing the localization of islets (see yellow arrow) in a rat chamber is visible.However, due to confounding larger hypointense region near the chamberand enhancement of other tissues visualization of islets is unclear. Thelower panel shows selective consecutive frames (cropped) of a 3D datasetobtained using echo-dephased SSFP protocol and essentially using the sameparameters as that of bSSFP. hyperintensite region (yellow arrow) is clearlyvisible within the close vicinity of the islets. A good suppression of thebackground is achieved that leads to excellent localization and tracking ofthe islets.
52
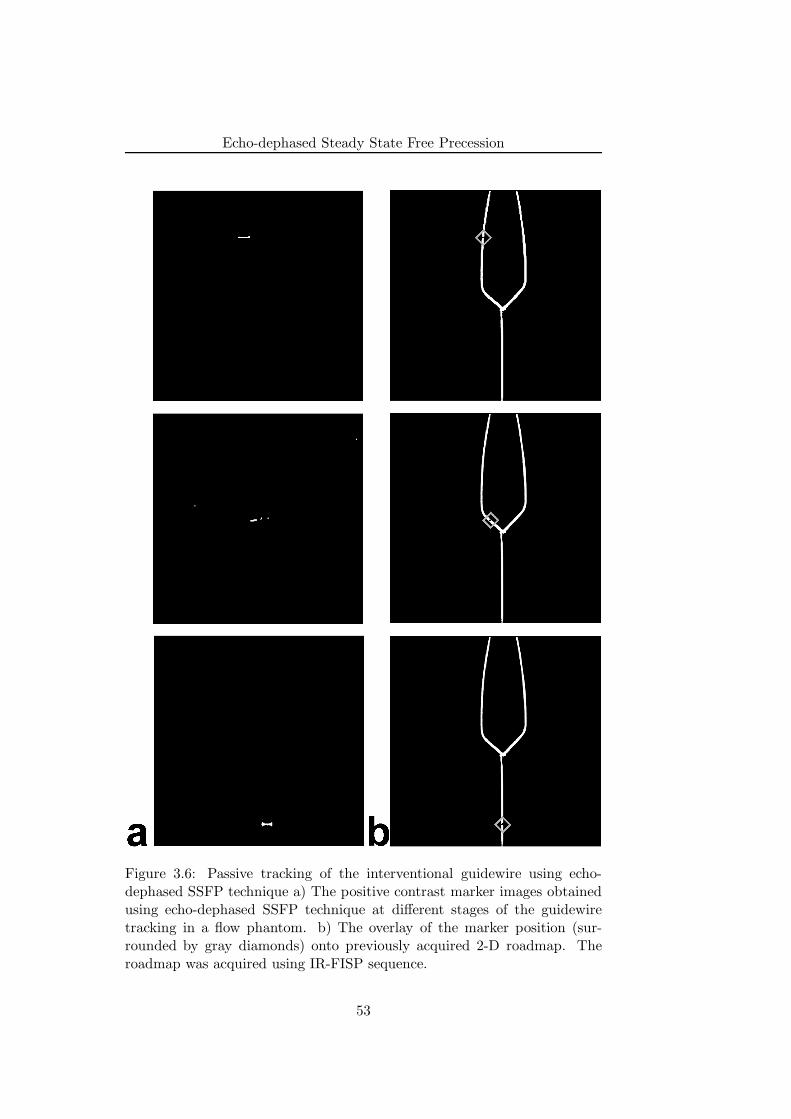
Echo-dephased Steady State Free Precession
Figure 3.6: Passive tracking of the interventional guidewire using echo-dephased SSFP technique a) The positive contrast marker images obtainedusing echo-dephased SSFP technique at different stages of the guidewiretracking in a flow phantom. b) The overlay of the marker position (sur-rounded by gray diamonds) onto previously acquired 2-D roadmap. Theroadmap was acquired using IR-FISP sequence.
53
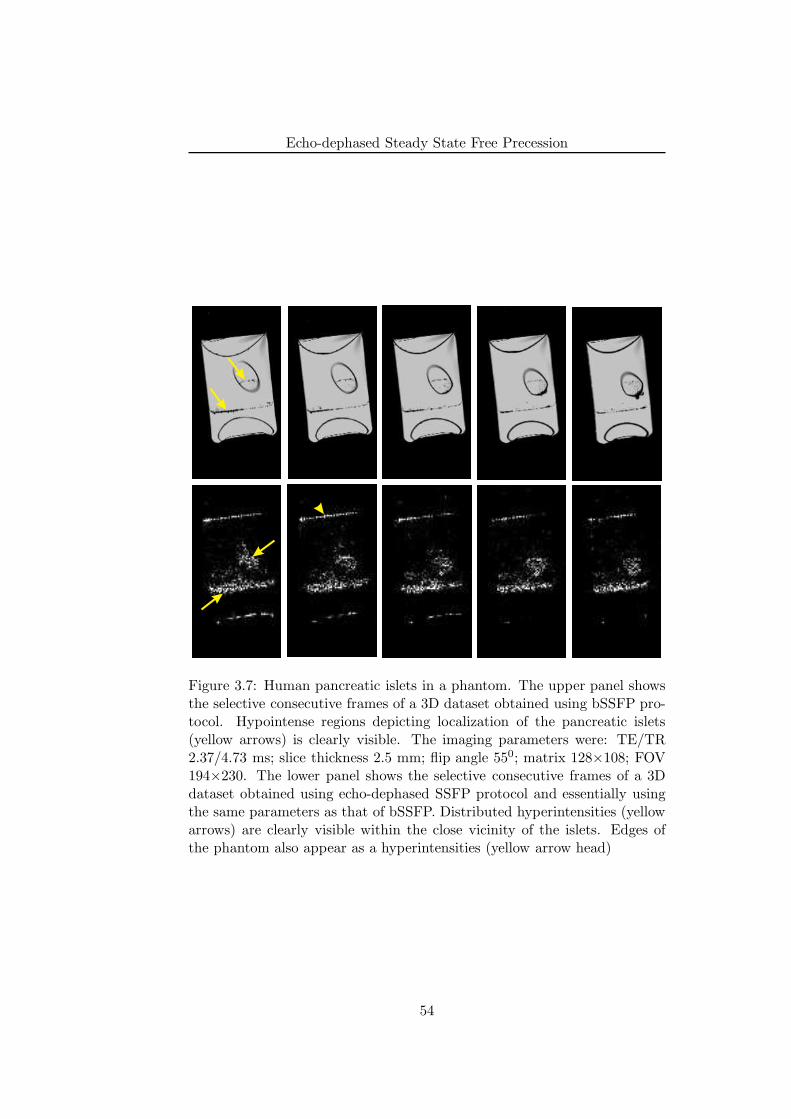
Echo-dephased Steady State Free Precession
Figure 3.7: Human pancreatic islets in a phantom. The upper panel showsthe selective consecutive frames of a 3D dataset obtained using bSSFP pro-tocol. Hypointense regions depicting localization of the pancreatic islets(yellow arrows) is clearly visible. The imaging parameters were: TE/TR2.37/4.73 ms; slice thickness 2.5 mm; flip angle 550; matrix 128×108; FOV194×230. The lower panel shows the selective consecutive frames of a 3Ddataset obtained using echo-dephased SSFP protocol and essentially usingthe same parameters as that of bSSFP. Distributed hyperintensities (yellowarrows) are clearly visible within the close vicinity of the islets. Edges ofthe phantom also appear as a hyperintensities (yellow arrow head)
54
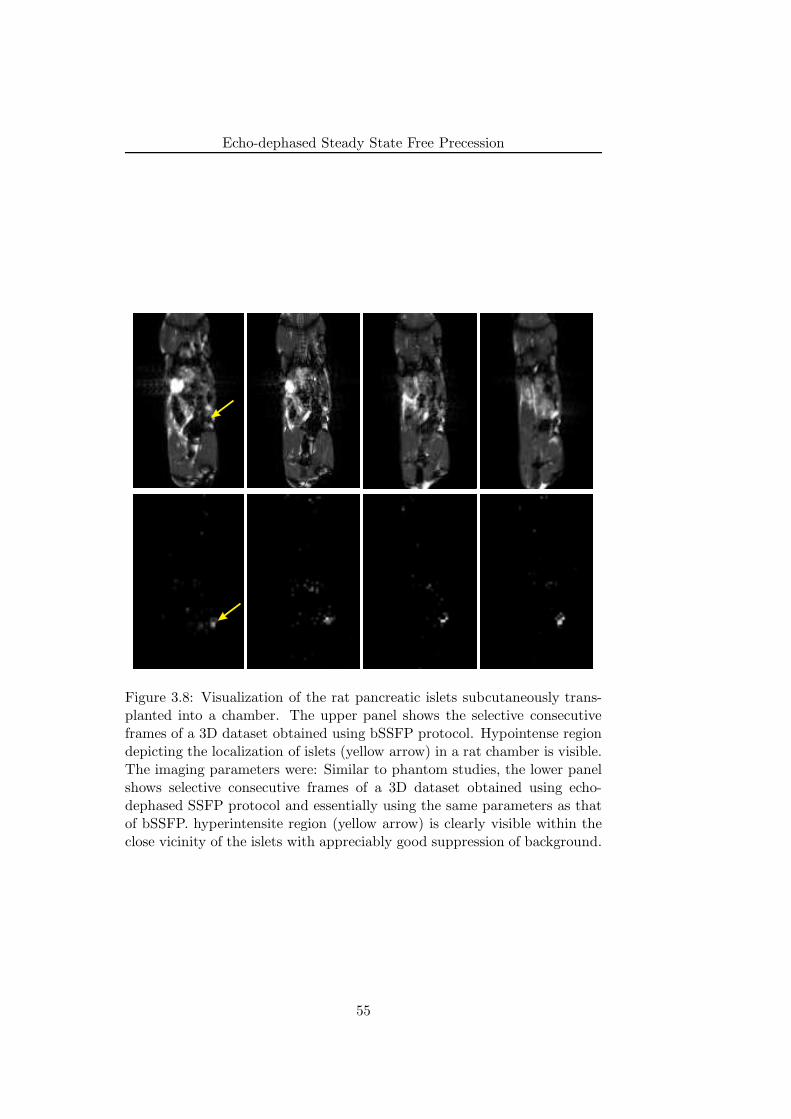
Echo-dephased Steady State Free Precession
Figure 3.8: Visualization of the rat pancreatic islets subcutaneously trans-planted into a chamber. The upper panel shows the selective consecutiveframes of a 3D dataset obtained using bSSFP protocol. Hypointense regiondepicting the localization of islets (yellow arrow) in a rat chamber is visible.The imaging parameters were: Similar to phantom studies, the lower panelshows selective consecutive frames of a 3D dataset obtained using echo-dephased SSFP protocol and essentially using the same parameters as thatof bSSFP. hyperintensite region (yellow arrow) is clearly visible within theclose vicinity of the islets with appreciably good suppression of background.
55
Echo-dephased Steady State Free Precession
3.4 Discussion
It was demonstrated that the dephasing by 4 π/voxel in the readout di-rection (from bottom to top in the images displayed; see Fig. 3.4) ensuresa completely dephased background and hyper intense signals appear onlyin the close vicinity of the paramagnetic marker material due to local fieldcompensation; being consistent with theoretical predictions (see Fig. 3.1band Fig. 3.3b). Using white marker imaging method at lower slice resolu-tions (slice thickness=40 mm) partial volume effects due to tissue interfaces(see arrow in Fig. 3.4d), inherent main magnetic field inhomogeneities atthe two extremes of the magnet appears with prominent positive contrast.This may hamper the accurate discrimination of the paramagnetic markermaterial from other unwanted background signal enhancements. Recentlyit has been shown that by applying equal and opposite dephasing gradientsand performing modulus subtraction of the resultant images partial volumeeffects can be eliminated [12]. However, this doubles the acquisition timeand in addition reduces the SNR of the resultant image.
Appropriate matching of the marker position and its localization in theimage is one of the major prerequisite of MR-guided interventions. In theecho-dephased SSFP sequence, compensation of the sequence-related de-phasing gradients by the local gradient fields induced due to paramagneticmarker always takes place outside of the marker. and the spatial accuracyof the positive contrast generated by echo-dephased SSFP has to be de-termined. Reconsidering Eq. 3.3, the phase evolution of spins (G(x)) isexpressed as (e.g., in the x-direction):
φG(x) = γ ·TR · (Gx ·x + ∆Gx · (x − x0))
= γ ·Gx ·TR ·(
x ·(
1 +∆Gx
Gx
)
− x0∆Gx
Gx
)
(3.8)
Noticing that kx = γ ·Gx ·TR, the position x will be encoded at position x′
in the reconstructed image [13] according to
x′ = x ·(
1 +∆Gx
Gx
)
− x0
(
∆Gx
Gx
)
(3.9)
Typically Gx ∼ 10 mT/m yielding γ ·Gx ·x = 420 Hz/mm, whereasfrequency offsets from paramagnetic markers are in the range of 500 Hz at 1cm distance for a given LMD at 1.5 T. As a result when Gx fully compensatefor ∆G at the iso-center, it leads to positional error of the marker in the rangeof 1 pixel. However, as one goes further away from the iso-center, spatialencoding falls in higher audio frequency range (i.e., when Gx >> Gx, see Eq.3.9) thereby making x ≈ x′. Thus in Echo-dephased SSFP for a completegradient compensation scheme (for example at position (1) in Fig. 3.1b),signal contribution comes from spatially encoded off-resonance frequencies.
56
Echo-dephased Steady State Free Precession
The hyper-intense blobs in images produced by echo-dephased SSFP arewithin the close vicinity of the marker; however, it should be recognized thatthese blobs always lie in the surrounding of the actual marker position. Thedistance between the exact location of the marker and any one of the hyper-intense blobs is same and the mid-point of the distance between two hyper-intense blobs should lie on the interventional device. Hence, the analysis ofdistance between two hyper-intense blobs as function of TR was performed(see Fig. 3.5). It can be inferred from this analysis is that in echo-dephasedSSFP the distance d can be minimized for a given LMD by keeping TR asshort as possible. A minimum distance of around 1.2 cm was observed atshorter TRs (4-5 ms) being consistent with theoretical predictions (see Fig.3.3) and indicating its good proximity (0.6 cm) to the marker material. Thefact that the proximity of the localization produced by echo-dephased SSFPto the physical position of the marker is directly proportional to TR for agiven LMD makes this technique suitable for MR-guided interventions. Thismay lead to further increase in temporal resolution, which is currently oneof the major obstacles of the utilization of passive tracking in practice. Alsothe positive signal contrast of the echo-dephased SSFP may benefit fromthe fact that the bSSFP sequences are less immune to main magnetic fieldinhomogeneities at low TRs.
In MR-guided interventions, passive tracking techniques utilizes eithersmall paramagnetic materials [14] or contrast agents [15] for visualization ofinterventional devices but reliable localization and visualization of markermaterials with respect to background is a major challenge. In this work,it was successfully demonstrated that the tracking of paramagnetic markermaterials based on echo-dephased SSFP is feasible and achieves accurateand reliable marker localization with excellent background suppression.
Thanks to excellent background suppression due to echo-dephased SSFPmethod, and in contrast to other passive tracking techniques, there was noneed to perform baseline subtraction [16] or additional post-processing [9].This allowed for fast calculation of marker positions and thus led to onlyinsignificant delays between the actual image acquisition and the correspond-ing update of the roadmap. Generally, any baseline subtraction method maysuffer from background signal enhancement in presence of motion, whereasadditional post-processing such as gradient signal maxima calculation as in(12) may be unsuitable for real time display of the images. Thus, presentapproach with its high contrast characteristics and better proximity to themarker material may be suitable for real time passive interventional MRI.
Another interesting application of Echo-dephased SSFP is to visualize,localize and track the SPIO-labeled cells and was demonstrated here forpancreatic islets visualization in in vitro as well as in vivo. Both phantomand rat studies clearly demonstrated that visualization of the SPIO-labeledislets with positive contrast is reliable and feasible. Although bSSFP is wellsuited for visualization of SPIO-labeled cells [17], it suffers from banding
57
Echo-dephased Steady State Free Precession
artifacts especially at high field strengths (≥3 T). The banding artifacts areclearly visible in both phantom (see Fig. 3.7) and rat (see Fig. 3.8) studies.On the contrary using Echo-dephased SSFP do not suffer from such artifactseven in vivo. Thus, Echo-dephased SSFP in combination with bSSFP maypotentially be employed as a valuable clinical tool to localize and track theSPIO-labeled islets.
The previously proposed methods; morphing SSFP [5] and susceptibilitygradient mapping (SGM) [18] also exploits the local gradient perturbationsinduced by the marker material in their immediate surrounding. In morph-ing SSFP, gradient perturbations compete with sequence-related dephasinggradients to induce a transition from SSFP-echo to balanced SSFP. In ad-dition, background suppression, and thus positive contrast, is achieved byusing the intrinsic high signal difference between bSSFP and SSFP-ECHO,especially for low flip angles in combination with long TR. In contrast inecho-dephased SSFP, echo-dephasing ensures excellent background suppres-sion even at large flip angles with short TR. Since echo-formation is anamalgamation of SSFP-FID, SSFP-ECHO and bSSFP (see Fig. 3.1b), itshows similar sensitivity as these three SSFP sequences to flip angle vari-ation as well as different types of off-resonances. The major advantage ofecho-dephased SSFP is its short TR, providing a positive contrast region inthe very close vicinity of the marker material with high temporal resolution.
The SGM method employs a localized short term Fourier transformmethod onto a gradient echo dataset for mapping local marker gradientsalong all three spatial directions (x, y and z) yielding a positive contrast im-age. SGM is thus based on the echo-shift in k-space, whereas echo-dephasedSSFP selectively acquires shifted echoes along the readout similar to 1DSGM. However, from interventional application point-of-view, some of thecurrent limitations of SGM method are: the positive contrast generationpartially relies on TE value [19], in-phase TE is needed to avoid water-fatboundary artifacts and being post-processing method makes it computation-ally cumbersome.
Similar to all passive positive contrast methods, other sources of large-scale susceptibility gradients such as lung-liver interfaces may appear withpositive contrast in echo-dephased SSFP as well (see Fig. 3.7). A specialcare must therefore be taken to avoid such “false positives”. For exam-ple, in current application marker position search space was confined withinthe vicinity of the vascular structure. It should also be noted that, since inthis method marker position is updated on the previously acquired roadmapsome of the disadvantages of the passive tracking remains when motion en-ters the game. However, the area of application for which these methods arebeing developed is the interventional peripheral MR angiography (ipMRA),where there is a low risk of or limited patient motion. Hence, the presentedmethod may find prominent application to perform these interventions.
58
Echo-dephased Steady State Free Precession
3.5 Conclusion
A novel concept for the generation of positive contrast from local susceptibili-ties, termed echo-dephased SSFP was proposed. In principle, echo-dephasedSSFP is an unbalanced SSFP type of sequence, in which echoes are dephasedprior to readout. We have demonstrated that this echo-dephasing approachensures excellent cancellation of any background signals. From local gra-dient compensation hyper-intense signals are formed and thus a positivecontrast emanates within the close vicinity of paramagnetic marker materi-als. Hyper-intense signals are mainly of bSSFP type, which ensures sufficientsignal intensity with respect to background. A reliable localization and ro-bust marker detection was demonstrated using the proposed method. Thepassive guidewire tracking experiments were performed in flow phantomssuggesting suitable applicability of the echo-dephased SSFP for MR-guidedinterventions such as ipMRA. Finally utilization of echo-dephased SSFP forpositive contrast visualization of SPIO-labeled islets was demonstrated bothin vitro and in vivo.
References
[1] J. Reichenbach, R. Venkatesan, D. Yablonskiy, M. Thompson, S. Lai,and E. Haacke, “Theory and application of static field inhomogene-ity effects in gradient-echo imaging,” J Magn Reson Imaging, vol. 7,p. 266–79, Apr. 1997.
[2] J. Frahm, K. Merboldt, and W. Hanicke, “Direct FLASH MR imagingof magnetic field inhomogeneities by gradient compensation,” MagnReson Med, vol. 6, p. 474–80, Apr. 1988.
[3] J. Seppenwoolde, M. Viergever, and C. Bakker, “Passive tracking ex-ploiting local signal conservation: the white marker phenomenon,”Magn Reson Med, vol. 50, p. 784–90, Oct. 2003.
[4] V. Mani, K. Briley-Saebo, V. Itskovich, D. Samber, and Z. Fayad,“Gradient echo acquisition for superparamagnetic particles with pos-itive contrast (GRASP): sequence characterization in membrane andglass superparamagnetic iron oxide phantoms at 1.5T and 3T,” MagnReson Med, vol. 55, no. 1, p. 126–35, 2006.
[5] O. Bieri, S. Patil, H. Quick, and K. Scheffler, “Morphing steady-statefree precession,” Magn Reson Med, vol. 58, p. 1242–8, Dec. 2007.
[6] D. A. Yablonskiy and E. M. Haacke, “Theory of NMR signal behaviorin magnetically inhomogeneous tissues: the static dephasing regime,”Magnetic Resonance in Medicine: Official Journal of the Society of
59
Echo-dephased Steady State Free Precession
Magnetic Resonance in Medicine / Society of Magnetic Resonance inMedicine, vol. 32, p. 749–763, Dec. 1994. PMID: 7869897.
[7] K. Scheffler, “A pictorial description of steady-states in rapid magneticresonance imaging,” Concepts in Magnetic Resonance, vol. 11, no. 5,p. 291–304, 1999.
[8] M. Gyngell, “The application of steady-state free precession in rapid2DFT NMR imaging: FAST and CE-FAST sequences,” Magn ResonImaging, vol. 6, p. 415–9, Aug. 1988.
[9] R. Mekle, E. Hofmann, K. Scheffler, and D. Bilecen, “A polymer-basedMR-compatible guidewire: a study to explore new prospects for in-terventional peripheral magnetic resonance angiography (ipMRA),” JMagn Reson Imaging, vol. 23, p. 145–55, Feb. 2006.
[10] D. Jirak, J. Krız, V. Herynek, B. Andersson, P. Girman, M. Burian,F. Saudek, and M. Hajek, “MRI of transplanted pancreatic islets,”Magnetic Resonance in Medicine: Official Journal of the Society ofMagnetic Resonance in Medicine / Society of Magnetic Resonance inMedicine, vol. 52, pp. 1228–1233, Dec. 2004. PMID: 15562474.
[11] K. Scheffler and J. Hennig, “Is TrueFISP a gradient-echo or a spin-echosequence?,” Magn Reson Med, vol. 49, p. 395–7, Feb. 2003.
[12] J. Seppenwoolde, K. Vincken, and C. Bakker, “White-marker imaging-Separating magnetic susceptibility effects from partial volume effects,”Magn Reson Med, July 2007.
[13] B. H. EM, Magnetic resonance imaging: physical principles and se-quence design. New York: Wiley, 1999.
[14] D. Rubin, A. Ratner, and S. Young, “Magnetic susceptibility effects andtheir application in the development of new ferromagnetic catheters formagnetic resonance imaging,” Invest Radiol, vol. 25, p. 1325–32, Dec.1990.
[15] O. Unal, F. Korosec, R. Frayne, C. Strother, and C. Mistretta, “Arapid 2D time-resolved variable-rate k-space sampling MR techniquefor passive catheter tracking during endovascular procedures,” MagnReson Med, vol. 40, p. 356–62, Sept. 1998.
[16] J. Seppenwoolde, L. Bartels, R. van der Weide, J. Nijsen, A. van hetSchip, and C. Bakker, “Fully MR-guided hepatic artery catheterizationfor selective drug delivery: a feasibility study in pigs,” J Magn ResonImaging, vol. 23, p. 123–9, Feb. 2006.
60
Echo-dephased Steady State Free Precession
[17] C. Heyn, C. V. Bowen, B. K. Rutt, and P. J. Foster, “Detection thresh-old of single SPIO-labeled cells with FIESTA,” Magnetic Resonancein Medicine: Official Journal of the Society of Magnetic Resonancein Medicine / Society of Magnetic Resonance in Medicine, vol. 53,pp. 312–320, Feb. 2005. PMID: 15678551.
[18] H. Dahnke, W. Liu, D. Herzka, J. Frank, and T. Schaeffter, “Suscepti-bility gradient mapping (SGM): a new postprocessing method for pos-itive contrast generation applied to superparamagnetic iron oxide par-ticle (SPIO)-labeled cells,” Magn Reson Med, vol. 60, p. 595–603, Sept.2008.
[19] E. Vonken, M. Schar, and M. Stuber, “Positive contrast visualizationof nitinol devices using susceptibility gradient mapping,” Magn ResonMed, vol. 60, p. 588–94, Sept. 2008.
61

Echo-dephased Steady State Free Precession
62
Chapter 4
Projection-ReconstructionImaging withEcho-Dephasing
This chapter is based upon:
S. Patil, O.Bieri, P. Jhooti, K. Scheffler, “An Automatic Slice Positioning for PassiveReal-Time Tracking of Interventional Devices Using Projection Reconstruction Imagingwith Echo-Dephasing (PRIDE)”, Magn. Reson. in Med., In Press, 2009.
63
Projection-Reconstruction Imaging with Echo-Dephasing
4.1 Introduction
Although X-ray is considered as the de-facto standard for endovascular inter-ventions, there is a growing interest in MR-guided interventions because ofits excellent soft-tissue contrast, lack of ionizing radiation and multi-planarimaging capability. In clinical practice, however, one of MRI’s drawbacks isthe difficulty in localization and high-contrast visualization of interventionaldevices (for e.g., guidewires and catheters). In addition, fast localization andautomatic adjustment of scan plane position is highly desirable. As a result,considerable efforts are being undertaken towards achieving these objectives.
Current methodologies for MR-guided interventions can be broadly clas-sified into active, semi-active and passive tracking. Active tracking utilizeslocally sensitive transmit/receive coils for either localization [1] or visual-ization [2] or is based on the visualization of currentrelated local field inho-mogeneities produced in a small loop [3]. Localization of the coil is achievedin few milliseconds through acquisition of one dimensional (1D) projectionsalong all three spatial directions (X, Y and Z). The positional informationis then used to actively align the position of the imaging slice. In addition,velocity of the device has been used to automatically adjust the imagingparameters [4]. However, potential radiofrequency (RF) heating issues dueto standing waves along the conducting cables still represent one of the ma-jor and most prominent potential safety hazards with active tracking [5].The standing waves lead to storage of electrical energy, which may be trans-mitted into the human body. With nitinol guidewires temperatures of upto 740C has been reported [5]. Some approaches have been suggested toreduce the heating risks, see for example Ref. [6], but widespread use ofactive tracking in humans is still limited due to design challenges.
Semi-active devices utilize self-resonant RF circuits and have no directelectrical connection to the scanner. Such devices incorporate miniature RFcoils tuned to Larmor frequency of the scanner and encapsulates a smallcontainer filled with a solution having short T1 [7, 8]. As a result, using afast imaging sequence with low flip angles generates a positive contrast forthe sample within the coil due to local gain of the B1 field [9], in combinationwith the relatively low signal from the background. However, semi-activedevices still require a mechanical connection (for e.g. laser fiber) betweenthe instrument and the scanner which greatly hampers the handling of suchinterventional devices.
Contrary to active tracking, passive techniques do not suffer from RFheating problems since either small paramagnetic materials (causing mag-netic susceptibility variations [10]) or contrast agents (such as 4-6 vol %Gd-DTPA to increase the MR signal [11]) are used for visualization of in-terventional devices. Moreover, unlike semi-active devices passive devicesdo not require any mechanical scanner connection. Reliable localizationand visualization of marker materials has recently been proposed using a
64
Projection-Reconstruction Imaging with Echo-Dephasing
steady state free precession (SSFP) positive contrast technique [12]. How-ever, image-based passive tracking is slow and hence does not provide fastcoordinate updates as required for automatic slice positioning (ASP) mech-anism.
The passive tracking of interventional devices, such as guidewires orcatheters, during endovascular interventions using ferromagnetic materialswas first introduced by Rubin et al [10] based on signal voids caused by localsusceptibility variations [13, 14]. Using a positive contrast technique knownas white marker technique [15], the conspicuity of the paramagnetic markerscontaining dysprosium oxide can be further improved. In another approach,a positive contrast was generated for an MR-compatible guidewire contain-ing an iron particle wrapped around it from local off-resonances using lowflip angle excitations in balanced SSFP (bSSFP) [16]. Although positivecontrast enhances the conspicuity of the marker as compared to the back-ground, it results in a loss of anatomical structure. Thus, passive trackingor localization of the guidewire can be achieved using a baseline subtractionmethod [17] or a positive contrast image [16] overlaid on either anatomi-cal reference images or a vascular roadmap (i.e., an angiogram). However,relatively long image acquisition times, leads to an undesired increased sen-sitivity to motion and/or flow with such overlay techniques. In addition,extended slice thickness (40-50 mm) is required in order to guarantee thatthe device always lie within the plane being imaged. In spite of these dis-advantages, passive tracking utilizing balloon catheters filled with CO2 hassuccessfully been demonstrated in patients who had undergone diagnosticcardiac catheterization [18, 19].
In order to further enhance the applicability of passive tracking tech-niques, the above-mentioned disadvantages need to be overcome and a real-time slice position update to the detected device location must be achievedin a comparable time to that of active tracking. In this work, a novelprojection-based passive tracking technique is proposed, termed ProjectionReconstruction Imaging with Echo-DEphasing (PRIDE). PRIDE is based onan acquisition of projections using dephasing gradients along all three spatial(X, Y and Z) dimensions. Using PRIDE, 3D position of the interventionaldevice tip containing paramagnetic marker is localized, which in turn is usedto automatically adjust the scan plane of the imaging slice. We first describethe concept of local gradient field compensation used in PRIDE, followedby in-vitro experiments demonstrating the feasibility of appropriate markerdetection in the presence of off-resonance related degradations caused byunwanted inhomogeneities (air/tissue interfaces etc). Then we describe theASP mechanism incorporating PRIDE as a tracking sequence to provide po-sitional information of the paramagnetic marker to bSSFP sequence servingas an imaging sequence. The demonstration and discussion of ASP mecha-nism on the clinical scanner is done by means of phantom results. Finally,in vivo experiments in a swine model are presented that corroborate the
65

Projection-Reconstruction Imaging with Echo-Dephasing
in-vitro results for robust and reliable detection of marker using PRIDE.
4.2 Materials and Methods
Phantom measurements, in vivo measurements and calibrations were per-formed on a Siemens 1.5 T Espree system (Siemens Healthcare, Erlangen,Germany) employing maximum gradient strength of 33 mT/m and a slewrate of 170 mT/(m×ms). Imaging was done using integrated spine coils andbody phased array coils. Numerical simulations, data analysis and visual-ization were done using Matlab 2006a (The MathWorks, Inc.).
4.2.1 Local Gradient Fields
A small point-like paramagnetic marker material wrapped around a guidewire (for example, as shown in Fig. 4.1a) induces a field perturbation (in SIunits)
∆Bz(x, y, z) =B0∆χV
4π∗ x2 + y2 − 2z2
(x2 + y2 + z2)5/2(4.1)
of dipolar form in the main magnetic field B0. Here, V is the volume ofthe paramagnetic material, ∆χ is the susceptibility difference between themarker material and the surrounding tissues and ∆χV (m3) characterizesthe local magnetic dose (LMD) [15]. The Local gradient fields (∆G) can bederived from partial derivatives of the field perturbation (∆Bz, see Eq. 4.1)as,
∆Gx,y,z = δx,y,z(∆Bz) (4.2)
Simulated ∆G values are shown in Fig. 4.1b (δz(∆Bz)) and Fig. 4.1c(δx,y(∆Bz)). These local gradients may have additive or compensating inter-ference with applied imaging gradients. In PRIDE, we exploit the compen-sating effect between local gradients and applied imaging gradients. In thefollowing, we elucidate the idea of compensating echo-dephasing gradientsin PRIDE.
4.2.2 Projection Reconstruction Imaging withEcho-Dephasing (PRIDE)
The sequence diagram of the PRIDE sequence is shown in Fig. 4.2a. Read-out gradients (GR) are placed along all three physical axes (X, Y and Z).Echo-dephasing (preferably 4π) is achieved by switching on a mono-polargradient wave-form for readout (essentially, there is no pre-phasing or re-focusing of the readout gradient). Therefore, in principle, no transversalstates can contribute to the echo similar to echo-dephased SSFP [20] andbackground signals are heavily suppressed. In the presence of marker-related
66
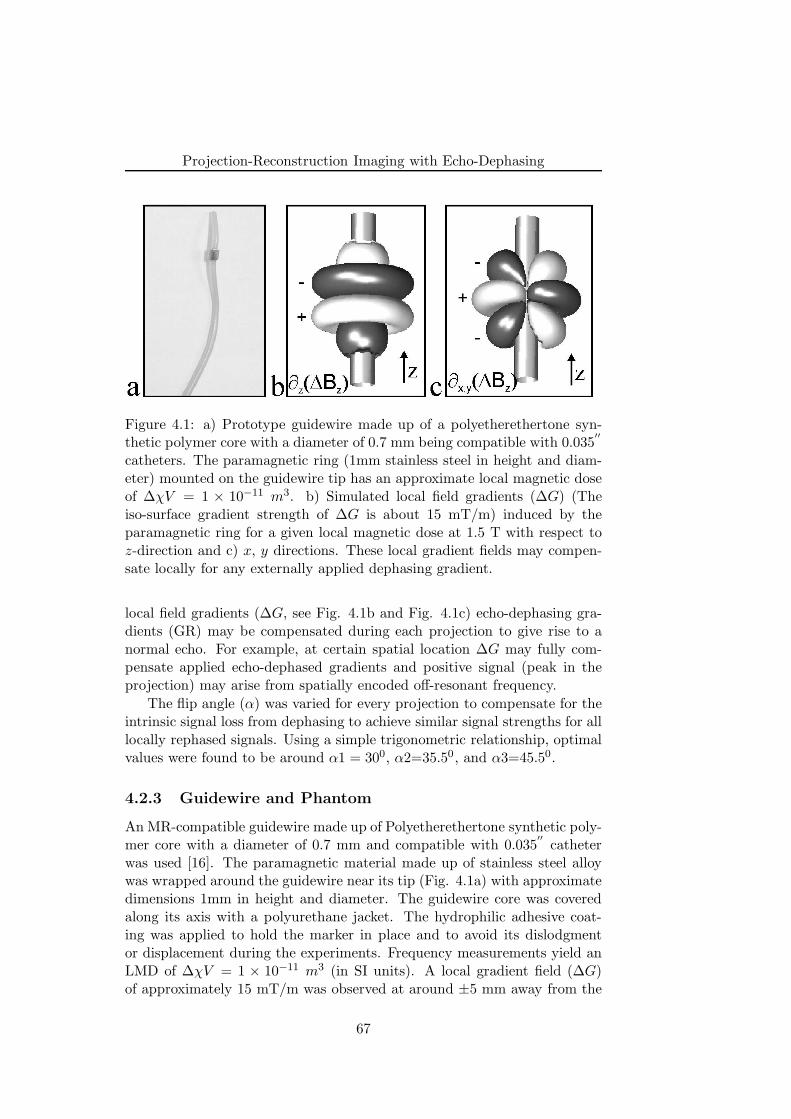
Projection-Reconstruction Imaging with Echo-Dephasing
Figure 4.1: a) Prototype guidewire made up of a polyetherethertone syn-thetic polymer core with a diameter of 0.7 mm being compatible with 0.035
′′
catheters. The paramagnetic ring (1mm stainless steel in height and diam-eter) mounted on the guidewire tip has an approximate local magnetic doseof ∆χV = 1 × 10⁻¹¹ m3. b) Simulated local field gradients (∆G) (Theiso-surface gradient strength of ∆G is about 15 mT/m) induced by theparamagnetic ring for a given local magnetic dose at 1.5 T with respect toz-direction and c) x, y directions. These local gradient fields may compen-sate locally for any externally applied dephasing gradient.
local field gradients (∆G, see Fig. 4.1b and Fig. 4.1c) echo-dephasing gra-dients (GR) may be compensated during each projection to give rise to anormal echo. For example, at certain spatial location ∆G may fully com-pensate applied echo-dephased gradients and positive signal (peak in theprojection) may arise from spatially encoded off-resonant frequency.
The flip angle (α) was varied for every projection to compensate for theintrinsic signal loss from dephasing to achieve similar signal strengths for alllocally rephased signals. Using a simple trigonometric relationship, optimalvalues were found to be around α1 = 300, α2=35.50, and α3=45.50.
4.2.3 Guidewire and Phantom
An MR-compatible guidewire made up of Polyetherethertone synthetic poly-mer core with a diameter of 0.7 mm and compatible with 0.035
′′
catheterwas used [16]. The paramagnetic material made up of stainless steel alloywas wrapped around the guidewire near its tip (Fig. 4.1a) with approximatedimensions 1mm in height and diameter. The guidewire core was coveredalong its axis with a polyurethane jacket. The hydrophilic adhesive coat-ing was applied to hold the marker in place and to avoid its dislodgmentor displacement during the experiments. Frequency measurements yield anLMD of ∆χV = 1 × 10⁻¹¹ m3 (in SI units). A local gradient field (∆G)of approximately 15 mT/m was observed at around ±5 mm away from the
67
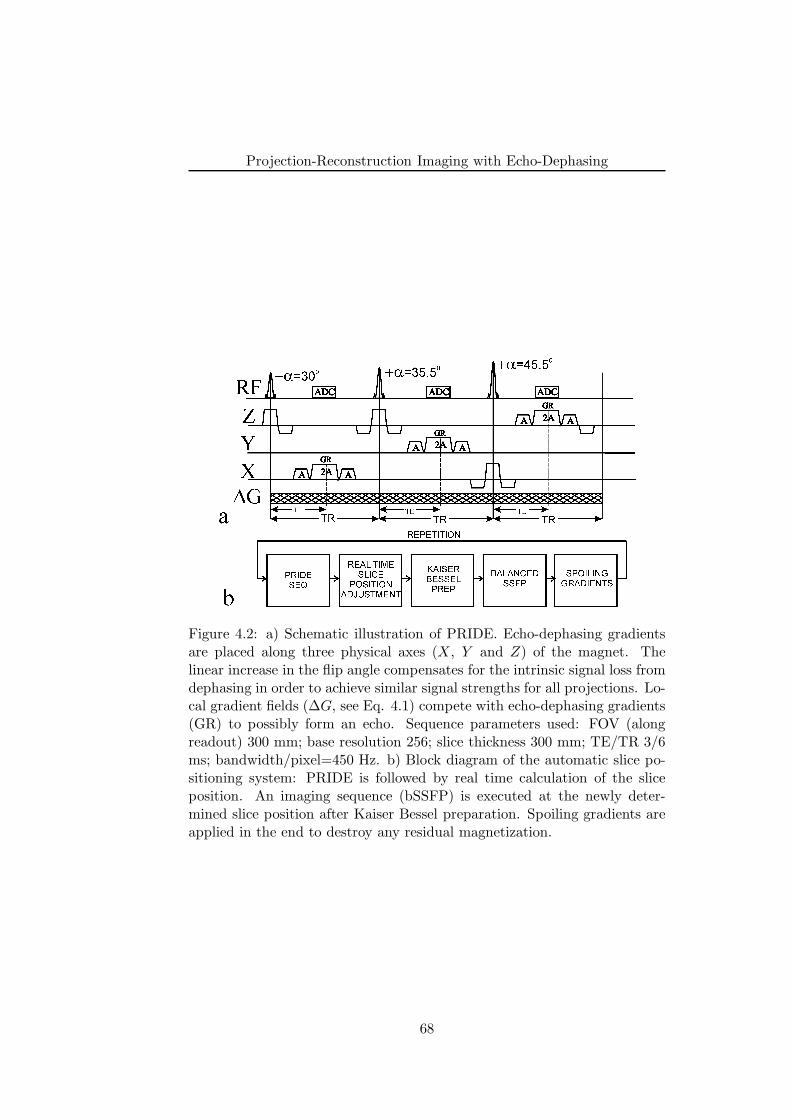
Projection-Reconstruction Imaging with Echo-Dephasing
Figure 4.2: a) Schematic illustration of PRIDE. Echo-dephasing gradientsare placed along three physical axes (X, Y and Z) of the magnet. Thelinear increase in the flip angle compensates for the intrinsic signal loss fromdephasing in order to achieve similar signal strengths for all projections. Lo-cal gradient fields (∆G, see Eq. 4.1) compete with echo-dephasing gradients(GR) to possibly form an echo. Sequence parameters used: FOV (alongreadout) 300 mm; base resolution 256; slice thickness 300 mm; TE/TR 3/6ms; bandwidth/pixel=450 Hz. b) Block diagram of the automatic slice po-sitioning system: PRIDE is followed by real time calculation of the sliceposition. An imaging sequence (bSSFP) is executed at the newly deter-mined slice position after Kaiser Bessel preparation. Spoiling gradients areapplied in the end to destroy any residual magnetization.
68
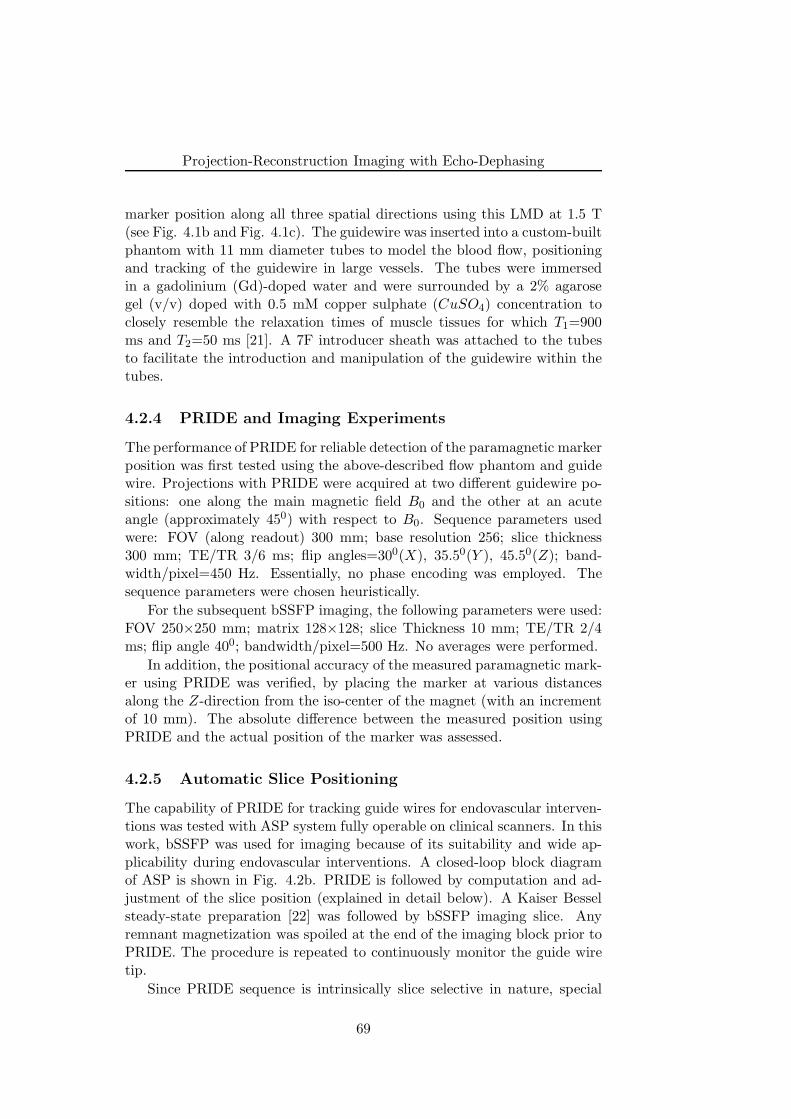
Projection-Reconstruction Imaging with Echo-Dephasing
marker position along all three spatial directions using this LMD at 1.5 T(see Fig. 4.1b and Fig. 4.1c). The guidewire was inserted into a custom-builtphantom with 11 mm diameter tubes to model the blood flow, positioningand tracking of the guidewire in large vessels. The tubes were immersedin a gadolinium (Gd)-doped water and were surrounded by a 2% agarosegel (v/v) doped with 0.5 mM copper sulphate (CuSO4) concentration toclosely resemble the relaxation times of muscle tissues for which T1=900ms and T2=50 ms [21]. A 7F introducer sheath was attached to the tubesto facilitate the introduction and manipulation of the guidewire within thetubes.
4.2.4 PRIDE and Imaging Experiments
The performance of PRIDE for reliable detection of the paramagnetic markerposition was first tested using the above-described flow phantom and guidewire. Projections with PRIDE were acquired at two different guidewire po-sitions: one along the main magnetic field B0 and the other at an acuteangle (approximately 450) with respect to B0. Sequence parameters usedwere: FOV (along readout) 300 mm; base resolution 256; slice thickness300 mm; TE/TR 3/6 ms; flip angles=300(X), 35.50(Y ), 45.50(Z); band-width/pixel=450 Hz. Essentially, no phase encoding was employed. Thesequence parameters were chosen heuristically.
For the subsequent bSSFP imaging, the following parameters were used:FOV 250×250 mm; matrix 128×128; slice Thickness 10 mm; TE/TR 2/4ms; flip angle 400; bandwidth/pixel=500 Hz. No averages were performed.
In addition, the positional accuracy of the measured paramagnetic mark-er using PRIDE was verified, by placing the marker at various distancesalong the Z-direction from the iso-center of the magnet (with an incrementof 10 mm). The absolute difference between the measured position usingPRIDE and the actual position of the marker was assessed.
4.2.5 Automatic Slice Positioning
The capability of PRIDE for tracking guide wires for endovascular interven-tions was tested with ASP system fully operable on clinical scanners. In thiswork, bSSFP was used for imaging because of its suitability and wide ap-plicability during endovascular interventions. A closed-loop block diagramof ASP is shown in Fig. 4.2b. PRIDE is followed by computation and ad-justment of the slice position (explained in detail below). A Kaiser Besselsteady-state preparation [22] was followed by bSSFP imaging slice. Anyremnant magnetization was spoiled at the end of the imaging block prior toPRIDE. The procedure is repeated to continuously monitor the guide wiretip.
Since PRIDE sequence is intrinsically slice selective in nature, special
69
Projection-Reconstruction Imaging with Echo-Dephasing
Figure 4.3: Automatic slice positioning using PRIDE includes a separategraphical slice positioning for marker detection (seen as white rectangularboxes). PRIDE related parameters can be interactively adjusted in a specialdialogue card. The slice of the bSSFP sequence whose position needs to beadjusted is shown as dotted rectangular boxes.
graphical slice positioning (GSP) window was incorporated along with stan-dard GSP used for bSSFP imaging slice. A special dialog card providesaccess to PRIDE related parameters (for example, TE, TR, FOV, resolu-tion etc) independent of the imaging sequence. Fig. 4.3 shows a screenshotof the GSP system on the clinical scanner used. The rectangular white col-ored boxes show the GSP corresponding to PRIDE sequence, whereas dot-ted rectangular boxes show the normal imaging bSSFP sequence. PRIDEacquires three orthogonal projections to detect the paramagnetic markerposition within the rectangular white colored boxes and the system adjuststhe position of the slice shown as dotted rectangular boxes corresponding tomarker position. The FOV and slice thickness for PRIDE was reduced from300 to 200 mm.
4.2.6 Slice Position Calculation
A standard image reconstruction system (64-bit Linux system) running soft-ware framework, known as ICE (Image Calculation Environment, SIEMENS,Erlangen) in C++ was used to perform the slice position calculation. PRIDEacquires three orthogonal projections along all three spatial axes and projec-tion data is sent to ICE. Upon reception of the projection data from PRIDE,calculation of 1D magnitude Fourier transforms was followed. Next, the ab-solute position of the maximum value of the 1D vector was stored. Byknowing that the center of 1D vector corresponds to the imaging position ofPRIDE, the absolute positions of the three maxima were converted into spa-tial shifts along three directions. These spatial shifts form 3D co-ordinates(imaging position) corresponding to marker position. Fast real-time feed-
70
Projection-Reconstruction Imaging with Echo-Dephasing
back link facility (manufacturer provided) utilizing digital signal processorswas used to send the calculated co-ordinates to the MPCU (Measurementand Physiological Unit), running pulse sequence. The acquisition of bSSFPimaging slice at this newly computed imaging position by MPCU and up-dating of the GSP is done automatically without any user intervention.
4.2.7 In Vivo Measurements
In vivo experiments were performed on a fully-anesthetized domestic pigweighing 35 kg. The experiments were conducted in accordance with allregulations set forth by their institutional and governmental agencies. Theanimal was placed head first in a supine position inside the scanner. A totalof six elements of a phased-array spine RF coil were activated to providesignal of the posterior anatomy of the pig. A second six-element phasedarray RF body surface coil was placed anterior to the pig. The animal washeparinized with 5000 IU 2 h prior to the intervention and was subsequentlyanesthetized.
A 7 F introducer sheath was inserted into the right iliac artery via arterialcut down and the guidewire was inserted through the introduced sheathand guided through the vasculature utilizing cartesian and radial bSSFPsequences. PRIDE parameters were similar to phantom experiment exceptFOV (along readout) was reduced to 200 mm and constant flip angle of 500
was used.
4.3 Results
In this section, we first describe and elaborate upon the performance ofPRIDE during the experiments conducted using flow phantom and guidewireas described in ‘Materials and Methods’ section. Since the localization ofthe guidewire tip play an important role during MR-guided interventions,the positional accuracy of the paramagnetic marker using PRIDE is de-scribed next. This is followed by flow phantom results of the ASP mech-anism with PRIDE as the tracking sequence and bSSFP as the imagingsequence. Demonstration of the results of PRIDE in a swine model con-cludes the section.
4.3.1 In-Vitro Measurements
The experimental setup is shown in Fig. 4.4a. Two bSSFP images, one incoronal and the other in sagittal direction depict the experimental setup ofthe phantom as well as typical image artifacts from local susceptibilities dueto the paramagnetic marker material mounted on the guidewire tip withinthe flow tubes. The conventional magnet axes directions (X, Y and Z) areshown on the image planes for better clearness. PRIDE projections along all
71
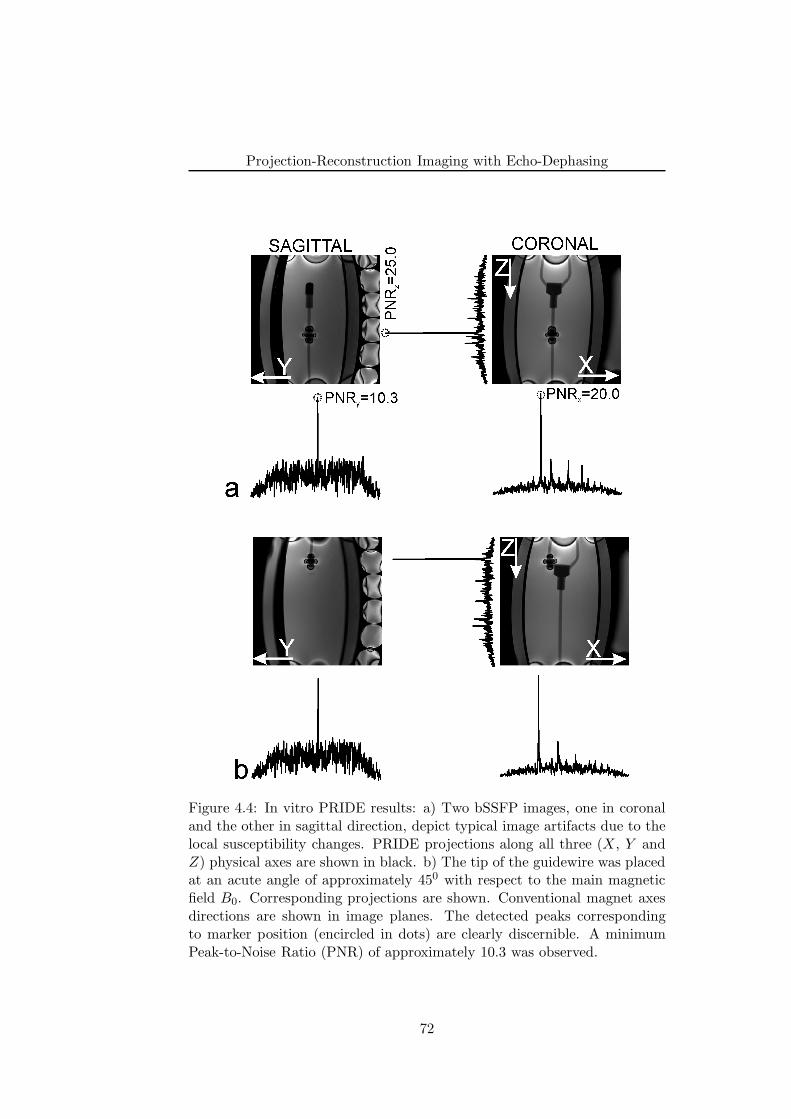
Projection-Reconstruction Imaging with Echo-Dephasing
Figure 4.4: In vitro PRIDE results: a) Two bSSFP images, one in coronaland the other in sagittal direction, depict typical image artifacts due to thelocal susceptibility changes. PRIDE projections along all three (X, Y andZ) physical axes are shown in black. b) The tip of the guidewire was placedat an acute angle of approximately 450 with respect to the main magneticfield B0. Corresponding projections are shown. Conventional magnet axesdirections are shown in image planes. The detected peaks correspondingto marker position (encircled in dots) are clearly discernible. A minimumPeak-to-Noise Ratio (PNR) of approximately 10.3 was observed.
72
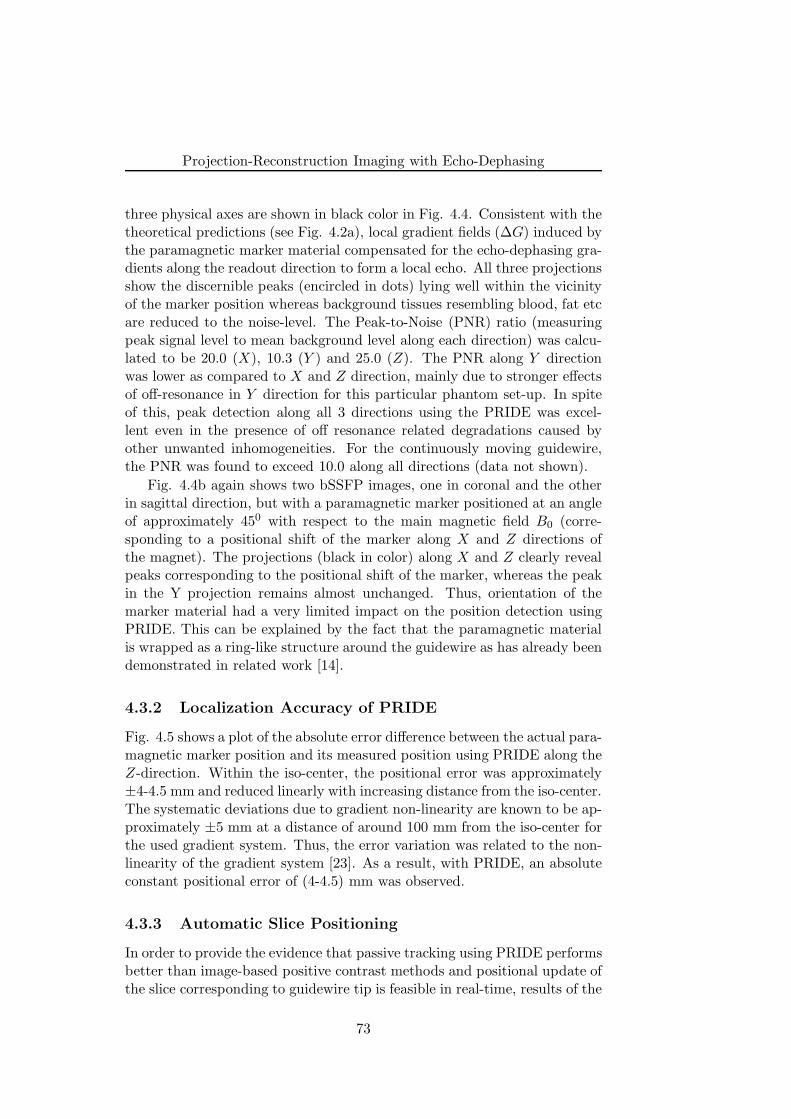
Projection-Reconstruction Imaging with Echo-Dephasing
three physical axes are shown in black color in Fig. 4.4. Consistent with thetheoretical predictions (see Fig. 4.2a), local gradient fields (∆G) induced bythe paramagnetic marker material compensated for the echo-dephasing gra-dients along the readout direction to form a local echo. All three projectionsshow the discernible peaks (encircled in dots) lying well within the vicinityof the marker position whereas background tissues resembling blood, fat etcare reduced to the noise-level. The Peak-to-Noise (PNR) ratio (measuringpeak signal level to mean background level along each direction) was calcu-lated to be 20.0 (X), 10.3 (Y ) and 25.0 (Z). The PNR along Y directionwas lower as compared to X and Z direction, mainly due to stronger effectsof off-resonance in Y direction for this particular phantom set-up. In spiteof this, peak detection along all 3 directions using the PRIDE was excel-lent even in the presence of off resonance related degradations caused byother unwanted inhomogeneities. For the continuously moving guidewire,the PNR was found to exceed 10.0 along all directions (data not shown).
Fig. 4.4b again shows two bSSFP images, one in coronal and the otherin sagittal direction, but with a paramagnetic marker positioned at an angleof approximately 450 with respect to the main magnetic field B0 (corre-sponding to a positional shift of the marker along X and Z directions ofthe magnet). The projections (black in color) along X and Z clearly revealpeaks corresponding to the positional shift of the marker, whereas the peakin the Y projection remains almost unchanged. Thus, orientation of themarker material had a very limited impact on the position detection usingPRIDE. This can be explained by the fact that the paramagnetic materialis wrapped as a ring-like structure around the guidewire as has already beendemonstrated in related work [14].
4.3.2 Localization Accuracy of PRIDE
Fig. 4.5 shows a plot of the absolute error difference between the actual para-magnetic marker position and its measured position using PRIDE along theZ-direction. Within the iso-center, the positional error was approximately±4-4.5 mm and reduced linearly with increasing distance from the iso-center.The systematic deviations due to gradient non-linearity are known to be ap-proximately ±5 mm at a distance of around 100 mm from the iso-center forthe used gradient system. Thus, the error variation was related to the non-linearity of the gradient system [23]. As a result, with PRIDE, an absoluteconstant positional error of (4-4.5) mm was observed.
4.3.3 Automatic Slice Positioning
In order to provide the evidence that passive tracking using PRIDE performsbetter than image-based positive contrast methods and positional update ofthe slice corresponding to guidewire tip is feasible in real-time, results of the
73
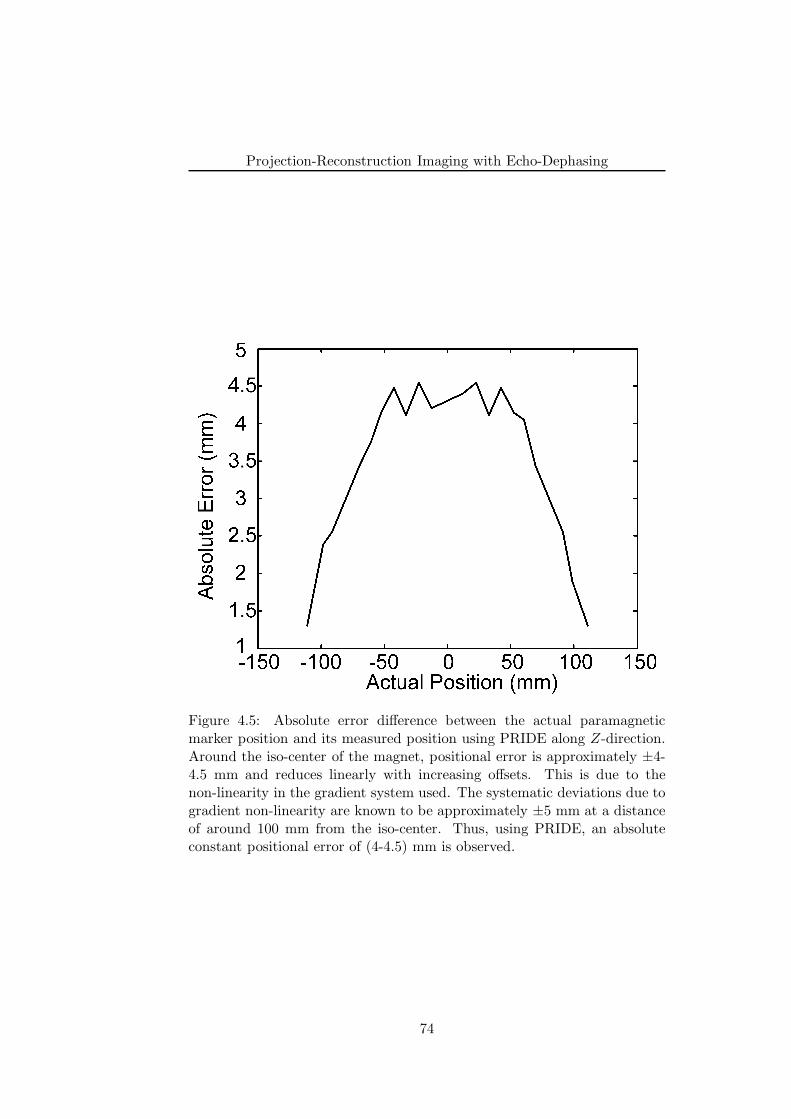
Projection-Reconstruction Imaging with Echo-Dephasing
Figure 4.5: Absolute error difference between the actual paramagneticmarker position and its measured position using PRIDE along Z-direction.Around the iso-center of the magnet, positional error is approximately ±4-4.5 mm and reduces linearly with increasing offsets. This is due to thenon-linearity in the gradient system used. The systematic deviations due togradient non-linearity are known to be approximately ±5 mm at a distanceof around 100 mm from the iso-center. Thus, using PRIDE, an absoluteconstant positional error of (4-4.5) mm is observed.
74
Projection-Reconstruction Imaging with Echo-Dephasing
Figure 4.6: Demonstration of the automatic slice positioning mechanism:Localizer images in sagittal and transversal planes indicate slice positionsbefore (a, b) and after (d, e) real-time feedback with corresponding coronalimages acquired before (c) and after real-time feedback (f). Red circles in-dicate detected slice position. Slice positioning is slightly shifted from themarker’s center-of-mass by a few millimeters, since local gradient compen-sation takes place outside of the marker position.
ASP mechanism are demonstrated using flow phantoms. Localizer imagesin sagittal and transversal planes indicate slice positions before (Fig. 4.6a,Fig. 4.6b) and after (Fig. 4.6d, Fig. 4.6e) real-time feedback with cor-responding coronal images acquired before (Fig. 4.6c) and after real-timefeedback (Fig. 4.6f). Red circles indicate the detected slice position, whichis well within the proximity of the marker position. This clearly demon-strates that a positional update to the paramagnetic marker material waspossible from simple projections, contrary to positive contrast techniquesin which whole k-space data needs to be acquired. The total time neededto calculate the co-ordinates of the slice position and corresponding real-time feedback to MPCU was approximately 2-3 ms. Thus, the total timerequired to determine the slice position using PRIDE was approximately 20ms (50 frames/s), comparable to active tracking systems (24 ms [23]) andsignificantly less than for positive contrast techniques.
75
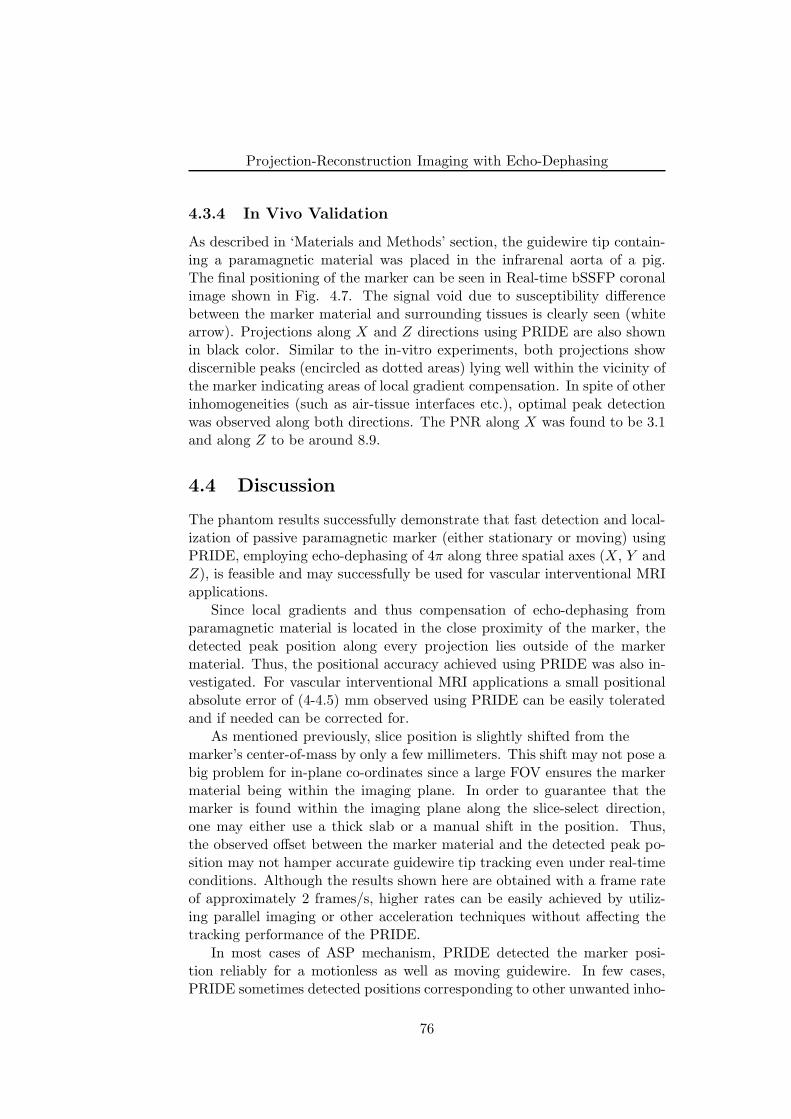
Projection-Reconstruction Imaging with Echo-Dephasing
4.3.4 In Vivo Validation
As described in ‘Materials and Methods’ section, the guidewire tip contain-ing a paramagnetic material was placed in the infrarenal aorta of a pig.The final positioning of the marker can be seen in Real-time bSSFP coronalimage shown in Fig. 4.7. The signal void due to susceptibility differencebetween the marker material and surrounding tissues is clearly seen (whitearrow). Projections along X and Z directions using PRIDE are also shownin black color. Similar to the in-vitro experiments, both projections showdiscernible peaks (encircled as dotted areas) lying well within the vicinity ofthe marker indicating areas of local gradient compensation. In spite of otherinhomogeneities (such as air-tissue interfaces etc.), optimal peak detectionwas observed along both directions. The PNR along X was found to be 3.1and along Z to be around 8.9.
4.4 Discussion
The phantom results successfully demonstrate that fast detection and local-ization of passive paramagnetic marker (either stationary or moving) usingPRIDE, employing echo-dephasing of 4π along three spatial axes (X, Y andZ), is feasible and may successfully be used for vascular interventional MRIapplications.
Since local gradients and thus compensation of echo-dephasing fromparamagnetic material is located in the close proximity of the marker, thedetected peak position along every projection lies outside of the markermaterial. Thus, the positional accuracy achieved using PRIDE was also in-vestigated. For vascular interventional MRI applications a small positionalabsolute error of (4-4.5) mm observed using PRIDE can be easily toleratedand if needed can be corrected for.
As mentioned previously, slice position is slightly shifted from themarker’s center-of-mass by only a few millimeters. This shift may not pose abig problem for in-plane co-ordinates since a large FOV ensures the markermaterial being within the imaging plane. In order to guarantee that themarker is found within the imaging plane along the slice-select direction,one may either use a thick slab or a manual shift in the position. Thus,the observed offset between the marker material and the detected peak po-sition may not hamper accurate guidewire tip tracking even under real-timeconditions. Although the results shown here are obtained with a frame rateof approximately 2 frames/s, higher rates can be easily achieved by utiliz-ing parallel imaging or other acceleration techniques without affecting thetracking performance of the PRIDE.
In most cases of ASP mechanism, PRIDE detected the marker posi-tion reliably for a motionless as well as moving guidewire. In few cases,PRIDE sometimes detected positions corresponding to other unwanted inho-
76
Projection-Reconstruction Imaging with Echo-Dephasing
Figure 4.7: In vivo PRIDE results: Real-time bSSFP coronal image dis-playing the placement of the guidewire tip (small white arrow) identified bysusceptibility artifact. The PRIDE projections along X and Z directionshaving peaks (encircled) within the close vicinity of the marker position areclearly seen.
77
Projection-Reconstruction Imaging with Echo-Dephasing
mogeneities such as air-plastic boundary of the phantom since such bound-aries create a gradually increasing gradient, which in turn gets compensatedby echo-dephased gradients of PRIDE. The ASP mechanism using PRIDEinterleaved with bSSFP for imaging was successfully demonstrated on a flowphantom, nevertheless its performance during the manipulation of guidewirealong the tortuous vessels as well as under severe motion condition needs tobe verified in-vivo.
Although the observed PNR is significantly lower during in vivo exper-iments as compared to phantom experiments, marker position can still bereliably detected due to excellent overall suppression of the background, es-pecially for projections along the main magnetic field B0. Along X, the PNRwas lower as compared to the Z direction, most likely due to stronger fieldinhomogeneity effects. During MR-interventions, the main vessels (femoralartery, abdominal aorta) usually lie in the XZ plane; hence PRIDE may besuccessfully employed to track interventional devices.
The gradients induced by marker material strongly depend upon theLMD of the paramagnetic material (See Eq. 4.2) used. From Eq. 4.2,the LMD needed for compensation of imaging gradient and thus to forman echo is a complex function of field strength, gradient system and thedistance from paramagnetic material. One may use a material with a strongsusceptibility difference and/or bigger size to induce stronger gradients. Byusing stronger echo-dephased gradients in PRIDE, one can expect increasedPNR. However, this would increase the artifact size and thereby hampervisualization of the underlying anatomical structures. Thus, from in vitroas well as in vivo experiments, it can be seen that the properties of thebackground (mainly gradients induced by unwanted inhomogeneities) playa role in defining the minimum size of the marker that can be detected.
Based on local gradient induction by paramagnetic marker material,PRIDE actively positions the slice at the device tip location. However,anatomy around the marker material is hindered due to signal loss in theimaged slice. Thus, some of the disadvantages of passive tracking remainwhen one uses PRIDE. Other unwanted inhomogeneities, such as air-tissueinterfaces, may also compensate echo-dephasing in PRIDE giving rise to falsepeak detection. This may lead to acquisition of imaging slice at erroneousposition. In order to reduce such false positives, intelligent post processingmay be introduced such as that provided in [23] or by restricting peak de-tection within the close vicinity of the vessel anatomy (for example; frompreviously acquired angiograms). Recently, a similar tracking approach hasbeen presented [24] that is based solely on an off-resonance tissue excitationand may lead to confounding results in the presence of fat tissues. More-over, the artifact size within the image is approximately 10 cm in length ascompared to 1.5-2 cm (in both lateral and vertical directions) in the currentimplementation.
In summary, we have demonstrated that PRIDE reliably detects the posi-
78
Projection-Reconstruction Imaging with Echo-Dephasing
tion of paramagnetic marker materials wrapped around the MR-compatibleguidewire along all three (X, Y and Z) spatial directions in vitro and alongtwo (X and Z) vital spatial directions in vivo. PRIDE has been successfullyincorporated into the ASP mechanism to feedback the actual position of theinterventional device in real-time on a clinical scanner, thereby making itcompetitive with the active tracking approach.
4.5 Conclusion
We have presented a framework for passive real-time tracking of interven-tional guidewires using PRIDE. With PRIDE, 3D localization of the para-magnetic marker is achieved by the acquisition of echo-dephased projec-tions along all three physical axes. Dephasing along each projection canbe compensated, by local gradients induced by paramagnetic markers togive rise to peaks signal formation within the close vicinity of the marker.Background signals from tissues such as blood or fat, remain completely de-phased. PRIDE shows excellent robustness against off-resonances (for e.g.,main magnetic field inhomogeneities, air/tissue interfaces etc.) as evidentfrom both in vitro as well as in vivo results. In addition, an ASP mechanismwas developed by interleaving PRIDE with an imaging sequence to providea positional update of the slice using a dedicated real-time feedback link. Invitro results suggest the feasibility of such a framework on a clinical scanner.
References
[1] C. Dumoulin, S. Souza, and R. Darrow, “Real-time position monitor-ing of invasive devices using magnetic resonance,” Magn Reson Med,vol. 29, p. 411–5, Mar. 1993.
[2] O. Ocali and E. Atalar, “Intravascular magnetic resonance imagingusing a loopless catheter antenna,” Magn Reson Med, vol. 37, no. 1,p. 112–8, 1997.
[3] A. Glowinski, G. Adam, A. Bucker, J. Neuerburg, J. van Vaals, andR. Gunther, “Catheter visualization using locally induced, actively con-trolled field inhomogeneities,” Magn Reson Med, vol. 38, p. 253–8, Aug.1997.
[4] F. Wacker, D. Elgort, C. Hillenbrand, J. Duerk, and J. Lewin, “Thecatheter-driven MRI scanner: a new approach to intravascular cathetertracking and imaging-parameter adjustment for interventional MRI,”AJR Am J Roentgenol, vol. 183, p. 391–5, Aug. 2004.
79
Projection-Reconstruction Imaging with Echo-Dephasing
[5] M. Konings, L. Bartels, H. Smits, and C. Bakker, “Heating around in-travascular guidewires by resonating RF waves,” J Magn Reson Imag-ing, vol. 12, p. 79–85, July 2000.
[6] M. Ladd and H. Quick, “Reduction of resonant RF heating in in-travascular catheters using coaxial chokes,” Magn Reson Med, vol. 43,p. 615–9, Apr. 2000.
[7] T. Kuehne, S. Weiss, F. Brinkert, J. Weil, S. Yilmaz, B. Schmitt, P. Ew-ert, P. Lange, and M. Gutberlet, “Catheter visualization with resonantmarkers at MR imaging-guided deployment of endovascular stents inswine,” Radiology, vol. 233, p. 774–80, Dec. 2004.
[8] S. Hegde, M. Miquel, R. Boubertakh, D. Gilderdale, V. Muthurangu,S. Keevil, I. Young, D. Hill, and R. Razavi, “Interactive MR imagingand tracking of catheters with multiple tuned fiducial markers,” J VascInterv Radiol, vol. 17, p. 1175–9, July 2006.
[9] M. Burl, G. Coutts, and I. Young, “Tuned fiducial markers to iden-tify body locations with minimal perturbation of tissue magnetization,”Magn Reson Med, vol. 36, p. 491–3, Sept. 1996.
[10] D. Rubin, A. Ratner, and S. Young, “Magnetic susceptibility effects andtheir application in the development of new ferromagnetic catheters formagnetic resonance imaging,” Invest Radiol, vol. 25, p. 1325–32, Dec.1990.
[11] O. Unal, F. Korosec, R. Frayne, C. Strother, and C. Mistretta, “Arapid 2D time-resolved variable-rate k-space sampling MR techniquefor passive catheter tracking during endovascular procedures,” MagnReson Med, vol. 40, p. 356–62, Sept. 1998.
[12] O. Bieri, S. Patil, H. Quick, and K. Scheffler, “Morphing steady-statefree precession,” Magn Reson Med, vol. 58, p. 1242–8, Dec. 2007.
[13] V. Kochli, G. McKinnon, E. Hofmann, and G. von Schulthess, “Vascu-lar interventions guided by ultrafast MR imaging: evaluation of differ-ent materials,” Magn Reson Med, vol. 31, p. 309–14, Mar. 1994.
[14] C. Bakker, R. Hoogeveen, J. Weber, J. van Vaals, M. Viergever, andW. Mali, “Visualization of dedicated catheters using fast scanning tech-niques with potential for MR-guided vascular interventions,” Magn Re-son Med, vol. 36, p. 816–20, Dec. 1996.
[15] J. Seppenwoolde, M. Viergever, and C. Bakker, “Passive tracking ex-ploiting local signal conservation: the white marker phenomenon,”Magn Reson Med, vol. 50, p. 784–90, Oct. 2003.
80
Projection-Reconstruction Imaging with Echo-Dephasing
[16] R. Mekle, E. Hofmann, K. Scheffler, and D. Bilecen, “A polymer-basedMR-compatible guidewire: a study to explore new prospects for in-terventional peripheral magnetic resonance angiography (ipMRA),” JMagn Reson Imaging, vol. 23, p. 145–55, Feb. 2006.
[17] J. Seppenwoolde, L. Bartels, R. van der Weide, J. Nijsen, A. van hetSchip, and C. Bakker, “Fully MR-guided hepatic artery catheterizationfor selective drug delivery: a feasibility study in pigs,” J Magn ResonImaging, vol. 23, p. 123–9, Feb. 2006.
[18] R. Razavi, D. Hill, S. Keevil, M. Miquel, V. Muthurangu, S. Hegde,K. Rhode, M. Barnett, J. van Vaals, D. Hawkes, and E. Baker, “Cardiaccatheterisation guided by MRI in children and adults with congenitalheart disease,” Lancet, vol. 362, p. 1877–82, Dec. 2003.
[19] M. Miquel, S. Hegde, V. Muthurangu, B. Corcoran, S. Keevil, D. Hill,and R. Razavi, “Visualization and tracking of an inflatable ballooncatheter using SSFP in a flow phantom and in the heart and greatvessels of patients,” Magn Reson Med, vol. 51, p. 988–95, May 2004.
[20] “ESMRMB 2008 congress, valencia, spain, 2-4 october: EPOSGaoposters / Info-RESO,” Magma, vol. 21 Suppl 1, p. 235–489: p. 395,Sept. 2008.
[21] B. H. EM, Magnetic resonance imaging: physical principles and se-quence design. New York: Wiley, 1999.
[22] P. L. Roux, “Simplified model and stabilization of SSFP sequences,” JMagn Reson, vol. 163, p. 23–37, July 2003.
[23] M. Bock, S. Volz, S. Zuhlsdorff, R. Umathum, C. Fink, P. Hallscheidt,and W. Semmler, “MR-guided intravascular procedures: real-time pa-rameter control and automated slice positioning with active trackingcoils,” J Magn Reson Imaging, vol. 19, p. 580–9, May 2004.
[24] A. Chanu, O. Felfoul, G. Beaudoin, and S. Martel, “Adapting the clin-ical MRI software environment for real-time navigation of an endovas-cular untethered ferromagnetic bead for future endovascular interven-tions,” Magn Reson Med, vol. 59, p. 1287–97, June 2008.
81

Projection-Reconstruction Imaging with Echo-Dephasing
82
Chapter 5
Highly Miniaturized Microcoils To Track InterventionalDevices
The work undertaken here is a part of EU project named Micro MR.
This chapter has been partially presented as:
• S. Patil, R. Umathum, M. Bock, J. Anders, G. Boero, K. Scheffler, “Highly minia-turized micro coil for tracking of the interventional devices”, Proceedings of the17th Scientific meeting of ISMRM, Hawaii, pp. 2009.
• S. Patil, R. Umathum, M. Bock, J. Anders, G. Boero, K. Scheffler, “Highly minia-turised micro coil for tracking of the interventional devices”, Proceedings of the 7thInterventional MRI Symposium (Oral Presentation), 2008.
83
Highly Miniaturized Micro-coils To Track Interventional Devices
5.1 Overview
Over the recent years, MRI has developed from a purely diagnostic tool toan imaging modality that can also be used to monitor endovascular inter-ventions. For such interventions, a reliable and high-contrast visualizationof the interventional devices (for e.g. catheter) in relation to surround-ing anatomy by means of active tracking coils is a well-established methodsince its introduction [1]. The active tracking utilizes locally sensitive trans-mit/receive solenoid coils for device localization [2, 3]. Localization of thecoil is achieved in few milliseconds through acquisition of one dimensional(1D) projections along all three spatial directions (X, Y and Z). Thus,very high frame rates of 50 frames/s can be easily achieved. The positionalinformation is then used to actively align the position of the imaging slice[4, 5]. In addition, velocity of the device has been used to automaticallyadjust the imaging parameters [6]. Although this method suffers from RFheating issues [7], efforts are being undertaken to mitigate them, see for e.g.[8, 9].
However, the dimensions of state-of-the-art active coils are bulky in na-ture (typically 2-3 mm in diameter) thereby increasing the size of normalinterventional catheters. In addition, the sensitivity of the coil and hence,the spatial resolution is directly proportional to coil dimensions [10]. Ascompared to x-ray fluoroscopy that offers a device localization resolution inthe range of the order of 0.1 mm, the current device dimensions limit theresolution in MRI. In order to overcome these disadvantages, highly minia-turised planar micro coils with built-in amplifier are developed [11]. Typicaldimensions of these micro-coils are 0.5×0.5 mm2 including the built-in am-plifier. The aim of this chapter is to demonstrate the feasibility of theseminiaturized micro-coils to utilize them as the tracking coil on a clinicalscanner with an aid of phantom experiments. In the first part of this chap-ter, we describe the experimental arrangements, difficulties thereof and MRsequence parameters. Next, the description and discussion of results ob-tained by means of spectroscopic, imaging and 1D projection are presented.Perspectives from the results conclude the chapter.
5.2 Experimental Setup
The coils which have been developed by are designed to operate at 63 MHzcorresponding to 1.5 T magnetic field strength. The equivalent circuit ofthe micro coil setup including connection to the clinical scanner throughFlex coil interface is shown in Fig. 5.1. The planar micro coil L tuned to63 MHz frequency using capacitor C, is connected to a low noise amplifier(LNA) with a gain of 43 dB. The development of micro-coil with built-inpre-amplifier was done using 0.35 µm CMOS technology. The photograph
84
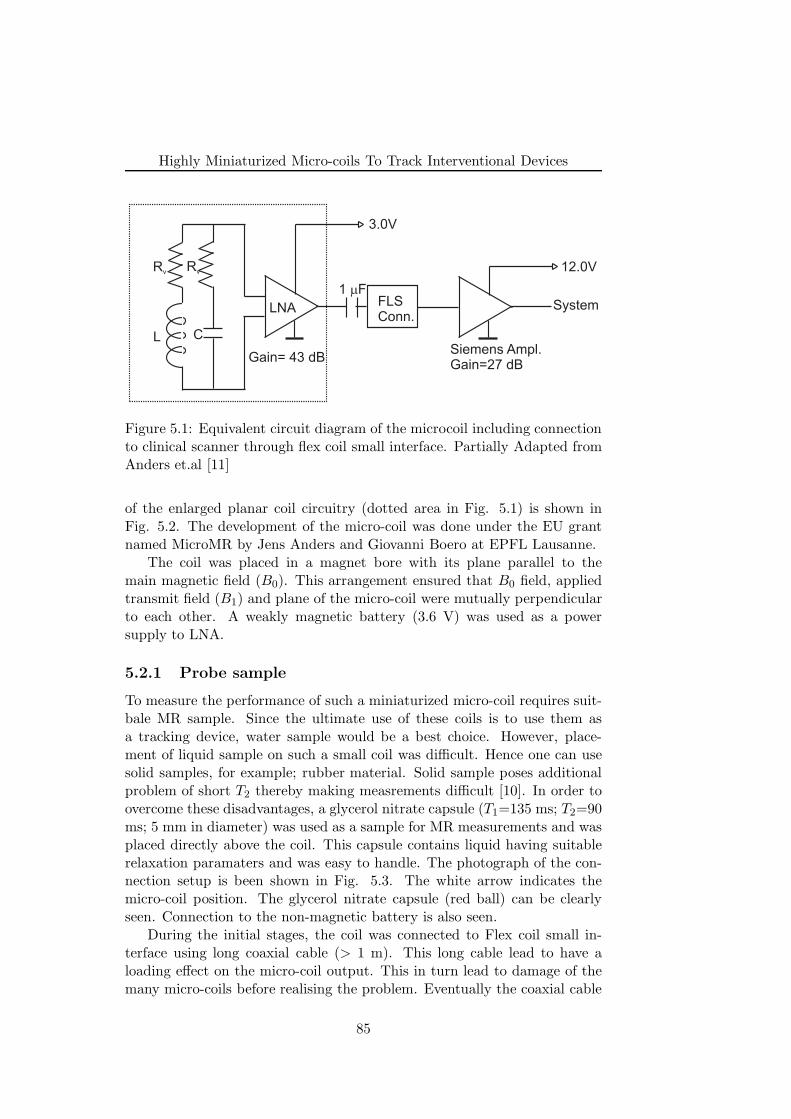
Highly Miniaturized Micro-coils To Track Interventional Devices
FLSConn.
LNA
L CSiemens Ampl.Gain=27 dB
Gain= 43 dB
1 Fm
3.0V
12.0V
System
Rv Rv
Figure 5.1: Equivalent circuit diagram of the microcoil including connectionto clinical scanner through flex coil small interface. Partially Adapted fromAnders et.al [11]
of the enlarged planar coil circuitry (dotted area in Fig. 5.1) is shown inFig. 5.2. The development of the micro-coil was done under the EU grantnamed MicroMR by Jens Anders and Giovanni Boero at EPFL Lausanne.
The coil was placed in a magnet bore with its plane parallel to themain magnetic field (B0). This arrangement ensured that B0 field, appliedtransmit field (B1) and plane of the micro-coil were mutually perpendicularto each other. A weakly magnetic battery (3.6 V) was used as a powersupply to LNA.
5.2.1 Probe sample
To measure the performance of such a miniaturized micro-coil requires suit-bale MR sample. Since the ultimate use of these coils is to use them asa tracking device, water sample would be a best choice. However, place-ment of liquid sample on such a small coil was difficult. Hence one can usesolid samples, for example; rubber material. Solid sample poses additionalproblem of short T2 thereby making measrements difficult [10]. In order toovercome these disadvantages, a glycerol nitrate capsule (T1=135 ms; T2=90ms; 5 mm in diameter) was used as a sample for MR measurements and wasplaced directly above the coil. This capsule contains liquid having suitablerelaxation paramaters and was easy to handle. The photograph of the con-nection setup is been shown in Fig. 5.3. The white arrow indicates themicro-coil position. The glycerol nitrate capsule (red ball) can be clearlyseen. Connection to the non-magnetic battery is also seen.
During the initial stages, the coil was connected to Flex coil small in-terface using long coaxial cable (> 1 m). This long cable lead to have aloading effect on the micro-coil output. This in turn lead to damage of themany micro-coils before realising the problem. Eventually the coaxial cable
85
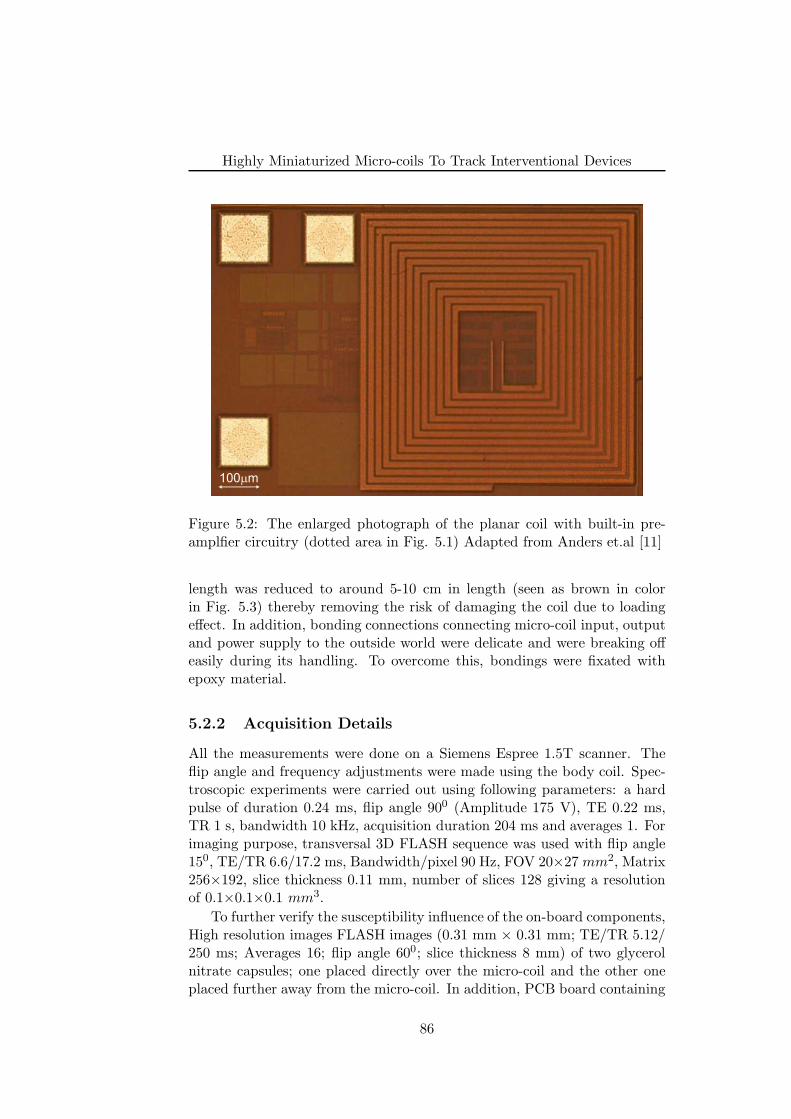
Highly Miniaturized Micro-coils To Track Interventional Devices
100 mm
Figure 5.2: The enlarged photograph of the planar coil with built-in pre-amplfier circuitry (dotted area in Fig. 5.1) Adapted from Anders et.al [11]
length was reduced to around 5-10 cm in length (seen as brown in colorin Fig. 5.3) thereby removing the risk of damaging the coil due to loadingeffect. In addition, bonding connections connecting micro-coil input, outputand power supply to the outside world were delicate and were breaking offeasily during its handling. To overcome this, bondings were fixated withepoxy material.
5.2.2 Acquisition Details
All the measurements were done on a Siemens Espree 1.5T scanner. Theflip angle and frequency adjustments were made using the body coil. Spec-troscopic experiments were carried out using following parameters: a hardpulse of duration 0.24 ms, flip angle 900 (Amplitude 175 V), TE 0.22 ms,TR 1 s, bandwidth 10 kHz, acquisition duration 204 ms and averages 1. Forimaging purpose, transversal 3D FLASH sequence was used with flip angle150, TE/TR 6.6/17.2 ms, Bandwidth/pixel 90 Hz, FOV 20×27 mm2, Matrix256×192, slice thickness 0.11 mm, number of slices 128 giving a resolutionof 0.1×0.1×0.1 mm3.
To further verify the susceptibility influence of the on-board components,High resolution images FLASH images (0.31 mm × 0.31 mm; TE/TR 5.12/250 ms; Averages 16; flip angle 600; slice thickness 8 mm) of two glycerolnitrate capsules; one placed directly over the micro-coil and the other oneplaced further away from the micro-coil. In addition, PCB board containing
86
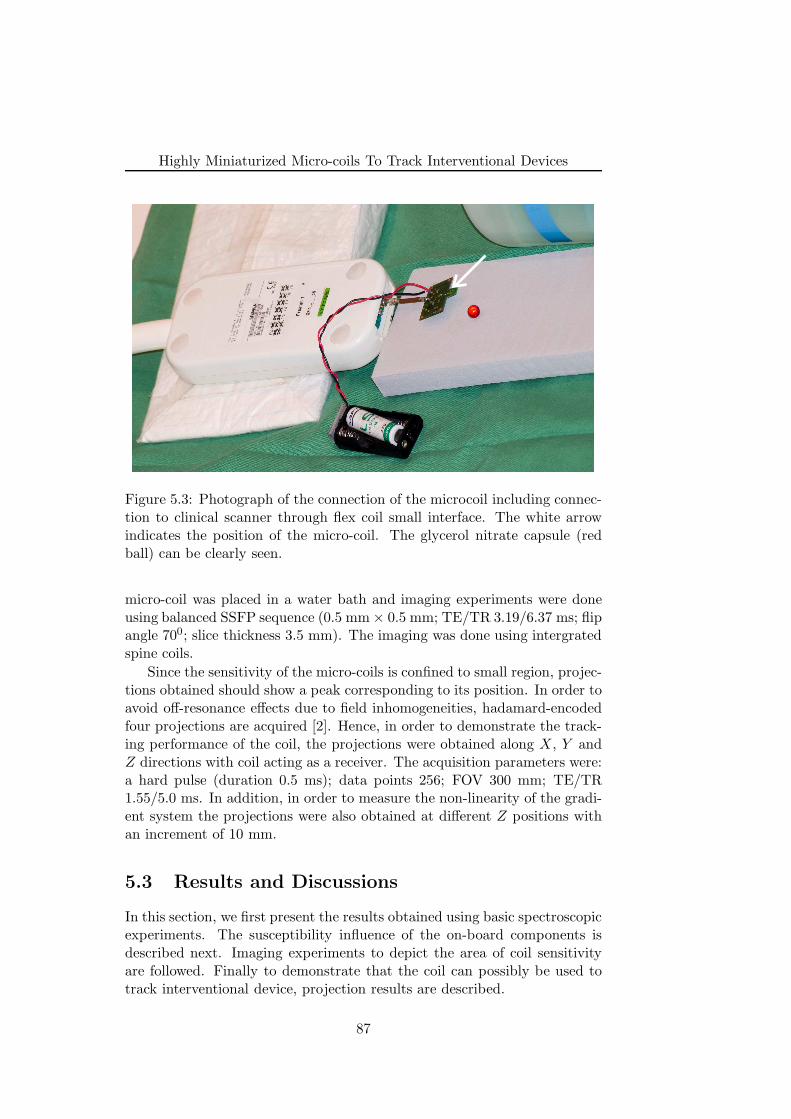
Highly Miniaturized Micro-coils To Track Interventional Devices
Figure 5.3: Photograph of the connection of the microcoil including connec-tion to clinical scanner through flex coil small interface. The white arrowindicates the position of the micro-coil. The glycerol nitrate capsule (redball) can be clearly seen.
micro-coil was placed in a water bath and imaging experiments were doneusing balanced SSFP sequence (0.5 mm × 0.5 mm; TE/TR 3.19/6.37 ms; flipangle 700; slice thickness 3.5 mm). The imaging was done using intergratedspine coils.
Since the sensitivity of the micro-coils is confined to small region, projec-tions obtained should show a peak corresponding to its position. In order toavoid off-resonance effects due to field inhomogeneities, hadamard-encodedfour projections are acquired [2]. Hence, in order to demonstrate the track-ing performance of the coil, the projections were obtained along X, Y andZ directions with coil acting as a receiver. The acquisition parameters were:a hard pulse (duration 0.5 ms); data points 256; FOV 300 mm; TE/TR1.55/5.0 ms. In addition, in order to measure the non-linearity of the gradi-ent system the projections were also obtained at different Z positions withan increment of 10 mm.
5.3 Results and Discussions
In this section, we first present the results obtained using basic spectroscopicexperiments. The susceptibility influence of the on-board components isdescribed next. Imaging experiments to depict the area of coil sensitivityare followed. Finally to demonstrate that the coil can possibly be used totrack interventional device, projection results are described.
87
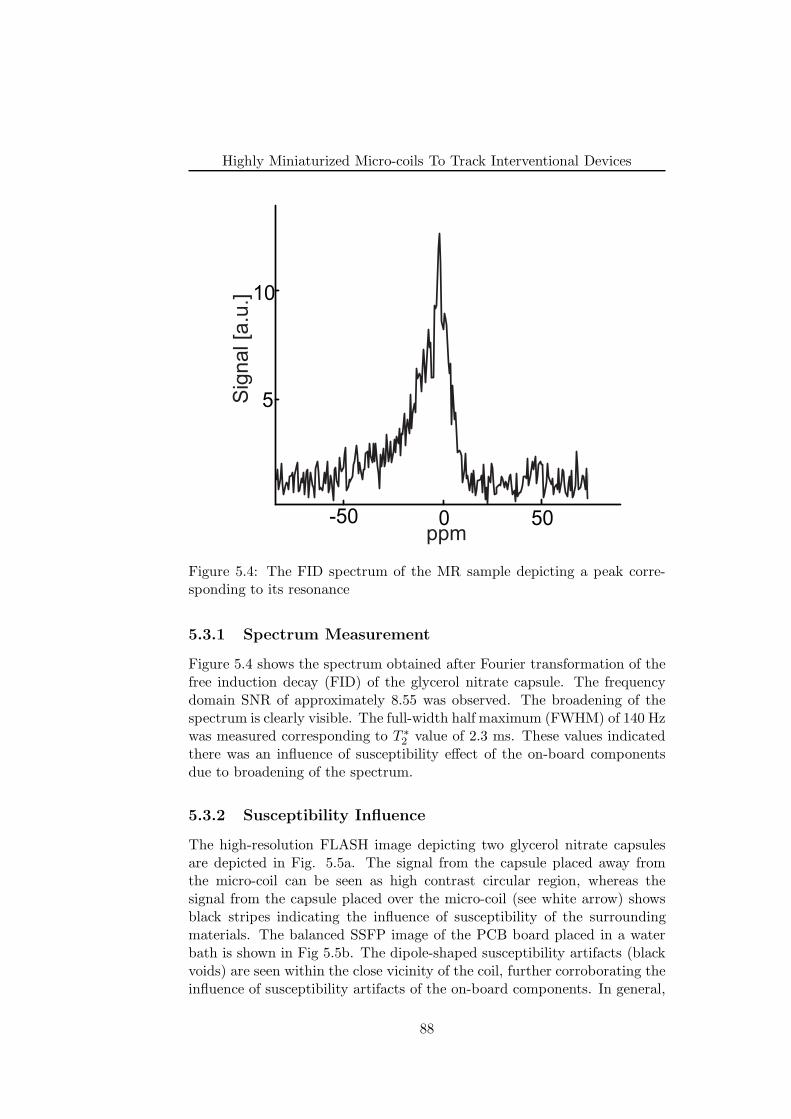
Highly Miniaturized Micro-coils To Track Interventional Devices
-50 0 50
5
10
ppm
Sig
nal [a
.u.]
Figure 5.4: The FID spectrum of the MR sample depicting a peak corre-sponding to its resonance
5.3.1 Spectrum Measurement
Figure 5.4 shows the spectrum obtained after Fourier transformation of thefree induction decay (FID) of the glycerol nitrate capsule. The frequencydomain SNR of approximately 8.55 was observed. The broadening of thespectrum is clearly visible. The full-width half maximum (FWHM) of 140 Hzwas measured corresponding to T ∗
2 value of 2.3 ms. These values indicatedthere was an influence of susceptibility effect of the on-board componentsdue to broadening of the spectrum.
5.3.2 Susceptibility Influence
The high-resolution FLASH image depicting two glycerol nitrate capsulesare depicted in Fig. 5.5a. The signal from the capsule placed away fromthe micro-coil can be seen as high contrast circular region, whereas thesignal from the capsule placed over the micro-coil (see white arrow) showsblack stripes indicating the influence of susceptibility of the surroundingmaterials. The balanced SSFP image of the PCB board placed in a waterbath is shown in Fig 5.5b. The dipole-shaped susceptibility artifacts (blackvoids) are seen within the close vicinity of the coil, further corroborating theinfluence of susceptibility artifacts of the on-board components. In general,
88
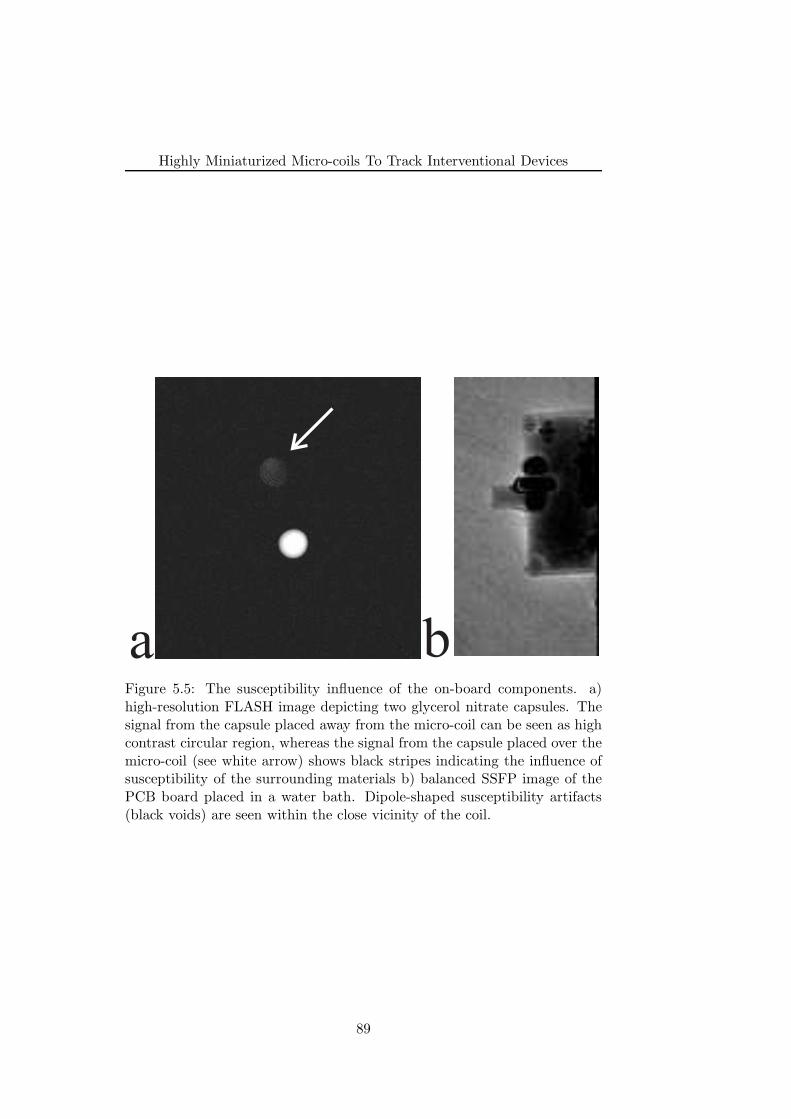
Highly Miniaturized Micro-coils To Track Interventional Devices
a bFigure 5.5: The susceptibility influence of the on-board components. a)high-resolution FLASH image depicting two glycerol nitrate capsules. Thesignal from the capsule placed away from the micro-coil can be seen as highcontrast circular region, whereas the signal from the capsule placed over themicro-coil (see white arrow) shows black stripes indicating the influence ofsusceptibility of the surrounding materials b) balanced SSFP image of thePCB board placed in a water bath. Dipole-shaped susceptibility artifacts(black voids) are seen within the close vicinity of the coil.
89
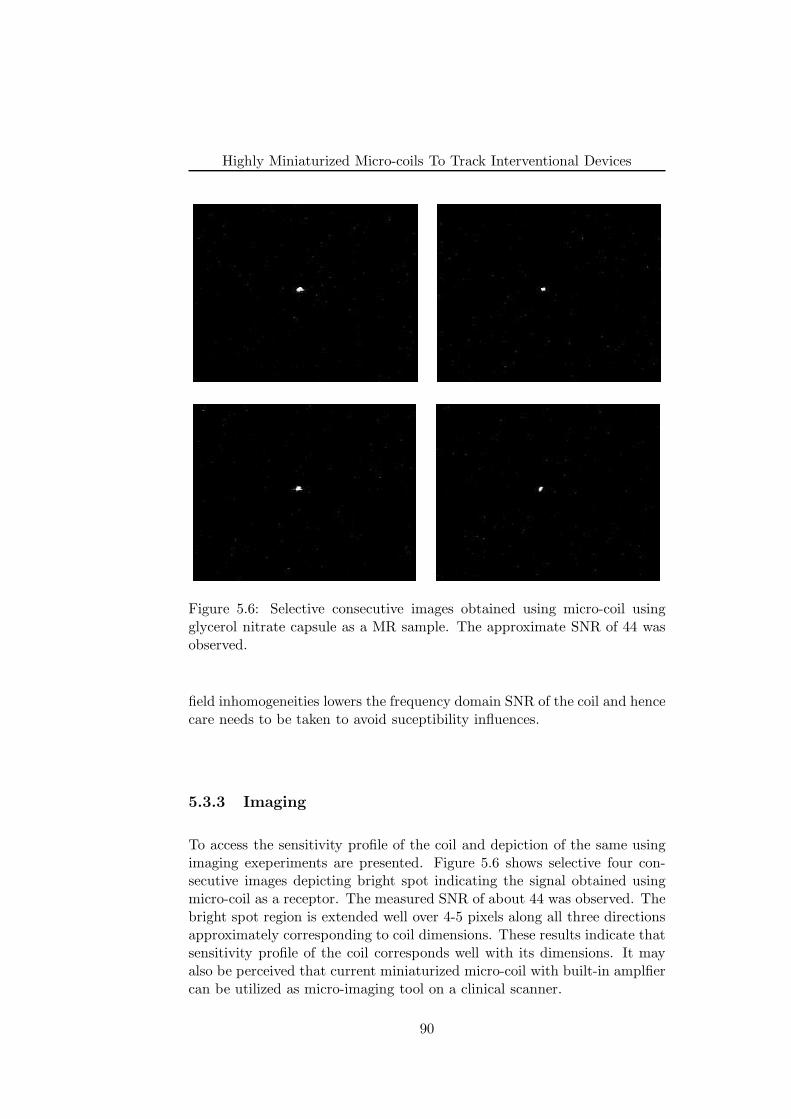
Highly Miniaturized Micro-coils To Track Interventional Devices
Figure 5.6: Selective consecutive images obtained using micro-coil usingglycerol nitrate capsule as a MR sample. The approximate SNR of 44 wasobserved.
field inhomogeneities lowers the frequency domain SNR of the coil and hencecare needs to be taken to avoid suceptibility influences.
5.3.3 Imaging
To access the sensitivity profile of the coil and depiction of the same usingimaging exeperiments are presented. Figure 5.6 shows selective four con-secutive images depicting bright spot indicating the signal obtained usingmicro-coil as a receptor. The measured SNR of about 44 was observed. Thebright spot region is extended well over 4-5 pixels along all three directionsapproximately corresponding to coil dimensions. These results indicate thatsensitivity profile of the coil corresponds well with its dimensions. It mayalso be perceived that current miniaturized micro-coil with built-in amplfiercan be utilized as micro-imaging tool on a clinical scanner.
90
Highly Miniaturized Micro-coils To Track Interventional Devices
5.3.4 Peak Detection
Figure 5.7a, b and c shows the projections obtained along X, Y and Zdirections respectively. The peak depiction corresponding to the coil positioncan be clearly visualised and delineated from the noise signal. The SNR ofabout 10 was obtained for every projection. Due to limited sensitivity of thehighly miniaturized micro-coil, the signal detected is only non-vanishing atits position.
Fig 5.7d shows the graph of the difference (Zm − Za) between actualposition and measured position using projection technique against the actualZ-positions (Za). It can be seen that the difference (Zm − Za) increaseslinearly with the increasing distance from the iso-centre, which is consistentwith the non-linearity of the gradient system, hence proving the utility ofthe coil as a RF receiver.
Finally, from the results presented in this chapter, it can be deduced thatcurrent miniaturized micro-coil may be utilized as an active tracking coilfor interventional purpose by suitably placing it over the device. However,further modifications of the micro-coil are necessary to avoid for e.g. thesusceptibility influence of the on-board components. Further experimentsshould be carried out using flow phantoms to further access the sensitivityprofile and detection capability of the coil. Generally well-known heatingissues associated with long cables connecting RF coils need to be accessed aswell. As described in ’Experimental Section’, coaxial cable connecting themicro-coil output to the Flex loop small interface was shortened to avoid theloading effect. However, from the interventional application point of view awork around need to be found out.
5.4 Conclusion
The main aim of this chapter was to introduce and test highly miniatur-ized micro-coils on a clinical scanner. The results presented in this chapterindicate that the micro coil with typical dimensions of 0.5 mm × 0.5 mmand built-in amplifier can be used as a RF detector on clinical scanner. Thespectroscopic and imaging showed the SNR and sensitivity of the coil. Highresolution FLASH and bSSFP imaging experiments indicated heavy influ-ence of susceptibility effect of on-board components. A care need to be takento strictly use non-ferromagnetic componentns. The SNR of the projectionsappears moderately sufficient to detect the position of the micro-coil for thesample used in the experiment. Further modifications and experiments arenecessary to incorporate the micro coil into an interventional device.
91
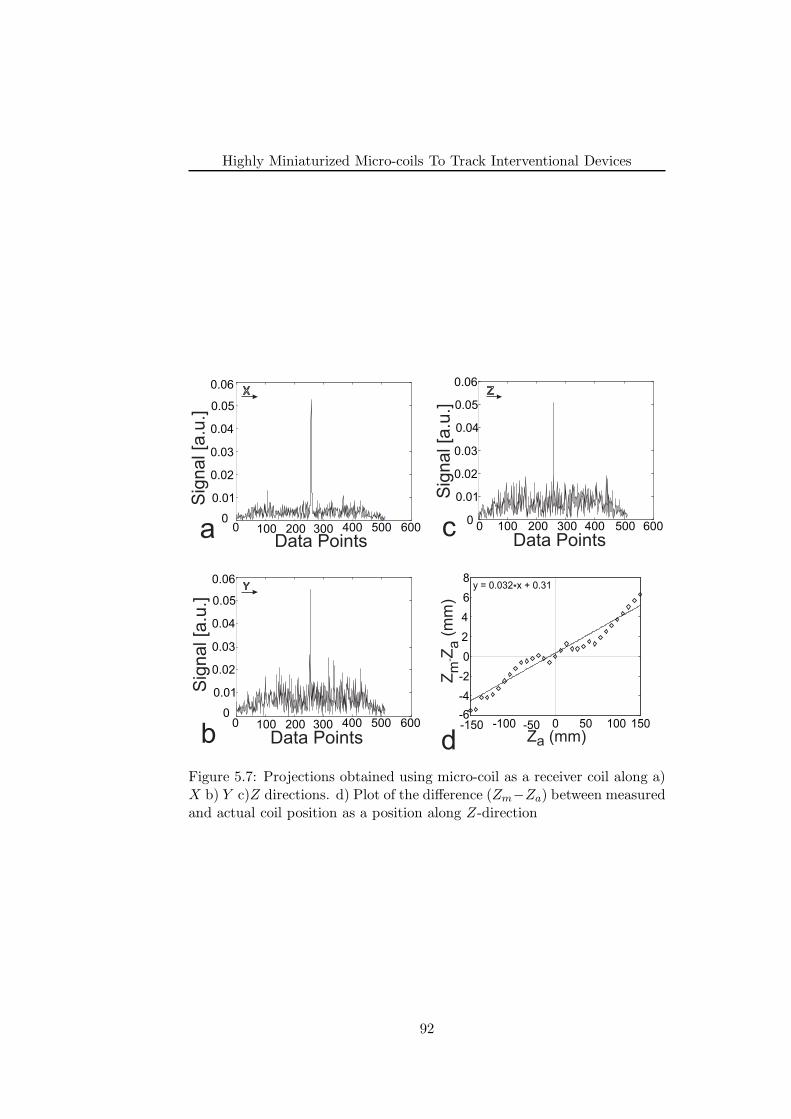
Highly Miniaturized Micro-coils To Track Interventional Devices
0 100 200 300 400 500 6000
0.01
0.02
0.03
0.04
0.05
0.06
Sig
nal [a
.u.]
Data Points
Sig
nal [a
.u.]
Data Points
0 100 200 300 400 500 6000
0.01
0.02
0.03
0.04
0.05
0.06
Sig
nal [a
.u.]
Data Points
-150 -100 -50 0 50 100 150-6
-4
-2
0
2
4
6
8y = 0.032*x + 0.31
Z (mm)a
ZZ
(mm
)m
a-
X
Y
Z
a
b d
c
0 100 200 300 400 500 6000
0.01
0.02
0.03
0.04
0.05
0.06
Figure 5.7: Projections obtained using micro-coil as a receiver coil along a)X b) Y c)Z directions. d) Plot of the difference (Zm−Za) between measuredand actual coil position as a position along Z-direction
92
Highly Miniaturized Micro-coils To Track Interventional Devices
References
[1] J. L. Ackerman, M. C. Offut, R. B. Buxton, and T. J. Brady, “Rapid 3Dtracking of small RF coils.,” in Proceedings of the SMRM, (Montreal),p. 1131, 1986.
[2] C. Dumoulin, S. Souza, and R. Darrow, “Real-time position monitor-ing of invasive devices using magnetic resonance,” Magn Reson Med,vol. 29, p. 411–5, Mar. 1993.
[3] O. Ocali and E. Atalar, “Intravascular magnetic resonance imagingusing a loopless catheter antenna,” Magn Reson Med, vol. 37, no. 1,p. 112–8, 1997.
[4] M. Bock, S. Volz, S. Zuhlsdorff, R. Umathum, C. Fink, P. Hallscheidt,and W. Semmler, “MR-guided intravascular procedures: real-time pa-rameter control and automated slice positioning with active trackingcoils,” J Magn Reson Imaging, vol. 19, p. 580–9, May 2004.
[5] M. E. Ladd, G. G. Zimmermann, H. H. Quick, J. F. Debatin, P. Boe-siger, G. K. von Schulthess, and G. C. McKinnon, “Active MR visual-ization of a vascular guidewire in vivo,” Journal of Magnetic ResonanceImaging: JMRI, vol. 8, pp. 220–225, Feb. 1998. PMID: 9500284.
[6] F. Wacker, D. Elgort, C. Hillenbrand, J. Duerk, and J. Lewin, “Thecatheter-driven MRI scanner: a new approach to intravascular cathetertracking and imaging-parameter adjustment for interventional MRI,”AJR Am J Roentgenol, vol. 183, p. 391–5, Aug. 2004.
[7] M. Konings, L. Bartels, H. Smits, and C. Bakker, “Heating around in-travascular guidewires by resonating RF waves,” J Magn Reson Imag-ing, vol. 12, p. 79–85, July 2000.
[8] M. Ladd and H. Quick, “Reduction of resonant RF heating in in-travascular catheters using coaxial chokes,” Magn Reson Med, vol. 43,p. 615–9, Apr. 2000.
[9] S. Weiss, P. Vernickel, T. Schaeffter, V. Schulz, and B. Gleich, “Trans-mission line for improved RF safety of interventional devices,” MagneticResonance in Medicine: Official Journal of the Society of MagneticResonance in Medicine / Society of Magnetic Resonance in Medicine,vol. 54, pp. 182–189, July 2005. PMID: 15968655.
[10] C. Massin, F. Vincent, A. Homsy, K. Ehrmann, G. Boero, P. Besse,A. Daridon, E. Verpoorte, N. F. de Rooij, and R. S. Popovic, “Planarmicrocoil-based microfluidic NMR probes,” Journal of Magnetic Res-onance (San Diego, Calif.: 1997), vol. 164, pp. 242–255, Oct. 2003.PMID: 14511593.
93

Highly Miniaturized Micro-coils To Track Interventional Devices
[11] J. Anders, S. Reymond, G. Boero, and K. Scheffler, “A Low-NoiseCMOS receiver frontend for NMR-based surgical guidance,” in Pro-ceedings of the International Conference on Biomedical Engineering,(Singapore), IEEE, 2008.
94

Chapter 6
Summary And FutureOutlook
95
Summary And Future Outlook
The major aim of this thesis was to investigate and develop novel strate-gies to perform localization, visualization and tracking of the interventionaldevices exploiting magnetic susceptibility artifacts induced by paramagneticmarker material mounted on it. This thesis also introduced highly miniatur-ized micro-coils to be used for active tracking of the interventional devices.In this final chapter, we summarize the key contributions of this thesis andprovide some possible future outlook.
The key contributions of this thesis are:
• In the first part of this thesis, SPSP pulses has been utilized as a wayto localize and visualize paramagnetic markers with a positive con-trast. It was utilized to visualize interventional guidewire tip. TheSPSP pulse, which is both spatially as well as spectrally selective, wasused to excite off-resonant tissues within the immediate surrounding ofthe paramagnetic marker to generate positive contrast. By addition-ally playing out STIR pre-pulse efficient fat suppression was achieved,whilst retaining the positive contrast. The proximity of the positivecontrast to the marker tip was dependent on off-resonance excitationfrequency of the SPSP pulse, whereas volume of the positive contrastwas dependent on the number of RF sub-pulses within the SPSP pulse.
• Next, a novel concept for the generation of positive contrast from localsusceptibilities, termed echo-dephased SSFP was proposed. In princi-ple, echo-dephased SSFP is an unbalanced SSFP type of sequence, inwhich echoes are dephased prior to readout. We have demonstratedthat this echo-dephasing approach ensures excellent cancellation of anybackground signals. From local gradient compensation hyper-intensesignals are formed and thus a positive contrast emanates within theclose vicinity of paramagnetic marker materials. Hyper-intense sig-nals are mainly of bSSFP type, which ensures sufficient signal inten-sity with respect to background. A reliable localization and robustmarker detection was demonstrated using the proposed method. Thepassive guidewire tracking experiments were performed in flow phan-toms suggesting suitable applicability of the echo-dephased SSFP forMR-guided interventions such as ipMRA. Finally utilization of echo-dephased SSFP for positive contrast visualization of SPIO-labeled isletcells was demonstrated both in vitro and in vivo.
• A new framework was also presented for passive real-time tracking ofinterventional guidewires using PRIDE. With PRIDE, 3D localizationof the paramagnetic marker is achieved by the acquisition of echo-dephased projections along all three physical axes. Dephasing alongeach projection can be compensated, by local gradients induced byparamagnetic markers to give rise to peaks signal formation withinthe close vicinity of the marker. Background signals from tissues such
96
Summary And Future Outlook
as blood or fat, remain completely dephased. PRIDE shows excellentrobustness against off-resonances (for e.g., main magnetic field inho-mogeneities, air/tissue interfaces etc.) as evident from both in vitro aswell as in vivo results. In addition, an ASP mechanism was developedby interleaving PRIDE with an imaging sequence to provide a posi-tional update of the slice using a dedicated real-time feedback link. Invitro results suggest the feasibility of such a framework on a clinicalscanner.
• Finally, highly miniaturized micro-coils were introduced for activetracking of the interventional devices. The results presented indicatethat the micro coil with typical dimensions of 0.5 mm × 0.5 mm andbuilt-in amplifier can be used as a RF detector on clinical scanner. TheSNR of the projections appears moderately sufficient to detect the po-sition of the micro-coil for the sample used in the experiment. It wasconcluded that, further modifications and experiments are necessaryto incorporate the micro coil into an interventional device.
6.1 Future Outlook
Research in the field of MR device tracking is vigorously active and still re-quires major development before calling it as a clinical reality. The currentgeneral research direction in the field of vascular interventions indicate thatguidewire tracking may be realized using passive tracking means, whereasactive tracking may be suitbale for catheter tracking. Ultimately, the se-quences and device interfaces developed in this thesis should be helpful forrobust detection of paramagnetic marker detection and find its utility in pas-sive tracking of interventional devices, especially guidewires. Before makingthem clinically useful, further investigation is necessary. This section sum-marizes some possible future directions for the work described in this thesisas well as general device development.
• To further verify the efficacy of the marker detection using both posi-tive contrast sequences; SPSP pulse and echo-dephased SSFP, in-vivostudies in a pig model should be very helpful.
• In this thesis, the performance of the passive tracking methods waspresented for fixed size paramagnetic marker. However, in the antic-ipation of availability of the certified guidewires with possibly havingdifferent paramagnetic materials, methods presented in this thesis needto be reaccessed for the new guidewires.
• One of the major requirement of positive contrast sequences is to ac-quire full 2D image, which obviously limits its utilization to trackinterventional devices. Further studies exploring the incorporation of
97
Summary And Future Outlook
fast imaging strategies such as view sharing, fast image reconstructionmethods should be very helpful.
• Effect of detection ability using positive contrast sequences at differentdevice speeds, within tortuous and narrow vessels in a pig model wouldfurther be needed.
• Another obvious and interesting application of positive contrast se-quences is the localization, tracking and quantification of SPIO-labeledcells. Although preliminary studies showed its potential, further in-vitro and in-vivo studies could potentially be done to explore its clin-ical viability.
• Quantification of SPIO-labeled cells is a challenging problem and stud-ies using positive contrast sequences may further prove its clinical util-ity.
• Preliminary studies using PRIDE in a pig model demonstrated itsefficient marker detection ability. However, further experiments ofASP mechanism are necessary to corroborate the results presented inthis thesis.
• One may also adopt a strategy to use the interventional device withthree different paramagnetic markers, their detection using PRIDEand use them to adjust not only slice position but also the plane ofthe following slice.
• Highly miniaturized micro-coils introduced in this thesis may havea potential to be used for catheter tracking. Further studies couldinclude incorporation of the micro-coils onto a prototype catheter, in-vitro and in-vivo studies using the same.
• To further access the SNR and sensitivity profile of the coil, in vitroexperiments need to be done using more realistic conditions of vascularinterventions such as flow phantom. Enlargement of coil dimensionswould be needed if SNR of the coil is found to be insufficient.
• Requirement of small coaxial cable to connect the micro-coil to thescanner may be overcome by incorporating highly miniaturized de-modulation system, demodulating high frequency (removal of carrierfrequency) signal to the low frequency. Such a low frequency outputmay also potentially to induce less heating than RF frequency.
• It would be also important to study safety aspects these micro-coils.Instead of using connecting cables one may explore the utility of wire-less systems to transfer the MR signal from device tip to the outsideworld.
98