Embed Size (px)
Citation preview
i
INFLUENCE OF A BLEACHING AGENT ON STAINED DIRECT COMPOSITE RESINS.
Caroline Wanjau
A mini-thesis submitted in partial fulfillment of the requirements for the degree of Master of Science in Dental Sciences in
Restorative Dentistry at the Faculty of Dentistry University of the Western Cape
Supervisor: Professor Y. I. Osman
November 2008
ii
INFLUENCE OF A BLEACHING AGENT ON STAINED DIRECT COMPOSITE RESINS.
KEY WORDS
Nanocomposite
Discolouration
Bleaching
Tea
Red Wine
iii
ABSTRACT
Despite the phenomenal strides in research of dental resin composites regarding their physical
and mechanical properties, discolouration, either intrinsic or extrinsic still remains a major
drawback and is one of the main reasons for the replacement of these restorations. Toothbrushing
and polishing procedures have been attempted to eliminate extrinsic staining without optimal
results. Vital tooth bleaching has over 90% success rates in whitening discoloured teeth and this
may be an alternative treatment modality for discoloured composite resins. Aim: The aim of this
study was to determine whether tooth bleaching agents alter the colour of stained direct
composite resins. Material and Method: 60 disc shaped specimens (9 x 2mm) of Filtek
Supreme XT were prepared. They were randomly divided into 3 groups (n = 20) and exposed to
either one of two experimental staining agents, tea or red wine, or artificial saliva (control)
continuously over a 7-day period. They were all then bleached with Opalescence Xtra Boost, a
chemically activated in-office whitening agent for 3, weekly sessions of a half hour each, broken
into 2, fifteen minute cycles. Colour determinations were made using a reflectance
spectrophotometer, from baseline, after each day of staining, after the bleaching treatments and
after a 1 week rehydration period. The CIE Lab colour space was used and colour changes were
monitored using ∆E, that was calculated during intervals between the experimental episodes
using L, a and b values. A ∆E ≥ 3.3 represented colour changes that were deemed clinically
noticeable. Data analysis was carried out using Microsoft excel and a non-parametric test
(Wilcoxon Signed Sum Rank Test) with a significance level set at ≤ 0.05 for colour differences
that are statistically significant. Results: Both staining solutions discoloured the composite resin
samples, but red wine produced greater colour changes than tea. After bleaching, the specimens
in the tea group reverted to baseline colour with a ∆E ≤ 3.3 but those in the red wine group did
not revert to baseline values with a ∆E ≥ 3.3. Conclusion: Filtek Supreme XT, a nanocomposite,
is susceptible to discolouration by chromogenic beverages. Red wine produced deeper staining
than tea. Opalescence Xtra Boost was effective in removing tea stains but not red wine stains.
iv
DECLARATION
I hereby declare that Influence of a Bleaching Agent on Stained Direct Composite Resins is
my own work, that it has not been submitted before for any degree or examination in any
university, and that all the sources I have used or quoted have been indicated and acknowledged
by complete references.
Caroline Wanjau
November 2008
Signed: ………………………………………
v
ACKNOWLEDGMENTS
Professor Y. I. Osman, for his kind words, encouragement, assistance and guidance in completing this thesis. I would also like to thank him for sharing his vast knowledge and imparting his wisdom and experience during the course of the program. Dr R. Rossouw, for his assistance, kindness and patience in acquiring the right materials to get the research underway and his immeasurable advice and encouragement during the course of this study. Dr N. Basson, for his kindness and assistance both in terms of advice and in acquiring the mould, staining vials and use of the pH machine. Dr A. Majeed, for his assistance and patience in the use of the spectrophotometer and in answering all my questions. Professor Kotze, for his invaluable input in the statistical analysis of this study. Robyn and Gisela of 3M ESPE, South Africa for generously supplying the composite resin and written material for this study. Alida of Milners’ Dental Suppliers, South Africa, for kindly providing the curing tip and literature needed for this study.

vi
DEDICATION
This is dedicated to my parents, who have been supportive and encouraging to us, their children
in all our endeavors. They have made sacrifices to see us through our undertakings and continue
to be our greatest advisors. There are no words to thank them.
I would also like to dedicate it to my friends whose encouragement and assistance helped make
this thesis a reality.

vii
TABLE OF CONTENTS
TITLE PAGE...…………………………………………………………………………………...i
KEY WORDS ................................................................................................................................ ii
ABSTRACT .................................................................................................................................. iii
DECLARATION.......................................................................................................................... iv
ACKNOWLEDGMENTS ............................................................................................................ v
DEDICATION.............................................................................................................................. vi
TABLE OF CONTENTS ........................................................................................................... vii
LIST OF FIGURES ...................................................................................................................... x
LIST OF TABLES ...................................................................................................................... xii
CHAPTER 1 INTRODUCTION ................................................................................................ 1
CHAPTER 2 LITERATURE REVIEW .................................................................................... 2
2. 1 INTRODUCTION .......................................................................................................... 2
2. 2 AESTHETIC DENTISTRY .......................................................................................... 2
2. 3 BLEACHING ................................................................................................................. 3
2. 3. 3. 1 Vital Tooth Bleaching ....................................................................................... 7
2. 3. 3. 1. 1 Night Guard Vital Bleaching (NGVB) ......................................................... 7
2. 3. 3. 1. 2 In-office Bleaching ....................................................................................... 8
2. 3. 3. 1. 3 Over-the-counter Bleaching Agents (OTC) ................................................. 9
2. 3. 3. 1. 4 Other Methods ............................................................................................ 10
2. 3. 3. 2 Non-vital Tooth Bleaching .............................................................................. 10
2. 3. 3. 2. 1 Walking Bleach Technique ........................................................................ 10
2. 3. 3. 2. 2 Thermocatalytic Technique ........................................................................ 10
2. 3. 3. 2. 3 “Inside-outside” Technique ........................................................................ 11
2. 4 COMPOSITE RESINS ................................................................................................ 13
viii
2. 4. 1 History..................................................................................................................... 13
2. 4. 2 Composition ............................................................................................................ 14
2. 4. 2. 1 Organic Matrix ................................................................................................ 14
2. 4. 2. 2 Inorganic Fillers ............................................................................................... 15
2. 4. 2. 3 Coupling Agents .............................................................................................. 17
2. 4. 3 Discolouration of Composites ................................................................................ 17
2. 4. 3. 1 Intrinsic Staining.............................................................................................. 18
2. 4. 3. 2 Extrinsic Staining ............................................................................................ 20
2. 3. 3. 3 Internalized Staining ........................................................................................ 22
2. 4. 4 Effect of Bleaching Agents on the Colour of Composite Restorations .................. 22
2. 5 COLOUR AND COLOUR MEASUREMENT ......................................................... 25
2. 5. 1 Colour Perception ................................................................................................... 25
2. 5. 2 Science of Colour .................................................................................................... 25
2. 5. 3 Colour Measurement ............................................................................................... 28
2. 5. 3. 1 Visual Techniques ........................................................................................... 28
2. 5. 3. 1. 1 Shade Guides .............................................................................................. 28
2. 5. 3. 1. 2 Stain Indices ............................................................................................... 28
2. 5. 3. 2 Instrumental Techniques.................................................................................. 29
2. 5. 3. 2. 1 Colourimeters ............................................................................................. 29
2. 5. 3. 2. 2 Spectrophotometers .................................................................................... 30
2. 5. 3. 2. 3 Digital Imaging Devices ............................................................................. 31
2. 6 CONCLUSION ............................................................................................................. 32
CHAPTER 3 AIMS AND OBJECTIVES .............................................................................. 33
3. 1 AIM ................................................................................................................................ 33
3. 2 OBJECTIVES .............................................................................................................. 33
3. 3 NULL HYPOTHESIS .................................................................................................. 33
CHAPTER 4 MATERIALS AND METHODS ...................................................................... 34
ix
4. 1 STUDY DESIGN .......................................................................................................... 34
4. 2 STUDY POPULATION AND SAMPLING .............................................................. 34
4. 3 MATERIALS ................................................................................................................ 34
4. 3. 1 Filtek Supreme XT .................................................................................................. 35
4. 3. 2 Staining Agents ....................................................................................................... 35
4. 3. 3 Opalescence Xtra Boost .......................................................................................... 37
4. 4 METHODOLOGY ....................................................................................................... 39
4. 4. 1 Composite Resin Specimen Preparation ................................................................. 40
4. 4. 2 Polymerization Procedure ....................................................................................... 41
4. 4. 3 Colour Measurement ............................................................................................... 43
4. 4. 4 Staining Process ...................................................................................................... 44
4. 4. 5 Bleaching Procedure ............................................................................................... 46
4. 5 Data Analysis ................................................................................................................ 47
CHAPTER 5 RESULTS ........................................................................................................... 48
CHAPTER 6 DISCUSSION..................................................................................................... 61
CHAPTER 7 CONCLUSIONS AND RECOMMENDATIONS .......................................... 72
REFERENCES ............................................................................................................................ 74
APPENDICES ............................................................................................................................. 83
x
LIST OF FIGURES
Figure 2.1: Nano-sized filler particles in Filtek Supreme XT. .................................................... 16
Figure 2.2: Munsell Colour System (Derbabian et al, 2001). ...................................................... 26
Figure 2.3: The CIE Lab colour space (Jarad et al, 2005). .......................................................... 27
Figure 4.1 Filtek supreme XT. ..................................................................................................... 35
Figure 4.2: Ketepa Pride Tea from Kenya. .................................................................................. 36
Figure 4.3: Simonsvlei Cabernet Sauvignon Merlot, 2006. ........................................................ 36
Figure 4.4: Opalescence Xtra Boost. ........................................................................................... 38
Figure 4.5: Flowchart of the study. .............................................................................................. 39
Figure 4.6: Rubber mould. ........................................................................................................... 40
Figure 4.7: Mould with composite sandwiched between 2 glass slabs and 2 polyester strips. .... 40
Figure 4.8: Optilux 150 Curing light. .......................................................................................... 41
Figure 4.9: Visible light intensity meter. ..................................................................................... 41
Figure 4.10: The curing process. ................................................................................................. 42
Figure 4.11: Test specimens. ....................................................................................................... 43
Figure 4.12: Konica Minolta Sensing spectrophotometer. .......................................................... 43
Figure 4.13: Colour measurements. ............................................................................................. 44
Figure 4.14: Development of the tea stain. .................................................................................. 45
Figure 4.15: Staining process ..................................................................................................... 45
Figure 4.16: Bleaching process. ................................................................................................... 46
Figure 5.1: Cumulative mean ΔE values from baseline for Group C. ........................................ 50
Figure 5.2: Dispersion for Group C ............................................................................................. 52
Figure 5.3: Cumulative mean ΔE values from baseline for Group T. ......................................... 53
Figure 5.4: Dispersion for Group T ............................................................................................. 55
Figure 5.5: Cumulative mean ΔE values from baseline for Group W. ........................................ 56

xi
Figure 5.6: Dispersion for Group W ............................................................................................ 58
Figure 5.7: Comparison of mean ΔE values from baseline for the three groups. ........................ 59
Figure 5.8: Comparison of sequential mean ΔE for the three groups. ......................................... 60
xii
LIST OF TABLES
Table 2.1: Studies on Effect of Bleaching Agents on the Colour of Composite Resins. ............. 24
Table 4.1: Materials Used in the Study. ....................................................................................... 34
Table 4.2: Composition of Artificial Saliva. ................................................................................ 37
Table 5.1: Extract from raw data ................................................................................................. 48
Table 5.2: Mean ΔE, standard deviation and p values for all groups. ......................................... 49
Table 5.3: Mean (standard deviation) values during the staining period for group C.. ............... 51
Table 5.4: Mean (standard deviation) values during the bleaching and rehydration period for
Group C. ........................................................................................................................................ 51
Table 5.5: Mean (standard deviation) values during the staining period for group T ................. 54
Table 5.6: Mean (standard deviation) values during the bleaching and rehydration period for
Group T ......................................................................................................................................... 54
Table 5.7: Mean (standard deviation) values during the staining period for group W ................ 57
Table 5.8: Mean (standard deviation) values during the bleaching and rehydration period for
Group W........................................................................................................................................ 57
Table 5.9: Mean (standard deviation) values of the overall changes for all three groups ........... 58
1
CHAPTER 1 INTRODUCTION
Tooth whitening has been a part of aesthetic dentistry since 1898 (Turker and Biskin, 2003), but
its popularity has increased dramatically in the last two decades as the public now pursues the
‘perfect youthful’ smile to complement the benefits reaped from dieting and exercising. Initially,
bleaching was carried out by dentists in their offices and was largely considered a preserve for
the rich (Burrell, 1997), but now, a large variety of over-the-counter systems are available for
anyone who would like to improve their smile. Professionally-staffed tooth whitening centres,
whose sole purpose is bleaching teeth, are now being opened in the USA, to meet the growing
demand for this service (Sarrett, 2002). The sale of bleaching agents now has a multi-million
dollar annual turnover as the craze for whiter, brighter smiles sweeps across the globe (Garber,
1997, Schmidt and Tatum, 2006).
Aesthetic considerations have also extended to restorations, with composite resins being used
more frequently, even in the posterior region. They have undergone a great deal of development
since their introduction in the 1940s, as regards their physical and chemical properties (Garcia et
al, 2006). Unfortunately, the discolouration of composite restorations over time, still remains a
major drawback (Buchalla et al, 2002, Villalta et al, 2006) and is one of the main reasons for
their replacement (Buchalla et al, 2002, Schulze et al, 2003, Villalta et al, 2006). Bleaching
systems have an effect on the tooth colour so it is deduced that composite restorations should
also be influenced by these whitening agents (Canay and Cehreli, 2003).
In Kenya and other parts of the world, the treatment of choice for stained composite restorations
is their removal and subsequent replacement, which is an invasive procedure. Furthermore, it has
been shown that each removal and replacement of a restoration is accompanied by a certain
amount of loss of sound dental material, with eventual weakening of the remaining tooth
structure (Elderton, 1996).
The aim of this study is to assess the effectiveness of a bleaching agent in removing stains from
light polymerized composite resins with a view of using this as an alternative method of
returning these discoloured restorations to their former aesthetic levels.
2
CHAPTER 2 LITERATURE REVIEW
2. 1 INTRODUCTION There has been a gradual shift in dentistry in the last 25 years, from treating and preventing oral
diseases, to aesthetics (Spear and Kokich, 2007). Although patients are still concerned with
getting their teeth to a healthy state to carry out their primary masticatory function, they are now
also placing great importance on how good their dentitions look (Morley, 1999, Spear and
Kokich, 2007). Dental professionals are increasingly being asked to improve the appearance of
the individual’s smiles even when no real pathology exists in the mouth (Morley, 1999, Spear
and Kokich, 2007). This has necessitated a multidisciplinary approach to treatment, with some
dentists even suggesting that the treatment planning should begin with aesthetics (Spear and
Kokich, 2007). This increased demand for enhanced appearance has led to the exponential
growth in the bleaching industry (Garber, 1997, Sarrett, 2002) and the shift to tooth coloured
restorations (Sadowsky, 2006). This has been accompanied by major strides in the research into
colour measurement and shade matching in prosthodontics (Brewer et al, 2004)
The literature review focuses on aesthetic dentistry and society’s increasing appetite for it,
bleaching procedures, composite resins and colour and colour measurement methods used in
dentistry.
2. 2 AESTHETIC DENTISTRY
It is now recognized that beautiful people are perceived to be happier, more outgoing, intelligent
and successful compared to their more plain counterparts (Adams and Pang, 2004, Beall, 2007).
These conclusions were previously based on overall attractiveness, but studies have shown that a
smile alone had a huge impact on what society views as attractive and at the same time,
enhanced personality. These individuals have also been found to be treated better in society
(Adams and Pang, 2004, Beall, 2007). It is no wonder then that society has increasingly become
obsessed with aesthetics whose standards are now media-dictated (Adams and Pang, 2004). The
confidence and self-esteem of individuals is now pegged on achieving these sometimes,
impossible expectations (Burrell, 1997, Goldstein, 1997, Adams and Pang, 2004).

3
A beautiful smile is so crucial that it is now accepted as the single most important interactive
communication skill an individual has (Joiner, 2004). It is associated with white, well aligned
and proportioned teeth (Morley, 1999, Adams and Pang, 2004, Schmidt and Tatum, 2006). The
position of the anterior teeth vis-à-vis the lip line is also an important consideration in aesthetic
dentistry, as is the gingival contour surrounding the teeth (Adams and Pang, 2004, Joiner, 2004,
Schmidt and Tatum, 2006, Spear and Kokich, 2007). Older members of society, who today are
keeping their natural teeth much longer, are also seeking these same treatment options to fulfill
the “youth at all costs” phenomenon (Morley, 1999) or as Burrell (1997) so succinctly put it , the
pursuit of “immortality”.
Minor aesthetic concerns such as tooth discolouration can be addressed with scaling and
polishing (Dahl and Pallesen, 2003, Joiner, 2006), bleaching techniques, micro-abrasion or
veneers and crowns (Morley, 1999, Joiner, 2006, Schmidt and Tatum, 2006, Spear and Kokich,
2007). When the position or the contour of the gingiva is less than ideal, periodontal surgery may
be indicated (Morley, 1999, Schmidt and Tatum, 2006, Spear and Kokich, 2007). The length and
width of teeth may be made more aesthetically pleasing by using veneers or crowns, by crown
lengthening procedures or by orthodontic extrusion (Spear and Kokich, 2007). Malaligned teeth
are repositioned using orthodontic appliances, and orthognathic surgery is indicated for severe
tooth and jaw discrepancies (Schmidt and Tatum, 2006, Spear and Kokich, 2007). There are
times when more than one modality of treatment has to be used to achieve the desired aesthetic
result (Spear and Kokich, 2007).
Whereas all these modes of treatment are used in aesthetic dentistry, this review focuses mainly
on bleaching procedures of discoloured teeth.
2. 3 BLEACHING
Tooth whitening, as a means to improve aesthetics has existed for over a century (Goldstein,
1997, Dahl and Pallesen, 2003, Turker and Biskin, 2003, Suleiman, 2004). It is the most
conservative of all the procedures that can be used in treating discoloured teeth (Attin et al, 2003,
Shethri et al, 2003, Kihn, 2007). Bleaching has been declared a safe and efficient method for
whitening teeth, with the American Dental Association giving bleaching systems, its “Seal of
Approval” (Garber, 1997, Sarrett, 2002, Shethri et al, 2003) as has the US Food and Drug
Administration (Schmidt and Tatum, 2006).
4
2. 3. 1 History of Bleaching
Both vital and non-vital teeth may be whitened (Goldstein, 1997, Sarrett 2002, Attin et al, 2003,
Dahl and Pallesen, 2003, Suleiman, 2004, Tredwin et al, 2006).
Truman has been credited with the introduction of bleaching of non-vital teeth which were
initially whitened using chlorinated lime around 1850 (Haywood, 1992, Attin et al, 2003, Dahl
and Pallesen, 2003, Suleiman, 2004). The use of oxalic acid, chlorine and sodium peroxide were
employed from 1862 until the turn of the 19th century. Thereafter, sodium hypochlorite,
pyrozone, which is a mixture of hydrogen peroxide and ether, and superoxol (30% hydrogen
peroxide) were used (Haywood, 1992, Attin et al, 2003). The application of light, heat and
electric currents to accelerate the bleaching reactions was also described in the early 1900s (Attin
et al, 2003, Dahl and Pallesen, 2003). A procedure, in which the bleaching agent would be left in
the pulp chamber in between dental appointments, was published in 1938 (Attin et al, 2003).
Back then, a mixture of distilled water and sodium perborate was used (Attin et al, 2003). It later
came to be called the “walking bleach” technique by Spasser in 1961 when he used a mixture of
sodium perborate and water (Attin et al, 2003, Dahl and Pallesen, 2003, Suleiman, 2004). Two
years later, Nutting and Poe used hydrogen peroxide in place of water to improve tooth
whitening, using the same technique (Haywood, 1992, Attin et al, 2003, Dahl and Pallesen,
2003, Suleiman, 2004).
The whitening of vital teeth was described as early as 1868, first using oxalic acid and later,
pyrozone or hydrogen peroxide. Hydrogen peroxide was the main product being used by the
early 1900s with heat or light activation (Haywood, 1992, Suleiman, 2004) in a process known
as power bleaching that was reported by Abbot in 1918 (Goldstein, 1997, Joiner, 2006, Buchalla
and Attin, 2007). In the 1990s, hydrogen peroxide gels replaced liquids (Suleiman, 2004).
In the late 1960s, Dr. Klusmier, an orthodontist, discovered that carbamide peroxide caused
lightening of teeth (Haywood, 1992, Dahl and Pallesen, 2003, Suleiman, 2004, Kihn, 2007). At
the time, he was using a 10% carbamide peroxide containing antiseptic on a tray for the
treatment of gingivitis on a patient, when he noticed that the teeth whitened. This kicked off the
night guard vital bleaching technique which was published in 1989 by Haywood and Heymann
(Haywood, 1992, Dahl and Pallesen, 2003, Suleiman, 2004).
5
Currently, hydrogen peroxide and its compounds, sodium perborate and carbamide peroxide are
used for tooth whitening (Dahl and Pallesen, 2003, Kim et al, 2004).
2. 3. 2 Chemistry of Bleaching
Hydrogen peroxide is a colorless liquid that is highly soluble in water. It has a bitter taste and is
an oxidizing agent. Industrially, it has many uses including bleaching, treatment of water and
sewage systems and seed disinfection (Tredwin et al, 2006). While hydrogen peroxide has been
used for bleaching teeth since the last century, carbamide peroxide has only been available for
this indication from 1989. Carbamide peroxide was originally used as an oral antiseptic
(Perdigao et al, 2004).
The chemical reactions involved in bleaching are not yet fully understood (Joiner, 2006, Kihn,
2007, Suleiman, 2004). Hydrogen peroxide may be used directly or it may be generated from
sodium perborate (SP) or carbamide peroxide (CP) for whitening procedures (Dahl and Pallesen,
2003). Sodium perborate is a stable compound when in powder form but readily decomposes in
the presence of acid, water or warm air forming metaborate and hydrogen peroxide (Suleiman,
2005a), while carbamide peroxide, an unstable solution, easily dissociates into its constituents, of
which only one third is hydrogen peroxide (HP), the remaining two thirds being urea (Turker and
Biskin, 2003, Joiner, 2007).
Na2[B2(O2)2(OH)4] + 2H2O 2NaBO3 + 2H2O2
(SP) (HP)
H2NCONH2.H2O2 H2NCONH2 + H2O2
(CP) (urea) (HP)
The urea undergoes further breakdown to yield ammonia (Canay and Cehreli, 2003, Dahl and
Pallesen, 2003, Turker and Biskin, 2003), an alkaline which raises the pH of the environment
(Dahl and Pallesen, 2003), and carbon dioxide (Canay and Cehreli, 2003, Turker and Biskin,
2003). The alkalinity facilitates the bleaching reaction resulting in more effective tooth
whitening than acidic environments (Attin et al, 2003, Dahl and Pallesen, 2003).
Chromophores or stains are organic compounds made up of long chains of alternating single and
double bonds, with heteroatoms, phenyl and carbonyl rings (Joiner, 2006). Bleaching occurs by
splitting these long chains into colourless, diffusible molecules (Attin et al, 2003, Dahl and
6
Pallesen, 2003, Suleiman, 2004, Kihn, 2007) or oxidizing some chemical components in the
chromophores (Joiner, 2006). This occurs via free radicals released from hydrogen peroxide
which are strong oxidizing agents and include hydroxyl, perhydroxyl anions (Dahl and Pallesen,
2003, Joiner, 2006) superoxide anions, reactive oxygen and hydrogen peroxide anions (Dahl and
Pallesen, 2003). These smaller molecules result in a lightening effect of the teeth because they
reflect less light (Suleiman, 2004, Kihn, 2007). In alkaline conditions, perhydroxyl anions
generally carry out the bleaching process, while the free radicals are more important in neutral
and acidic conditions (Joiner, 2006).
H2O2 2HO. (hydroxyl radicals)
HO. + H2O2 H2O + HO2. (perhydroxyl radicals)
HO2. H+ + O2
. (superoxide anions)
2H2O2 2H2O + 2{O} 2H2O + O2
(reactive oxygen)
H2O2 H+ + HOO- (hydrogen peroxide anions)
The cleavage of hydrogen peroxide molecules is accelerated in the presence of heat, light or
lasers (Buchalla and Attin, 2007, Kihn, 2007). Heat increases the decomposition of hydrogen
peroxide by a factor of 2 for each 100C temperature rise (Joiner, 2006, Buchalla and Attin, 2007),
but due to the risk of pulpal death, the temperature should not exceed the critical threshold of
5.50C (Suleiman, 2005b, Buchalla and Attin, 2007). Light sources on the other hand cause lysis
of hydrogen peroxide by two mechanisms (Buchalla and Attin, 2007). First, the light is absorbed
by the bleaching agents and some of the energy is converted to heat (Buchalla and Attin, 2007).
Secondly, they can cause decomposition of hydrogen peroxide directly by excitation of the
whitening agent, photolysis (Joiner, 2006, Buchalla and Attin, 2007). Colourants may be mixed
into the formulations of the bleaching agents to increase the absorption of light (Joiner, 2006,
Buchalla and Attin, 2007). For example, carotene raises the absorption of blue light while small
silica particles, raise the absorption of infra-red light (Buchalla and Attin, 2007).
2. 3. 3 Bleaching Methods
Different methods are used to bleach vital and non-vital teeth and the success of the procedures
is influenced by the type of stain (Haywood, 1992, Suleiman, 2005a, Joiner, 2006), the ability of
7
the whitening agent to access the stain and the number of times it is in contact with the stain
(Dahl and Pallesen, 2003).
2. 3. 3. 1 Vital Tooth Bleaching
There are various methods available for the whitening of vital teeth, which vary in type and
concentration of the bleaching agent, mode of application, duration and method of activation
(Joiner, 2006, Kihn, 2007). Three basic methods are currently used; night-guard or at-home
bleaching, in-office or power bleaching and bleaching by means of over-the-counter (OTC)
products (Dahl and Pallesen, 2003, Joiner, 2006, Kihn, 2007).
2. 3. 3. 1. 1 Night Guard Vital Bleaching (NGVB)
This method of bleaching renewed the interest of the population in tooth whitening (Haywood,
1992). It was found to be cheaper and safer than the modes employed before 1989 (Haywood,
1992, Suleiman, 2005a). Now, a larger section of the population was able to access this
appearance enhancing technique (Haywood, 1992, Burrell, 1997). It is currently the most popular
bleaching method available (Perdigao et al, 2004, Christensen, 2005, Suleiman, 2005a) and is
highly successful (Haywood, 1992, Perdigao et al, 2004, Suleiman, 2005a, Kihn, 2007).
Night guard vital bleaching generally utilizes 10% carbamide peroxide, which is equivalent to
about 3% hydrogen peroxide (Haywood, 1992). However, products are available with
concentrations of carbamide peroxide ranging from 5% to as high as 36% and hydrogen peroxide
from 6% to 15% (Kihn, 2007). This is a dentist-prescribed/home applied technique where the
patient wears a custom-fabricated tray filled with the bleaching agent for a period of time
(Haywood, 1992, Perdigao et al, 2004, Suleiman, 2005a, Joiner, 2006, Kihn, 2007). Some
advocate for twice daily use for 30 minutes for up to 6 weeks (Kihn, 2007) while others for
overnight use for 2 or 3 weeks (Haywood, 1992, Suleiman, 2005a, Joiner, 2006).
The dental staff is able to monitor the bleaching process, thereby preventing over whitening of
the teeth. However, there are times when patients buy carbamide or hydrogen peroxide from
shops and continue to bleach their teeth after the process has been discontinued by the dental
professional resulting in unnaturally white teeth with surrounding restorations now appearing too
dark (Christensen, 2005). Nightguard vital bleaching requires compliance from the patient for
8
optimal results to be achieved and this is often seen as a disadvantage (Suleiman, 2005a, Kihn,
2007).
2. 3. 3. 1. 2 In-office Bleaching
This method of bleaching is popular with patients who desire quick results, lack compliance for
the at-home remedies (Shethri et al, 2003, Perdigao et al, 2004, Buchalla and Attin, 2007, Kihn,
2007) or simply require one discolored tooth to be whitened (Goldstein, 1997, Sarrett, 2002,
Suleiman, 2005b, Buchalla and Attin, 2007). High concentrations of the whitening agents are
used (Sarrett, 2002, Dahl and Pallesen, 2003, Suleiman, 2005b, Joiner, 2006, Buchalla and Attin,
2007, Kihn, 2007) ranging from 17% to 50% hydrogen peroxide (Suleiman, 2005b). It therefore
necessitates the use of rubber dam isolation or paint-on gingival barriers to protect the soft
tissues (Sarrett, 2002, Perdigao et al, 2004, Suleiman, 2005b, Joiner, 2006, Buchalla and Attin,
2007, Kihn, 2007).
In-office bleaching, as the name suggests is carried out in the dentist’s clinic. It is time
consuming because rarely are satisfactory results obtained in just one appointment. The patient
has to undergo several appointments with two or more applications of the bleach per session
(Perdigao et al, 2004, Suleiman, 2005b, Joiner, 2006, Buchalla and Attin, 2007, Kihn, 2007). It
is also a costly procedure (Suleiman, 2005b, Kihn, 2007). To reduce the chair time used, and
optimize on the final result, in-office bleaching may be used to initiate the whitening process,
followed by the patient using nightguard vital bleaching for a few days (Goldstein, 1997, Shethri
et al, 2003, Suleiman, 2005b, Buchalla and Attin, 2007, Kihn, 2007).
The bleaching process may be accelerated by heat, light or laser (Suleiman, 2005b, Joiner, 2006,
Buchalla and Attin, 2007, Kihn, 2007). Light sources include plasma arc light emitting diodes,
argon lasers and xenon-halogen lamps (Suleiman, 2005b, Buchalla and Attin, 2007, Kihn, 2007).
This has not been found to significantly increase the rate of hydrogen peroxide decomposition
due to the fact that only a limited rise in temperature is permitted, so as to spare the pulp from
permanent damage (Perdigao et al, 2004, Joiner, 2006, Buchalla and Attin, 2007). The clinical
studies on the benefits of light activation have been controversial and further testing is required
to give a firm statement on whether or not this form of accelerating in-office bleaching is at all
necessary (Joiner, 2006, Buchalla and Attin, 2007, Kihn, 2007).
9
Recently, chemically activated in-office bleaching agents have become available (Goldstein,
1997, Perdigao et al, 2004, Suleiman, 2005b). The chemical catalyst is added to the hydrogen
peroxide just prior to its use resulting in rapid bleaching. No other form of activation is necessary
with these systems (Perdigao et al, 2004, Suleiman, 2005b).
Ultrasonically activated bleaching systems have been introduced in the UK, utilizing 6% – 7.5%
hydrogen peroxide. It is a quick procedure which only requires two cycles of 5 minutes each to
achieve the whitening effect. It is thought that the ultrasonic energy results in the production of
more free radicals (Suleiman, 2005b)
2. 3. 3. 1. 3 Over-the-counter Bleaching Agents (OTC)
Whitening strips were introduced in 2000, and like nightguard vital bleaching agents, were
widely available to the public. They are self-prescribed, easy to use systems (Gerlach, 2004).
Hydrogen peroxide gel is delivered and held against the teeth by flexible polyethylene strips
(Sarrett, 2002, Gerlach, 2004, Kihn, 2007). They took the world by storm and within just a few
months of production, the distribution of Crest White strips, one of the commercially available
products, sold millions of kits (Gerlach, 2004). The concentration of the hydrogen peroxide gel is
as low as 5.3% and 6.5% in the original strips (Gerlach, 2004, Perdigao et al, 2004), compared to
the newer products which contain 14% (Gerlach, 2004). Two whitening strips are used each day,
for 30minutes each, over a period of 2 to 3 weeks (Gerlach, 2004, Perdigao et al, 2004, Joiner,
2006).The latter products are said to result in faster, safer and more efficient whitening than
other professionally prescribed whitening agents with similar or higher concentrations of
hydrogen peroxide (Gerlach, 2004).
Little research has been carried out on these products therefore their long term side effects are
yet to be established (Sarrett, 2002, Kihn, 2007). They tend to be abused by the population with
over-bleaching being the final result at the best (Christensen, 2005) and bleaching undiagnosed
pathologies such as caries, at the worst (Sarrett, 2002). There have been reports of damage to
enamel with long term use of these products (Sarrett, 2002).
Whitening kits that are supplied with prefabricated trays are also available. These may present
problems of ill-fitting trays. Bleaching results with the use of these trays have not been consistent
(Kihn, 2007).

10
2. 3. 3. 1. 4 Other Methods
Other methods of whitening teeth include dentifrices which contain mild abrasives and some also
have low concentrations of hydrogen peroxide added (Sarrett, 2002, Kihn, 2007), and paint-on
liquids (Perdigao et al, 2004, Kihn, 2007). The toothpastes basically remove surface stains from
teeth and cannot be used to treat intrinsic discolourations (Sarrett, 2002). The paint-on liquids
are currently available as 18% carbamide peroxide or 19% sodium percarbonate systems. As
with whitening strips, supporting clinical studies are few, but have so far shown them to be
effective (Perdigao et al, 2004).
2. 3. 3. 2 Non-vital Tooth Bleaching
Discoloured teeth to be bleached using the non-vital bleaching technique have to be well
obturated and have healthy periodontal tissues, to prevent the bleaching material from leaking
into the peri-apical region (Attin et al, 2003, Dahl and Pallesen, 2003, Suleiman, 2005a, Tredwin
et al, 2006). Three techniques have been described; the walking bleach, the thermocatalytic and
the “inside-outside” techniques (Suleiman, 2005a).
2. 3. 3. 2. 1 Walking Bleach Technique
Either 30% hydrogen peroxide on its own or mixed with sodium perborate or water may be used
(Friedman, 1997, Attin et al, 2003, Suleiman, 2005a). The bleaching agent is sealed into the pulp
chamber and left in-situ for up to 2 weeks. The whitening process is repeated until the tooth is
satisfactorily whitened (Friedman, 1997, Sarrett, 2002, Attin et al, 2003, Dahl and Pallesen,
2003, Suleiman, 2005a, Tredwin et al, 2006), but, if no appreciable change is noticed after 3
appointments, another method needs to be employed to treat the discoloured tooth (Dahl and
Pallesen, 2003).
2. 3. 3. 2. 2 Thermocatalytic Technique
In this method, 30% to 35% hydrogen peroxide gel is used, with the application of light
(Suleiman, 2005a) or heat to accelerate the cleavage of the hydrogen peroxide (Friedman, 1997,
Suleiman, 2005a). In between visits, the walking bleach technique is employed (Friedman, 1997,
Suleiman, 2005a).
11
2. 3. 3. 2. 3 “Inside-outside” Technique
Liebenberg described a modification of the walking bleach technique (Liebenberg, 1997, Dahl
and Pallesen, 2003) where the patient uses 10% carbamide peroxide in a prepared pulp chamber,
which they change on their own every 2 hours until the desired results are obtained. A splint
keeps the whitening agent in place in the intracoronal access cavity, and it is also loaded with the
bleach for extracoronal whitening (Liebenberg, 1997, Suleiman, 2005a). The access cavity stays
open during the treatment (Liebenberg, 1997, Suleiman, 2005a, Dahl and Pallesen, 2003) and the
patient is advised not to chew on the tooth until the end of the treatment (Liebenberg, 1997,
Suleiman, 2005a). In as much as this method reduces both the concentration and duration of the
treatment, it carries the risk of endodontic failure, ingestion of bleaching material and additional
discolouration from foods and drinks ingested (Dahl and Pallesen, 2003). Patient compliance and
manual dexterity is called upon for this treatment to be successful (Suleiman, 2005a).
The long-term efficacy of bleaching non-vital teeth is low, and after a few years, the procedure
has to be repeated and more so when sodium perborate is used instead of hydrogen peroxide
(Friedman, 1997).
2. 3. 4 Adverse Effects of Bleaching
Tooth sensitivity, gingival irritation (Dahl and Pallesen, 2003, Suleiman, 2005a, Tredwin et al,
2006) and changes to enamel surfaces all occur with vital tooth bleaching, with tooth sensitivity
occurring commonly. These adverse reactions are especially apparent with high concentrations
of hydrogen and carbamide peroxide (Dahl and Pallesen, 2003, Tredwin et al, 2006). It has been
suggested that patients with pre-existing tooth sensitivity are more likely to suffer from this side
effect (Dahl and Pallesen, 2003) and should be treated with a desensitizing agent prior to
bleaching (Suleiman, 2005a). In-office power bleaching is especially implicated in tooth
sensitivity (Dahl and Pallesen, 2003, Tredwin et al, 2006). It is thought that bleaching agents
penetrate enamel and dentine to reach the pulp (Dahl and Pallesen, 2003, Tredwin et al, 2006).
Patients can undergo treatment for a couple of weeks by wearing a splint with fluoride, prior to
bleaching to minimize sensitivity (Suleiman, 2004). Soft tissues should always be protected
during the whitening process even when low concentrations of the bleaching agent are used.
Whitening strips may therefore not be the best option in this regard (Dahl and Pallesen, 2003).

12
These symptoms have however been shown to be transient, and disappear when the treatment is
discontinued or concluded (Dahl and Pallesen, 2003, Suleiman, 2005a).
The surface hardness and fracture toughness of dentine and enamel has been shown to be
reduced, as well as changes in their histological and chemical composition, following bleaching,
but these changes are not clinically significant (Attin et al, 2004, Joiner, 2007) and have been
attributed more to the pH of the whitening agent, than from the agent itself (Suleiman, 2004).
Some patients have reported a metallic taste in the mouth in the morning after using the night
guard vital bleaching technique, but this taste disappears 2 hours after removing the trays from
the mouth (Suleiman, 2005a).
The use of 30% hydrogen peroxide with the thermocatalytic technique is discouraged because
cervical root resorption is a possible adverse effect (Friedman, 1997, Attin et al, 2003, Dahl and
Pallesen, 2003, Tredwin et al, 2006). As such, a sodium perborate and water mixture is preferred
and in severe cases of discolouration (Friedman, 1997, Attin et al, 2003, Dahl and Pallesen,
2003), 3% hydrogen peroxide may replace the water (Attin et al, 2003). The lightening effect
with 30% hydrogen peroxide or sodium perborate mixed with 3% hydrogen peroxide or water
seems to produce the same results after bleaching (Dahl and Pallesen, 2003, Tredwin et al,
2006). Liebenberg also suggested application of catalase to the bleached surfaces immediately
after bleaching, rendering the whitening agent inactive, thereby minimizing the risk of cervical
root resorption (Liebenberg, 1997).
2. 3. 5 Effects of Bleaching Agents on Restorations
Several in-vitro studies have been carried out on the effects of whitening agents on the properties
of composite resin restorations. However, results have been conflicting as pertains to surface
hardness. Some of the studies show a decrease (Okte et al, 2006) and others no change after
bleaching (Turker and Biskin, 2003, Schemehorn et al, 2004). Surface porosities were shown to
be increased after application of bleaching agents (Turker and Biskin, 2003). Bond strength
between enamel and composite resins is reduced in the period immediately after bleaching. It is
thought to be caused by inhibition of polymerization of the resin by remnants of oxygen in the
tooth structure (Spyrides et al, 2000, Lai et al, 2002, El-din et al, 2006). The tags formed in
bleached enamel after acid etching are shallow and lack definition (El-din et al, 2006). It is
recommended that definitive resin based restorations are not placed immediately after bleaching
13
(Dahl and Pallesen, 2003, Tredwin et al, 2006). The change of colour of resin restorations after
bleaching will be discussed later in the review.
Bonding of glass ionomers to bleached dentine is also compromised immediately after the
whitening process (Spyrides et al, 2000). It has also been suggested that bleaching agents
dissolve glass ionomer and other cements (Swift et al, 1999) and increase their surface roughness
(Turker and Biskin, 2003).
Mercury and silver have been shown to be released from amalgam during bleaching, and this
increases with higher concentrations of the whitening agent (Rotstein et al, 2000). Oxidation of
the material by bleaching agents has been implicated in the “greening” seen at the margins of
amalgam restorations after tooth whitening (Haywood, 2002).
2. 4 COMPOSITE RESINS
Composite resins are the most aesthetic direct restorative material currently available (Bayne,
2000, ADA Council on Scientific Affairs, 2003). They have greatly evolved since they were
introduced in the 1940s, to not only be used on anterior teeth, but on all classes of cavities
(Bayne, 2000, ADA Council on Scientific Affairs, 2003, Garcia et al, 2006). Composite resins
are versatile materials that now even include packable and flowable composites, for just about
every clinical indication (Garcia et al, 2006, LeSage, 2007).
2. 4. 1 History
Composite resins were developed in the 1940s to replace the only tooth coloured materials in use
then, the silicates and acrylic resins (Anusavice, 2003, Garcia et al, 2006). Both these materials
underwent significant polymerization shrinkage and had high coefficient of thermal expansion
(Anusavice, 2003). Rafael Bowen, in the early 1960s developed the new composite resins with
bisphenol A-glycidyl methacrylate (bis-GMA) as the monomer (Anusavice, 2003, Garcia et al,
2006). This remains the basis of composite resins to date (Leinfelder, 2001) and it improved on
the drawbacks of acrylic resins (Anusavice, 2003, Garcia et al, 2006). Since then, composite
resins have undergone great improvements (Anusavice, 2003, ADA Council on Scientific
Affairs, 2003, Garcia et al, 2006) with the production of diverse materials which can be used for
a variety of therapeutic situations (Garcia et al, 2006). Initially, the composite resins available
were chemically cured but in the 1970s, light cured composite resins became available
14
commercially, thereby improving on the colour stability and eliminating the shortcomings of
hand-mixed materials such as proportioning (Garcia et al, 2006). During the same period, the
world started shifting towards composite restorations, even in the posterior region, as the safety
of amalgam continued to be questioned and patients’ preference for more aesthetic materials
increased (Anusavice, 2003, ADA Council on Scientific Affairs, 2003). By the late 1990s, the
number of composite resin restorations placed in the posterior region was greater than amalgam
restorations (ADA Council on Scientific Affairs, 2003). Composite resins have been said to be
the material most likely to replace amalgam in the future as a restorative material (Bayne, 2000).
2. 4. 2 Composition
Composite resins are basically made up of three main components; the organic matrix, inorganic
fillers and silane coupling agents (Anusavice, 2003, ADA Council on Scientific Affairs, 2003,
Garcia et al, 2006).
2. 4. 2. 1 Organic Matrix
The organic matrix consists of the monomer bis-GMA, with or without urethane dimethacrylate
(UDMA) (Anusavice, 2003, Garcia et al, 2006, LeSage, 2007). Its aromatic structure increases
the compressive strength and stiffness of the material and at the same time reduces the
absorption of water (LeSage, 2007). This resin is highly viscous, therefore low molecular weight
monomers such as triethylene glycol dimethacrylate (TEGDMA) are added as diluents
(Anusavice, 2003, Garcia et al, 2006). Their low molecular weight increases polymerization
shrinkage of the composite, so they must be used with care (Anusavice, 2003).
An activator-initiator system is also found within the organic matrix, which releases free radicals
that facilitate the polymerization reaction (Anusavice, 2003, Garcia et al, 2006). Light cured
composite resins have camphoroquinone as the initiator using blue light of about 470nm
wavelength to release free radicals. Self cured composite resins on the other hand contain an
aromatic tertiary amine for this purpose (LeSage, 2007).
An inhibitor within the organic matrix prevents auto-polymerization of the material when it is in
storage (Anusavice, 2003, Garcia et al, 2006) and ultra-violet light absorbers are included in the
organic phase to stabilize the colour of the set restoration over time (Garcia et al, 2006).
15
2. 4. 2. 2 Inorganic Fillers
The filler component is responsible for the physical and mechanical properties of the composite
resin. A higher filler load is desirable as this reduces polymerization shrinkage and the
coefficient of thermal expansion and improves the aesthetics and strength of the restoration
(ADA Council on Scientific Affairs, 2003, Garcia et al, 2006). Filler particles are produced by
grinding quartz or glass (Anusavice, 2003), and they range in size from 25nm to 100 µm
(Anusavice, 2003, Garcia et al, 2006). Composites are classified according to the size of the
primary filler particles they contain (ADA Council on Scientific Affairs, 2003, Garcia et al,
2006), which determine the properties of the materials (Anusavice, 2003, ADA Council on
Scientific Affairs, 2003, Garcia et al, 2006). There are macrofilled, microfilled, hybrid and
nanofilled composites. The majority of composites are hybrid composites and these can be used
both anteriorly and posteriorly as restorative materials (Garcia et al, 2006). Hybrids using
optimal size particles were later developed that have better finish than the conventional hybrids
and are as highly filled (Wakefield and Kofford, 2001). Recently, nanocomposites were
introduced which give excellent aesthetics and maintain the glossiness of the restorations over
time. They also have high filler loads, and are therefore strong and wear away less than hybrids.
These are also used in both the anterior and posterior regions of the mouth (Mitra et al, 2003,
Sadowsky, 2006).
The composite resin used in this study is Filtek Supreme XT. It is a nanofilled material. “Nano”
is adopted from the Greek work meaning dwarf (Saravana and Vijayalakshmi, 2006) hence
nanotechnology or molecular engineering is the production of materials using tiny structures
ranging between 0.1 and 100 nanometers (Mitra et al, 2003). This is equivalent to a billionth of a
meter (Mitra et al, 2003, Saravana and Vijayalakshmi, 2006) or a thousandth of a micrometer
(Mitra et al, 2003). This technology is currently creating waves in science (Mitra et al, 2003,
Saravana and Vijayalakshmi, 2006) resulting in materials that are much improved in electrical,
chemical, mechanical and optical characteristics (Mitra et al, 2003).
Filtek supreme XT was manufactured to combine the aesthetics of microfilled composites, with
the strength and durability of hybrid composites (Mitra et al, 2003). It was introduced to the
market in October 2002 (Baseren, 2004) and contains silica nanoparticles ranging between 5 and
20 nm and loosely bound zirconia/silica nanoclusters measuring 0.6 to 1.4 µm (Baseren, 2004,

16
Villalta et al, 2006). The filler loading of Filtek Supreme XT is 78.5% by weight (Baseren, 2004)
due to the packing of nanoparticles between the nanoclusters (3M ESPE, Filtek Supreme
Technical Product Profile, 2005). This was supposed to be a truly universal composite restorative
material, which at the time no material fulfilled (Mitra et al, 2003). The manufacture of its filler
particles uses the bottom-up approach, a move away from the top-down technique that was
previously used with other composite resins (Mitra et al, 2003, Saravana and Vijayalakshmi,
2006). Traditionally, composite resin fillers are produced from larger particles that are milled to
smaller ones. This process cannot produce particles of less than 100nm (Mitra et al, 2003). Filtek
Supreme XT starts off with synthetically manufactured nanofillers of 25nm for the regular
shades and 75nm for the translucent shades (3M ESPE, Filtek Supreme Technical Product
Profile, 2005) as shown in the scanning electron micrograph in figure 2.1.
Figure 2.1: Nano-sized filler particles in Filtek Supreme XT (3M ESPE, Filtek Supreme Technical Product Profile, 2005).
This produces a highly aesthetic restorative material which lacks adequate handling and physical
properties. 3M ESPE then introduced an innovative way to maximize on their strength and
aesthetics by aggregating these particles into nanoclusters (Mitra et al, 2003, 3M ESPE, Filtek
Supreme Technical Product Profile, 2005, Saravana and Vijayalakshmi, 2006). The nanoparticles
fill the interstitial spaces between the nanoclusters, resulting in a highly filled material (Mitra et
al, 2003, Attar, 2007).
17
Its organic matrix consists of bis-GMA, bis-EMA (bisphenol A polyethylene glycol diether
dimethacrylate), UDMA and small amounts of TEGDMA to reduce the viscosity of the resin
(3M ESPE, Filtek Supreme Technical Product Profile, 2005, Villalta et al, 2006).
One of the great advantages of Filtek Supreme XT is that it achieves and maintains a high polish.
This is enabled by the mode of wear that this restorative material undergoes; individual
nanoparticles of 25 nm or less break off their surfaces and not the larger nanoclusters (Mitra et
al, 2003, 3M ESPE, Filtek Supreme Technical Product Profile, 2005). This results in defects that
are smaller than the wavelength of light, hence cannot be detected by the human eye (Mitra et al,
2003). It is said to have flexural, compressive and diametral strength and fracture toughness
comparable to hybrids due to its high filler loading (Mitra et al, 2003, 3M ESPE, Filtek Supreme
Technical Product Profile, 2005) and has good handling characteristics (Mitra et al, 2003). The
nanoparticles are small enough to allow light to go through them resulting in highly translucent
materials and when combined with nanoclusters, become opaque resins. They therefore come in
a wide range of shades (Mitra et al, 2003).
2. 4. 2. 3 Coupling Agents
Coupling agents are used to bond the organic and inorganic phases of composite resins
(Anusavice, 2003, Garcia et al, 2006, LeSage, 2007). They are mainly organosilanes which coat
the filler particles (Anusavice, 2003). The silane group at one end forms an ionic bond with the
filler and a methacrylate group at the other end bonds covalently with the organic resin
(Anusavice, 2003, Garcia et al, 2006). Coupling agents transmit the stresses from the matrix to
the filler particles (Anusavice, 2003).
2. 4. 3 Discolouration of Composites
The major developments that have gone into composite resins and bonding systems have resulted
in highly aesthetic restorations, but their success has been hampered by discolouration (Patel et
al, 2004, Villalta et al, 2006, Sarac et al, 2006), which remains one of the main reasons for their
replacement (Buchalla et al, 2002, Schulze et al, 2003, Villalta et al, 2006). Discolouration of
composites can be caused by intrinsic and extrinsic factors (Schulze et al, 2003, Patel et al, 2005,
Villalta et al, 2006).
18
2. 4. 3. 1 Intrinsic Staining
Intrinsic staining occurs as a result of changes within the restoration itself (Villalta et al, 2006). It
is the more important of the two main types of staining because it involves all the layers of the
restoration and cannot be eliminated by polishing as most extrinsic stains can (Kolbeck et al,
2006). These colour changes could be due to the type of monomer and other constituents of the
composite resin, the filler content, degree of polymerization and the effect of moisture and heat
on the materials (Buchalla et al, 2002, Patel et al, 2004, Villalta et al, 2006, Sarafianou et al,
2007).
Composite resins, in the oral environment absorb water which is thought to occur via the matrix-
filler interface (Buchalla et al, 2002, Vichi et al, 2004, Patel et al, 2004, Villalta et al, 2006).
This causes darkening of these restorations over time (Buchalla et al, 2002, Patel et al, 2004,
Villalta et al, 2006, Sarafianou et al, 2007), due probably to the difference in the scattering of
light as a result of degradation of the silane-coupling agent (Vichi et al, 2004, Sarafianou et al,
2007). This process has been suggested to be the carrier for extrinsic stains from chromogenic
foods and beverages into the restorations (Schulze et al, 2003, Bagheri et al, 2005). Water too is
responsible for the leaching of monomers possibly also resulting in colour changes (Okte et al,
2006, Villalta et al, 2006, Sarafianou et al, 2007). The resins that include hydrophilic monomers
such as TEGDMA show higher water sorption with greater colour changes in the restorations,
compared to those that do not contain hydrophilic monomers (Imazato et al, 1999, Bagheri et al,
2005, Sarafianou et al, 2007). A 0 to 1% increase of TEGDMA in bis-GMA based composite
resins, increases the water sorption by 3 to 6% (Bagheri et al, 2005). UDMA is less hydrophilic
than both TEGDMA and bis-GMA, therefore products containing more UDMA are less
susceptible to discolouration by extrinsic stains than those that do not (Turkun and Turkun, 2004,
Bagheri et al, 2005). It has also been shown that higher temperatures cause more rapid diffusion
of water through the composite resins (Imazato et al, 1999, Vichi et al, 2004, Sarafianou et al,
2007).
Surface roughness of composite resins increases in wet environments due to the leaching of
monomers leaving filler particles standing proud (Schulze et al, 2003, Villalta et al, 2006). This
reduces the glossiness of restorations with time, due to the scattering of light (Schulze et al,
2003). The size of the filler particle that a composite resin contains is thought to affect the
19
stability of its optical properties. Microfilled and nanofilled composite resins are highly
polishable and are able to maintain these smooth surfaces over time because small individual
filler particles are plucked from their surfaces during wear, resulting in defects that are smaller
than the wavelength of light (Mitra et al, 2003). It has been suggested that microfilled
composites have greater matrix-filler interface area and should therefore discolour more than
hybrids, but the opposite was found to be the case by Buchalla et al (2002). Vichi et al (2004)
also found this to be true and concluded that composite resins with larger filler particle size were
more susceptible to water sorption, and hence, optical changes.
Composite resins tend to yellow over time and camphoroquinone, the photoinitiator, has been
implicated (Seghi et al, 1990, Kolbeck et al, 2006, Sarafianou et al, 2007). Seghi et al (1990)
and Buchalla et al (2002) found that there was a shift in the chroma of composite resins after
curing, when the initiator, camphoroquinone, is depleted and is therefore no longer absorbing
blue light, but reflecting it. This is accompanied by either an increase or decrease in translucency
of the restorations (Lee et al, 2005). Ferracane et al (1985) showed that ultra-violet irradiation
caused yellowing of composite resins. They thought that the chemical activator, initiator,
inhibitor and monomer of self-cured composite resins all played a role in this colour change.
However, they found that composites yellowed even when they were polymerized under intense
heat, without the addition of activators and initiators, suggesting that the resin itself was more
important in colour stability than the other materials (Ferracane et al, 1985). They hypothesized
that vinyl groups within the organic matrix are oxidized giving off coloured peroxides (Ferracane
et al, 1985, Kolbeck et al, 2006). The tertiary aromatic amines, which are the accelerators found
in the organic matrix (Schulze et al, 2003, Sarafianou et al, 2007), too have been implicated in
discolouration of composite resins. They are thought to give off photo-reactive chromatic by-
products when composite resins are exposed to heat or light (Sarafianou et al, 2007). Several
other researchers have tried to explain this yellowing of composite resins when exposed to UV
light, with some suggesting that residual free radicals from camphoroquinone are remobilized
(Kolbeck et al, 2006, Sarafianou et al, 2007), while others postulating that chemical bonds are
broken in UV-light (Kolbeck et al, 2006). Kolbeck et al (2006) thought unreacted
camphoroquinone gave resin-based composites their yellow colour over time. It is notable that
all the above theories name the organic matrix as responsible for the colour changes in the
composite resins (Kolbeck et al, 2006).
20
The degree of conversion of monomer to polymer is important to the colour stability of
composite resins as shown by the higher level of discoloration of self-cured resins compared to
light polymerized resins (Schulze et al, 2003). This may also be brought about by inadequate
curing due to insufficient light output from a curing unit, reduced curing time or depth of cure
(Usumez et al, 2005). This determines the amount of unreacted components that remain in the
resin post-cure (Kolbeck et al, 2006). It is said, that composite resins containing 35% and more
of unreacted carbon-carbon double bonds, are prone to colour changes (Sarafianou et al, 2007)
probably by their oxidation within in the polymer, resulting in coloured peroxides (Ferracane et
al, 1985, Imazato et al, 1999, Buchalla et al, 2002, Sarafianou et al, 2007). Physical properties,
including water sorption and colour stability are affected by inadequate curing (Usumez et al,
2005). The varied degree of polymerization is a possible explanation for the difference in colour
change found by Usumez et al (2005) after curing composite resins with different types of curing
units and storing them.
2. 4. 3. 2 Extrinsic Staining
Extrinsic staining occurs as a result of adsorption or absorption of chromogenic foods, beverages
and other substances taken into the mouth (Villalta et al, 2006). Intake of chromogenic beverages
such as tea and coffee, as well as habits like tobacco smoking, cause staining of resin-based
composites through the matrix-filler interface during the water sorptive process (Patel et al,
2004, Villalta et al, 2006). Adsorption of stains occurs on the surface of composite resins
(Turkun and Turkun, 2004) via the accumulation of chromogens in the salivary pellicle and
plaque (Omata et al, 2006).
Procedures such as finishing and polishing also affect the colour of composite restorations (Patel
et al, 2004, Lee et al, 2005, Bagheri et al, 2005, Sarac et al, 2006) and their stainability (Patel et
al, 2004, Bagheri et al, 2005, Sarac et al, 2006). Rough surfaces lead to plaque accumulation,
secondary caries and staining (Patel et al, 2004, Bagheri et al, 2005, Sarac et al, 2006). This is
especially true of composite resins that have larger filler particles. Polishing may result in loss of
the resin matrix leaving the larger filler particles protruding from the surface (Bagheri et al,
2005, Sarac et al, 2006). Composite resins with high gloss finishes are more resistant to extrinsic
staining (Mitra et al, 2003, Patel et al, 2004, Sarac et al, 2006).
21
Composite resins which polymerize under polyester strips have been shown to produce the
smoothest finishes, hence lowest surface roughness (Baseren, 2004, Patel et al, 2004, Bagheri et
al, 2005, Sarac et al, 2006, Attar, 2007). The oxygen inhibited layer found on the surfaces of
resins that have not been cured under polyester strips result in an incompletely polymerized
surface layer of resin (Rueggeberg and Margeson, 1990). Its presence on the surface of the
composite resins as well as in porosities enhances extrinsic discolouration of the material
(Schulze et al, 2003). Matrix strips eliminate this layer, resulting in a higher degree of
polymerization (Rueggeberg and Margeson, 1990). However, Patel et al (2004), in a study on the
stainability of filled and unfilled resin based composites, showed the greatest colour change was
found in composite resins that had been polymerized under polyester strips, compared to those
finished by other means. They thought that even though the oxygen inhibited layer was
eliminated, the degree of polymerization beneath the polyester strip was still less than that in the
body of the composite resin. They suggested that restorations polymerized under these strips
therefore needed to be polished by other means, for longevity and maintenance of aesthetics
(Patel et al, 2004). Other investigators have also found that composite resins finished off with
polyester strips were more susceptible to staining by chromogenic foods and beverages than
those finished off by other means and thought the rich resin layer found on their surfaces was
responsible for their increased stainability (Setcos et al, 1999, Bagheri et al, 2005, Okte et al,
2006).
Glazes have been used to cover composite resins, giving them a glossy finish. These are unfilled
resins that fill-in the defects on the surface of composite restorations created after finishing and
polishing procedures (Doray et al, 2003, Sarac et al, 2006). They serve the duo purpose of
increasing resistance of the restoration to abrasion and as well as staining (Sarac et al, 2006).
However, they have been shown to be removed after tooth brushing, thereby not fulfilling their
intended purposes (Doray et al, 2003). Recently, a surface sealant for covering composite resin
restorations has been introduced. This is a light-cured liquid polish system that polymerizes
without leaving an oxygen inhibited layer at the surface (Attar, 2007). It has been shown to
confer on the surface of the composite restoration, a surface with Mylar strip-like smoothness
(Attar, 2007).

22
2. 3. 3. 3 Internalized Staining
Discolouration of composite resins may also occur by incorporation of stains into the substance
of the material (Turkun and Turkun, 2004, Kolbeck et al, 2006, Lee and Powers, 2007).
Degradation or changes in the components of composite resins may facilitate this process
(Schulze et al, 2003, Turkun and Turkun, 2004). Alcohol, for instance, has been shown to soften
the organic matrix of these restorations, rendering them susceptible to discolouration (Patel et al,
2004, Bagheri et al, 2005). This results in the penetration of chromogens into the sub-surface
area of the material (Turkun and Turkun, 2004, Kolbeck et al, 2006, Lee and Powers, 2007) and
is referred to as internalized staining (Kolbeck et al, 2006, Lee and Powers, 2007). Unreacted
monomer or initiators may readily take up hydrophilic colourants from ingested substances
resulting in this type of discolouration (Kolbeck et al, 2006).
2. 4. 4 Effect of Bleaching Agents on the Colour of Composite Restorations
It has been hypothesized that tooth whitening agents cause colour changes in composite resins
through oxidation by free radicals, of the amine compounds in the organic matrix (Monaghan et
al, 1992a). Kim et al (2004) echoed these sentiments, but went on to postulate that the coupling
agent may be degraded with a shift of stain accumulation to the matrix-filler interface. Other
authors believe that the bleach undergoes a chemical reaction with the unreacted monomer in the
composite resin (Monaghan et al, 1992a, Buchalla et al, 2002, Rosentritt et al, 2005). The
monomer composition and type and amount of filler, are thought to influence the degree of
lightening that bleaching agents may cause in dental composite resins (Monaghan et al, 1992a,
Rosentritt et al, 2005).
Studies on the effects of bleaching systems on the colour of composite resins have been few
(Turkan and Turkan, 2004, Rosentritt et al, 2005). Monaghan et al (1992a) showed, in-vitro, that
composite resins lighten in shade after simulated in-office vital bleaching accelerated by heat.
They suggested that this may be a way to remove stains from these restorations. In another study,
they found the colour changes in composite resins produced by a carbamide peroxide home
bleaching kit were so small, that they could only be detected using a Minolta chroma meter
(Monaghan et al, 1992b). Cullen et al (1993) studied the effect of 10% carbamide peroxide and
30% hydrogen peroxide on the tensile strength of composite resins. They exposed the samples to
the bleaching agents continuously for a week and observed that the samples lightened
23
considerably with the 30% hydrogen peroxide. These changes could be readily seen with the
naked eye. Canay and Cehreli (2003), published results of a study carried out, in-vitro, to
compare the effect of 10% hydrogen peroxide and 10% carbamide peroxide on composite resins.
They showed that 10% hydrogen peroxide lightened all the composite resins tested, and the
changes were noticeable, even to the naked eye, but the changes produced by 10% carbamide
peroxide were slight, except in the polyacid modified composite resins. Kim et al (2004)
evaluated the effect of tooth-whitening strips and films on the colour of microfilled and
nanofilled resin composites. They found that the colour changes produced were clinically
insignificant. Rosentritt et al, (2005) studied the effect of different bleaching systems on the
colour, hardness and surface roughness of various composite materials. They included bovine
enamel in their experiment as it approximated human enamel in composition and structure. The
colour difference by all the whitening agents was greatest on the bovine enamel than on the
composite resins tested. They also found that the polyacid modified resins as well as the
microfilled composite resins showed the greatest colour changes when investigating the
influence of different concentrations of hydrogen peroxide in various bleaching systems, on a
variety of composite resin materials. All the composite resins tested showed discolouration when
a high concentration of hydrogen peroxide was used. This study also showed that the surface
roughness of dental composite resins increased after they were subjected to the various bleaching
agents (Rosentritt et al, 2005). Yalcin and Gurgan (2005) evaluated the effect of 10% carbamide
peroxide and 6.5% hydrogen peroxide on the gloss of a flowable and a packable composite resin
and an ormocer and found the gloss to be significantly reduced in all tested samples. They
observed that the gloss decrease was indirectly proportional with the size of the filler particles in
the composite restorations. Fay et al (1999) stained tooth coloured restorative material samples
with cranberry juice, tea or chlorhexidine and found that tooth whiteners removed extrinsic stains
from the composite resins and the hybrid ionomers, but not from the compomers. Turkun and
Turkun (2004) exposed composite samples to tea and coffee then polished and bleached them,
effectively removing the surface stains. Similarly, Villalta et al (2006) also demonstrated that
bleaching agents remove stains from the surface of composite resins. They discoloured their
samples with coffee and red wine. Villalta et al (2006) suggested that whereas bleaching systems
effectively whitened teeth, they did not discolour composite resins, beyond removing their
exterior stains. These studies have been summarized in table 2.1.

24
Table 2.1: Summary of Studies on the Effect of Bleaching Agents on the Colour of Composite Resins.
Study Materials tested Stain Bleaching Agent Method Lightened
Monaghan et al, 1992a
Composites No 30% hydrogen peroxide In-office Yes
Monaghan et al, 1992b
Composites No Carbamide peroxide NGVB Yes
Cullen et al, 1993 Composites No 10% carbamide peroxide 30% hydrogen peroxide
1 week exposure
No Yes
Canay and Cehreli, 2003
Composites Compomers
No 10% hydrogen peroxide 10% carbamide peroxide
NGVB Yes
Kim et al, 2004 Composites No 3 & 6.5% hydrogen peroxide 18% carbamide peroxide 19% sodium perborate
OTC Yes
Rosentritt et al, 2005
Composites Compomers Ormocers
No 10 – 16% carbamide peroxide 35% hydrogen peroxide
NGVB In-office
Yes
Fay et al, 1999 Composite, Ionomer, Compomer
Yes 10% carbamide peroxide Paint-on Yes No
Turkun and Turkun, 2004
Composites Yes 15% hydrogen peroxide In-office Yes
Villalta et al, 2006 Composites Yes 16 and 18% hydrogen peroxide 35% hydrogen peroxide
Paint-on In-office
Yes
25
2. 5 COLOUR AND COLOUR MEASUREMENT
2. 5. 1 Colour Perception
There are about ten million colours that the human eye can detect (Brook et al, 2007) and they
are perceived when light falls on objects and is reflected to the eye (Derbabian et al, 2001,
Brewer et al, 2004, Joiner, 2004). Natural light is composed of a mixture of component bands
and falls between 380 and 770nm wavelength of the electromagnetic spectrum. Objects contain
pigments that absorb some parts of the light spectrum and reflect others, thereby producing the
sensation of colour (Brewer et al, 2004). The retina of the eye contains sensors, rods and cones
that respond to light. The cones which are 1 in every 20 of these sensors are responsible for the
perception of colour (Brewer et al, 2004). They are of three types; those sensitive to the primary
colours of light i.e. red, green and blue wavelength and they send signals to the brain for
recognition of the colour of objects (Fondriest, 2003, Brewer et al, 2004). The different
wavelengths are indistinguishable to the eye, but the dominant or an average wavelength is what
is then perceived (Fondriest, 2003). The rods, only register lightness of an object (Brewer et al,
2004). The perception of colour is dependent on the light source, the object being viewed and the
observer’s visual system. All these variables may change giving different descriptions of colour
for the same object (Joiner, 2004, Khurana et al, 2007).
2. 5. 2 Science of Colour
Colour was described in three dimensions by Albert Munsell (Fondriest, 2003). This allowed a
colour to be specifically defined in the colour space or coordinate system (Derbabian et al, 2001,
Brewer et al, 2004). The Munsell System’s three attributes are value, hue and chroma (Fondriest,
2003, Brewer et al, 2004, Joiner, 2004). The value refers to the lightness or brightness of an
object (Derbabian et al, 2001, Watts and Addy, 2001, Fondriest, 2003, Brewer et al, 2004,
Joiner, 2004). This is a measure on the grey scale with black at one extreme and white on the
other (Fondriest, 2003). An object with a low value is reflecting little light, such that more light
is either being absorbed, scattered or transmitted through it (Fondriest, 2003). Value is
considered the most important of the three attributes (Derbabian et al, 2001, Khurana et al, 2007)
as far as shade matching in dentistry is concerned and is the only one that can be measured
independently (Derbabian et al, 2001). Hue distinguishes one family of colours from another
(Derbabian et al, 2001, Watts and Addy, 2001, Fondriest, 2003, Joiner, 2004). It is the attribute
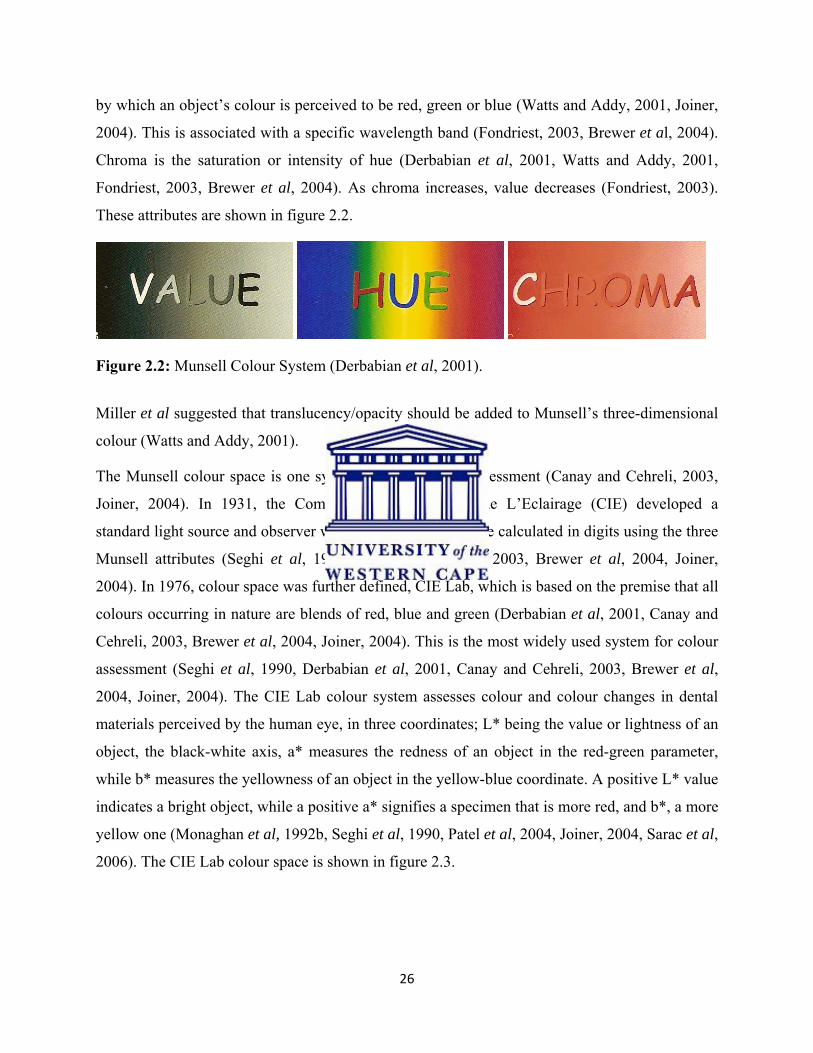
26
by which an object’s colour is perceived to be red, green or blue (Watts and Addy, 2001, Joiner,
2004). This is associated with a specific wavelength band (Fondriest, 2003, Brewer et al, 2004).
Chroma is the saturation or intensity of hue (Derbabian et al, 2001, Watts and Addy, 2001,
Fondriest, 2003, Brewer et al, 2004). As chroma increases, value decreases (Fondriest, 2003).
These attributes are shown in figure 2.2.
Figure 2.2: Munsell Colour System (Derbabian et al, 2001).
Miller et al suggested that translucency/opacity should be added to Munsell’s three-dimensional
colour (Watts and Addy, 2001).
The Munsell colour space is one system used for colour assessment (Canay and Cehreli, 2003,
Joiner, 2004). In 1931, the Commission Internationale de L’Eclairage (CIE) developed a
standard light source and observer which enabled colour to be calculated in digits using the three
Munsell attributes (Seghi et al, 1990, Canay and Cehreli, 2003, Brewer et al, 2004, Joiner,
2004). In 1976, colour space was further defined, CIE Lab, which is based on the premise that all
colours occurring in nature are blends of red, blue and green (Derbabian et al, 2001, Canay and
Cehreli, 2003, Brewer et al, 2004, Joiner, 2004). This is the most widely used system for colour
assessment (Seghi et al, 1990, Derbabian et al, 2001, Canay and Cehreli, 2003, Brewer et al,
2004, Joiner, 2004). The CIE Lab colour system assesses colour and colour changes in dental
materials perceived by the human eye, in three coordinates; L* being the value or lightness of an
object, the black-white axis, a* measures the redness of an object in the red-green parameter,
while b* measures the yellowness of an object in the yellow-blue coordinate. A positive L* value
indicates a bright object, while a positive a* signifies a specimen that is more red, and b*, a more
yellow one (Monaghan et al, 1992b, Seghi et al, 1990, Patel et al, 2004, Joiner, 2004, Sarac et al,
2006). The CIE Lab colour space is shown in figure 2.3.
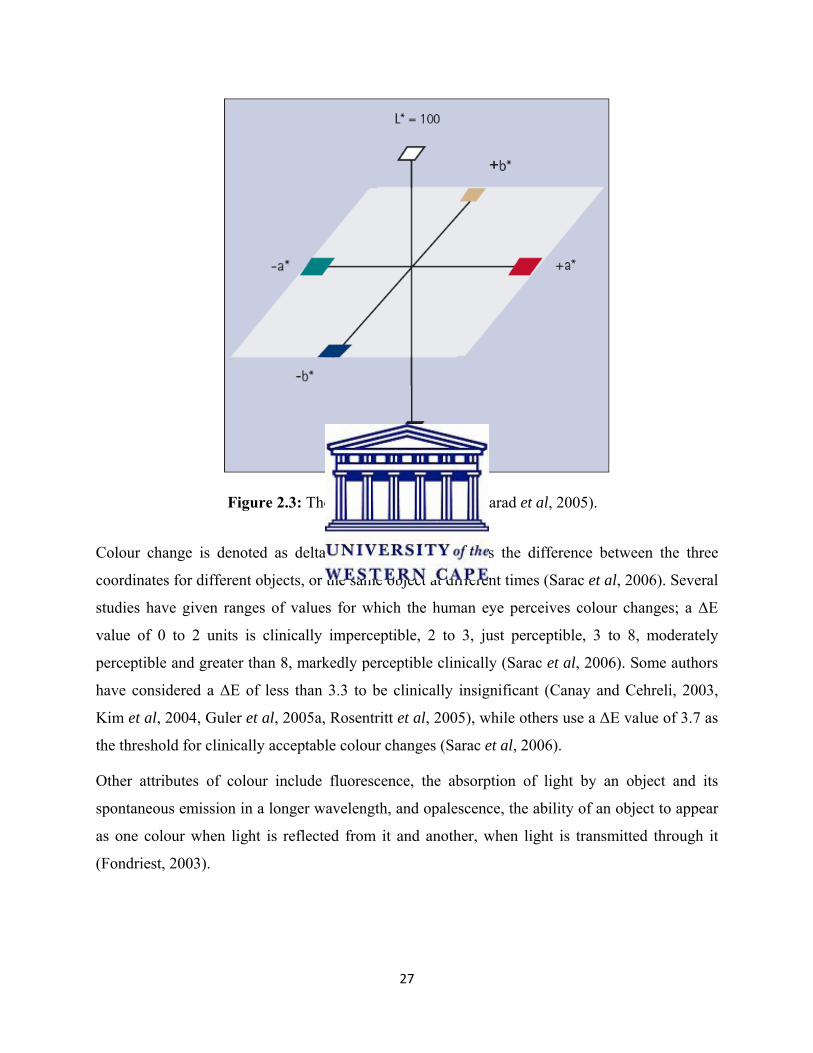
27
Figure 2.3: The CIE Lab colour space (Jarad et al, 2005).
Colour change is denoted as delta E (ΔE) and it expresses the difference between the three
coordinates for different objects, or the same object at different times (Sarac et al, 2006). Several
studies have given ranges of values for which the human eye perceives colour changes; a ΔE
value of 0 to 2 units is clinically imperceptible, 2 to 3, just perceptible, 3 to 8, moderately
perceptible and greater than 8, markedly perceptible clinically (Sarac et al, 2006). Some authors
have considered a ΔE of less than 3.3 to be clinically insignificant (Canay and Cehreli, 2003,
Kim et al, 2004, Guler et al, 2005a, Rosentritt et al, 2005), while others use a ΔE value of 3.7 as
the threshold for clinically acceptable colour changes (Sarac et al, 2006).
Other attributes of colour include fluorescence, the absorption of light by an object and its
spontaneous emission in a longer wavelength, and opalescence, the ability of an object to appear
as one colour when light is reflected from it and another, when light is transmitted through it
(Fondriest, 2003).
28
2. 5. 3 Colour Measurement
Currently, several methods exist for measuring tooth colour and colour changes after bleaching
in dentistry, ranging from visual to instrumental assessments (Joiner, 2004, Joiner, 2006, Brook
et al, 2007).
2. 5. 3. 1 Visual Techniques
2. 5. 3. 1. 1 Shade Guides
This visual method of assessing tooth colour is the most commonly used in dentistry (Joiner,
2004, Joiner, 2006, Brook et al, 2007). Shade guides are composed of sets of tooth shaped tabs
made either of porcelain (Joiner, 2004, Brook et al, 2007) or acrylic (Joiner, 2004) and are
supposed to cover the possible range of colour space occupied by natural teeth (Brook et al,
2007). Traditional shade guides did not adequately cover the colour space (Brewer et al, 2004,
Joiner, 2004, Park et al, 2006, Brook et al, 2007) as observed by several researchers (Brewer et
al, 2004, Brook et al, 2007). Furthermore, they were not arranged in a logical manner and
covered only 1-dimension of the colour space, namely from light to dark (Brewer et al, 2004,
Park et al, 2006). More recent shade guides are based on the Munsell colour system (Brewer et
al, 2004, Joiner, 2004, Park et al, 2006, Brook et al, 2007) such as the 3-D Master guide (Brewer
et al, 2004, Joiner, 2004, Park et al, 2006). It is more reliable in colour measurements since the
results are repeatable (Brewer et al, 2004, Joiner, 2004, Park et al, 2006).
This method, although subjective, has been employed in several longitudinal tooth whitening
studies (Joiner, 2004, Joiner, 2006, Brook et al, 2007). It is an easy and quick method to use, but
has numerous disadvantages; inter-operator variation exists due to eye fatigue, age, experience,
lighting conditions (Joiner, 2004, Joiner, 2006, Brook et al, 2007) and physiological conditions
such as colour blindness (Joiner, 2004).
2. 5. 3. 1. 2 Stain Indices
These evaluate the staining of teeth and include the Lobene stain index and Murray and Shaw
stain index (Macpherson et al, 2000, Brook et al, 2007). Like the shade guides, they are easy to
use and quick but a lot of variability exists between assessors and even with the same assessor at
different times. Most of these indices evaluate only the labial and lingual surfaces of the teeth,
therefore raising questions to the accuracy of the results (Macpherson et al, 2000, Brook et al,
29
2007) because approximal surfaces of a lot of patients pick up extrinsic stains (Macpherson et al,
2000). This drawback led Macpherson and others (2000) to develop a stain index that covers the
proximal aspect and body of the tooth.
Indices to evaluate intrinsic staining of teeth due to developmental defects also exist and have
been used by both researchers and clinicians. However, they are cumbersome and not very
accurate (Brook et al, 2007).
2. 5. 3. 2 Instrumental Techniques
2. 5. 3. 2. 1 Colourimeters
The first colourimeter to be developed for use in dentistry was the Chromascan in the early
1980s. The demand for this kind of device was initially poor and it proved to be inaccurate and
had problems related to its design. Several years later, as the demand for aesthetics increased,
newer and more efficient designs were introduced (Brewer et al, 2004). The newer devices
measure the colour of objects and express it in terms of CIE Lab colour space (Joiner, 2006).
Colourimeters have filters that correlate with spectral function of the standard observer’s eye
(Brewer et al, 2004, Joiner, 2004, Khurana et al, 2007). Unfortunately, it has not been possible to
produce filters that exactly mimic the standard observer functions and they are therefore not
100% accurate (Brewer et al, 2004). Nonetheless, they are precise and quick in measuring colour
differences and their performance has been comparable to that of spectrophotometers that are
deemed to be superior in colour measurement (Brewer et al, 2004, Joiner, 2004).
Colourimeters must be in contact with the object under study and measure the amount of light
reflected off its surface (Brook et al, 2007, Khurana et al, 2007). They give results using the CIE
Lab colour scale (Brook et al, 2007). Custom-made jigs should be used to ensure the measuring
probe is placed on the same position of the tooth each time, to ensure repeatability (Joiner,
2004).
These instruments have a number of disadvantages; they measure the colour of flat objects and
are therefore not useful in assessing colour of tooth surfaces, in-vivo, that are mostly curved with
surface irregularities (Derbabian et al, 2001, Joiner, 2004, Jarad et al, 2005, Brook et al, 2007,
Khurana et al, 2007). Small diameter apertures are prone to edge-loss errors, which cause
inaccurate readings due to loss of light entering the surface of the object from the margins
30
(Joiner, 2004, Paravina et al, 2007). Only small surfaces can be measured at any one time which
does not represent the whole tooth surface (Derbabian et al, 2001, Brook et al, 2007, Khurana et
al, 2007). Cross infection is a likely occurrence because these devices must be in contact with the
tooth surface while taking the measurement (Brook et al, 2007). In addition, the translucency of
teeth may also result in inaccurate measurements of tooth colour (Derbabian et al, 2001, Brook
et al, 2007). Due to the difficulty in correcting systematic errors within colourimeters, different
instruments give varying readings of the same object. Therefore, comparison of data where more
than one colourimeter is used is unreliable (Joiner, 2004). Finally, these instruments are
expensive and difficult to use in clinical situations (Brook et al, 2007, Khurana et al, 2007). In
light of these drawbacks, it has been recommended that the use of colourimeters be limited to the
detection of small colour differences in objects (Joiner, 2004). Several longitudinal studies
measuring the differences of tooth colour during bleaching procedures have utilized
colourimeters (Joiner, 2006, Brook et al, 2007).
2. 5. 3. 2. 2 Spectrophotometers
Whereas colourimeters use filters to match the standard observer function, spectrophotometers
are scanning devices. As such, they are thought to be more accurate than colourimeters (Brewer
et al, 2004). They are however similar to colourimeters in most other aspects including their use,
mode of readings and shortcomings (Joiner, 2004, Brewer et al, 2004). Traditional
spectrophotometers have only one photodiode therefore measure one wavelength at a time, being
reflected from the object being assessed (Brewer et al, 2004, Joiner, 2004, Khurana et al, 2007).
The latest designs have incorporated multiple diodes for each wavelength that can then be
measured simultaneously. Their main components include a light source, a geometric
conditioning system for colour measurement, a light disperser, a detector and software that
converts light into signals suitable for assessment (Khurana et al, 2007). Spectrophotometers
control the external light conditions and give colour measurements using the CIE Lab colour
space (Khurana et al, 2007). They may be more accurate, but both the traditional and newer
designs are slower in measuring colour than colourimeters (Brewer et al, 2004).
Spectrophotometers use standard illuminants when taking colour measurements and these
different illuminants affect the results obtained. There are several illuminants that can be used
such as Standard illuminant D65 which represents daylight (Patel et al, 2004, Park et al, 2006),
31
illuminant F2 representing fluorescent light and illuminant A, for incandescent light. Illuminants
D65 and A are the commonly used illuminants in dentistry (Park et al, 2006). Spectrophotometers
are very sensitive to both colour changes and surface topography (Lee et al, 2002, Sarac et al,
2006). They use either one of two geometries; the specular component included (SCI) or the
specular component excluded (SCE) (Lee et al, 2002, Sarac et al, 2006). The condition of the
surfaces of materials and teeth determine the amount of light that is scattered or reflected from
them (Lee et al, 2002). It is difficult to ensure equal surface roughness for teeth or samples being
measured (Sarac et al, 2006) therefore the SCE geometry, which is more accurate in reflecting
irregularities than the SCI geometry, is preferred (Lee et al, 2002, Sarac et al, 2006).
Spectrophotometers are expensive (Joiner, 2004, Jarad et al, 2005, Khurana et al, 2007), difficult
to use intra-orally (Joiner, 2004, Khurana et al, 2007) and require being in contact with objects
undergoing measurement (Joiner, 2004, Brook et al, 2007). Like colourimeters, they measure flat
small surfaces, carry a risk of cross-infection (Brook et al, 2007) and their results are affected by
the translucency of teeth (Brook et al, 2007, Paravina et al, 2007). Edge-loss error is also a
concern with spectrophotometers (Paravina et al, 2007). Both colourimeters and
spectrophotometers have been used in longitudinal studies to measure colour changes following
tooth bleaching (Brook et al, 2007).
2. 5. 3. 2. 3 Digital Imaging Devices
Digital imaging devices are the most recently introduced instruments used for measuring colour
in dentistry (Brewer et al, 2004, Jarad et al, 2005, Brook et al, 2007). These are high resolution
digital cameras that are attached to image acquiring software (Brewer et al, 2004, Joiner, 2004,
Brook et al, 2007). They contain charge-coupled devices with thousands to millions of tiny light
sensitive elements which perceive light in its three primary colours (Brewer et al, 2004). Results
are given using the CIE Lab colour system or as red, green and blue values (Brook et al, 2007).
They are being used in shade matching where the images are sent electronically to the dental
technician (Jarad et al, 2005, Brook et al, 2007).
Digital imaging devices have been shown to be more accurate, repeatable and economical
compared to spectrophotometers. They do not require contact with objects and have the ability to
assess the whole tooth surface (Brook et al, 2007). They are easy to use and permanent records
of images measured are made (Jarad et al, 2005, Brook et al, 2007).
32
2. 6 CONCLUSION
The popularity of tooth whitening as a part of the ever increasing demand for aesthetic dentistry
continues to rise unabated (Burrell, 1997). The success rate of vital tooth bleaching is high and it
has been declared a safe and non-invasive method of improving the colour of teeth (Suleiman,
2005b, Kihn, 2007). This has been accompanied by the frequent use of composite resins as
restorative materials, because of their improved aesthetics (Sadowsky, 2006). Their potential to
discolour however mars an otherwise beautiful smile, resulting in frequent replacement of these
discoloured restorations (Buchalla et al, 2002, Schulze et al, 2003, Villalta et al, 2006). Most of
the studies carried out on the effect of whitening agents on tooth coloured restorative materials
show that bleaching systems lighten them and also remove surface stains from the restorations,
especially when higher concentrations of hydrogen peroxide are used (Canay and Cehreli, 2003,
Rosentritt et al, 2005, Villalta et al, 2006). The question then, can bleaching be used as a viable
method of stain removal from old composite restorations to serve the purposes of restoring
aesthetics as well as conserving tooth structure, over a lifetime of a composite resin restoration,
is justified.
33
CHAPTER 3 AIMS AND OBJECTIVES 3. 1 AIM The aim of this study was to determine whether tooth bleaching agents alter the colour of stained
direct composite resins.
3. 2 OBJECTIVES
• To determine the colour after staining of the composite resin specimens.
• To compare the colour after bleaching of the stained samples.
3. 3 NULL HYPOTHESIS
• There is no significant difference in the staining ability of the different agents used in this
study.
• There is no significant difference in the colour of the stained composite resins after
subjecting them to the bleaching agent.
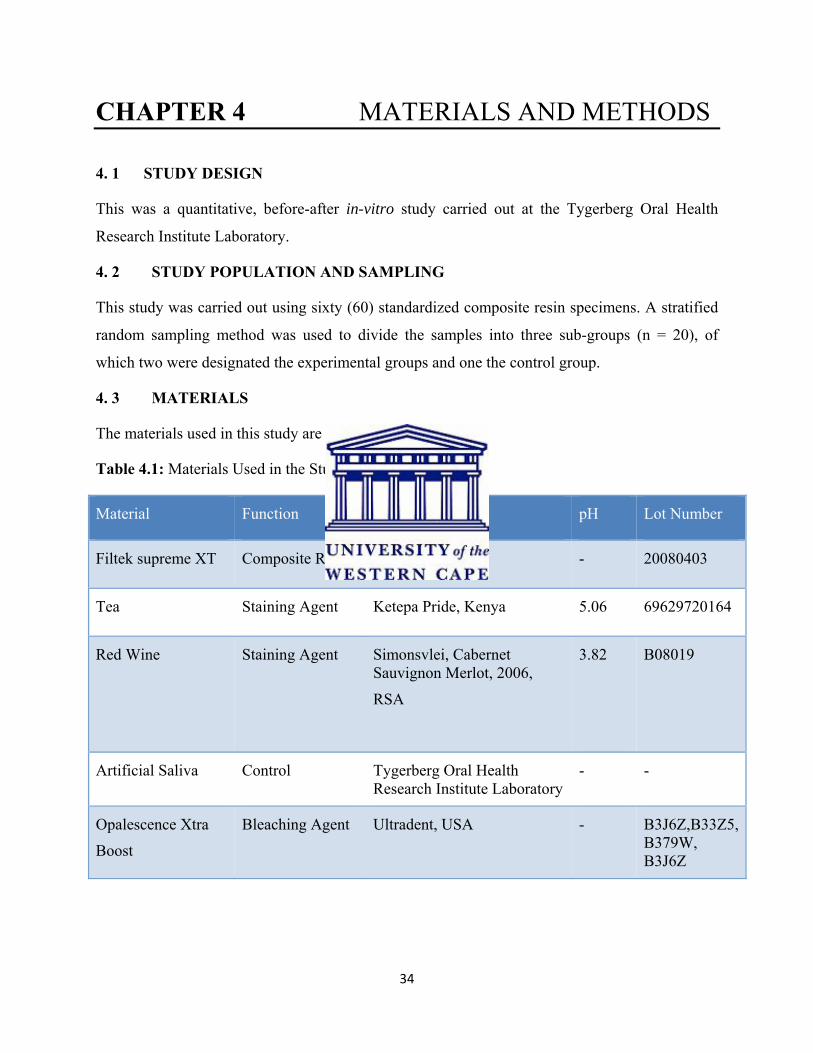
34
CHAPTER 4 MATERIALS AND METHODS
4. 1 STUDY DESIGN
This was a quantitative, before-after in-vitro study carried out at the Tygerberg Oral Health
Research Institute Laboratory.
4. 2 STUDY POPULATION AND SAMPLING
This study was carried out using sixty (60) standardized composite resin specimens. A stratified
random sampling method was used to divide the samples into three sub-groups (n = 20), of
which two were designated the experimental groups and one the control group.
4. 3 MATERIALS
The materials used in this study are listed in table 4.1.
Table 4.1: Materials Used in the Study.
Material Function Company pH Lot Number
Filtek supreme XT Composite Resin 3M ESPE, USA - 20080403
Tea Staining Agent Ketepa Pride, Kenya 5.06 69629720164
Red Wine Staining Agent Simonsvlei, Cabernet Sauvignon Merlot, 2006,
RSA
3.82
B08019
Artificial Saliva Control Tygerberg Oral Health Research Institute Laboratory
- -
Opalescence Xtra
Boost
Bleaching Agent Ultradent, USA - B3J6Z,B33Z5, B379W, B3J6Z

35
4. 3. 1 Filtek Supreme XT
Filtek Supreme XT is a nanofilled composite resin which is supplied in syringes or capsules. The
syringes used in this study are shown in figure 4.1. Body enamel Shade A2, was selected because
lighter shades of composite have been shown to discolour more than darker shades (Koksal and
Dikbas, 2008).
Figure 4.1 Filtek supreme XT.
4. 3. 2 Staining Agents
One of the staining agents was Kenyan tea, Ketepa Pride Ltd. It is 100% very fine granules of tea
in filter bags of 2 grams each. It contains vitamin C and E, fluoride, catchins which are anti-
oxidants and other flavours. It has no additives, preservatives or artificial colourants. It is made
from locally harvested tea leaves and produced by Kenyans, for mainly Kenyans
(www.ketepa.com, 24th June 2008). This product is pictured in figure 4.2.
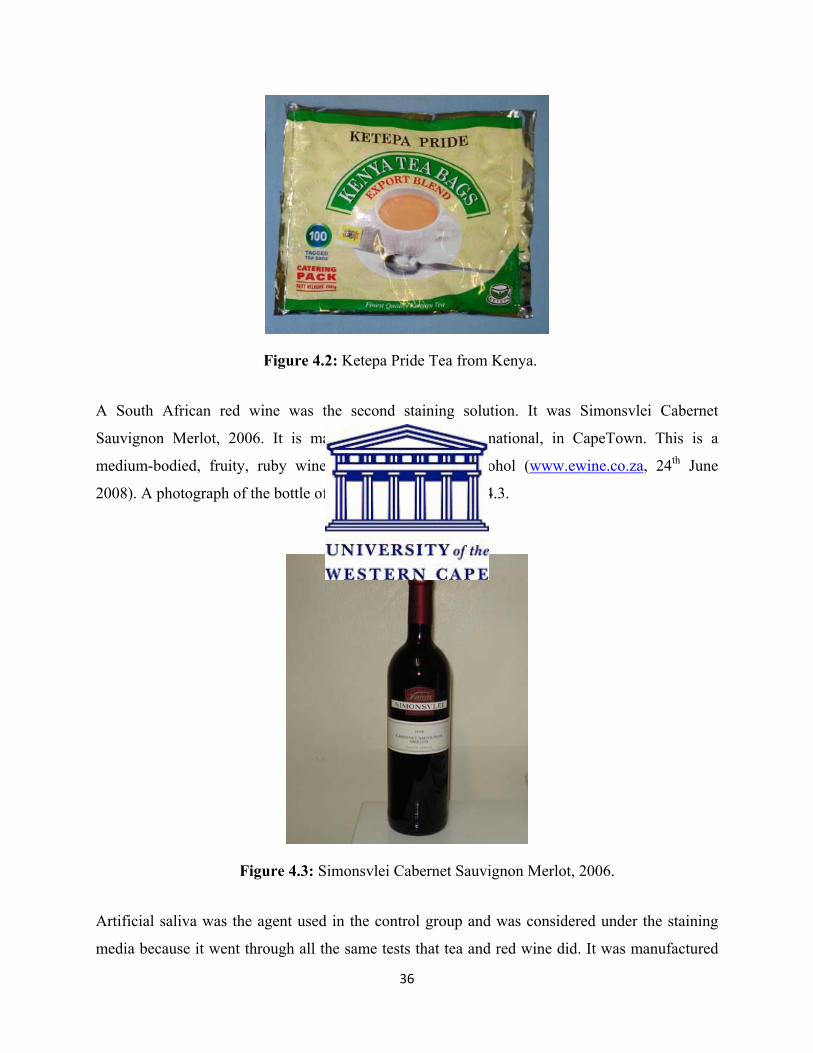
36
Figure 4.2: Ketepa Pride Tea from Kenya.
A South African red wine was the second staining solution. It was Simonsvlei Cabernet
Sauvignon Merlot, 2006. It is made by Simonsvlei International, in CapeTown. This is a
medium-bodied, fruity, ruby wine containing 14.43% alcohol (www.ewine.co.za, 24th June
2008). A photograph of the bottle of wine is shown in figure 4.3.
Figure 4.3: Simonsvlei Cabernet Sauvignon Merlot, 2006.
Artificial saliva was the agent used in the control group and was considered under the staining
media because it went through all the same tests that tea and red wine did. It was manufactured
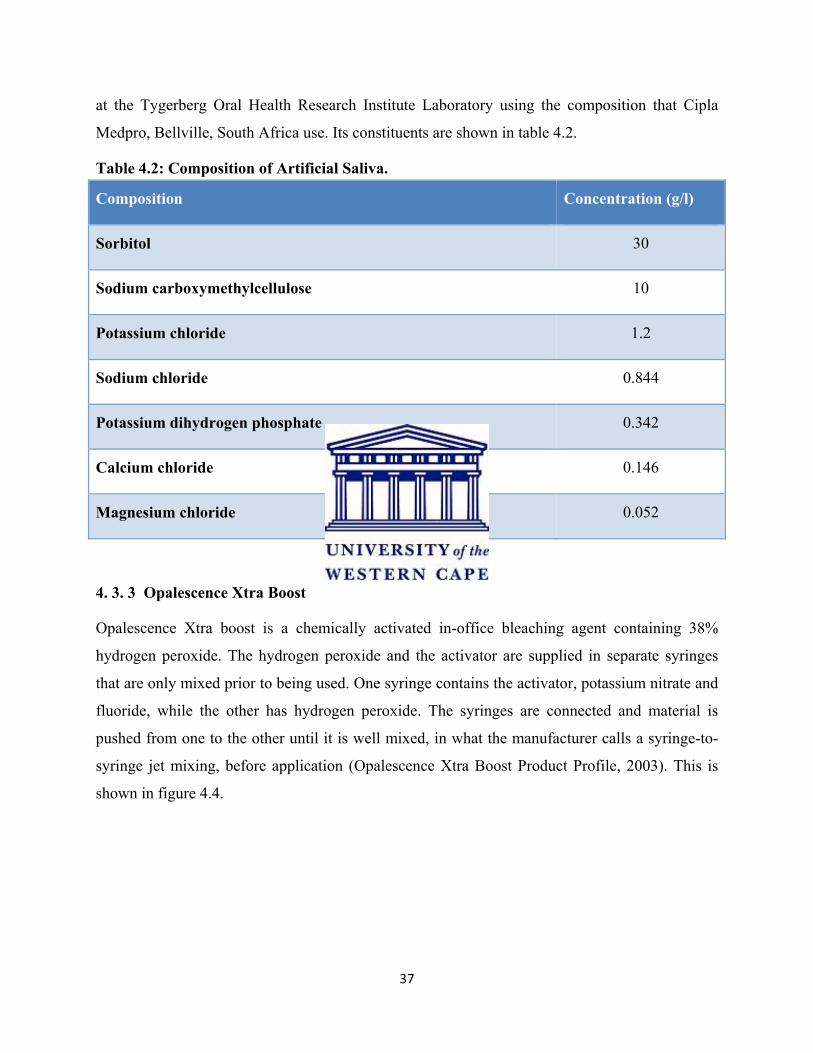
37
at the Tygerberg Oral Health Research Institute Laboratory using the composition that Cipla
Medpro, Bellville, South Africa use. Its constituents are shown in table 4.2.
Table 4.2: Composition of Artificial Saliva.
Composition Concentration (g/l)
Sorbitol 30
Sodium carboxymethylcellulose 10
Potassium chloride 1.2
Sodium chloride 0.844
Potassium dihydrogen phosphate 0.342
Calcium chloride 0.146
Magnesium chloride 0.052
4. 3. 3 Opalescence Xtra Boost
Opalescence Xtra boost is a chemically activated in-office bleaching agent containing 38%
hydrogen peroxide. The hydrogen peroxide and the activator are supplied in separate syringes
that are only mixed prior to being used. One syringe contains the activator, potassium nitrate and
fluoride, while the other has hydrogen peroxide. The syringes are connected and material is
pushed from one to the other until it is well mixed, in what the manufacturer calls a syringe-to-
syringe jet mixing, before application (Opalescence Xtra Boost Product Profile, 2003). This is
shown in figure 4.4.
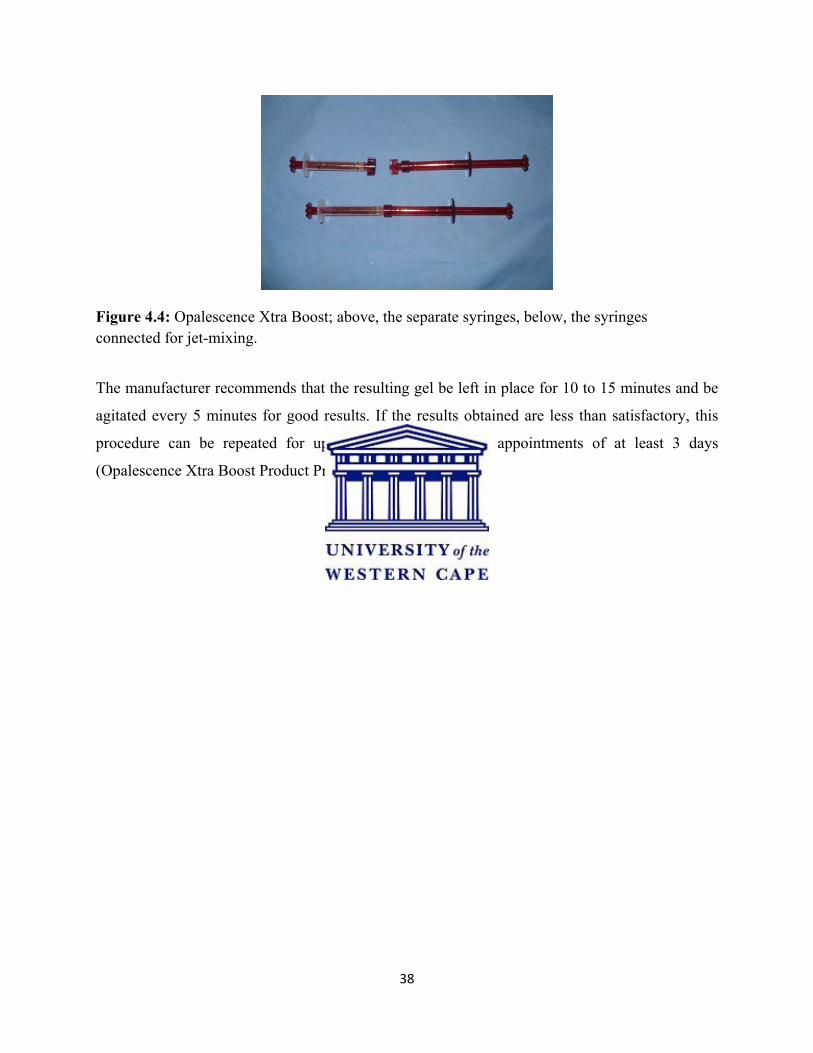
38
Figure 4.4: Opalescence Xtra Boost; above, the separate syringes, below, the syringes connected for jet-mixing.
The manufacturer recommends that the resulting gel be left in place for 10 to 15 minutes and be
agitated every 5 minutes for good results. If the results obtained are less than satisfactory, this
procedure can be repeated for up to 6 cycles in spaced appointments of at least 3 days
(Opalescence Xtra Boost Product Profile, 2003).

39
4. 4 METHODOLOGY
A flow chart of the methodology of this study is shown in figure 4.5.
Figure 4.5: Flowchart of the study.
Composite samples (60)
Control – group C (n =20) Tea – group T (n = 20) Wine –group W (n = 20)
Baseline colour ‐ 0
7 days of staining, renewing stains every 24 hours
Colour measurements 1 to 7
3, weekly bleaching sessions; 2 cycles of 15 minutes each
Colour measurements 8 to 10
1 week incubation/rehydration
Final colour measurement ‐ 11

40
4. 4. 1 Composite Resin Specimen Preparation
A number of the studies reviewed that tested composite resins, used samples measuring between
9 and 20 mm in diameter. However, the height was constant in all these studies at 2mm so as to
cure the material in bulk.
Therefore sixty (60) disc-shaped composite resin specimens were prepared, in a rubber mould
measuring 9mm in diameter by 2mm in height shown in figure 4.6. These measurements were
confirmed using a digital caliper (Hipex Tools Ltd, China).
Figure 4.6: Rubber mould.
The mould was placed on a glass slab and a transparent polyester strip (Odus universal strips,
Odus Technologies, Switzerland) was placed between the mould and the glass slab. Composite
resin completely filled the mould. Another polyester strip was then put over the mould, to cover
the composite resin and a second glass slab placed over it. The polyester strips were discarded
after preparation of each sample. This process is shown in figure 4.7.
Figure 4.7: Mould with composite sandwiched between 2 glass slabs and 2 polyester strips.
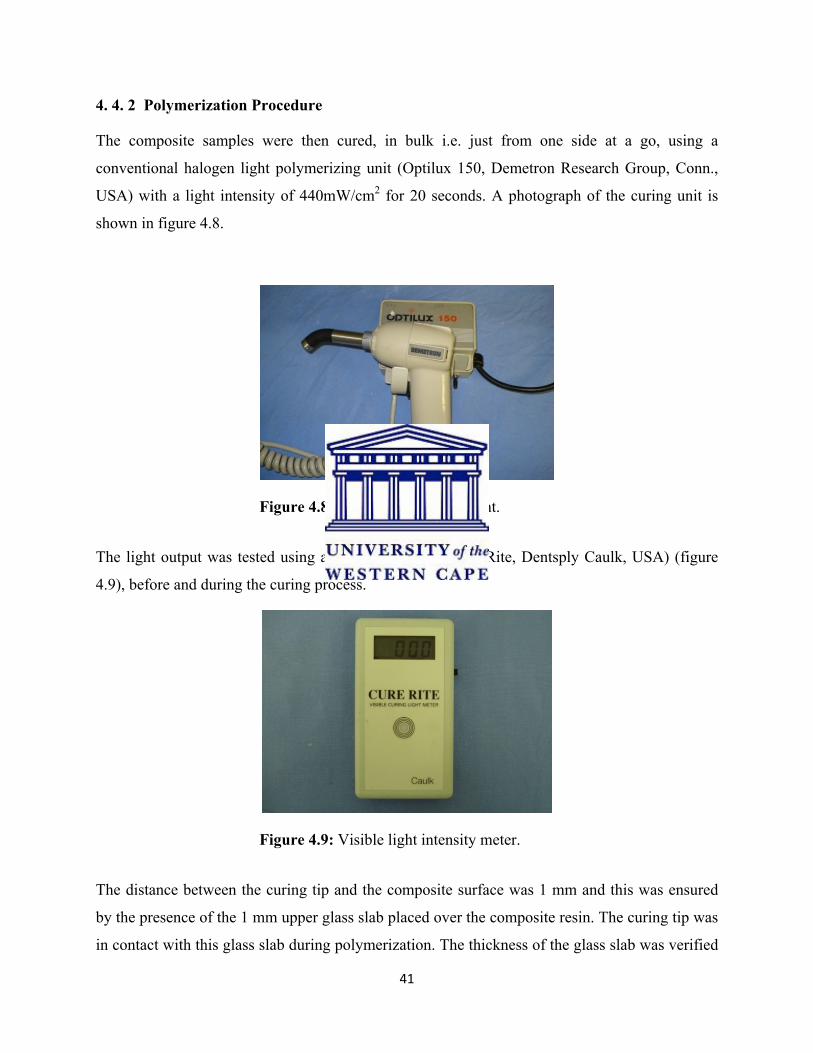
41
4. 4. 2 Polymerization Procedure
The composite samples were then cured, in bulk i.e. just from one side at a go, using a
conventional halogen light polymerizing unit (Optilux 150, Demetron Research Group, Conn.,
USA) with a light intensity of 440mW/cm2 for 20 seconds. A photograph of the curing unit is
shown in figure 4.8.
Figure 4.8: Optilux 150 Curing light.
The light output was tested using an intensity meter (Cure Rite, Dentsply Caulk, USA) (figure
4.9), before and during the curing process.
Figure 4.9: Visible light intensity meter.
The distance between the curing tip and the composite surface was 1 mm and this was ensured
by the presence of the 1 mm upper glass slab placed over the composite resin. The curing tip was
in contact with this glass slab during polymerization. The thickness of the glass slab was verified
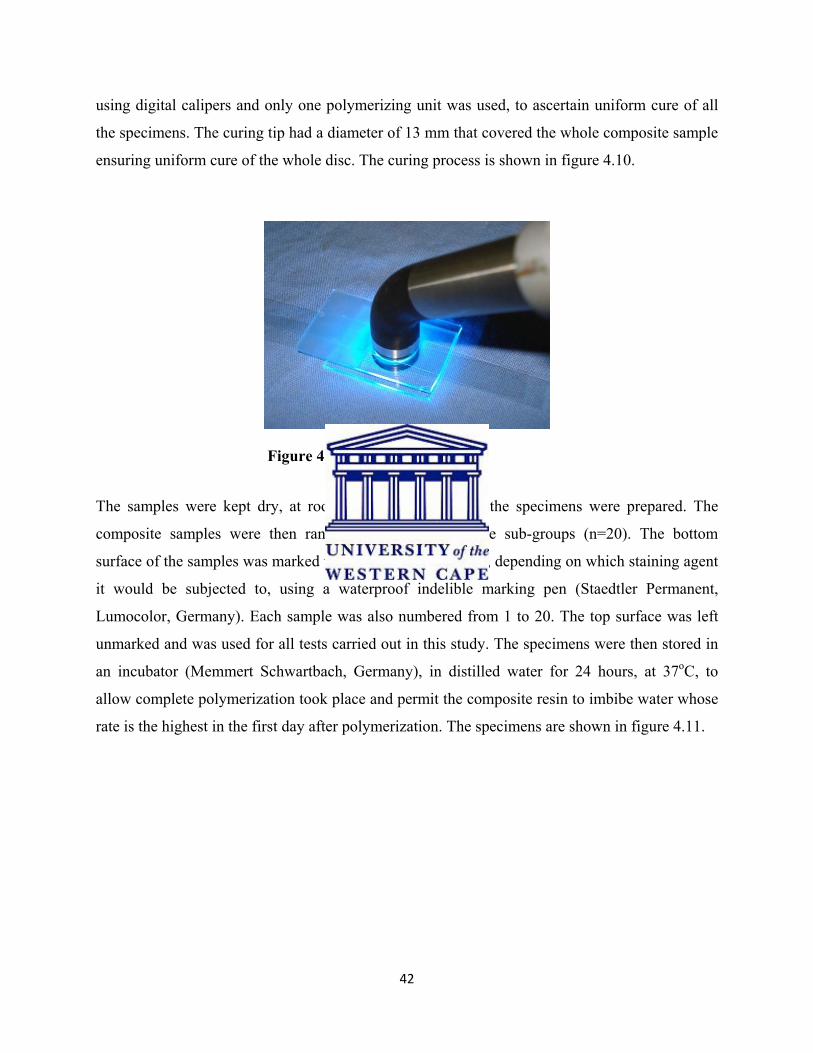
42
using digital calipers and only one polymerizing unit was used, to ascertain uniform cure of all
the specimens. The curing tip had a diameter of 13 mm that covered the whole composite sample
ensuring uniform cure of the whole disc. The curing process is shown in figure 4.10.
Figure 4.10: The curing process.
The samples were kept dry, at room temperature until all the specimens were prepared. The
composite samples were then randomly divided into three sub-groups (n=20). The bottom
surface of the samples was marked with the initial C, T or W, depending on which staining agent
it would be subjected to, using a waterproof indelible marking pen (Staedtler Permanent,
Lumocolor, Germany). Each sample was also numbered from 1 to 20. The top surface was left
unmarked and was used for all tests carried out in this study. The specimens were then stored in
an incubator (Memmert Schwartbach, Germany), in distilled water for 24 hours, at 37oC, to
allow complete polymerization took place and permit the composite resin to imbibe water whose
rate is the highest in the first day after polymerization. The specimens are shown in figure 4.11.
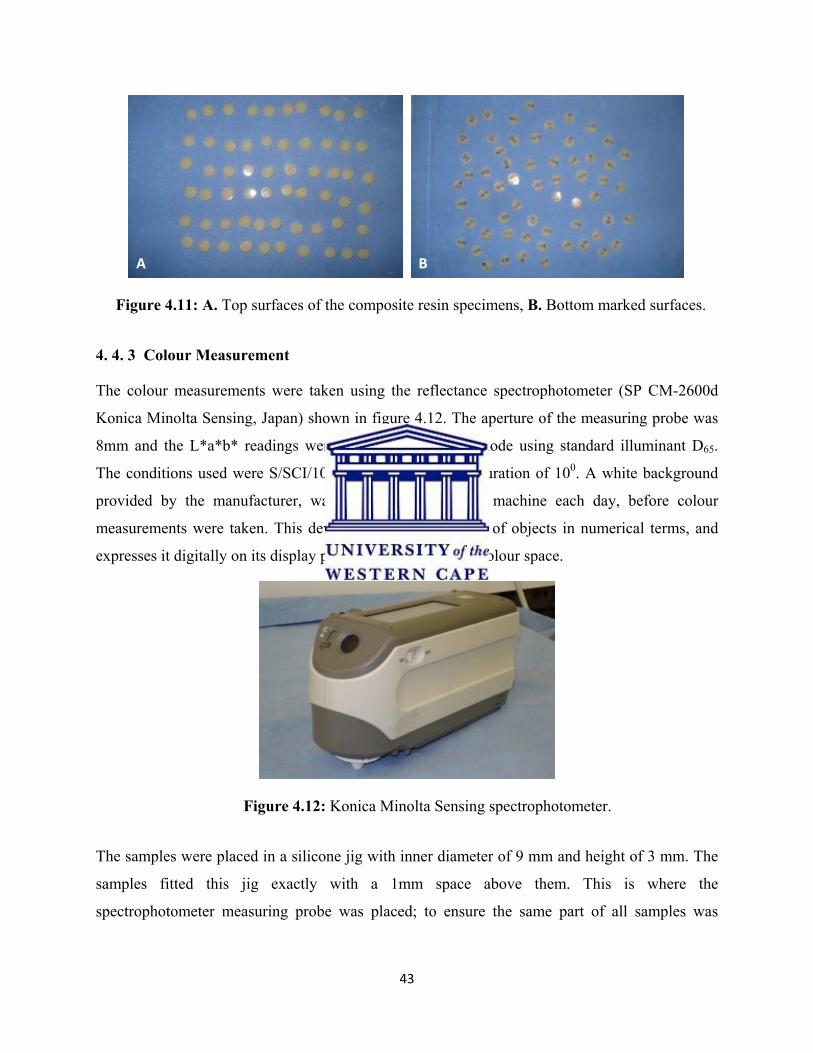
43
Figure 4.11: A. Top surfaces of the composite resin specimens, B. Bottom marked surfaces.
4. 4. 3 Colour Measurement
The colour measurements were taken using the reflectance spectrophotometer (SP CM-2600d
Konica Minolta Sensing, Japan) shown in figure 4.12. The aperture of the measuring probe was
8mm and the L*a*b* readings were taken in reflectance mode using standard illuminant D65.
The conditions used were S/SCI/100 with a viewing configuration of 100. A white background
provided by the manufacturer, was used to calibrate the machine each day, before colour
measurements were taken. This device measures the colour of objects in numerical terms, and
expresses it digitally on its display panel using the CIE Lab colour space.
Figure 4.12: Konica Minolta Sensing spectrophotometer.
The samples were placed in a silicone jig with inner diameter of 9 mm and height of 3 mm. The
samples fitted this jig exactly with a 1mm space above them. This is where the
spectrophotometer measuring probe was placed; to ensure the same part of all samples was
A B
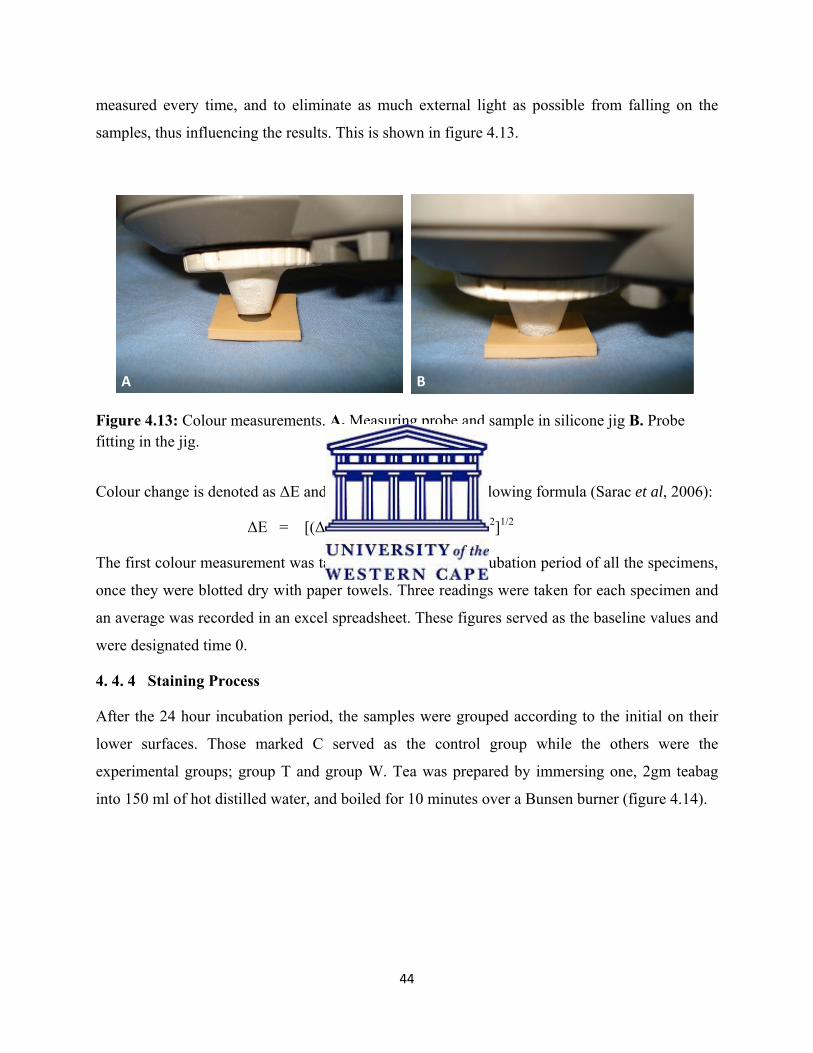
44
measured every time, and to eliminate as much external light as possible from falling on the
samples, thus influencing the results. This is shown in figure 4.13.
Figure 4.13: Colour measurements. A. Measuring probe and sample in silicone jig B. Probe fitting in the jig.
Colour change is denoted as ΔE and is calculated with the following formula (Sarac et al, 2006):
ΔE = [(ΔL*)2 + (Δ a*)2 + (Δ b*)2]1/2
The first colour measurement was taken after the 24 hour incubation period of all the specimens,
once they were blotted dry with paper towels. Three readings were taken for each specimen and
an average was recorded in an excel spreadsheet. These figures served as the baseline values and
were designated time 0.
4. 4. 4 Staining Process
After the 24 hour incubation period, the samples were grouped according to the initial on their
lower surfaces. Those marked C served as the control group while the others were the
experimental groups; group T and group W. Tea was prepared by immersing one, 2gm teabag
into 150 ml of hot distilled water, and boiled for 10 minutes over a Bunsen burner (figure 4.14).
A B
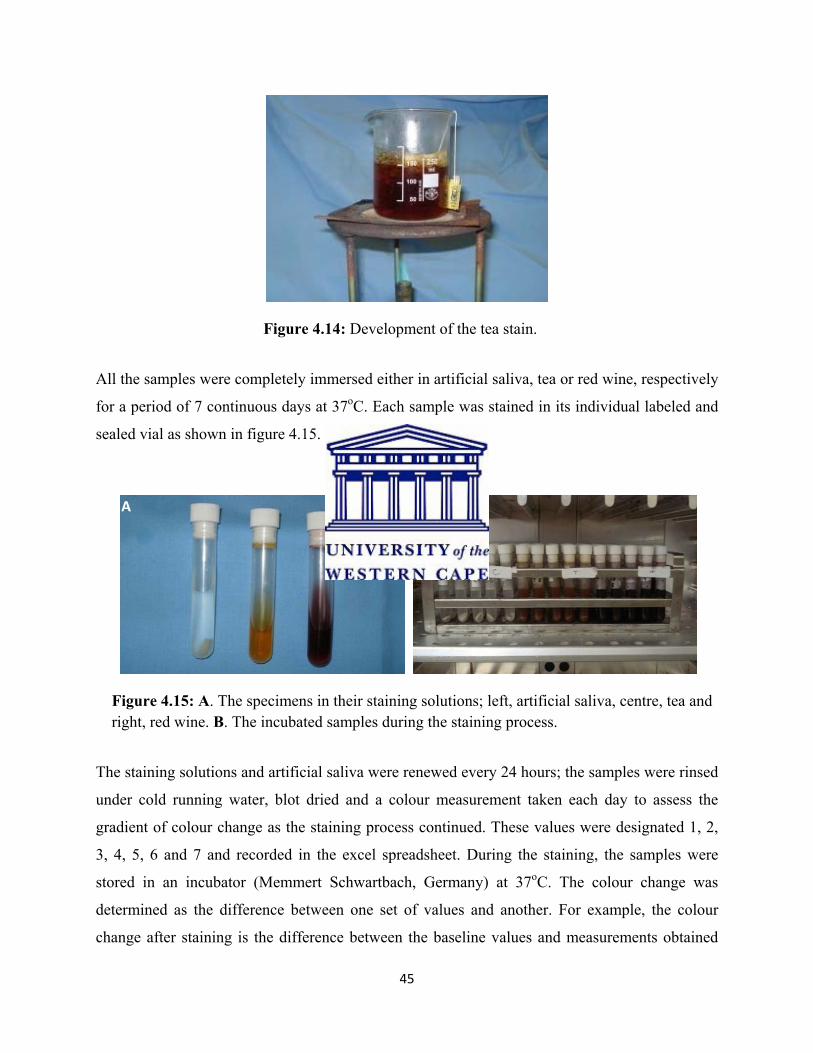
45
Figure 4.14: Development of the tea stain.
All the samples were completely immersed either in artificial saliva, tea or red wine, respectively
for a period of 7 continuous days at 37oC. Each sample was stained in its individual labeled and
sealed vial as shown in figure 4.15.
Figure 4.15: A. The specimens in their staining solutions; left, artificial saliva, centre, tea and right, red wine. B. The incubated samples during the staining process.
The staining solutions and artificial saliva were renewed every 24 hours; the samples were rinsed
under cold running water, blot dried and a colour measurement taken each day to assess the
gradient of colour change as the staining process continued. These values were designated 1, 2,
3, 4, 5, 6 and 7 and recorded in the excel spreadsheet. During the staining, the samples were
stored in an incubator (Memmert Schwartbach, Germany) at 37oC. The colour change was
determined as the difference between one set of values and another. For example, the colour
change after staining is the difference between the baseline values and measurements obtained
A B
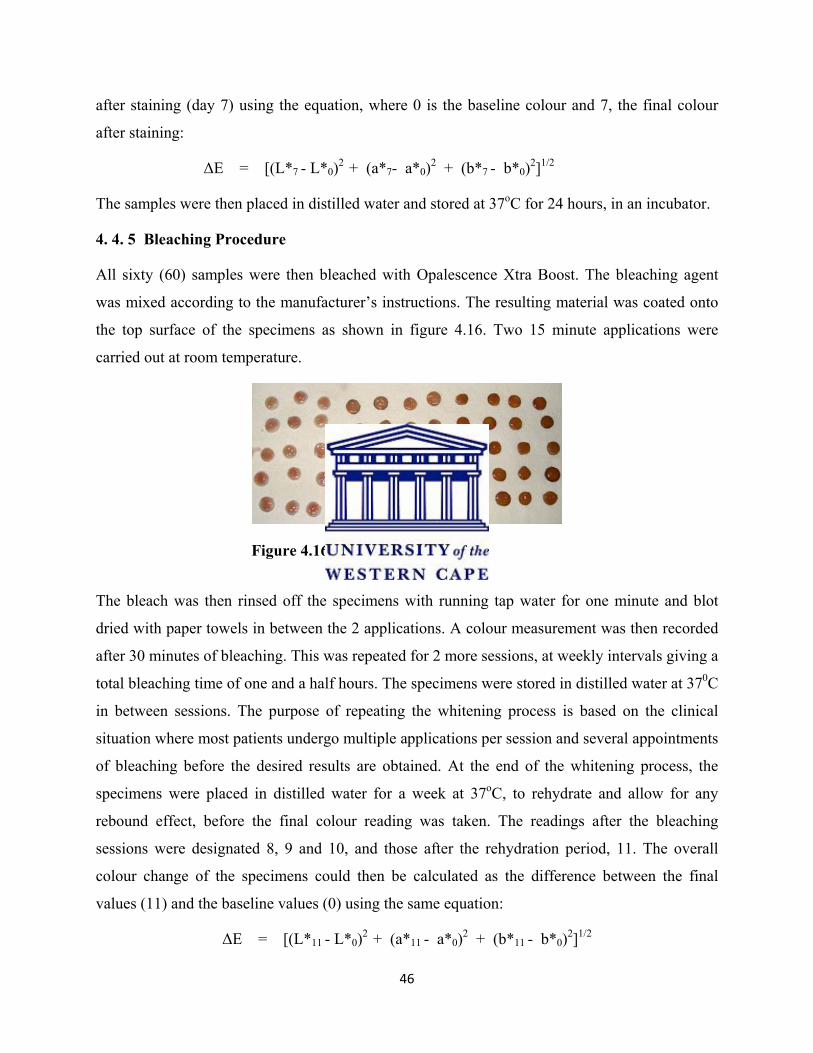
46
after staining (day 7) using the equation, where 0 is the baseline colour and 7, the final colour
after staining:
ΔE = [(L*7 - L*0)2 + (a*7- a*0)2 + (b*7 - b*0)2]1/2
The samples were then placed in distilled water and stored at 37oC for 24 hours, in an incubator.
4. 4. 5 Bleaching Procedure
All sixty (60) samples were then bleached with Opalescence Xtra Boost. The bleaching agent
was mixed according to the manufacturer’s instructions. The resulting material was coated onto
the top surface of the specimens as shown in figure 4.16. Two 15 minute applications were
carried out at room temperature.
Figure 4.16: The bleaching process.
The bleach was then rinsed off the specimens with running tap water for one minute and blot
dried with paper towels in between the 2 applications. A colour measurement was then recorded
after 30 minutes of bleaching. This was repeated for 2 more sessions, at weekly intervals giving a
total bleaching time of one and a half hours. The specimens were stored in distilled water at 370C
in between sessions. The purpose of repeating the whitening process is based on the clinical
situation where most patients undergo multiple applications per session and several appointments
of bleaching before the desired results are obtained. At the end of the whitening process, the
specimens were placed in distilled water for a week at 37oC, to rehydrate and allow for any
rebound effect, before the final colour reading was taken. The readings after the bleaching
sessions were designated 8, 9 and 10, and those after the rehydration period, 11. The overall
colour change of the specimens could then be calculated as the difference between the final
values (11) and the baseline values (0) using the same equation:
ΔE = [(L*11 - L*0)2 + (a*11 - a*0)2 + (b*11 - b*0)2]1/2
47
All values obtained were recorded in an excel spreadsheet and are presented in appendix 1.
Appendix 2 shows the changes in the individual L*a*b* and E* for the samples over the
experimental period.
4. 5 Data Analysis
The data was analyzed on an excel spreadsheet (Microsoft Office Excel, 2007) where ΔE, means
and standard deviations were determined. Graphical methods were used to show the pattern of
staining and bleaching. A ΔE value greater than 3.3 units was considered clinically significant
(Canay and Cehreli, 2003, Kim et al, 2004, Guler et al, 2005a, Rosentritt et al, 2005). A non-
parametric test, the Wilcoxon Signed Rank Sum test was used to analyze the statistical
differences in staining and bleaching within and between the groups at various intervals. Paired
comparisons which resulted in p values below 0.05, were deemed to have differences that are
statistically significant while those above this value are not.
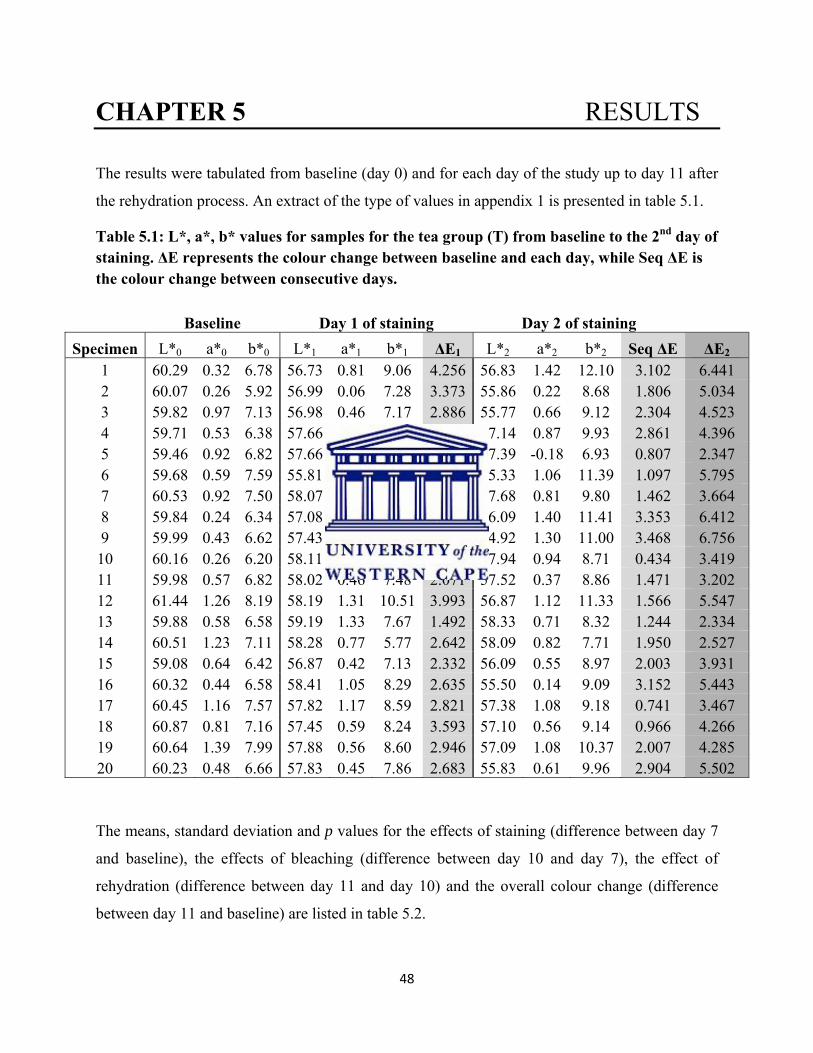
48
CHAPTER 5 RESULTS
The results were tabulated from baseline (day 0) and for each day of the study up to day 11 after
the rehydration process. An extract of the type of values in appendix 1 is presented in table 5.1.
Table 5.1: L*, a*, b* values for samples for the tea group (T) from baseline to the 2nd day of staining. ΔE represents the colour change between baseline and each day, while Seq ΔE is the colour change between consecutive days.
Baseline Day 1 of staining Day 2 of staining Specimen L*0 a*0 b*0 L*1 a*1 b*1 ΔE1 L*2 a*2 b*2 Seq ΔE ΔE2
1 60.29 0.32 6.78 56.73 0.81 9.06 4.256 56.83 1.42 12.10 3.102 6.441 2 60.07 0.26 5.92 56.99 0.06 7.28 3.373 55.86 0.22 8.68 1.806 5.034 3 59.82 0.97 7.13 56.98 0.46 7.17 2.886 55.77 0.66 9.12 2.304 4.523 4 59.71 0.53 6.38 57.66 0.19 7.20 2.234 57.14 0.87 9.93 2.861 4.396 5 59.46 0.92 6.82 57.66 0.58 6.91 1.834 57.39 -0.18 6.93 0.807 2.347 6 59.68 0.59 7.59 55.81 1.56 10.54 4.962 55.33 1.06 11.39 1.097 5.795 7 60.53 0.92 7.50 58.07 0.97 8.40 2.620 57.68 0.81 9.80 1.462 3.664 8 59.84 0.24 6.34 57.08 0.39 8.37 3.429 56.09 1.40 11.41 3.353 6.412 9 59.99 0.43 6.62 57.43 0.85 8.65 3.294 54.92 1.30 11.00 3.468 6.756 10 60.16 0.26 6.20 58.11 0.79 8.34 3.010 57.94 0.94 8.71 0.434 3.419 11 59.98 0.57 6.82 58.02 0.46 7.48 2.071 57.52 0.37 8.86 1.471 3.202 12 61.44 1.26 8.19 58.19 1.31 10.51 3.993 56.87 1.12 11.33 1.566 5.547 13 59.88 0.58 6.58 59.19 1.33 7.67 1.492 58.33 0.71 8.32 1.244 2.334 14 60.51 1.23 7.11 58.28 0.77 5.77 2.642 58.09 0.82 7.71 1.950 2.527 15 59.08 0.64 6.42 56.87 0.42 7.13 2.332 56.09 0.55 8.97 2.003 3.931 16 60.32 0.44 6.58 58.41 1.05 8.29 2.635 55.50 0.14 9.09 3.152 5.443 17 60.45 1.16 7.57 57.82 1.17 8.59 2.821 57.38 1.08 9.18 0.741 3.467 18 60.87 0.81 7.16 57.45 0.59 8.24 3.593 57.10 0.56 9.14 0.966 4.266 19 60.64 1.39 7.99 57.88 0.56 8.60 2.946 57.09 1.08 10.37 2.007 4.285 20 60.23 0.48 6.66 57.83 0.45 7.86 2.683 55.83 0.61 9.96 2.904 5.502
The means, standard deviation and p values for the effects of staining (difference between day 7
and baseline), the effects of bleaching (difference between day 10 and day 7), the effect of
rehydration (difference between day 11 and day 10) and the overall colour change (difference
between day 11 and baseline) are listed in table 5.2.
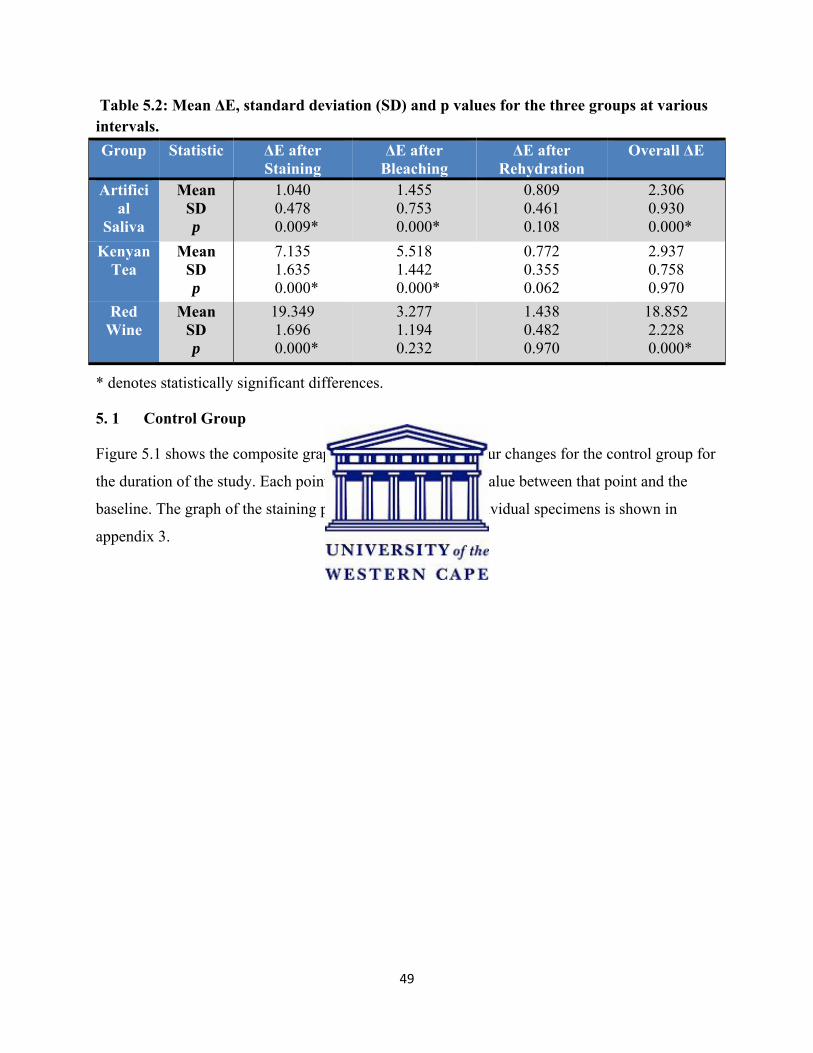
49
Table 5.2: Mean ΔE, standard deviation (SD) and p values for the three groups at various intervals. Group Statistic ΔE after
Staining ΔE after
Bleaching ΔE after
Rehydration Overall ΔE
Artificial
Saliva
Mean SD p
1.040 0.478
0.009*
1.455 0.753
0.000*
0.809 0.461 0.108
2.306 0.930
0.000* Kenyan
Tea Mean
SD p
7.135 1.635
0.000*
5.518 1.442
0.000*
0.772 0.355 0.062
2.937 0.758 0.970
Red Wine
Mean SD p
19.349 1.696
0.000*
3.277 1.194 0.232
1.438 0.482 0.970
18.852 2.228
0.000*
* denotes statistically significant differences.
5. 1 Control Group
Figure 5.1 shows the composite graph of the trend in the colour changes for the control group for
the duration of the study. Each point is calculated as the ΔE value between that point and the
baseline. The graph of the staining pattern for each of the individual specimens is shown in
appendix 3.
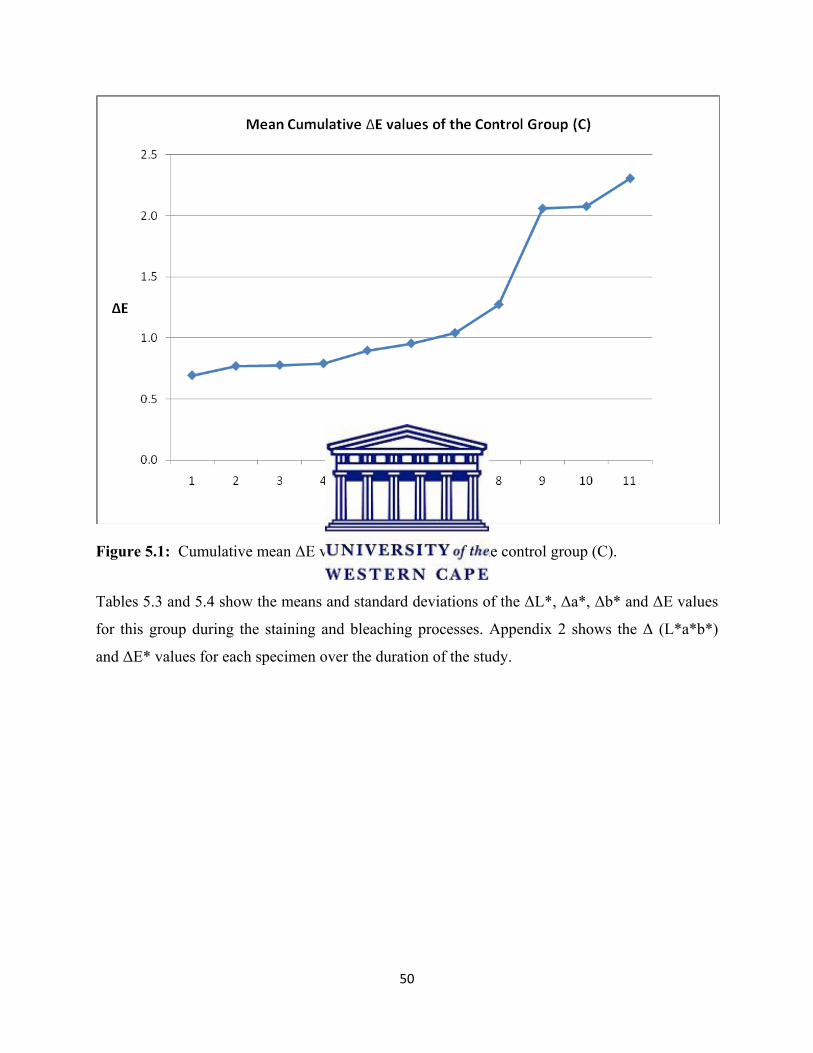
50
Figure 5.1: Cumulative mean ΔE values from baseline for the control group (C).
Tables 5.3 and 5.4 show the means and standard deviations of the ΔL*, Δa*, Δb* and ΔE values
for this group during the staining and bleaching processes. Appendix 2 shows the Δ (L*a*b*)
and ΔE* values for each specimen over the duration of the study.

51
Table 5.3: Mean (standard deviation) values of the cumulative colour changes (ΔL*, Δa*, Δb* and ΔE*) during the 7-day staining period calculated from baseline for the control group (C).
Day ΔL* Δa* Δb* ΔE*
1 -0.183 (0.435) 0.012 (0. 319) -0.182 (0.496) 0.693 (0.320)
2 -0.029 (0.492) 0.032 (0.369) -0.159 (0.625) 0.769 (0.420)
3 0.108 (0.591) 0.115 (0.319) -0.144 (0.547) 0.776 (0.404)
4 0.117 (0.491) 0.082 (0.323) -0.431 (0.443) 0.789 (0.321)
5 0.083 (0.594) 0.003 (0.288) -0.521 (0.554) 0.896 (0.436)
6 0.175 (0.611) -0.061 (0.275) 0.569 (0.494) 0.954 (0.335)
7 0.165 (0.648) -0.122 (0.367) -0.665 (0.550) 1.040 (0.478)
Table 5.4: Mean (standard deviation) values of the cumulative colour changes (ΔL*, Δa*, Δb* and ΔE*) during the 3 bleaching sessions (days 8, 9 and 10) and rehydration period (day 11) calculated from the last day of the staining period (day 7) for the control group (C).
Day ΔL* Δa* Δb* ΔE*
8 -0.077 (0.550) -0.089 (0.316) -0.354 (0.498) 0.775 (0.406)
9 -0.694 (0.509) -0.442 (0.297) -1.168 (0.485) 1.471 (0.673)
10 -0.658 (0.516) -0.425 (0.345) -1.121 (0.666) 1.455 (0.753)
11 -1.037 (0.667) -0.508 (0.350) -1.311 (0.635) 1.822 (0.829)
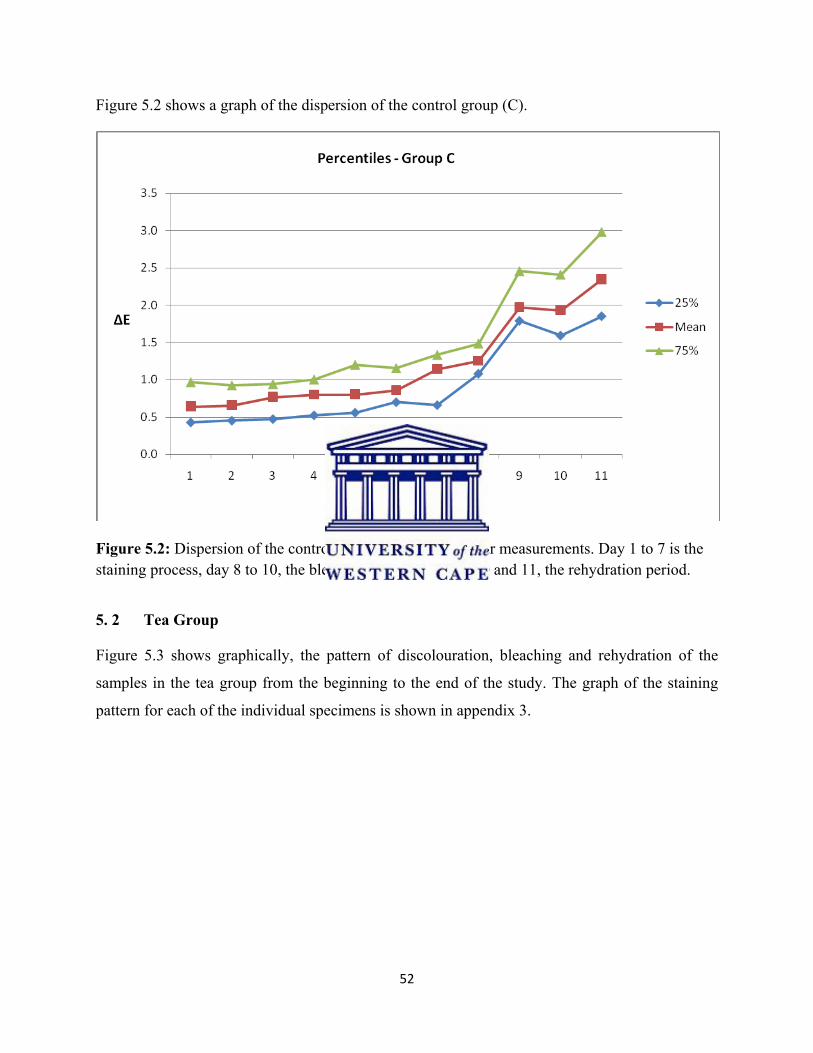
52
Figure 5.2 shows a graph of the dispersion of the control group (C).
Figure 5.2: Dispersion of the control group over the 11 colour measurements. Day 1 to 7 is the staining process, day 8 to 10, the bleaching period and day 10 and 11, the rehydration period.
5. 2 Tea Group
Figure 5.3 shows graphically, the pattern of discolouration, bleaching and rehydration of the
samples in the tea group from the beginning to the end of the study. The graph of the staining
pattern for each of the individual specimens is shown in appendix 3.

53
Figure 5.3: Cumulative mean ΔE values from baseline for the tea group (T).
Tables 5.5 and 5.6 list the means and standard deviation of the ΔL*, Δa*, Δb* and ΔE values for
Group T for the duration of the study while these values for each individual specimen are shown
in appendix 2.
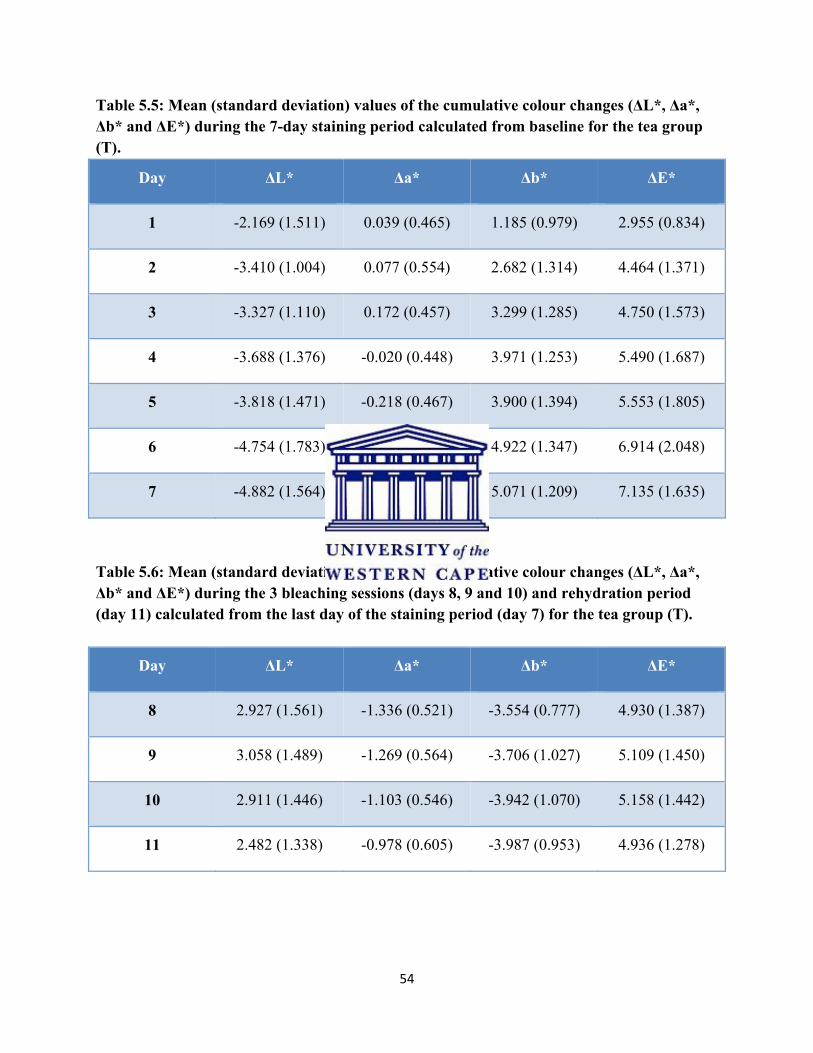
54
Table 5.5: Mean (standard deviation) values of the cumulative colour changes (ΔL*, Δa*, Δb* and ΔE*) during the 7-day staining period calculated from baseline for the tea group (T).
Day ΔL* Δa* Δb* ΔE*
1 -2.169 (1.511) 0.039 (0.465) 1.185 (0.979) 2.955 (0.834)
2 -3.410 (1.004) 0.077 (0.554) 2.682 (1.314) 4.464 (1.371)
3 -3.327 (1.110) 0.172 (0.457) 3.299 (1.285) 4.750 (1.573)
4 -3.688 (1.376) -0.020 (0.448) 3.971 (1.253) 5.490 (1.687)
5 -3.818 (1.471) -0.218 (0.467) 3.900 (1.394) 5.553 (1.805)
6 -4.754 (1.783) 0.000 (0.490) 4.922 (1.347) 6.914 (2.048)
7 -4.882 (1.564) -0.032 (0.440) 5.071 (1.209) 7.135 (1.635)
Table 5.6: Mean (standard deviation) values of the cumulative colour changes (ΔL*, Δa*, Δb* and ΔE*) during the 3 bleaching sessions (days 8, 9 and 10) and rehydration period (day 11) calculated from the last day of the staining period (day 7) for the tea group (T).
Day ΔL* Δa* Δb* ΔE*
8 2.927 (1.561) -1.336 (0.521) -3.554 (0.777) 4.930 (1.387)
9 3.058 (1.489) -1.269 (0.564) -3.706 (1.027) 5.109 (1.450)
10 2.911 (1.446) -1.103 (0.546) -3.942 (1.070) 5.158 (1.442)
11 2.482 (1.338) -0.978 (0.605) -3.987 (0.953) 4.936 (1.278)
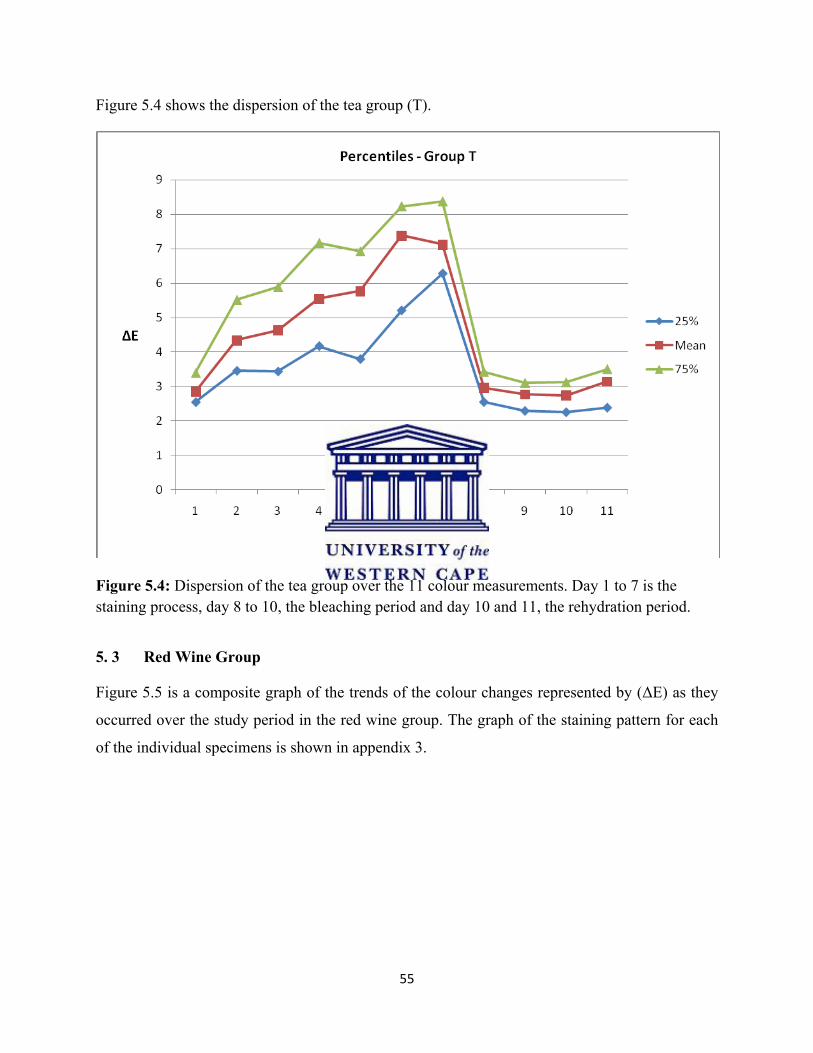
55
Figure 5.4 shows the dispersion of the tea group (T).
Figure 5.4: Dispersion of the tea group over the 11 colour measurements. Day 1 to 7 is the staining process, day 8 to 10, the bleaching period and day 10 and 11, the rehydration period.
5. 3 Red Wine Group
Figure 5.5 is a composite graph of the trends of the colour changes represented by (ΔE) as they
occurred over the study period in the red wine group. The graph of the staining pattern for each
of the individual specimens is shown in appendix 3.
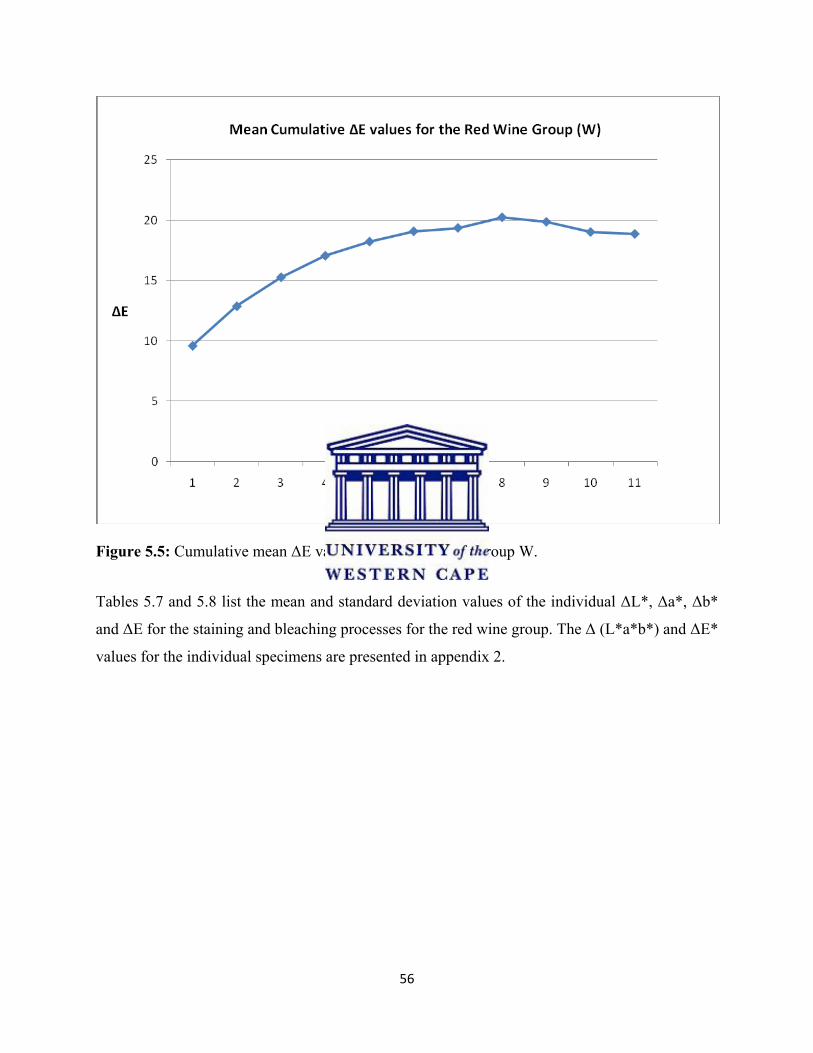
56
Figure 5.5: Cumulative mean ΔE values from baseline for Group W.
Tables 5.7 and 5.8 list the mean and standard deviation values of the individual ΔL*, Δa*, Δb*
and ΔE for the staining and bleaching processes for the red wine group. The Δ (L*a*b*) and ΔE*
values for the individual specimens are presented in appendix 2.
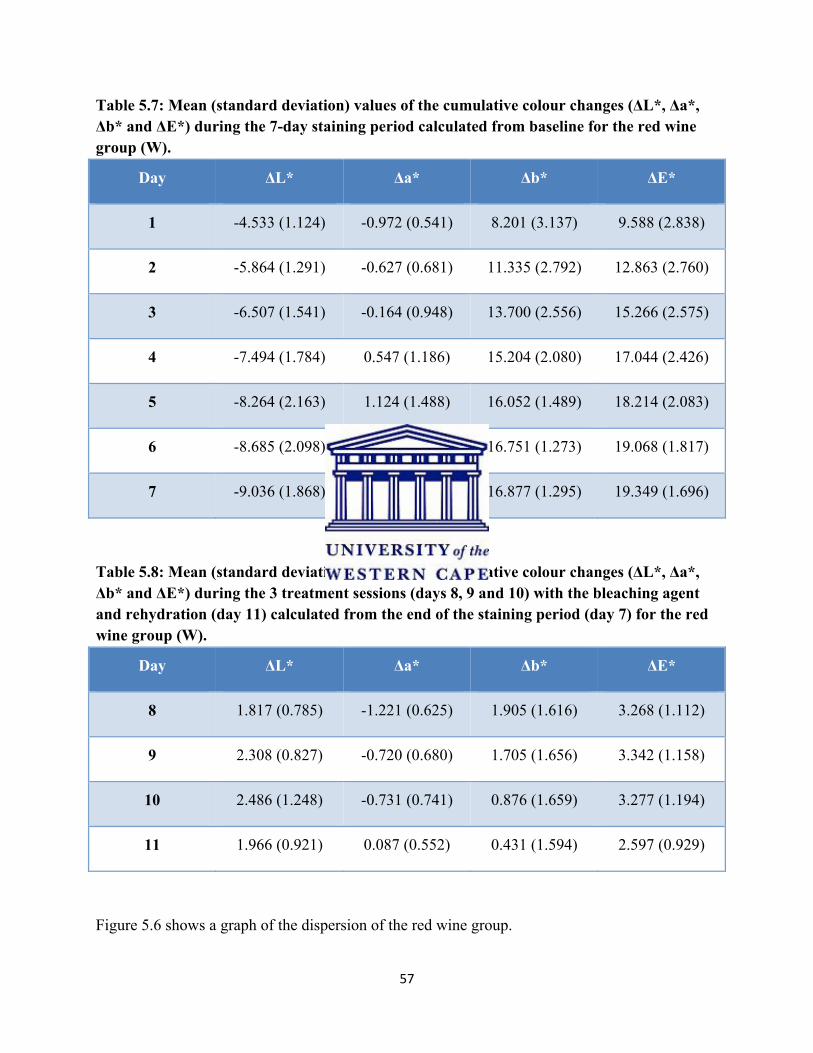
57
Table 5.7: Mean (standard deviation) values of the cumulative colour changes (ΔL*, Δa*, Δb* and ΔE*) during the 7-day staining period calculated from baseline for the red wine group (W).
Day ΔL* Δa* Δb* ΔE*
1 -4.533 (1.124) -0.972 (0.541) 8.201 (3.137) 9.588 (2.838)
2 -5.864 (1.291) -0.627 (0.681) 11.335 (2.792) 12.863 (2.760)
3 -6.507 (1.541) -0.164 (0.948) 13.700 (2.556) 15.266 (2.575)
4 -7.494 (1.784) 0.547 (1.186) 15.204 (2.080) 17.044 (2.426)
5 -8.264 (2.163) 1.124 (1.488) 16.052 (1.489) 18.214 (2.083)
6 -8.685 (2.098) 1.606 (1.595) 16.751 (1.273) 19.068 (1.817)
7 -9.036 (1.868) 1.915 (1.479) 16.877 (1.295) 19.349 (1.696)
Table 5.8: Mean (standard deviation) values of the cumulative colour changes (ΔL*, Δa*, Δb* and ΔE*) during the 3 treatment sessions (days 8, 9 and 10) with the bleaching agent and rehydration (day 11) calculated from the end of the staining period (day 7) for the red wine group (W).
Day ΔL* Δa* Δb* ΔE*
8 1.817 (0.785) -1.221 (0.625) 1.905 (1.616) 3.268 (1.112)
9 2.308 (0.827) -0.720 (0.680) 1.705 (1.656) 3.342 (1.158)
10 2.486 (1.248) -0.731 (0.741) 0.876 (1.659) 3.277 (1.194)
11 1.966 (0.921) 0.087 (0.552) 0.431 (1.594) 2.597 (0.929)
Figure 5.6 shows a graph of the dispersion of the red wine group.

58
Figure 5.6: Dispersion of the red wine group over the 11 colour measurements. Day 1 to 7 is the staining process, day 8 to 10, the bleaching period and day 10 and 11, the rehydration period.
5. 4 Overall Colour Change
Table 5.9 presents the overall changes of the individual components of the colour space for all
the groups at the end of the study.
Table 5.9: Mean (standard deviation) values of the overall colour changes (ΔL*, Δa*, Δb* and ΔE*) at the end of the study for all three groups (difference between day 11 and baseline values).
Group ΔL* Δa* Δb* ΔE*
Control -0.925 (0.827) -0.705 (0.465) -2.065 (0.790) 2.345 (1.130)
Kenyan Tea -2.590 (0.680) -0.975 (0.378) 0.820 (1.553) 3.142 (1.109)
Red Wine -6.675 (2.458) 1.720 (0.955) 16.940 (2.288) 18.227 (3.162)
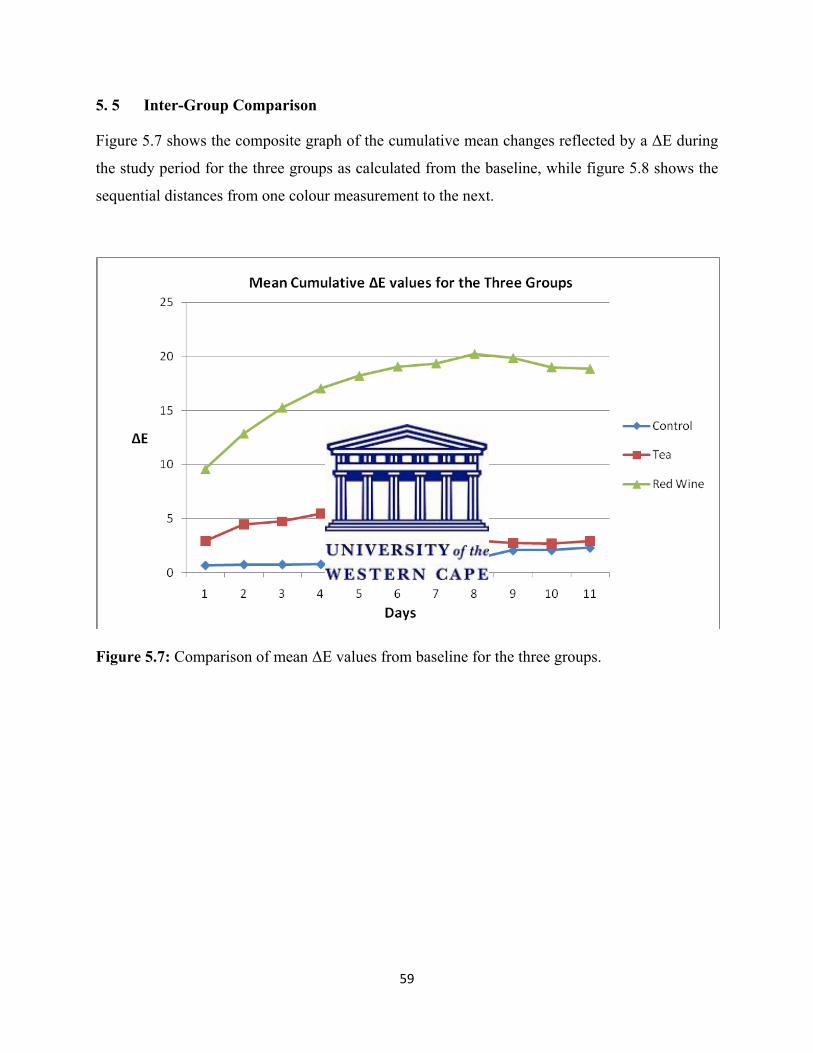
59
5. 5 Inter-Group Comparison
Figure 5.7 shows the composite graph of the cumulative mean changes reflected by a ΔE during
the study period for the three groups as calculated from the baseline, while figure 5.8 shows the
sequential distances from one colour measurement to the next.
Figure 5.7: Comparison of mean ΔE values from baseline for the three groups.
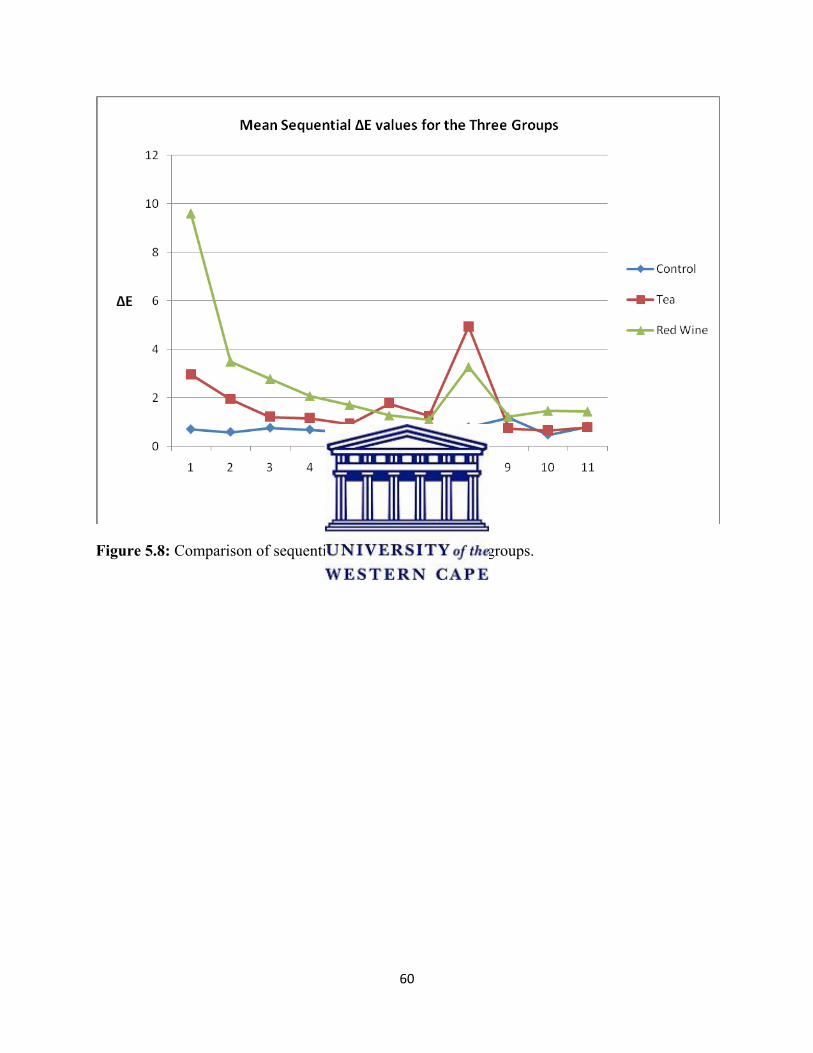
60
Figure 5.8: Comparison of sequential mean ΔE for the three groups.
61
CHAPTER 6 DISCUSSION The discolouration of composite resins is a major cause for concern as aesthetics becomes the
focus in the lives of many individuals. Amongst the methods that are used to restore the colour of
stained composite resin restorations are abrasive dentifrices and polishing procedures (Turkan
and Turkan, 2004). Both modalities involve loss or wear of the restoration (Turkan and Turkan,
2004). Another option lies in replacement of the restoration which is destructive to tooth
structure (Elderton, 1996). Bleaching is both a non-invasive and safe way of treating discoloured
teeth (Garber, 1997, Sarrett, 2002, Shethri et al, 2003, Schmidt and Tatum, 2006) and has a
success rate of over 90% (Suleiman, 2005a). This study aimed to determine whether bleaching
agents are as successful in altering the colour of stained direct composite resins as they are on
teeth.
The samples in the control and the tea group reverted to their baseline colour at the end of the
study period but those in the red wine group did not (table 5.2). The mean ΔE observed was
2.306 and 2.937 for the control and the tea group respectively. Statistically, the control group
showed a significant difference (p < 0.5) even though clinically the changes were imperceptible.
The tea group did not show a statistically significant difference (p > 0.5) at the end of the study
period. After the staining process, the specimens in all three groups had discoloured to some
degree reflected by a ΔE ranging from 1.040 to 19.349. The control group showed the smallest
ΔE of 1.040 and this was not clinically perceptible as the threshold value is a ΔE of 3.3.
However, the difference is statistically significant (p < 0.5). The tea and the red wine group also
showed statistically significant differences (p < 0.5) after the staining period. The colour change
was clinically perceptible, with the samples in the red wine group staining more intensely than
those in the tea group. The mean ΔE value was 7.135 and 19.349 for the tea and the red wine
group respectively and is greater than the threshold value making the colour change clinically
perceptible. The bleaching agent had little effect on the samples in the control and the red wine
group with a mean ΔE value of less than 3.3 in both groups and therefore, the difference in
colour is not clinically perceptible. Statistically, the control group showed significant differences
(p < 0.5) despite the clinically imperceptible changes in colour. In the red wine group, the
difference in colour was not statistically significant (p > 0.5) and there was no clinically
62
perceptible change in colour. This was not the case with the specimens in the tea group which
had a mean ΔE value of 5.518 which implied that the difference in colour was clinically evident
and also statistically significant (p < 0.5). All three groups showed some changes in the ΔE value
after the rehydration period. The control group had a mean ΔE value of 0.809 while the tea group
had a ΔE value of 0.772. The red wine group showed the greatest ΔE after rehydration compared
to the other two groups with a value of 1.438. Statistically, all three groups did not show
significant differences (p > 0.5) during this period. These figures are represented in table 5.2.
6. 1 Staining process
One of the null hypotheses of this study was rejected as there was a statistically significant
difference between the staining ability of the discolouring solutions used. In this study, red wine
stained the composite resin samples markedly more than tea as represented by the composite ΔE
graph in figure 5.7. The samples stained in red wine had a mean ΔE value of 19.349 at the end of
the staining period (day 7) while those stained in tea had a ΔE value of 7.135 at the end of the
staining process. The change in colour in both groups was therefore also clinically noticeable.
This change in colour of all the specimens in both tea and red wine was also found by other
researchers who used various beverages, some of which were also used in this study to stain
composite resins (Um and Ruyter, 1991, Fay et al, 1999, Turkan and Turkan, 2004, Omata et al,
2006, Villalta et al, 2006). The b* and L* components of the CIE Lab colour space were most
affected by the tea stain with the colour progressively shifting towards yellow, reflected by a Δb*
of 5.071 and all the samples darkening with a ΔL* value of -4.882. Movement along the a* axis
was minimal throughout the staining period. These findings are represented in table 5.5.
In the red wine group, the samples darkened reflected by a ΔL* value of -9.036 and there was
also a considerable shift towards yellow reflected by a Δb* value of 16.877 (table 5.7). This
dimension of colour was the most affected by the red wine. Changes along the red-green axis
(a*) was mainly towards red but these changes were only minor reflected by a Δa* value of
1.915. Both the L* and b* components stabilized on the 5th day of the 7-day staining process
with only small changes observed in these values thereafter. These figures are shown in table 5.7.
Alcohol has been shown to cause softening of the organic matrix and degradation of the surfaces
of composite resins (Strober et al, 2001, Patel et al, 2004, Bagheri et al, 2005, Okte et al, 2006,
Omata et al, 2006, Villalta et al, 2006) and more so in Bis-GMA and UDMA-based materials
63
(Okte et al, 2006). The resulting rough surface is more prone to pick up extrinsic stains than a
smoother surface (Strober et al, 2001, Patel et al, 2004, Bagheri et al, 2005, Villalta et al, 2006).
The red wine used in this study contained 14.43% alcohol and this may partly explain why it
stained the specimens more deeply than tea. The pH of the red wine was 3.82 in this study which
was more acidic than the tea which had a pH value of 5.06. Solutions with a low pH value have
an adverse effect on the surfaces of composite resins akin to that of alcohol (Strober et al, 2001,
Bagheri et al, 2005, Villalta et al, 2006). Therefore, the combination of alcohol content and
acidity of the red wine may have caused degradation of the surfaces of the samples, rendering
them more susceptible to discolouration than the tea samples.
Both tea and red wine contain polyphenols, but of different kinds and at varying levels, which
are responsible for their colouring effect. Polyphenols are by-products of plant metabolism and
are involved in plant pigmentation among other functions (Bravo, 1998). Red wine contains
tannins in abundance, which are known to cause discolouration of teeth (Macpherson et al, 2000)
while the colourants found in tea are theoflavins and theorubigins (Bravo, 1998, Suleiman et al,
2003). Tannins must have been responsible for the deep discolouration that red wine caused on
the composite resin samples. Theoflavins are yellow (Suleiman et al, 2003) and are responsible
for the positive change in the b* coordinate of the colour space of the samples during the staining
process. Theorubigins which are red (Suleiman et al, 2003), seemed not to have played a major
role in the discolouration of the specimens because the movement along the a* axis was minimal.
The different polyphenols found in tea and red wine may play a role in the difference in the
staining ability of the two beverages. Omata and others (2006) also found that red wine caused
severe discolouration of composite resins compared to tea and coffee, as did Villalta et al (2006)
when comparing red wine to coffee.
The samples in the experimental groups discoloured the most on the first day of immersion into
the staining media reflected by the largest ΔE values for any day of the study (figure 5.8 and
appendix 6). This finding is consistent with that found by Um and Ruyter (1991) and Turkan and
Turkan (2004).
In this study, the trend in discolouration for the samples in the tea group during the staining
period was a general increase in ΔE values as shown in the graph in figure 5.3. The greatest ΔE
computed occurred on the first day of the staining period reflected by a ΔE value of 2.955 shown

64
in the table of sequential colour changes in appendix 5. After this, the samples went on to
discolour more deeply, but each day, the colour change from the previous day was less marked
until the 5th day when there was a significant increase in the staining intensity reflected by a ΔE
of 1.763, compared to the previous days (figure 5.3 and appendix 5). The samples in the red wine
group also discoloured the most on the first day of immersion in the staining agent reflected by a
ΔE value of 9.588 reflected in appendix 5. The discolouration gradually deepened, but, was less
intense with each passing day (figure 5.5 and appendix 5). After the 5th day, the trend in
discolouration plateaued out as shown in the graph in figure 5.5.
The samples in the control group, after the staining period showed differences in colour that were
clinically insignificant and this was reflected by a ΔE of 1.040. The colour of the samples was
almost constant throughout this period with little dispersion of the values (figures 5.1 and 5.2).
The presence of the hydrophilic monomers bis-GMA and TEGDMA in Filtek Supreme XT,
probably contributed to the slight discolouration observed in the samples in this group. The
effects of water sorption on the colour of the composite resin specimens was demonstrated by
Imazato et al (1999) when the specimens in their control group discoloured over time during
storage in distilled water. They tested the water sorption and colour stability of composite resins
containing an antibacterial monomer by storing the samples in distilled water at 370C and 600C.
The samples in their control group incubated at 370C were markedly discoloured as reflected by
a ΔE of almost 7 units in the first week of their experiment which is much higher than that found
in this study over the same duration. In the present study, the samples in the control group were
stored in artificial saliva during the staining process. The degree of conversion of monomer to
polymer during polymerization is also important in the colour stability of composite resins
(Schulze et al, 2003). Miletic and Santini (2008) showed that the degree of conversion was
higher when resin-based composites were stored in artificial saliva than in distilled water. This
may have rendered the samples in this study less susceptible to intrinsic colour changes, hence
their colour remaining stable at the end of the staining period. Sarafianou et al, (2007) found that
water sorption in composite resins primarily affected the L* component of the colour space.
However, in this study, storage of the samples in artificial saliva produced greater colour changes
in the a* axis with a shift towards green, and in the b* coordinate, with movement towards blue
than in the L* coordinate. The b* component was the most affected of the three coordinates
during the staining period reflected by a Δb* of -0.665 compared to Δa* of -0.122 and ΔL* of
65
0.165. Higher temperatures also cause a more rapid diffusion of water through composite resins
affecting their colour stability (Imazato et al, 1999, Vichi et al, 2004, Sarafianou et al, 2007).
The samples in the present study were incubated at 370C.
The staining of the samples within the groups was variable, especially in the tea and the control
group despite the preparation protocol being kept standard for all specimens. This is reflected in
the graphs in appendix 6 of the sequential ΔE values of the individual samples for the duration of
the study. The dispersion of the ΔE values in the control group is small. Only on the 5th and 7th
days of the staining period did the dispersion increase but not significantly (figure 5.2). There
was a wide dispersion of the means during the staining period for the tea group from the 2nd to
the 7th day, with a peak in dispersion on day 5 (figure 5.4). These values ranged from 0.834 on
day 1 to 2.048 on day 6 as seen from the cumulative ΔE values table in appendix 4. The red wine
group did not show as much dispersion of the ΔE values during the staining period as the tea
group. This is reflected by a narrow dispersion of ΔE values in this group especially after the 3rd
day of staining (figure 5.6). This group also showed the least variability of all three groups in the
study. The variability in ΔE values was also a finding made by Strober et al (2001) and Lee and
Powers (2007) and is probably due to the slight differences in surface morphology of the
samples. To achieve identical surfaces between the samples and even from one point of the same
sample to another is difficult and the differences are recognized by the spectrophotometer (Sarac
et al, 2006). Incorporation of porosities may occur, scratches may be found on some specimens
and the degree of conversion may not be the same in all samples (Sarac et al, 2006). In this
study, the specimens were formed by curing the composite resin against polyester strips with no
subsequent polishing. Polyester strips produce the smoothest surface possible (Baseren, 2004,
Patel et al, 2004, Bagheri et al, 2005, Sarac et al, 2006, Attar, 2007) and eliminate the oxygen-
inhibited layer which is responsible for the uncured material at the surface (Rueggeberg and
Margeson, 1990). However, it has been shown that the layer under the matrix has a lower degree
of conversion compared to the bulk of the composite resin which is not exposed to oxygen at all
prior and during curing (Patel et al, 2004). This surface layer is resin-rich (Setcos et al, 1999,
Patel et al, 2004, Attar, 2007) and this component of composite resin has been shown to be most
responsible for the colour changes within these materials (Ferracane et al, 1985, Kolbeck et al,
2006). This layer is softer and prone to wear and can result in diminished aesthetics (Setcos et al,
1999, Baseren, 2004, Patel et al, 2004). It may also contain voids (Setcos et al, 1999) which may
66
partly explain the variability of the colour changes as reflected by a varied ΔE and different
degrees of staining within the groups. It is therefore suggested that this layer be removed by
polishing, for the longevity of composite restorations (Baseren, 2004, Patel et al, 2004). The
voids may have been avoided by placing a weight over the polyester strips instead of the glass
slide. However, this weight would have to be transparent to prevent interference with the
polymerization of the composite resin samples through the weight. This should be done in future
studies.
Spectrophotometers use either the specular component included (SCI) geometry or the specular
component excluded (SCE) geometry (Lee et al, 2002, Sarac et al, 2006). The SCE geometry is
better suited to measure colour differences when surface variations may exist because it takes
these differences into account, giving more accurate colour readings (Lee et al, 2002, Sarac et al,
2006). The SCI geometry was used in this study and probably resulted in the intra-group
differences observed in the colour measurements of the samples. The effects of edge-loss error
have also been identified as a source of variability of results from spectrophotometry (Paravina et
al, 2007). In this study, the circumference of the samples fitted exactly into a prepared silicon jig
but the height and shape did not match the conical measuring probe precisely, resulting in some
reflected light being lost around the margins. This may also have played a role in the variability
of the colour readings within the groups during the study.
6. 2 Bleaching Process
The other null hypotheses of this study was also disproven by the finding that there was a
statistically significant difference in the colour of the stained samples in the tea group, but not in
the red wine group based on the ΔE values after subjecting the specimens to the bleaching agent
(table 5.2 and figure 5.8). The mean ΔE value was 3.277 for the red wine group and 5.518 for the
tea samples for the period between staining and bleaching and with the threshold at 3.3, the
difference was clinically significant for the tea group but not for the red wine group. The
beginning of the whitening stage in the tea group was marked by a significant change in colour
reflected by a ΔE value of 4.930 as the samples approached the baseline colour. The greatest ΔE
value was observed on the first day of bleaching. The graph in figure 5.3 shows this trend. After
the first bleaching treatment some samples had a ΔE value of over 7.0 units as shown on the
table of sequential colour changes in appendix 5. All L*a*b* values changed with all the

67
specimens lightening, and the chroma (a* and b* values) shifting towards the green and blue
directions. b* representing the blue-yellow axis changed the most reflecting a value of -3.554
and a* representing the green-red coordinate, the least with a value of -1.336. A ΔL* value of
2.927 was observed after the bleaching cycle (table 5.6). After this initial bleaching treatment,
the samples did not whiten much more reflected by a ΔE that remained in the 5.1 region during
the subsequent bleaching cycles. During this time, the samples remained largely unchanged as
far as lightness and the red-green dimension were concerned. Any changes observed after the
first whitening treatment were attributed to the b* axis, with a small shift towards blue. These
figures are represented in table 5.6.
The red wine group too showed the greatest colour change after the first bleaching treatment, but
the effect was less than that observed for the tea group (figure 5.8), as reflected by a mean ΔE of
3.268 (table 5.8). On the second day and third days of treatment with the bleaching agent, the
samples further changed colour following the same pattern as the first day, but the differences
were small, as reflected by the ΔE value of 3.342 and 3.277 respectively. The L* component
increased, lightening the specimens to a small extent. However, there was a movement towards
red as reflected by a higher a* value and the samples became more blue as reflected by a
decreased b* value. The samples did not change colour markedly after the initial bleaching
session with a ΔE value of less than half a unit after the second and third whitening cycles. The
rehydration period produced an unremarkable colour change but, individual components within
the L*a*b* system, showed a mild rebound with the samples darkening slightly and a* and b*
coordinates continued towards red and blue, respectively. These findings are presented in table
5.8. This minor rebound is reflected by a ΔE of 1.438 between day 10 and 11, shown in appendix
5.
Tooth bleaching has very high success rates but this study showed that tooth whitening agents
are not as effective on stained composites, as they are on discoloured teeth. This conclusion was
supported by Villalta et al (2006). The colour of the samples in the tea group returned to
clinically acceptable levels with a ΔE value of 2.937 that is close to the baseline after the
bleaching process, but not to the original colour. This finding is consistent with Turkun and
Turkun (2004). All the samples reverted to colours close to but not exactly baseline values in
their study. In the present study, the bleaching agent was ineffective in removing the stains from
the samples in the red wine group leaving the specimens severely discoloured at the end of the

68
bleaching process with a ΔE value of 18.852. Although both, teeth according to Watts and Addy
(2001) and composite resins according to Turkun and Turkun (2004) and Bagheri et al (2005),
discolour by absorption and adsorption of chromogenic foods and beverages, the two have
different structures and composition and therefore the outcome of bleaching on them may also be
different (Kim et al, 2004). Rosentritt et al, (2005) showed that whitening systems have a
significantly greater effect on enamel than on composite resins. Teeth become whiter due to the
ease of movement of free radicals released from hydrogen peroxide into enamel and dentine
(Suleiman, 2004, Villalta et al, 2006) via enamel micropores which communicate directly with
dentinal tubules resulting in desirable whitening effects (Suleiman et al, 2003). The structure of
teeth is well ordered probably facilitating this movement, however, the structure of composite
resins, is a highly cross-linked polymer (Anusavice, 2003, Miletic and Santini, 2008) which may
impede movement of free radicals into the structure of the composite resin resulting in less
effective bleaching. Another possible explanation for the difference in bleaching between teeth
and composite resins is that chromogens may combine chemically with unreacted monomers in
the composite resin (Monaghan et al, 1992a, Buchalla et al, 2002, Rosentritt et al, 2005) and are
therefore not readily available for free radical oxidation. Kim et al (2004) postulated that the
coupling agent in composite resin may also be degraded by bleaching agents with a shift of stain
accumulation to the matrix-filler interface. This suggests that the chromogens may remain in this
interface and do not diffuse out of the material, as occurs with teeth, thereby leaving some
residual staining within the composite resin.
Although not part of the study, a sample from both the tea and the red wine group was ground on
an abrasive paper along the outer circumference to assess, under a microscope, the depth of stain
penetration, if any. The tea stains were only superficial while the red wine discolouration was
evident in the subsurface region. Tea contains high polarity yellow colourants which stain
composite resins by adsorption onto their surfaces (Um and Ruyter, 1991, Bagheri et al, 2005).
These are easily removed by toothbrushing (Um and Ruyter, 1991, Bagheri et al, 2005). Turkun
and Turkun (2004) showed that both polishing systems and bleaching agents removed tea and
coffee stains from composite resins but that bleaching was the more effective method. Red wine
on the other hand probably stains by absorption and adsorption due to the changes it confers on
the surfaces of the composite resin and the degradation of the matrix-filler interface. Um and
Ruyter (1991) stained composite resin samples with tea and coffee and attempted to clean them
69
by brushing once discolouration had occurred. Using this method, the majority of the tea stains
were removed but not the coffee stains. They postulated that colourants in coffee were
compatible with components in the organic matrix of composite resins and caused discolouration
by both adsorption and absorption. This may also have occurred with the samples discoloured by
red wine in the present study. These chromogens may therefore not have been accessible for
oxidation by the free radicals. Scanning electron microscopy pictures before and after the
staining period should be included in future studies to ascertain this postulation. This may
explain the lightening effect with the bleaching treatment in the tea group compared to the red
wine group whose samples remained highly stained even after three applications of the
whitening agent.
Other studies that assessed the effects of bleaching agents on the colour of composite resins
found them to be lightened by the whitening systems (Monaghan et al, 1991a, Monaghan et al,
1991b, Canay and Cehreli, 2003, Kim et al, 2004, Rosentritt et al, 2005). In this study the
converse was found in the control group; the changes recorded after the three bleaching sessions
are reflected in table 5.4. Of the three tri-stimulus attributes, Δb* was the highest at the end of
the third and final whitening procedure with a shift towards blue. ΔL* and Δa* were minor with
the specimens darkening and moving towards green. All three components in the colour space
decreased after the rehydration phase; however, the ΔE was only 0.809 which is not clinically
perceptible (appendix 5). The previous studies stored the specimens in distilled water for a few
hours between the bleaching cycles (Fay et al, 1999, Villalta et al, 2006) while in this study, the
specimens were stored for 1 week intervals in distilled water, between treatments. Composite
resin tends to absorb water in the oral environment (Buchalla et al, 2002, Vichi et al, 2004, Patel
et al, 2004, Villalta et al, 2006) which causes darkening of these restorations over time (Buchalla
et al, 2002, Patel et al, 2004, Villalta et al, 2006, Sarafianou et al, 2007). Water sorption, due to
the longer period the samples were stored in distilled water may have played a significant role in
the discolouration of the specimens in the control group in this study compared to previous
research.
This study used Opalescence Xtra Boost as the whitening agent which is an in-office, chemically
activated bleaching agent. The duration of application of in-office whitening systems is generally
much shorter than that of other vital tooth bleaching methods (Kim et al, 2004). Other studies
that successfully removed extrinsic stains from discoloured composite resins used longer
70
protocols with paint-on whitening systems (Fay et al, 1999, Villalta et al, 2006). Zekonis et al
(2003) showed in-vivo that at-home bleaching agents were significantly more effective than in-
office whitening systems, despite the higher concentration of the latter. Contact time may
therefore be a factor in the difference in whitening between previous studies and the present
study. Zekonis et al (2003) went on to suggest that in-office bleaching agents may need to be
applied for longer periods to achieve the same results as at-home products, however, the readings
in this study showed little change in colour after the first bleaching session in both experimental
groups and by extrapolation, it can be assumed that further treatment would not have produced a
dramatic improvement of the discoloured specimens. Turkun and Turkun (2004) used an in-
office bleaching agent in their research, with their samples being effectively whitened. But, it
must be noted, that their staining agents, coffee and tea, did not severely discolour their samples.
Additionally, Omata and others (2006) showed that red wine produces greater discolouration of
composite samples, than either tea or coffee.
The effects of rehydration were also measured in this study. The lack of significant change
between the final bleaching treatment and the rehydration period in all three groups shows that
the rebound effect is minimal. Kugel et al, (2006) showed in-vivo that Opalescence Xtra Boost
did not produce a significant rebound effect after bleaching compared to another in-office
bleaching agent. Also, bleaching agents that contain glycerin as the carrier for the active
constituents draw out water from dentine, resulting in dehydration of teeth following whitening
(Betke et al, 2006). Manufacturers are now incorporating water into their bleaching products to
counteract the effects of dehydration (Suleiman, 2005b). Composite resins may not contain much
water in their structures to render them susceptible to the dehydrating effects of tooth whitening
systems as teeth do, which may explain the clinically insignificant changes during the
rehydration period. Secondly, from the results of the study of Kugel et al (2006), Opalescence
Xtra Boost does not seem to cause dehydration.
6. 3 Limitations of the Study
This was an in-vitro study and therefore the staining process was exaggerated. In life,
restorations are regularly cleaned through tooth brushing and exposure to staining foods and
beverages is not continuous (Bagheri et al, 2005). It is important though to note that staining of
composites is still a problem even with newer nanofilled composites with different monomers
71
and filler particle size. However, this study tested only Filtek Supreme XT; therefore there was
no comparison of the stainability of other tooth coloured materials.
This study concentrated on the development and removal of extrinsic stains from composite
resins. Kolbeck et al (2006) stated that intrinsic discolouration was more important because it
involved all the layers of the material, whereas extrinsic staining is confined to the surface and
subsurface regions of composite resins. Future studies need to investigate the factors relating to
intrinsic staining.
In tooth bleaching, at-home products have been shown to produce better results than in-office
systems (Kugel et al, 2006). Combination treatment, where in-office agents start the whitening
process and night-guard vital bleaching then follows gives very good results (Goldstein, 1997,
Shethri et al, 2003, Suleiman, 2005b, Buchalla and Attin, 2007, Kihn, 2007). In this study, only
an in-office bleaching technique was used. Therefore, the effectiveness of other methods such as
combination therapy or at-home therapy was not evaluated.
72
CHAPTER7 CONCLUSIONS AND RECOMMENDATIONS
7. 1 Conclusions
This in-vitro study assessed the ability of an in-office bleaching agent in removing stains from
discoloured composite resin specimens. The first null hypothesis of this study was rejected
because tea and red wine stained composite resin samples to differing intensities as measured by
a reflectance spectrophotometer. The second null hypothesis was also rejected as the tea group
specimens reverted to baseline colour, after bleaching but the red wine samples remained deeply
stained. The following conclusions can be drawn from this study:
• Composite resins discolour in the presence of beverages with colourants. All the samples
immersed in either tea or red wine discoloured markedly.
• Red wine discolours composite resins more than tea. There was a statistically significant
difference in the staining ability of the two beverages.
• Opalescence Xtra Boost is effective against extrinsic tea stains on composite resin
samples and returns stained samples to a colour value just below what could be clinically
perceptible as a different colour.
• Opalescence Xtra Boost is ineffective against discolouration caused by red wine on
composite resin samples. All the samples in the red wine group were still severely stained
at the end of the bleaching process.
• Opalescence Xtra Boost does not dehydrate composite resins and therefore a rebound
effect of the bleaching process does not occur.
From this study, it can be seen that extrinsic staining of composite resins is still a problem even
with materials manufactured using innovative technology. The composite resin tested was a
nanofilled material but was still susceptible to staining. However, this was an in-vitro study and
in-vivo studies need to be carried out to ascertain the conclusions of this study.
7. 2 Recommendations
The results obtained in this study are based on an in-vitro experiment and long term in-vivo
studies are required to verify these results. Further research is needed in the area of composite
73
resin discoloration which has been a major concern for the aesthetics of these tooth-coloured
materials. Until this is accomplished, it is recommended that all composite resin restorations
should be polished to increase their resistance to extrinsic staining.
Bleaching agents seem to be successful in removing some extrinsic surface stains from
composite resins but research for alternative methods that are safe and non-invasive for the
treatment of discoloured composite restorations is required especially concerning internalized
and intrinsic staining.
74
REFERENCES
3M ESPE, Filtek Supreme Technical Product Profile, 2005
Attar N., 2007. The Effect of Finishing and Polishing Procedures on the Surface Roughness of
Composite Resin Materials. J Contemp Dent Prac, 8: 27 – 35.
ADA Council on Scientific Affairs, 2003. Direct and Indirect Restorative Materials. JADA, 134:
463 – 472.
Adams T. C., Pang P. K., 2004. Lasers in Aesthetic Dentistry. Dent Clin N Am, 48: 833 – 860.
Anusavice K. J., 2003. Phillips Science of Dental Materials, 11th Edition, Philadelphia:
Saunders.
Attin T., Hanning C., Wiegand A., Attin R., 2004. Effect of Bleaching on Restorative Materials
and Restorations – A Systematic Review. Dent Mater, 20: 852 – 861.
Attin T., Paque F., Ajam F., Lennon A. M., 2003. Review of the Current Status of Tooth
Whitening with the Walking Bleach Technique. Int Endo J, 36: 313 – 329.
Bagheri R., Burrow M. F., Tyas M., 2005. Influence of Food-Simulating Solutions and Surface
Finish on Susceptibility to Staining of Aesthetic Restorative Materials. J Dent, 33: 389 – 398.
Baseren M., 2004. Surface Roughness of Nanofill and Nanohybrid Composite Resin and
Ormocer-Based Tooth Colored Restorative Materials after Several Finishing and Polishing
Procedures. J Biomater Appl, 19: 121 – 134.
Bayne S. C. 2000. Our Future in Restorative Dental Materials. J Esthet Dent, 12: 175 – 182.
Beall A. E., 2007. Can a New Smile Make You Look More Intelligent and Successful? Dent Clin
N Am, 51: 289 – 297.
Betke H., Kahler E., Reitz A., Hartmann G., Lennon A., Attin T., 2006. Influence of Bleaching
Agents and Desensitizing Varnishes on the Water Content of Dentin. Oper Dent, 31: 536 – 542.
75
Bravo L., 1998. Polyphenols: Chemistry, Dietary Sources, Metabolism and Nutritional
Significance. Nutrition Rev, 56: 317 – 333.
Brewer J. D., Wee A., Seghi R., 2004. Advances in Color Matching. Dent Clin N Am, 48: 341 –
358.
Brook A. H., Smith R. N., Lath D. J., 2007. The Clinical Measurement of Tooth Colour and
Stain. Int Dent J, 57: 324 – 330.
Buchalla W., Attin T., 2007. External Bleaching Therapy with Activation by Heat, Light or
Laser – A Systematic Review. Dent Mater, 23: 586 – 596.
Buchalla W., Attin T., Hilgers R. D., Hellwig E., 2002. The Effect of Water Storage and Light
Exposure on the Color and Translucency of a Hybrid and a Microfilled Composite. J Prosthet
Dent, 87: 264 – 270.
Burrell K., 1997. ADA Supports Vital Tooth Bleaching- But Look for the Seal. JADA, 128: 3S-
5S.
Canay S., Cehreli M. C., 2003. The Effect of Current Bleaching Agents on the Color of Light-
Polymerized Composites in Vitro. J Prosthet Dent, 89: 474 – 478.
Christensen G. J., 2005. Are Snow-white Teeth Really so Desirable? JADA, 136: 933 – 935.
Cullen D. R., Nelson J. A., Sandrik J. L., 1993. Peroxide Bleaches: Effect on Tensile Strength of
Composite Resins. J Prosthet Dent, 69; 247 – 249.
Dahl J. E, Pallesen U., 2003. Tooth Bleaching – A Critical Review of the Biological Aspects.
Crit Rev Oral Biol Med, 14: 292-304.
Derbabian K., Marzola R., Donovan T., Arcidiacono A., 2001. The Science of Communicating
the Art of Esthetic Dentistry. Part III: Precise Shade Communication. J Esthet Restor Dent, 13:
154 – 162.

76
Doray P. A., Eldiwany M. S., Powers J. M., 2003. Effect of Resin Surface Sealers on
Improvement of Stain Resistance for a Composite Provisional Material. J Esthet Rest Dent, 15;
244 – 250.
El-din A. K. N., Miller B. H., Griggs J. A., Wakefield C., 2006. Immediate Bonding to Bleached
Enamel. Oper Dent, 31: 106 – 114.
Elderton R. J., 1996. Treating Restorative Dentistry to Health. Brit Dent J. 181: 220 – 225.
Fay R-M., Servos T., Powers J. M., 1999. Color of Restorative Materials after Staining and
Bleaching. Oper Dent, 24: 292 -296.
Ferracane J. L., Moser J. B., Greener E. H., 1985. Ultraviolet Light-Induced Yellowing of Dental
Restorative Resins. J Prosthet Dent, 54: 483 – 487.
Fondriest J., 2003. Shade Matching in Restorative Dentistry: The Science and Strategies. Int J
Perio Restor Dent, 23: 467 – 479.
Friedman S., 1997. Internal Bleaching: Long-term Outcomes and Complications. JADA, 128:
51S – 55S.
Garber D. A., 1997. Dentist Monitored Bleaching: A Discussion of Combination and Laser
Bleaching. JADA, 128: 26S-39S.
Garcia A. H., Lozano M. A. M., Vila J. C., Escribano A. B., Galve P. F., 2006. Composite
Resins. A Review of the Materials and Clinical Indications. Med Oral Patol Oral Cir Bucal, 11:
E215 – 220.
Gerlach R. W., 2004. Whitening Paradigms Revisited: Introduction of a Thin and Concentrated
Hydrogen Peroxide Gel Technology for Professional Tooth Whitening. Comp Cont Edu Dent,
25: 4 – 8.
Goldstein R. E., 1997. In-Office Bleaching, Where We Came From, Where We Are Today.
JADA 128: 11S-15S.
Goldstein R. E., Garber D., A. 1995. Complete Dental Bleaching. Chicago: Quintessence
77
Guler A. U., Kurt S., Kulunk T., 2005a. Effects of Various Finishing Procedures on the Staining
of Provisional Restorative Materials. J Prosthet Dent, 93: 453 – 458.
Guler A. U., Yilmaz F., Kulunk T., Guler E., Kurt S. 2005b, Effects of Different Drinks on
Stainability of Resin Composite Provisional Restorative Materials. J Prosthet Dent, 94: 118 –
124.
Haywood V. B., 1992. History, Safety and Effectiveness of Current Bleaching Techniques and
Applications of the Nightguard Vital Bleaching Technique. Quint Int, 23: 471 – 488.
Haywood V. B., 2002. Greening of the Tooth-Amalgam Interface during Extended 10%
Carbamide Peroxide Bleaching of Tetracycline-Stained Teeth: A Case Report. J Esthet Rest
Dent, 14: 12 – 17.
http://www.ewine.co.za
http://www.ketepa.com
Imazato S., Tarumi H., Kato S., Ebisu S., 1999. Water Sorption and Colour Stability of
Composites Containing the Antibacterial Monomer MDPB. J Dent, 27: 270 – 283.
Jarad F. D., Russell M. D., Moss B. W., 2005. The Use of Digital Imaging for Colour Matching
and Communication in Restorative Dentistry. Brit Dent J, 199: 43 – 49.
Joiner A. 2004, Tooth Colour: A Review of the Literature. J Dent, 32: 3 – 12.
Joiner A., 2006. The Bleaching of Teeth: A Review of the Literature. J Dent, 34: 412 – 419.
Joiner A., 2007. Review of the Effects of Peroxide on Enamel and Dentine Properties. J Dent,
35: 889 – 896.
Khurana R., Tredwin C. J., Weisbloom M., Moles D. R., 2007. A Clinical Evaluation of the
Individual Repeatability of Three Commercially Available Colour Measuring Devices. Brit Dent
J, 203: 675 – 680.
Kihn P. W., 2007. Vital Tooth Whitening. Dent Clin N Am, 51: 319 – 331.
78
Kim J-H., Lee Y-K., Lim B-S., Rhee S-H., Yang H-C., 2004. Effect of Tooth-Whitening Strips
and Films in Changes in Color and Surface Roughness of Resin Composites. Clin Oral Invest, 8:
118-122.
Kolbeck C., Rosentritt M., Lang R., Handel G., 2006. Discoloration of Facing and Restorative
Composites by UV-Irradiation and Staining Food. Dent Mater, 22: 63 – 68.
Koksal T., Dikbas I., 2008. Colour Stability of Different Denture Teeth Materials against
Various Staining Agents. Dent Mater J, 27: 139 – 144.
Kugel G., Papathanasiou A., Williams A. J., Anderson C., Ferreira S., 2006. Clinical Evaluation
of Chemical and Light-Activated Tooth Whitening Systems. Comp Cont Ed Dent, 27: 54 – 62.
Lai S. C. N., Tay F. R., Cheung G. S. P., Mak Y. F., Carvalho R. M., Wei S. H. Y., Toledano M.,
Osorio R., Pashley D. H., 2002. Reversal of Compromised Bonding in Bleached Enamel. J Dent
Res, 81: 477 – 481.
Lee Y-K., Lim B-S, Kim C-W., 2002. Effect of Surface Conditions on the Color of Dental Resin
Composites. J Biomed Mater Res (Appl Biomater), 63: 657 – 663.
Lee Y-K., Lim B-S., Rhee H-C., Yang H-C., Powers J. M., 2005. Color and Translucency of A2
Shade Resin Composites after Curing, Polishing and Thermocycling. Oper Dent, 30: 436 – 442.
Lee Y-K., Powers J. M., 2007. Combined Effect of Staining Substances on the Discoloration of
Esthetic Class V Dental Restorative Material . J Mater Sci: Mater Med , 18: 165 - 170.
Leinfelder K. F., 2001. Dentine adhesives for the Twenty First Century. Dent Clin N Am, 46: 1 -
6.
LeSage B., 2007. Aesthetic Anterior Composite Restorations: A Guide to Direct Placement. Dent
Clin N Am, 51: 359 – 378.
Liebenberg W. H., 1997. Intracoronal Lightening of Discolored Pulpless Teeth: A Modified
Walking Bleach Technique. Quint Int, 28: 771 – 777.
79
Macpherson L. M. D., Stephen K. W., Joiner A., Schafer F., Huntington E., 2000. Comparison of
a Conventional and Modified Tooth Stain Index. J Clin Perio, 27: 854 – 859.
Miletic V. J., Santini A., 2008. Remaining Unreacted Methacrylate Groups in Resin-Based
Composites with Respect to Sample Preparation and Storing Conditions Using Micro-Raman
Spectroscopy. J Biomed Mater Res Part B: Appl Biomater. Available from:
http://www3.interscience.wiley.com [Accessed 1 September 2008].
Mitra S. B., Wu D., Holmes B. N., 2003. An Application of Nanotechnology in Advanced Dental
Materials. JADA, 134: 1382 – 1390.
Monaghan P., Trowbridge T., Lautenschlager E., 1992a. Composite Resin Color Change after
Vital Tooth Bleaching. J Prosthet Dent, 67: 778 – 781.
Monaghan P., Lim E., Lautenschlager E., 1992b. Effects of Home Bleaching Preparations on
Composite Resin Color. J Prosthet Dent, 68: 575 – 578.
Morley J., 1999. The Role of Cosmetic Dentistry in Restoring a Youthful Appearance. JADA,
130: 1166 – 1172.
Okte Z., Villalta P., Garcia-Godoy F., Lu H., Powers J. M., 2006. Surface Hardness of Resin
Composites after Staining and Bleaching. Oper Dent, 31: 623 – 628.
Omata Y., Uno S., Nakaoki Y., Tanaka T., Sano H., Yoshida S., Sidhu S. K., 2006. Staining of
Hybrid Composites with Coffee, Oolong Tea or Red Wine. Dent Mater J, 25: 125 – 131.
Opalescence Xtra Boost Product Profile, 2003
Paravina R. D., Majkic G., Imai F. H., Powers J. M., 2007. Optimization of Tooth Colour and
Shade Guide Design. J Prosth, 16: 269 – 276.
Park J-H., Lee Y-K., Lim B-S., 2006. Influence of Illuminants on the Colour Distribution of
Shade Guides. J Prosthet Dent, 96: 402 – 411.
Patel S. B., Gordan V. V., Barrett A. A., Shen C., 2004. The Effect of Surface Finishing and
Storage Solutions on the Color Stability of Resin-Based Composites. JADA, 135: 587 – 594.
80
Perdigao J., Baratieri L. N., Arcari G. M., 2004. Contemporary Trends and Techniques in Tooth
Whitening: A Review. Prac Proced Aesthet Dent, 16: 185 – 192.
Rosentritt M., Lang R., Plein T., Behr M., Handel G., 2005. Discoloration of Restorative
Materials after Bleaching Application. Quint Int, 36: 33-39.
Rotstein I., Dogan H., Avron Y., Shemesh H., Steinberg D., 2000. Mercury Release from Dental
Amalgam after Treatment With 10% Carbamide Peroxide In Vitro. Oral Surg Oral Med Oral
Path, 89: 216 – 219.
Rueggeberg F. A., Margeson D. H., 1990. The Effect of Oxygen Inhibition on an Unfilled/Filled
Composite System. J Dent Res, 69: 1652 – 1658.
Sadowsky S. J., 2006. An Overview of Treatment Considerations for Esthetic Restorations: A
Review of the Literature. J Prosthet Dent, 96: 433- 442.
Sarac D., Sarac Y. S., Kulunk S., Ural C., Kulunk T., 2006. The Effect of Polishing Techniques
on the Surface Roughness and Color Change of Composite Resins. J Prosthet Dent, 96: 33 – 40.
Saravana K. R., Vijayalakshmi R., 2006. Nanotechnology in Dentistry. Ind J Dent Res, 17: 62 –
65.
Sarafianou A., Iosifidou S., Papadopoulos T., Eliades G., 2007. Color Stability and Degree of
Cure of Direct Composite Restoratives after Accelerated Aging. Oper Dent, 32: 406 – 411.
Sarrett D. C., 2002. Tooth whitening today. JADA, 133: 1535-1538.
Schemehorn B., Gonzalez-Cabezas C., Joiner A., 2004. A SEM Evaluation of a 6% Hydrogen
Peroxide Tooth Whitening Gel on Dental Materials In Vitro. J Dent, 32 (Suppl 1): 35 – 39.
Schmidt C. J., Tatum S. A., 2006. Cosmetic Dentistry. Curr Opin Otolaryngo Head Neck Surg,
14: 254 – 259.
Schulze K. A., Marshall S. J., Gansky S. A., Marshall G. W., 2003. Color Stability and Hardness
in Dental Composites after Accelerated Aging. Dent Mater, 19: 612 – 619.
81
Seghi R. R., Gritz M. D., Kim J., 1990. Colorimetric Changes in Composites Resulting from
Visible-Light-Initiated Polymerization. Dent Mater, 6: 133 – 137.
Setcos J. C., Tarim B., Suzuki S., 1999. Surface Finish Produced on Resin Composites by New
Polishing Systems. Quint Int, 30: 169 – 173.
Shethri S. A., Matis B. A., Cochran M. A., Zekonis R., Stropes M., 2003. Clinical Evaluation of
Two In-Office Bleaching Products. Oper Dent, 28: 488 – 495.
Spear F. M., Kokich V. G., 2007. A Multidisciplinary Approach to Esthetic Dentistry. Dent Clin
N Am, 51: 487 – 505.
Spyrides G.M., Perdigao J, Pagani C., Araujo M. A., Spyrides S. M., 2000. Effect of Whitening
Agents on Dentin Bonding. J Esthet Dent, 12: 264 – 270.
Suleiman M., 2004. An Overview of Bleaching Techniques: 1. History, Chemistry, Safety and
Legal Aspects. Dent Update, 31: 608 – 616.
Suleiman M., 2005a. An Overview of Bleaching Techniques: 2. Night Guard Vital Bleaching
and Non-Vital Bleaching. Dent Update, 32: 39 – 46.
Suleiman M., 2005b. An Overview of Bleaching Techniques: 3. In–Surgery or Power Bleaching.
Dent Update, 31: 101 – 108.
Suleiman M., Addy M., Rees J. S., 2003. Development and Evaluation of a Method In-Vitro to
Study the Effectiveness of Tooth Bleaching. J Dent, 31: 415- 422.
Strober T., Gilde H., Lenz P., 2001. Color Stability of Highly Filled Composite Resin Materials
for Facings. Dent Mater, 17: 87 – 94.
Swift E. J., May K. N., Wilder A. D., Heymann H. 0., Bayne S., 1999. Two-Year Clinical
Evaluation of Tooth Whitening Using an At-Home Bleaching System. J Esthet Dent, 11: 36 –
42.
Turker S. B., Biskin T., 2003. Effect of Three Bleaching Agents on the Surface Properties of
Three Different Esthetic Restorative Materials. J Prosthet Dent, 89: 466-73.
82
Turkun L. S., Turkun M., 2004. Effect of Bleaching and Repolishing Procedures on Coffee and
Tea Stain Removal from Three Anterior Composite Veneering Materials. J Esthet Rest Dent, 16:
290 -301.
Tredwin C. J., Naik S., Lewis N. J., Scully C. B. E., 2006. Hydrogen Peroxide Tooth-Whitening
(Bleaching) Products: Review of Adverse Effects and Safety Issues. Brit Dent J, 200: 371 – 376.
Um C. M., Ruyter I. E., 1991. Staining of Resin-Based Veneering Materials with Coffee and
Tea. Quint Int, 22: 377 – 386.
Usumez A., Ozturk N., Ozturk B., 2005. Two-year Color Changes of Light-cured Composites:
Influence of Different Light-curing Units. Oper Dent, 30: 655 – 660.
Vichi A., Ferrari M., Davidson C. L., 2004. Color and Opacity Variations in Three Different
Resin-Based Composite Products after Water Aging. Dent Mater, 20: 530 – 534.
Villalta P., Lu H., Okte Z., Garcia-Godoy F., Powers J. M., 2006. Effects of Staining and
Bleaching on Color Change of Dental Composite Resins. J Prosthet Dent, 95: 137-42.
Wakefield C. W., Kofford K. R., 2001. Advances in Restorative Materials. Dent Clin N Am, 46:
7 – 26.
Watts A., Addy M., 2001. Tooth Discolouration and Staining: A Review of the Literature. Brit
Dent J, 190: 309 – 316.
Yalcin F., Gurgan S., 2005. Effect of Two Different Bleaching Regimens on the Gloss of Tooth
Colored Restorative Materials. Dent Mater, 21: 464 – 468.
Zekonis R., Matis B. A., Cochran M. A., Shetri S. A., Eckert G. J., Carlson T. J., 2003. Clinical
Evaluation of In-Office and At-Home Bleaching Treatments. Oper Dent, 28: 114 – 121.
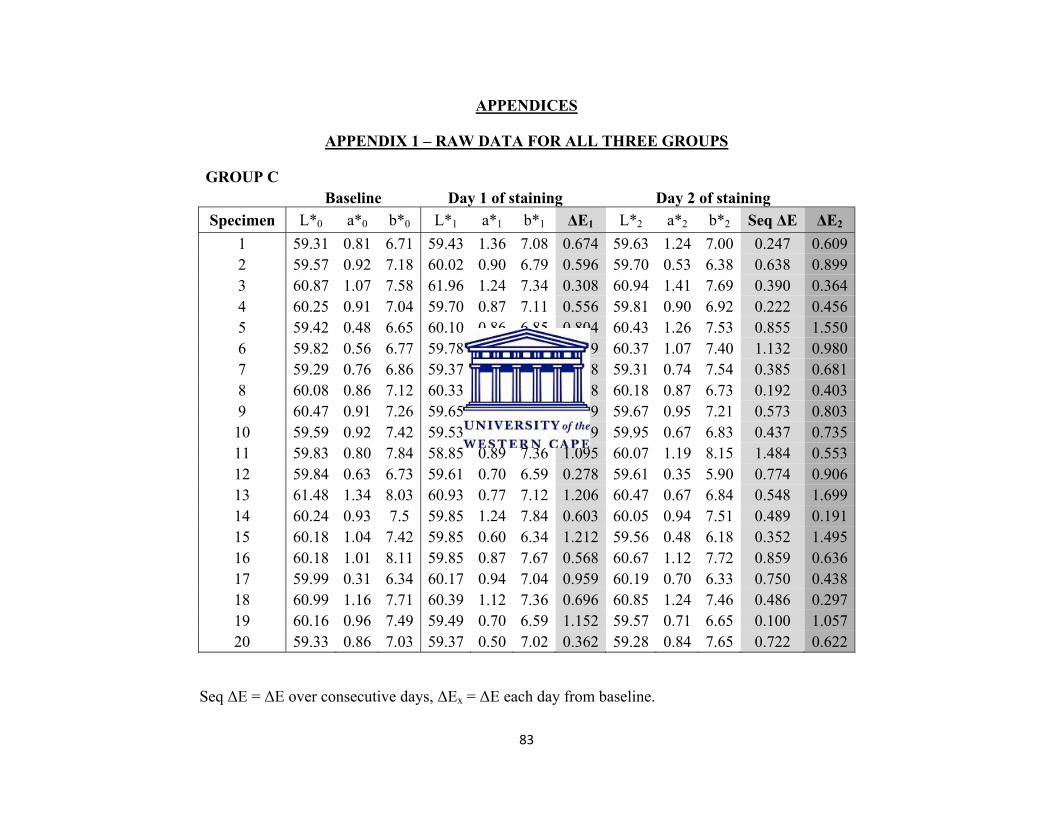
83
APPENDICES
APPENDIX 1 – RAW DATA FOR ALL THREE GROUPS
GROUP C Baseline Day 1 of staining Day 2 of staining Specimen L*0 a*0 b*0 L*1 a*1 b*1 ΔE1 L*2 a*2 b*2 Seq ΔE ΔE2
1 59.31 0.81 6.71 59.43 1.36 7.08 0.674 59.63 1.24 7.00 0.247 0.6092 59.57 0.92 7.18 60.02 0.90 6.79 0.596 59.70 0.53 6.38 0.638 0.8993 60.87 1.07 7.58 61.96 1.24 7.34 0.308 60.94 1.41 7.69 0.390 0.3644 60.25 0.91 7.04 59.70 0.87 7.11 0.556 59.81 0.90 6.92 0.222 0.4565 59.42 0.48 6.65 60.10 0.86 6.85 0.804 60.43 1.26 7.53 0.855 1.5506 59.82 0.56 6.77 59.78 0.61 6.55 0.229 60.37 1.07 7.40 1.132 0.9807 59.29 0.76 6.86 59.37 0.52 7.23 0.448 59.31 0.74 7.54 0.385 0.6818 60.08 0.86 7.12 60.33 0.86 6.85 0.368 60.18 0.87 6.73 0.192 0.4039 60.47 0.91 7.26 59.65 1.23 7.71 0.989 59.67 0.95 7.21 0.573 0.80310 59.59 0.92 7.42 59.53 0.69 6.71 0.749 59.95 0.67 6.83 0.437 0.73511 59.83 0.80 7.84 58.85 0.89 7.36 1.095 60.07 1.19 8.15 1.484 0.55312 59.84 0.63 6.73 59.61 0.70 6.59 0.278 59.61 0.35 5.90 0.774 0.90613 61.48 1.34 8.03 60.93 0.77 7.12 1.206 60.47 0.67 6.84 0.548 1.69914 60.24 0.93 7.5 59.85 1.24 7.84 0.603 60.05 0.94 7.51 0.489 0.19115 60.18 1.04 7.42 59.85 0.60 6.34 1.212 59.56 0.48 6.18 0.352 1.49516 60.18 1.01 8.11 59.85 0.87 7.67 0.568 60.67 1.12 7.72 0.859 0.63617 59.99 0.31 6.34 60.17 0.94 7.04 0.959 60.19 0.70 6.33 0.750 0.43818 60.99 1.16 7.71 60.39 1.12 7.36 0.696 60.85 1.24 7.46 0.486 0.29719 60.16 0.96 7.49 59.49 0.70 6.59 1.152 59.57 0.71 6.65 0.100 1.05720 59.33 0.86 7.03 59.37 0.50 7.02 0.362 59.28 0.84 7.65 0.722 0.622
Seq ΔE = ΔE over consecutive days, ΔEx = ΔE each day from baseline.
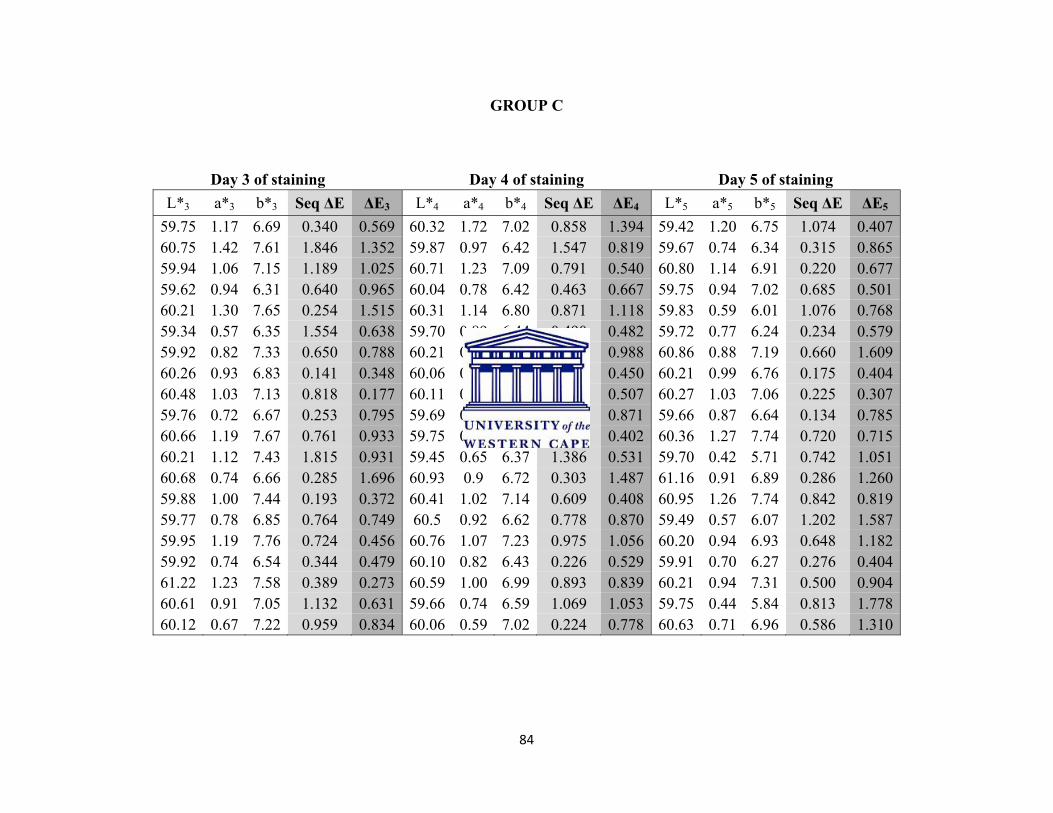
84
GROUP C
Day 3 of staining Day 4 of staining Day 5 of staining L*3 a*3 b*3 Seq ΔE ΔE3 L*4 a*4 b*4 Seq ΔE ΔE4 L*5 a*5 b*5 Seq ΔE ΔE5
59.75 1.17 6.69 0.340 0.569 60.32 1.72 7.02 0.858 1.394 59.42 1.20 6.75 1.074 0.40760.75 1.42 7.61 1.846 1.352 59.87 0.97 6.42 1.547 0.819 59.67 0.74 6.34 0.315 0.86559.94 1.06 7.15 1.189 1.025 60.71 1.23 7.09 0.791 0.540 60.80 1.14 6.91 0.220 0.67759.62 0.94 6.31 0.640 0.965 60.04 0.78 6.42 0.463 0.667 59.75 0.94 7.02 0.685 0.50160.21 1.30 7.65 0.254 1.515 60.31 1.14 6.80 0.871 1.118 59.83 0.59 6.01 1.076 0.76859.34 0.57 6.35 1.554 0.638 59.70 0.89 6.44 0.490 0.482 59.72 0.77 6.24 0.234 0.57959.92 0.82 7.33 0.650 0.788 60.21 0.77 7.22 0.314 0.988 60.86 0.88 7.19 0.660 1.60960.26 0.93 6.83 0.141 0.348 60.06 0.95 6.68 0.251 0.450 60.21 0.99 6.76 0.175 0.40460.48 1.03 7.13 0.818 0.177 60.11 0.98 6.91 0.433 0.507 60.27 1.03 7.06 0.225 0.30759.76 0.72 6.67 0.253 0.795 59.69 0.76 6.57 0.128 0.871 59.66 0.87 6.64 0.134 0.78560.66 1.19 7.67 0.761 0.933 59.75 0.98 7.49 0.951 0.402 60.36 1.27 7.74 0.720 0.71560.21 1.12 7.43 1.815 0.931 59.45 0.65 6.37 1.386 0.531 59.70 0.42 5.71 0.742 1.05160.68 0.74 6.66 0.285 1.696 60.93 0.9 6.72 0.303 1.487 61.16 0.91 6.89 0.286 1.26059.88 1.00 7.44 0.193 0.372 60.41 1.02 7.14 0.609 0.408 60.95 1.26 7.74 0.842 0.81959.77 0.78 6.85 0.764 0.749 60.5 0.92 6.62 0.778 0.870 59.49 0.57 6.07 1.202 1.58759.95 1.19 7.76 0.724 0.456 60.76 1.07 7.23 0.975 1.056 60.20 0.94 6.93 0.648 1.18259.92 0.74 6.54 0.344 0.479 60.10 0.82 6.43 0.226 0.529 59.91 0.70 6.27 0.276 0.40461.22 1.23 7.58 0.389 0.273 60.59 1.00 6.99 0.893 0.839 60.21 0.94 7.31 0.500 0.90460.61 0.91 7.05 1.132 0.631 59.66 0.74 6.59 1.069 1.053 59.75 0.44 5.84 0.813 1.77860.12 0.67 7.22 0.959 0.834 60.06 0.59 7.02 0.224 0.778 60.63 0.71 6.96 0.586 1.310
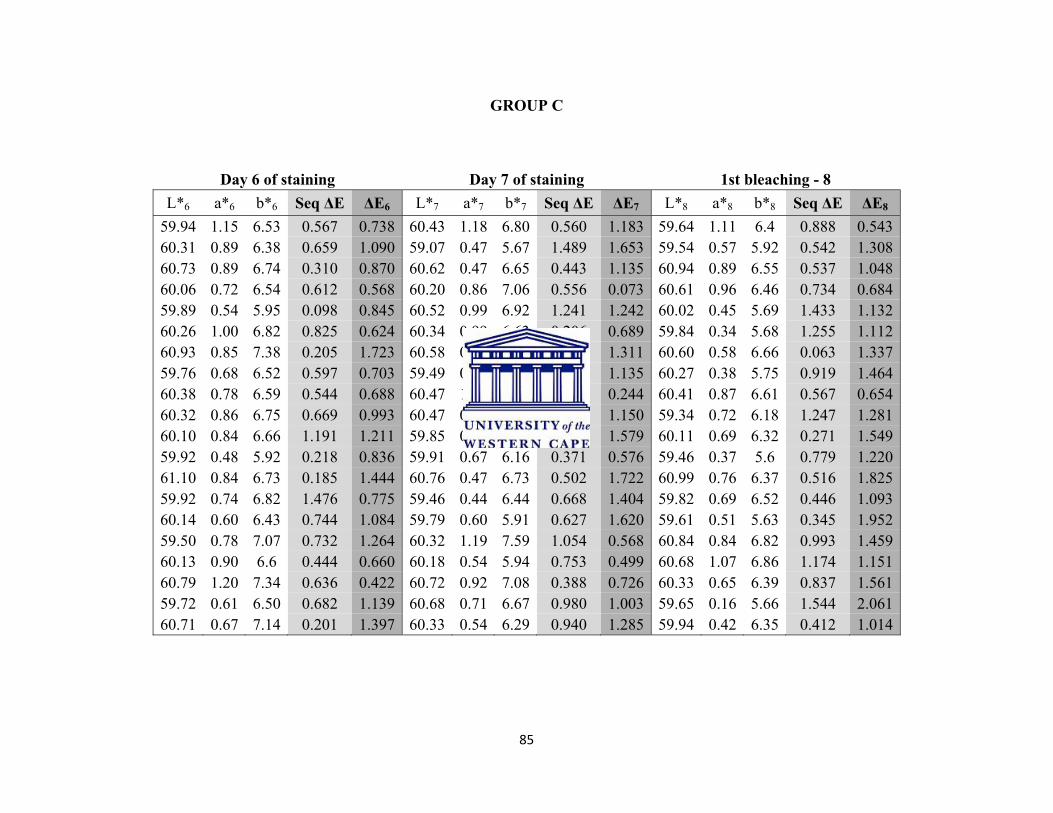
85
GROUP C
Day 6 of staining Day 7 of staining 1st bleaching - 8
L*6 a*6 b*6 Seq ΔE ΔE6 L*7 a*7 b*7 Seq ΔE ΔE7 L*8 a*8 b*8 Seq ΔE ΔE8
59.94 1.15 6.53 0.567 0.738 60.43 1.18 6.80 0.560 1.183 59.64 1.11 6.4 0.888 0.54360.31 0.89 6.38 0.659 1.090 59.07 0.47 5.67 1.489 1.653 59.54 0.57 5.92 0.542 1.30860.73 0.89 6.74 0.310 0.870 60.62 0.47 6.65 0.443 1.135 60.94 0.89 6.55 0.537 1.04860.06 0.72 6.54 0.612 0.568 60.20 0.86 7.06 0.556 0.073 60.61 0.96 6.46 0.734 0.68459.89 0.54 5.95 0.098 0.845 60.52 0.99 6.92 1.241 1.242 60.02 0.45 5.69 1.433 1.13260.26 1.00 6.82 0.825 0.624 60.34 0.99 6.63 0.206 0.689 59.84 0.34 5.68 1.255 1.11260.93 0.85 7.38 0.205 1.723 60.58 0.64 6.66 0.828 1.311 60.60 0.58 6.66 0.063 1.33759.76 0.68 6.52 0.597 0.703 59.49 0.50 6.22 0.442 1.135 60.27 0.38 5.75 0.919 1.46460.38 0.78 6.59 0.544 0.688 60.47 1.11 7.12 0.631 0.244 60.41 0.87 6.61 0.567 0.65460.32 0.86 6.75 0.669 0.993 60.47 0.89 6.68 0.168 1.150 59.34 0.72 6.18 1.247 1.28160.10 0.84 6.66 1.191 1.211 59.85 0.63 6.27 0.509 1.579 60.11 0.69 6.32 0.271 1.54959.92 0.48 5.92 0.218 0.836 59.91 0.67 6.16 0.371 0.576 59.46 0.37 5.6 0.779 1.22061.10 0.84 6.73 0.185 1.444 60.76 0.47 6.73 0.502 1.722 60.99 0.76 6.37 0.516 1.82559.92 0.74 6.82 1.476 0.775 59.46 0.44 6.44 0.668 1.404 59.82 0.69 6.52 0.446 1.09360.14 0.60 6.43 0.744 1.084 59.79 0.60 5.91 0.627 1.620 59.61 0.51 5.63 0.345 1.95259.50 0.78 7.07 0.732 1.264 60.32 1.19 7.59 1.054 0.568 60.84 0.84 6.82 0.993 1.45960.13 0.90 6.6 0.444 0.660 60.18 0.54 5.94 0.753 0.499 60.68 1.07 6.86 1.174 1.15160.79 1.20 7.34 0.636 0.422 60.72 0.92 7.08 0.388 0.726 60.33 0.65 6.39 0.837 1.56159.72 0.61 6.50 0.682 1.139 60.68 0.71 6.67 0.980 1.003 59.65 0.16 5.66 1.544 2.06160.71 0.67 7.14 0.201 1.397 60.33 0.54 6.29 0.940 1.285 59.94 0.42 6.35 0.412 1.014
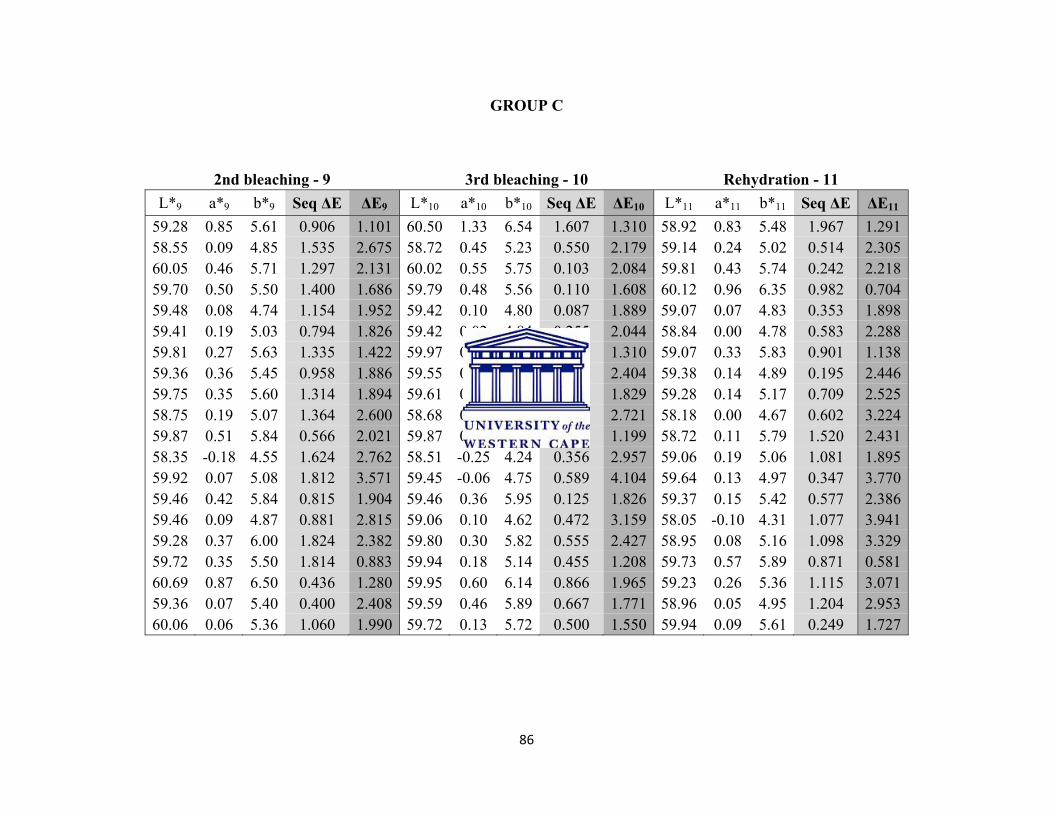
86
GROUP C
2nd bleaching - 9 3rd bleaching - 10 Rehydration - 11
L*9 a*9 b*9 Seq ΔE ΔE9 L*10 a*10 b*10 Seq ΔE ΔE10 L*11 a*11 b*11 Seq ΔE ΔE11
59.28 0.85 5.61 0.906 1.101 60.50 1.33 6.54 1.607 1.310 58.92 0.83 5.48 1.967 1.29158.55 0.09 4.85 1.535 2.675 58.72 0.45 5.23 0.550 2.179 59.14 0.24 5.02 0.514 2.30560.05 0.46 5.71 1.297 2.131 60.02 0.55 5.75 0.103 2.084 59.81 0.43 5.74 0.242 2.21859.70 0.50 5.50 1.400 1.686 59.79 0.48 5.56 0.110 1.608 60.12 0.96 6.35 0.982 0.70459.48 0.08 4.74 1.154 1.952 59.42 0.10 4.80 0.087 1.889 59.07 0.07 4.83 0.353 1.89859.41 0.19 5.03 0.794 1.826 59.42 0.02 4.84 0.255 2.044 58.84 0.00 4.78 0.583 2.28859.81 0.27 5.63 1.335 1.422 59.97 0.37 5.81 0.261 1.310 59.07 0.33 5.83 0.901 1.13859.36 0.36 5.45 0.958 1.886 59.55 0.05 4.92 0.643 2.404 59.38 0.14 4.89 0.195 2.44659.75 0.35 5.60 1.314 1.894 59.61 0.46 5.71 0.209 1.829 59.28 0.14 5.17 0.709 2.52558.75 0.19 5.07 1.364 2.600 58.68 0.10 4.99 0.139 2.721 58.18 0.00 4.67 0.602 3.22459.87 0.51 5.84 0.566 2.021 59.87 0.59 6.66 0.824 1.199 58.72 0.11 5.79 1.520 2.43158.35 -0.18 4.55 1.624 2.762 58.51 -0.25 4.24 0.356 2.957 59.06 0.19 5.06 1.081 1.89559.92 0.07 5.08 1.812 3.571 59.45 -0.06 4.75 0.589 4.104 59.64 0.13 4.97 0.347 3.77059.46 0.42 5.84 0.815 1.904 59.46 0.36 5.95 0.125 1.826 59.37 0.15 5.42 0.577 2.38659.46 0.09 4.87 0.881 2.815 59.06 0.10 4.62 0.472 3.159 58.05 -0.10 4.31 1.077 3.94159.28 0.37 6.00 1.824 2.382 59.80 0.30 5.82 0.555 2.427 58.95 0.08 5.16 1.098 3.32959.72 0.35 5.50 1.814 0.883 59.94 0.18 5.14 0.455 1.208 59.73 0.57 5.89 0.871 0.58160.69 0.87 6.50 0.436 1.280 59.95 0.60 6.14 0.866 1.965 59.23 0.26 5.36 1.115 3.07159.36 0.07 5.40 0.400 2.408 59.59 0.46 5.89 0.667 1.771 58.96 0.05 4.95 1.204 2.95360.06 0.06 5.36 1.060 1.990 59.72 0.13 5.72 0.500 1.550 59.94 0.09 5.61 0.249 1.727
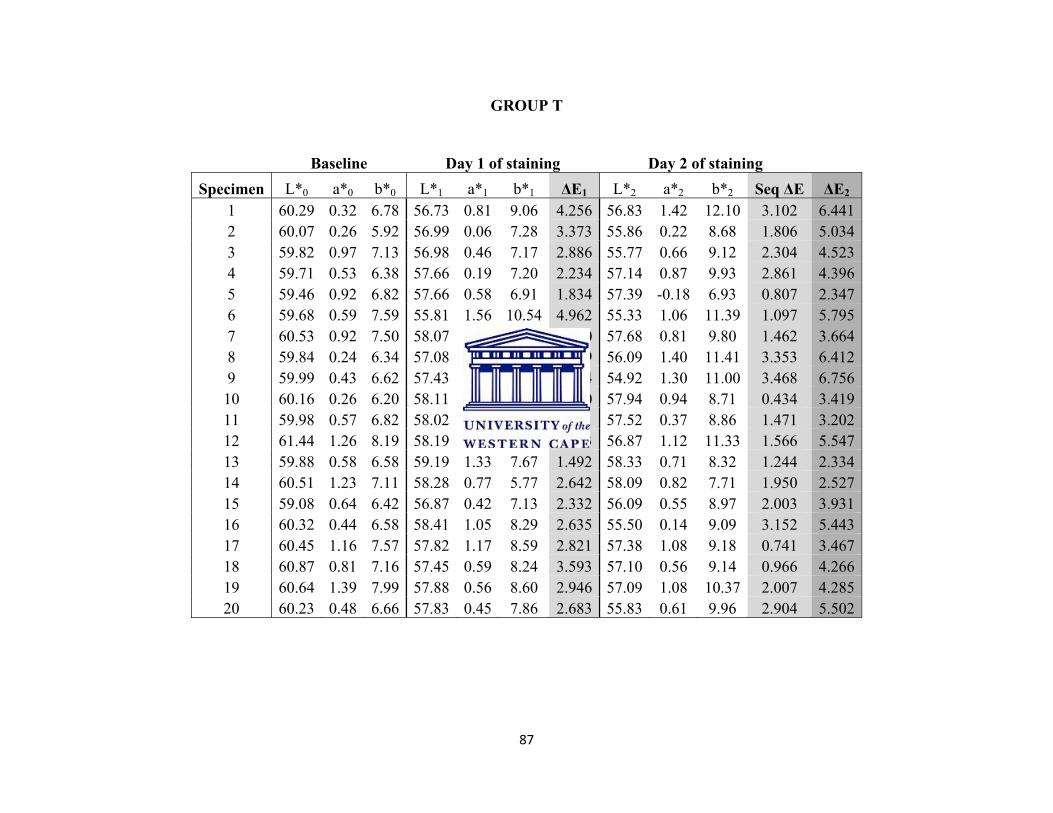
87
GROUP T
Baseline Day 1 of staining Day 2 of staining Specimen L*0 a*0 b*0 L*1 a*1 b*1 ΔE1 L*2 a*2 b*2 Seq ΔE ΔE2
1 60.29 0.32 6.78 56.73 0.81 9.06 4.256 56.83 1.42 12.10 3.102 6.4412 60.07 0.26 5.92 56.99 0.06 7.28 3.373 55.86 0.22 8.68 1.806 5.0343 59.82 0.97 7.13 56.98 0.46 7.17 2.886 55.77 0.66 9.12 2.304 4.5234 59.71 0.53 6.38 57.66 0.19 7.20 2.234 57.14 0.87 9.93 2.861 4.3965 59.46 0.92 6.82 57.66 0.58 6.91 1.834 57.39 -0.18 6.93 0.807 2.3476 59.68 0.59 7.59 55.81 1.56 10.54 4.962 55.33 1.06 11.39 1.097 5.7957 60.53 0.92 7.50 58.07 0.97 8.40 2.620 57.68 0.81 9.80 1.462 3.6648 59.84 0.24 6.34 57.08 0.39 8.37 3.429 56.09 1.40 11.41 3.353 6.4129 59.99 0.43 6.62 57.43 0.85 8.65 3.294 54.92 1.30 11.00 3.468 6.75610 60.16 0.26 6.20 58.11 0.79 8.34 3.010 57.94 0.94 8.71 0.434 3.41911 59.98 0.57 6.82 58.02 0.46 7.48 2.071 57.52 0.37 8.86 1.471 3.20212 61.44 1.26 8.19 58.19 1.31 10.51 3.993 56.87 1.12 11.33 1.566 5.54713 59.88 0.58 6.58 59.19 1.33 7.67 1.492 58.33 0.71 8.32 1.244 2.33414 60.51 1.23 7.11 58.28 0.77 5.77 2.642 58.09 0.82 7.71 1.950 2.52715 59.08 0.64 6.42 56.87 0.42 7.13 2.332 56.09 0.55 8.97 2.003 3.93116 60.32 0.44 6.58 58.41 1.05 8.29 2.635 55.50 0.14 9.09 3.152 5.44317 60.45 1.16 7.57 57.82 1.17 8.59 2.821 57.38 1.08 9.18 0.741 3.46718 60.87 0.81 7.16 57.45 0.59 8.24 3.593 57.10 0.56 9.14 0.966 4.26619 60.64 1.39 7.99 57.88 0.56 8.60 2.946 57.09 1.08 10.37 2.007 4.28520 60.23 0.48 6.66 57.83 0.45 7.86 2.683 55.83 0.61 9.96 2.904 5.502
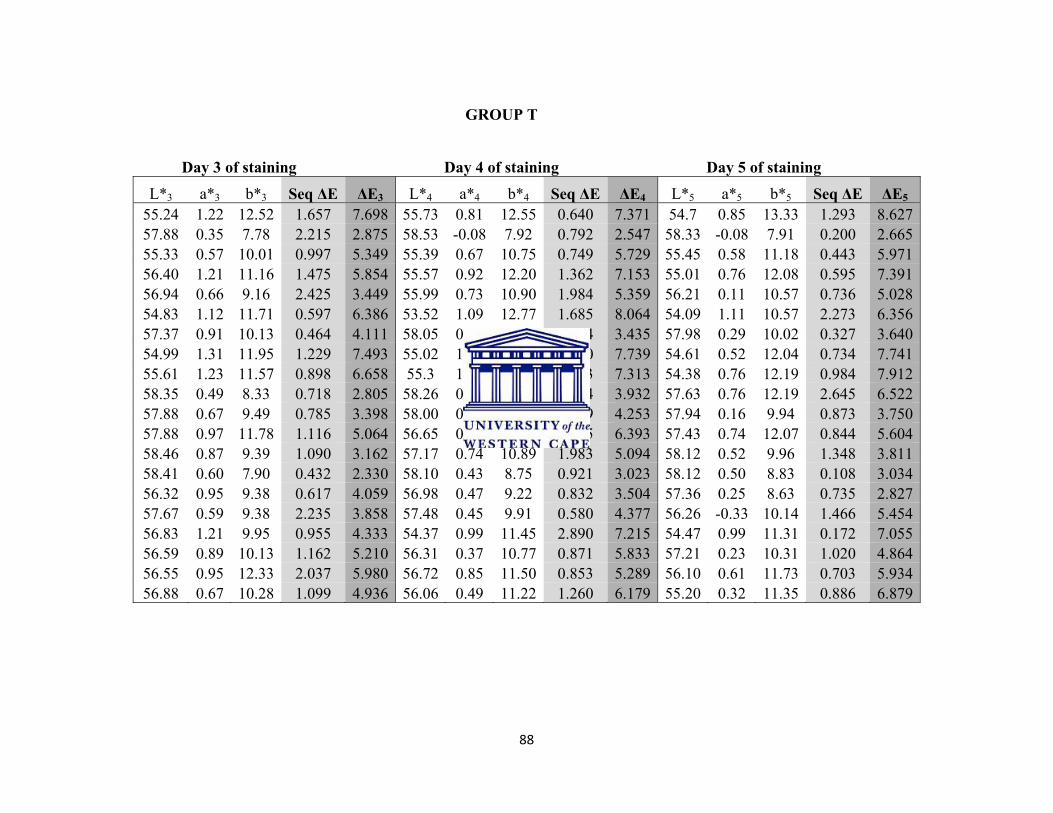
88
Day 3 of staining
GROUP T
Day 4 of staining
Day 5 of staining
L*3 a*3 b*3 Seq ΔE ΔE3 L*4 a*4 b*4 Seq ΔE ΔE4 L*5 a*5 b*5 Seq ΔE ΔE5
55.24 1.22 12.52 1.657 7.698 55.73 0.81 12.55 0.640 7.371 54.7 0.85 13.33 1.293 8.62757.88 0.35 7.78 2.215 2.875 58.53 -0.08 7.92 0.792 2.547 58.33 -0.08 7.91 0.200 2.66555.33 0.57 10.01 0.997 5.349 55.39 0.67 10.75 0.749 5.729 55.45 0.58 11.18 0.443 5.97156.40 1.21 11.16 1.475 5.854 55.57 0.92 12.20 1.362 7.153 55.01 0.76 12.08 0.595 7.39156.94 0.66 9.16 2.425 3.449 55.99 0.73 10.90 1.984 5.359 56.21 0.11 10.57 0.736 5.02854.83 1.12 11.71 0.597 6.386 53.52 1.09 12.77 1.685 8.064 54.09 1.11 10.57 2.273 6.35657.37 0.91 10.13 0.464 4.111 58.05 0.56 9.85 0.814 3.435 57.98 0.29 10.02 0.327 3.64054.99 1.31 11.95 1.229 7.493 55.02 1.05 12.34 0.470 7.739 54.61 0.52 12.04 0.734 7.74155.61 1.23 11.57 0.898 6.658 55.3 1.11 12.19 0.703 7.313 54.38 0.76 12.19 0.984 7.91258.35 0.49 8.33 0.718 2.805 58.26 0.55 9.63 1.304 3.932 57.63 0.76 12.19 2.645 6.52257.88 0.67 9.49 0.785 3.398 58.00 0.75 10.58 1.099 4.253 57.94 0.16 9.94 0.873 3.75057.88 0.97 11.78 1.116 5.064 56.65 0.65 12.38 1.405 6.393 57.43 0.74 12.07 0.844 5.60458.46 0.87 9.39 1.090 3.162 57.17 0.74 10.89 1.983 5.094 58.12 0.52 9.96 1.348 3.81158.41 0.60 7.90 0.432 2.330 58.10 0.43 8.75 0.921 3.023 58.12 0.50 8.83 0.108 3.03456.32 0.95 9.38 0.617 4.059 56.98 0.47 9.22 0.832 3.504 57.36 0.25 8.63 0.735 2.82757.67 0.59 9.38 2.235 3.858 57.48 0.45 9.91 0.580 4.377 56.26 -0.33 10.14 1.466 5.45456.83 1.21 9.95 0.955 4.333 54.37 0.99 11.45 2.890 7.215 54.47 0.99 11.31 0.172 7.05556.59 0.89 10.13 1.162 5.210 56.31 0.37 10.77 0.871 5.833 57.21 0.23 10.31 1.020 4.86456.55 0.95 12.33 2.037 5.980 56.72 0.85 11.50 0.853 5.289 56.10 0.61 11.73 0.703 5.93456.88 0.67 10.28 1.099 4.936 56.06 0.49 11.22 1.260 6.179 55.20 0.32 11.35 0.886 6.879
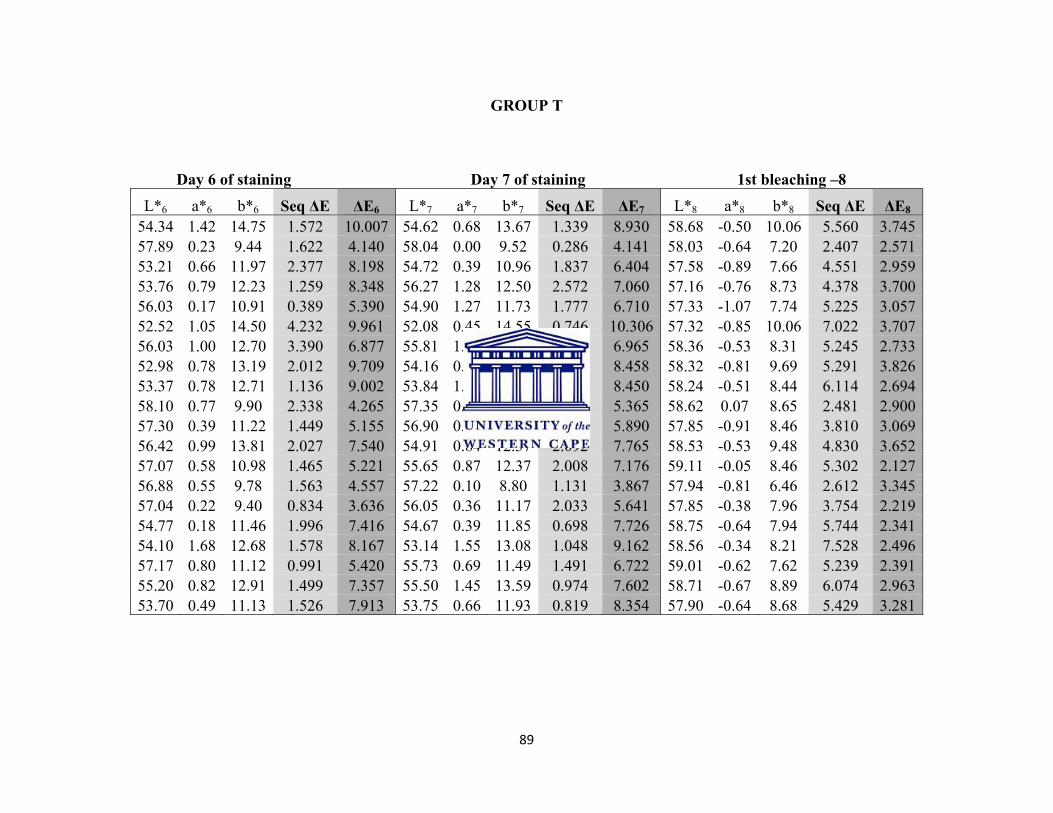
89
GROUP T
Day 6 of staining Day 7 of staining 1st bleaching –8
L*6 a*6 b*6 Seq ΔE ΔE6 L*7 a*7 b*7 Seq ΔE ΔE7 L*8 a*8 b*8 Seq ΔE ΔE8
54.34 1.42 14.75 1.572 10.007 54.62 0.68 13.67 1.339 8.930 58.68 -0.50 10.06 5.560 3.74557.89 0.23 9.44 1.622 4.140 58.04 0.00 9.52 0.286 4.141 58.03 -0.64 7.20 2.407 2.57153.21 0.66 11.97 2.377 8.198 54.72 0.39 10.96 1.837 6.404 57.58 -0.89 7.66 4.551 2.95953.76 0.79 12.23 1.259 8.348 56.27 1.28 12.50 2.572 7.060 57.16 -0.76 8.73 4.378 3.70056.03 0.17 10.91 0.389 5.390 54.90 1.27 11.73 1.777 6.710 57.33 -1.07 7.74 5.225 3.05752.52 1.05 14.50 4.232 9.961 52.08 0.45 14.55 0.746 10.306 57.32 -0.85 10.06 7.022 3.70756.03 1.00 12.70 3.390 6.877 55.81 1.03 12.62 0.236 6.965 58.36 -0.53 8.31 5.245 2.73352.98 0.78 13.19 2.012 9.709 54.16 0.70 12.59 1.326 8.458 58.32 -0.81 9.69 5.291 3.82653.37 0.78 12.71 1.136 9.002 53.84 1.07 12.38 0.643 8.450 58.24 -0.51 8.44 6.114 2.69458.10 0.77 9.90 2.338 4.265 57.35 0.29 10.77 1.245 5.365 58.62 0.07 8.65 2.481 2.90057.30 0.39 11.22 1.449 5.155 56.90 0.57 11.84 0.759 5.890 57.85 -0.91 8.46 3.810 3.06956.42 0.99 13.81 2.027 7.540 54.91 0.84 12.37 2.092 7.765 58.53 -0.53 9.48 4.830 3.65257.07 0.58 10.98 1.465 5.221 55.65 0.87 12.37 2.008 7.176 59.11 -0.05 8.46 5.302 2.12756.88 0.55 9.78 1.563 4.557 57.22 0.10 8.80 1.131 3.867 57.94 -0.81 6.46 2.612 3.34557.04 0.22 9.40 0.834 3.636 56.05 0.36 11.17 2.033 5.641 57.85 -0.38 7.96 3.754 2.21954.77 0.18 11.46 1.996 7.416 54.67 0.39 11.85 0.698 7.726 58.75 -0.64 7.94 5.744 2.34154.10 1.68 12.68 1.578 8.167 53.14 1.55 13.08 1.048 9.162 58.56 -0.34 8.21 7.528 2.49657.17 0.80 11.12 0.991 5.420 55.73 0.69 11.49 1.491 6.722 59.01 -0.62 7.62 5.239 2.39155.20 0.82 12.91 1.499 7.357 55.50 1.45 13.59 0.974 7.602 58.71 -0.67 8.89 6.074 2.96353.70 0.49 11.13 1.526 7.913 53.75 0.66 11.93 0.819 8.354 57.90 -0.64 8.68 5.429 3.281
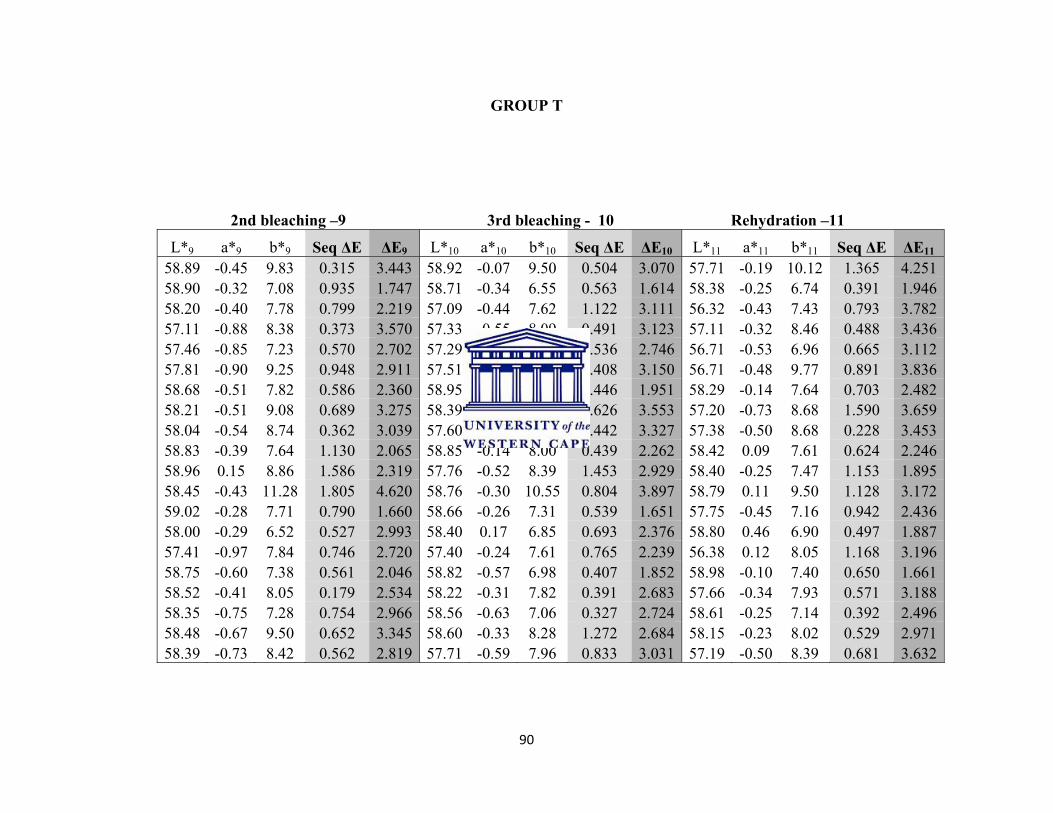
90
GROUP T
2nd bleaching –9 3rd bleaching - 10 Rehydration –11
L*9 a*9 b*9 Seq ΔE ΔE9 L*10 a*10 b*10 Seq ΔE ΔE10 L*11 a*11 b*11 Seq ΔE ΔE11
58.89 -0.45 9.83 0.315 3.443 58.92 -0.07 9.50 0.504 3.070 57.71 -0.19 10.12 1.365 4.25158.90 -0.32 7.08 0.935 1.747 58.71 -0.34 6.55 0.563 1.614 58.38 -0.25 6.74 0.391 1.94658.20 -0.40 7.78 0.799 2.219 57.09 -0.44 7.62 1.122 3.111 56.32 -0.43 7.43 0.793 3.78257.11 -0.88 8.38 0.373 3.570 57.33 -0.55 8.09 0.491 3.123 57.11 -0.32 8.46 0.488 3.43657.46 -0.85 7.23 0.570 2.702 57.29 -0.76 6.73 0.536 2.746 56.71 -0.53 6.96 0.665 3.11257.81 -0.90 9.25 0.948 2.911 57.51 -0.72 9.46 0.408 3.150 56.71 -0.48 9.77 0.891 3.83658.68 -0.51 7.82 0.586 2.360 58.95 -0.16 7.88 0.446 1.951 58.29 -0.14 7.64 0.703 2.48258.21 -0.51 9.08 0.689 3.275 58.39 -0.15 9.56 0.626 3.553 57.20 -0.73 8.68 1.590 3.65958.04 -0.54 8.74 0.362 3.039 57.60 -0.50 8.74 0.442 3.327 57.38 -0.50 8.68 0.228 3.45358.83 -0.39 7.64 1.130 2.065 58.85 -0.14 8.00 0.439 2.262 58.42 0.09 7.61 0.624 2.24658.96 0.15 8.86 1.586 2.319 57.76 -0.52 8.39 1.453 2.929 58.40 -0.25 7.47 1.153 1.89558.45 -0.43 11.28 1.805 4.620 58.76 -0.30 10.55 0.804 3.897 58.79 0.11 9.50 1.128 3.17259.02 -0.28 7.71 0.790 1.660 58.66 -0.26 7.31 0.539 1.651 57.75 -0.45 7.16 0.942 2.43658.00 -0.29 6.52 0.527 2.993 58.40 0.17 6.85 0.693 2.376 58.80 0.46 6.90 0.497 1.88757.41 -0.97 7.84 0.746 2.720 57.40 -0.24 7.61 0.765 2.239 56.38 0.12 8.05 1.168 3.19658.75 -0.60 7.38 0.561 2.046 58.82 -0.57 6.98 0.407 1.852 58.98 -0.10 7.40 0.650 1.66158.52 -0.41 8.05 0.179 2.534 58.22 -0.31 7.82 0.391 2.683 57.66 -0.34 7.93 0.571 3.18858.35 -0.75 7.28 0.754 2.966 58.56 -0.63 7.06 0.327 2.724 58.61 -0.25 7.14 0.392 2.49658.48 -0.67 9.50 0.652 3.345 58.60 -0.33 8.28 1.272 2.684 58.15 -0.23 8.02 0.529 2.97158.39 -0.73 8.42 0.562 2.819 57.71 -0.59 7.96 0.833 3.031 57.19 -0.50 8.39 0.681 3.632
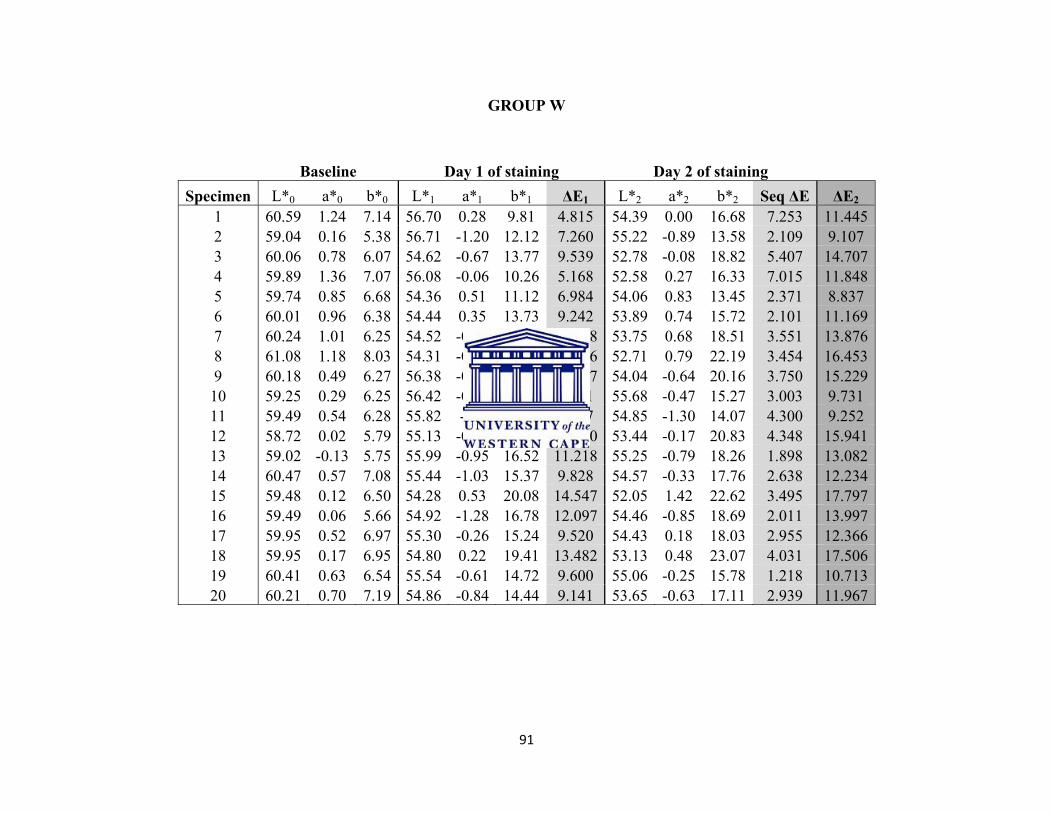
91
GROUP W
Baseline Day 1 of staining Day 2 of staining
Specimen L*0 a*0 b*0 L*1 a*1 b*1 ΔE1 L*2 a*2 b*2 Seq ΔE ΔE2
1 60.59 1.24 7.14 56.70 0.28 9.81 4.815 54.39 0.00 16.68 7.253 11.4452 59.04 0.16 5.38 56.71 -1.20 12.12 7.260 55.22 -0.89 13.58 2.109 9.107 3 60.06 0.78 6.07 54.62 -0.67 13.77 9.539 52.78 -0.08 18.82 5.407 14.7074 59.89 1.36 7.07 56.08 -0.06 10.26 5.168 52.58 0.27 16.33 7.015 11.8485 59.74 0.85 6.68 54.36 0.51 11.12 6.984 54.06 0.83 13.45 2.371 8.837 6 60.01 0.96 6.38 54.44 0.35 13.73 9.242 53.89 0.74 15.72 2.101 11.1697 60.24 1.01 6.25 54.52 -0.21 15.16 10.658 53.75 0.68 18.51 3.551 13.8768 61.08 1.18 8.03 54.31 -0.30 19.33 13.256 52.71 0.79 22.19 3.454 16.4539 60.18 0.49 6.27 56.38 -0.66 17.23 11.657 54.04 -0.64 20.16 3.750 15.22910 59.25 0.29 6.25 56.42 -0.42 12.36 6.771 55.68 -0.47 15.27 3.003 9.731 11 59.49 0.54 6.28 55.82 -0.6 9.94 5.307 54.85 -1.30 14.07 4.300 9.252 12 58.72 0.02 5.79 55.13 -0.71 16.86 11.660 53.44 -0.17 20.83 4.348 15.94113 59.02 -0.13 5.75 55.99 -0.95 16.52 11.218 55.25 -0.79 18.26 1.898 13.08214 60.47 0.57 7.08 55.44 -1.03 15.37 9.828 54.57 -0.33 17.76 2.638 12.23415 59.48 0.12 6.50 54.28 0.53 20.08 14.547 52.05 1.42 22.62 3.495 17.79716 59.49 0.06 5.66 54.92 -1.28 16.78 12.097 54.46 -0.85 18.69 2.011 13.99717 59.95 0.52 6.97 55.30 -0.26 15.24 9.520 54.43 0.18 18.03 2.955 12.36618 59.95 0.17 6.95 54.80 0.22 19.41 13.482 53.13 0.48 23.07 4.031 17.50619 60.41 0.63 6.54 55.54 -0.61 14.72 9.600 55.06 -0.25 15.78 1.218 10.71320 60.21 0.70 7.19 54.86 -0.84 14.44 9.141 53.65 -0.63 17.11 2.939 11.967
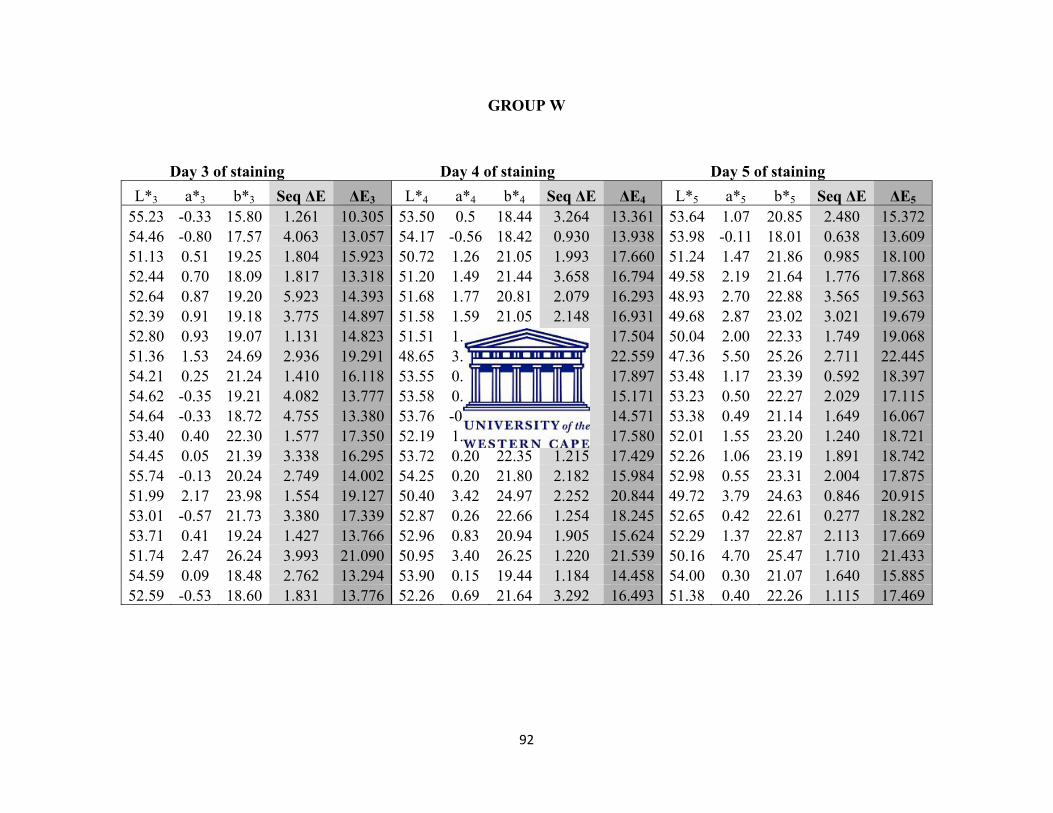
92
GROUP W
Day 3 of staining Day 4 of staining Day 5 of staining
L*3 a*3 b*3 Seq ΔE ΔE3 L*4 a*4 b*4 Seq ΔE ΔE4 L*5 a*5 b*5 Seq ΔE ΔE5
55.23 -0.33 15.80 1.261 10.305 53.50 0.5 18.44 3.264 13.361 53.64 1.07 20.85 2.480 15.37254.46 -0.80 17.57 4.063 13.057 54.17 -0.56 18.42 0.930 13.938 53.98 -0.11 18.01 0.638 13.60951.13 0.51 19.25 1.804 15.923 50.72 1.26 21.05 1.993 17.660 51.24 1.47 21.86 0.985 18.10052.44 0.70 18.09 1.817 13.318 51.20 1.49 21.44 3.658 16.794 49.58 2.19 21.64 1.776 17.86852.64 0.87 19.20 5.923 14.393 51.68 1.77 20.81 2.079 16.293 48.93 2.70 22.88 3.565 19.56352.39 0.91 19.18 3.775 14.897 51.58 1.59 21.05 2.148 16.931 49.68 2.87 23.02 3.021 19.67952.80 0.93 19.07 1.131 14.823 51.51 1.82 21.40 2.808 17.504 50.04 2.00 22.33 1.749 19.06851.36 1.53 24.69 2.936 19.291 48.65 3.60 26.70 3.958 22.559 47.36 5.50 25.26 2.711 22.44554.21 0.25 21.24 1.410 16.118 53.55 0.86 22.89 1.879 17.897 53.48 1.17 23.39 0.592 18.39754.62 -0.35 19.21 4.082 13.777 53.58 0.06 20.32 1.575 15.171 53.23 0.50 22.27 2.029 17.11554.64 -0.33 18.72 4.755 13.380 53.76 -0.13 19.66 1.303 14.571 53.38 0.49 21.14 1.649 16.06753.40 0.40 22.30 1.577 17.350 52.19 1.05 22.08 1.391 17.580 52.01 1.55 23.20 1.240 18.72154.45 0.05 21.39 3.338 16.295 53.72 0.20 22.35 1.215 17.429 52.26 1.06 23.19 1.891 18.74255.74 -0.13 20.24 2.749 14.002 54.25 0.20 21.80 2.182 15.984 52.98 0.55 23.31 2.004 17.87551.99 2.17 23.98 1.554 19.127 50.40 3.42 24.97 2.252 20.844 49.72 3.79 24.63 0.846 20.91553.01 -0.57 21.73 3.380 17.339 52.87 0.26 22.66 1.254 18.245 52.65 0.42 22.61 0.277 18.28253.71 0.41 19.24 1.427 13.766 52.96 0.83 20.94 1.905 15.624 52.29 1.37 22.87 2.113 17.66951.74 2.47 26.24 3.993 21.090 50.95 3.40 26.25 1.220 21.539 50.16 4.70 25.47 1.710 21.43354.59 0.09 18.48 2.762 13.294 53.90 0.15 19.44 1.184 14.458 54.00 0.30 21.07 1.640 15.88552.59 -0.53 18.60 1.831 13.776 52.26 0.69 21.64 3.292 16.493 51.38 0.40 22.26 1.115 17.469
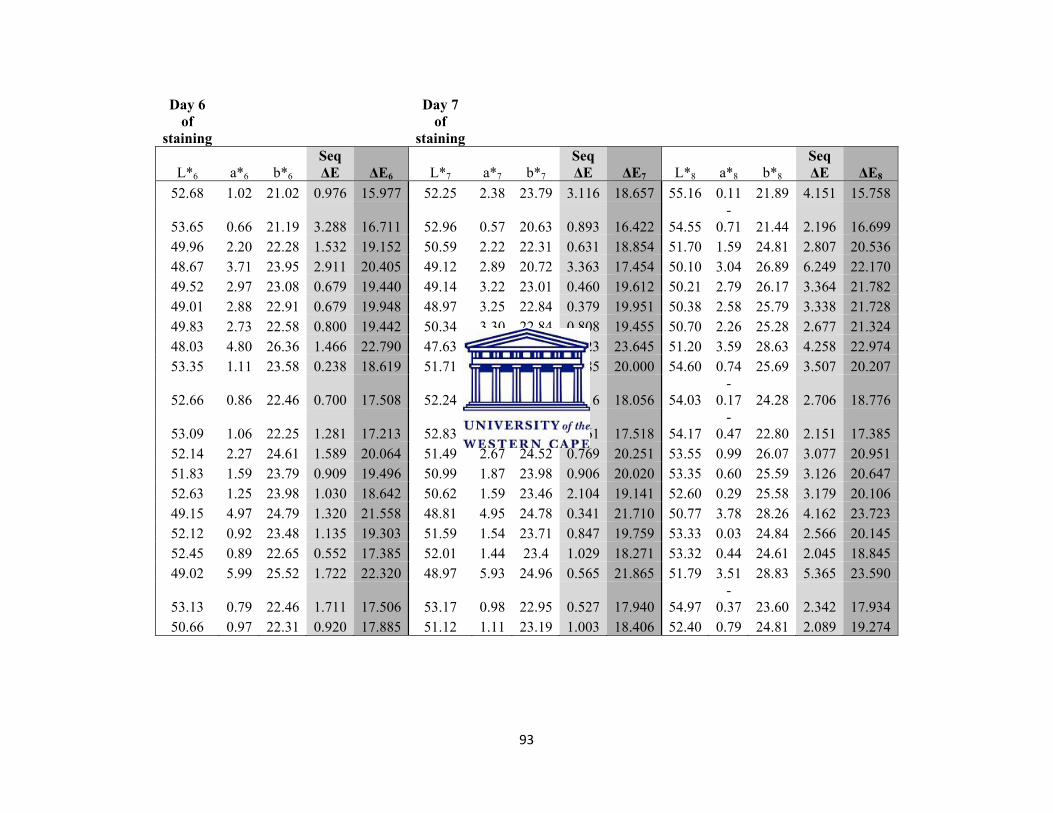
93
Day 6 of
staining
Day 7 of
staining
L*6 a*6 b*6 Seq ΔE ΔE6 L*7 a*7 b*7
Seq ΔE ΔE7 L*8 a*8 b*8
Seq ΔE ΔE8
52.68 1.02 21.02 0.976 15.977 52.25 2.38 23.79 3.116 18.657 55.16 0.11 21.89 4.151 15.758
53.65 0.66 21.19 3.288 16.711 52.96 0.57 20.63 0.893 16.422 54.55-
0.71 21.44 2.196 16.69949.96 2.20 22.28 1.532 19.152 50.59 2.22 22.31 0.631 18.854 51.70 1.59 24.81 2.807 20.53648.67 3.71 23.95 2.911 20.405 49.12 2.89 20.72 3.363 17.454 50.10 3.04 26.89 6.249 22.17049.52 2.97 23.08 0.679 19.440 49.14 3.22 23.01 0.460 19.612 50.21 2.79 26.17 3.364 21.78249.01 2.88 22.91 0.679 19.948 48.97 3.25 22.84 0.379 19.951 50.38 2.58 25.79 3.338 21.72849.83 2.73 22.58 0.800 19.442 50.34 3.30 22.84 0.808 19.455 50.70 2.26 25.28 2.677 21.32448.03 4.80 26.36 1.466 22.790 47.63 5.28 27.04 0.923 23.645 51.20 3.59 28.63 4.258 22.97453.35 1.11 23.58 0.238 18.619 51.71 2.17 24.31 2.085 20.000 54.60 0.74 25.69 3.507 20.207
52.66 0.86 22.46 0.700 17.508 52.24 1.28 22.86 0.716 18.056 54.03-
0.17 24.28 2.706 18.776
53.09 1.06 22.25 1.281 17.213 52.83 1.18 22.47 0.361 17.518 54.17-
0.47 22.80 2.151 17.38552.14 2.27 24.61 1.589 20.064 51.49 2.67 24.52 0.769 20.251 53.55 0.99 26.07 3.077 20.95151.83 1.59 23.79 0.909 19.496 50.99 1.87 23.98 0.906 20.020 53.35 0.60 25.59 3.126 20.64752.63 1.25 23.98 1.030 18.642 50.62 1.59 23.46 2.104 19.141 52.60 0.29 25.58 3.179 20.10649.15 4.97 24.79 1.320 21.558 48.81 4.95 24.78 0.341 21.710 50.77 3.78 28.26 4.162 23.72352.12 0.92 23.48 1.135 19.303 51.59 1.54 23.71 0.847 19.759 53.33 0.03 24.84 2.566 20.14552.45 0.89 22.65 0.552 17.385 52.01 1.44 23.4 1.029 18.271 53.32 0.44 24.61 2.045 18.84549.02 5.99 25.52 1.722 22.320 48.97 5.93 24.96 0.565 21.865 51.79 3.51 28.83 5.365 23.590
53.13 0.79 22.46 1.711 17.506 53.17 0.98 22.95 0.527 17.940 54.97-
0.37 23.60 2.342 17.93450.66 0.97 22.31 0.920 17.885 51.12 1.11 23.19 1.003 18.406 52.40 0.79 24.81 2.089 19.274
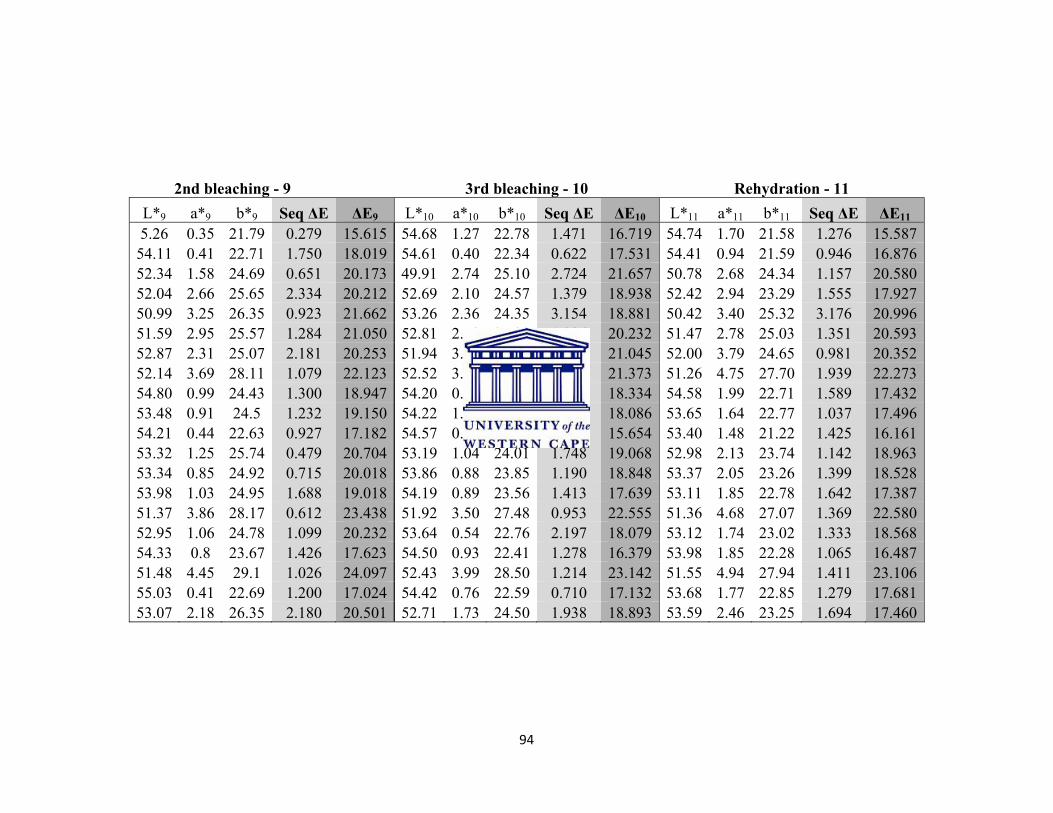
94
2nd bleaching - 9 3rd bleaching - 10 Rehydration - 11 L*9 a*9 b*9 Seq ΔE ΔE9 L*10 a*10 b*10 Seq ΔE ΔE10 L*11 a*11 b*11 Seq ΔE ΔE11
5.26 0.35 21.79 0.279 15.615 54.68 1.27 22.78 1.471 16.719 54.74 1.70 21.58 1.276 15.58754.11 0.41 22.71 1.750 18.019 54.61 0.40 22.34 0.622 17.531 54.41 0.94 21.59 0.946 16.87652.34 1.58 24.69 0.651 20.173 49.91 2.74 25.10 2.724 21.657 50.78 2.68 24.34 1.157 20.58052.04 2.66 25.65 2.334 20.212 52.69 2.10 24.57 1.379 18.938 52.42 2.94 23.29 1.555 17.92750.99 3.25 26.35 0.923 21.662 53.26 2.36 24.35 3.154 18.881 50.42 3.40 25.32 3.176 20.99651.59 2.95 25.57 1.284 21.050 52.81 2.78 25.20 1.286 20.232 51.47 2.78 25.03 1.351 20.59352.87 2.31 25.07 2.181 20.253 51.94 3.24 25.46 1.372 21.045 52.00 3.79 24.65 0.981 20.35252.14 3.69 28.11 1.079 22.123 52.52 3.29 27.50 0.822 21.373 51.26 4.75 27.70 1.939 22.27354.80 0.99 24.43 1.300 18.947 54.20 0.73 23.60 1.057 18.334 54.58 1.99 22.71 1.589 17.43253.48 0.91 24.5 1.232 19.150 54.22 1.36 23.59 1.256 18.086 53.65 1.64 22.77 1.037 17.49654.21 0.44 22.63 0.927 17.182 54.57 0.67 21.14 1.550 15.654 53.40 1.48 21.22 1.425 16.16153.32 1.25 25.74 0.479 20.704 53.19 1.04 24.01 1.748 19.068 52.98 2.13 23.74 1.142 18.96353.34 0.85 24.92 0.715 20.018 53.86 0.88 23.85 1.190 18.848 53.37 2.05 23.26 1.399 18.52853.98 1.03 24.95 1.688 19.018 54.19 0.89 23.56 1.413 17.639 53.11 1.85 22.78 1.642 17.38751.37 3.86 28.17 0.612 23.438 51.92 3.50 27.48 0.953 22.555 51.36 4.68 27.07 1.369 22.58052.95 1.06 24.78 1.099 20.232 53.64 0.54 22.76 2.197 18.079 53.12 1.74 23.02 1.333 18.56854.33 0.8 23.67 1.426 17.623 54.50 0.93 22.41 1.278 16.379 53.98 1.85 22.28 1.065 16.48751.48 4.45 29.1 1.026 24.097 52.43 3.99 28.50 1.214 23.142 51.55 4.94 27.94 1.411 23.10655.03 0.41 22.69 1.200 17.024 54.42 0.76 22.59 0.710 17.132 53.68 1.77 22.85 1.279 17.68153.07 2.18 26.35 2.180 20.501 52.71 1.73 24.50 1.938 18.893 53.59 2.46 23.25 1.694 17.460
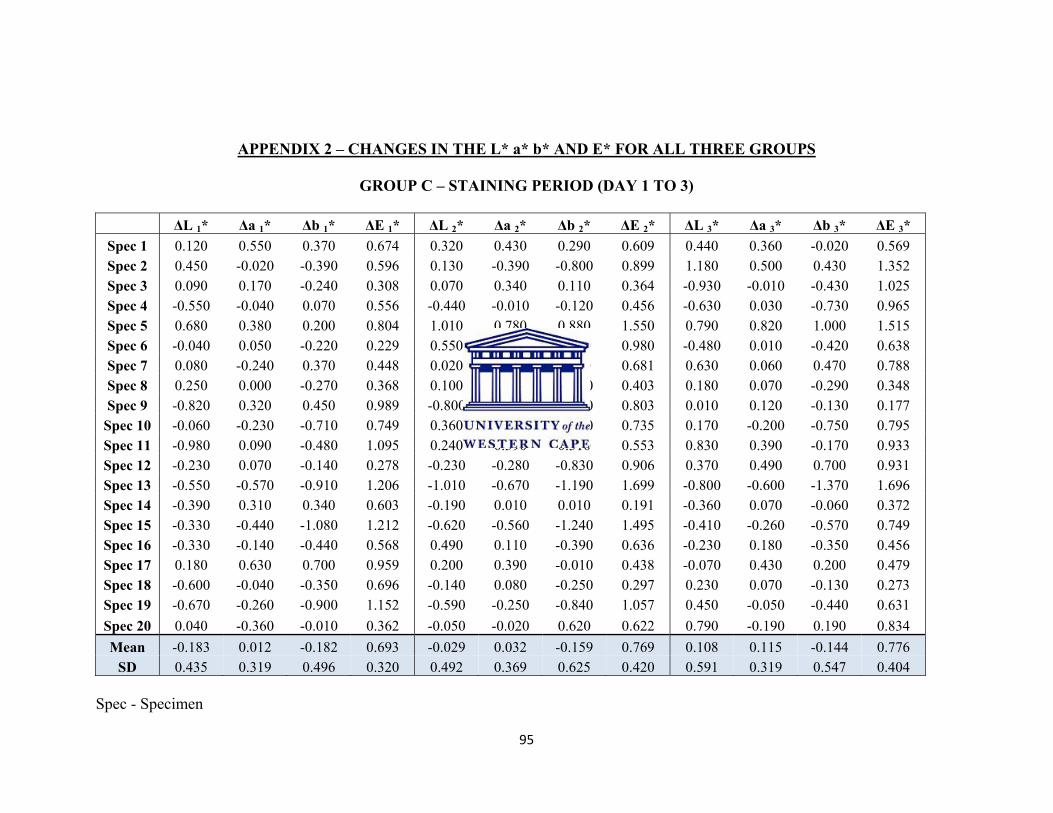
95
APPENDIX 2 – CHANGES IN THE L* a* b* AND E* FOR ALL THREE GROUPS
GROUP C – STAINING PERIOD (DAY 1 TO 3) ΔL 1* Δa 1* Δb 1* ΔE 1* ΔL 2* Δa 2* Δb 2* ΔE 2* ΔL 3* Δa 3* Δb 3* ΔE 3* Spec 1 0.120 0.550 0.370 0.674 0.320 0.430 0.290 0.609 0.440 0.360 -0.020 0.569 Spec 2 0.450 -0.020 -0.390 0.596 0.130 -0.390 -0.800 0.899 1.180 0.500 0.430 1.352 Spec 3 0.090 0.170 -0.240 0.308 0.070 0.340 0.110 0.364 -0.930 -0.010 -0.430 1.025 Spec 4 -0.550 -0.040 0.070 0.556 -0.440 -0.010 -0.120 0.456 -0.630 0.030 -0.730 0.965 Spec 5 0.680 0.380 0.200 0.804 1.010 0.780 0.880 1.550 0.790 0.820 1.000 1.515 Spec 6 -0.040 0.050 -0.220 0.229 0.550 0.510 0.630 0.980 -0.480 0.010 -0.420 0.638 Spec 7 0.080 -0.240 0.370 0.448 0.020 -0.020 0.680 0.681 0.630 0.060 0.470 0.788 Spec 8 0.250 0.000 -0.270 0.368 0.100 0.010 -0.390 0.403 0.180 0.070 -0.290 0.348 Spec 9 -0.820 0.320 0.450 0.989 -0.800 0.040 -0.050 0.803 0.010 0.120 -0.130 0.177
Spec 10 -0.060 -0.230 -0.710 0.749 0.360 -0.250 -0.590 0.735 0.170 -0.200 -0.750 0.795 Spec 11 -0.980 0.090 -0.480 1.095 0.240 0.390 0.310 0.553 0.830 0.390 -0.170 0.933 Spec 12 -0.230 0.070 -0.140 0.278 -0.230 -0.280 -0.830 0.906 0.370 0.490 0.700 0.931 Spec 13 -0.550 -0.570 -0.910 1.206 -1.010 -0.670 -1.190 1.699 -0.800 -0.600 -1.370 1.696 Spec 14 -0.390 0.310 0.340 0.603 -0.190 0.010 0.010 0.191 -0.360 0.070 -0.060 0.372 Spec 15 -0.330 -0.440 -1.080 1.212 -0.620 -0.560 -1.240 1.495 -0.410 -0.260 -0.570 0.749 Spec 16 -0.330 -0.140 -0.440 0.568 0.490 0.110 -0.390 0.636 -0.230 0.180 -0.350 0.456 Spec 17 0.180 0.630 0.700 0.959 0.200 0.390 -0.010 0.438 -0.070 0.430 0.200 0.479 Spec 18 -0.600 -0.040 -0.350 0.696 -0.140 0.080 -0.250 0.297 0.230 0.070 -0.130 0.273 Spec 19 -0.670 -0.260 -0.900 1.152 -0.590 -0.250 -0.840 1.057 0.450 -0.050 -0.440 0.631 Spec 20 0.040 -0.360 -0.010 0.362 -0.050 -0.020 0.620 0.622 0.790 -0.190 0.190 0.834 Mean -0.183 0.012 -0.182 0.693 -0.029 0.032 -0.159 0.769 0.108 0.115 -0.144 0.776
SD 0.435 0.319 0.496 0.320 0.492 0.369 0.625 0.420 0.591 0.319 0.547 0.404 Spec - Specimen
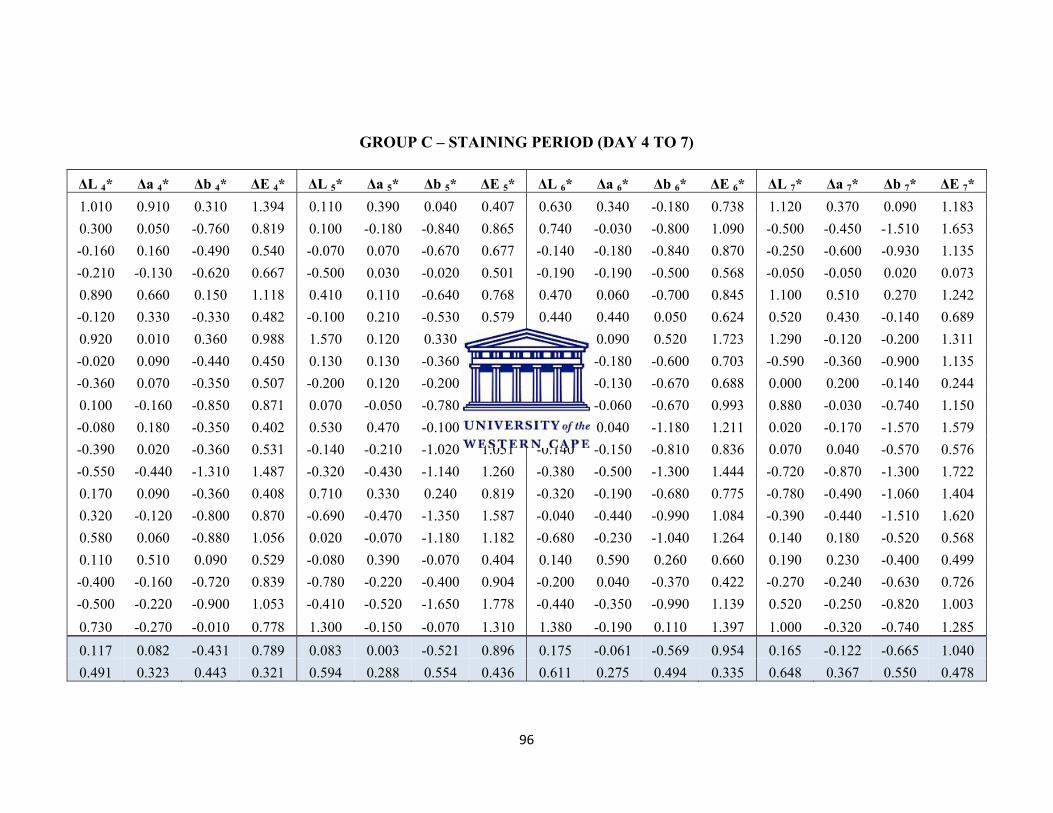
96
GROUP C – STAINING PERIOD (DAY 4 TO 7)
ΔL 4* Δa 4* Δb 4* ΔE 4* ΔL 5* Δa 5* Δb 5* ΔE 5* ΔL 6* Δa 6* Δb 6* ΔE 6* ΔL 7* Δa 7* Δb 7* ΔE 7* 1.010 0.910 0.310 1.394 0.110 0.390 0.040 0.407 0.630 0.340 -0.180 0.738 1.120 0.370 0.090 1.183 0.300 0.050 -0.760 0.819 0.100 -0.180 -0.840 0.865 0.740 -0.030 -0.800 1.090 -0.500 -0.450 -1.510 1.653 -0.160 0.160 -0.490 0.540 -0.070 0.070 -0.670 0.677 -0.140 -0.180 -0.840 0.870 -0.250 -0.600 -0.930 1.135 -0.210 -0.130 -0.620 0.667 -0.500 0.030 -0.020 0.501 -0.190 -0.190 -0.500 0.568 -0.050 -0.050 0.020 0.073 0.890 0.660 0.150 1.118 0.410 0.110 -0.640 0.768 0.470 0.060 -0.700 0.845 1.100 0.510 0.270 1.242 -0.120 0.330 -0.330 0.482 -0.100 0.210 -0.530 0.579 0.440 0.440 0.050 0.624 0.520 0.430 -0.140 0.689 0.920 0.010 0.360 0.988 1.570 0.120 0.330 1.609 1.640 0.090 0.520 1.723 1.290 -0.120 -0.200 1.311 -0.020 0.090 -0.440 0.450 0.130 0.130 -0.360 0.404 -0.320 -0.180 -0.600 0.703 -0.590 -0.360 -0.900 1.135 -0.360 0.070 -0.350 0.507 -0.200 0.120 -0.200 0.307 -0.090 -0.130 -0.670 0.688 0.000 0.200 -0.140 0.244 0.100 -0.160 -0.850 0.871 0.070 -0.050 -0.780 0.785 0.730 -0.060 -0.670 0.993 0.880 -0.030 -0.740 1.150 -0.080 0.180 -0.350 0.402 0.530 0.470 -0.100 0.715 0.270 0.040 -1.180 1.211 0.020 -0.170 -1.570 1.579 -0.390 0.020 -0.360 0.531 -0.140 -0.210 -1.020 1.051 -0.140 -0.150 -0.810 0.836 0.070 0.040 -0.570 0.576 -0.550 -0.440 -1.310 1.487 -0.320 -0.430 -1.140 1.260 -0.380 -0.500 -1.300 1.444 -0.720 -0.870 -1.300 1.722 0.170 0.090 -0.360 0.408 0.710 0.330 0.240 0.819 -0.320 -0.190 -0.680 0.775 -0.780 -0.490 -1.060 1.404 0.320 -0.120 -0.800 0.870 -0.690 -0.470 -1.350 1.587 -0.040 -0.440 -0.990 1.084 -0.390 -0.440 -1.510 1.620 0.580 0.060 -0.880 1.056 0.020 -0.070 -1.180 1.182 -0.680 -0.230 -1.040 1.264 0.140 0.180 -0.520 0.568 0.110 0.510 0.090 0.529 -0.080 0.390 -0.070 0.404 0.140 0.590 0.260 0.660 0.190 0.230 -0.400 0.499 -0.400 -0.160 -0.720 0.839 -0.780 -0.220 -0.400 0.904 -0.200 0.040 -0.370 0.422 -0.270 -0.240 -0.630 0.726 -0.500 -0.220 -0.900 1.053 -0.410 -0.520 -1.650 1.778 -0.440 -0.350 -0.990 1.139 0.520 -0.250 -0.820 1.003 0.730 -0.270 -0.010 0.778 1.300 -0.150 -0.070 1.310 1.380 -0.190 0.110 1.397 1.000 -0.320 -0.740 1.285 0.117 0.082 -0.431 0.789 0.083 0.003 -0.521 0.896 0.175 -0.061 -0.569 0.954 0.165 -0.122 -0.665 1.040 0.491 0.323 0.443 0.321 0.594 0.288 0.554 0.436 0.611 0.275 0.494 0.335 0.648 0.367 0.550 0.478
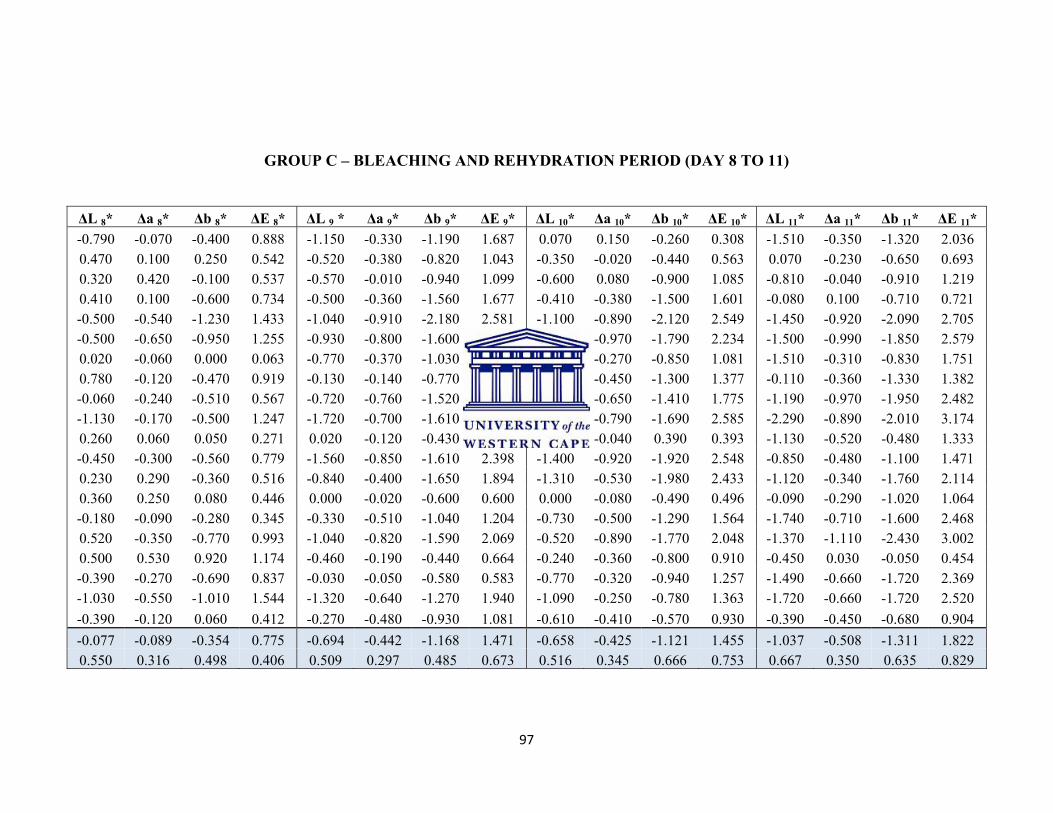
97
GROUP C – BLEACHING AND REHYDRATION PERIOD (DAY 8 TO 11)
ΔL 8* Δa 8* Δb 8* ΔE 8* ΔL 9 * Δa 9* Δb 9* ΔE 9* ΔL 10* Δa 10* Δb 10* ΔE 10* ΔL 11* Δa 11* Δb 11* ΔE 11* -0.790 -0.070 -0.400 0.888 -1.150 -0.330 -1.190 1.687 0.070 0.150 -0.260 0.308 -1.510 -0.350 -1.320 2.036 0.470 0.100 0.250 0.542 -0.520 -0.380 -0.820 1.043 -0.350 -0.020 -0.440 0.563 0.070 -0.230 -0.650 0.693 0.320 0.420 -0.100 0.537 -0.570 -0.010 -0.940 1.099 -0.600 0.080 -0.900 1.085 -0.810 -0.040 -0.910 1.219 0.410 0.100 -0.600 0.734 -0.500 -0.360 -1.560 1.677 -0.410 -0.380 -1.500 1.601 -0.080 0.100 -0.710 0.721 -0.500 -0.540 -1.230 1.433 -1.040 -0.910 -2.180 2.581 -1.100 -0.890 -2.120 2.549 -1.450 -0.920 -2.090 2.705 -0.500 -0.650 -0.950 1.255 -0.930 -0.800 -1.600 2.016 -0.920 -0.970 -1.790 2.234 -1.500 -0.990 -1.850 2.579 0.020 -0.060 0.000 0.063 -0.770 -0.370 -1.030 1.338 -0.610 -0.270 -0.850 1.081 -1.510 -0.310 -0.830 1.751 0.780 -0.120 -0.470 0.919 -0.130 -0.140 -0.770 0.793 0.060 -0.450 -1.300 1.377 -0.110 -0.360 -1.330 1.382 -0.060 -0.240 -0.510 0.567 -0.720 -0.760 -1.520 1.846 -0.860 -0.650 -1.410 1.775 -1.190 -0.970 -1.950 2.482 -1.130 -0.170 -0.500 1.247 -1.720 -0.700 -1.610 2.458 -1.790 -0.790 -1.690 2.585 -2.290 -0.890 -2.010 3.174 0.260 0.060 0.050 0.271 0.020 -0.120 -0.430 0.447 0.020 -0.040 0.390 0.393 -1.130 -0.520 -0.480 1.333 -0.450 -0.300 -0.560 0.779 -1.560 -0.850 -1.610 2.398 -1.400 -0.920 -1.920 2.548 -0.850 -0.480 -1.100 1.471 0.230 0.290 -0.360 0.516 -0.840 -0.400 -1.650 1.894 -1.310 -0.530 -1.980 2.433 -1.120 -0.340 -1.760 2.114 0.360 0.250 0.080 0.446 0.000 -0.020 -0.600 0.600 0.000 -0.080 -0.490 0.496 -0.090 -0.290 -1.020 1.064 -0.180 -0.090 -0.280 0.345 -0.330 -0.510 -1.040 1.204 -0.730 -0.500 -1.290 1.564 -1.740 -0.710 -1.600 2.468 0.520 -0.350 -0.770 0.993 -1.040 -0.820 -1.590 2.069 -0.520 -0.890 -1.770 2.048 -1.370 -1.110 -2.430 3.002 0.500 0.530 0.920 1.174 -0.460 -0.190 -0.440 0.664 -0.240 -0.360 -0.800 0.910 -0.450 0.030 -0.050 0.454 -0.390 -0.270 -0.690 0.837 -0.030 -0.050 -0.580 0.583 -0.770 -0.320 -0.940 1.257 -1.490 -0.660 -1.720 2.369 -1.030 -0.550 -1.010 1.544 -1.320 -0.640 -1.270 1.940 -1.090 -0.250 -0.780 1.363 -1.720 -0.660 -1.720 2.520 -0.390 -0.120 0.060 0.412 -0.270 -0.480 -0.930 1.081 -0.610 -0.410 -0.570 0.930 -0.390 -0.450 -0.680 0.904 -0.077 -0.089 -0.354 0.775 -0.694 -0.442 -1.168 1.471 -0.658 -0.425 -1.121 1.455 -1.037 -0.508 -1.311 1.822 0.550 0.316 0.498 0.406 0.509 0.297 0.485 0.673 0.516 0.345 0.666 0.753 0.667 0.350 0.635 0.829
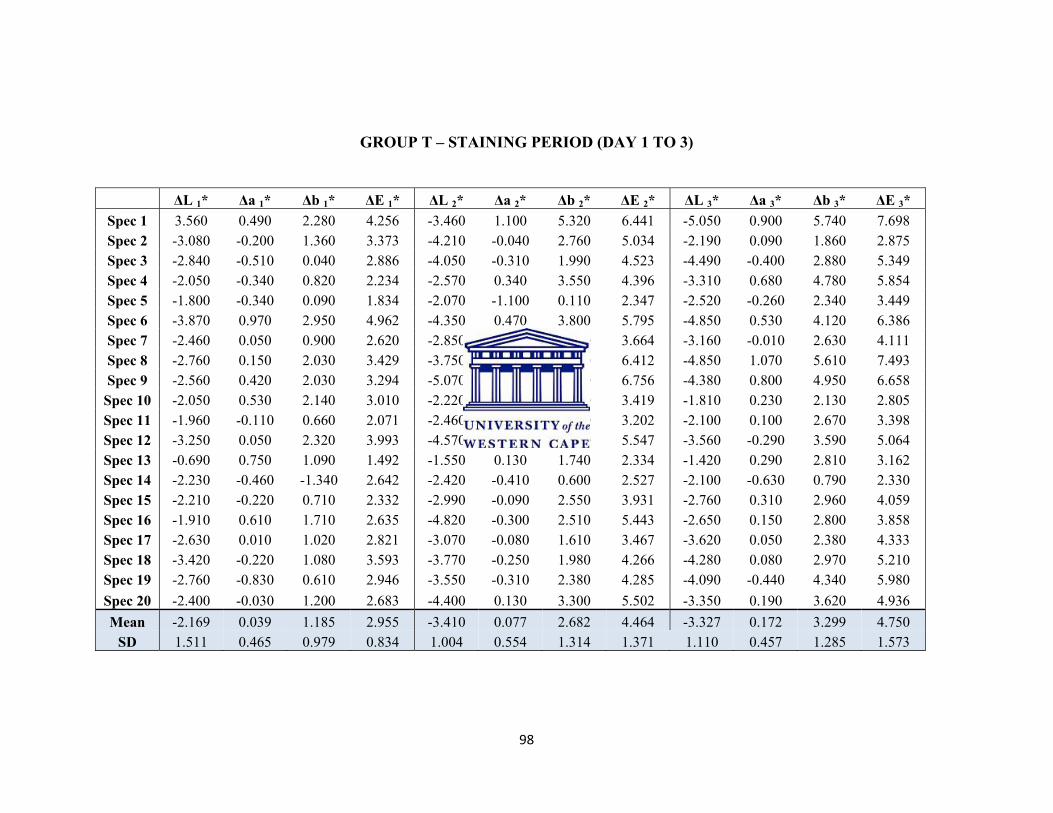
98
GROUP T – STAINING PERIOD (DAY 1 TO 3)
ΔL 1* Δa 1* Δb 1* ΔE 1* ΔL 2* Δa 2* Δb 2* ΔE 2* ΔL 3* Δa 3* Δb 3* ΔE 3* Spec 1 3.560 0.490 2.280 4.256 -3.460 1.100 5.320 6.441 -5.050 0.900 5.740 7.698 Spec 2 -3.080 -0.200 1.360 3.373 -4.210 -0.040 2.760 5.034 -2.190 0.090 1.860 2.875 Spec 3 -2.840 -0.510 0.040 2.886 -4.050 -0.310 1.990 4.523 -4.490 -0.400 2.880 5.349 Spec 4 -2.050 -0.340 0.820 2.234 -2.570 0.340 3.550 4.396 -3.310 0.680 4.780 5.854 Spec 5 -1.800 -0.340 0.090 1.834 -2.070 -1.100 0.110 2.347 -2.520 -0.260 2.340 3.449 Spec 6 -3.870 0.970 2.950 4.962 -4.350 0.470 3.800 5.795 -4.850 0.530 4.120 6.386 Spec 7 -2.460 0.050 0.900 2.620 -2.850 -0.110 2.300 3.664 -3.160 -0.010 2.630 4.111 Spec 8 -2.760 0.150 2.030 3.429 -3.750 1.160 5.070 6.412 -4.850 1.070 5.610 7.493 Spec 9 -2.560 0.420 2.030 3.294 -5.070 0.870 4.380 6.756 -4.380 0.800 4.950 6.658
Spec 10 -2.050 0.530 2.140 3.010 -2.220 0.680 2.510 3.419 -1.810 0.230 2.130 2.805 Spec 11 -1.960 -0.110 0.660 2.071 -2.460 -0.200 2.040 3.202 -2.100 0.100 2.670 3.398 Spec 12 -3.250 0.050 2.320 3.993 -4.570 -0.140 3.140 5.547 -3.560 -0.290 3.590 5.064 Spec 13 -0.690 0.750 1.090 1.492 -1.550 0.130 1.740 2.334 -1.420 0.290 2.810 3.162 Spec 14 -2.230 -0.460 -1.340 2.642 -2.420 -0.410 0.600 2.527 -2.100 -0.630 0.790 2.330 Spec 15 -2.210 -0.220 0.710 2.332 -2.990 -0.090 2.550 3.931 -2.760 0.310 2.960 4.059 Spec 16 -1.910 0.610 1.710 2.635 -4.820 -0.300 2.510 5.443 -2.650 0.150 2.800 3.858 Spec 17 -2.630 0.010 1.020 2.821 -3.070 -0.080 1.610 3.467 -3.620 0.050 2.380 4.333 Spec 18 -3.420 -0.220 1.080 3.593 -3.770 -0.250 1.980 4.266 -4.280 0.080 2.970 5.210 Spec 19 -2.760 -0.830 0.610 2.946 -3.550 -0.310 2.380 4.285 -4.090 -0.440 4.340 5.980 Spec 20 -2.400 -0.030 1.200 2.683 -4.400 0.130 3.300 5.502 -3.350 0.190 3.620 4.936 Mean -2.169 0.039 1.185 2.955 -3.410 0.077 2.682 4.464 -3.327 0.172 3.299 4.750
SD 1.511 0.465 0.979 0.834 1.004 0.554 1.314 1.371 1.110 0.457 1.285 1.573
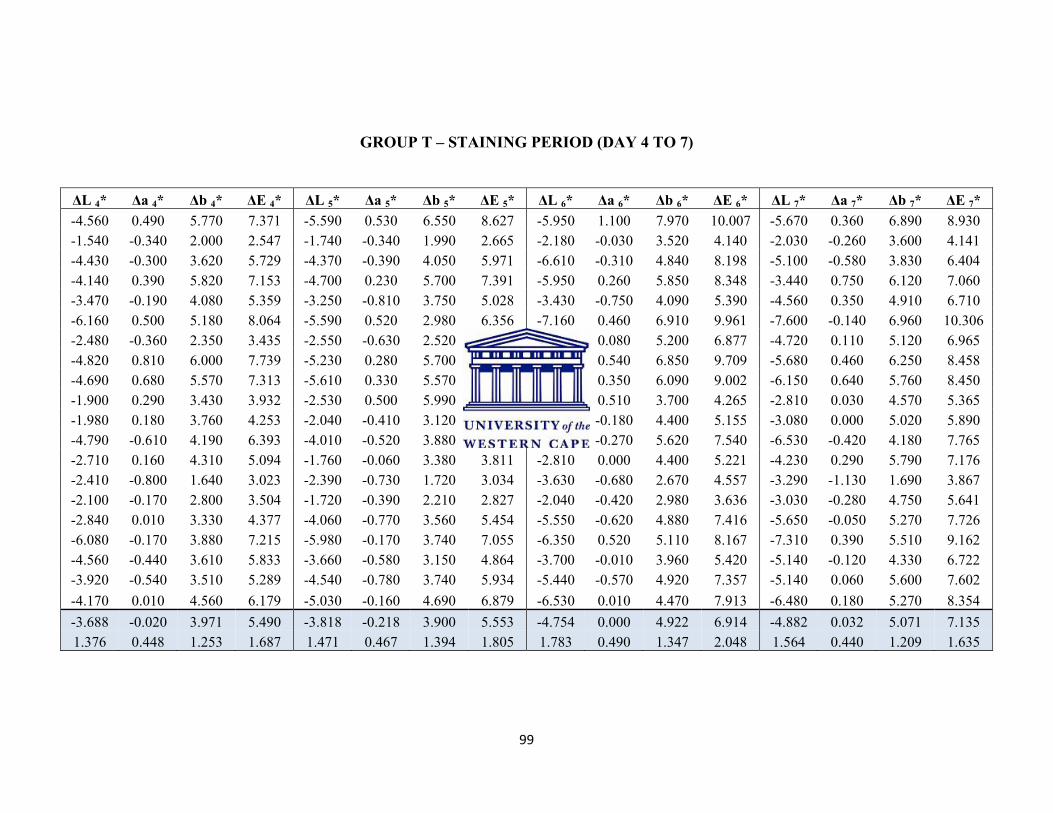
99
GROUP T – STAINING PERIOD (DAY 4 TO 7)
ΔL 4* Δa 4* Δb 4* ΔE 4* ΔL 5* Δa 5* Δb 5* ΔE 5* ΔL 6* Δa 6* Δb 6* ΔE 6* ΔL 7* Δa 7* Δb 7* ΔE 7* -4.560 0.490 5.770 7.371 -5.590 0.530 6.550 8.627 -5.950 1.100 7.970 10.007 -5.670 0.360 6.890 8.930 -1.540 -0.340 2.000 2.547 -1.740 -0.340 1.990 2.665 -2.180 -0.030 3.520 4.140 -2.030 -0.260 3.600 4.141 -4.430 -0.300 3.620 5.729 -4.370 -0.390 4.050 5.971 -6.610 -0.310 4.840 8.198 -5.100 -0.580 3.830 6.404 -4.140 0.390 5.820 7.153 -4.700 0.230 5.700 7.391 -5.950 0.260 5.850 8.348 -3.440 0.750 6.120 7.060 -3.470 -0.190 4.080 5.359 -3.250 -0.810 3.750 5.028 -3.430 -0.750 4.090 5.390 -4.560 0.350 4.910 6.710 -6.160 0.500 5.180 8.064 -5.590 0.520 2.980 6.356 -7.160 0.460 6.910 9.961 -7.600 -0.140 6.960 10.306 -2.480 -0.360 2.350 3.435 -2.550 -0.630 2.520 3.640 -4.500 0.080 5.200 6.877 -4.720 0.110 5.120 6.965 -4.820 0.810 6.000 7.739 -5.230 0.280 5.700 7.741 -6.860 0.540 6.850 9.709 -5.680 0.460 6.250 8.458 -4.690 0.680 5.570 7.313 -5.610 0.330 5.570 7.912 -6.620 0.350 6.090 9.002 -6.150 0.640 5.760 8.450 -1.900 0.290 3.430 3.932 -2.530 0.500 5.990 6.522 -2.060 0.510 3.700 4.265 -2.810 0.030 4.570 5.365 -1.980 0.180 3.760 4.253 -2.040 -0.410 3.120 3.750 -2.680 -0.180 4.400 5.155 -3.080 0.000 5.020 5.890 -4.790 -0.610 4.190 6.393 -4.010 -0.520 3.880 5.604 -5.020 -0.270 5.620 7.540 -6.530 -0.420 4.180 7.765 -2.710 0.160 4.310 5.094 -1.760 -0.060 3.380 3.811 -2.810 0.000 4.400 5.221 -4.230 0.290 5.790 7.176 -2.410 -0.800 1.640 3.023 -2.390 -0.730 1.720 3.034 -3.630 -0.680 2.670 4.557 -3.290 -1.130 1.690 3.867 -2.100 -0.170 2.800 3.504 -1.720 -0.390 2.210 2.827 -2.040 -0.420 2.980 3.636 -3.030 -0.280 4.750 5.641 -2.840 0.010 3.330 4.377 -4.060 -0.770 3.560 5.454 -5.550 -0.620 4.880 7.416 -5.650 -0.050 5.270 7.726 -6.080 -0.170 3.880 7.215 -5.980 -0.170 3.740 7.055 -6.350 0.520 5.110 8.167 -7.310 0.390 5.510 9.162 -4.560 -0.440 3.610 5.833 -3.660 -0.580 3.150 4.864 -3.700 -0.010 3.960 5.420 -5.140 -0.120 4.330 6.722 -3.920 -0.540 3.510 5.289 -4.540 -0.780 3.740 5.934 -5.440 -0.570 4.920 7.357 -5.140 0.060 5.600 7.602 -4.170 0.010 4.560 6.179 -5.030 -0.160 4.690 6.879 -6.530 0.010 4.470 7.913 -6.480 0.180 5.270 8.354 -3.688 -0.020 3.971 5.490 -3.818 -0.218 3.900 5.553 -4.754 0.000 4.922 6.914 -4.882 0.032 5.071 7.135 1.376 0.448 1.253 1.687 1.471 0.467 1.394 1.805 1.783 0.490 1.347 2.048 1.564 0.440 1.209 1.635
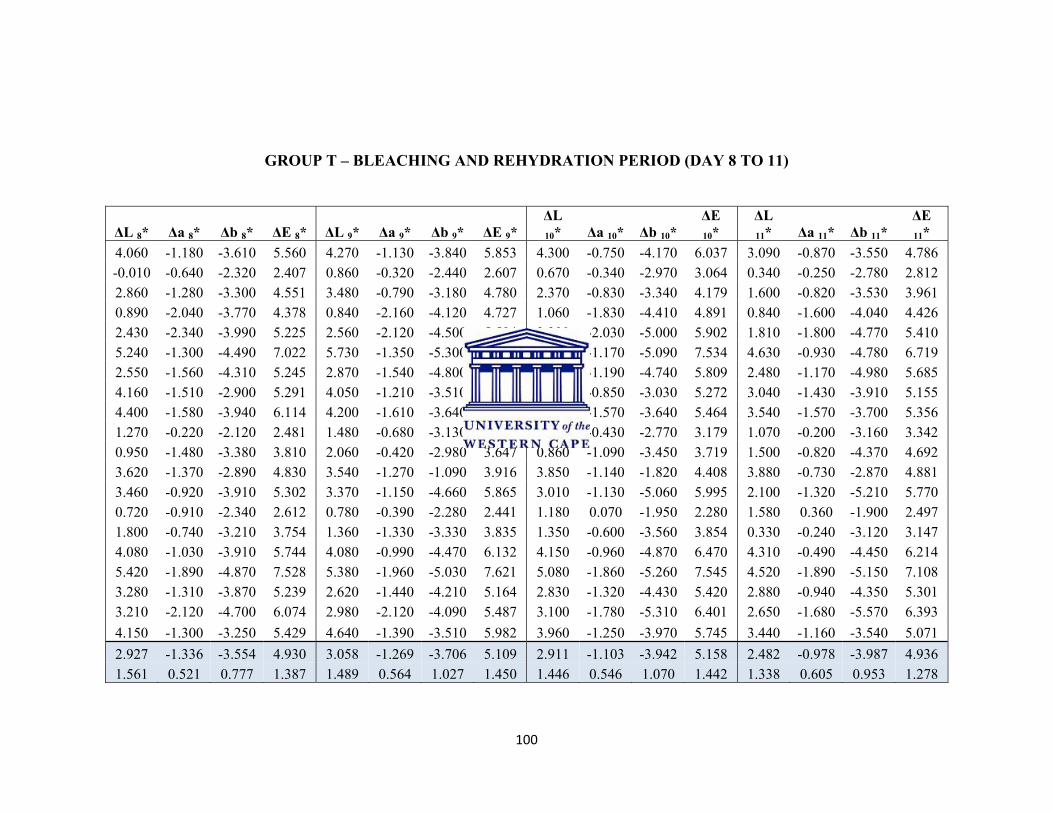
100
GROUP T – BLEACHING AND REHYDRATION PERIOD (DAY 8 TO 11)
ΔL 8* Δa 8* Δb 8* ΔE 8* ΔL 9* Δa 9* Δb 9* ΔE 9* ΔL 10* Δa 10* Δb 10*
ΔE 10*
ΔL 11* Δa 11* Δb 11*
ΔE 11*
4.060 -1.180 -3.610 5.560 4.270 -1.130 -3.840 5.853 4.300 -0.750 -4.170 6.037 3.090 -0.870 -3.550 4.786 -0.010 -0.640 -2.320 2.407 0.860 -0.320 -2.440 2.607 0.670 -0.340 -2.970 3.064 0.340 -0.250 -2.780 2.812 2.860 -1.280 -3.300 4.551 3.480 -0.790 -3.180 4.780 2.370 -0.830 -3.340 4.179 1.600 -0.820 -3.530 3.961 0.890 -2.040 -3.770 4.378 0.840 -2.160 -4.120 4.727 1.060 -1.830 -4.410 4.891 0.840 -1.600 -4.040 4.426 2.430 -2.340 -3.990 5.225 2.560 -2.120 -4.500 5.594 2.390 -2.030 -5.000 5.902 1.810 -1.800 -4.770 5.410 5.240 -1.300 -4.490 7.022 5.730 -1.350 -5.300 7.921 5.430 -1.170 -5.090 7.534 4.630 -0.930 -4.780 6.719 2.550 -1.560 -4.310 5.245 2.870 -1.540 -4.800 5.801 3.140 -1.190 -4.740 5.809 2.480 -1.170 -4.980 5.685 4.160 -1.510 -2.900 5.291 4.050 -1.210 -3.510 5.494 4.230 -0.850 -3.030 5.272 3.040 -1.430 -3.910 5.155 4.400 -1.580 -3.940 6.114 4.200 -1.610 -3.640 5.786 3.760 -1.570 -3.640 5.464 3.540 -1.570 -3.700 5.356 1.270 -0.220 -2.120 2.481 1.480 -0.680 -3.130 3.528 1.500 -0.430 -2.770 3.179 1.070 -0.200 -3.160 3.342 0.950 -1.480 -3.380 3.810 2.060 -0.420 -2.980 3.647 0.860 -1.090 -3.450 3.719 1.500 -0.820 -4.370 4.692 3.620 -1.370 -2.890 4.830 3.540 -1.270 -1.090 3.916 3.850 -1.140 -1.820 4.408 3.880 -0.730 -2.870 4.881 3.460 -0.920 -3.910 5.302 3.370 -1.150 -4.660 5.865 3.010 -1.130 -5.060 5.995 2.100 -1.320 -5.210 5.770 0.720 -0.910 -2.340 2.612 0.780 -0.390 -2.280 2.441 1.180 0.070 -1.950 2.280 1.580 0.360 -1.900 2.497 1.800 -0.740 -3.210 3.754 1.360 -1.330 -3.330 3.835 1.350 -0.600 -3.560 3.854 0.330 -0.240 -3.120 3.147 4.080 -1.030 -3.910 5.744 4.080 -0.990 -4.470 6.132 4.150 -0.960 -4.870 6.470 4.310 -0.490 -4.450 6.214 5.420 -1.890 -4.870 7.528 5.380 -1.960 -5.030 7.621 5.080 -1.860 -5.260 7.545 4.520 -1.890 -5.150 7.108 3.280 -1.310 -3.870 5.239 2.620 -1.440 -4.210 5.164 2.830 -1.320 -4.430 5.420 2.880 -0.940 -4.350 5.301 3.210 -2.120 -4.700 6.074 2.980 -2.120 -4.090 5.487 3.100 -1.780 -5.310 6.401 2.650 -1.680 -5.570 6.393 4.150 -1.300 -3.250 5.429 4.640 -1.390 -3.510 5.982 3.960 -1.250 -3.970 5.745 3.440 -1.160 -3.540 5.071 2.927 -1.336 -3.554 4.930 3.058 -1.269 -3.706 5.109 2.911 -1.103 -3.942 5.158 2.482 -0.978 -3.987 4.936 1.561 0.521 0.777 1.387 1.489 0.564 1.027 1.450 1.446 0.546 1.070 1.442 1.338 0.605 0.953 1.278
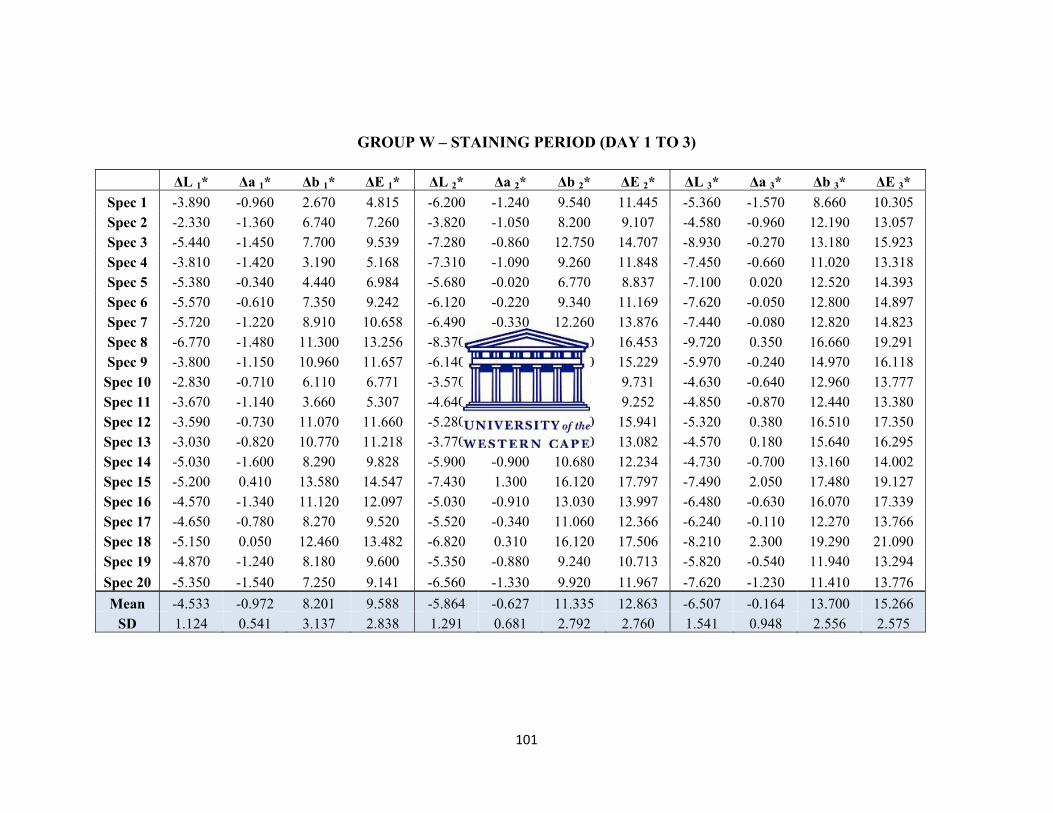
101
GROUP W – STAINING PERIOD (DAY 1 TO 3)
ΔL 1* Δa 1* Δb 1* ΔE 1* ΔL 2* Δa 2* Δb 2* ΔE 2* ΔL 3* Δa 3* Δb 3* ΔE 3* Spec 1 -3.890 -0.960 2.670 4.815 -6.200 -1.240 9.540 11.445 -5.360 -1.570 8.660 10.305 Spec 2 -2.330 -1.360 6.740 7.260 -3.820 -1.050 8.200 9.107 -4.580 -0.960 12.190 13.057 Spec 3 -5.440 -1.450 7.700 9.539 -7.280 -0.860 12.750 14.707 -8.930 -0.270 13.180 15.923 Spec 4 -3.810 -1.420 3.190 5.168 -7.310 -1.090 9.260 11.848 -7.450 -0.660 11.020 13.318 Spec 5 -5.380 -0.340 4.440 6.984 -5.680 -0.020 6.770 8.837 -7.100 0.020 12.520 14.393 Spec 6 -5.570 -0.610 7.350 9.242 -6.120 -0.220 9.340 11.169 -7.620 -0.050 12.800 14.897 Spec 7 -5.720 -1.220 8.910 10.658 -6.490 -0.330 12.260 13.876 -7.440 -0.080 12.820 14.823 Spec 8 -6.770 -1.480 11.300 13.256 -8.370 -0.390 14.160 16.453 -9.720 0.350 16.660 19.291 Spec 9 -3.800 -1.150 10.960 11.657 -6.140 -1.130 13.890 15.229 -5.970 -0.240 14.970 16.118
Spec 10 -2.830 -0.710 6.110 6.771 -3.570 -0.760 9.020 9.731 -4.630 -0.640 12.960 13.777 Spec 11 -3.670 -1.140 3.660 5.307 -4.640 -1.840 7.790 9.252 -4.850 -0.870 12.440 13.380 Spec 12 -3.590 -0.730 11.070 11.660 -5.280 -0.190 15.040 15.941 -5.320 0.380 16.510 17.350 Spec 13 -3.030 -0.820 10.770 11.218 -3.770 -0.660 12.510 13.082 -4.570 0.180 15.640 16.295 Spec 14 -5.030 -1.600 8.290 9.828 -5.900 -0.900 10.680 12.234 -4.730 -0.700 13.160 14.002 Spec 15 -5.200 0.410 13.580 14.547 -7.430 1.300 16.120 17.797 -7.490 2.050 17.480 19.127 Spec 16 -4.570 -1.340 11.120 12.097 -5.030 -0.910 13.030 13.997 -6.480 -0.630 16.070 17.339 Spec 17 -4.650 -0.780 8.270 9.520 -5.520 -0.340 11.060 12.366 -6.240 -0.110 12.270 13.766 Spec 18 -5.150 0.050 12.460 13.482 -6.820 0.310 16.120 17.506 -8.210 2.300 19.290 21.090 Spec 19 -4.870 -1.240 8.180 9.600 -5.350 -0.880 9.240 10.713 -5.820 -0.540 11.940 13.294 Spec 20 -5.350 -1.540 7.250 9.141 -6.560 -1.330 9.920 11.967 -7.620 -1.230 11.410 13.776 Mean -4.533 -0.972 8.201 9.588 -5.864 -0.627 11.335 12.863 -6.507 -0.164 13.700 15.266
SD 1.124 0.541 3.137 2.838 1.291 0.681 2.792 2.760 1.541 0.948 2.556 2.575
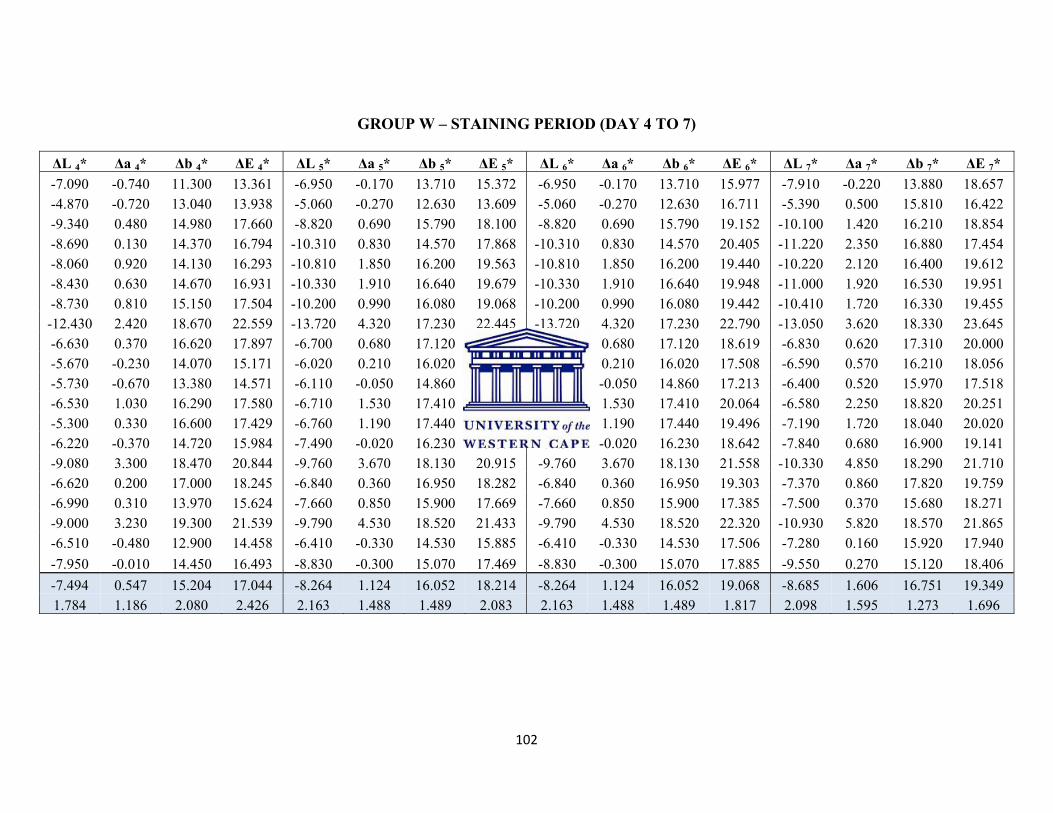
102
GROUP W – STAINING PERIOD (DAY 4 TO 7)
ΔL 4* Δa 4* Δb 4* ΔE 4* ΔL 5* Δa 5* Δb 5* ΔE 5* ΔL 6* Δa 6* Δb 6* ΔE 6* ΔL 7* Δa 7* Δb 7* ΔE 7* -7.090 -0.740 11.300 13.361 -6.950 -0.170 13.710 15.372 -6.950 -0.170 13.710 15.977 -7.910 -0.220 13.880 18.657 -4.870 -0.720 13.040 13.938 -5.060 -0.270 12.630 13.609 -5.060 -0.270 12.630 16.711 -5.390 0.500 15.810 16.422 -9.340 0.480 14.980 17.660 -8.820 0.690 15.790 18.100 -8.820 0.690 15.790 19.152 -10.100 1.420 16.210 18.854 -8.690 0.130 14.370 16.794 -10.310 0.830 14.570 17.868 -10.310 0.830 14.570 20.405 -11.220 2.350 16.880 17.454 -8.060 0.920 14.130 16.293 -10.810 1.850 16.200 19.563 -10.810 1.850 16.200 19.440 -10.220 2.120 16.400 19.612 -8.430 0.630 14.670 16.931 -10.330 1.910 16.640 19.679 -10.330 1.910 16.640 19.948 -11.000 1.920 16.530 19.951 -8.730 0.810 15.150 17.504 -10.200 0.990 16.080 19.068 -10.200 0.990 16.080 19.442 -10.410 1.720 16.330 19.455 -12.430 2.420 18.670 22.559 -13.720 4.320 17.230 22.445 -13.720 4.320 17.230 22.790 -13.050 3.620 18.330 23.645 -6.630 0.370 16.620 17.897 -6.700 0.680 17.120 18.397 -6.700 0.680 17.120 18.619 -6.830 0.620 17.310 20.000 -5.670 -0.230 14.070 15.171 -6.020 0.210 16.020 17.115 -6.020 0.210 16.020 17.508 -6.590 0.570 16.210 18.056 -5.730 -0.670 13.380 14.571 -6.110 -0.050 14.860 16.067 -6.110 -0.050 14.860 17.213 -6.400 0.520 15.970 17.518 -6.530 1.030 16.290 17.580 -6.710 1.530 17.410 18.721 -6.710 1.530 17.410 20.064 -6.580 2.250 18.820 20.251 -5.300 0.330 16.600 17.429 -6.760 1.190 17.440 18.742 -6.760 1.190 17.440 19.496 -7.190 1.720 18.040 20.020 -6.220 -0.370 14.720 15.984 -7.490 -0.020 16.230 17.875 -7.490 -0.020 16.230 18.642 -7.840 0.680 16.900 19.141 -9.080 3.300 18.470 20.844 -9.760 3.670 18.130 20.915 -9.760 3.670 18.130 21.558 -10.330 4.850 18.290 21.710 -6.620 0.200 17.000 18.245 -6.840 0.360 16.950 18.282 -6.840 0.360 16.950 19.303 -7.370 0.860 17.820 19.759 -6.990 0.310 13.970 15.624 -7.660 0.850 15.900 17.669 -7.660 0.850 15.900 17.385 -7.500 0.370 15.680 18.271 -9.000 3.230 19.300 21.539 -9.790 4.530 18.520 21.433 -9.790 4.530 18.520 22.320 -10.930 5.820 18.570 21.865 -6.510 -0.480 12.900 14.458 -6.410 -0.330 14.530 15.885 -6.410 -0.330 14.530 17.506 -7.280 0.160 15.920 17.940 -7.950 -0.010 14.450 16.493 -8.830 -0.300 15.070 17.469 -8.830 -0.300 15.070 17.885 -9.550 0.270 15.120 18.406 -7.494 0.547 15.204 17.044 -8.264 1.124 16.052 18.214 -8.264 1.124 16.052 19.068 -8.685 1.606 16.751 19.349 1.784 1.186 2.080 2.426 2.163 1.488 1.489 2.083 2.163 1.488 1.489 1.817 2.098 1.595 1.273 1.696
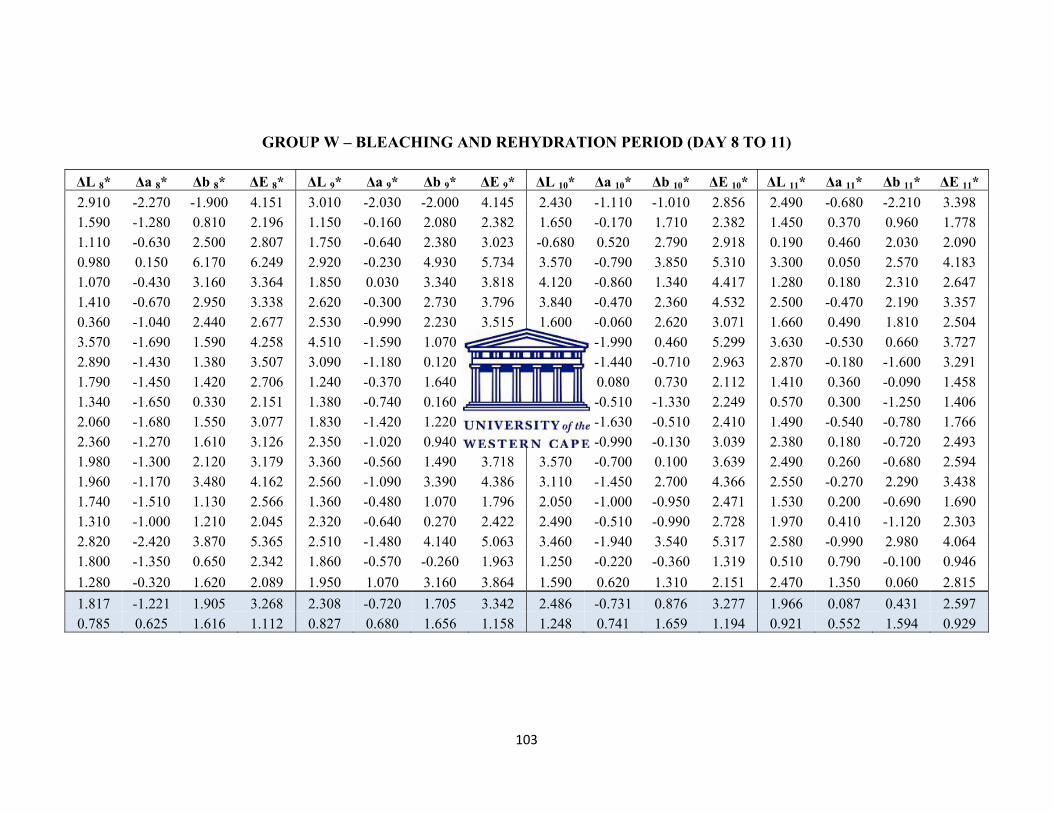
103
GROUP W – BLEACHING AND REHYDRATION PERIOD (DAY 8 TO 11)
ΔL 8* Δa 8* Δb 8* ΔE 8* ΔL 9* Δa 9* Δb 9* ΔE 9* ΔL 10* Δa 10* Δb 10* ΔE 10* ΔL 11* Δa 11* Δb 11* ΔE 11* 2.910 -2.270 -1.900 4.151 3.010 -2.030 -2.000 4.145 2.430 -1.110 -1.010 2.856 2.490 -0.680 -2.210 3.398 1.590 -1.280 0.810 2.196 1.150 -0.160 2.080 2.382 1.650 -0.170 1.710 2.382 1.450 0.370 0.960 1.778 1.110 -0.630 2.500 2.807 1.750 -0.640 2.380 3.023 -0.680 0.520 2.790 2.918 0.190 0.460 2.030 2.090 0.980 0.150 6.170 6.249 2.920 -0.230 4.930 5.734 3.570 -0.790 3.850 5.310 3.300 0.050 2.570 4.183 1.070 -0.430 3.160 3.364 1.850 0.030 3.340 3.818 4.120 -0.860 1.340 4.417 1.280 0.180 2.310 2.647 1.410 -0.670 2.950 3.338 2.620 -0.300 2.730 3.796 3.840 -0.470 2.360 4.532 2.500 -0.470 2.190 3.357 0.360 -1.040 2.440 2.677 2.530 -0.990 2.230 3.515 1.600 -0.060 2.620 3.071 1.660 0.490 1.810 2.504 3.570 -1.690 1.590 4.258 4.510 -1.590 1.070 4.900 4.890 -1.990 0.460 5.299 3.630 -0.530 0.660 3.727 2.890 -1.430 1.380 3.507 3.090 -1.180 0.120 3.310 2.490 -1.440 -0.710 2.963 2.870 -0.180 -1.600 3.291 1.790 -1.450 1.420 2.706 1.240 -0.370 1.640 2.089 1.980 0.080 0.730 2.112 1.410 0.360 -0.090 1.458 1.340 -1.650 0.330 2.151 1.380 -0.740 0.160 1.574 1.740 -0.510 -1.330 2.249 0.570 0.300 -1.250 1.406 2.060 -1.680 1.550 3.077 1.830 -1.420 1.220 2.618 1.700 -1.630 -0.510 2.410 1.490 -0.540 -0.780 1.766 2.360 -1.270 1.610 3.126 2.350 -1.020 0.940 2.729 2.870 -0.990 -0.130 3.039 2.380 0.180 -0.720 2.493 1.980 -1.300 2.120 3.179 3.360 -0.560 1.490 3.718 3.570 -0.700 0.100 3.639 2.490 0.260 -0.680 2.594 1.960 -1.170 3.480 4.162 2.560 -1.090 3.390 4.386 3.110 -1.450 2.700 4.366 2.550 -0.270 2.290 3.438 1.740 -1.510 1.130 2.566 1.360 -0.480 1.070 1.796 2.050 -1.000 -0.950 2.471 1.530 0.200 -0.690 1.690 1.310 -1.000 1.210 2.045 2.320 -0.640 0.270 2.422 2.490 -0.510 -0.990 2.728 1.970 0.410 -1.120 2.303 2.820 -2.420 3.870 5.365 2.510 -1.480 4.140 5.063 3.460 -1.940 3.540 5.317 2.580 -0.990 2.980 4.064 1.800 -1.350 0.650 2.342 1.860 -0.570 -0.260 1.963 1.250 -0.220 -0.360 1.319 0.510 0.790 -0.100 0.946 1.280 -0.320 1.620 2.089 1.950 1.070 3.160 3.864 1.590 0.620 1.310 2.151 2.470 1.350 0.060 2.815 1.817 -1.221 1.905 3.268 2.308 -0.720 1.705 3.342 2.486 -0.731 0.876 3.277 1.966 0.087 0.431 2.597 0.785 0.625 1.616 1.112 0.827 0.680 1.656 1.158 1.248 0.741 1.659 1.194 0.921 0.552 1.594 0.929
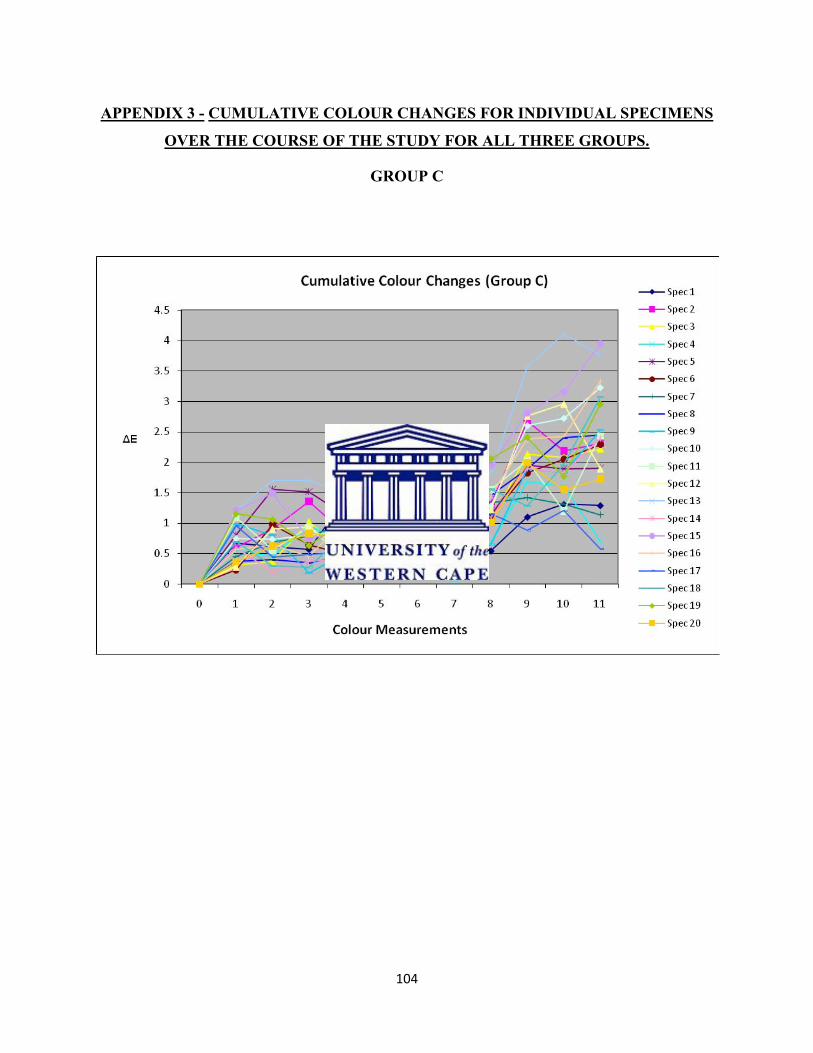
104
APPENDIX 3 - CUMULATIVE COLOUR CHANGES FOR INDIVIDUAL SPECIMENS
OVER THE COURSE OF THE STUDY FOR ALL THREE GROUPS.
GROUP C

105
GROUP T

106
GROUP W
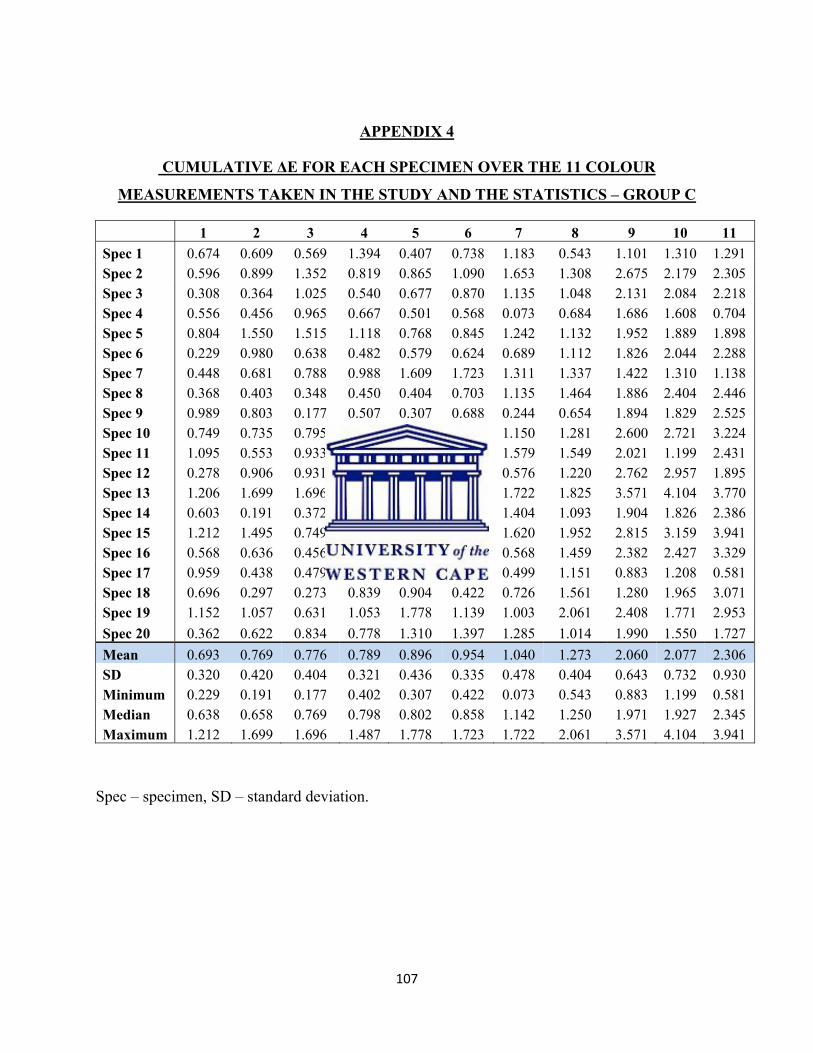
107
APPENDIX 4
CUMULATIVE ΔE FOR EACH SPECIMEN OVER THE 11 COLOUR
MEASUREMENTS TAKEN IN THE STUDY AND THE STATISTICS – GROUP C
1 2 3 4 5 6 7 8 9 10 11 Spec 1 0.674 0.609 0.569 1.394 0.407 0.738 1.183 0.543 1.101 1.310 1.291 Spec 2 0.596 0.899 1.352 0.819 0.865 1.090 1.653 1.308 2.675 2.179 2.305 Spec 3 0.308 0.364 1.025 0.540 0.677 0.870 1.135 1.048 2.131 2.084 2.218 Spec 4 0.556 0.456 0.965 0.667 0.501 0.568 0.073 0.684 1.686 1.608 0.704 Spec 5 0.804 1.550 1.515 1.118 0.768 0.845 1.242 1.132 1.952 1.889 1.898 Spec 6 0.229 0.980 0.638 0.482 0.579 0.624 0.689 1.112 1.826 2.044 2.288 Spec 7 0.448 0.681 0.788 0.988 1.609 1.723 1.311 1.337 1.422 1.310 1.138 Spec 8 0.368 0.403 0.348 0.450 0.404 0.703 1.135 1.464 1.886 2.404 2.446 Spec 9 0.989 0.803 0.177 0.507 0.307 0.688 0.244 0.654 1.894 1.829 2.525 Spec 10 0.749 0.735 0.795 0.871 0.785 0.993 1.150 1.281 2.600 2.721 3.224 Spec 11 1.095 0.553 0.933 0.402 0.715 1.211 1.579 1.549 2.021 1.199 2.431 Spec 12 0.278 0.906 0.931 0.531 1.051 0.836 0.576 1.220 2.762 2.957 1.895 Spec 13 1.206 1.699 1.696 1.487 1.260 1.444 1.722 1.825 3.571 4.104 3.770 Spec 14 0.603 0.191 0.372 0.408 0.819 0.775 1.404 1.093 1.904 1.826 2.386 Spec 15 1.212 1.495 0.749 0.870 1.587 1.084 1.620 1.952 2.815 3.159 3.941 Spec 16 0.568 0.636 0.456 1.056 1.182 1.264 0.568 1.459 2.382 2.427 3.329 Spec 17 0.959 0.438 0.479 0.529 0.404 0.660 0.499 1.151 0.883 1.208 0.581 Spec 18 0.696 0.297 0.273 0.839 0.904 0.422 0.726 1.561 1.280 1.965 3.071 Spec 19 1.152 1.057 0.631 1.053 1.778 1.139 1.003 2.061 2.408 1.771 2.953 Spec 20 0.362 0.622 0.834 0.778 1.310 1.397 1.285 1.014 1.990 1.550 1.727 Mean 0.693 0.769 0.776 0.789 0.896 0.954 1.040 1.273 2.060 2.077 2.306 SD 0.320 0.420 0.404 0.321 0.436 0.335 0.478 0.404 0.643 0.732 0.930 Minimum 0.229 0.191 0.177 0.402 0.307 0.422 0.073 0.543 0.883 1.199 0.581 Median 0.638 0.658 0.769 0.798 0.802 0.858 1.142 1.250 1.971 1.927 2.345 Maximum 1.212 1.699 1.696 1.487 1.778 1.723 1.722 2.061 3.571 4.104 3.941
Spec – specimen, SD – standard deviation.
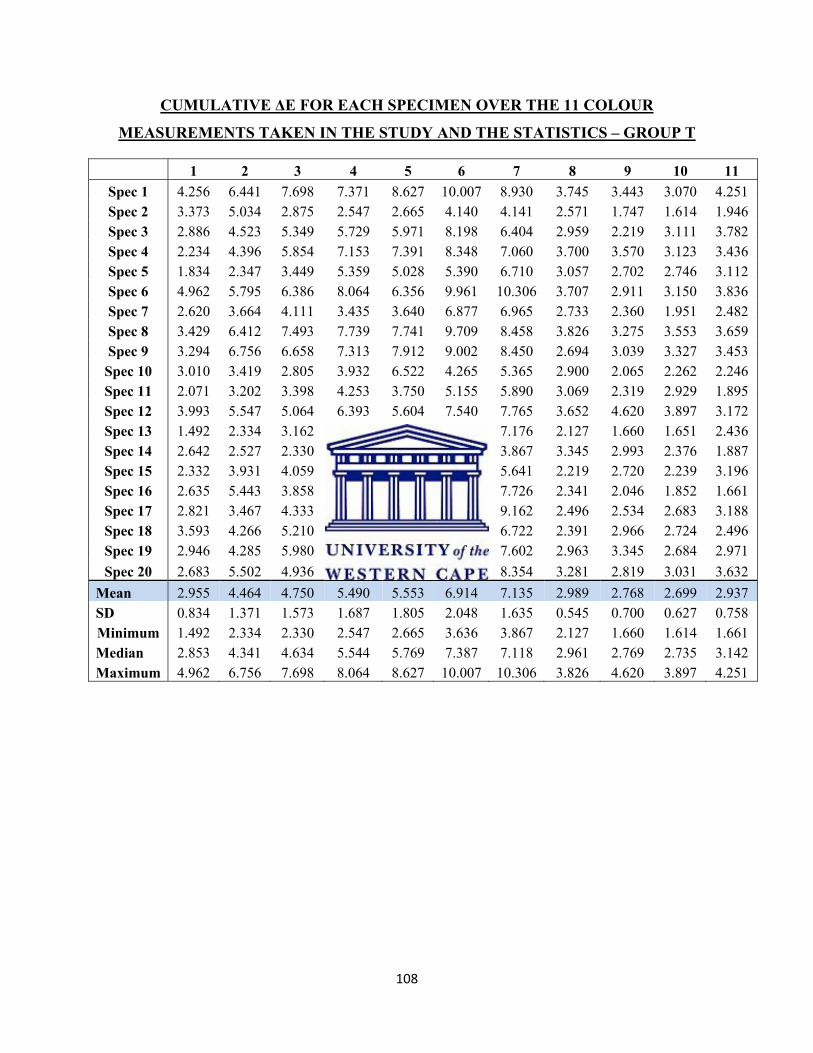
108
CUMULATIVE ΔE FOR EACH SPECIMEN OVER THE 11 COLOUR
MEASUREMENTS TAKEN IN THE STUDY AND THE STATISTICS – GROUP T
1 2 3 4 5 6 7 8 9 10 11 Spec 1 4.256 6.441 7.698 7.371 8.627 10.007 8.930 3.745 3.443 3.070 4.251 Spec 2 3.373 5.034 2.875 2.547 2.665 4.140 4.141 2.571 1.747 1.614 1.946 Spec 3 2.886 4.523 5.349 5.729 5.971 8.198 6.404 2.959 2.219 3.111 3.782 Spec 4 2.234 4.396 5.854 7.153 7.391 8.348 7.060 3.700 3.570 3.123 3.436 Spec 5 1.834 2.347 3.449 5.359 5.028 5.390 6.710 3.057 2.702 2.746 3.112 Spec 6 4.962 5.795 6.386 8.064 6.356 9.961 10.306 3.707 2.911 3.150 3.836 Spec 7 2.620 3.664 4.111 3.435 3.640 6.877 6.965 2.733 2.360 1.951 2.482 Spec 8 3.429 6.412 7.493 7.739 7.741 9.709 8.458 3.826 3.275 3.553 3.659 Spec 9 3.294 6.756 6.658 7.313 7.912 9.002 8.450 2.694 3.039 3.327 3.453
Spec 10 3.010 3.419 2.805 3.932 6.522 4.265 5.365 2.900 2.065 2.262 2.246 Spec 11 2.071 3.202 3.398 4.253 3.750 5.155 5.890 3.069 2.319 2.929 1.895 Spec 12 3.993 5.547 5.064 6.393 5.604 7.540 7.765 3.652 4.620 3.897 3.172 Spec 13 1.492 2.334 3.162 5.094 3.811 5.221 7.176 2.127 1.660 1.651 2.436 Spec 14 2.642 2.527 2.330 3.023 3.034 4.557 3.867 3.345 2.993 2.376 1.887 Spec 15 2.332 3.931 4.059 3.504 2.827 3.636 5.641 2.219 2.720 2.239 3.196 Spec 16 2.635 5.443 3.858 4.377 5.454 7.416 7.726 2.341 2.046 1.852 1.661 Spec 17 2.821 3.467 4.333 7.215 7.055 8.167 9.162 2.496 2.534 2.683 3.188 Spec 18 3.593 4.266 5.210 5.833 4.864 5.420 6.722 2.391 2.966 2.724 2.496 Spec 19 2.946 4.285 5.980 5.289 5.934 7.357 7.602 2.963 3.345 2.684 2.971 Spec 20 2.683 5.502 4.936 6.179 6.879 7.913 8.354 3.281 2.819 3.031 3.632
Mean 2.955 4.464 4.750 5.490 5.553 6.914 7.135 2.989 2.768 2.699 2.937 SD 0.834 1.371 1.573 1.687 1.805 2.048 1.635 0.545 0.700 0.627 0.758 Minimum 1.492 2.334 2.330 2.547 2.665 3.636 3.867 2.127 1.660 1.614 1.661 Median 2.853 4.341 4.634 5.544 5.769 7.387 7.118 2.961 2.769 2.735 3.142 Maximum 4.962 6.756 7.698 8.064 8.627 10.007 10.306 3.826 4.620 3.897 4.251
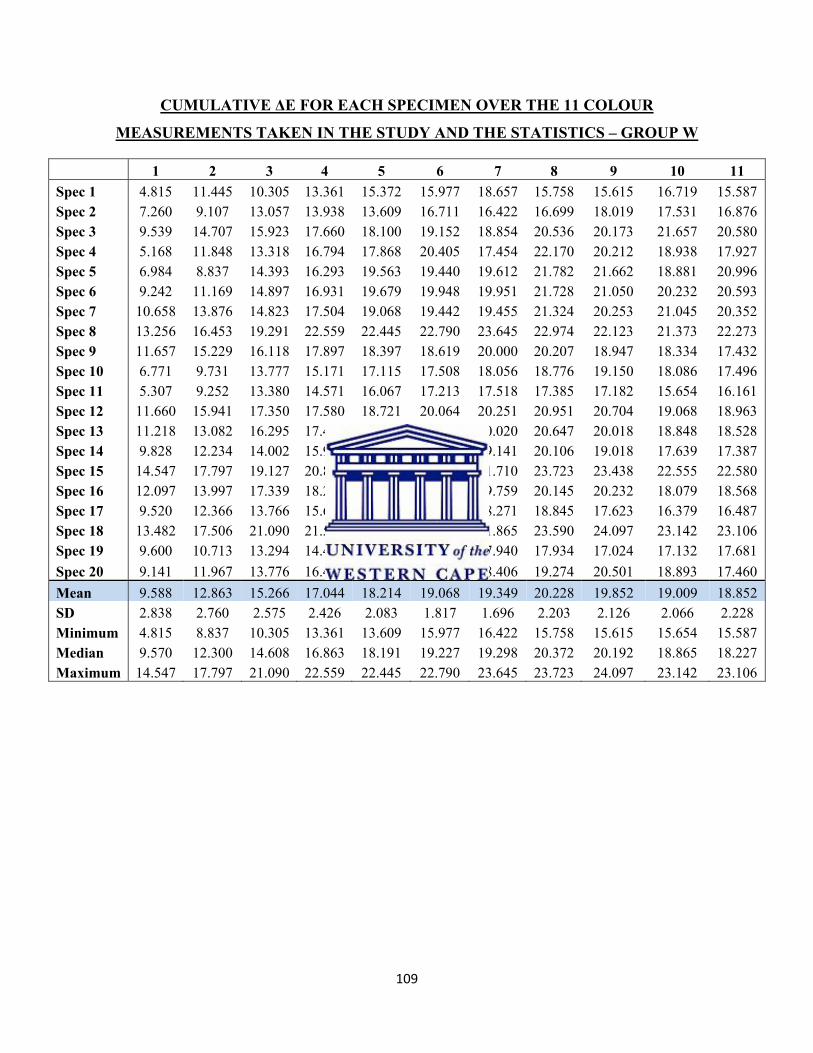
109
CUMULATIVE ΔE FOR EACH SPECIMEN OVER THE 11 COLOUR
MEASUREMENTS TAKEN IN THE STUDY AND THE STATISTICS – GROUP W
1 2 3 4 5 6 7 8 9 10 11 Spec 1 4.815 11.445 10.305 13.361 15.372 15.977 18.657 15.758 15.615 16.719 15.587 Spec 2 7.260 9.107 13.057 13.938 13.609 16.711 16.422 16.699 18.019 17.531 16.876 Spec 3 9.539 14.707 15.923 17.660 18.100 19.152 18.854 20.536 20.173 21.657 20.580 Spec 4 5.168 11.848 13.318 16.794 17.868 20.405 17.454 22.170 20.212 18.938 17.927 Spec 5 6.984 8.837 14.393 16.293 19.563 19.440 19.612 21.782 21.662 18.881 20.996 Spec 6 9.242 11.169 14.897 16.931 19.679 19.948 19.951 21.728 21.050 20.232 20.593 Spec 7 10.658 13.876 14.823 17.504 19.068 19.442 19.455 21.324 20.253 21.045 20.352 Spec 8 13.256 16.453 19.291 22.559 22.445 22.790 23.645 22.974 22.123 21.373 22.273 Spec 9 11.657 15.229 16.118 17.897 18.397 18.619 20.000 20.207 18.947 18.334 17.432 Spec 10 6.771 9.731 13.777 15.171 17.115 17.508 18.056 18.776 19.150 18.086 17.496 Spec 11 5.307 9.252 13.380 14.571 16.067 17.213 17.518 17.385 17.182 15.654 16.161 Spec 12 11.660 15.941 17.350 17.580 18.721 20.064 20.251 20.951 20.704 19.068 18.963 Spec 13 11.218 13.082 16.295 17.429 18.742 19.496 20.020 20.647 20.018 18.848 18.528 Spec 14 9.828 12.234 14.002 15.984 17.875 18.642 19.141 20.106 19.018 17.639 17.387 Spec 15 14.547 17.797 19.127 20.844 20.915 21.558 21.710 23.723 23.438 22.555 22.580 Spec 16 12.097 13.997 17.339 18.245 18.282 19.303 19.759 20.145 20.232 18.079 18.568 Spec 17 9.520 12.366 13.766 15.624 17.669 17.385 18.271 18.845 17.623 16.379 16.487 Spec 18 13.482 17.506 21.090 21.539 21.433 22.320 21.865 23.590 24.097 23.142 23.106 Spec 19 9.600 10.713 13.294 14.458 15.885 17.506 17.940 17.934 17.024 17.132 17.681 Spec 20 9.141 11.967 13.776 16.493 17.469 17.885 18.406 19.274 20.501 18.893 17.460 Mean 9.588 12.863 15.266 17.044 18.214 19.068 19.349 20.228 19.852 19.009 18.852 SD 2.838 2.760 2.575 2.426 2.083 1.817 1.696 2.203 2.126 2.066 2.228 Minimum 4.815 8.837 10.305 13.361 13.609 15.977 16.422 15.758 15.615 15.654 15.587 Median 9.570 12.300 14.608 16.863 18.191 19.227 19.298 20.372 20.192 18.865 18.227 Maximum 14.547 17.797 21.090 22.559 22.445 22.790 23.645 23.723 24.097 23.142 23.106
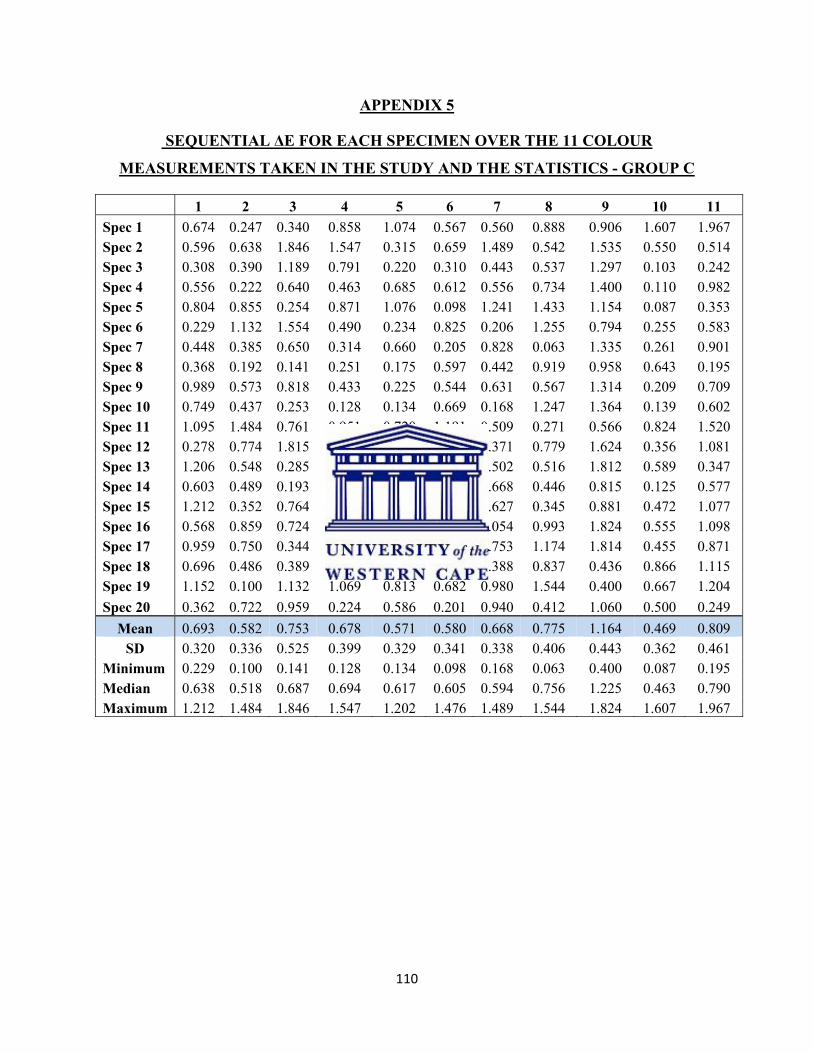
110
APPENDIX 5
SEQUENTIAL ΔE FOR EACH SPECIMEN OVER THE 11 COLOUR
MEASUREMENTS TAKEN IN THE STUDY AND THE STATISTICS - GROUP C
1 2 3 4 5 6 7 8 9 10 11 Spec 1 0.674 0.247 0.340 0.858 1.074 0.567 0.560 0.888 0.906 1.607 1.967 Spec 2 0.596 0.638 1.846 1.547 0.315 0.659 1.489 0.542 1.535 0.550 0.514 Spec 3 0.308 0.390 1.189 0.791 0.220 0.310 0.443 0.537 1.297 0.103 0.242 Spec 4 0.556 0.222 0.640 0.463 0.685 0.612 0.556 0.734 1.400 0.110 0.982 Spec 5 0.804 0.855 0.254 0.871 1.076 0.098 1.241 1.433 1.154 0.087 0.353 Spec 6 0.229 1.132 1.554 0.490 0.234 0.825 0.206 1.255 0.794 0.255 0.583 Spec 7 0.448 0.385 0.650 0.314 0.660 0.205 0.828 0.063 1.335 0.261 0.901 Spec 8 0.368 0.192 0.141 0.251 0.175 0.597 0.442 0.919 0.958 0.643 0.195 Spec 9 0.989 0.573 0.818 0.433 0.225 0.544 0.631 0.567 1.314 0.209 0.709 Spec 10 0.749 0.437 0.253 0.128 0.134 0.669 0.168 1.247 1.364 0.139 0.602 Spec 11 1.095 1.484 0.761 0.951 0.720 1.191 0.509 0.271 0.566 0.824 1.520 Spec 12 0.278 0.774 1.815 1.386 0.742 0.218 0.371 0.779 1.624 0.356 1.081 Spec 13 1.206 0.548 0.285 0.303 0.286 0.185 0.502 0.516 1.812 0.589 0.347 Spec 14 0.603 0.489 0.193 0.609 0.842 1.476 0.668 0.446 0.815 0.125 0.577 Spec 15 1.212 0.352 0.764 0.778 1.202 0.744 0.627 0.345 0.881 0.472 1.077 Spec 16 0.568 0.859 0.724 0.975 0.648 0.732 1.054 0.993 1.824 0.555 1.098 Spec 17 0.959 0.750 0.344 0.226 0.276 0.444 0.753 1.174 1.814 0.455 0.871 Spec 18 0.696 0.486 0.389 0.893 0.500 0.636 0.388 0.837 0.436 0.866 1.115 Spec 19 1.152 0.100 1.132 1.069 0.813 0.682 0.980 1.544 0.400 0.667 1.204 Spec 20 0.362 0.722 0.959 0.224 0.586 0.201 0.940 0.412 1.060 0.500 0.249
Mean 0.693 0.582 0.753 0.678 0.571 0.580 0.668 0.775 1.164 0.469 0.809 SD 0.320 0.336 0.525 0.399 0.329 0.341 0.338 0.406 0.443 0.362 0.461
Minimum 0.229 0.100 0.141 0.128 0.134 0.098 0.168 0.063 0.400 0.087 0.195 Median 0.638 0.518 0.687 0.694 0.617 0.605 0.594 0.756 1.225 0.463 0.790 Maximum 1.212 1.484 1.846 1.547 1.202 1.476 1.489 1.544 1.824 1.607 1.967
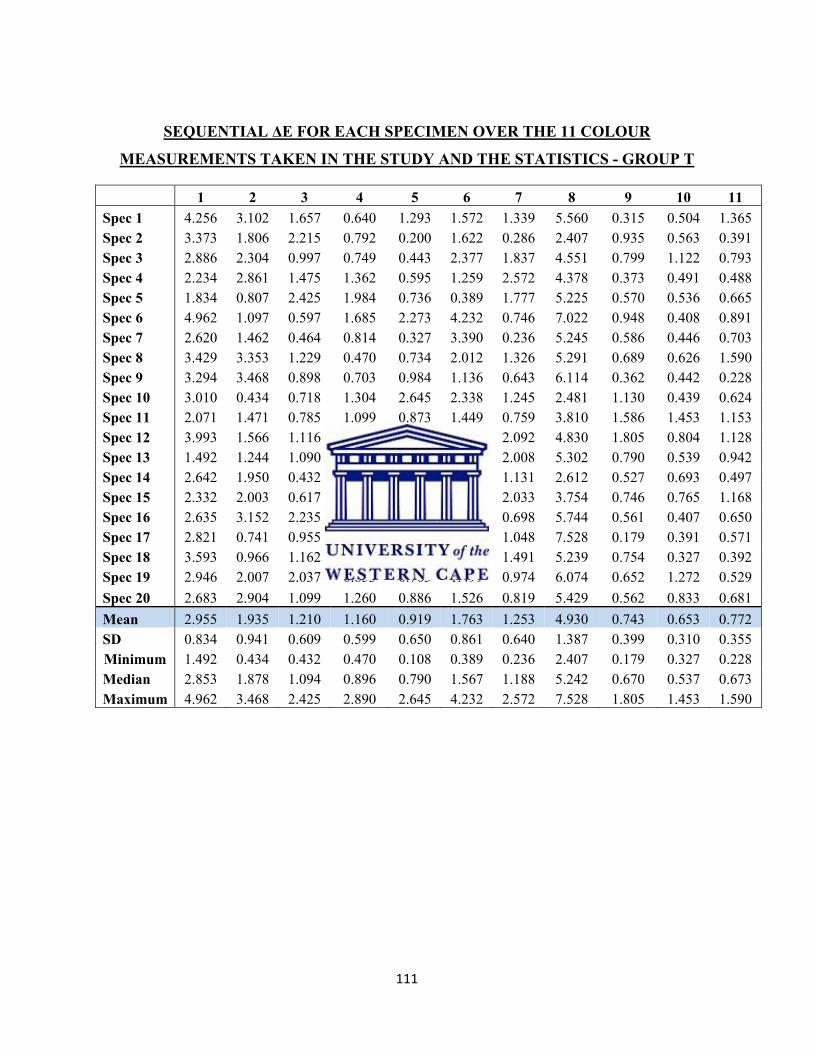
111
SEQUENTIAL ΔE FOR EACH SPECIMEN OVER THE 11 COLOUR
MEASUREMENTS TAKEN IN THE STUDY AND THE STATISTICS - GROUP T
1 2 3 4 5 6 7 8 9 10 11 Spec 1 4.256 3.102 1.657 0.640 1.293 1.572 1.339 5.560 0.315 0.504 1.365 Spec 2 3.373 1.806 2.215 0.792 0.200 1.622 0.286 2.407 0.935 0.563 0.391 Spec 3 2.886 2.304 0.997 0.749 0.443 2.377 1.837 4.551 0.799 1.122 0.793 Spec 4 2.234 2.861 1.475 1.362 0.595 1.259 2.572 4.378 0.373 0.491 0.488 Spec 5 1.834 0.807 2.425 1.984 0.736 0.389 1.777 5.225 0.570 0.536 0.665 Spec 6 4.962 1.097 0.597 1.685 2.273 4.232 0.746 7.022 0.948 0.408 0.891 Spec 7 2.620 1.462 0.464 0.814 0.327 3.390 0.236 5.245 0.586 0.446 0.703 Spec 8 3.429 3.353 1.229 0.470 0.734 2.012 1.326 5.291 0.689 0.626 1.590 Spec 9 3.294 3.468 0.898 0.703 0.984 1.136 0.643 6.114 0.362 0.442 0.228 Spec 10 3.010 0.434 0.718 1.304 2.645 2.338 1.245 2.481 1.130 0.439 0.624 Spec 11 2.071 1.471 0.785 1.099 0.873 1.449 0.759 3.810 1.586 1.453 1.153 Spec 12 3.993 1.566 1.116 1.405 0.844 2.027 2.092 4.830 1.805 0.804 1.128 Spec 13 1.492 1.244 1.090 1.983 1.348 1.465 2.008 5.302 0.790 0.539 0.942 Spec 14 2.642 1.950 0.432 0.921 0.108 1.563 1.131 2.612 0.527 0.693 0.497 Spec 15 2.332 2.003 0.617 0.832 0.735 0.834 2.033 3.754 0.746 0.765 1.168 Spec 16 2.635 3.152 2.235 0.580 1.466 1.996 0.698 5.744 0.561 0.407 0.650 Spec 17 2.821 0.741 0.955 2.890 0.172 1.578 1.048 7.528 0.179 0.391 0.571 Spec 18 3.593 0.966 1.162 0.871 1.020 0.991 1.491 5.239 0.754 0.327 0.392 Spec 19 2.946 2.007 2.037 0.853 0.703 1.499 0.974 6.074 0.652 1.272 0.529 Spec 20 2.683 2.904 1.099 1.260 0.886 1.526 0.819 5.429 0.562 0.833 0.681 Mean 2.955 1.935 1.210 1.160 0.919 1.763 1.253 4.930 0.743 0.653 0.772 SD 0.834 0.941 0.609 0.599 0.650 0.861 0.640 1.387 0.399 0.310 0.355 Minimum 1.492 0.434 0.432 0.470 0.108 0.389 0.236 2.407 0.179 0.327 0.228 Median 2.853 1.878 1.094 0.896 0.790 1.567 1.188 5.242 0.670 0.537 0.673 Maximum 4.962 3.468 2.425 2.890 2.645 4.232 2.572 7.528 1.805 1.453 1.590
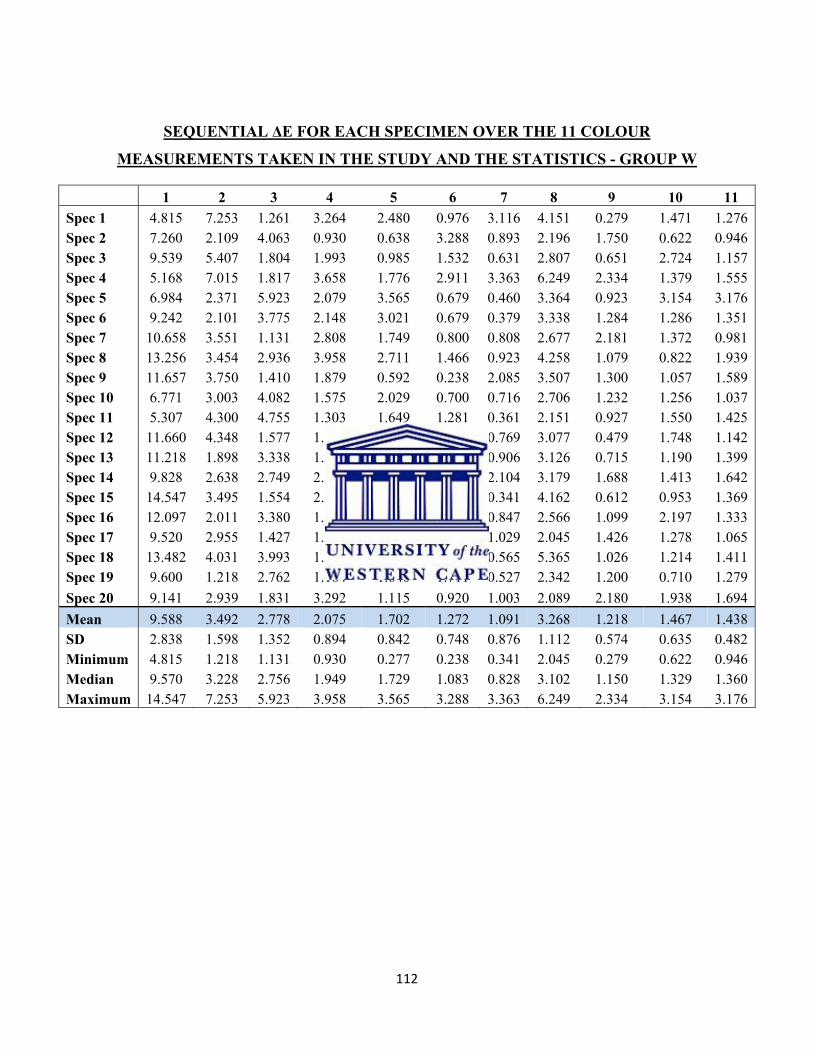
112
SEQUENTIAL ΔE FOR EACH SPECIMEN OVER THE 11 COLOUR
MEASUREMENTS TAKEN IN THE STUDY AND THE STATISTICS - GROUP W
1 2 3 4 5 6 7 8 9 10 11 Spec 1 4.815 7.253 1.261 3.264 2.480 0.976 3.116 4.151 0.279 1.471 1.276Spec 2 7.260 2.109 4.063 0.930 0.638 3.288 0.893 2.196 1.750 0.622 0.946Spec 3 9.539 5.407 1.804 1.993 0.985 1.532 0.631 2.807 0.651 2.724 1.157Spec 4 5.168 7.015 1.817 3.658 1.776 2.911 3.363 6.249 2.334 1.379 1.555Spec 5 6.984 2.371 5.923 2.079 3.565 0.679 0.460 3.364 0.923 3.154 3.176Spec 6 9.242 2.101 3.775 2.148 3.021 0.679 0.379 3.338 1.284 1.286 1.351Spec 7 10.658 3.551 1.131 2.808 1.749 0.800 0.808 2.677 2.181 1.372 0.981Spec 8 13.256 3.454 2.936 3.958 2.711 1.466 0.923 4.258 1.079 0.822 1.939Spec 9 11.657 3.750 1.410 1.879 0.592 0.238 2.085 3.507 1.300 1.057 1.589Spec 10 6.771 3.003 4.082 1.575 2.029 0.700 0.716 2.706 1.232 1.256 1.037Spec 11 5.307 4.300 4.755 1.303 1.649 1.281 0.361 2.151 0.927 1.550 1.425Spec 12 11.660 4.348 1.577 1.391 1.240 1.589 0.769 3.077 0.479 1.748 1.142Spec 13 11.218 1.898 3.338 1.215 1.891 0.909 0.906 3.126 0.715 1.190 1.399Spec 14 9.828 2.638 2.749 2.182 2.004 1.030 2.104 3.179 1.688 1.413 1.642Spec 15 14.547 3.495 1.554 2.252 0.846 1.320 0.341 4.162 0.612 0.953 1.369Spec 16 12.097 2.011 3.380 1.254 0.277 1.135 0.847 2.566 1.099 2.197 1.333Spec 17 9.520 2.955 1.427 1.905 2.113 0.552 1.029 2.045 1.426 1.278 1.065Spec 18 13.482 4.031 3.993 1.220 1.710 1.722 0.565 5.365 1.026 1.214 1.411Spec 19 9.600 1.218 2.762 1.184 1.640 1.711 0.527 2.342 1.200 0.710 1.279Spec 20 9.141 2.939 1.831 3.292 1.115 0.920 1.003 2.089 2.180 1.938 1.694Mean 9.588 3.492 2.778 2.075 1.702 1.272 1.091 3.268 1.218 1.467 1.438SD 2.838 1.598 1.352 0.894 0.842 0.748 0.876 1.112 0.574 0.635 0.482Minimum 4.815 1.218 1.131 0.930 0.277 0.238 0.341 2.045 0.279 0.622 0.946Median 9.570 3.228 2.756 1.949 1.729 1.083 0.828 3.102 1.150 1.329 1.360Maximum 14.547 7.253 5.923 3.958 3.565 3.288 3.363 6.249 2.334 3.154 3.176
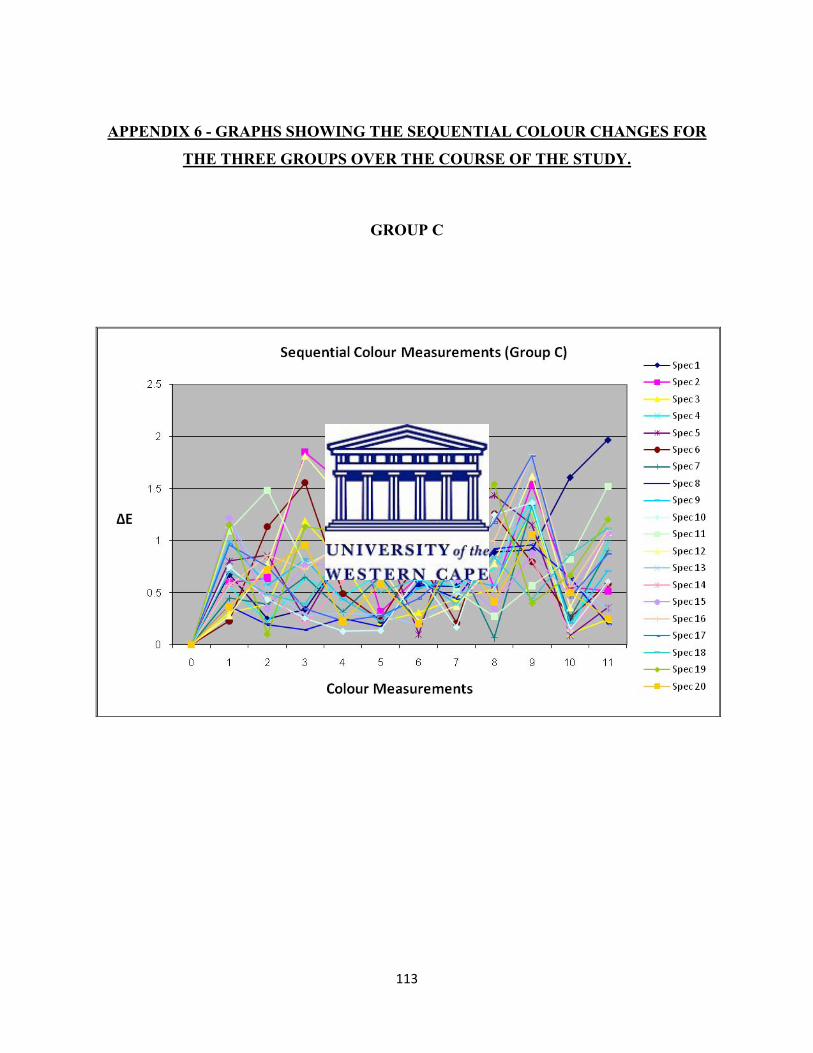
113
APPENDIX 6 - GRAPHS SHOWING THE SEQUENTIAL COLOUR CHANGES FOR
THE THREE GROUPS OVER THE COURSE OF THE STUDY.
GROUP C
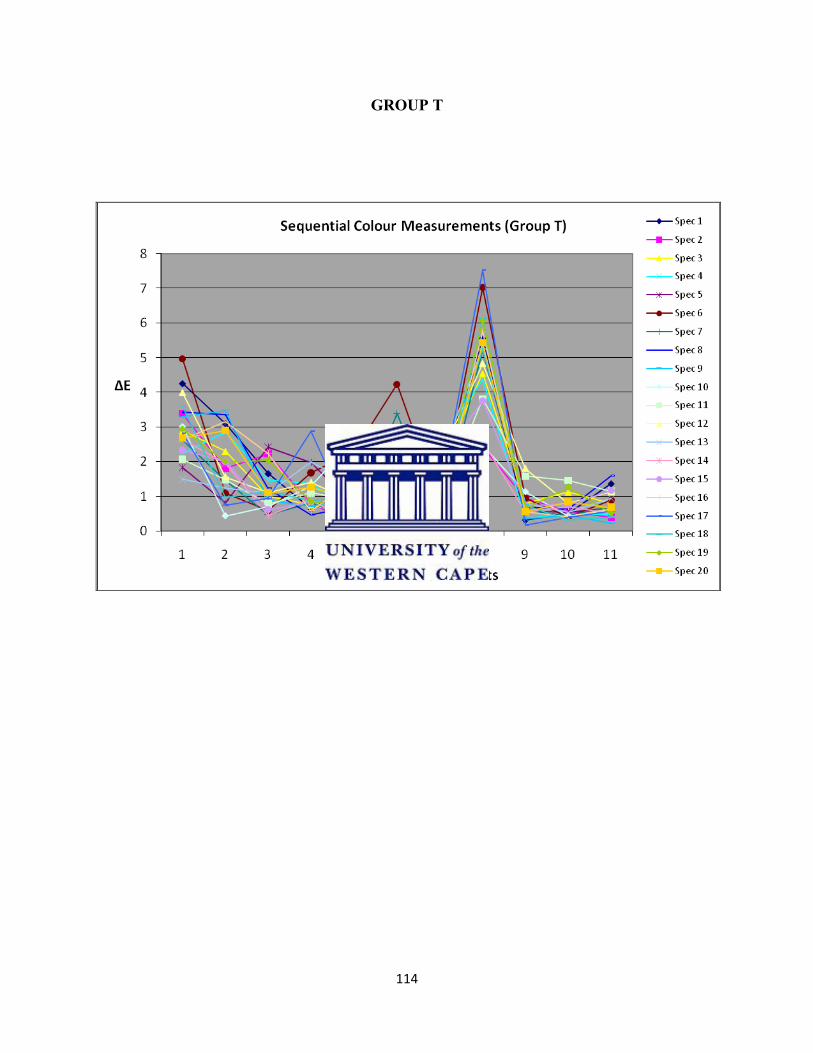
114
GROUP T
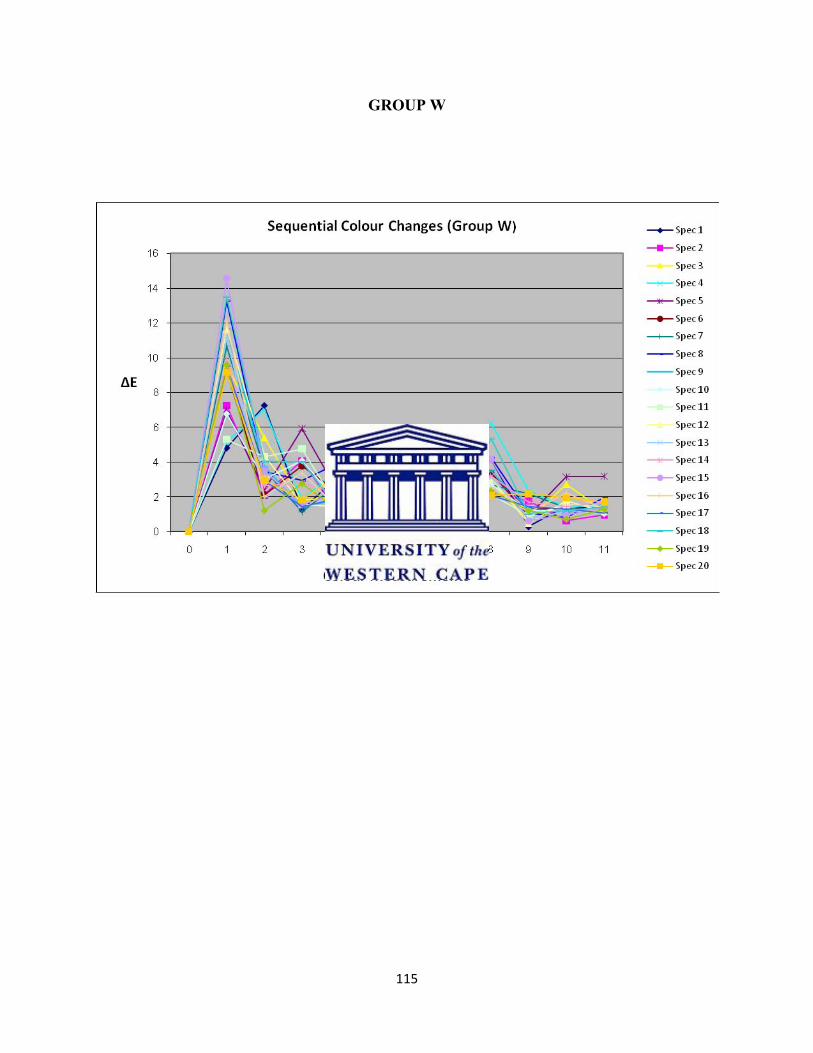
115
GROUP W