Embed Size (px)
Citation preview

Cell Metabolism, Volume 9
Supplemental Data
Fasting-Induced Hypothermia and Reduced Energy Production in Mice Lacking Acetyl-CoA Synthetase 2
Iori Sakakibara, Takahiro Fujino, Makoto Ishii, Toshiya Tanaka, Tatsuo Shimosawa, Shinji Miura, Wei Zhang, Yuka Tokutake, Joji Yamamoto, Mutsumi Awano, Satoshi Iwasaki, Toshiyuki Motoike, Masashi Okamura, Takeshi Inagaki, Kiyoshi Kita, Osamu Ezaki, Makoto Naito, Tomoyuki Kuwaki, Shigeru Chohnan, Tokuo Yamamoto, Robert E. Hammer, Tatsuhiko Kodama, Masashi Yanagisawa, and Juro Sakai
Supplemental Experimental Procedures
Assay Procedure for Malonyl-CoA : Acetyl-CoA Cycling
Mouse tissues were quickly (<1 min) removed and frozen in liquid nitrogen. Frozen
tissue was weighed, pulverized, transferred to 1 ml of ice-cold 0.3 M sulfuric acid,
sonicated for 10 min and centrifuged at 10,000 x g for 5 min at 4°C. Supernates were
carefully adjusted to pH 6.0 on ice. The reaction mixture for malonyl-CoA, which is
based on the methods of Takamura et al. (Cha et al., 2005; Hu et al., 2003; Takamura et
al., 1985), contained the appropriate amount of neutralized tissue extract, 50 mM
Tris_HCl (pH 7.2), 10 mM magnesium sulfate, 1 mM 2-mercaptoethanol, 2 mM
oxaloacetate, and 1 unit of citrate synthase (Sigma) in a total volume of 200 μl. After 20
min at 25°C, the reaction was terminated by placing the tube in an ice slush. The

‘‘cycling’’ reaction is then initiated by addition of 50 mM malonate, 10 mM ATP, and
1.0 unit of malonate decarboxylase (from Pseudomonas putida; Takamura et al.) and
incubated at 30°C for 20 min followed by the addition of 1.0 unit of acetate kinase
(EC2.7.2.1). After 20 min of incubation, 100 μl of 2.5 M neutralized hydroxylamine
were added and the incubation was continued for an additional 20 min at 25°C. The
reaction was terminated by addition of 0.3 ml of 10 mM ferric chloride dissolved in 25
mM trichloroacetic acid and 1 M HCl. The quantity of acetylhydroxamate formed was
measured at A540. For measurement of acetyl-CoA, acetyl-CoA, which is based on
the methods of Takamura et al. (Cha et al., 2005; Hu et al., 2003; Takamura et al., 1985),
contained the appropriate amount of neutralized tissue extract, 50 mM Tris_HCl (pH
7.2), 10 mM magnesium sulfate, and 1 mM 2-mercaptoethanol in a total volume of 200
μl. After 20 min at 25°C, the reaction was terminated by placing the tube in an ice slush
and incubated at 30°C for 20 min followed by the addition of 1.0 unit of acetate kinase
(EC2.7.2.1). After 20 min of incubation, 100 μl of 2.5 M neutralized hydroxylamine
were added and the incubation was continued for an additional 20 min at 25°C. The
reaction was terminated by addition of 0.3 ml of 10 mM ferric chloride dissolved in 25
mM trichloroacetic acid and 1 M HCl. The quantity of acetylhydroxamate formed was
measured at O.D. 540.

Assay Procedure for Acetyl-CoA
Mouse tissues were quickly (<1 min) removed and frozen in liquid nitrogen. Frozen
tissue was weighed, pulverized, transferred to 1 ml of ice-cold 0.3 M sulfuric acid,
sonicated for 10 min and centrifuged at 10,000 x g for 5 min at 4°C. Supernates were
carefully adjusted to pH 6.0 on ice. The reaction mixture for measurement of
acetyl-CoA, which is based on the methods of Takamura et al. (Cha et al., 2005; Hu et
al., 2003; Takamura et al., 1985), contained the appropriate amount of neutralized tissue
extract, 50 mM Tris-HCl (pH 7.2), 10 mM magnesium sulfate, and 1 mM
2-mercaptoethanol in a total volume of 200 μl. After 20 min at 25°C, the reaction was
terminated by placing the tube in an ice slush and incubated at 30°C for 20 min
followed by the addition of 1.0 unit of acetate kinase (EC2.7.2.1). After 20 min of
incubation, 100 μl of 2.5 M neutralized hydroxylamine were added and the incubation
was continued for an additional 20 min at 25°C. The reaction was terminated by
addition of 0.3 ml of 10 mM ferric chloride dissolved in 25 mM trichloroacetic acid and
1 M HCl. The quantity of acetylhydroxamate formed was measured at O.D. 540.
Acetyl-CoA Carboxylase Activity
Acetyl-CoA carboxylase activity was determined by the H14CO3- fixation assay
(Nakanishi and Numa, 1970). The H14CO3- fixation assay follows the rate of

acetyl-CoA-dependent H14CO3- incorporation into acid-stable material, i. e.
malonyl-CoA. Tissue extract was first preincubated at 37°C for 30min in a mixture
(final volume, 1.0 ml) containing 50 mM Tris-C1 pH 7.5, 10 mM potassium citrate, 10
mM MgCl, 3.75 mM GSH and 0.75 mg/ml bovine serum albumin. The reaction was
then initiated by adding an aliquot of the preincubated enzyme to an assay mixture (final
volume, 0.8 ml) containing 50 mM Tris-HC1 pH 7.5, 10 mM potassium citrate, 10 mM
MgCl,, 3.75 mM ATP, 0.125 mM acetyl-CoA, 3.75 mM GSH, 0.75 mg/ ml bovine
serum albumin and 12.5 mM KHI4CO3 (specific activity, 3.0 x 10⁵ counts x min-1 x
pmole-l). Following incubation at 37°C for 10 min, the reaction was terminated with
0.2 ml of 5 N HC1. After centrifugation, an aliquot of the supernatant fluid was taken to
dryness in a scintillation counting vial at 80°C for 45-60min. 0.5ml of water and 10ml
of scintillator solution were added, and 14C activity was determined with the use of a
liquid scintillation spectrometer.
NAD+ and NADH Measurements
NAD+ and NADH nucleotides concentration in skeletal muscle and BAT of 12 week old
male mice were directly measured by NAD+ /NADH Assay kit (Biochain Insitute, Inc.)
according to the manufacturer’s instructions. In brief, approximately 10 mg of frozen
tissue was homogenized in 100 μl of acid extraction buffer for NAD+ and 100 μl of

alkali extraction for NADH concentration measurement, respectively. After
neutralization, the concentration of nucleotides was measured at 565 nm by an alcohol
dehydrogenase cycling reaction. Values for both nucleotides were detected within the
linear range.
Measurement of Adenine Nucleotides Contents
The gastrocnemius muscle was homogenized from 12 week old male mice with 1.0 N
perchloric acid and centrifuged at 10,000 x g for 15 min. After neutralization of the
supernatant with calcium carbonate, adenine nucleotide concentrations were determined
by high performance liquid chromatography (Phenomenex Luna 5 μ NH2; mobile phase,
sodium phosphatase buffer; detector, 260 nm; Torrance, CA) as described previously
(Miura et al., 2006; Scott et al., 1992).
Body Composition Analysis
Mice were anesthesised with pentobarbital sodium, Nembutal (0.08 mg/g body weight;
Abbot Laboratories, Chicago, IL), and scanned with a Lunar PIXI mus2 densitometer
(Lunar Corp., Madison, WI), equipped for dual-energy X-ray absorptiometry (DEXA)
(Miura et al., 2006; Nagy and Clair, 2000).

Supplemental Reference
Cha, S.H., Hu, Z., Chohnan, S., and Lane, M.D. (2005). Inhibition of hypothalamic fatty acid synthase triggers rapid activation of fatty acid oxidation in skeletal muscle. Proc Natl Acad Sci U S A 102, 14557-14562. Hu, Z., Cha, S.H., Chohnan, S., and Lane, M.D. (2003). Hypothalamic malonyl-CoA as a mediator of feeding behavior. Proc Natl Acad Sci U S A 100, 12624-12629. Miura, S., Tomitsuka, E., Kamei, Y., Yamazaki, T., Kai, Y., Tamura, M., Kita, K., Nishino, I., and Ezaki, O. (2006). Overexpression of peroxisome proliferator-activated receptor gamma co-activator-1alpha leads to muscle atrophy with depletion of ATP. Am J Pathol 169, 1129-1139. Nagy, T.R., and Clair, A.L. (2000). Precision and accuracy of dual-energy X-ray absorptiometry for determining in vivo body composition of mice. Obes Res 8, 392-398. Nakanishi, S., and Numa, S. (1970). Purification of rat liver acetyl coenzyme A carboxylase and immunochemical studies on its synthesis and degradation. Eur J Biochem 16, 161-173. Scott, M.D., Baudendistel, L.J., and Dahms, T.E. (1992). Rapid separation of creatine, phosphocreatine and adenosine metabolites by ion-pair reversed-phase high-performance liquid chromatography in plasma and cardiac tissue. J Chromatogr 576, 149-154. Takamura, Y., Kitayama, Y., Arakawa, A., Yamanaka, S., Tosaki, M., and Ogawa, Y. (1985). Malonyl-CoA: acetyl-CoA cycling. A new micromethod for determination of acyl-CoAs with malonate decarboxylase. Biochim Biophys Acta 834, 1-7.
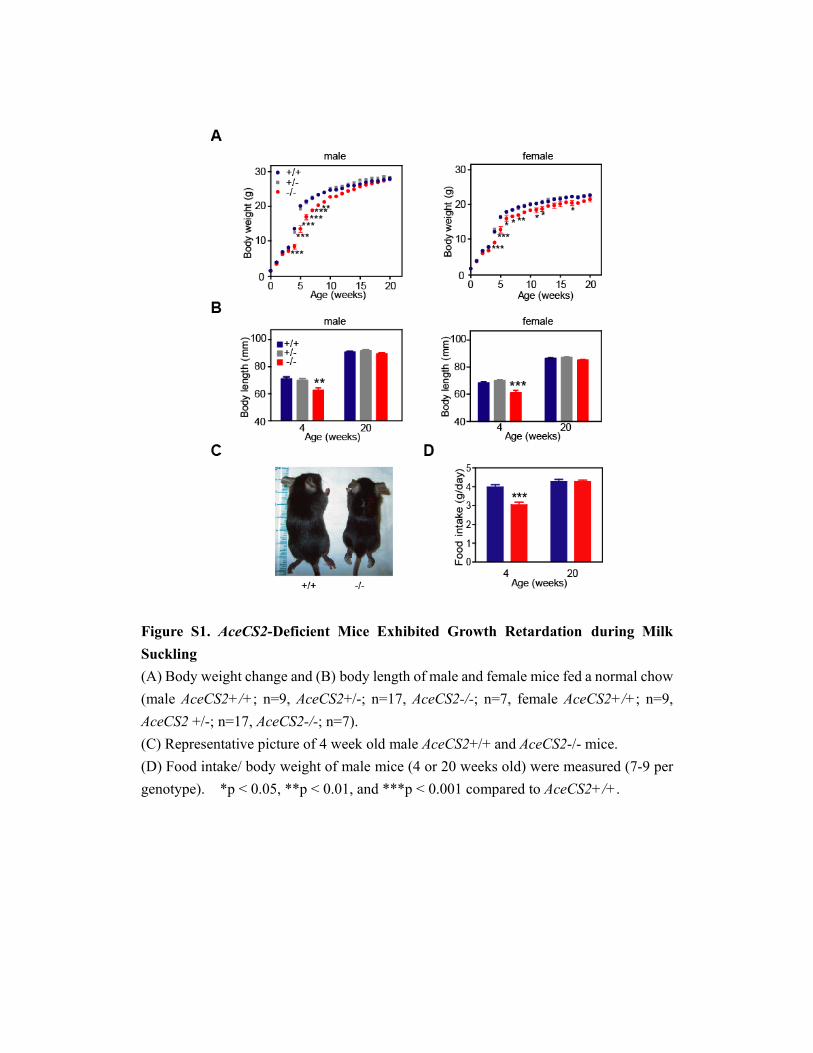
Figure S1. AceCS2-Deficient Mice Exhibited Growth Retardation during Milk Suckling (A) Body weight change and (B) body length of male and female mice fed a normal chow (male AceCS2+/+; n=9, AceCS2+/-; n=17, AceCS2-/-; n=7, female AceCS2+/+; n=9, AceCS2 +/-; n=17, AceCS2-/-; n=7). (C) Representative picture of 4 week old male AceCS2+/+ and AceCS2-/- mice. (D) Food intake/ body weight of male mice (4 or 20 weeks old) were measured (7-9 per genotype). *p < 0.05, **p < 0.01, and ***p < 0.001 compared to AceCS2+/+.
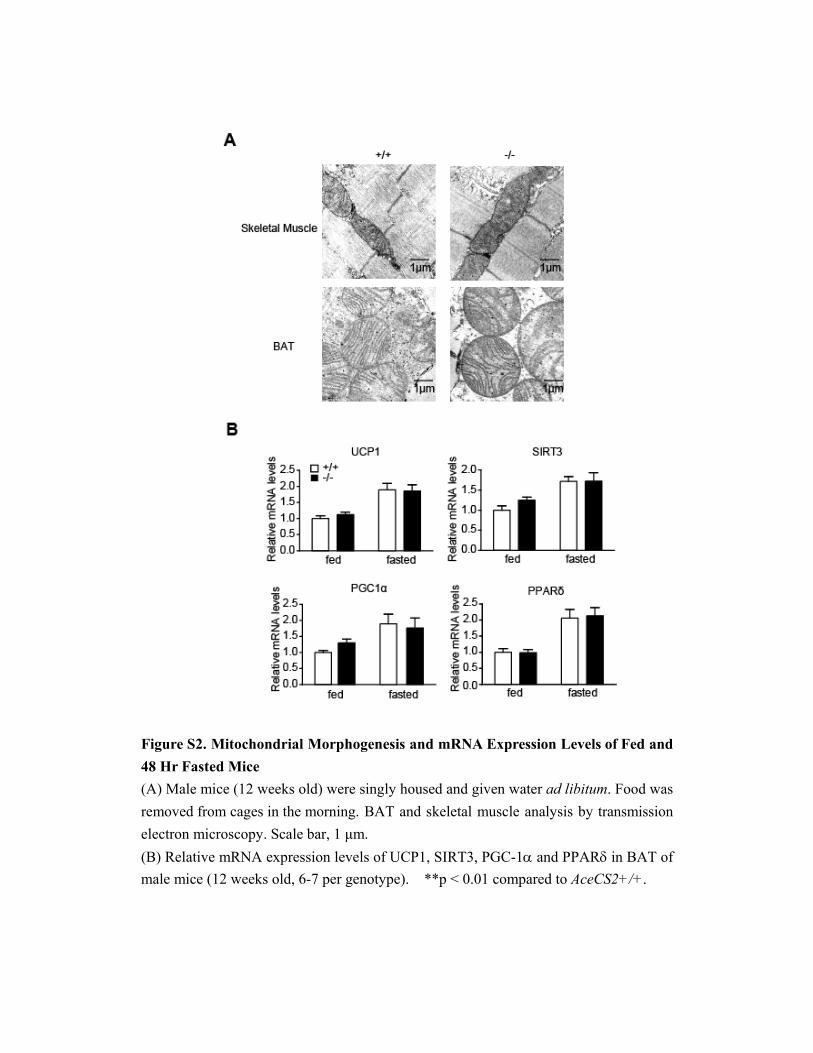
Figure S2. Mitochondrial Morphogenesis and mRNA Expression Levels of Fed and 48 Hr Fasted Mice (A) Male mice (12 weeks old) were singly housed and given water ad libitum. Food was removed from cages in the morning. BAT and skeletal muscle analysis by transmission electron microscopy. Scale bar, 1 μm. (B) Relative mRNA expression levels of UCP1, SIRT3, PGC-1α and PPARδ in BAT of male mice (12 weeks old, 6-7 per genotype). **p < 0.01 compared to AceCS2+/+.

Figure S3. Relative mRNA Expression Levels (A) and Restoration of Hypoglycemia by Pyruvate (B) in LC/HF Diet Fed Male Mice (A) Relative mRNA expression levels of glucose 6 phosphatase (G6Pase), phosphoenolpyruvate carboxykinase (PEPCK), and alanine aminotransferase 1 (ALT1) (liver), and branched chain aminotransferase 2 (BCAT2) (skeletal muscle) in LC/HF diet fed male mice (4 weeks old) and in 12 week old normal chow diet fed male mice, (6-7 per genotype). *p < 0.05 compared to AceCS2+/+. LC/HF, low carbohydrate high fat diet, NC, normal chow diet. (B) LC/HF diet fed male mice (4 weeks old) were received an i.p. injection of 500 mg/kg sodium pyruvate (WAKO) dissolved in water. Blood glucose levels were determined ***p < 0.05 compared to AceCS2+/+. (AceCS2-/-; n=5, AceCS2-/-; n=4).

Figure S4. Comparison of Plasma Parameter, Body Temperature, and Body Weight of AceCS2-/- Mice that Survived or Died while Fed an LC/HF Diet (A-E) Male mice (4 weeks old) were fed a ketogenic diet. (A) Core rectal temperature. (B) Blood glucose level. (C) Plasma NEFA level. (D) Plasma ketone body level. (E) Body weight. (AceCS2-/- dead; n=4, AceCS2-/- survived; n=3).

Figure S5. Malonyl-CoA Levels and ACC Activity of AceCS2-/- Mice Fed an LC/HF Diet AceCS2-/- and AceCS2+/+ mice (male, 26 week old) were fed a LC/HF diet. Malonyl-CoA levels and ACC activity of liver, BAT and SM were determined (AceCS2+/+; n=8, AceCS2-/-; n=8). ***p < 0.001 compared to AceCS2+/+. SM, skeletal muscle.

Figure S6. Oxygen Consumption of AceCS2-/- Mice Fed an LC/HF Diet Not Corrected for Body Weight Oxygen consumption (VO2, left panel), and average of VO2 (right panel) were determined in male mice (26 weeks old) fed a LC/HF diet by indirect calorimetry (AceCS2+/+; n=8, AceCS2-/-; n=7). The data was not corrected for body weight.

Table S1. Metabolic Parameters of AceCS2+/+ and AceCS2-/- Mice at 2 Weeks Old
and 26 Weeks Old
2-4 weeks old 26 weeks old
+/+ -/- +/+ -/-
Glucose (mg/dL) 125 ± 14 110 ± 12 261 ± 14 249 ± 10
Cholesterol (mg/dL) 70 ± 4 71 ± 2 45 ± 3 32 ± 1 *
Triglycerides (mg/dL) 75 ± 7 81 ± 11 75 ± 6 77 ± 4
NEFA (μEql/L) 387 ± 37 403 ± 41 354 ± 40 319 ± 58
Ketone body (mΜ) 0.489 ± 0.058 0.521 ± 0.052 0.205 ± 0.038 0.281 ± 0.062
Insulin (ng/mL) 0.36 ± 0.15 0.46 ± 0.14 2.30 ± 0.26 2.57 ± 0.96
Leptin (pg/mL)
Growth hormone (ng/ml)
IGF-1 (ng/ml)
Acetate (mM)
187 ± 25
1.40 ± 0.32
392 ± 60
0.09 ± 0.04
100 ± 12 *
1.37 ± 0.35
352 ± 41
2.20 ± 0.31
161 ± 29
NE
NE
NE
172 ± 56
NE
NE
NE
Male mice (26 weeks old, 7-9 per genotype) were fed a normal diet. Male mice (2-4
weeks old, n =7-9 per genotype) were fed milk from their mother. Assays of blood
samples were performed on isolated plasma. * p<0.05 compared to AceCS2+/+ mice.
NE, not examined.

Table S2. Body Composition, Food Intake, Weights, and Metabolic Parameters of
AceCS2-/- Mice at 12 Weeks Age
Fed Fasted Parameter
+/+ -/- +/+ -/-
Body Weight (g) 27.2 ± 1.2 25.3 ± 1.8* 20.8 ± 0.9 18.6 ± 1.5**
Lean Body Mass (g) 20.8 ± 2.0 17.1 ± 1.4* NE NE
Fat content (%) 14.3 ± 1.3 15.5 ± 2.2 NE NE
Epididymal fat (g) NE NE 0.052 ± 0.033 0.033 ± 0.02
BMD (mg/cm2) 45.6 ± 2.6 42.1 ± 2.2** NE NE
Food intake (g/day) 3.4 ± 0.8 2.8 ± 0.3 0 0
Glucose (mg/dL) 174 ± 15 185 ± 26 120 ± 22.9 113 ± 18
Cholesterol (mg/dL) 48.9 ± 7.71 47.2 ± 9.42 31.6 ± 7.57 33.3 ± 11.9
Triglycerides (mg/dL) 0.717 ± 0.20 0.662 ± 0.19 1.08 ± 0.29 0.979 ± 0.27
NEFA (mEql/L) 0.717 ± 0.20 0.662 ± 0.19 1.08 ± 0.29 0.979 ± 0.27
Ketone body (mM) 0.210 ± 0.064 0.255 ± 0.14* 2.54 ± 0.831 2.08 ± 1.22
Insulin (ng/mL) 1.19 ± 0.97 1.08 ± 0.57 0.29 ± 0.14 0.132 ± 0.03*
Leptin (pg/mL) 248 ± 94 234 ± 23.2 42.9 ± 27.7 20.6 ± 30.0

Tissue acetate (mmol/mg protein)
Liver
SM
BAT
4.73 ± 0.52
3.29 ± 0.60
3.53 ± 0.37
9.01 ± 1.12**
6.84 ± 0.67***
9.18 ± 0.63***
5.24 ± 0.38
3.48 ± 0.40
3.71 ± 0.12
10.42 ± 3.05*
8.91 ± 2.24*
11.38 ± 3.16*
Male mice (12 weeks old, AceCS2+/+; n = 18, AceCS2-/-; n= 14) were fed on normal
chow diet. To analyze the metabolic parameters of fed and fasted mice, mice were
divided into two groups: Fed and Fasted. The fed group was fed ad libitum and the
fasted group was fasted 48 hr. AceCS2-/- mice weighed less (body weight and lean
body mass) than AceCS2+/+ mice when measured at 12 weeks of age. Fat content per
body weight of AceCS2-/- and AceCS2+/+ mice did not differ significantly. Food
intake and blood analysis of these mice fed or fasted are shown. Asterisks denote the
level of statistical significance between the AceCS2+/+ and AceCS2-/- groups (Student’s
t test). * p<0.05, ** p<0.01 compared to AceCS2+/+ mice. NE, not examined.
BMD, bone mineral density. SM, skeletal muscle.

Table S3. Constituents of the LC/HF Diet (TD96355, Harlan Teklad)
Component g/kg
Casein
DL-methionine
Shortning (Crisco)
Corn Oil
Cellulose
Vitamin mix (Teklad 40060)
Choline bitartrate
TBHQ (antioxidant)
Mineral mix, Ca-P Deficient (TD79055)
Calcium phosphate, dibasic
Calcium carbonate
Magnesium oxide
173.3
2.6
586.4
86.2
87.97
13.0
2.5
0.13
20.0
19.3
8.2
0.4


![Siyam (Fasting) [Arabic]](https://img.pdfslide.tips/doc/110x75/577cd8f51a28ab9e78a259a8/siyam-fasting-arabic.jpg)