Embed Size (px)
Citation preview
Copyright Heiwa Corporation 2015
Supplementary Material
Fiscal Year Ended March 31, 2015
Heiwa Corporation
May 15, 2015
Copyright Heiwa Corporation 2015
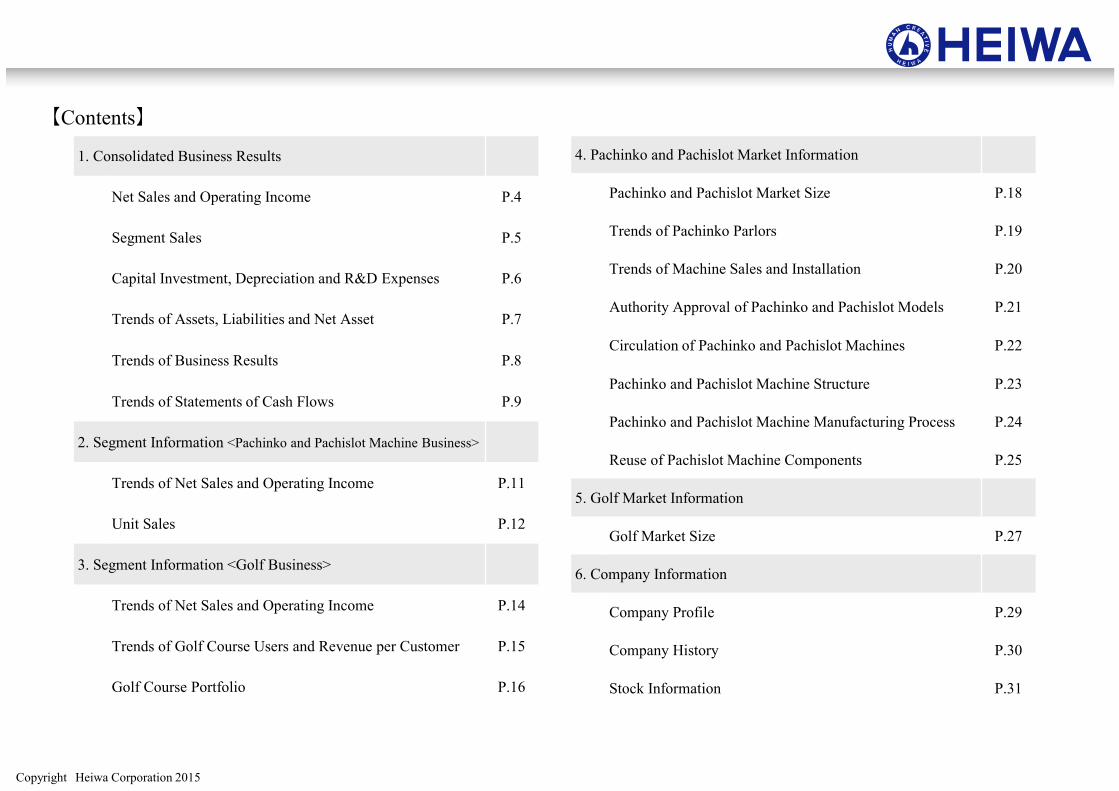
1. Consolidated Business Results
Net Sales and Operating Income P.4
Segment Sales P.5
Capital Investment, Depreciation and R&D Expenses P.6
Trends of Assets, Liabilities and Net Asset P.7
Trends of Business Results P.8
Trends of Statements of Cash Flows P.9
2. Segment Information <Pachinko and Pachislot Machine Business>
Trends of Net Sales and Operating Income P.11
Unit Sales P.12
3. Segment Information <Golf Business>
Trends of Net Sales and Operating Income P.14
Trends of Golf Course Users and Revenue per Customer P.15
Golf Course Portfolio P.16
4. Pachinko and Pachislot Market Information
Pachinko and Pachislot Market Size P.18
Trends of Pachinko Parlors P.19
Trends of Machine Sales and Installation P.20
Authority Approval of Pachinko and Pachislot Models P.21
Circulation of Pachinko and Pachislot Machines P.22
Pachinko and Pachislot Machine Structure P.23
Pachinko and Pachislot Machine Manufacturing Process P.24
Reuse of Pachislot Machine Components P.25
5. Golf Market Information
Golf Market Size P.27
6. Company Information
Company Profile P.29
Company History P.30
Stock Information P.31
【Contents】
Copyright Heiwa Corporation 2015 3
1. Consolidated Business Results
Copyright Heiwa Corporation 2015
Net Sales and Operating Income
4
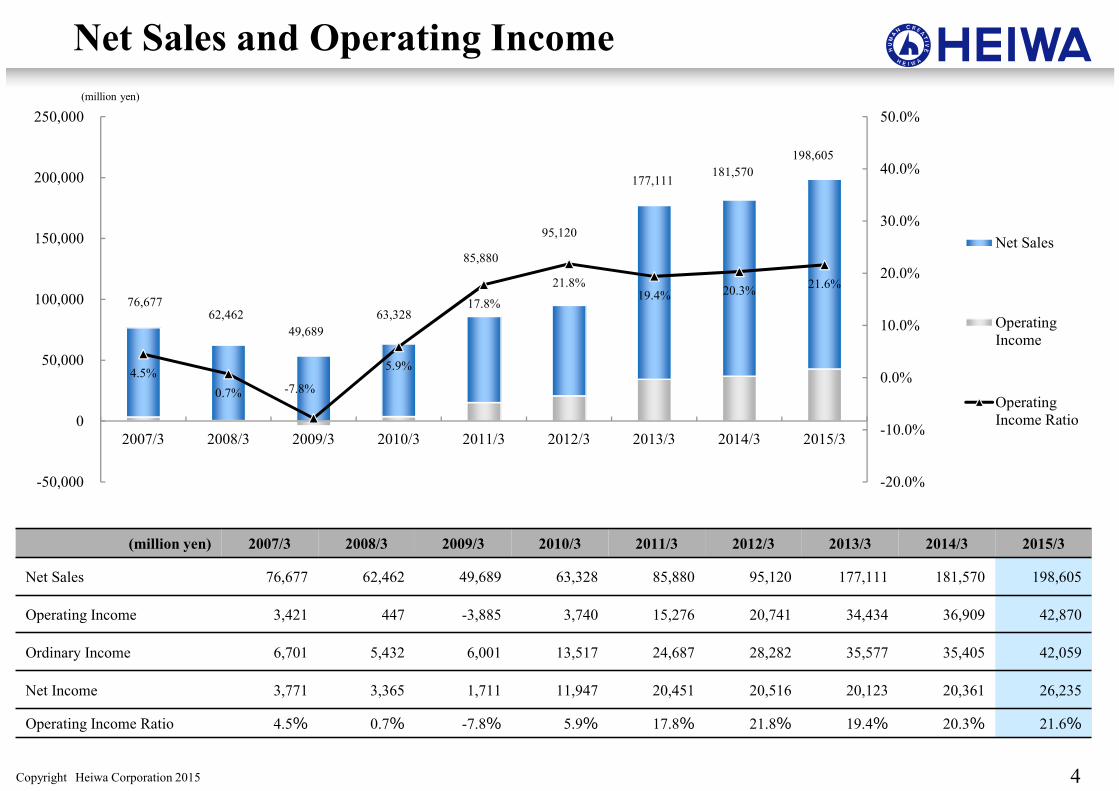
(million yen) 2007/3 2008/3 2009/3 2010/3 2011/3 2012/3 2013/3 2014/3 2015/3
Net Sales 76,677 62,462 49,689 63,328 85,880 95,120 177,111 181,570 198,605
Operating Income 3,421 447 -3,885 3,740 15,276 20,741 34,434 36,909 42,870
Ordinary Income 6,701 5,432 6,001 13,517 24,687 28,282 35,577 35,405 42,059
Net Income 3,771 3,365 1,711 11,947 20,451 20,516 20,123 20,361 26,235
Operating Income Ratio 4.5% 0.7% -7.8% 5.9% 17.8% 21.8% 19.4% 20.3% 21.6%
(million yen)
4.5%
0.7% -7.8%
5.9%
17.8%
21.8%19.4% 20.3%
21.6%
-20.0%
-10.0%
0.0%
10.0%
20.0%
30.0%
40.0%
50.0%
-50,000
0
50,000
100,000
150,000
200,000
250,000
2007/3 2008/3 2009/3 2010/3 2011/3 2012/3 2013/3 2014/3 2015/3
Net Sales
Operating
Income
Operating
Income Ratio
76,67762,462
49,689
63,328
85,880
95,120
177,111181,570
198,605
Copyright Heiwa Corporation 2015
Segment Sales
5
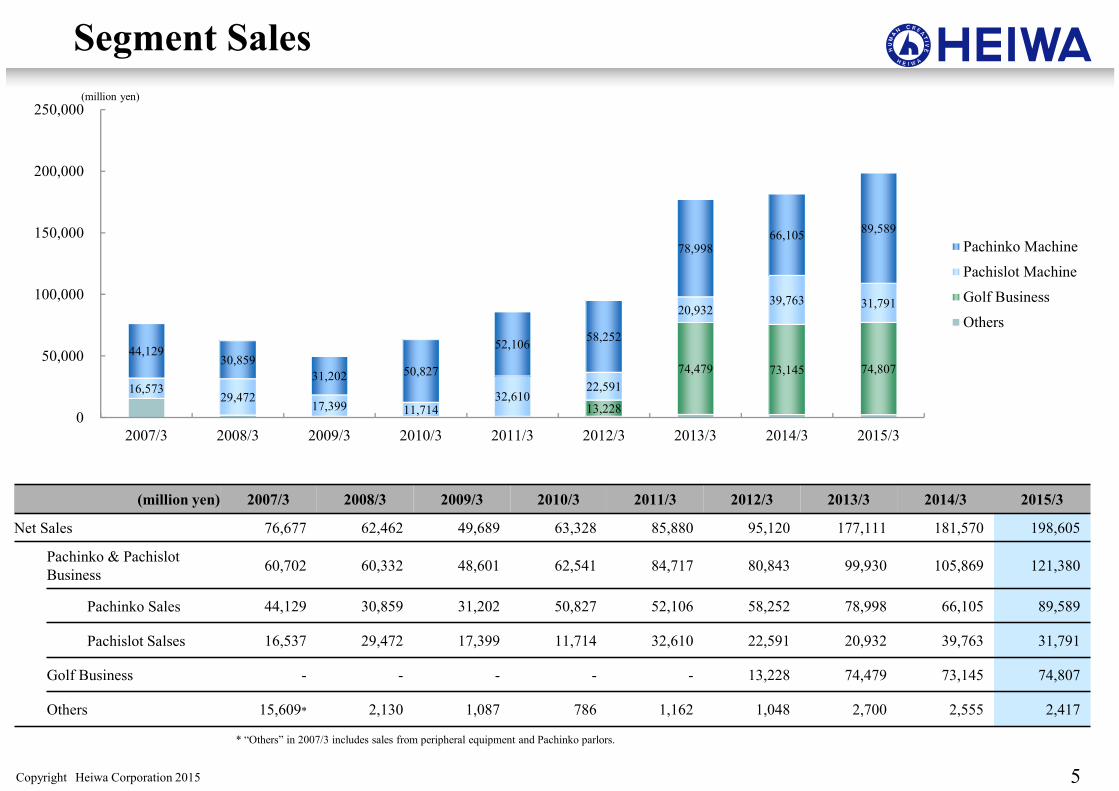
(million yen) 2007/3 2008/3 2009/3 2010/3 2011/3 2012/3 2013/3 2014/3 2015/3
Net Sales 76,677 62,462 49,689 63,328 85,880 95,120 177,111 181,570 198,605
Pachinko & Pachislot
Business60,702 60,332 48,601 62,541 84,717 80,843 99,930 105,869 121,380
Pachinko Sales 44,129 30,859 31,202 50,827 52,106 58,252 78,998 66,105 89,589
Pachislot Salses 16,537 29,472 17,399 11,714 32,610 22,591 20,932 39,763 31,791
Golf Business - - - - - 13,228 74,479 73,145 74,807
Others 15,609* 2,130 1,087 786 1,162 1,048 2,700 2,555 2,417
* “Others” in 2007/3 includes sales from peripheral equipment and Pachinko parlors.
13,228
74,479 73,145 74,807
16,573 29,472
17,399 11,714 32,610
22,591
20,932 39,763 31,791
44,129 30,859
31,202 50,827
52,106 58,252
78,998 66,105
89,589
0
50,000
100,000
150,000
200,000
250,000
2007/3 2008/3 2009/3 2010/3 2011/3 2012/3 2013/3 2014/3 2015/3
Pachinko Machine
Pachislot Machine
Golf Business
Others
(million yen)
Copyright Heiwa Corporation 2015
Capital Investment, Depreciation and R&D Expenses
6
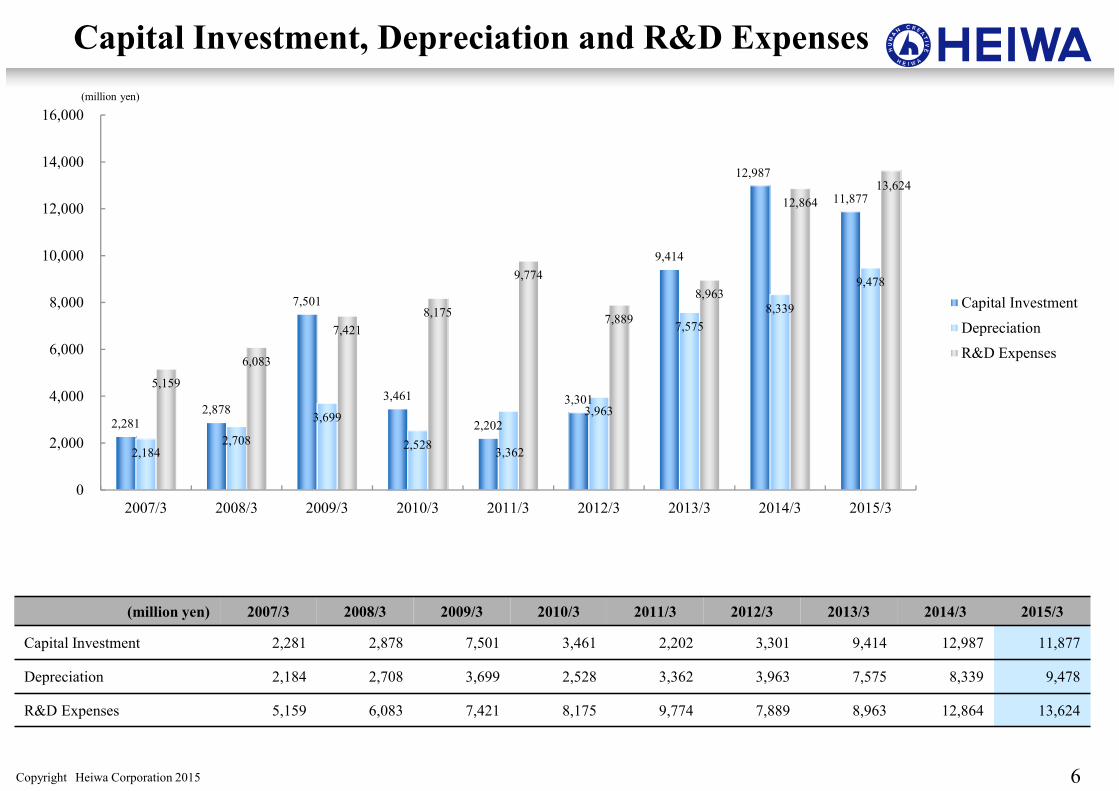
(million yen) 2007/3 2008/3 2009/3 2010/3 2011/3 2012/3 2013/3 2014/3 2015/3
Capital Investment 2,281 2,878 7,501 3,461 2,202 3,301 9,414 12,987 11,877
Depreciation 2,184 2,708 3,699 2,528 3,362 3,963 7,575 8,339 9,478
R&D Expenses 5,159 6,083 7,421 8,175 9,774 7,889 8,963 12,864 13,624
2,281 2,878
7,501
3,461
2,202
3,301
9,414
12,987
11,877
2,184 2,708
3,699
2,528 3,362
3,963
7,575
8,339
9,478
5,159
6,083
7,421
8,175
9,774
7,889
8,963
12,864
13,624
0
2,000
4,000
6,000
8,000
10,000
12,000
14,000
16,000
2007/3 2008/3 2009/3 2010/3 2011/3 2012/3 2013/3 2014/3 2015/3
Capital Investment
Depreciation
R&D Expenses
(million yen)

Copyright Heiwa Corporation 2015
Trends of Assets, Liabilities and Net Assets
7
(million yen) 2009/3 2010/3 2011/3 2012/3 2013/3 2014/3 2015/3
Total Current Assets 76,034 92,301 88,439 126,560 137,985 148,086 162,023
Cash and deposits 38,911 36,971 24,541 37,756 74,549 96,425 109,628
Short-term investment
securities4,383 22,432 39,436 45,736 21,003 8,625 12,631
Merchandises and
finished goods212 407 536 5,596 3,469 1,678 2,212
Raw materials and
supplies11,304 10,966 5,054 7,451 4,673 6,656 5,511
Property, Plant and
Equipment31,086 31,622 30,079 245,155 247,300 260,386 261,603
Intangible Assets 163 108 85 3,854 4,253 5,062 5,062
Investments and Other
Assets33,186 32,717 30,178 31,305 27,517 24,972 19,144
Total Noncurrent Assets 64,435 64,449 60,343 280,315 279,071 290,420 285,810
Total Assets 140,470 156,750 148,783 406,875 417,057 438,506 447,833
Total Current Liabilities 10,507 27,621 34,918 72,062 69,227 69,216 68,299
Short-term loans payable - - - - 3,000 - -
Current portion of long-
term loans payable513 443 6,518 21,504 18,635 21,690 16,876
Current portion of bonds - - - - 7,984 - -
Total Noncurrent Liabilities 41,711 60,424 17,146 209,987 206,647 212,787 201,264
Bonds payable - - - 7,984 - 8,000 8,000
Long-term loans payable 8,085 7,641 1,122 134,818 142,611 138,815 131,337
Negative goodwill 30,107 21,505 12,903 4,301 - - -
Deposits received from
members- - - 39,262 37,739 36,173 34,352
Total Liabilities 52,218 60,424 52,065 282,049 275,875 282,003 269,564
Total Net Assets 88,251 96,326 96,717 124,826 141,182 156,502 178,269
Total Liabilities and Net Assets 140,470 156,750 148,783 406,875 417,057 438,506 447,833
Copyright Heiwa Corporation 2015
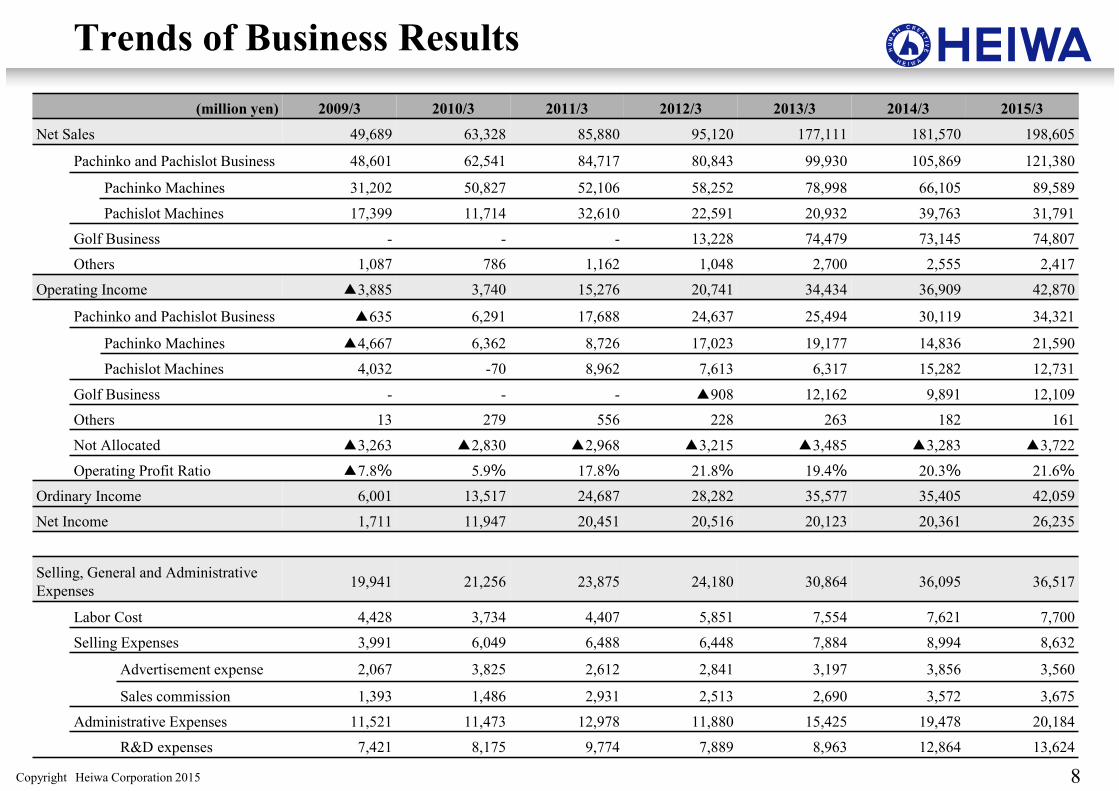
Trends of Business Results
8
(million yen) 2009/3 2010/3 2011/3 2012/3 2013/3 2014/3 2015/3
Net Sales 49,689 63,328 85,880 95,120 177,111 181,570 198,605
Pachinko and Pachislot Business 48,601 62,541 84,717 80,843 99,930 105,869 121,380
Pachinko Machines 31,202 50,827 52,106 58,252 78,998 66,105 89,589
Pachislot Machines 17,399 11,714 32,610 22,591 20,932 39,763 31,791
Golf Business - - - 13,228 74,479 73,145 74,807
Others 1,087 786 1,162 1,048 2,700 2,555 2,417
Operating Income ▲3,885 3,740 15,276 20,741 34,434 36,909 42,870
Pachinko and Pachislot Business ▲635 6,291 17,688 24,637 25,494 30,119 34,321
Pachinko Machines ▲4,667 6,362 8,726 17,023 19,177 14,836 21,590
Pachislot Machines 4,032 -70 8,962 7,613 6,317 15,282 12,731
Golf Business - - - ▲908 12,162 9,891 12,109
Others 13 279 556 228 263 182 161
Not Allocated ▲3,263 ▲2,830 ▲2,968 ▲3,215 ▲3,485 ▲3,283 ▲3,722
Operating Profit Ratio ▲7.8% 5.9% 17.8% 21.8% 19.4% 20.3% 21.6%Ordinary Income 6,001 13,517 24,687 28,282 35,577 35,405 42,059
Net Income 1,711 11,947 20,451 20,516 20,123 20,361 26,235
Selling, General and Administrative
Expenses19,941 21,256 23,875 24,180 30,864 36,095 36,517
Labor Cost 4,428 3,734 4,407 5,851 7,554 7,621 7,700
Selling Expenses 3,991 6,049 6,488 6,448 7,884 8,994 8,632
Advertisement expense 2,067 3,825 2,612 2,841 3,197 3,856 3,560
Sales commission 1,393 1,486 2,931 2,513 2,690 3,572 3,675
Administrative Expenses 11,521 11,473 12,978 11,880 15,425 19,478 20,184
R&D expenses 7,421 8,175 9,774 7,889 8,963 12,864 13,624
Copyright Heiwa Corporation 2015
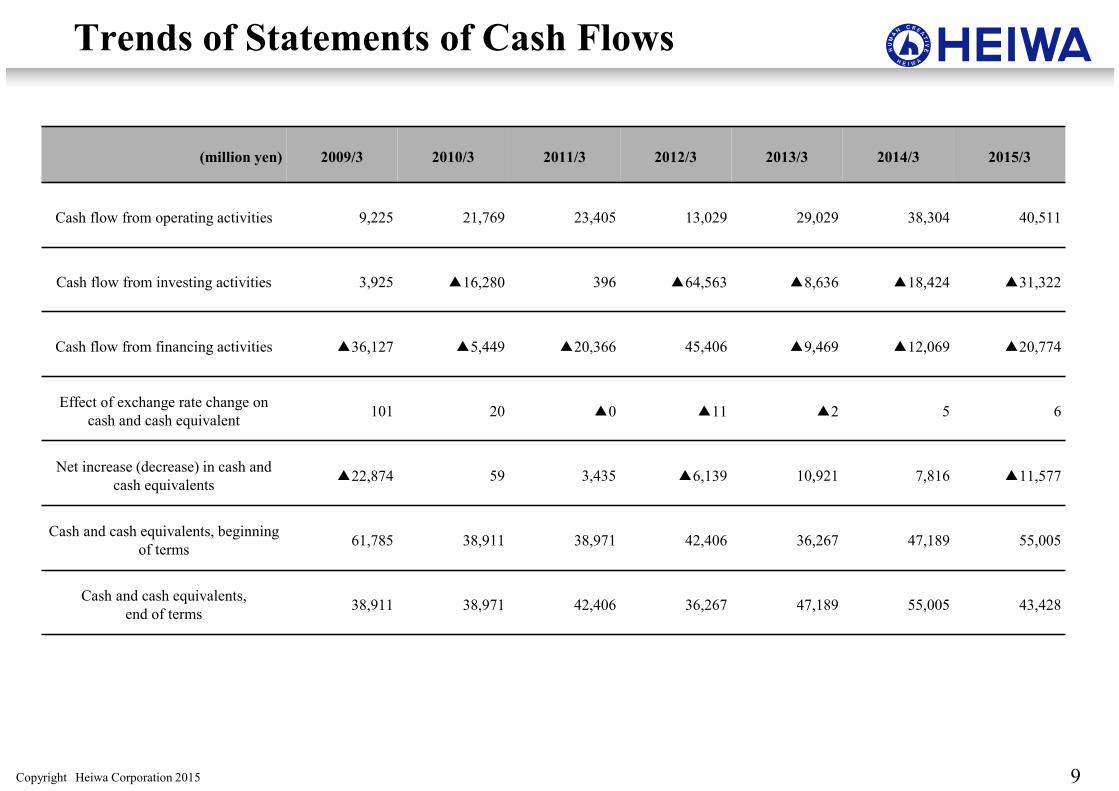
Trends of Statements of Cash Flows
9
(million yen) 2009/3 2010/3 2011/3 2012/3 2013/3 2014/3 2015/3
Cash flow from operating activities 9,225 21,769 23,405 13,029 29,029 38,304 40,511
Cash flow from investing activities 3,925 ▲16,280 396 ▲64,563 ▲8,636 ▲18,424 ▲31,322
Cash flow from financing activities ▲36,127 ▲5,449 ▲20,366 45,406 ▲9,469 ▲12,069 ▲20,774
Effect of exchange rate change on
cash and cash equivalent101 20 ▲0 ▲11 ▲2 5 6
Net increase (decrease) in cash and
cash equivalents▲22,874 59 3,435 ▲6,139 10,921 7,816 ▲11,577
Cash and cash equivalents, beginning
of terms61,785 38,911 38,971 42,406 36,267 47,189 55,005
Cash and cash equivalents,
end of terms38,911 38,971 42,406 36,267 47,189 55,005 43,428
Copyright Heiwa Corporation 2015 10
2. Segment Information
< Pachinko and Pachislot Machine Business >
Copyright Heiwa Corporation 2015
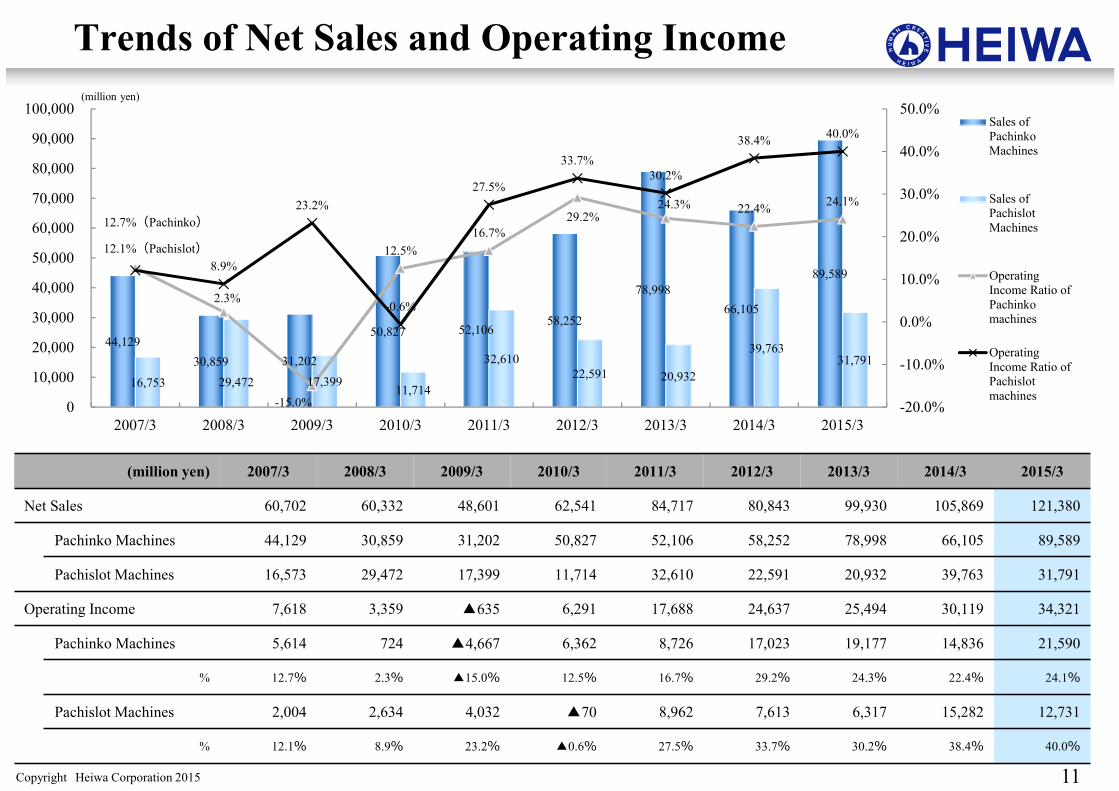
Trends of Net Sales and Operating Income
11
(million yen) 2007/3 2008/3 2009/3 2010/3 2011/3 2012/3 2013/3 2014/3 2015/3
Net Sales 60,702 60,332 48,601 62,541 84,717 80,843 99,930 105,869 121,380
Pachinko Machines 44,129 30,859 31,202 50,827 52,106 58,252 78,998 66,105 89,589
Pachislot Machines 16,573 29,472 17,399 11,714 32,610 22,591 20,932 39,763 31,791
Operating Income 7,618 3,359 ▲635 6,291 17,688 24,637 25,494 30,119 34,321
Pachinko Machines 5,614 724 ▲4,667 6,362 8,726 17,023 19,177 14,836 21,590
% 12.7% 2.3% ▲15.0% 12.5% 16.7% 29.2% 24.3% 22.4% 24.1%
Pachislot Machines 2,004 2,634 4,032 ▲70 8,962 7,613 6,317 15,282 12,731
% 12.1% 8.9% 23.2% ▲0.6% 27.5% 33.7% 30.2% 38.4% 40.0%
44,129
30,859 31,202
50,827 52,106 58,252
78,998
66,105
89,589
16,753 29,472 17,399 11,714
32,610
22,591 20,932
39,763 31,791
12.7%(Pachinko)
2.3%
-15.0%
12.5%
16.7%
29.2%24.3% 22.4%
24.1%
12.1%(Pachislot)8.9%
23.2%
-0.6%
27.5%
33.7%
30.2%
38.4%40.0%
-20.0%
-10.0%
0.0%
10.0%
20.0%
30.0%
40.0%
50.0%
0
10,000
20,000
30,000
40,000
50,000
60,000
70,000
80,000
90,000
100,000
2007/3 2008/3 2009/3 2010/3 2011/3 2012/3 2013/3 2014/3 2015/3
Sales of
Pachinko
Machines
Sales of
Pachislot
Machines
Operating
Income Ratio of
Pachinko
machines
Operating
Income Ratio of
Pachislot
machines
(million yen)
Copyright Heiwa Corporation 2015
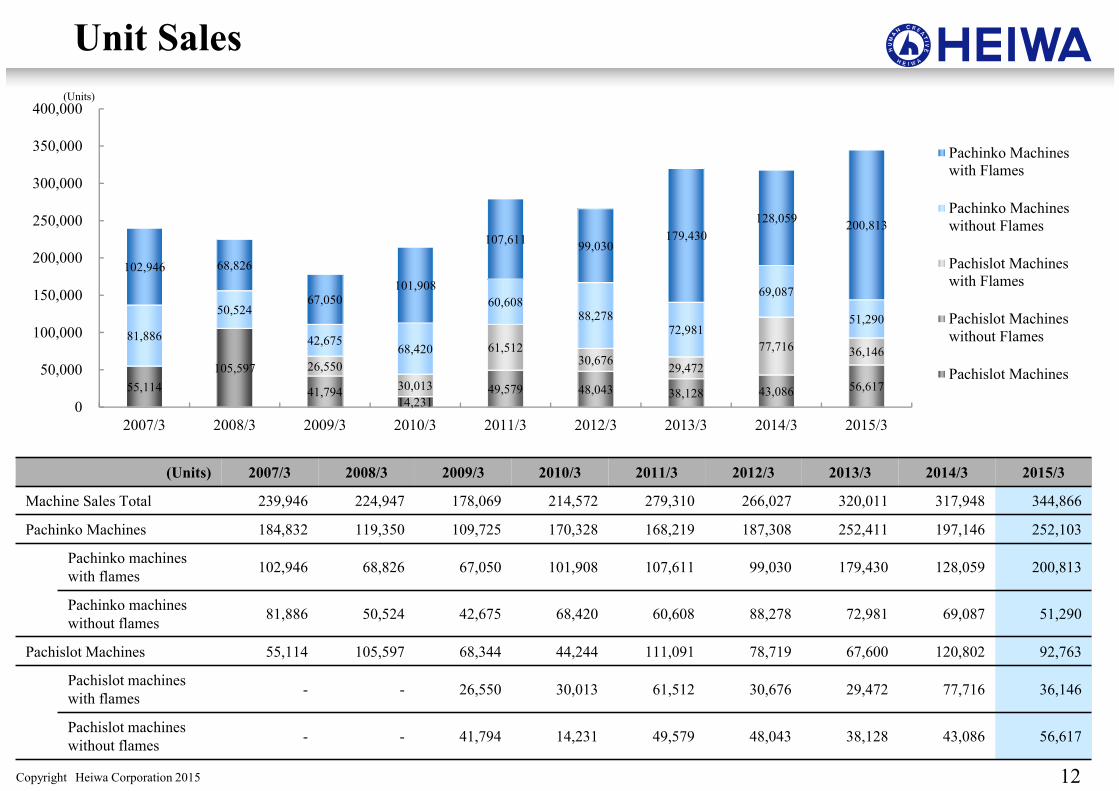
Unit Sales
12
(Units) 2007/3 2008/3 2009/3 2010/3 2011/3 2012/3 2013/3 2014/3 2015/3
Machine Sales Total 239,946 224,947 178,069 214,572 279,310 266,027 320,011 317,948 344,866
Pachinko Machines 184,832 119,350 109,725 170,328 168,219 187,308 252,411 197,146 252,103
Pachinko machines
with flames102,946 68,826 67,050 101,908 107,611 99,030 179,430 128,059 200,813
Pachinko machines
without flames81,886 50,524 42,675 68,420 60,608 88,278 72,981 69,087 51,290
Pachislot Machines 55,114 105,597 68,344 44,244 111,091 78,719 67,600 120,802 92,763
Pachislot machines
with flames- - 26,550 30,013 61,512 30,676 29,472 77,716 36,146
Pachislot machines
without flames- - 41,794 14,231 49,579 48,043 38,128 43,086 56,617
(Units)
55,114
105,597
41,794 14,231
49,579 48,043 38,128 43,086 56,617
26,550
30,013
61,512 30,676
29,472
77,716 36,146
81,886
50,524
42,675 68,420
60,608 88,278
72,981
69,087
51,290
102,946 68,826
67,050 101,908
107,611 99,030
179,430
128,059 200,813
0
50,000
100,000
150,000
200,000
250,000
300,000
350,000
400,000
2007/3 2008/3 2009/3 2010/3 2011/3 2012/3 2013/3 2014/3 2015/3
Pachinko Machines
with Flames
Pachinko Machines
without Flames
Pachislot Machines
with Flames
Pachislot Machines
without Flames
Pachislot Machines
Copyright Heiwa Corporation 2015 13
3. Segment Information
< Golf Business >
Copyright Heiwa Corporation 2015
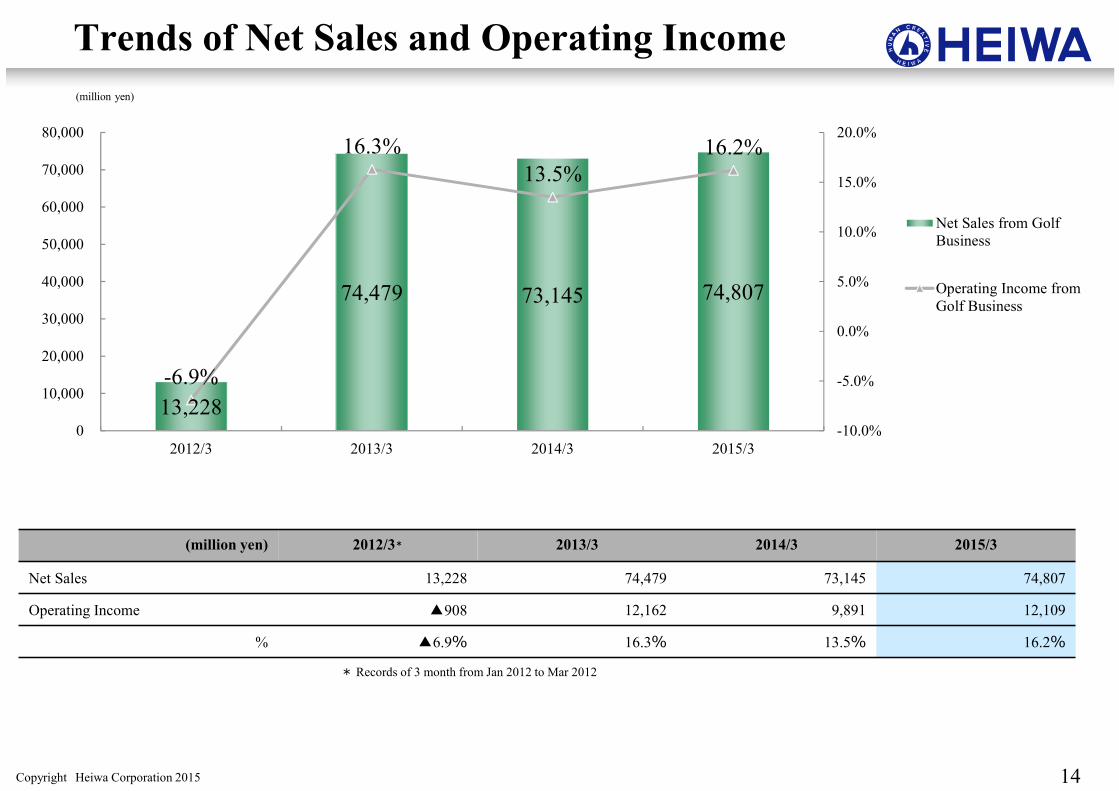
Trends of Net Sales and Operating Income
14
(million yen) 2012/3* 2013/3 2014/3 2015/3
Net Sales 13,228 74,479 73,145 74,807
Operating Income ▲908 12,162 9,891 12,109
% ▲6.9% 16.3% 13.5% 16.2%
(million yen)
* Records of 3 month from Jan 2012 to Mar 2012
13,228
74,479 73,145 74,807
-6.9%
16.3%
13.5%
16.2%
-10.0%
-5.0%
0.0%
5.0%
10.0%
15.0%
20.0%
0
10,000
20,000
30,000
40,000
50,000
60,000
70,000
80,000
2012/3 2013/3 2014/3 2015/3
Net Sales from Golf
Business
Operating Income from
Golf Business
Copyright Heiwa Corporation 2015
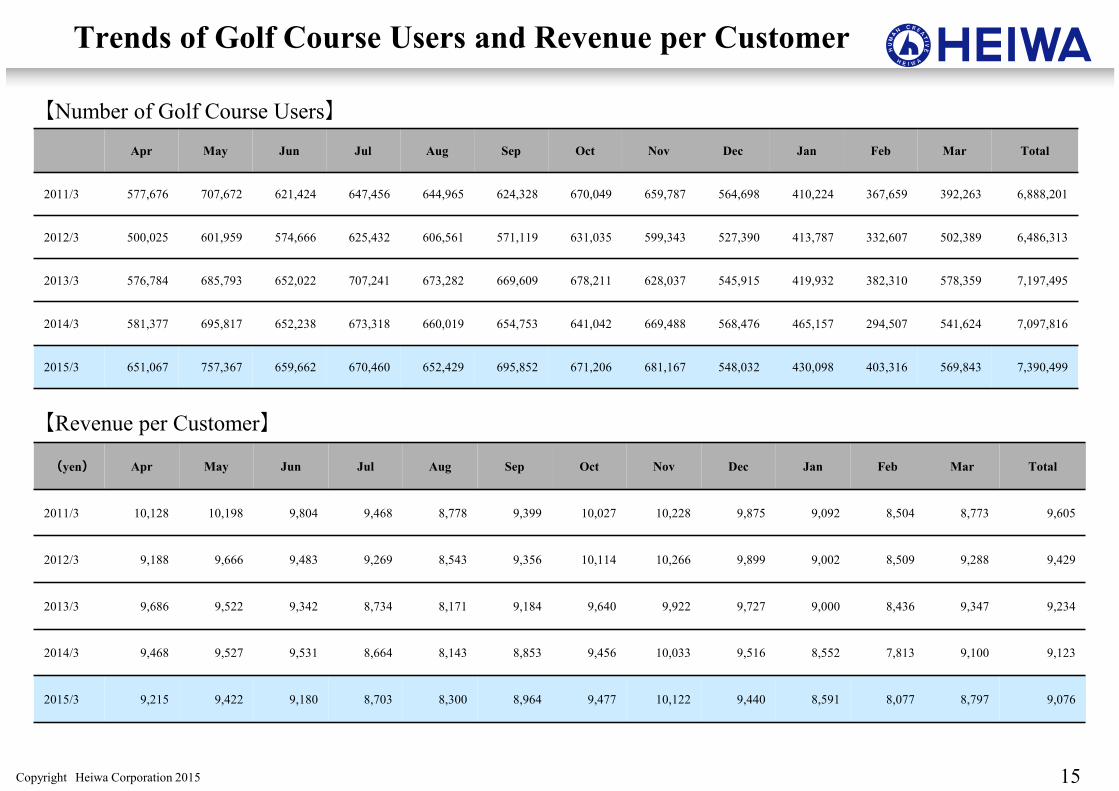
Trends of Golf Course Users and Revenue per Customer
15
Apr May Jun Jul Aug Sep Oct Nov Dec Jan Feb Mar Total
2011/3 577,676 707,672 621,424 647,456 644,965 624,328 670,049 659,787 564,698 410,224 367,659 392,263 6,888,201
2012/3 500,025 601,959 574,666 625,432 606,561 571,119 631,035 599,343 527,390 413,787 332,607 502,389 6,486,313
2013/3 576,784 685,793 652,022 707,241 673,282 669,609 678,211 628,037 545,915 419,932 382,310 578,359 7,197,495
2014/3 581,377 695,817 652,238 673,318 660,019 654,753 641,042 669,488 568,476 465,157 294,507 541,624 7,097,816
2015/3 651,067 757,367 659,662 670,460 652,429 695,852 671,206 681,167 548,032 430,098 403,316 569,843 7,390,499
(yen) Apr May Jun Jul Aug Sep Oct Nov Dec Jan Feb Mar Total
2011/3 10,128 10,198 9,804 9,468 8,778 9,399 10,027 10,228 9,875 9,092 8,504 8,773 9,605
2012/3 9,188 9,666 9,483 9,269 8,543 9,356 10,114 10,266 9,899 9,002 8,509 9,288 9,429
2013/3 9,686 9,522 9,342 8,734 8,171 9,184 9,640 9,922 9,727 9,000 8,436 9,347 9,234
2014/3 9,468 9,527 9,531 8,664 8,143 8,853 9,456 10,033 9,516 8,552 7,813 9,100 9,123
2015/3 9,215 9,422 9,180 8,703 8,300 8,964 9,477 10,122 9,440 8,591 8,077 8,797 9,076
【Number of Golf Course Users】
【Revenue per Customer】
Copyright Heiwa Corporation 2015
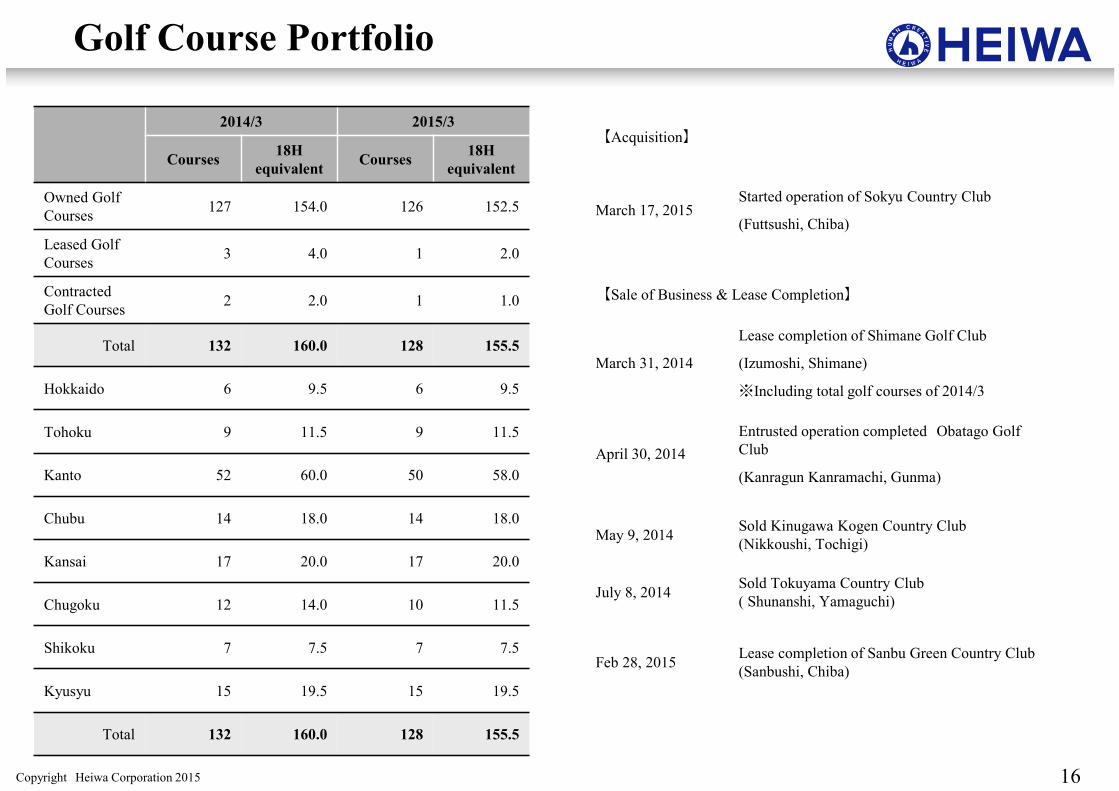
Golf Course Portfolio
16
2014/3 2015/3
Courses18H
equivalentCourses
18H
equivalent
Owned Golf
Courses127 154.0 126 152.5
Leased Golf
Courses3 4.0 1 2.0
Contracted
Golf Courses2 2.0 1 1.0
Total 132 160.0 128 155.5
Hokkaido 6 9.5 6 9.5
Tohoku 9 11.5 9 11.5
Kanto 52 60.0 50 58.0
Chubu 14 18.0 14 18.0
Kansai 17 20.0 17 20.0
Chugoku 12 14.0 10 11.5
Shikoku 7 7.5 7 7.5
Kyusyu 15 19.5 15 19.5
Total 132 160.0 128 155.5
【Acquisition】
March 17, 2015Started operation of Sokyu Country Club
(Futtsushi, Chiba)
【Sale of Business & Lease Completion】
March 31, 2014
Lease completion of Shimane Golf Club
(Izumoshi, Shimane)
※Including total golf courses of 2014/3
April 30, 2014
Entrusted operation completed Obatago Golf
Club
(Kanragun Kanramachi, Gunma)
May 9, 2014Sold Kinugawa Kogen Country Club
(Nikkoushi, Tochigi)
July 8, 2014Sold Tokuyama Country Club
( Shunanshi, Yamaguchi)
Feb 28, 2015Lease completion of Sanbu Green Country Club
(Sanbushi, Chiba)
Copyright Heiwa Corporation 2015 17
4. Pachinko and Pachislot
Market Information
Copyright Heiwa Corporation 2015
Pachinko & Pachislot
Entertainment (excl. Pachinko & Pachislot)
Hobbies
Tourism
Sports
18
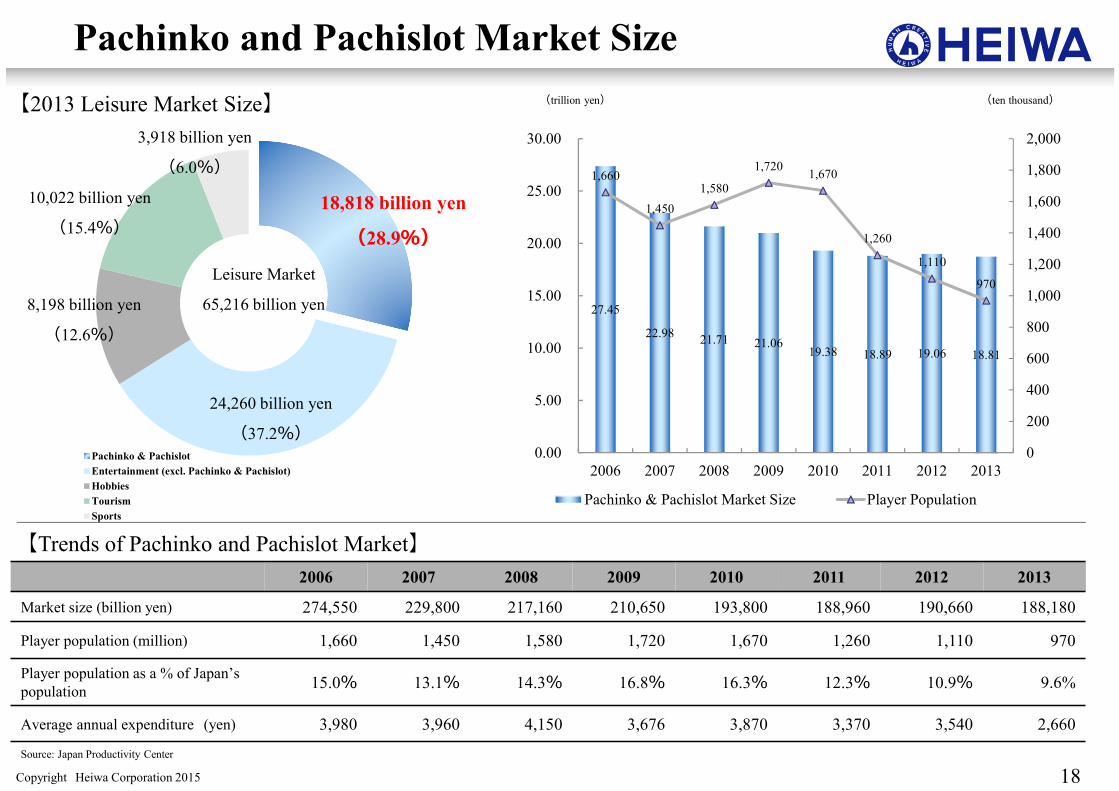
Pachinko and Pachislot Market Size
Leisure Market
65,216 billion yen
Source: Japan Productivity Center
18,818 billion yen
(28.9%)
24,260 billion yen
(37.2%)
8,198 billion yen
(12.6%)
10,022 billion yen
(15.4%)
3,918 billion yen
(6.0%)
【2013 Leisure Market Size】
2006 2007 2008 2009 2010 2011 2012 2013
Market size (billion yen) 274,550 229,800 217,160 210,650 193,800 188,960 190,660 188,180
Player population (million) 1,660 1,450 1,580 1,720 1,670 1,260 1,110 970
Player population as a % of Japan’s
population15.0% 13.1% 14.3% 16.8% 16.3% 12.3% 10.9% 9.6%
Average annual expenditure (yen) 3,980 3,960 4,150 3,676 3,870 3,370 3,540 2,660
【Trends of Pachinko and Pachislot Market】
(ten thousand)(trillion yen)
27.45
22.98 21.71 21.06
19.38 18.89 19.06 18.81
1,660
1,450
1,580
1,720 1,670
1,260
1,110
970
0
200
400
600
800
1,000
1,200
1,400
1,600
1,800
2,000
0.00
5.00
10.00
15.00
20.00
25.00
30.00
2006 2007 2008 2009 2010 2011 2012 2013
Pachinko & Pachislot Market Size Player Population

Copyright Heiwa Corporation 2015 19
Trends of Pachinko Parlors
【Number of Pachinko Parlors】
2006 2007 2008 2009 2010 2011 2012 2013 2014
Number of Pachinko Parlors 14,674 13,585 12,937 12,652 12,479 12,323 12,149 11,893 11,627
Pachinko and Pachislot 12,588 12,039 11,800 11,722 11,576 11,392 11,178 10,873 10,610
Pachislot only 2,086 1,546 1,137 930 903 931 971 1,020 1,017
Average machines installation per
parlor (days)336 337 349 356 365 371 378 387 395
(Parlors) (Units)
Source: National Police Agency
12,588
12,039 11,800
11,722 11,576 11,392 11,178 10,873 10,610
2,086
1,546 1,137 930 903 931 971 1,020 1,017
336 337
349
356
365
371
378
387 395
300
320
340
360
380
400
0
4,000
8,000
12,000
16,000
2006 2007 2008 2009 2010 2011 2012 2013 2014
Parlors with Pachinko & Pachislot Parlors only with Pachislot Average Machines per Parlor
Copyright Heiwa Corporation 2015 20
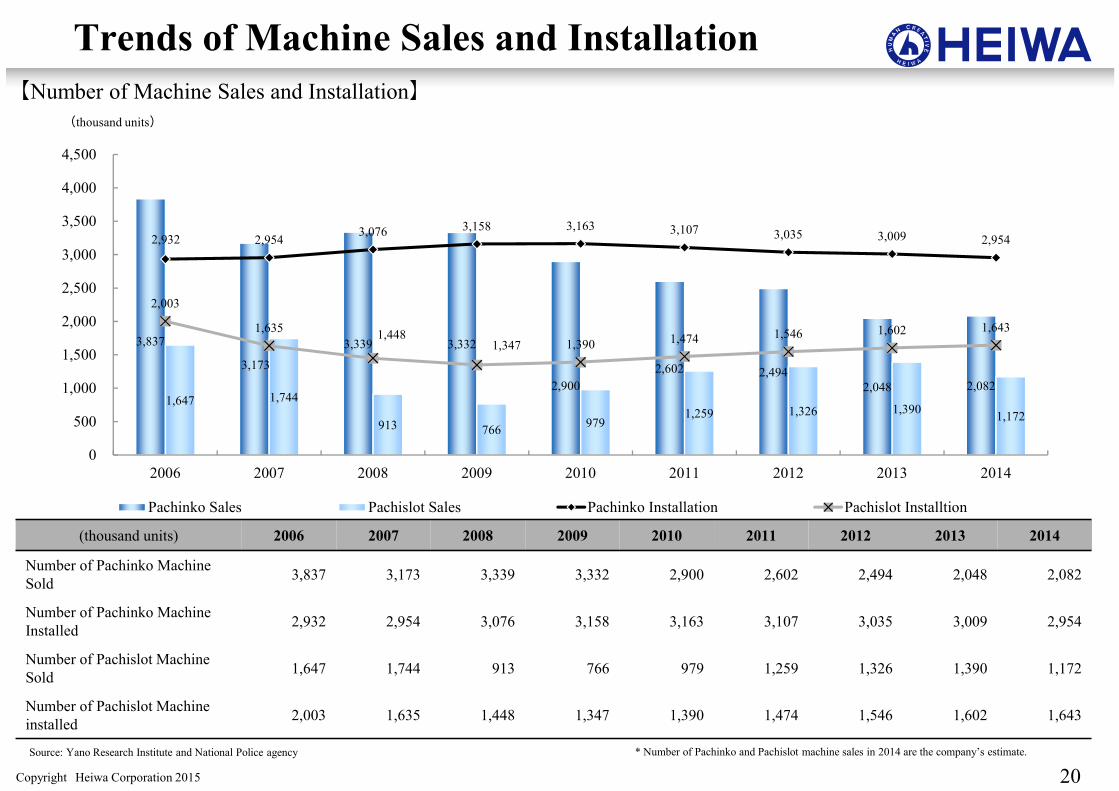
Trends of Machine Sales and Installation
【Number of Machine Sales and Installation】
(thousand units) 2006 2007 2008 2009 2010 2011 2012 2013 2014
Number of Pachinko Machine
Sold3,837 3,173 3,339 3,332 2,900 2,602 2,494 2,048 2,082
Number of Pachinko Machine
Installed2,932 2,954 3,076 3,158 3,163 3,107 3,035 3,009 2,954
Number of Pachislot Machine
Sold1,647 1,744 913 766 979 1,259 1,326 1,390 1,172
Number of Pachislot Machine
installed2,003 1,635 1,448 1,347 1,390 1,474 1,546 1,602 1,643
(thousand units)
Source: Yano Research Institute and National Police agency
3,837
3,173
3,339 3,332
2,900
2,602 2,494
2,048 2,082
1,647 1,744
913 766 979
1,259 1,326 1,390 1,172
2,932 2,954 3,076 3,158 3,163 3,107 3,035 3,009 2,954
2,003
1,635 1,448
1,347 1,390 1,474 1,546 1,602 1,643
0
500
1,000
1,500
2,000
2,500
3,000
3,500
4,000
4,500
2006 2007 2008 2009 2010 2011 2012 2013 2014
Pachinko Sales Pachislot Sales Pachinko Installation Pachislot Installtion
* Number of Pachinko and Pachislot machine sales in 2014 are the company’s estimate.
Copyright Heiwa Corporation 2015 21
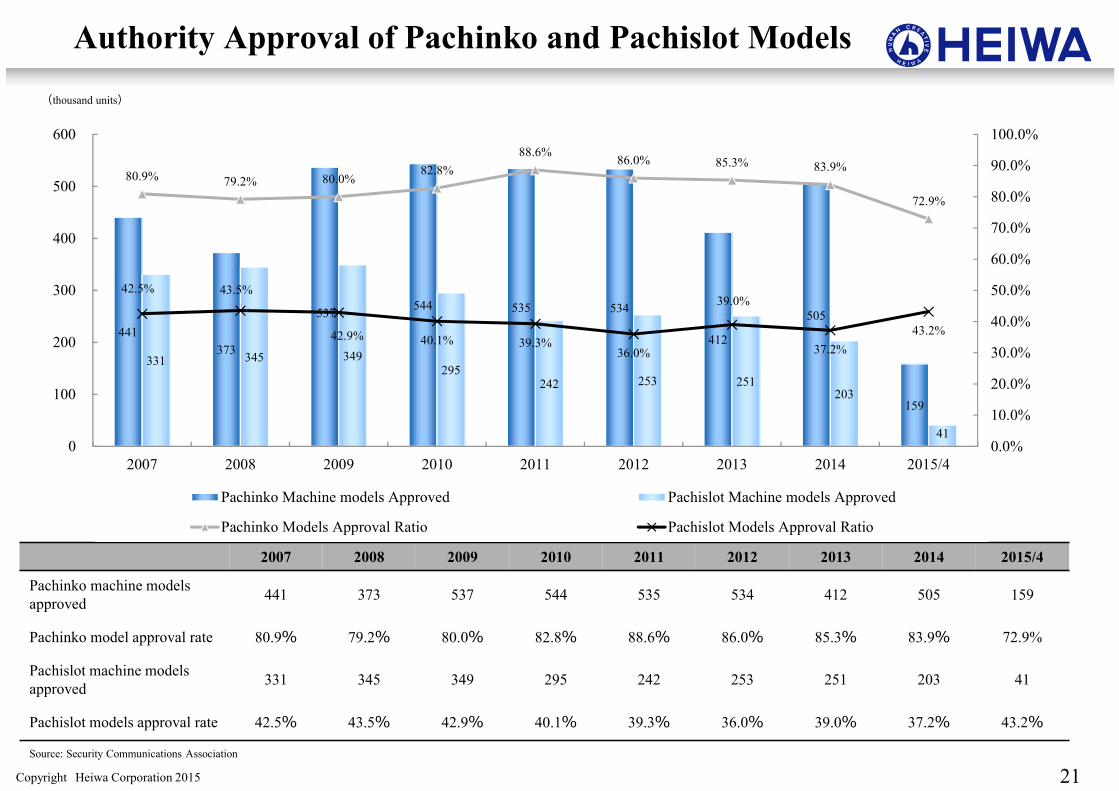
Authority Approval of Pachinko and Pachislot Models
(thousand units)
2007 2008 2009 2010 2011 2012 2013 2014 2015/4
Pachinko machine models
approved441 373 537 544 535 534 412 505 159
Pachinko model approval rate 80.9% 79.2% 80.0% 82.8% 88.6% 86.0% 85.3% 83.9% 72.9%
Pachislot machine models
approved331 345 349 295 242 253 251 203 41
Pachislot models approval rate 42.5% 43.5% 42.9% 40.1% 39.3% 36.0% 39.0% 37.2% 43.2%
Source: Security Communications Association
441
373
537 544 535 534
412
505
159
331 345 349 295
242 253 251 203
41
80.9% 79.2% 80.0%82.8%
88.6%86.0% 85.3% 83.9%
72.9%
42.5% 43.5%
42.9% 40.1% 39.3%36.0%
39.0%
37.2%
43.2%
0.0%
10.0%
20.0%
30.0%
40.0%
50.0%
60.0%
70.0%
80.0%
90.0%
100.0%
0
100
200
300
400
500
600
2007 2008 2009 2010 2011 2012 2013 2014 2015/4
Pachinko Machine models Approved Pachislot Machine models Approved
Pachinko Models Approval Ratio Pachislot Models Approval Ratio
Copyright Heiwa Corporation 2015 22
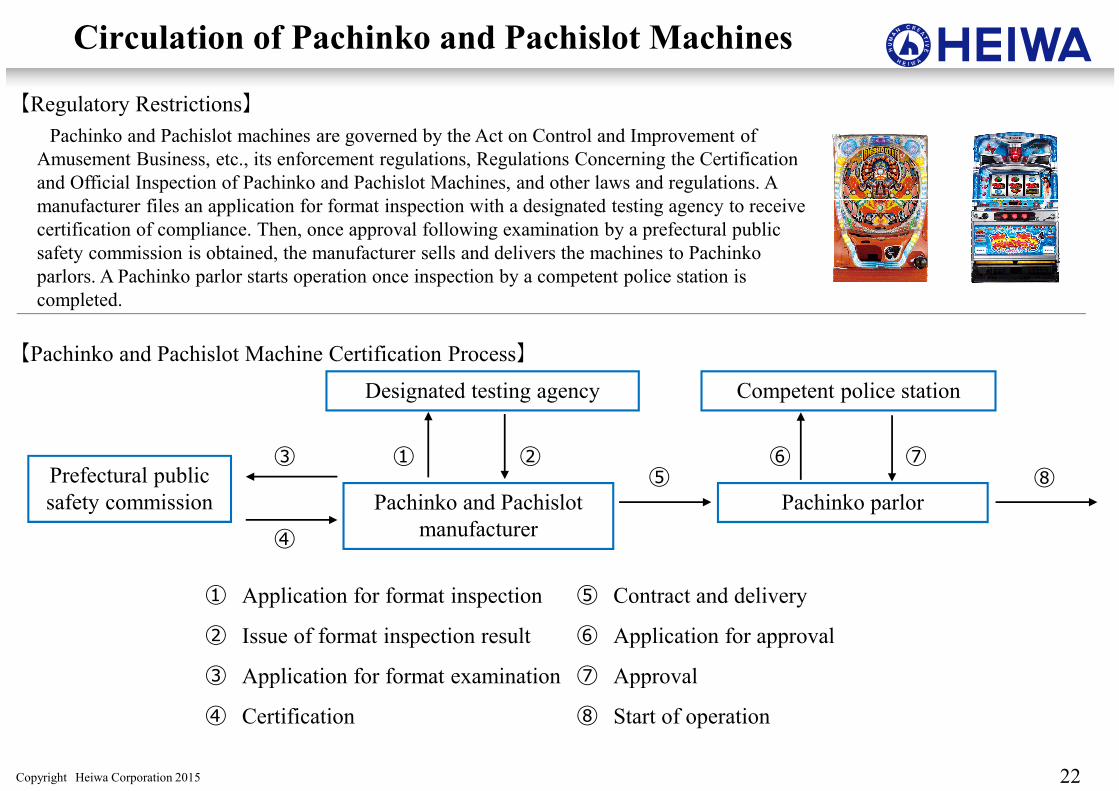
Circulation of Pachinko and Pachislot Machines
【Regulatory Restrictions】
【Pachinko and Pachislot Machine Certification Process】
Pachinko and Pachislot machines are governed by the Act on Control and Improvement of
Amusement Business, etc., its enforcement regulations, Regulations Concerning the Certification
and Official Inspection of Pachinko and Pachislot Machines, and other laws and regulations. A
manufacturer files an application for format inspection with a designated testing agency to receive
certification of compliance. Then, once approval following examination by a prefectural public
safety commission is obtained, the manufacturer sells and delivers the machines to Pachinko
parlors. A Pachinko parlor starts operation once inspection by a competent police station is
completed.
Pachinko and Pachislot
manufacturer
Designated testing agency
Prefectural public
safety commission Pachinko parlor
Competent police station
① ②③
④
⑤⑥ ⑦
⑧
① Application for format inspection
② Issue of format inspection result
③ Application for format examination
④ Certification
⑤ Contract and delivery
⑥ Application for approval
⑦ Approval
⑧ Start of operation
Copyright Heiwa Corporation 2015 23
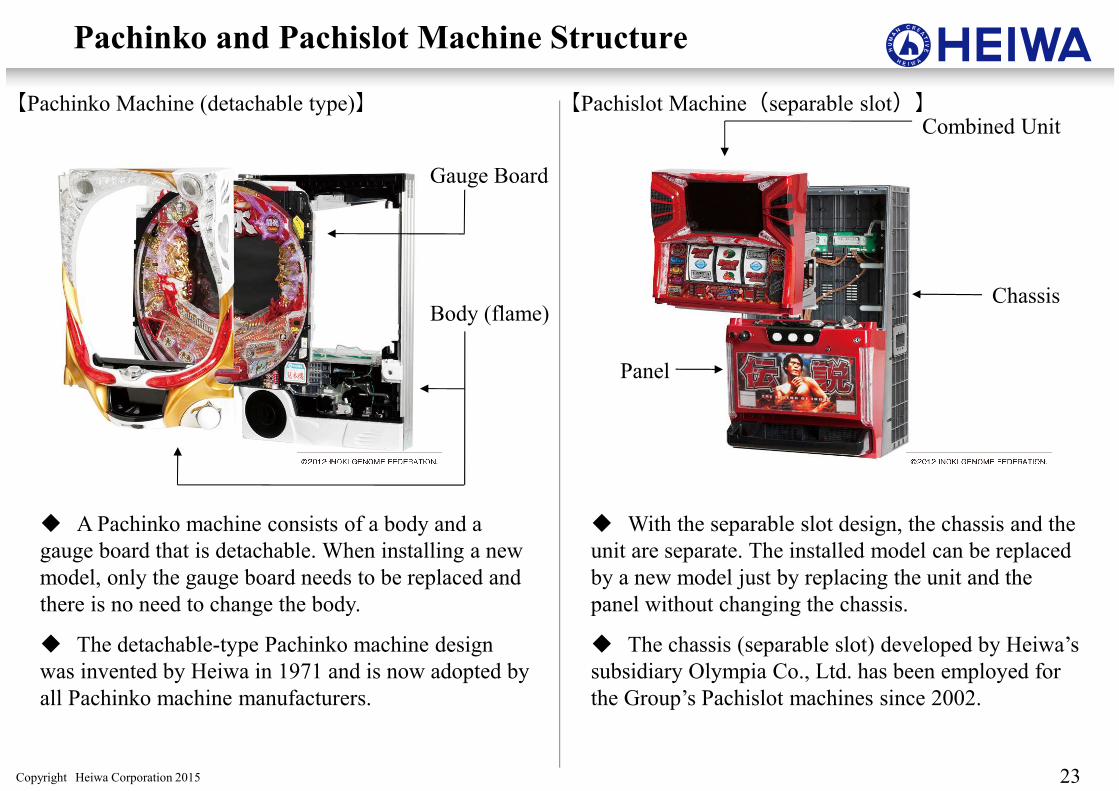
Pachinko and Pachislot Machine Structure
【Pachinko Machine (detachable type)】 【Pachislot Machine(separable slot)】
Gauge Board
Body (flame)
Combined Unit
Chassis
Panel
� A Pachinko machine consists of a body and a
gauge board that is detachable. When installing a new
model, only the gauge board needs to be replaced and
there is no need to change the body.
� The detachable-type Pachinko machine design
was invented by Heiwa in 1971 and is now adopted by
all Pachinko machine manufacturers.
� With the separable slot design, the chassis and the
unit are separate. The installed model can be replaced
by a new model just by replacing the unit and the
panel without changing the chassis.
� The chassis (separable slot) developed by Heiwa’s
subsidiary Olympia Co., Ltd. has been employed for
the Group’s Pachislot machines since 2002.
Copyright Heiwa Corporation 2015
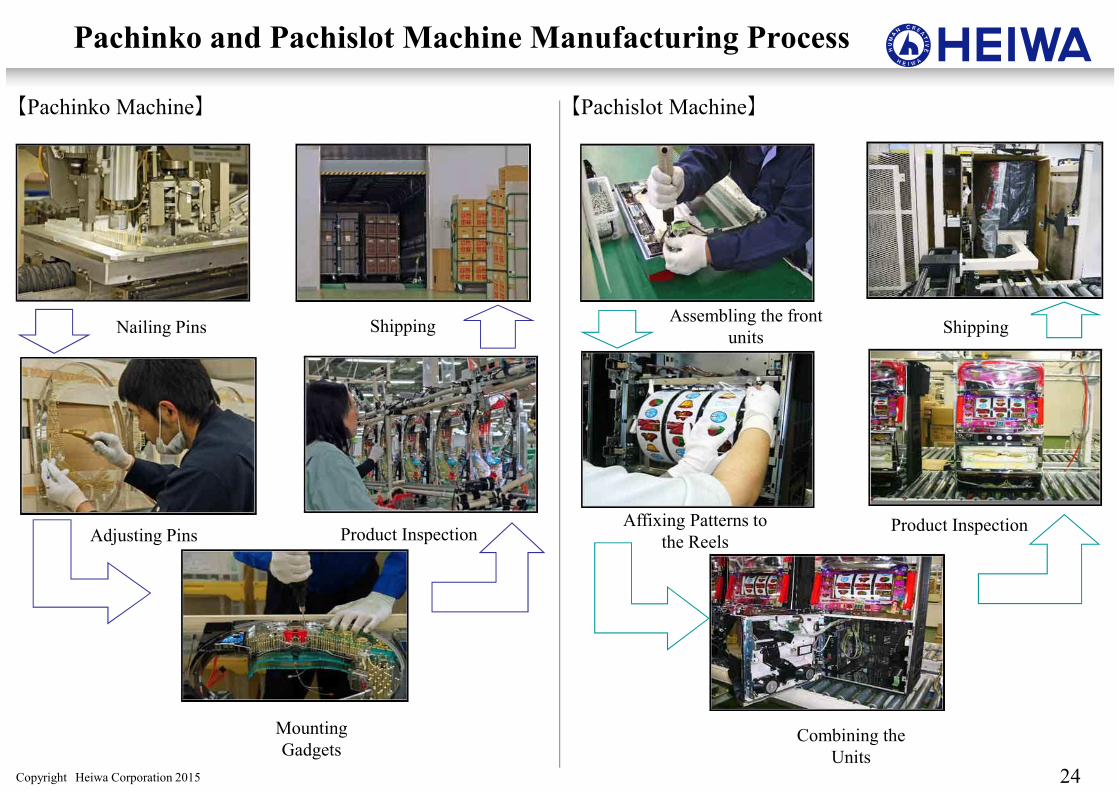
Affixing Patterns to
the ReelsProduct Inspection
Assembling the front
units
24
Pachinko and Pachislot Machine Manufacturing Process
Adjusting Pins Product Inspection
Nailing Pins Shipping
Mounting
GadgetsCombining the
Units
Shipping
【Pachinko Machine】 【Pachislot Machine】
Copyright Heiwa Corporation 2015 25
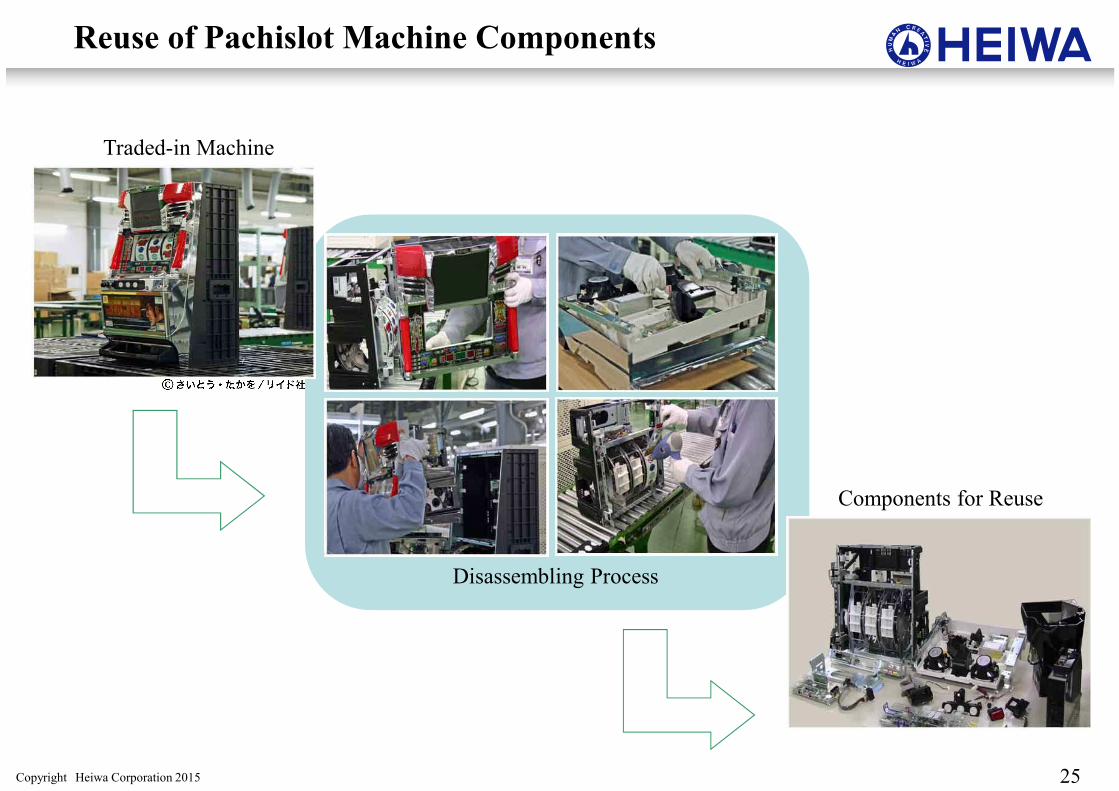
Reuse of Pachislot Machine Components
Traded-in Machine
Disassembling Process
Components for Reuse
Copyright Heiwa Corporation 2015 26
5. Golf Market Information
Copyright Heiwa Corporation 2015
Pachinko & Pachislot Entertainment (excl. Pachinko & Pachislot)
Hobbies Tourism
Sports Golf Market
27
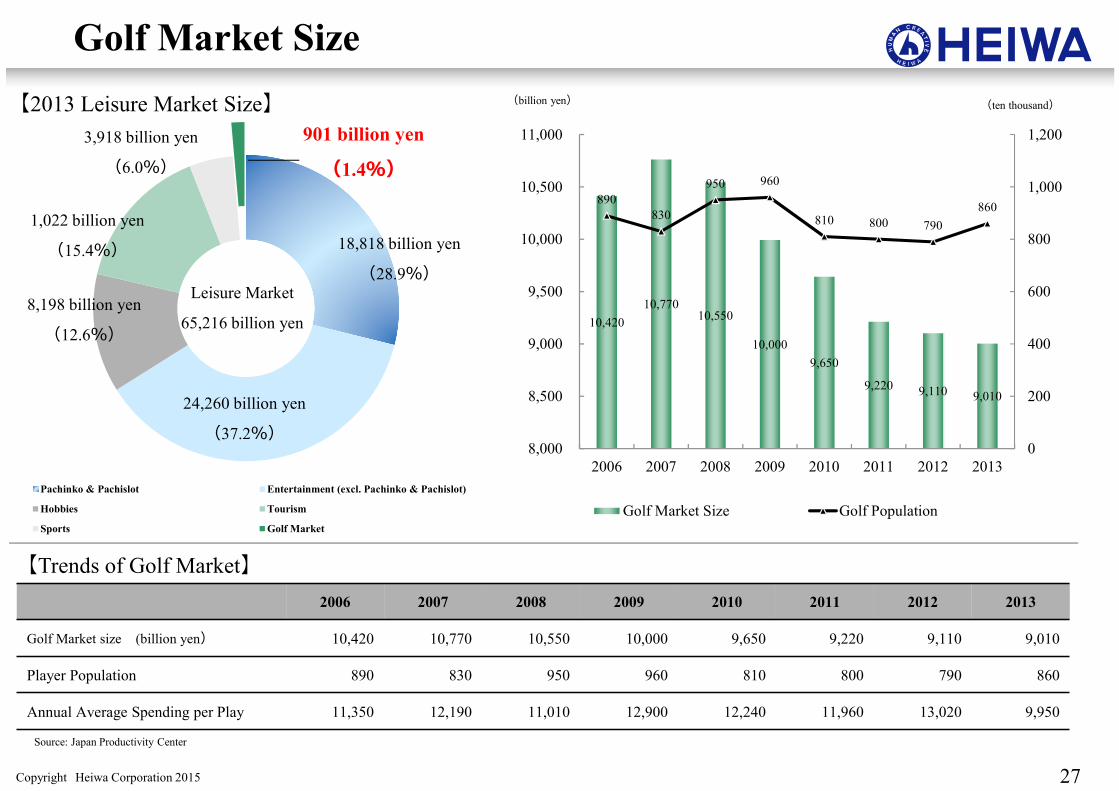
Golf Market Size
Leisure Market
65,216 billion yen
901 billion yen
(1.4%)
24,260 billion yen
(37.2%)
8,198 billion yen
(12.6%)
1,022 billion yen
(15.4%)
3,918 billion yen
(6.0%)
【2013 Leisure Market Size】
【Trends of Golf Market】
18,818 billion yen
(28.9%)
2006 2007 2008 2009 2010 2011 2012 2013
Golf Market size (billion yen) 10,420 10,770 10,550 10,000 9,650 9,220 9,110 9,010
Player Population 890 830 950 960 810 800 790 860
Annual Average Spending per Play 11,350 12,190 11,010 12,900 12,240 11,960 13,020 9,950
(billion yen) (ten thousand)
Source: Japan Productivity Center
10,420
10,770 10,550
10,000
9,650
9,220 9,110 9,010
890
830
950 960
810 800 790
860
0
200
400
600
800
1,000
1,200
8,000
8,500
9,000
9,500
10,000
10,500
11,000
2006 2007 2008 2009 2010 2011 2012 2013
Golf Market Size Golf Population
Copyright Heiwa Corporation 2015 28
6. Company Information
Copyright Heiwa Corporation 2015
Company Profile
29
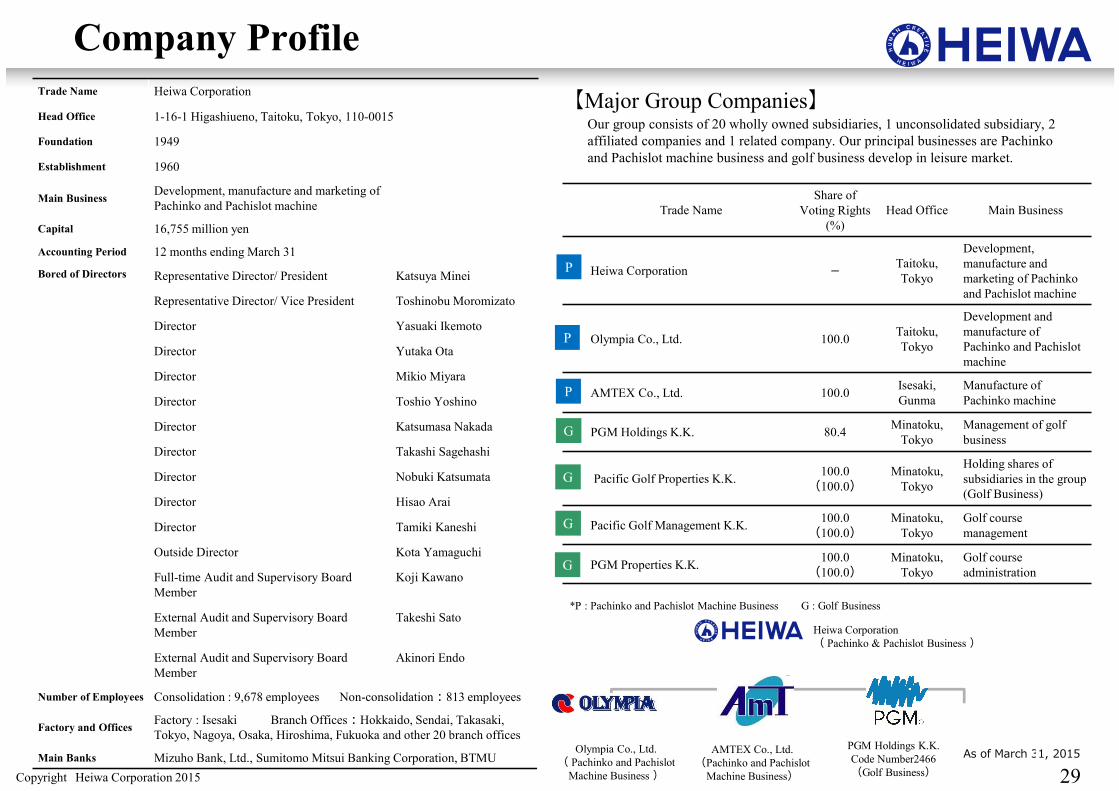
As of March 31, 2015
Trade Name Heiwa Corporation
Head Office 1-16-1 Higashiueno, Taitoku, Tokyo, 110-0015
Foundation 1949
Establishment 1960
Main BusinessDevelopment, manufacture and marketing of
Pachinko and Pachislot machine
Capital 16,755 million yen
Accounting Period 12 months ending March 31
Bored of Directors Representative Director/ President Katsuya Minei
Representative Director/ Vice President Toshinobu Moromizato
Director Yasuaki Ikemoto
Director Yutaka Ota
Director Mikio Miyara
Director Toshio Yoshino
Director Katsumasa Nakada
Director Takashi Sagehashi
Director Nobuki Katsumata
Director Hisao Arai
Director Tamiki Kaneshi
Outside Director Kota Yamaguchi
Full-time Audit and Supervisory Board
Member
Koji Kawano
External Audit and Supervisory Board
Member
Takeshi Sato
External Audit and Supervisory Board
Member
Akinori Endo
Number of Employees Consolidation : 9,678 employees Non-consolidation:813 employees
Factory and OfficesFactory : Isesaki Branch Offices:Hokkaido, Sendai, Takasaki,
Tokyo, Nagoya, Osaka, Hiroshima, Fukuoka and other 20 branch offices
Main Banks Mizuho Bank, Ltd., Sumitomo Mitsui Banking Corporation, BTMU
Trade Name
Share of
Voting Rights
(%)
Head Office Main Business
Heiwa Corporation - Taitoku,
Tokyo
Development,
manufacture and
marketing of Pachinko
and Pachislot machine
Olympia Co., Ltd. 100.0Taitoku,
Tokyo
Development and
manufacture of
Pachinko and Pachislot
machine
AMTEX Co., Ltd. 100.0Isesaki,
Gunma
Manufacture of
Pachinko machine
PGM Holdings K.K. 80.4Minatoku,
Tokyo
Management of golf
business
Pacific Golf Properties K.K.100.0
(100.0)Minatoku,
Tokyo
Holding shares of
subsidiaries in the group
(Golf Business)
Pacific Golf Management K.K.100.0
(100.0)Minatoku,
Tokyo
Golf course
management
PGM Properties K.K.100.0
(100.0)Minatoku,
Tokyo
Golf course
administration
P
G
Olympia Co., Ltd.
( Pachinko and Pachislot
Machine Business )
AMTEX Co., Ltd.
(Pachinko and Pachislot
Machine Business)
PGM Holdings K.K.
Code Number2466
(Golf Business)
Heiwa Corporation
( Pachinko & Pachislot Business )
【Major Group Companies】Our group consists of 20 wholly owned subsidiaries, 1 unconsolidated subsidiary, 2
affiliated companies and 1 related company. Our principal businesses are Pachinko
and Pachislot machine business and golf business develop in leisure market.
P
P
G
G
G
*P : Pachinko and Pachislot Machine Business G : Golf Business
Copyright Heiwa Corporation 2015
Company History
30
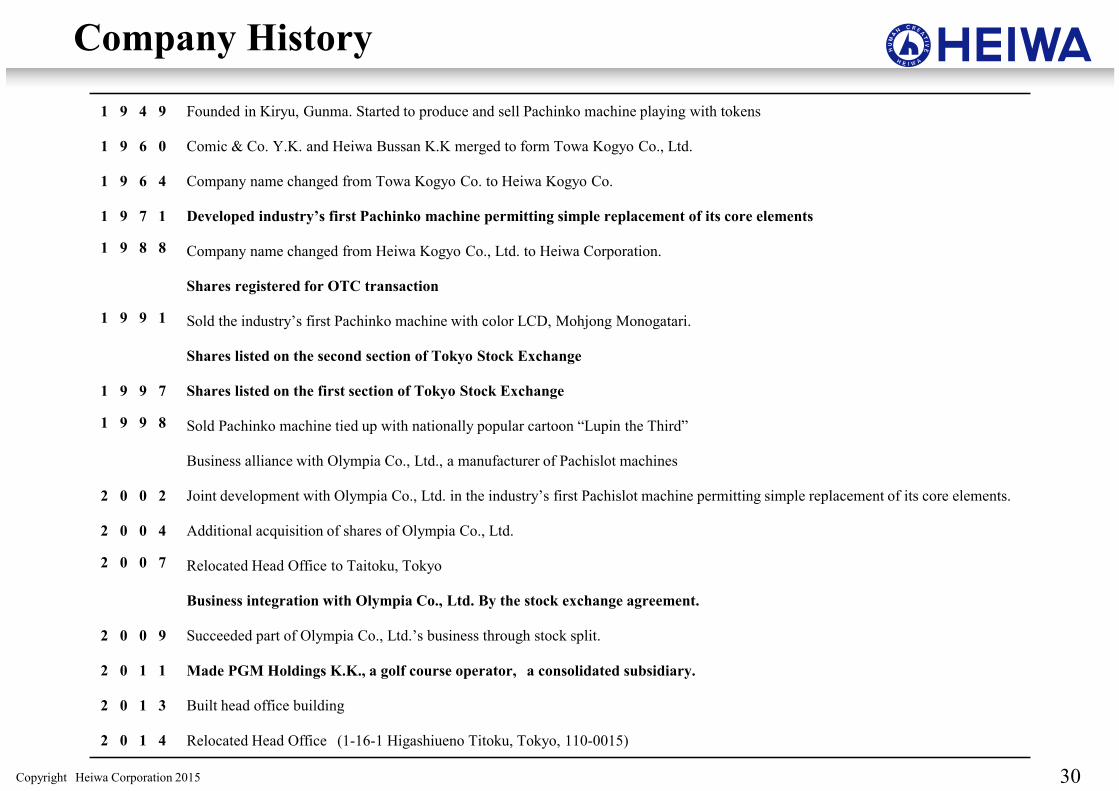
1 9 4 9 Founded in Kiryu, Gunma. Started to produce and sell Pachinko machine playing with tokens
1 9 6 0 Comic & Co. Y.K. and Heiwa Bussan K.K merged to form Towa Kogyo Co., Ltd.
1 9 6 4 Company name changed from Towa Kogyo Co. to Heiwa Kogyo Co.
1 9 7 1 Developed industry’s first Pachinko machine permitting simple replacement of its core elements
1 9 8 8 Company name changed from Heiwa Kogyo Co., Ltd. to Heiwa Corporation.
Shares registered for OTC transaction
1 9 9 1 Sold the industry’s first Pachinko machine with color LCD, Mohjong Monogatari.
Shares listed on the second section of Tokyo Stock Exchange
1 9 9 7 Shares listed on the first section of Tokyo Stock Exchange
1 9 9 8 Sold Pachinko machine tied up with nationally popular cartoon “Lupin the Third”
Business alliance with Olympia Co., Ltd., a manufacturer of Pachislot machines
2 0 0 2 Joint development with Olympia Co., Ltd. in the industry’s first Pachislot machine permitting simple replacement of its core elements.
2 0 0 4 Additional acquisition of shares of Olympia Co., Ltd.
2 0 0 7 Relocated Head Office to Taitoku, Tokyo
Business integration with Olympia Co., Ltd. By the stock exchange agreement.
2 0 0 9 Succeeded part of Olympia Co., Ltd.’s business through stock split.
2 0 1 1 Made PGM Holdings K.K., a golf course operator, a consolidated subsidiary.
2 0 1 3 Built head office building
2 0 1 4 Relocated Head Office (1-16-1 Higashiueno Titoku, Tokyo, 110-0015)
Copyright Heiwa Corporation 2015
Japanese Institutions Individuals
Japanese Financial Institutions Foreign Institution and individuals
Japanese Security firms Treasure Stocks
Stock Information
31
Name Shares % of Shares
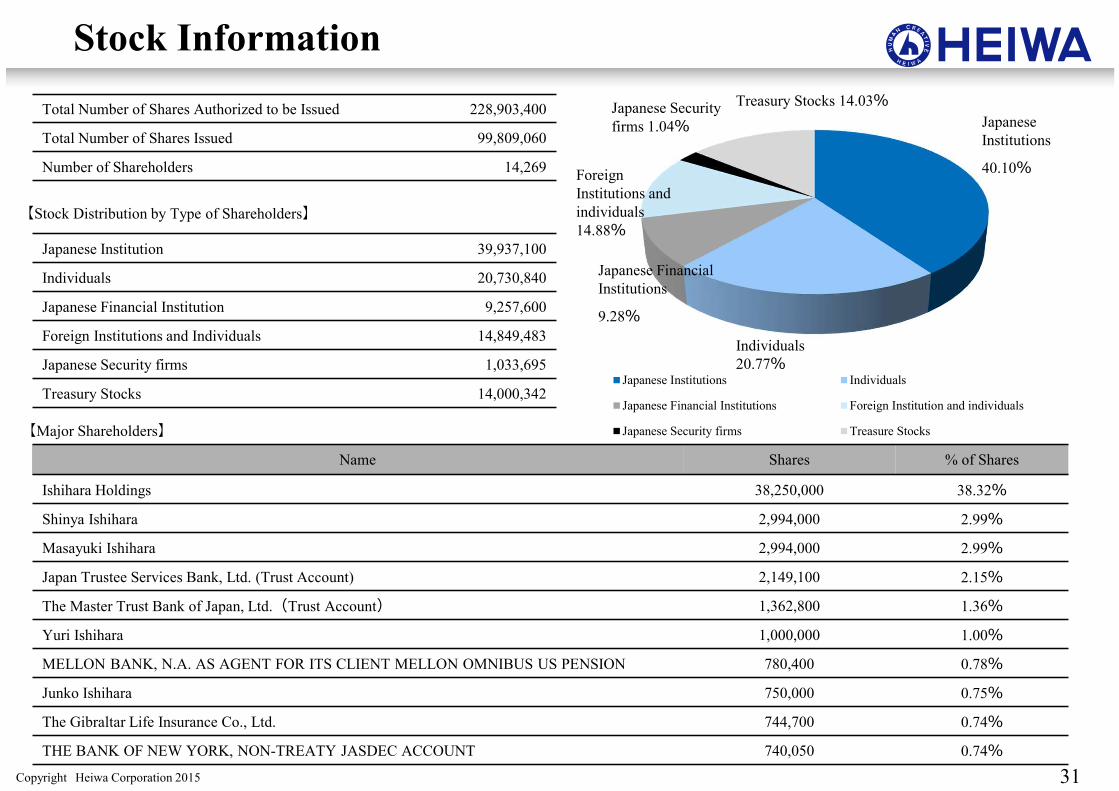
Ishihara Holdings 38,250,000 38.32%
Shinya Ishihara 2,994,000 2.99%
Masayuki Ishihara 2,994,000 2.99%
Japan Trustee Services Bank, Ltd. (Trust Account) 2,149,100 2.15%
The Master Trust Bank of Japan, Ltd.(Trust Account) 1,362,800 1.36%
Yuri Ishihara 1,000,000 1.00%
MELLON BANK, N.A. AS AGENT FOR ITS CLIENT MELLON OMNIBUS US PENSION 780,400 0.78%
Junko Ishihara 750,000 0.75%
The Gibraltar Life Insurance Co., Ltd. 744,700 0.74%
THE BANK OF NEW YORK, NON-TREATY JASDEC ACCOUNT 740,050 0.74%
【Major Shareholders】
Japanese Institution 39,937,100
Individuals 20,730,840
Japanese Financial Institution 9,257,600
Foreign Institutions and Individuals 14,849,483
Japanese Security firms 1,033,695
Treasury Stocks 14,000,342
【Stock Distribution by Type of Shareholders】
Total Number of Shares Authorized to be Issued 228,903,400
Total Number of Shares Issued 99,809,060
Number of Shareholders 14,269
Japanese
Institutions
40.10%
Individuals
20.77%
Japanese Financial
Institutions
9.28%
Foreign
Institutions and
individuals
14.88%
Japanese Security
firms 1.04%Treasury Stocks 14.03%