Embed Size (px)
Citation preview
www.sciencemag.org/content/347/6222/646/suppl/DC1
Supplementary Materials for
A rational strategy for the realization of chain-growth supramolecular
polymerization
Jiheong Kang, Daigo Miyajima,* Tadashi Mori, Yoshihisa Inoue, Yoshimitsu Itoh,
Takuzo Aida*
*Corresponding author. E-mail: [email protected] (D.M.); [email protected] (T.A.)
Published 6 February 2015, Science 347, 646 (2015)
DOI: 10.1126/science.aaa4249
This PDF file includes:
Materials and Methods
Supplementary Text
Figs. S1 to S27
Tables S1 to S3
Full Reference List

S1
Supplementary Material
A Rational Strategy for the Realization of Chain-Growth Supramolecular Polymerization
Jiheong Kang, Daigo Miyajima,* Tadashi Mori, Yoshihisa Inoue, Yoshimitsu Itoh,
and Takuzo Aida*
* To whom correspondence should be addressed.
E-mail: [email protected] (D.M.); [email protected] (T.A.)
Table of Contents
1. General .................................................................................................................................. S2
2. Synthesis of Compounds ...................................................................................................... S3
3. Analytical Data .................................................................................................................... S5
4. Supplementary Methods .................................................................................................. S10
5. Supplementary Figures ...................................................................................................... S14
6. References ........................................................................................................................... S33

S2
1. General
Unless otherwise noted, all commercial reagents were used as received. 1H and 13C NMR spectra
were recorded at 25 °C on a JEOL model JNM-ECA500 spectrometer, operating at 500 and 125
MHz, respectively, where chemical shifts (δ in ppm) were determined using tetramethylsilane (δ
0.0 ppm) for 1H NMR and CDCl3 (δ 77.1 ppm) for 13C NMR as internal references. Matrix-
assisted laser desorption ionization time-of-flight (MALDI–TOF) mass spectrometry was
performed in the reflector mode on a Brucker model autoflex TM speed spectrometer. Electronic
absorption and circular dichroism (CD) spectra were recorded on a JASCO model V-670
UV/VIS/NIR spectrophotometer and a JASCO Type J-820 spectropolarimeter, respectively,
using a quartz cell of 10 mm optical path length. Dynamic light scattering (DLS) measurements
were performed with a Malvern type Zetasizer Nano ZSP at 25 °C using a quartz cell of 10 mm
optical path length. Fourier-transform infrared (FT-IR) spectra were recorded using a JASCO
model FT/IR-610Plus infrared spectrometer. Vibrational circular dichroism (VCD) spectra were
measured in a 0.5-mm thick BaF2 cell with a JASCO model FVS-6000 spectrometer. All VCD
spectra were collected for ca. 4 h (6000-time accumulation) with a resolution of 4 cm–1.
Analytical size-exclusion chromatography (SEC) was performed at 4 °C, using a TSKgel Super
Multipore Hz-M column on a JASCO Type PU-2080i Plus equipped with a JASCO Type MD-
2015 Plus variable-wavelength UV-Vis detector and a JASCO Type CD-2095A variable-
wavelength CD detector. Number-average molecular weights (Mn) and weight-average molecular
weights (Mw) were calculated relative to linear polystyrene standards. Tapping-mode atomic
force microscopy (AFM) images of polymerized mixtures were recorded by an Asylum Research
type CypherS AFM microscope, where all samples were prepared by drop-casting and air-drying
on silicon wafer after 100-fold dilution (0.01 mM).
S3
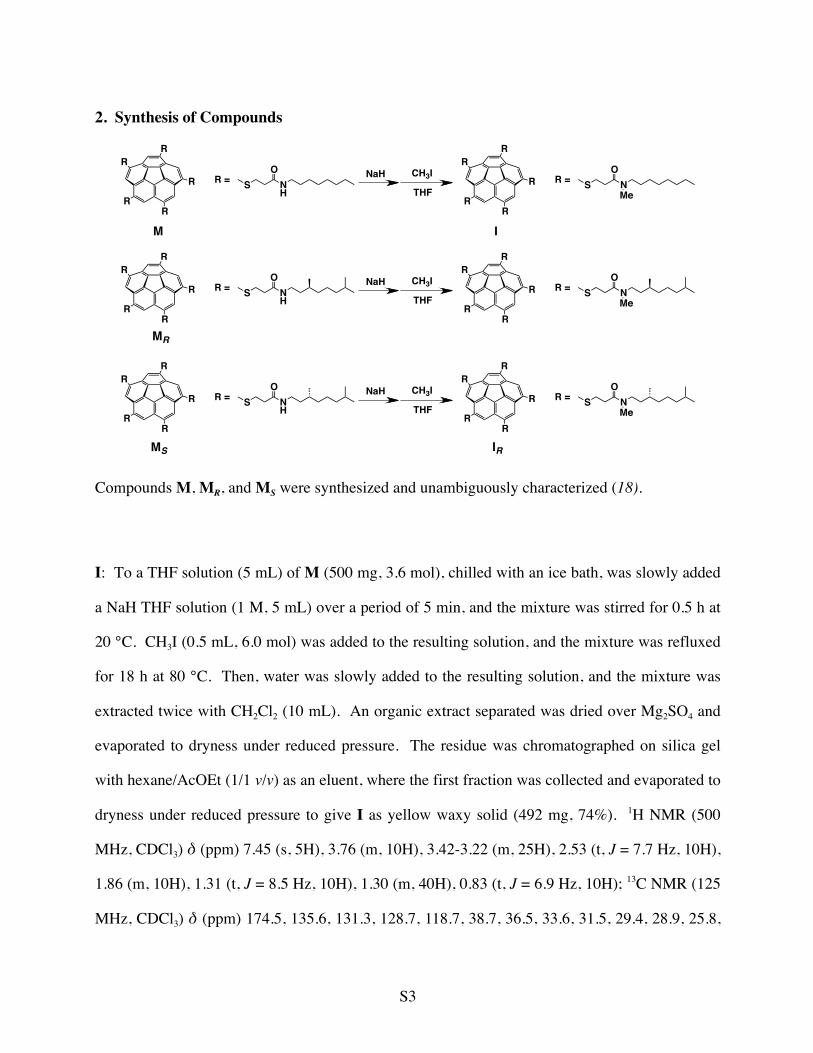
2. Synthesis of Compounds
Compounds M, MR, and MS were synthesized and unambiguously characterized (18).
I: To a THF solution (5 mL) of M (500 mg, 3.6 mol), chilled with an ice bath, was slowly added
a NaH THF solution (1 M, 5 mL) over a period of 5 min, and the mixture was stirred for 0.5 h at
20 °C. CH3I (0.5 mL, 6.0 mol) was added to the resulting solution, and the mixture was refluxed
for 18 h at 80 °C. Then, water was slowly added to the resulting solution, and the mixture was
extracted twice with CH2Cl2 (10 mL). An organic extract separated was dried over Mg2SO4 and
evaporated to dryness under reduced pressure. The residue was chromatographed on silica gel
with hexane/AcOEt (1/1 v/v) as an eluent, where the first fraction was collected and evaporated to
dryness under reduced pressure to give I as yellow waxy solid (492 mg, 74%). 1H NMR (500
MHz, CDCl3) δ (ppm) 7.45 (s, 5H), 3.76 (m, 10H), 3.42-3.22 (m, 25H), 2.53 (t, J = 7.7 Hz, 10H),
1.86 (m, 10H), 1.31 (t, J = 8.5 Hz, 10H), 1.30 (m, 40H), 0.83 (t, J = 6.9 Hz, 10H); 13C NMR (125
MHz, CDCl3) δ (ppm) 174.5, 135.6, 131.3, 128.7, 118.7, 38.7, 36.5, 33.6, 31.5, 29.4, 28.9, 25.8,
RR
R
RR
S NH
O
RR
R
RR
S NH
OR
R
R
RR
S NH
O
R =
R =
R =
M
MS
RR
R
RR
S NO
RR
R
RR
S NO
RR
R
RR
S NO
R =
R =
R =
I
IR
Me
Me
Me
NaH CH3I
THF
NaH CH3I
THF
NaH CH3I
THF
MR

S4
22.3, 13.7. MALDI-TOF mass, m/z calculated for compound I [M + Na]+; 1418.83, found;
1419.35.
IR: Compound IR was likewise derived from MR. 1H NMR (500 MHz, CDCl3) δ (ppm) 7.45 (s,
5H), 3.76 (m, 10H), 3.40 (m, 25H), 2.51 (dd, J = 5.1 and 14.0 Hz, 5H), 2.29 (dd, J = 8.6 and 14.0
Hz, 5H), 2.15 (m, 5H), 1.41 (m, 30H), 1.22 (m, 10H), 1.08 (d, J = 6.2 Hz, 15H), 0.83 (d, J = 6.4
Hz, 30H); 13C NMR (125 MHz, CDCl3) δ (ppm) 174.2, 135.4, 131.9, 129.0, 120.4, 44.3, 39.3,
39.1, 37.6, 34.2, 30.8, 28.1, 25.0, 22.5, 22.6, 20.3. MALDI-TOF mass, m/z calculated for
compound IR [M + Na]+; 1558.98, found; 1559.99.
IS: Compound IS was likewise derived from MS. 1H NMR (500 MHz, CDCl3) δ (ppm) 7.42 (s,
5H), 3.76 (m, 10H), 3.40 (m, 25H), 2.51 (dd, J = 5.1 and 14.0 Hz, 5H), 2.29 (dd, J = 8.6 and 14.0
Hz, 5H), 2.15 (m, 5H), 1.41 (m, 30H), 1.22 (m, 10H), 1.08 (d, J = 6.2 Hz, 15H), 0.83 (d, J = 6.4
Hz, 30H); 13C NMR (125 MHz, CDCl3) δ (ppm) 174.1, 134.9, 131.4, 128.1, 120.7, 43.1, 39.3,
39.3, 37.4, 34.7, 31.0, 28.0, 25.3, 22.7, 22.3, 21.0. MALDI-TOF mass, m/z calculated for
compound IS [M + Na]+; 1558.98, found; 1559.44.

S5
3. Analytical Data
3.1 1H and 13C NMR Spectroscopy
Fig. S1. 1H NMR spectrum (500 MHz) of I in CDCl3 at 25 °C.
PPM
175 150 125 100 75 50 25 0
DFILE \\Aida-nmr\550nmr\zhihua\20110430_5tikan_S_C7rev_500_VT55_13C(edit).alsCOMNTDATIM Sat Apr 30 11:52:11 2011OBNUC 13CEXMOD SINGLOBFRQ 125.65 MHzOBSET 0.00 KHzOBFIN 127958.00 HzPOINT 32768FREQU 33898.30 HzSCANS 1942ACQTM 0.9667 secPD 1.0000 secPW1 5.00 usecIRNUC 1HCTEMP 55.0 cSLVNT CDCL3EXREF 77.00 ppmBF 0.12 HzRGAIN 28
\\Aida-nmr\550nmr\zhihua\20110430_5tikan_S_C7rev_500_VT55_13C(edit).als
174.
514
135.
583
131.
215
128.
328
119.
000
38.
603
36.
530
33.
635
31.
521
29.
431
28.
897
25.
829
22.
349
13.
688
!ppm180 150 120 90 60 30 0
Fig. S2. 13C NMR spectrum (125 MHz) of I in CDCl3 at 25 °C.

S6
Fig. S3. 1H NMR spectrum (500 MHz) of IR in CDCl3 at 25 °C.
PPM
175 150 125 100 75 50 25
DFILE \\Aida-nmr\550nmr\harada\20110502_5tikanS-C7rev_minus_VT55_500_13C(edit).alsCOMNTDATIM Mon May 02 20:09:09 2011OBNUC 13CEXMOD SINGLOBFRQ 125.65 MHzOBSET 0.00 KHzOBFIN 127958.00 HzPOINT 32768FREQU 33898.30 HzSCANS 2000ACQTM 0.9667 secPD 1.0000 secPW1 5.00 usecIRNUC 1HCTEMP 54.9 cSLVNT CDCL3EXREF 77.00 ppmBF 0.12 HzRGAIN 27
\\Aida-nmr\550nmr\harada\20110502_5tikanS-C7rev_minus_VT55_500_13C(edit).als
174.
054
135.
764
131.
931
129.
010
120.
431
77.
255
77.
000
76.
745
44.
435
39.
286
39.
022
37.
492
34.
161
30.
739
27.
984
24.
874
22.
637
22.
538
20.
161
!ppm180 150 120 90 60 30 0
Fig. S4. 13C NMR spectrum (125 MHz) of IR in CDCl3 at 25 °C.

S7
Fig. S5. 1H NMR spectrum (500 MHz) of IS in CDCl3 at 25 °C.
㪧㪧㪤
㪈㪎㪌 㪈㪌㪇 㪈㪉㪌 㪈㪇㪇 㪎㪌 㪌㪇 㪉㪌 㪇
㪛㪝㪠㪣㪜 㪚㪑㪳㪛㫆㪺㫌㫄㪼㫅㫋㫊㩷㪸㫅㪻㩷㪪㪼㫋㫋㫀㫅㪾㫊㪳㪸㪻㫄㫀㫅㪳䊂䉴䉪䊃䉾䊒㪚㪦㪤㪥㪫㪛㪘㪫㪠㪤 㪪㪸㫋㩷㪘㫇㫉㩷㪈㪍㩷㪇㪊㪑㪇㪐㪑㪈㪈㩷㪉㪇㪈㪈㪦㪙㪥㪬㪚 㪈㪊㪚㪜㪯㪤㪦㪛 㪙㪚㪤㪦㪙㪝㪩㪨 㩷㩷㩷㩷㩷㩷㩷㪍㪎㪅㪏㪇㩷㪤㪟㫑㪦㪙㪪㪜㪫 㩷㩷㩷㩷㩷㩷㪈㪊㪌㪅㪇㪇㩷㪢㪟㫑㪦㪙㪝㪠㪥 㩷㩷㩷㩷㩷㪌㪉㪇㪇㪅㪇㪇㩷㪟㫑㪧㪦㪠㪥㪫 㩷㩷㩷㩷㩷㩷㩷㪊㪉㪎㪍㪏㪝㪩㪜㪨㪬 㩷㩷㩷㩷㪈㪏㪊㪈㪌㪅㪇㪇㩷㪟㫑㪪㪚㪘㪥㪪 㩷㩷㩷㩷㩷㩷㩷㩷㪈㪍㪏㪎㪘㪚㪨㪫㪤 㩷㩷㩷㩷㩷㩷㪈㪅㪎㪏㪐㪈㩷㫊㪼㪺㪧㪛 㩷㩷㩷㩷㩷㩷㪈㪅㪉㪈㪈㪇㩷㫊㪼㪺㪧㪮㪈 㩷㩷㩷㩷㩷㩷㩷㩷㪋㪅㪇㪇㩷㫌㫊㪼㪺㪠㪩㪥㪬㪚 㪈㪟㪚㪫㪜㪤㪧 㩷㩷㩷㩷㩷㩷㩷㩷㪌㪌㪅㪏㩷㪺㪪㪣㪭㪥㪫 㪚㪛㪚㪣㪊㪜㪯㪩㪜㪝 㩷㩷㩷㩷㩷㩷㩷㪎㪎㪅㪇㪇㩷㫇㫇㫄㪙㪝 㩷㩷㩷㩷㩷㩷㩷㩷㪇㪅㪈㪉㩷㪟㫑㪩㪞㪘㪠㪥 㩷㩷㩷㩷㩷㩷㩷㩷㩷㩷㪉㪏
㪚㪑㪳㪛㫆㪺㫌㫄㪼㫅㫋㫊㩷㪸㫅㪻㩷㪪㪼㫋㫋㫀㫅㪾㫊㪳㪸㪻㫄㫀㫅㪳䊂䉴䉪䊃䉾䊒㪳㪌㪌㪇㪥㪤㪩㪉㪳㪿㪸㫉㪸㪻㪸㪳㪉㪇㪈㪈㪇㪋㪈㪌㪶㪌㫋㫀㫂㪸㫅㪶㪪㪶㪚㪎㩿㫉㪼㫍㪀㫇㫃㫌㫊㪶㫍㫋㪌㪌㪶㪈㪊㪚㩿㪼㪻㫀㫋㪀㪅㪸㫃㫊
㪈㪎㪊㪅㪐㪇㪌
㪈㪊㪌㪅㪍㪋㪍
㪈㪊㪈㪅㪎㪋㪎
㪈㪉㪏㪅㪏㪌㪇
㪈㪉㪇㪅㪉㪎㪎
㩷㪋㪋㪅㪋㪎㪍
㩷㪊㪐㪅㪊㪋㪉
㩷㪊㪐㪅㪇㪐㪌
㩷㪊㪎㪅㪌㪌㪎
㩷㪊㪋㪅㪉㪉㪌
㩷㪊㪇㪅㪏㪈㪏
㩷㪉㪏㪅㪇㪎㪇
㩷㪉㪋㪅㪐㪍㪇
㩷㪉㪉㪅㪎㪊㪈
㩷㪉㪉㪅㪍㪊㪉
㩷㪉㪇㪅㪉㪍㪉
㩷㩷㪈㪅㪈㪋㪈
!ppm180 150 120 90 60 30 0
Fig. S6. 13C NMR spectrum (125 MHz) of IS in CDCl3 at 25 °C.

S8
3.2 MALDI-TOF Mass Spectrometry
Fig. S7. MALDI-TOF mass spectrum of I using CHCA as a matrix.
1500 16001400130012001100 1700 1800 1900 2000m/z
1559.99
Fig. S8. MALDI-TOF mass spectrum of IR using CHCA as a matrix.
1500 16001400130012001100 1700 1800 1900 2000
1419.35
m/z

S9
Fig. S9. MALDI-TOF mass spectrum of IS using CHCA as a matrix.
1500 16001400130012001100 1700 1800 1900 2000
1559.44
m/z

S10
4. Supplementary Methods
Preparation of Monomeric Samples of M, MR, and MS in MCHex
Typically, a mixture of M and its polymers (14 mg, 1.0 mmol) was dissolved in CHCl3 (5 mL),
and the resulting solution was slowly evaporated to dryness with gentle stirring at room
temperature under reduced pressure. The residue was then dissolved in MCHex
(methylcyclohexane, 10 mL) upon sonication with an ice bath. By this procedure, molecularly
dispersed M employed for the chain-growth supramolecular polymerization was obtained, as
confirmed by SEC-UV and DLS. MCHex solutions of molecularly dispersed MR and MS were
likewise prepared.
Thermal Polymerization of M without I
A MCHex solution of M ([M] = 1.0 mM) was heated at 60 °C for 12 h and then allowed to cool
to 25 °C and stand for 12 h. The formation of polymeric M at the complete monomer
consumption was confirmed by SEC-UV (see Fig. S12).
Size-Exclusion Chromatography (SEC)
All analytical SEC measurements were performed at 4 °C with CHCl3/MCHex (1/1 v/v) as an
eluent, monitored by UV and CD detectors at 290 nm. An analyte (10 µL) was slowly injected
into the sample injection loop. Number-average (Mn) and weight-average molecular weights
(Mw) were estimated using a calibration curve based on polystyrene standards. The flow rate was
set at 0.5 mL min–1, whereas that for the SEC in Fig. 3D was 0.2 mL min–1.

S11
*Note: Although polymeric M, MR, and MS dissociate into their monomers in CHCl3, they are
sufficiently stable in CHCl3/MCHex (1/1 v/v) at 4 °C (Fig. S27). Therefore, SEC was carried out
using CHCl3/MCHex (1/1 v/v) as eluent at 4 °C.
Evaluation of the Degrees of Polymerization (Dp) of Polymers by DOSY NMR
According to the Stokes-Einstein relation (eq. 1), the diffusion coefficient (D) of a molecule is
inversely proportional to its hydrodynamic radius R, where kB, T, and η are Boltzmann constant,
temperature, and dynamic viscosity of the solvent, respectively.
D = kBT/6πηR ------------------- eq. 1
As summarized in Figs. 2B and S10, the diffusion coefficients (D) of polymeric M at varying
[M]0/[I]0 ratios, together with that of monomeric M, were obtained at 293 K by DOSY NMR
experiments in deuterated MCHex at [M]0 = 1.0 x 10⁻⁴ M (21). With these D values, the Dp
values of the polymers were estimated by eq. 2.
DP = (D of monomeric M)3/(D of polymeric M)3 ------------------- eq. 2
The Dp values thus estimated are a rough approximation because the theoretical treatment
involves an assumption that a polymer is hydrodynamically spherical. Nevertheless, the Dp
values are in good agreement with the number-averaged Dp values expected from [M]0/[I]0.

S12
Evaluation of %-Enantiomeric Excess of Polymeric M
In a previous paper (18), we estimated (31–33) that molar ellipticities ([θ]) of the C5-symmetirc
chiral corannulene skeleton of MR in MCHex at 25 °C are [θ]290 = 7.0 × 10⁴ deg cm2 dmol–1, [θ]337
= 2.9 × 10⁴ deg cm2 dmol–1, and [θ]378 = –2.8 × 10⁴ deg cm2 dmol–1 at 290, 337, and 378 nm,
respectively. By using these values and eq. 3, the %-enantiomeric excesses of polymeric M in
MCHex at 25 °C were estimated based on its apparent molar ellipticities (app[θ]) observed at 290,
337, and 378 nm and summarized in Tables S2 and S3.
%-Enantiomeric Excess = 100 × (app[θ]/[θ]) ------------------- eq. 3
Structural Optimization of Trimeric M Using Simplified Model M’
All calculations were performed with the Gaussian 09 or Turbomole 6.5 program package (34),
where structural optimizations were carried out at DFT-D3(BJ)-TPSS/def2-TZVP level followed
by frequency calculation at the same level, affording the structures on the next page with zero
imaginary frequencies. For shortening the calculation time, simplified molecular model M’ (A)
was used instead of M. Prior to this, we first calculated dimeric M’ with clockwise and
counterclockwise geometries in regard to the intermolecularly H-bonded amide network (green).
As shown in (B) and (D), when the C5-symmetric corannulene core adopts a clockwise
(counterclockwise) geometry, M’ stacks up to give a stable 1D assembly only when the
intermolecularly H-bonded amide network adopts a clockwise (counterclockwise) geometry.
Namely, the stereochemistry of the chiral corannulene skeleton, once fixed upon dimerization,
unambiguously determines that of the intermolecularly H-bonded amide network. The same held
true when trimeric M’ was calculated (C). This geometrical coherence most likely leads to the
high stereospecificity of the supramolecular polymerization. For the purpose of estimating the

S13
VCD spectra in Fig. S21, the geometrically optimized structure of trimeric M’ (C) was
employed.

S14
5. Supplementary Figures 5.1. 1H DOSY NMR Spectroscopy of Polymeric M Formed with I in Deuterated MCHex
Fig. S10. 1H DOSY NMR spectra in deuterated MCHex at 20 ºC (500 MHz) of monomeric M (dark red) and its polymers formed at [M]total/[I]0 = 50 (purple), 250 (dark yellow), 500 (green), and 1000 (blue).
S15
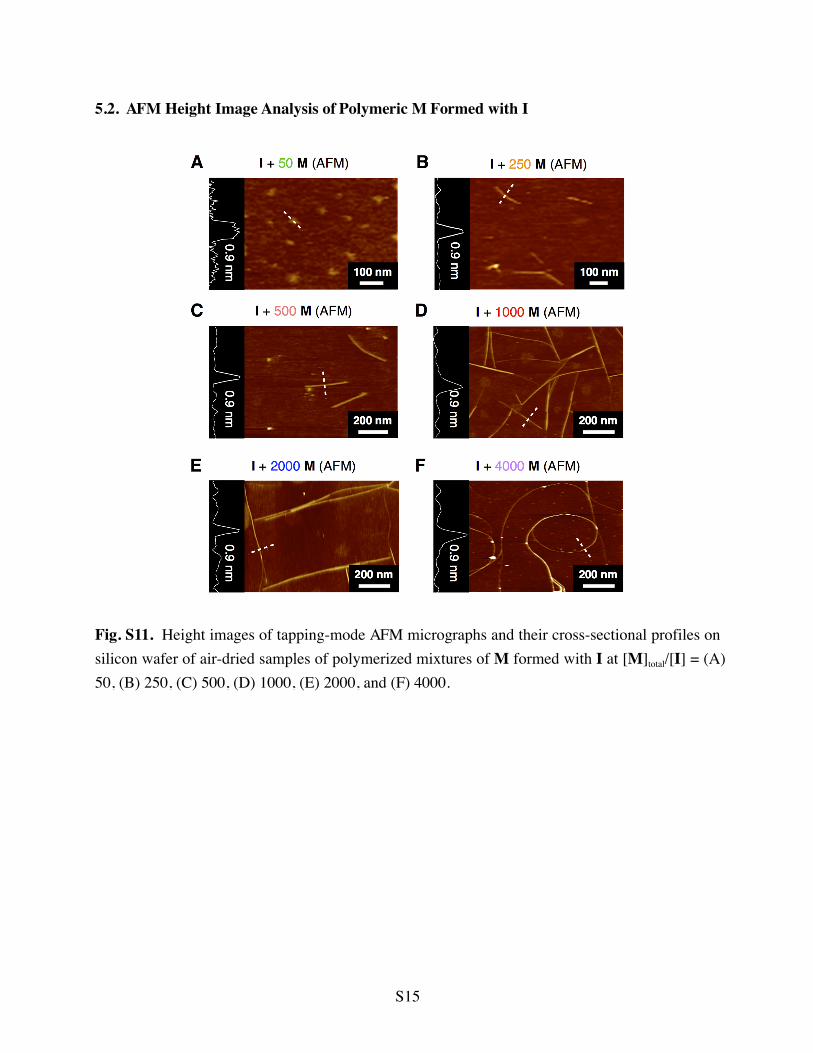
5.2. AFM Height Image Analysis of Polymeric M Formed with I
Fig. S11. Height images of tapping-mode AFM micrographs and their cross-sectional profiles on silicon wafer of air-dried samples of polymerized mixtures of M formed with I at [M]total/[I] = (A) 50, (B) 250, (C) 500, (D) 1000, (E) 2000, and (F) 4000.

S16
5.3. SEC Characterization of Polymeric M Formed Thermally or with I
Fig. S12. SEC-UV trace at 290 nm of polymeric M formed with I at [M]0/[I]0 = 500 ([M]0 = 1.0 mM) in MCHex at 25 °C (black) and that of a thermally polymerized reference ([M]0 = 1.0 mM) in MCHex at 60 °C without I (red). A broken line represents the peak-top position of monomeric M.

S17
5.4. FT-IR Characterization of Monomeric and Polymeric M
Fig. S13. FT-IR spectra at 25 °C of monomeric M (1.0 mM, blue) and its polymer formed with I at [M]0/[I]0 = 500 ([M]0 = 1.0 mM, red) in MCHex at 25 °C. (A) N-H and (B) C=O regions.
S18
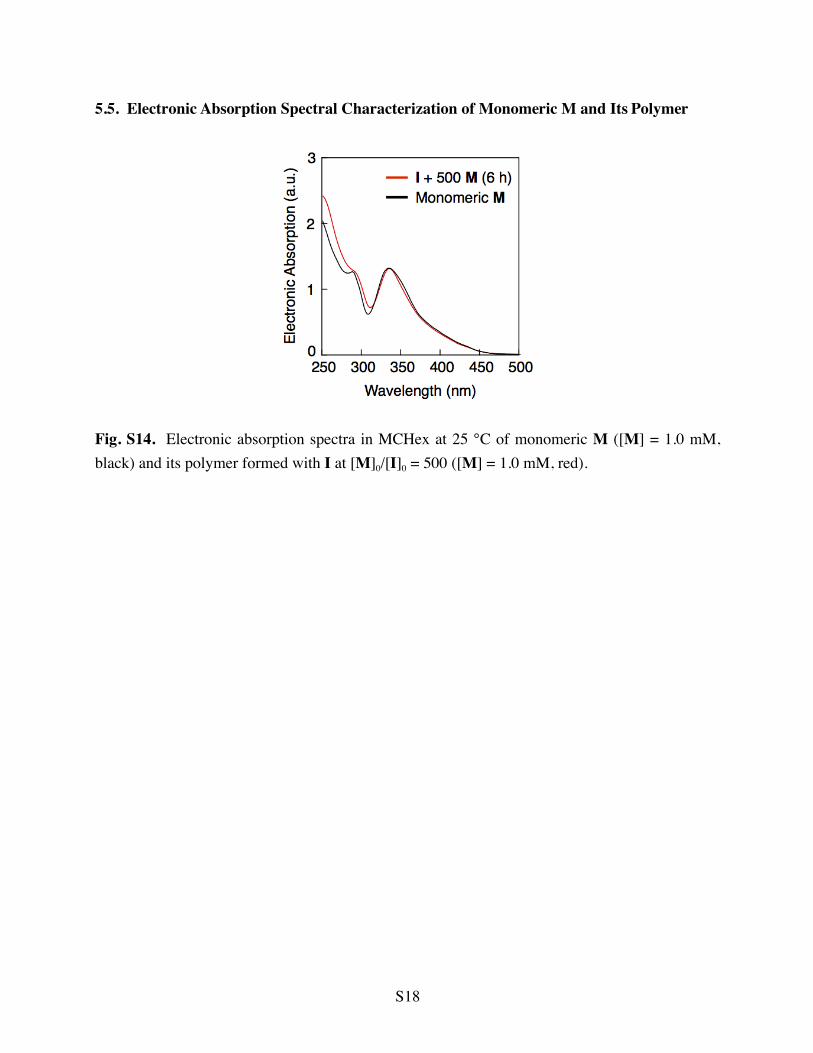
5.5. Electronic Absorption Spectral Characterization of Monomeric M and Its Polymer
Fig. S14. Electronic absorption spectra in MCHex at 25 °C of monomeric M ([M] = 1.0 mM, black) and its polymer formed with I at [M]0/[I]0 = 500 ([M] = 1.0 mM, red).
S19
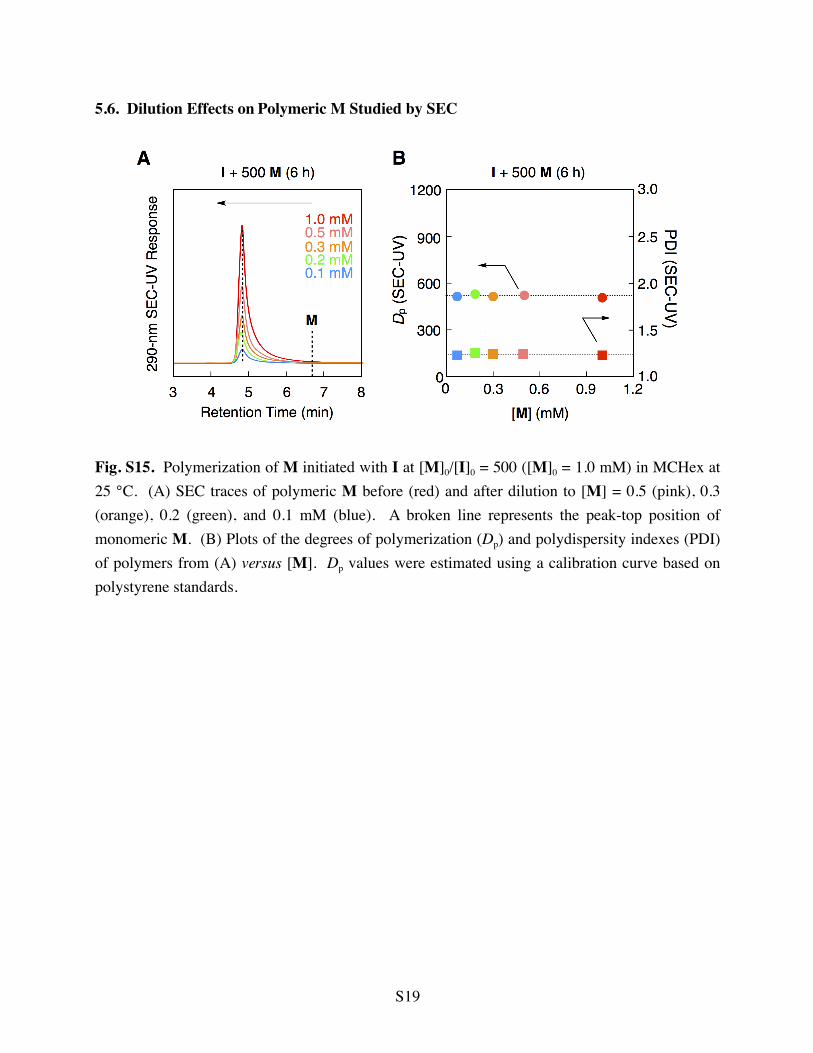
5.6. Dilution Effects on Polymeric M Studied by SEC
Fig. S15. Polymerization of M initiated with I at [M]0/[I]0 = 500 ([M]0 = 1.0 mM) in MCHex at 25 °C. (A) SEC traces of polymeric M before (red) and after dilution to [M] = 0.5 (pink), 0.3 (orange), 0.2 (green), and 0.1 mM (blue). A broken line represents the peak-top position of monomeric M. (B) Plots of the degrees of polymerization (Dp) and polydispersity indexes (PDI) of polymers from (A) versus [M]. Dp values were estimated using a calibration curve based on polystyrene standards.

S20
5.7 Effects of Thermal Annealing on Polymeric M Studied by SEC
Fig. S16. SEC-UV traces at 290 nm of polymerized mixtures of M formed with I at [M]0/[I]0 = 500 ([M]0 = 1.0 mM) in MCHex at 25 °C before (black) and after heating at 100 ºC for 1 h and subsequent cooling to 25 ºC at rates of 1.0 °C min–1 (blue) and 20 °C min–1 (red). A broken line represents the peak-top position of monomeric M.

S21
5.8. Effects of CHCl3 on Polymeric M Studied by DLS
Fig. S17. DLS profiles of polymerized mixtures of M formed with I at [M]0/[I]0 = 500 ([M]0 = 1.0 mM) in MCHex at 25 °C before (red) and after 10-fold dilution with CHCl3 (blue).
S22
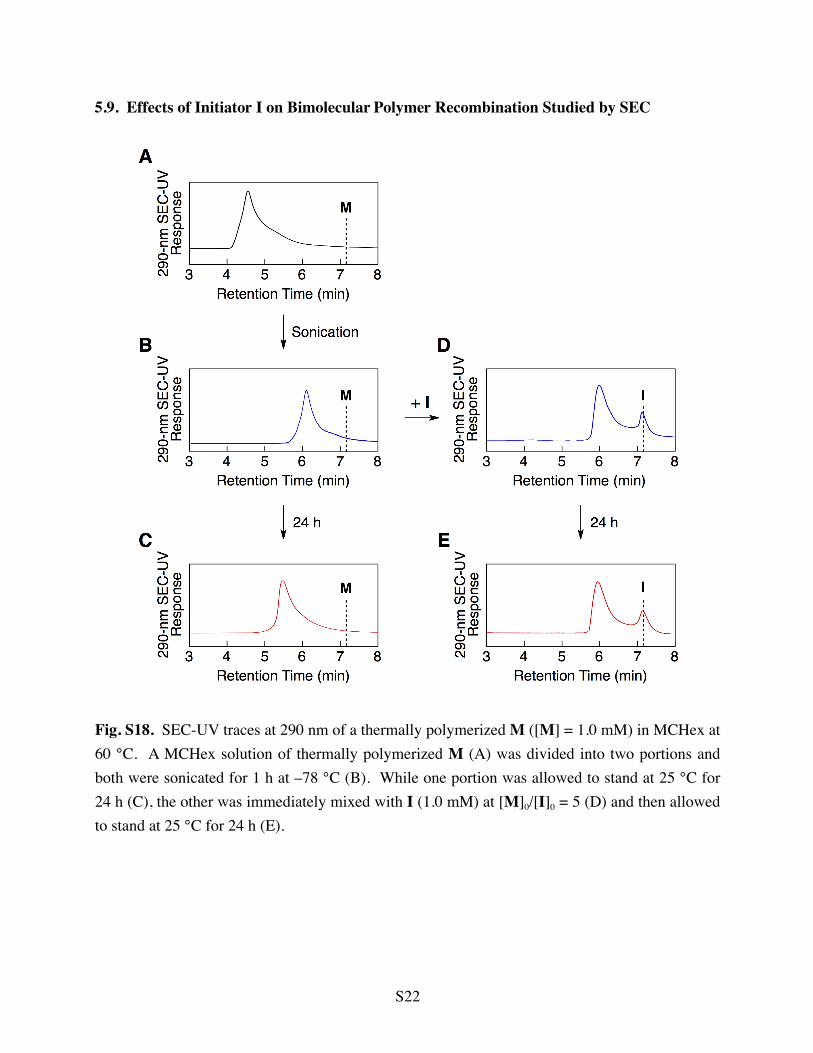
5.9. Effects of Initiator I on Bimolecular Polymer Recombination Studied by SEC
Fig. S18. SEC-UV traces at 290 nm of a thermally polymerized M ([M] = 1.0 mM) in MCHex at 60 °C. A MCHex solution of thermally polymerized M (A) was divided into two portions and both were sonicated for 1 h at –78 °C (B). While one portion was allowed to stand at 25 °C for 24 h (C), the other was immediately mixed with I (1.0 mM) at [M]0/[I]0 = 5 (D) and then allowed to stand at 25 °C for 24 h (E).

S23
5.10. Polymerization of MR (MS) with IR (IS) Studied by CD Spectroscopy
Fig. S19. Time-dependent CD spectra at 25 °C in MCHex of polymeric MR formed with IR at [MR]0/[IR]0 = 500 ([MR]0 = 1.0 mM) in 0 (black), 1 (blue), 2 (cyan), 3 (green), 4 (orange), and 5 h (red). A broken curve represents the CD spectrum of polymeric MS formed with IS in 5 h under conditions otherwise identical to the above.

S24
5.11. Polymerizations of M, MR, and MS with IR Studied by CD Spectroscopy
Fig. S20. Time-dependent changes in [θ] at 290 nm ([θ]290) upon mixing IR with M (black), MR (red), and MS (blue) at [monomer]/[IR] = 500 ([monomer] = 1.0 mM) in MCHex at 25 °C.

S25
5.12. FT-IR and VCD Characterizations of Polymeric M, MR, and MS
Fig. S21. Experimental VCD (upper) and FT-IR (lower) spectra at 25 °C of (A) polymerized mixtures of M with IR (red) and IS (blue), and (B) those of MR with IR (red) and of MS with IS (blue) in MCHex. (C) Theoretical VCD (upper) and FT-IR (lower) spectra of trimeric M’ adopting a clockwise geometry of corannulenes and a clockwise array of intermolecular H-bonds (blue), and its enantiomeric form (red) obtained by a time-dependent DFT method at B3LYP/6-31g(d) level. The frequencies were scaled with a factor 0.96, and a bandwidth of 6 cm–1 was employed. Note that DFT calculation at DFT-D3(BJ)-TPSS/def2-TZVP level was used for the structural optimization of trimeric M’.

S26
5.13. SEC Characterization of Polymeric MS Formed with IS
Fig. S22. SEC-UV trace at 290 nm of polymeric MS formed with IS at [MS]0/[IS]0 = 500 ([M]0 = 1.0 mM) in MCHex at 25 °C.
S27
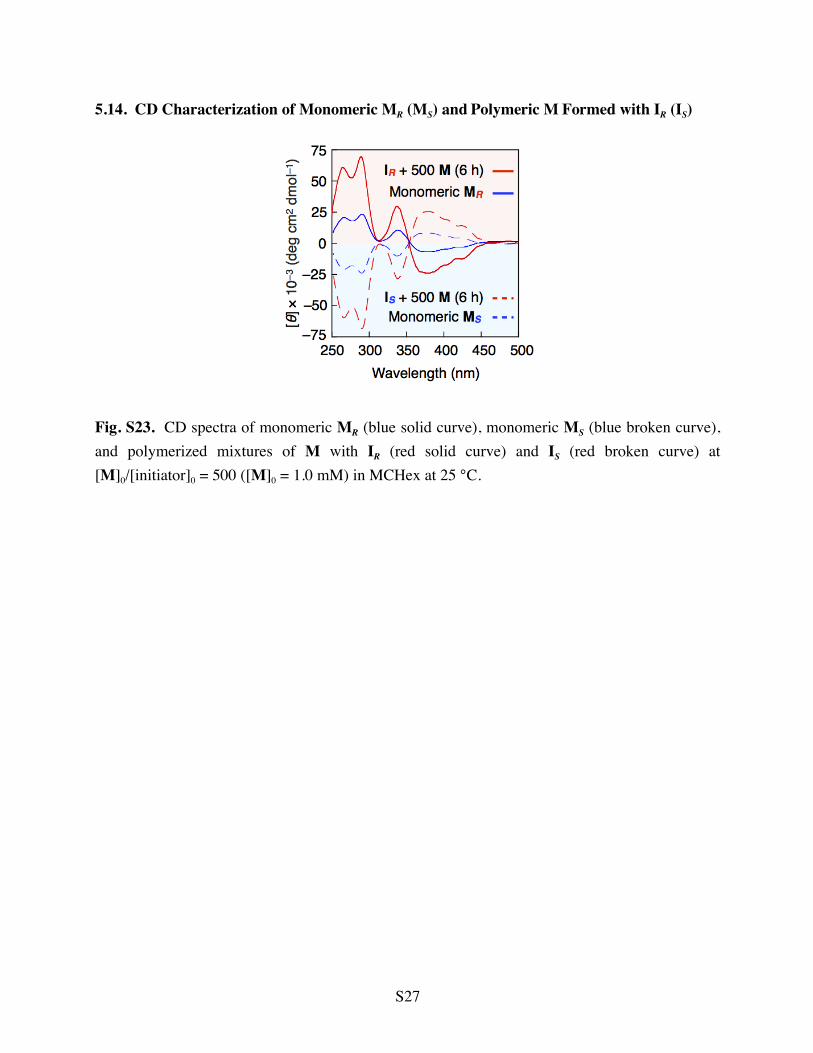
5.14. CD Characterization of Monomeric MR (MS) and Polymeric M Formed with IR (IS)
Fig. S23. CD spectra of monomeric MR (blue solid curve), monomeric MS (blue broken curve), and polymerized mixtures of M with IR (red solid curve) and IS (red broken curve) at [M]0/[initiator]0 = 500 ([M]0 = 1.0 mM) in MCHex at 25 °C.
S28
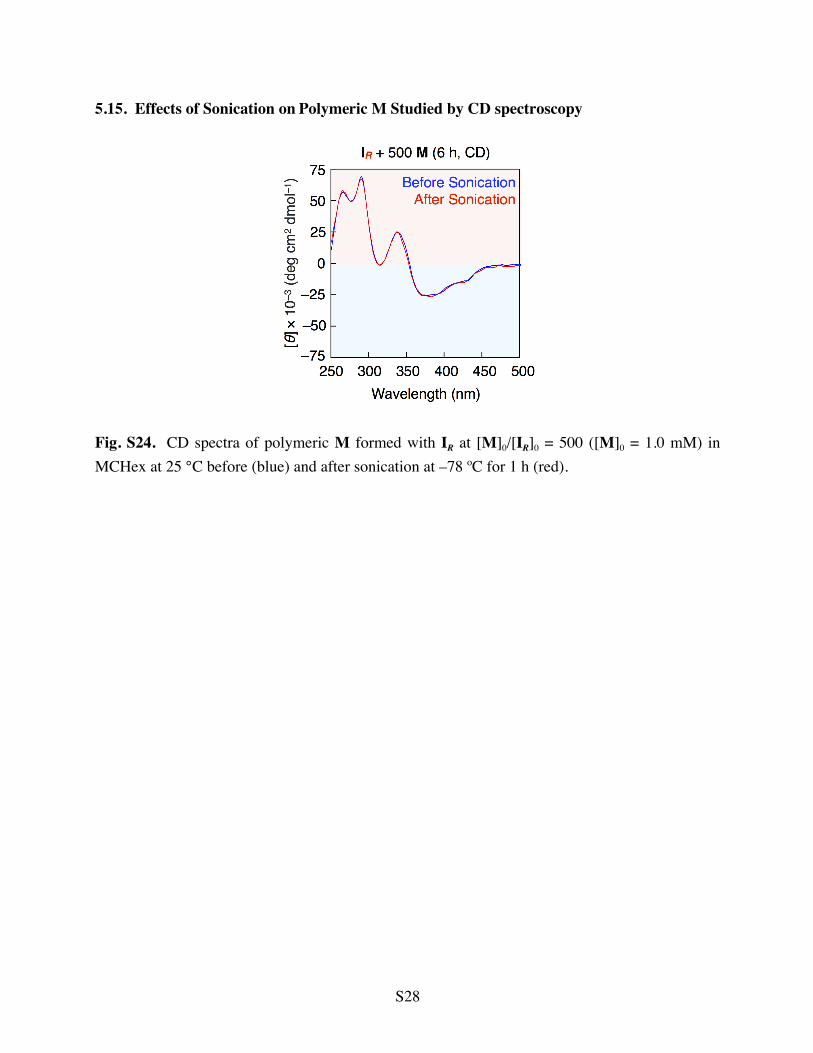
5.15. Effects of Sonication on Polymeric M Studied by CD spectroscopy
Fig. S24. CD spectra of polymeric M formed with IR at [M]0/[IR]0 = 500 ([M]0 = 1.0 mM) in MCHex at 25 °C before (blue) and after sonication at –78 ºC for 1 h (red).

S29
5.16. SEC Characterization of Polymerized Mixtures of MR with IR and of Mrac with IR
Fig. S25. SEC-UV (upper) and SEC-CD (lower) traces at 290 nm of (A) polymerized mixtures of Mrac formed with IR at [Mrac]0/[IR]0 = 500 ([Mrac]0 = 1.0 mM) in 6 h (black) and 14 days (red), and (B) those of a polymerized mixture of MR formed with IR at [Mrac]0/[IR]0 = 250 ([MR]0 = 0.5 mM) in 6 h (red) together with those of monomeric MS ([MS]= 0.5 mM) (blue) and black SEC-UV and SEC-CD traces in (A).
S30
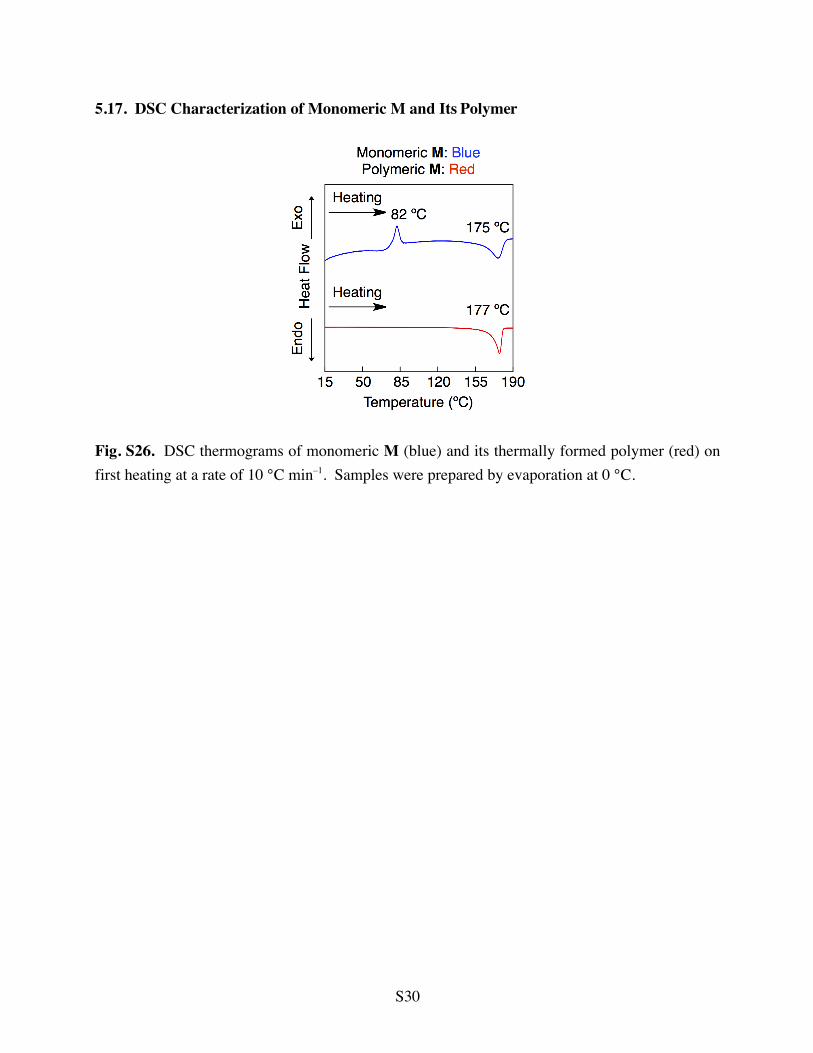
5.17. DSC Characterization of Monomeric M and Its Polymer
Fig. S26. DSC thermograms of monomeric M (blue) and its thermally formed polymer (red) on first heating at a rate of 10 °C min–1. Samples were prepared by evaporation at 0 °C.
S31
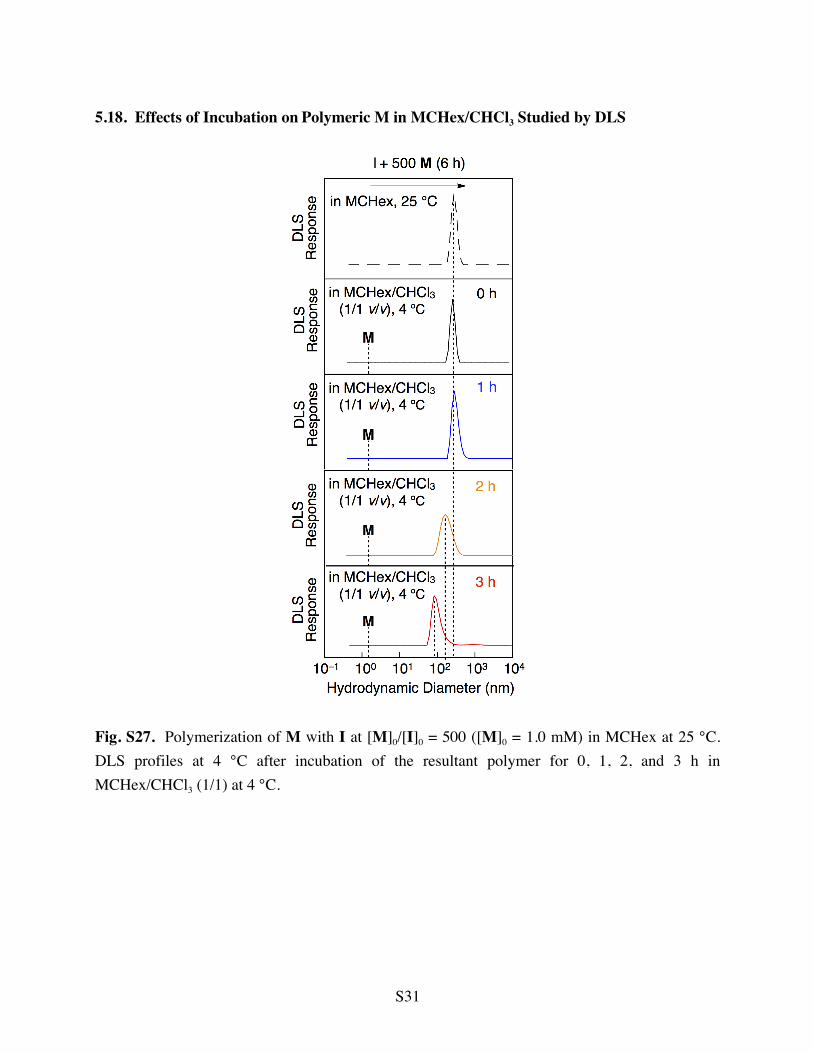
5.18. Effects of Incubation on Polymeric M in MCHex/CHCl3 Studied by DLS
Fig. S27. Polymerization of M with I at [M]0/[I]0 = 500 ([M]0 = 1.0 mM) in MCHex at 25 °C. DLS profiles at 4 °C after incubation of the resultant polymer for 0, 1, 2, and 3 h in MCHex/CHCl3 (1/1) at 4 °C.
S32
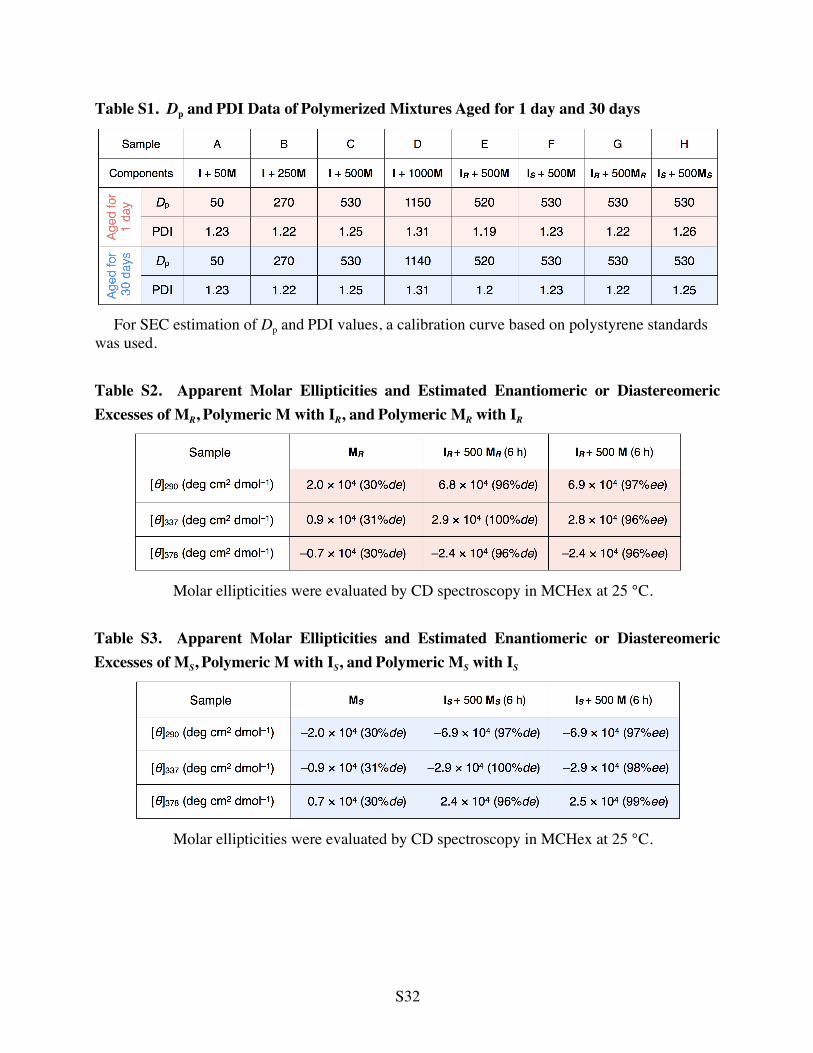
Table S1. Dp and PDI Data of Polymerized Mixtures Aged for 1 day and 30 days
For SEC estimation of Dp and PDI values, a calibration curve based on polystyrene standards
was used. Table S2. Apparent Molar Ellipticities and Estimated Enantiomeric or Diastereomeric Excesses of MR, Polymeric M with IR, and Polymeric MR with IR
Molar ellipticities were evaluated by CD spectroscopy in MCHex at 25 °C.
Table S3. Apparent Molar Ellipticities and Estimated Enantiomeric or Diastereomeric Excesses of MS, Polymeric M with IS, and Polymeric MS with IS
Molar ellipticities were evaluated by CD spectroscopy in MCHex at 25 °C.

S33
References and Notes
1. B. Ranby, in Macromolecular Concept and Strategy for Humanity in Science, Technology and
Industry (Springer, Berlin, 1996), pp. 3–13.
2. H. Staudinger, Über polymeriation. Ber. Deut. Chem. Ges. 53, 1073–1085 (1920).
3. P. J. Flory, Principles of Polymer Chemistry (Cornell Univ. Press, Ithaca, NY, 1969).
4. R. Mülhaupt, Hermann Staudinger and the origin of macromolecular chemistry. Angew. Chem.
Int. Ed. 43, 1054–1063 (2004). doi:10.1002/anie.200330070
5. H. Rehage, H. Hoffmann, Rheological properties of viscoelastic surfactant systems. J. Phys.
Chem. 92, 4712–4719 (1988). doi:10.1021/j100327a031
6. N. Zimmerman, J. S. Moore, S. C. Zimmerman, Polymer chemistry comes full circle. Chem.
Ind. 1998, 604–610 (1998).
7. J.-M. Lehn, Macromol. Chem. Macromol. Symp. 69, 1 (1993).
8. J.-M. Lehn, Supramolecular Chemistry-Concepts and Perspectives (Wiley-VCH, Weinheim,
Germany, ed. 1, 1995).
9. J.-M. Lehn, Supramolecular polymer chemistry—scope and perspectives. Polym. Int. 51, 825–
839 (2002). doi:10.1002/pi.852
10. R. P. Sijbesma, F. H. Beijer, L. Brunsveld, B. J. B. Folmer, J. H. K. K. Hirschberg, R. F. M.
Lange, J. K. L. Lowe, E. W. Meijer, Reversible polymers formed from self-
complementary monomers using quadruple hydrogen bonding. Science 278, 1601–1604
(1997). Medline doi:10.1126/science.278.5343.1601
11. T. F. A. De Greef, M. M. J. Smulders, M. Wolffs, A. P. H. J. Schenning, R. P. Sijbesma, E.
W. Meijer, Supramolecular polymrization. Chem. Rev. 109, 5687–5754 (2009). Medline
doi:10.1021/cr900181u
12. C. Fouquey, J.-M. Lehn, A.-M. Levelut, Molecular recognition directed self-assembly of
supramolecular liquid crystalline polymers from complementary chiral components. Adv.
Mater. 2, 254–257 (1990). doi:10.1002/adma.19900020506
13. X. Wang, G. Guerin, H. Wang, Y. Wang, I. Manners, M. A. Winnik, Cylindrical block
copolymer micelles and co-micelles of controlled length and architecture. Science 317,
644–647 (2007). Medline doi:10.1126/science.1141382
14. J. B. Gilroy, T. Gädt, G. R. Whittell, L. Chabanne, J. M. Mitchels, R. M. Richardson, M. A.
Winnik, I. Manners, Monodisperse cylindrical micelles by crystallization-driven living
self-assembly. Nat. Chem. 2, 566–570 (2010). Medline doi:10.1038/nchem.664
15. W. Zhang, W. Jin, T. Fukushima, A. Saeki, S. Seki, T. Aida, Supramolecular linear
heterojunction composed of graphite-like semiconducting nanotubular segments. Science
334, 340–343 (2011). Medline doi:10.1126/science.1210369
16. S. Ogi, K. Sugiyasu, S. Manna, S. Samitsu, M. Takeuchi, Living supramolecular
polymerization realized through a biomimetic approach. Nat. Chem. 6, 188–195 (2014).
Medline doi:10.1038/nchem.1849
17. G. Odian, Principles of Polymerization (Wiley-VCH, New York, ed. 4, 2004).

S34
18. J. Kang, D. Miyajima, Y. Itoh, T. Mori, H. Tanaka, M. Yamauchi, Y. Inoue, S. Harada, T.
Aida, C₅-symmetric chiral corannulenes: Desymmetrization of bowl inversion
equilibrium via “intramolecular” hydrogen-bonding network. J. Am. Chem. Soc. 136,
10640–10644 (2014). Medline doi:10.1021/ja505941b
19. Y. T. Wu, J. S. Siegel, Aromatic molecular-bowl hydrocarbons: Synthetic derivatives, their
structures, and physical properties. Chem. Rev. 106, 4843–4867 (2006). Medline
doi:10.1021/cr050554q
20. V. M. Tsefrikas, L. T. Scott, Geodesic polyarenes by flash vacuum pyrolysis. Chem. Rev.
106, 4868–4884 (2006). Medline doi:10.1021/cr050553y
21. R. Schmidt, M. Stolte, M. Grüne, F. Würthner, Hydrogen-bond-directed formation of
supramolecular polymers incorporating head-to-tail oriented dipolar merocyanine dyes.
Macromolecules 44, 3766–3776 (2011). doi:10.1021/ma2004184
22. Y. Ishida, T. Aida, Homochiral supramolecular polymerization of an “S”-shaped chiral
monomer: Translation of optical purity into molecular weight distribution. J. Am. Chem.
Soc. 124, 14017–14019 (2002). Medline doi:10.1021/ja028403h
23. D. Miyajima, K. Tashiro, F. Araoka, H. Takezoe, J. Kim, K. Kato, M. Takata, T. Aida,
Liquid crystalline corannulene responsive to electric field. J. Am. Chem. Soc. 131, 44–45
(2009). Medline doi:10.1021/ja808396b
24. P. A. Korevaar, S. J. George, A. J. Markvoort, M. M. Smulders, P. A. Hilbers, A. P.
Schenning, T. F. De Greef, E. W. Meijer, Pathway complexity in supramolecular
polymerization. Nature 481, 492–496 (2012). Medline doi:10.1038/nature10720
25. M.-I. Childers, J. M. Longo, N. J. Van Zee, A. M. LaPointe, G. W. Coates, Stereoselective
epoxide polymerization and copolymerization. Chem. Rev. 114, 8129–8152 (2014).
Medline doi:10.1021/cr400725x
26. F. Helmich, M. M. J. Smulders, C. C. Lee, A. P. H. J. Schenning, E. W. Meijer, Effect of
stereogenic centers on the self-sorting, depolymerization, and atropisomerization kinetics
of porphyrin-based aggregates. J. Am. Chem. Soc. 133, 12238–12246 (2011). Medline
doi:10.1021/ja204543f
27. Y. Okamoto, T. Nakano, Asymmetric polymerization. Chem. Rev. 94, 349–372 (1994).
doi:10.1021/cr00026a004
28. N. Berova, K. Nakanishi, R. W. Woody, Circular Dichroism: Principles and Applications
(Wiley-VCH, New York, ed. 2, 2000).
29. M. M. J. Smulders, T. Buffeteau, D. Cavagnat, M. Wolffs, A. P. Schenning, E. W. Meijer,
C3-symmetrical self-assembled structures investigated by vibrational circular dichroism.
Chirality 20, 1016–1022 (2008). Medline doi:10.1002/chir.20568
30. W. Hirahata, R. M. Thomas, E. B. Lobkovsky, G. W. Coates, Enantioselective
polymerization of epoxides: A highly active and selective catalyst for the preparation of
stereoregular polyethers and enantiopure epoxides. J. Am. Chem. Soc. 130, 17658–17659
(2008). Medline doi:10.1021/ja807709j
S35
31. K. R. Brunden, Y. Uratani, W. A. Cramer, Dependence of the conformation of a colicin E1
channel-forming peptide on acidic pH and solvent polarity. J. Biol. Chem. 259, 7682–
7687 (1984). Medline
32. N. J. Greenfield, Using circular dichroism collected as a function of temperature to determine
the thermodynamics of protein unfolding and binding interactions. Nat. Protoc. 1, 2527–
2535 (2007). Medline doi:10.1038/nprot.2006.204
33. J. M. Scholtz, S. Marqusee, R. L. Baldwin, E. J. York, J. M. Stewart, M. Santoro, D. W.
Bolen, Calorimetric determination of the enthalpy change for the alpha-helix to coil
transition of an alanine peptide in water. Proc. Natl. Acad. Sci. U.S.A. 88, 2854–2858
(1991). Medline doi:10.1073/pnas.88.7.2854
34. M. J. Frisch et al., Gaussian 09, revision D.01 (2009).