Embed Size (px)
Citation preview

Supply Chain Management
Lecture 7

Outline
• Homework 1• Today
– Introduction to Excel Solver– Start with Chapter 5
• Thursday– Chapter 5
• Skipping sections– Locating to Split the Market (3e: p. 120, 4e: p. 112)– Gravity Location Models (3e: p. 129-131, 4e: p.120-122)– Locating Plants and Warehouses Simultaneously (3e: p. 138-139, 4e: 129-131)– Accounting for Taxes, Tariffs and Customer Requirements (3e: p. 139-140, 4e p. 131-
132)
– Start with Chapter 6?– Homework 2

Design Options For a Distribution Network
Retailer
Manufacturers
Consumers
RetailerMergers
Consumers
Manufacturers
DistributorWarehouse
Manufacturers
Consumers
DistributorWarehouse
DistributorWarehouse
Manufacturers
Consumers
DistributorWarehouse
DistributorWarehouse
Manufacturers
Consumers
DistributorWarehouse
Retailer
Consumers
RetailerRetailer
DistributorWarehouse
Manufacturers
DistributorWarehouse
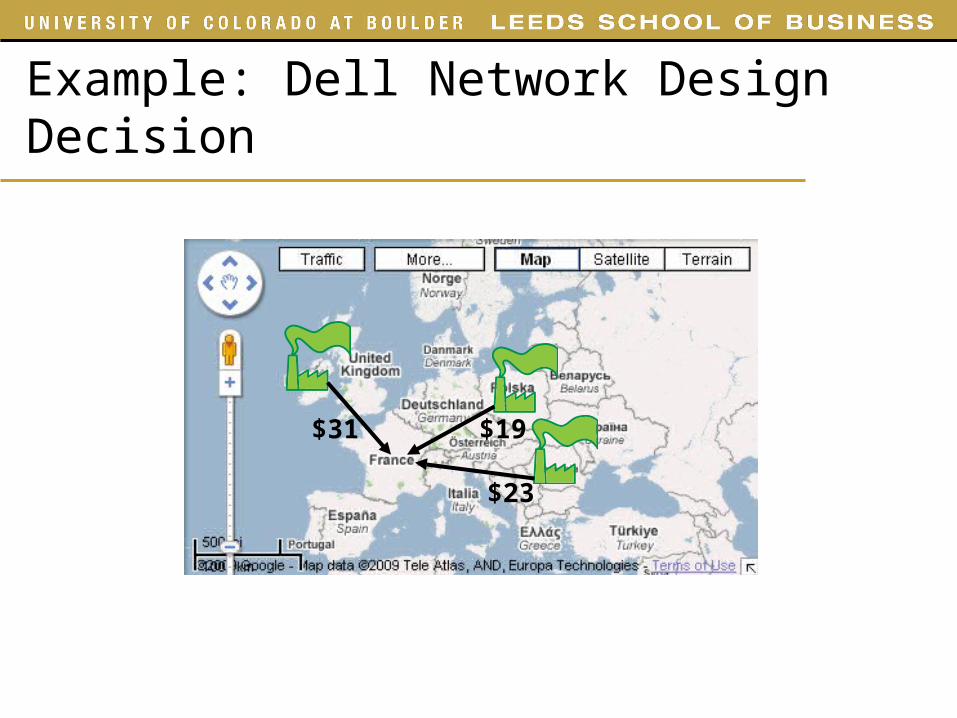
Example: Dell Network Design Decision
$19
$23
$31

Example: Dell Network Design Decision
Romenia Poland IrelandFrance 23 19 31Germany 9 15 11Italy 23 21 40Spain 29 26 40United Kingdom 33 36 20
Romenia Poland Ireland DemandFrance 23 19 31 15,000.00Germany 9 15 11 20,000.00Italy 23 21 40 13,000.00Spain 29 26 40 12,000.00United Kingdom 33 36 20 19,000.00
Romenia Poland Ireland DemandFrance 23 19 31 15,000.00Germany 9 15 11 20,000.00Italy 23 21 40 13,000.00Spain 29 26 40 12,000.00United Kingdom 33 36 20 19,000.00Capacity 80,000 80,000 80,000Cost 18,000,000.00$ 17,500,000.00$ 24,500,000.00$

What is an Optimization Problem• Generally, an optimization problem seeks a
solution where decisions need to be made in a constrained or limited resource environment– Most supply chain optimization problems require
matching demand and supply when one, the other, or both may be limited
• An optimization problem comprises of three major components– Decision variables– Constraints– Objective

Introduction to Excel Solver
• Installing Excel Solver– Goto Tools > Add-ins…– Select “Solver Add-in” and press OK
• Opening Excel Solver– Goto Tools > Solver

Example: Profit Maximization Problem
• The Windsor Glass Company is planning to launch two new products.– 8 feet glass door with aluminum framing– 4x6 feet window with wood framing
• Management of the company wants to determine what mixture of both products would be most profitable

Example: Profit Maximization Problem
Plant 1(Aluminum frames)
Plant 2(Wood frames)
Plant 3(Glass and assembly)
Windsor Glass Company
8 Feet Aluminum Frame Doors
1 hour
3 hours
2 hours
Profits
$3,000Excess cap. 4 hours
Excess cap. 12 hours
Excess cap. 18 hours
2 hours $5,000
4x6 Wood Frame Windows

Windsor Glass Company Model
• Inputs
• Decision variables– Xdoors number of batches of doors produced
– Xwindows number of batches of windows produced
Production time per batch (hours)Plant 1 Plant 2 Plant 3 Profit per batch
Doors 1 0 3 $3,000Windows 0 2 2 $5,000Available time (hours) 4 12 18

Windsor Glass Company Model
• Objective function– Maximize
3000 Xdoors + 5000 Xwindows
Production time per batch (hours)Plant 1 Plant 2 Plant 3 Profit per batch
Doors 1 0 3 $3,000Windows 0 2 2 $5,000Available time (hours) 4 12 18

Windsor Glass Company Model
• Constraints– Hours available in Plant 1
Xdoors 4
– Hours available in Plant 22 Xwindows 12
– Hours available in Plant 33 Xdoors + 2 Xwindows 18
– Nonnegative production quantitiesXdoors 0, Xwindows 0
Production time per batch (hours)Plant 1 Plant 2 Plant 3 Profit per batch
Doors 1 0 3 $3,000Windows 0 2 2 $5,000Available time (hours) 4 12 18

Windsor Glass Company Model
• Decision variables– Xdoors number of batches of doors produced
– Xwindows number of batches of windows produced
• Objective function– Maximize 3000 Xdoors + 5000 Xwindows
• Constraints– Xdoors <= 4 (Available hours Plant 1)
– 2 Xwindows <= 12 (Available hours Plant 2)
– 3 Xdoors + 2 Xwindows <= 18 (Available hours Plant 3)
– Xdoors, Xwindows >= 0 (nonnegativity)

Windsor Glass Company Model
• Objective function– Maximize 3000 Xdoors + 5000 Xwindows
Objective functionMaximize profit =SUMPRODUCT(E4:E5,H4:H5)

Windsor Glass Company Model
• Constraints– X1 <= 4 (Available hours Plant 1)
– 2 X2 <= 12 (Available hours Plant 2)
– 3 X1 + 2 X2 <= 18 (Available hours Plant 3)
– X1, X2 >= 0 (nonnegativity)
• Constraints– 0 <= 4 - Xdoors (Available hours Plant 1)
– 0 <= 12 - 2 Xwindows (Available hours Plant 2)
– 0 <= 18 - 3 Xdoors - 2 Xwindows (Available hours Plant 3)
– Xdoors, Xwindows >= 0 (nonnegativity)Constraints
Plant 1DoorsWindowsAvailable time (hours) =B6-SUMPRODUCT(B4:B5,H4:H5)

Windsor Glass Company Model
• Decision variables– Xdoors number of batches of doors produced
– Xwindows number of batches of windows produced
• Objective function– Maximize 3000 Xdoors + 5000 Xwindows
• Constraints– 0 <= 4 - Xdoors (Available hours Plant 1)
– 0 <= 12 - 2 Xwindows (Available hours Plant 2)
– 0 <= 18 - 3 Xdoors - 2 Xwindows (Available hours Plant 3)
– Xdoors, Xwindows >= 0 (nonnegativity)

Windsor Glass Company Model using Excel Solver
Objective function
Decision variables
Constraints

Windsor Glass Company Model using Excel
Inputs VariablesProduction time per batch (hours)Plant 1 Plant 2 Plant 3 Profit per batch
Doors 1 0 3 $3,000 Doors 2Windows 0 2 2 $5,000 Windows 6Available time (hours) 4 12 18
ConstraintsPlant 1 Plant 2 Plant 3 Profit per batch
DoorsWindowsAvailable time (hours) 2 0 0
Objective functionMaximize profit 36,000$

Supply Chain Network Design Decisions
• Facility role– What role should each facility play? What processes are
performed at each facility?
• Facility location– Where should facilities be located?
• Capacity allocation– How much capacity should be allocated to each facility?
• Market and supply allocation– What markets should each facility serve? Which supply sources
should feed each facility?

Example: Dell Market Allocation
What are the decisions?
What are the constraints?

Example: Dell Market Allocation
What are the decisions?
What are the constraints?

Example: Dell Market Allocation
• Constraints (Satisfy demand at each market)– 0 = 15,000 - XIreland,France - XPoland,France - XRomenia,France
– 0 = 20,000 - XIreland,Germany - XPoland,Germany - XRomenia,Germany
– 0 = 13,000 - XIreland,Italy - XPoland,Italy - XRomenia,Italy
– 0 = 12,000 - XIreland,Spain - XPoland,Spain - XRomenia,Spain
– 0 = 19,000 - XIreland,UK - XPoland,UK - XRomenia,UK
Romenia Poland Ireland DemandFrance 23 19 31 15,000Germany 9 15 11 20,000Italy 23 21 40 13,000Spain 29 26 40 12,000United Kingdom 33 36 20 19,000

Example: Dell Market Allocation
What are the decisions?
What are the constraints?

Example: Dell Market Allocation
• Constraints (Capacity cannot be exceeded)– 0 30,000
- XRomenia,France - XRomenia,Germany - XRomenia,Italy - XRomenia,Spain - XRomenia,UK
– 0 30,000 - XPoland,France - XPoland,Germany - XPoland,Italy - XPoland,Spain - XPoland,UK
– 0 30,000 - XIreland,France - XIreland,Germany - XIreland,Italy - XIreland,Spain - XIreland,UK
Romenia Poland Ireland DemandFrance 23 19 31 15,000Germany 9 15 11 20,000Italy 23 21 40 13,000Spain 29 26 40 12,000United Kingdom 33 36 20 19,000Capacity 30,000 30,000 30,000

Example: Dell Facility Location
? ??
What are the decisions?
What are the constraints?

Example: Dell Facility Location
• Constraints (Satisfy demand at each market)– 0 = 15,000 - XIreland,France - XPoland,France - XRomenia,France
– 0 = 20,000 - XIreland,Germany - XPoland,Germany - XRomenia,Germany
– 0 = 13,000 - XIreland,Italy - XPoland,Italy - XRomenia,Italy
– 0 = 12,000 - XIreland,Spain - XPoland,Spain - XRomenia,Spain
– 0 = 19,000 - XIreland,UK - XPoland,UK - XRomenia,UK
Romenia Poland Ireland DemandFrance 23 19 31 15,000Germany 9 15 11 20,000Italy 23 21 40 13,000Spain 29 26 40 12,000United Kingdom 33 36 20 19,000

Example: Dell Facility Location
• Constraints (Capacity cannot be exceeded)– 0 30,000*YRomenia
- XRomenia,France - XRomenia,Germany - XRomenia,Italy - XRomenia,Spain - XRomenia,UK
– 0 30,000*YPoland - XPoland,France - XPoland,Germany - XPoland,Italy - XPoland,Spain - XPoland,UK
– 0 30,000*YIreland - XIreland,France - XIreland,Germany - XIreland,Italy - XIreland,Spain - XIreland,UK Romenia Poland Ireland Demand
France 23 19 31 15,000Germany 9 15 11 20,000Italy 23 21 40 13,000Spain 29 26 40 12,000United Kingdom 33 36 20 19,000Capacity 80,000 80,000 80,000Fixed operating cost 18,000,000.00$ 17,500,000.00$ 24,500,000.00$

Supply Chain Network Design Decisions
Site location matters. Indeed, it has become a more critical decision for supply chain leaders as supply chains have stretched, companies have expanded, and transportation costs have soared. Today, a poor location decision can have much greater and more immediate effects on operating efficiencies and cash flow.
Yet it is surprising how few of the executives responsible for the location of a new distribution center (DC) or production facility can explain the basic principles behind choosing the location. In fact, it is alarming that more and more business leaders are relying on the results of sophisticated computer analyses to make their location decisions without fully understanding the underlying logic—or its potential impact on their supply chains
Source: John T. Mentzer -- Supply Chain Management Review, 5/1/2008

Factor Influencing Network Design Decisions
• Customer response time– Maintain a balance between an inexpensive location and proximity
to customers. Don't get too close, or go too far away
Pull
PushLocal FG Inventory
Regional FG Inventory
Central FG Inventory
Custom production and Central Raw Material
Custom production and raw material at suppliers
High
Low
Cost
HighLow Response time
Central WIP Inventory
Regional WIP Inventory

Factor Influencing Network Design Decisions
• Logistics and facility costs– Inventory and facility costs increase as the number of facilities
increase– Transportation costs decrease (up to a point) as the number of
facilities increase
LogisticsCosts
Number of Facilities
Transportation Costs
Facility Costs
Logistics Costs
Inventory Costs

Factor Influencing Network Design Decisions
• Strategic factors
GlobalCustomers
Offshore<low-cost>
<exports only>Many Asian plants
Source<low-cost>
<global market>Nike plants in Korea
Regional Customers
Server<local market><avoid tariffs>
Suziki’s Indian ventureMaruti
Contributor<customization>
<development skills>Maruti
Lead<advanced technology>
Lockheed Martin’s JSF in Dallas
Outpost<access to
knowledge>Dell in Ireland
Strategic role

Factor Influencing Network Design Decisions
• Macroeconomic factors– Quotas, tariffs, and tax incentives
• Economic trade agreements: Nafta, EU, APTA, AFTZ
– Exchange rate and demand risk– Different states or countries often offer economic incentives to
companies that decide to set up shop there, including tax incentives and low-interest economic development loans
How can trade agreements influence the number of facilities in a supply chain?

Factor Influencing Network Design Decisions
• Political factors– Political stability
• Infrastructure factors– Availability of transportation terminals, labor
• Most of Amazon’s distribution centers are located near airports
• Competitive factors– Positive externalities (many stores in a mall makes it more
convenient for customers – one location for everything the customers need)
Should you locate your facility close to your competitors or far from them?

Factor Influencing Network Design Decisions
• Technological factors– Compare your supplies to the final product, considering whether
value, weight, volume or other factors change – Availability of production technologies– High or low fixed cost
• Semiconductor manufacturing takes place only in 5-6 countries worldwide (building one plant costs about 1 to 4 billion dollars)
Which products gain/lose weight in the production process?