Embed Size (px)
Citation preview
Supporting information
Mapping local electric fields in proteins at biomimetic interfaces
Gal Schkolnik1, Tillmann Utesch1, Johannes Salewski1, Katalin Tenger2, Diego Millo1, Anja Kranich1,
Ingo Zebger1, Claudia Schulz1, László Zimányi2, Gábor Rákhely3, Maria Andrea Mroginski1, Peter
Hildebrandt1*
1 Technische Universität Berlin, Institut für Chemie, Sekr. PC14, Straße des 17. Juni 135, D-10623
Berlin, Germany;
2 Institute of Biophysics, Biological Research Centre, H-6726 Szeged Temesvári krt. 62., Hungary;
3 Department of Biotechnology, University of Szeged, Közép fasor 52, H-6726 Szeged, Hungary
* Corresponding author. Email: [email protected]
Content:
1. Preparation of labelled proteins
2. Vibrational spectroscopy
3. Electrochemical measurements
4. Molecular dynamics simulations
Electronic Supplementary Material (ESI) for Chemical CommunicationsThis journal is © The Royal Society of Chemistry 2011
1. Preparation of labelled proteins
Cyt-c mutants were produced by site-directed mutagenesis and purified, according to procedures
previously described by Tenger et al.1,2. The plasmids containing the mutated genes for the expression
of the K8C and K39C mutant cytochromes c have been verified by sequencing. The final purity of the
protein was reached by chromatography on a CM-Sephadex C50 cation exchange matrix. The purity
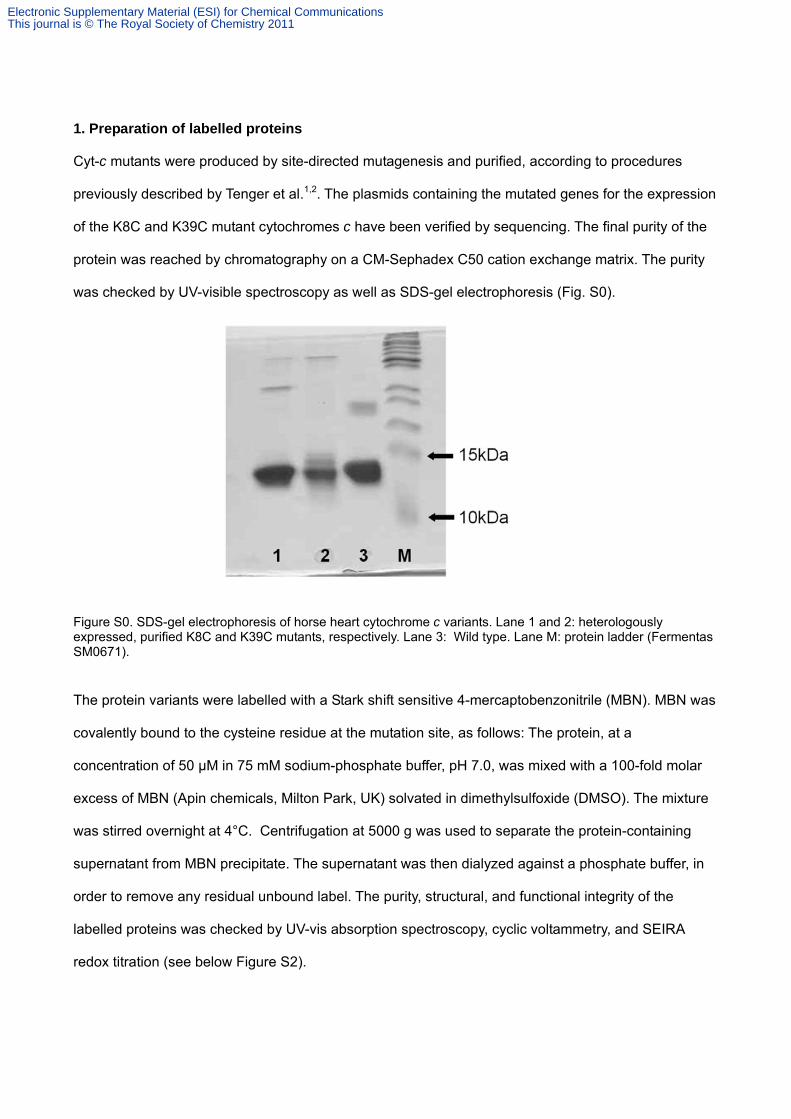
was checked by UV-visible spectroscopy as well as SDS-gel electrophoresis (Fig. S0).
Figure S0. SDS-gel electrophoresis of horse heart cytochrome c variants. Lane 1 and 2: heterologously expressed, purified K8C and K39C mutants, respectively. Lane 3: Wild type. Lane M: protein ladder (Fermentas SM0671).
The protein variants were labelled with a Stark shift sensitive 4-mercaptobenzonitrile (MBN). MBN was
covalently bound to the cysteine residue at the mutation site, as follows: The protein, at a
concentration of 50 µM in 75 mM sodium-phosphate buffer, pH 7.0, was mixed with a 100-fold molar
excess of MBN (Apin chemicals, Milton Park, UK) solvated in dimethylsulfoxide (DMSO). The mixture
was stirred overnight at 4°C. Centrifugation at 5000 g was used to separate the protein-containing
supernatant from MBN precipitate. The supernatant was then dialyzed against a phosphate buffer, in
order to remove any residual unbound label. The purity, structural, and functional integrity of the
labelled proteins was checked by UV-vis absorption spectroscopy, cyclic voltammetry, and SEIRA
redox titration (see below Figure S2).
Electronic Supplementary Material (ESI) for Chemical CommunicationsThis journal is © The Royal Society of Chemistry 2011

Sequence of Horse heart Cyt-c (according to pdb 1Akk)
1 GLY ASP VAL GLU LYS GLY LYS LYS ILE PHE 11 VAL GLN LYS CYS ALA GLN CYS HIS THR VAL 21 GLU LYS GLY GLY LYS HIS LYS THR GLY PRO 31 ASN LEU HIS GLY LEU PHE GLY ARG LYS THR 41 GLY GLN ALA PRO GLY PHE THR TYR THR ASP 51 ALA ASN LYS ASN LYS GLY ILE THR TRP LYS 61 GLU GLU THR LEU MET GLU TYR LEU GLU ASN 71 PRO LYS LYS TYR ILE PRO GLY THR LYS MET 81 ILE PHE ALA GLY ILE LYS LYS LYS THR GLU 91 ARG GLU ASP LEU ILE ALA TYR LEU LYS LYS 101 ALA THR ASN GLU red: lysine residues that were mutated; yellow: Cys residues that covalently bind the heme; blue: axial ligands of the heme
Chemicals. 6-Mercaptohexanoic acid (C5), Dojindo, was used without further purification. The water
used in all experiments was purified by a Millipore system and its resistance was greater than 18 MΩ.
Di-potassium hydrogen phosphate (K2HPO4, ≥ 99%) and potassium di-hydrogen phosphate (KH2PO4,
≥ 99%) were purchased from Merck.
2. Vibrational spectroscopy
2.1 IR transmission measurements
IR transmission spectra were recorded with a spectral resolution of 4 cm-1 using a Bruker Tensor 27
spectrometer, equipped with a liquid nitrogen-cooled photoconductive MCT detector. The sample
compartment was purged with dried air. The sample was held in a temperature-controlled (10°C) gas-
tight IR cell for liquid samples (volume ~ 7 µL, path length = 50 µm), equipped with CaF2 windows.
20,000 scans were accumulated for each spectrum.
2.2 SEIRA measurements
SEIRA measurements were performed using a Kretschmann-ATR configuration using a hemi-
Electronic Supplementary Material (ESI) for Chemical CommunicationsThis journal is © The Royal Society of Chemistry 2011
cylindrical shaped silicone (Si) crystal (20 × 25 × 10 mm of W × L × H) under an angle of incidence of
60°. Thin, nano-structured gold (Au) films were formed on the polished surface of the Si substrate by
electroless (chemical) deposition.3 The formation of SAMs followed a protocol previously described.4
For the immobilization of both Cyt-c variants, the 6-mercaptohexanoic acid SAM coated gold film was
immersed in a 2 µM Cyt-c solution. SEIRA spectra were recorded at a range from 4000 to 1000 cm-1,
with a spectral resolution of 4 cm-1 on a Bruker IFS66v/s spectrometer equipped with a
photoconductive MCT detector. 400 scans were co-added for each spectrum; three to five spectra
were recorded for each experiment and averaged. A representative SEIRA spectrum is shown in Fig.
S1.
For SEIRA measurements at an applied potential (Fig. S2), the ATR crystal was incorporated in a
three-electrode home-built cell, constructed based on a previously published design.5 The Au-film on
the ATR crystal, a Pt wire, and a Ag/AgCl (3 M KCl) electrode served as working, counter, and
reference electrode, respectively. Electrode potentials were controlled by an Autolab PGSTAT 12
potentiostat.6
IR transmission experiments were repeated twice, and SEIRA experiments 3-4 times, for each Cyt-c
variant. Average values are reported. The corresponding standard deviation for IR transmission
measurements is 0.15 cm-1 for both mutants, and for SEIRA 0.4 cm-1 for K39C and 0.9 cm-1 for K8C.
All measurements were performed at 10° C, in a 10 mM potassium phosphate buffer, corresponding to
an ionic strength of 22 mM, at pH 7.0. Accordingly, the reciprocal Debye length is calculated to be
5x10⁸ m-1.
For both variants, in the SEIRA experiments the vibrational stretching band of the CN label slowly
disappears upon attachment of the protein to the SAM, notably at a rate ca. 5 times faster for the K8C
compared to the K39C variant. We attribute this effect to the cleavage of the bound label by reactive
oxygen species generated in the electrode/electrolyte interface. This unwanted side reaction would
require only traces of oxygen, which could not be avoided within the present experimental setup.
Electronic Supplementary Material (ESI) for Chemical CommunicationsThis journal is © The Royal Society of Chemistry 2011
2.3. Data analysis
IR and SEIRA spectra were either analysed using the second derivative or by fits of Gaussian
functions to the spectra after background subtraction. Both approaches yield identical results. Note
that there are variations in the shape of the peak indicating a (asymmetric) broadening. Thus,
satisfactory fits required in some cases additional Gaussian functions albeit with weak amplitudes. For
the analysis, only the main peak frequency was considered. As a consequence of these changes from
experiment to experiment, the variation of the nitrile stretching frequency determined form the IR and
SEIRA spectra was ±0.15 for the IR, ±0.4 for K39C SEIRA and ±0.9 for K8C SEIRA measurements.
Non-covalently bound MBN displays a band at a frequency (ca. 2225 cm-1, attributed to solid MBN,
see Figure S3 for a Raman spectrum of solid MBN.) that is distinctly lower than that of the covalently
bound label. The solid MBN occurs due to precipitation of this rather water-insoluble compound, and
the corresponding band disappears upon repeated centrifugation and dialysis. Thus, the purity of the
labelled protein can readily be checked on the basis of the IR spectra.
2.4. Raman spectroscopy
Raman spectra of MBN were obtained with 1064-nm excitation using an RFS-Raman spectrometer
(Bruker Optics). The laser power at the sample was 80 mW and the resolution 4 cm-1; the
accumulation time was ca. 1 h (Fig. S3).
3. Electrochemical measurements
Cyclic voltammograms of the labelled K39C and K8C variants were carried out as described
previously6 (Fig. S2).
Electronic Supplementary Material (ESI) for Chemical CommunicationsThis journal is © The Royal Society of Chemistry 2011
4. MD Simulations
4.1. Preparation of Cytochrome c mutants
All calculations have been based on the minimized NMR structure of reduced horse-heart cytochrome
c (PDB accession code 2FRC).7 Two single mutations of Lys-8 and Lys-39 to cysteine, labelled with
MBN, were incorporated into the structure with the CHARMM package.8 These modified structures are
denoted as MBN-labelled K8C and MBN-labelled K39C. In order to be consistent with the
CHARMM22 force field,9 we have used the CHARMM partial charges of phenylalanine for the
benzene ring, the disulfide patch for the disulfides and the standard amino acid backbone for the
backbone. The nitrile charges were derived by density functional theory (B3LYB/6-31g(d)) calculations
of MBN, employing the GAUSSIAN 09.10 The charges of the benzene ring carbons linked to the nitrile
and sulfur were adjusted manually, in order to maintain charge neutrality for the label (Table S1). The
modified protein structures were protonated according to pH 7 with the CHARMM package.8 The
histidine residues were protonated on the Nδ atoms unless the environment suggested another
configuration. The heme cofactor (taken to be reduced) was simulated with the CHARMM parameter
set.9 For both protein variants, the charge was +7e.
4.2. Preparation of the SAM and surface systems
For the self-assembled monolayer (SAM) of 6-mercaptohexanoic acid, the CHARMM force field of
lipids11 was used, but the SAM sulfur atoms and the gold layer were handled as uncharged fixed
bodies in order to maintain the separation of 4.96 Å between the sulfur atoms.12 The protonation level
of the carboxyl head-groups was set to 92%, which resulted in a total charge of -30 e for the surface.
The initial orientation of the mutants on the surface was chosen according to the protein dipole
moment calculated with VMD 1.8.7.13 These settings assume a strong electrostatically driven
adsorption of cytochrome c on the SAM. In the initial structure, the separation distance between the
mutants and the SAM was set to 5 Å.
Electronic Supplementary Material (ESI) for Chemical CommunicationsThis journal is © The Royal Society of Chemistry 2011
4.3. Molecular dynamics (MD) simulations
MD simulations of the MBN-labelled K8C and MBN-labelled K39C mutants in solution and on the SAM
covered gold surface were performed with NAMD 2.614 using the CHARMM22 force-field.9 The
systems were solvated with TIP3 water15 and Na+ and Cl- ions were inserted with the VMD 1.8.7
package13 to gain a neutrally charged system with an ionic strength of ~50 mM, close to the value
used in experiments. The systems of more than 42,000 atoms were minimized and heated to 300 K.
Following an equilibration of 100 ps, we performed 10 ns long NVT Langevin piston dynamics with a
time-step of 2 fs enabled by rigid bonds to all hydrogens.16 The simulations were carried out under
periodic boundary conditions with a simple cut-off of 12 Å for vdW interactions and the particle-mesh
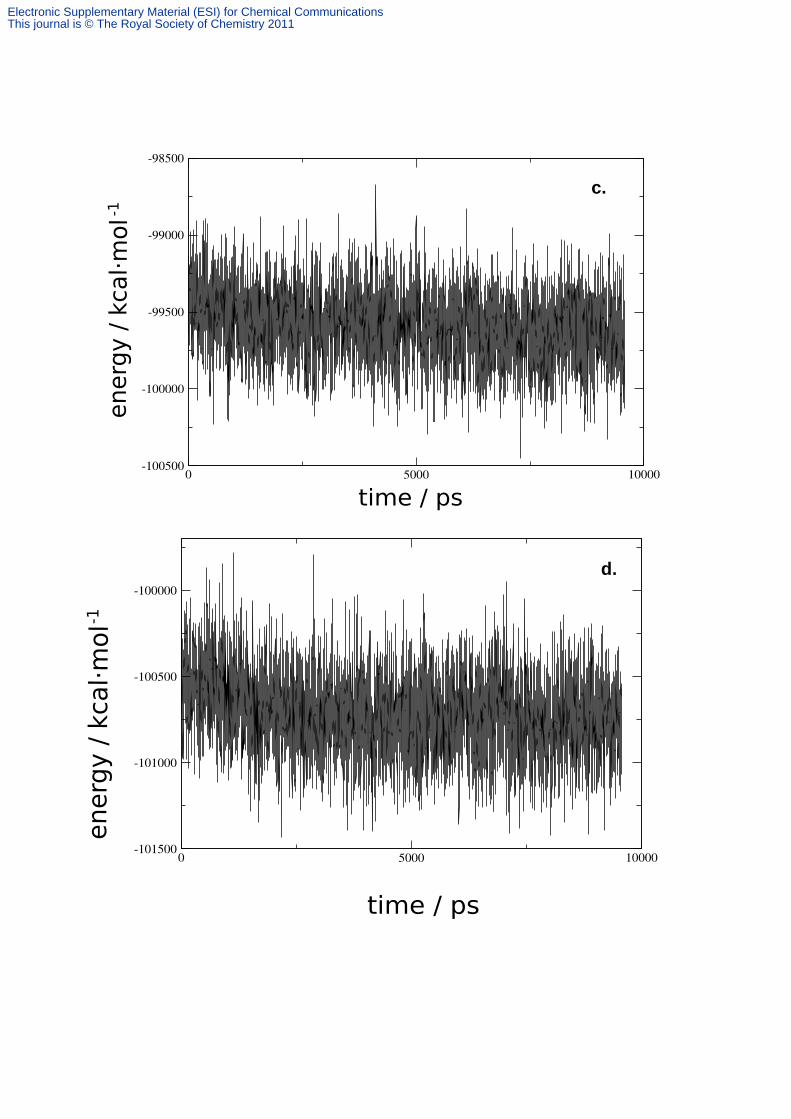
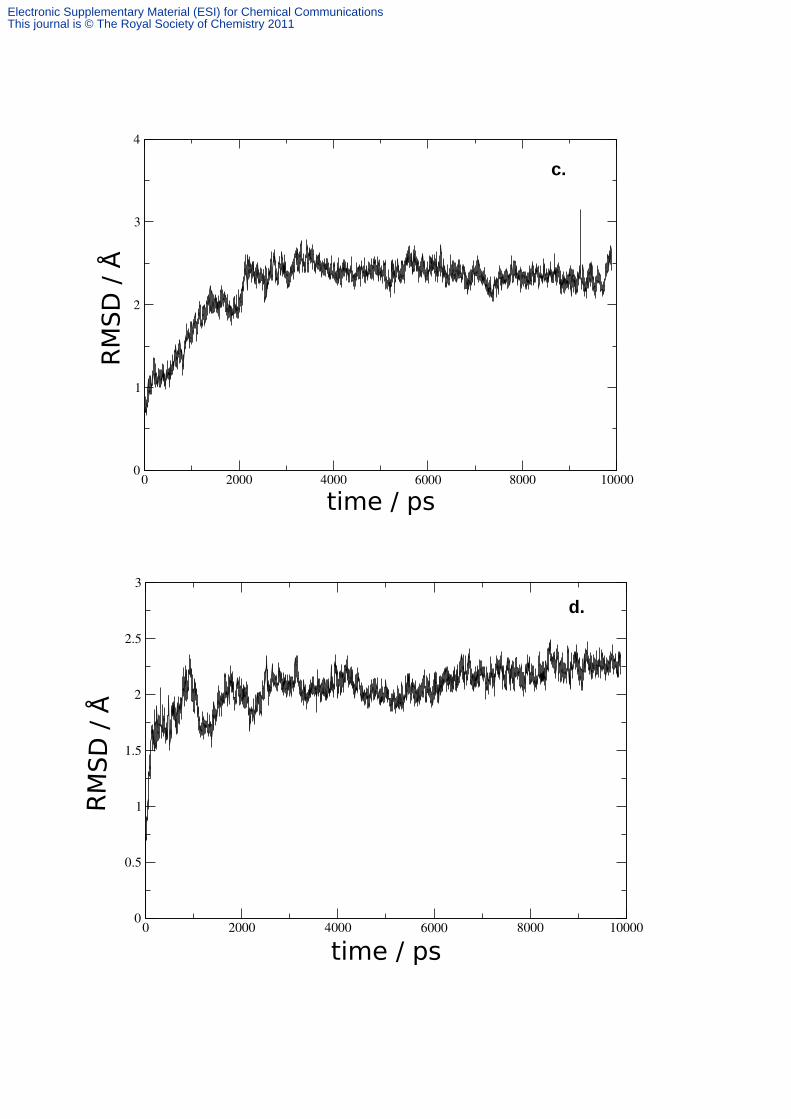
Ewald (PME) summation for long-range electrostatics.17 According to energy and rmsd analysis, the
whole system and the protein kept stable during all simulations (Figs. S4 and S5). During the last 5 ns
of simulations of Cytochrome c mutants on the surface, where the protein is equilibrated (Fig. S5),
minimal distances between the CN label and the gold slab and angles between the heme plane and
the surface normal or the CN label were averaged (Table S1, Figs. S6 and S7).
The MD simulations indicate that the nitrile label is solvent exposed in both variants as illustrated in
Fig. S8.
References
1. Tenger, K.; Khoroshyy, P.; Kovács, K. L.; Zimányi, L.; Rákhely, G.; Acta Biol. Hung. 2007, 58
(Suppl.), 23–35.
2. Tenger, K.; Khoroshyy, P.; Rákhely, G.; Zimányi, L.; J Bioenerg. Biomembr. 2010, 42,125–133.
3. Miyake, H.; Ye, S.; Osawa, M. Electrochemistry Communications 2002, 4(12), 973–977.
4. Murgida, D.H.; Hildebrandt, P. J. Phys. Chem. B 2001, 105, 1578–1586.
5. Ataka, K.; Heberle, J. Anal. Bioanal. Chem. 2007, 388, 47–54.
6. Wisitruangsakul, N.; Zebger, I.; Ly, K.H.; Murgida, D.H.; Egkasit, S.; Hildebrandt, P. Phys. Chem.
Chem. Phys. 2008, 10, 5276–5286.
7. Xiurong Qi, P.; Beckman, R.A.; Wand, A.J. Biochemistry 1996, 35, 12275–12286.
Electronic Supplementary Material (ESI) for Chemical CommunicationsThis journal is © The Royal Society of Chemistry 2011
8. Brooks, B.R.; Bruccoleri, R.E.; Olafson, B.D.; States, D.J.; Swaminathan, S.; Karplus, M. J.
Comput. Chem. 1983, 4(2),187–217.
9. MacKerell, Jr., A. D.; Bashford, D.; Bellott, M.; Dunbrack, Jr., R. L.; Evanseck, J. D.; Field, M. J.;
Fischer, S.; Gao, J.; Guo, H.; Ha, S.; Joseph-McCarthy, D.; Kuchnir, L.; Kuczera, K.; Lau, F. T. K.;
Mattos, C.; Michnick, S.; Ngo, T.; Nguyen, D. T.; Prodhom, B.; Reiher, III, W. E.; Roux, B.;
Schlenkrich, M.; Smith, J. C.; Stote, R.; Straub, J.; Watanabe, M.; Wio´rkiewicz-Kuczera, J.; Yin,
D.; Karplus, M. J. Phys. Chem. B 1998, 102, 3586–3616.
10. Frisch, M.J.; Trucks, G.W.; Schlegel, H.B.; Scuseria, G.E.; Robb, M.A.; Cheeseman, J.R.;
Scalmani, G.; Barone, V.; Mennucci, B.; Petersson, G.A.; Nakatsuji, H.; Caricato, M.; Li, X.;
Hratchian, H.P.; Izmaylov, A.F.; Bloino, J.; Zheng, G.; Sonnenberg, J.L.; Hada, M.; Ehara, M.;
Toyota, K.; Fukuda, R.; Hasegawa, J.; Ishida, M.; Nakajima, T.; Honda, Y.; Kitao, O.; Nakai, H.;
Vreven, T.; Montgomery, Jr., J.A.; Peralta, J.E.; Ogliaro, F.; Bearpark, M.; Heyd, J.J.; Brothers, E.;
Kudin, K.N.; Staroverov, V.N.; Kobayashi, R.; Normand, J.; Raghavachari, K.; Rendell, A.; Burant,
J.C.; Iyengar, S.S.; Tomasi, J.; Cossi, M.; Rega, N.; Millam, J. M.; Klene, M.; Knox, J.E.; Cross,
J.B.; Bakken, V.; Adamo, C.; Jaramillo, J.; Gomperts, R.; Stratmann, R.E.; Yazyev, O.; Austin, A.J.;
Cammi, R.; Pomelli, C.; Ochterski, J.W.; Martin, R.L.; Morokuma, K.; Zakrzewski, V.G.; Voth, G.A;.
Salvador, P.; Dannenberg, J.J.; Dapprich, S.; Daniels, A.D.; Farkas, Ö.; Foresman, J.B.; Ortiz,
J.V.; Cioslowski, J.; Fox, D.J. Gaussian 09, 2009 Revision A.1, Gaussian, Inc., Wallingford CT.
11. Feller, S.E.; Gawrisch, K.; MacKerell, Jr., A.D. J. Am. Chem. Soc. 2002, 124(2), 318–326.
12. Widrig, C.A., Alves, C.A., Porter, M.D., J. Am. Chem. Soc. 1991, 113(8), 2805–2810.
13. Humphrey, W.; Dalke, A.; Schulten, K.; J. Mol. Graphics 1996, 14, 33–38.
14. Phillips, J.C.; Braun, R.; Wang, W.; Gumbart, J.; Tajkhorshid, E.; Villa, E.; Chipot, C.; Skeel, R.D.;
Kale´, L.; Schulten, K. J. Comput. Chem. 2005, 26(16), 1781–1802.
15. Jorgensen, W.L.; Chandrasekhar, J.; Madura, J.D.; Impey, R.W.; Klein, M.L. J. Chem. Phys. 1983,
79(2), 926–935.
16. van Gunsteren, W. F. and Berendsen, H. J. C. Mol. Phy. 1977, 34(5), 1311–1327.
17. Darden, T.; York, D.; Pedersen, L. Chem. Phys. 1993, 98(12), 10089–10092.
Electronic Supplementary Material (ESI) for Chemical CommunicationsThis journal is © The Royal Society of Chemistry 2011

Table S1: CHARMM Charges of MBN
RESI CBN 0.00 GROUP ATOM N NH1 -0.47 ! | HZ1 HN1 ATOM HN H 0.31 ! HN-N | | ATOM CA CT1 0.07 ! | HB1 CZ1--CN1 ATOM HA HB 0.09 ! | | // \\ GROUP ! HA-CA--CB--SG--SD--CE CT--CI=-NK ATOM CB CT2 -0.10 ! | | \ __ / ATOM HB1 HA 0.09 ! | HB2 CZ2--CN2 ATOM HB2 HA 0.09 ! O=C | | ATOM SG S -0.08 ! | HZ2 HN2 GROUP ATOM SD S -0.08 ATOM CE CA 0.289 ATOM CZ1 CA -0.115 ATOM HZ1 HP 0.115 ATOM CZ2 CA -0.115 ATOM HZ2 HP 0.115 ATOM CN1 CA -0.115 ATOM HN1 HP 0.115 ATOM CN2 CA -0.115 ATOM HN2 HP 0.115 ATOM CT CA -0.029 ATOM CI CNI 0.254 ATOM NK NNI -0.434 GROUP ATOM C C 0.51 ATOM O O -0.51 Table S2: Structural parameters of MBN-labelled K8C and MBN-labelled K39C on the SAM coated gold layer.
MBN-labelled K8C MBN-labelled K39C Distance (-CN – gold) / Å 22.1 44.8
Angle (heme – surface normal) / degrees 104.9 127.3 Angle (-CN – heme) / degrees 121.2 93.8
Electronic Supplementary Material (ESI) for Chemical CommunicationsThis journal is © The Royal Society of Chemistry 2011
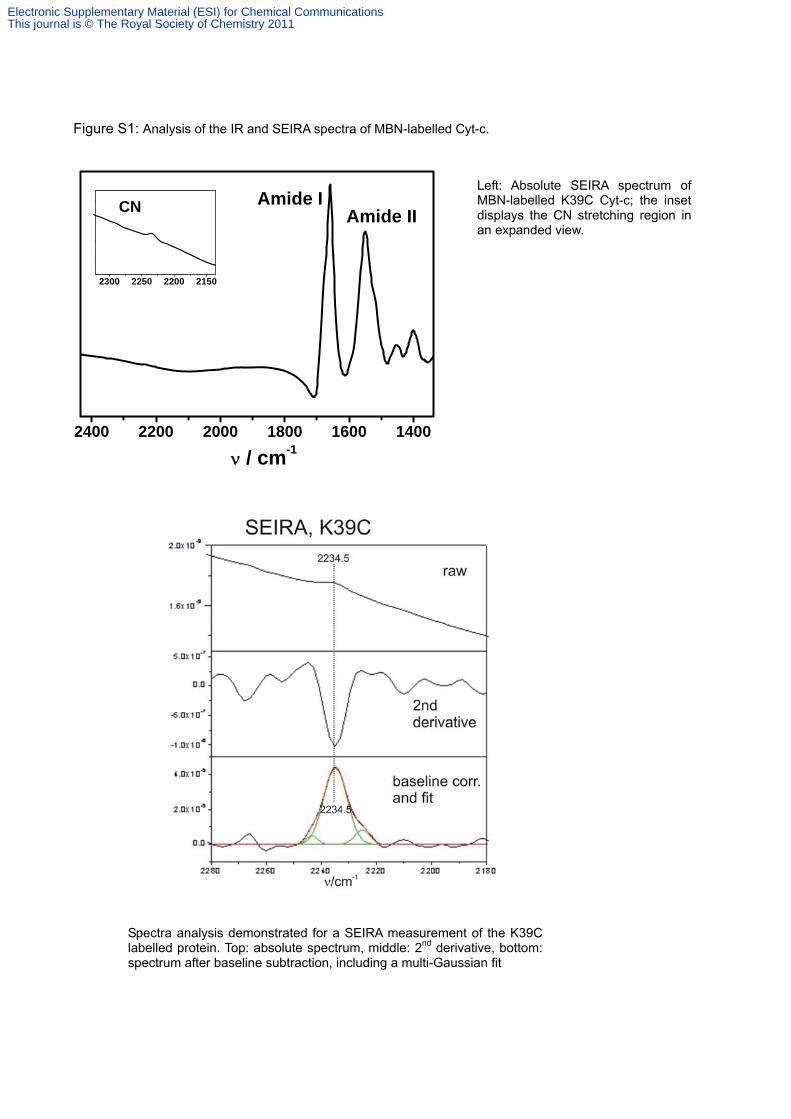
Figure S1: Analysis of the IR and SEIRA spectra of MBN-labelled Cyt-c.
2400 2200 2000 1800 1600 1400
ν / cm-1
2300 2250 2200 2150
CN Amide IIAmide I
Left: Absolute SEIRA spectrum of MBN-labelled K39C Cyt-c; the inset displays the CN stretching region in an expanded view.
Spectra analysis demonstrated for a SEIRA measurement of the K39C labelled protein. Top: absolute spectrum, middle: 2nd derivative, bottom: spectrum after baseline subtraction, including a multi-Gaussian fit
Electronic Supplementary Material (ESI) for Chemical CommunicationsThis journal is © The Royal Society of Chemistry 2011
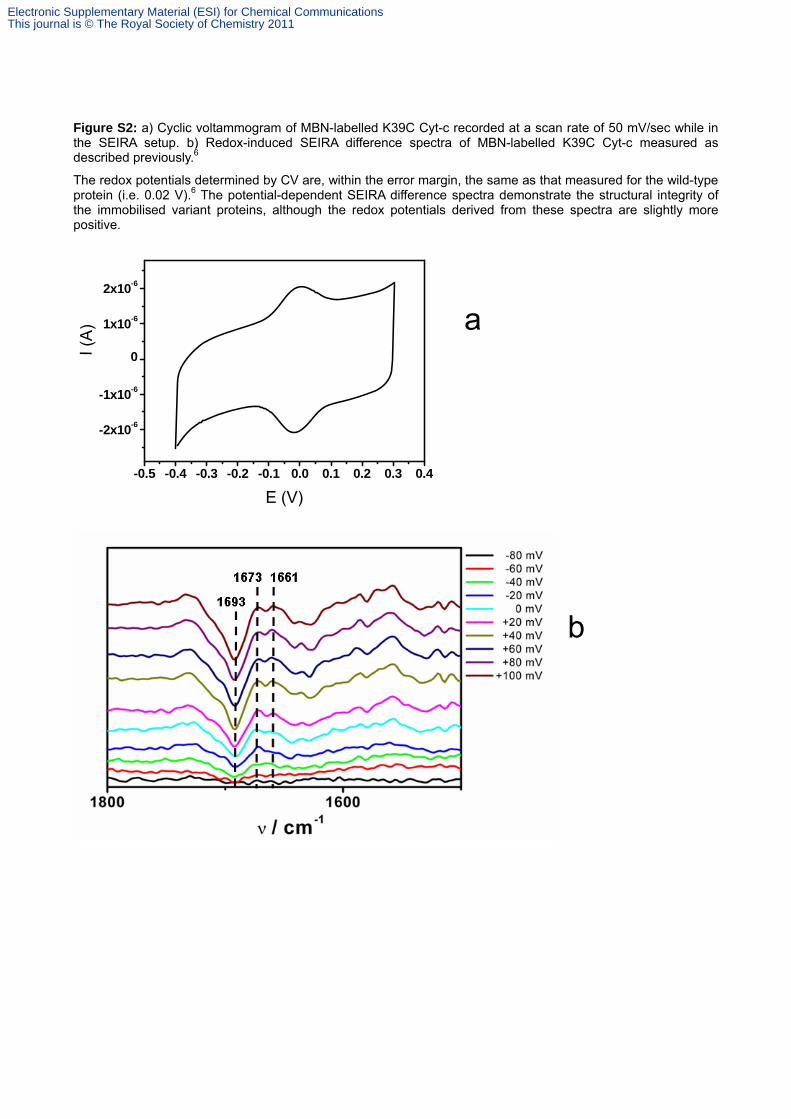
Figure S2: a) Cyclic voltammogram of MBN-labelled K39C Cyt-c recorded at a scan rate of 50 mV/sec while in the SEIRA setup. b) Redox-induced SEIRA difference spectra of MBN-labelled K39C Cyt-c measured as described previously.6
The redox potentials determined by CV are, within the error margin, the same as that measured for the wild-type protein (i.e. 0.02 V).6 The potential-dependent SEIRA difference spectra demonstrate the structural integrity of the immobilised variant proteins, although the redox potentials derived from these spectra are slightly more positive.
-0.5 -0.4 -0.3 -0.2 -0.1 0.0 0.1 0.2 0.3 0.4
-2x10⁻⁶
-1x10⁻⁶
0
1x10⁻⁶
2x10⁻⁶
I (A
)
E (V)
a
b
Electronic Supplementary Material (ESI) for Chemical CommunicationsThis journal is © The Royal Society of Chemistry 2011
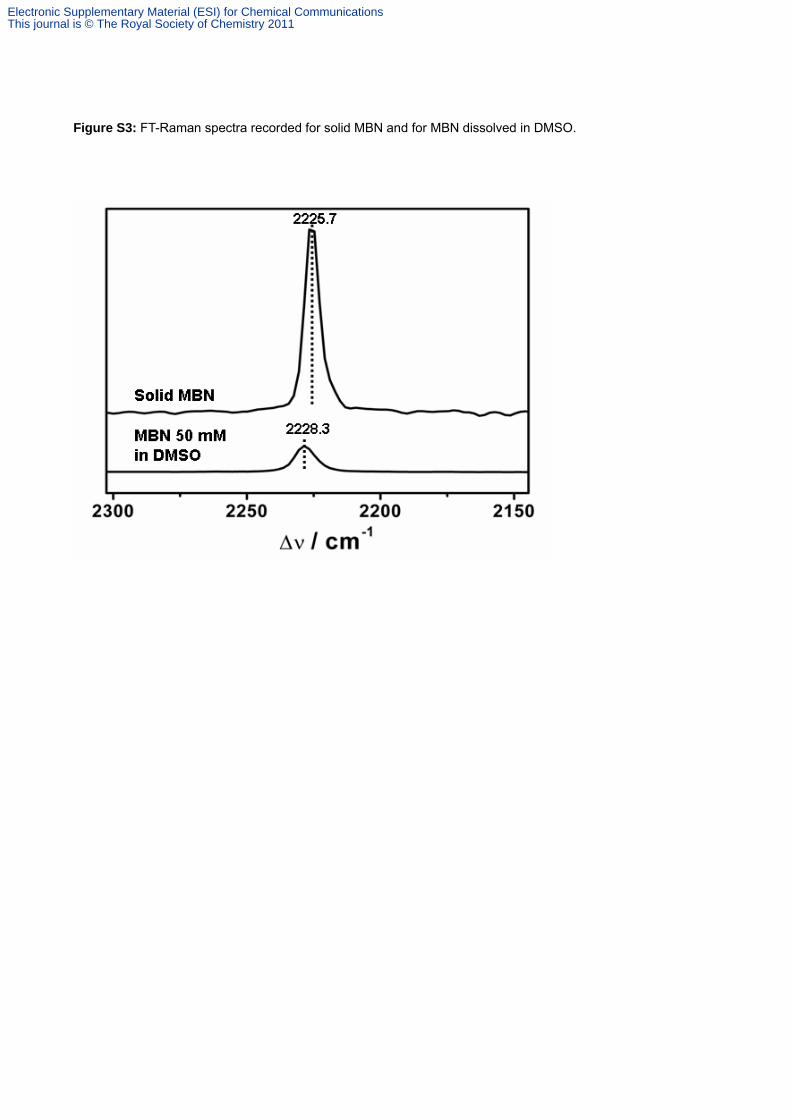
Figure S3: FT-Raman spectra recorded for solid MBN and for MBN dissolved in DMSO.
Electronic Supplementary Material (ESI) for Chemical CommunicationsThis journal is © The Royal Society of Chemistry 2011
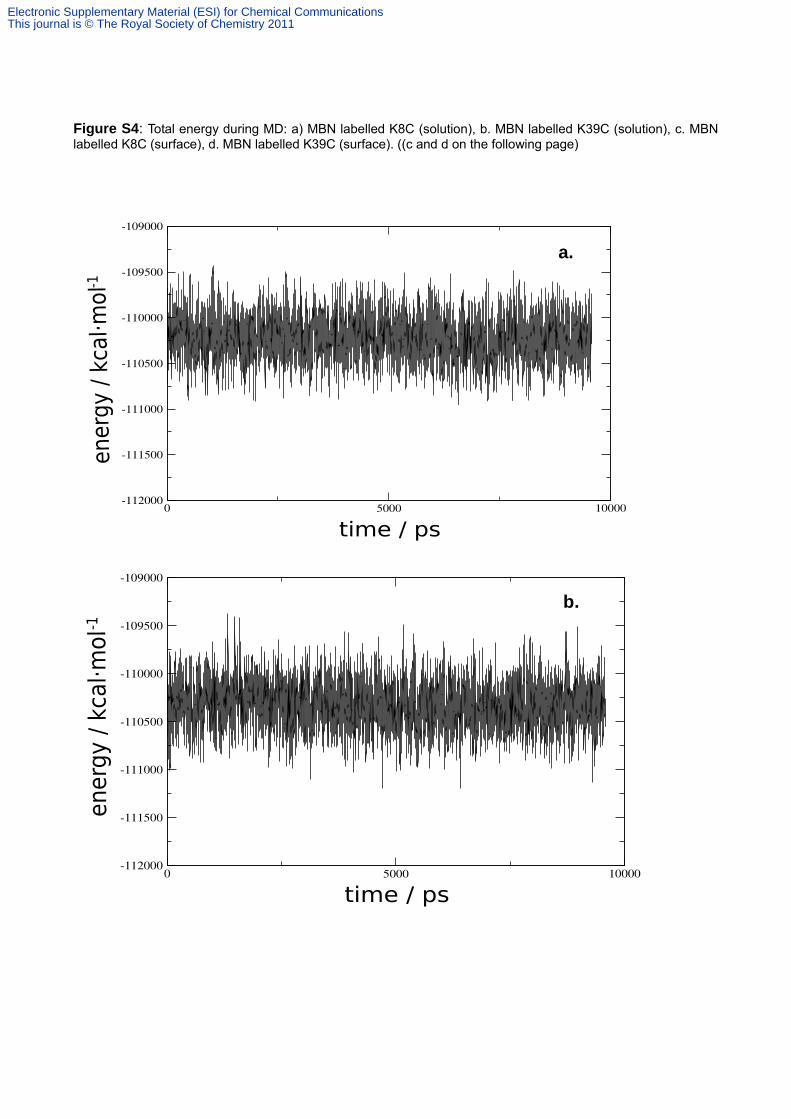
Figure S4: Total energy during MD: a) MBN labelled K8C (solution), b. MBN labelled K39C (solution), c. MBN labelled K8C (surface), d. MBN labelled K39C (surface). ((c and d on the following page)
b.
a.
Electronic Supplementary Material (ESI) for Chemical CommunicationsThis journal is © The Royal Society of Chemistry 2011
d.
c.
Electronic Supplementary Material (ESI) for Chemical CommunicationsThis journal is © The Royal Society of Chemistry 2011
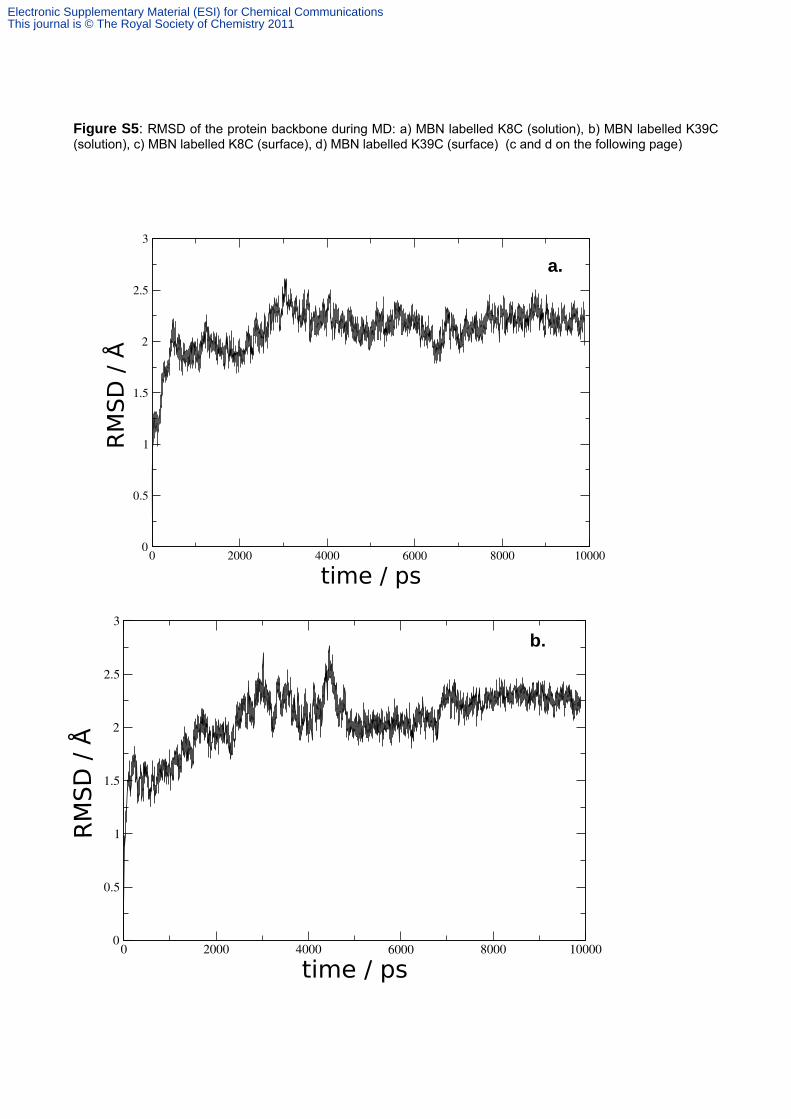
Figure S5: RMSD of the protein backbone during MD: a) MBN labelled K8C (solution), b) MBN labelled K39C (solution), c) MBN labelled K8C (surface), d) MBN labelled K39C (surface) (c and d on the following page)
b.
a.
Electronic Supplementary Material (ESI) for Chemical CommunicationsThis journal is © The Royal Society of Chemistry 2011
d.
c.
Electronic Supplementary Material (ESI) for Chemical CommunicationsThis journal is © The Royal Society of Chemistry 2011
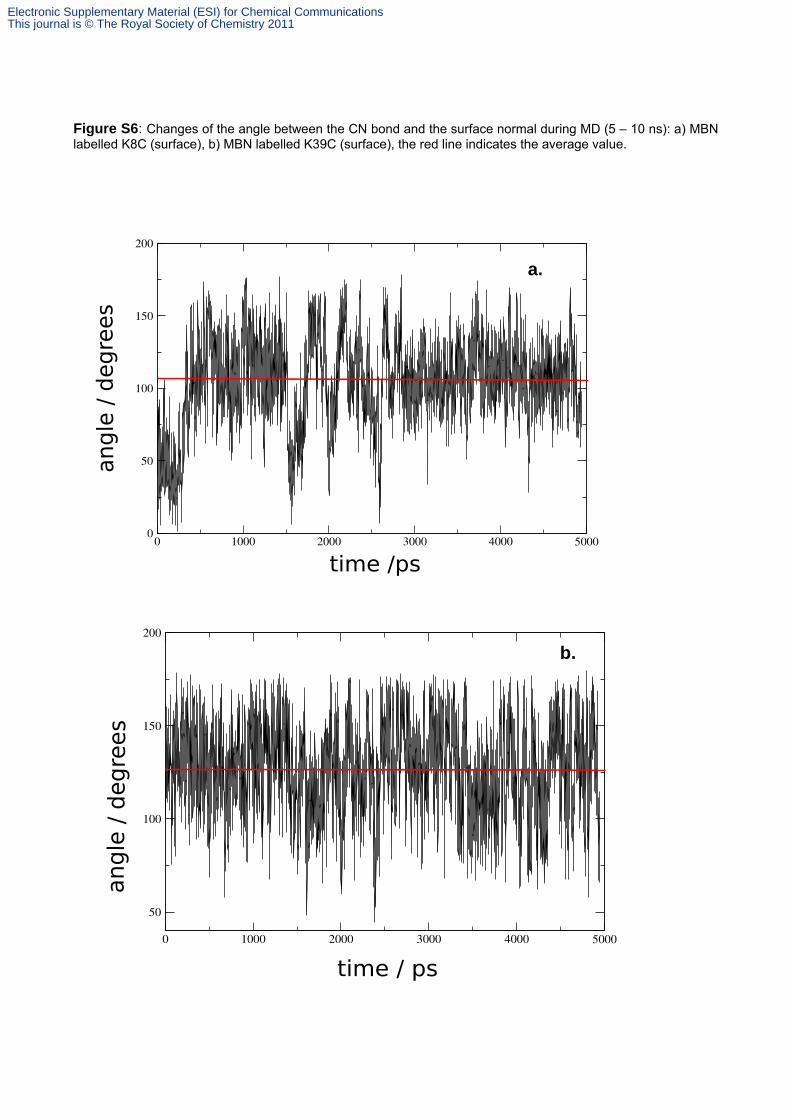
Figure S6: Changes of the angle between the CN bond and the surface normal during MD (5 – 10 ns): a) MBN labelled K8C (surface), b) MBN labelled K39C (surface), the red line indicates the average value.
b.
a.
Electronic Supplementary Material (ESI) for Chemical CommunicationsThis journal is © The Royal Society of Chemistry 2011
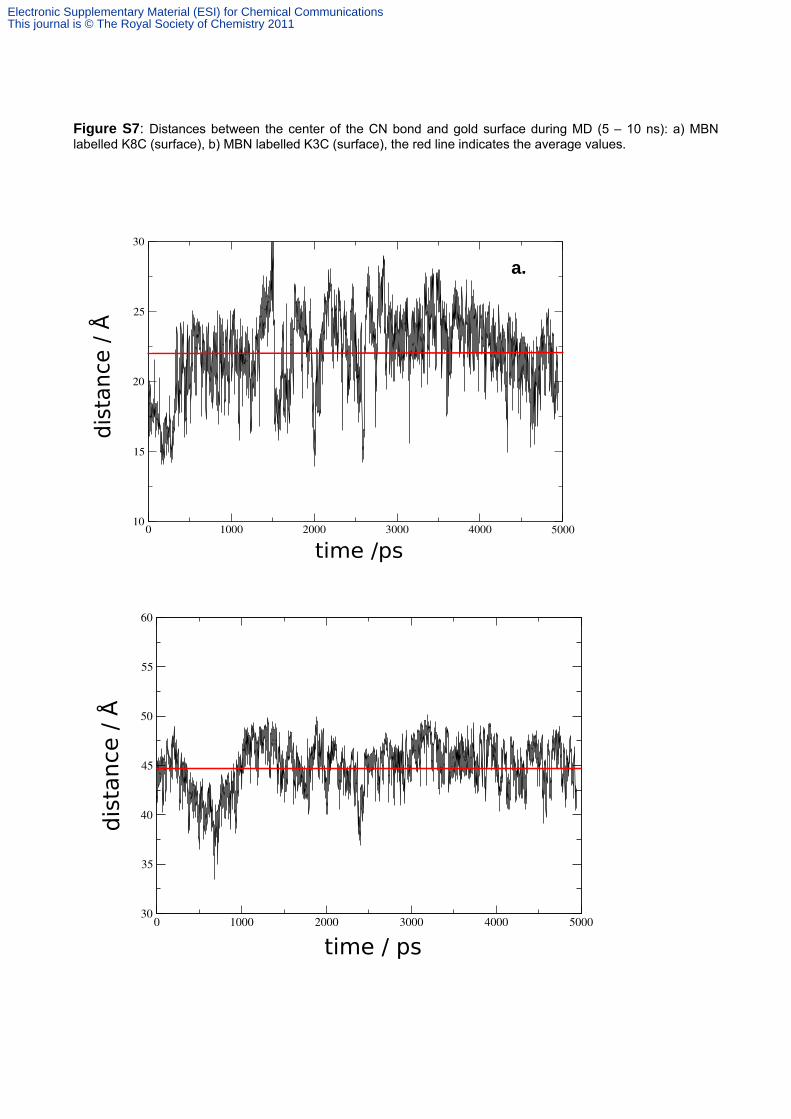
Figure S7: Distances between the center of the CN bond and gold surface during MD (5 – 10 ns): a) MBN labelled K8C (surface), b) MBN labelled K3C (surface), the red line indicates the average values.
a.
Electronic Supplementary Material (ESI) for Chemical CommunicationsThis journal is © The Royal Society of Chemistry 2011

Figure S8: Number of contacts of the nitrile label (N atom) of K8C (black) and K39C (red) with solvent water molecules during the MD simulations. In solution (top figures), the average numbers of contacts are 3.37 and 3.63 for the nitrile labels of K8C and K39C, respectively. Essentially the same values were obtained for the immobilised protein (bottom figures, 3.44 for K8C and 3.62 for K39C).
Electronic Supplementary Material (ESI) for Chemical CommunicationsThis journal is © The Royal Society of Chemistry 2011
![Supporting Information · 2015-12-08 · Supporting Information Emerson et al. 10.1073/pnas.1521918112 SI Materials and Methods Mapping of prd-1. The prd-1; ras-1[bd] was crossed](https://img.pdfslide.tips/doc/110x75/5ee2fbb3ad6a402d666d2341/supporting-information-2015-12-08-supporting-information-emerson-et-al-101073pnas1521918112.jpg)