Embed Size (px)
Citation preview

PAGE
TH
REE
Fish Health Management Quarter One - January to March 2014
SALMONSustainable Scottish
SSPO HEALTH MANAGEMNT REPORT 2014
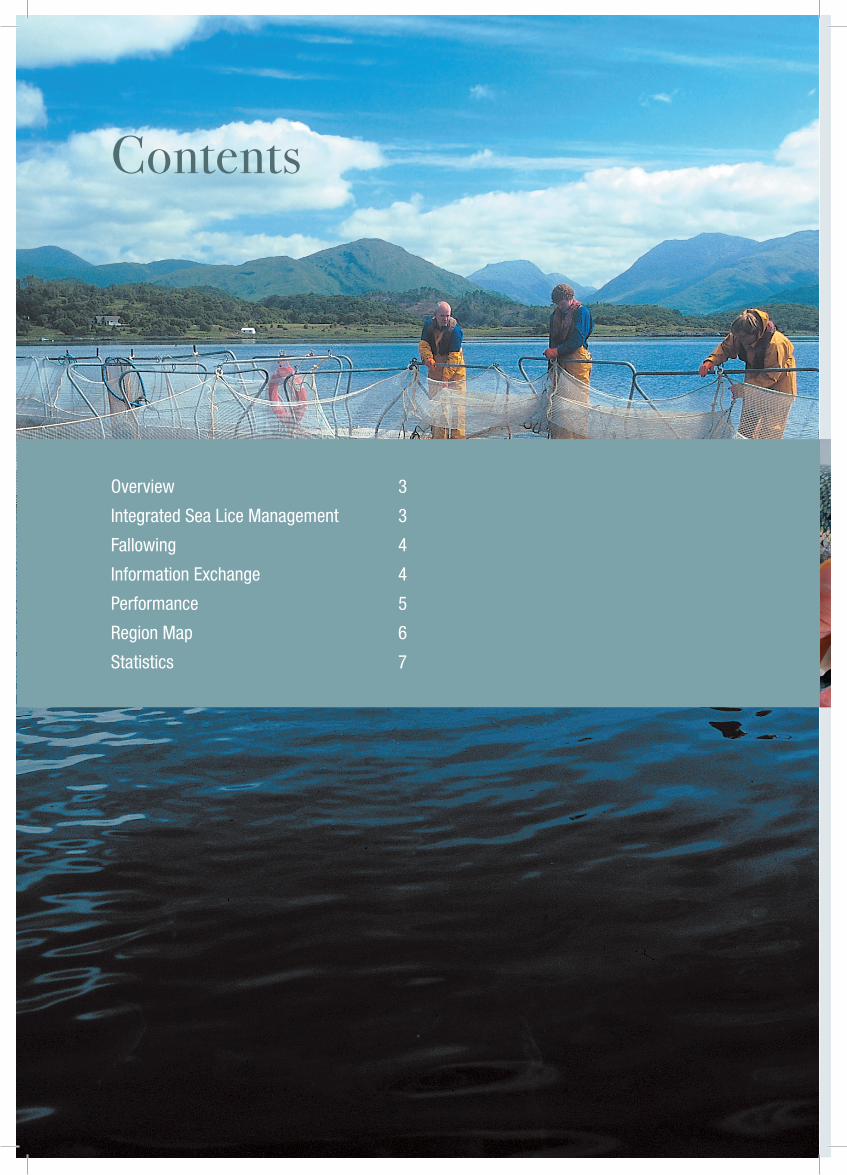
Overview 3
Integrated Sea Lice Management 3
Fallowing 4
Information Exchange 4
Performance 5
Region Map 6
Statistics 7
Contents

PAGE
TH
REE
Overview
“All the production sites were stocked with just one year class of fish.”
This report marks the beginning of the second year of reporting fish health management information, specifically looking at sea lice.
During this quarter 179 sites were stocked with salmon, approximately 75% of the active sites in Scotland. All the production sites were stocked with just one year class of fish, as required by the Code of Good Practice for Scottish Finfish Aquaculture.
The Code of Good Practice requirements on sea lice management reflect Integrated Sea Lice Management protocols which were pioneered in Scotland and are now used internationally.
SSPO QUARTERLY MANAGEMENT REPORT
Integrated Sea Lice Management
Information exchange
Area management
FallowingSingle year class stocking
All in/all out stocking
Synchronisation
Weekly monitoring
Treatment using licensed medicines
Cleaner fish Lice filtrationPhysical barrier
Research and innovation
SSPO QUARTERLY MANAGEMENT REPORT
PAGE
FO
UR
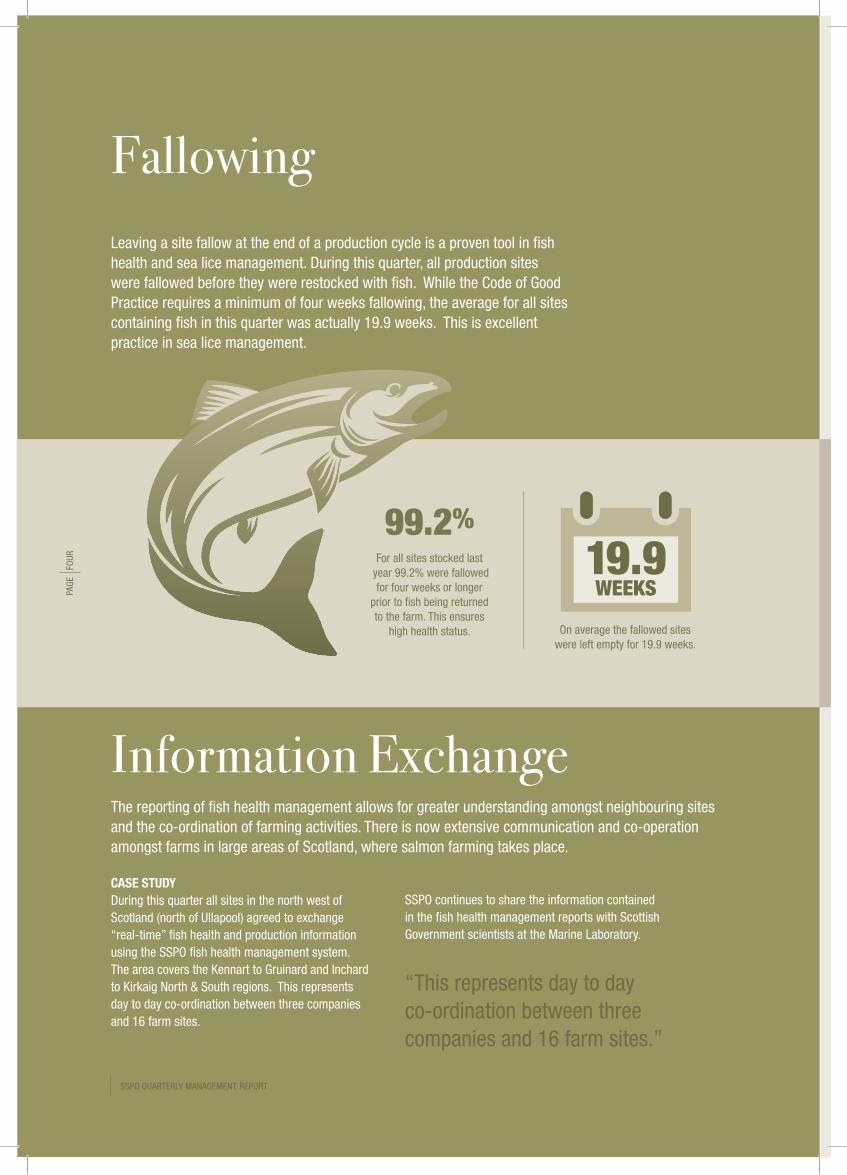
Leaving a site fallow at the end of a production cycle is a proven tool in fish health and sea lice management. During this quarter, all production sites were fallowed before they were restocked with fish. While the Code of Good Practice requires a minimum of four weeks fallowing, the average for all sites containing fish in this quarter was actually 19.9 weeks. This is excellent practice in sea lice management.
Fallowing
Information Exchange
“This represents day to day co-ordination between three companies and 16 farm sites.”
CASE STUDYDuring this quarter all sites in the north west of Scotland (north of Ullapool) agreed to exchange “real-time” fish health and production information using the SSPO fish health management system. The area covers the Kennart to Gruinard and Inchard to Kirkaig North & South regions. This represents day to day co-ordination between three companies and 16 farm sites.
The reporting of fish health management allows for greater understanding amongst neighbouring sites and the co-ordination of farming activities. There is now extensive communication and co-operation amongst farms in large areas of Scotland, where salmon farming takes place.
SSPO continues to share the information contained in the fish health management reports with Scottish Government scientists at the Marine Laboratory.
For all sites stocked last year 99.2% were fallowed
for four weeks or longer prior to fish being returned to the farm. This ensures
high health status.
99.2%
On average the fallowed sites were left empty for 19.9 weeks.
19.9WEEKS
“Quote
SSPO QUARTERLY MANAGEMENT REPORT
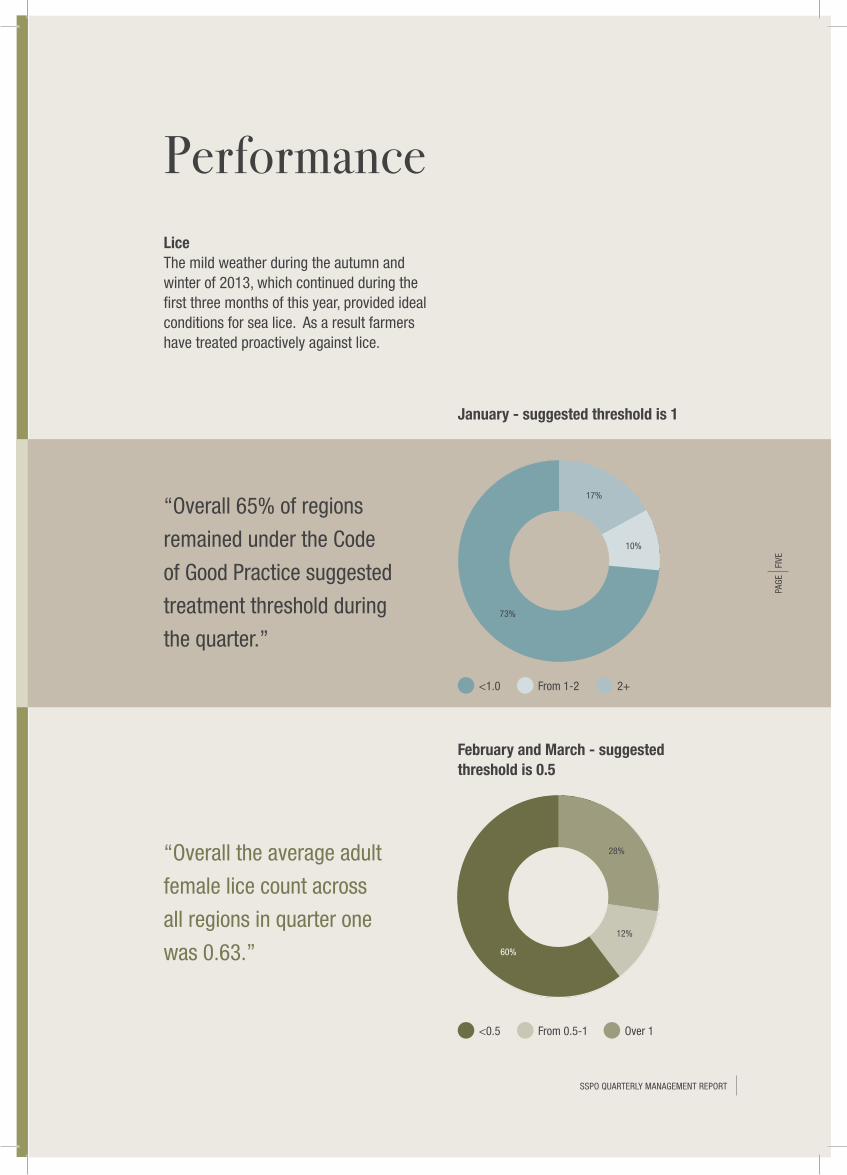
LiceThe mild weather during the autumn and winter of 2013, which continued during the first three months of this year, provided ideal conditions for sea lice. As a result farmers have treated proactively against lice.
Performance
PAGE
FI
VE
“Overall the average adult
female lice count across
all regions in quarter one
was 0.63.”
“Overall 65% of regions
remained under the Code
of Good Practice suggested
treatment threshold during
the quarter.”
January - suggested threshold is 1
February and March - suggested threshold is 0.5
Over 1
2+
From 0.5-1
From 1-2
<0.5
<1.0
73%
60%
17%
10%
28%
12%
SSPO QUARTERLY MANAGEMENT REPORT
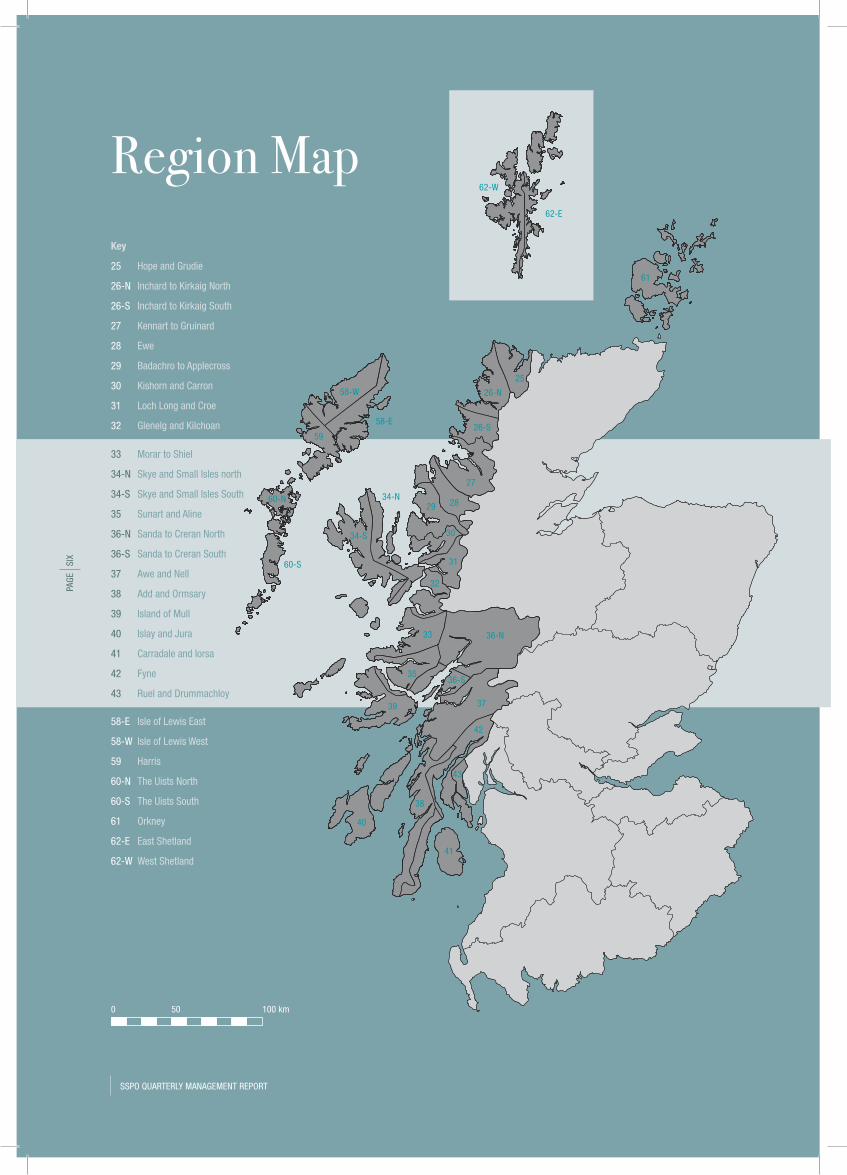
Key
25 Hope and Grudie
26-N Inchard to Kirkaig North
26-S Inchard to Kirkaig South
27 Kennart to Gruinard
28 Ewe
29 Badachro to Applecross
30 Kishorn and Carron
31 Loch Long and Croe
32 Glenelg and Kilchoan
33 Morar to Shiel
34-N Skye and Small Isles north
34-S Skye and Small Isles South
35 Sunart and Aline
36-N Sanda to Creran North
36-S Sanda to Creran South
37 Awe and Nell
38 Add and Ormsary
39 Island of Mull
40 Islay and Jura
41 Carradale and Iorsa
42 Fyne
43 Ruel and Drummachloy
Region Map
PAGE
SI
X
0 50 100 km
61
36-N
36-S
37
42
43
41
38
40
58-W
58-E
59
60-N
60-S
34-N
25
26-N
34-S
26-S
27
2829
30
31
32
33
35
39
58-E Isle of Lewis East
58-W Isle of Lewis West
59 Harris
60-N The Uists North
60-S The Uists South
61 Orkney
62-E East Shetland
62-W West Shetland
62-W
62-E
“Quote
SSPO QUARTERLY MANAGEMENT REPORT
StatisticsAr
ea N
ame
Area
co
de
Adul
t Fem
ale
Coun
t 201
3Ad
ult F
emal
e Co
unt 2
014
Jan
Feb
Mar
Apr
May
June
July
Aug
Sept
Oct
Nov
Dec
Jan
Feb
Mar
Hope
and
Gru
die
250.
140.
120.
140.
220.
400.
30F
FF
0.00
0.00
0.00
0.00
0.00
0.00
Inch
ard
to K
irkai
g N
orth
26-N
2.64
1.76
1.97
2.40
1.26
1.12
1.51
3.72
9.42
6.27
1.09
0.21
0.78
1.36
1.77
Inch
ard
to K
irkai
g So
uth
Curr
ently
no
activ
e sa
lmon
farm
s
Kenn
art t
o Gr
uina
rd27
4.19
4.61
4.57
2.27
2.56
2.09
3.13
4.80
9.26
10.2
74.
875.
112.
762.
221.
50
Ewe
280.
000.
000.
000.
000.
000.
010.
04F
FF
FF
0.00
0.00
0.00
Bada
chro
to A
pple
cros
s29
0.92
0.57
0.31
0.24
0.61
0.70
0.92
2.24
12.1
05.
18F
FF
0.00
0.00
Kish
orn
and
Carr
on30
0.00
0.00
0.00
0.00
0.00
0.00
0.01
0.01
0.18
0.43
0.99
0.97
2.86
2.09
0.45
Loch
Lon
g an
d Cr
oe31
FF
0.00
0.00
0.00
0.00
0.01
0.01
0.16
0.25
0.78
1.58
0.96
1.03
1.21
Glen
elg
to K
ilcho
an32
0.10
0.18
0.07
0.02
0.01
0.04
0.02
0.07
0.09
0.01
0.02
0.03
0.09
0.15
0.10
Mor
ar to
Shi
el33
0.60
0.56
F0.
020.
040.
030.
050.
190.
120.
210.
670.
170.
240.
541.
01
Skye
and
Sm
all I
sles
Nor
th34
-N0.
070.
160.
010.
020.
020.
020.
040.
200.
591.
021.
441.
111.
682.
173.
15
Skye
and
Sm
all I
sles
Sou
th34
-S0.
020.
020.
000.
000.
000.
040.
020.
150.
320.
480.
550.
280.
010.
000.
05
Suna
rt a
nd A
line
350.
080.
120.
070.
040.
030.
020.
040.
120.
030.
020.
020.
040.
100.
150.
35
Sand
a to
Cre
ran
Nor
th36
-N0.
230.
340.
100.
250.
290.
580.
591.
302.
026.
02F
FF
0.00
0.00
Sand
a to
Cre
ran
Sout
h36
-S0.
350.
370.
260.
370.
400.
740.
851.
020.
620.
520.
410.
40F
F0.
00
Awe
and
Nell
370.
270.
260.
190.
200.
700.
370.
560.
681.
965.
858.
482.
853.
742.
602.
38
Add
and
Orm
sary
381.
840.
720.
650.
540.
250.
060.
040.
331.
402.
563.
172.
323.
451.
020.
36
Isla
nd o
f Mul
l39
0.21
0.16
0.04
0.04
0.01
0.03
0.04
0.15
0.40
0.68
1.67
2.49
1.21
3.49
1.59
Isla
y an
d Ju
ra40
FF
FF
F0.
851.
103.
125.
605.
2012
.45
4.00
5.20
BB
Carr
adal
e an
d Io
rsa
410.
020.
000.
000.
000.
010.
080.
560.
870.
860.
240.
270.
050.
00F
F
Fyne
420.
110.
160.
240.
270.
430.
42F
F0.
000.
000.
000.
000.
000.
000.
00
Ruel
and
Dru
mm
achl
oy43
FF
A0.
000.
000.
000.
000.
010.
030.
040.
070.
000.
030.
030.
07
Isle
of L
ewis
Eas
t58
-E0.
230.
320.
040.
090.
130.
080.
310.
541.
093.
233.
858.
030.
590.
330.
83
Isle
of L
ewis
Wes
t58
-WF
F0.
000.
000.
000.
000.
000.
010.
000.
030.
080.
170.
380.
310.
15
Harr
is59
1.98
2.58
2.02
2.81
0.61
0.84
1.36
1.44
1.77
0.39
0.26
0.05
0.10
0.19
0.17
The
Uist
s N
orth
60-N
1.87
0.30
0.45
0.94
1.27
1.94
1.02
1.29
1.82
2.21
2.30
0.76
1.68
0.70
0.54
The
Uist
s So
uth
60-S
0.38
0.27
0.08
0.15
0.25
0.47
1.26
1.74
2.90
3.76
7.70
2.83
0.83
0.68
0.55
Orkn
ey61
0.00
0.02
0.02
0.00
0.00
0.00
0.02
0.00
0.00
0.00
0.03
0.00
0.00
0.00
0.00
Shet
land
Eas
t62
-E0.
250.
640.
200.
140.
180.
290.
150.
200.
360.
540.
620.
490.
511.
010.
75
Shet
land
Wes
t62
-W0.
270.
270.
060.
060.
370.
350.
350.
940.
850.
430.
350.
140.
120.
150.
21
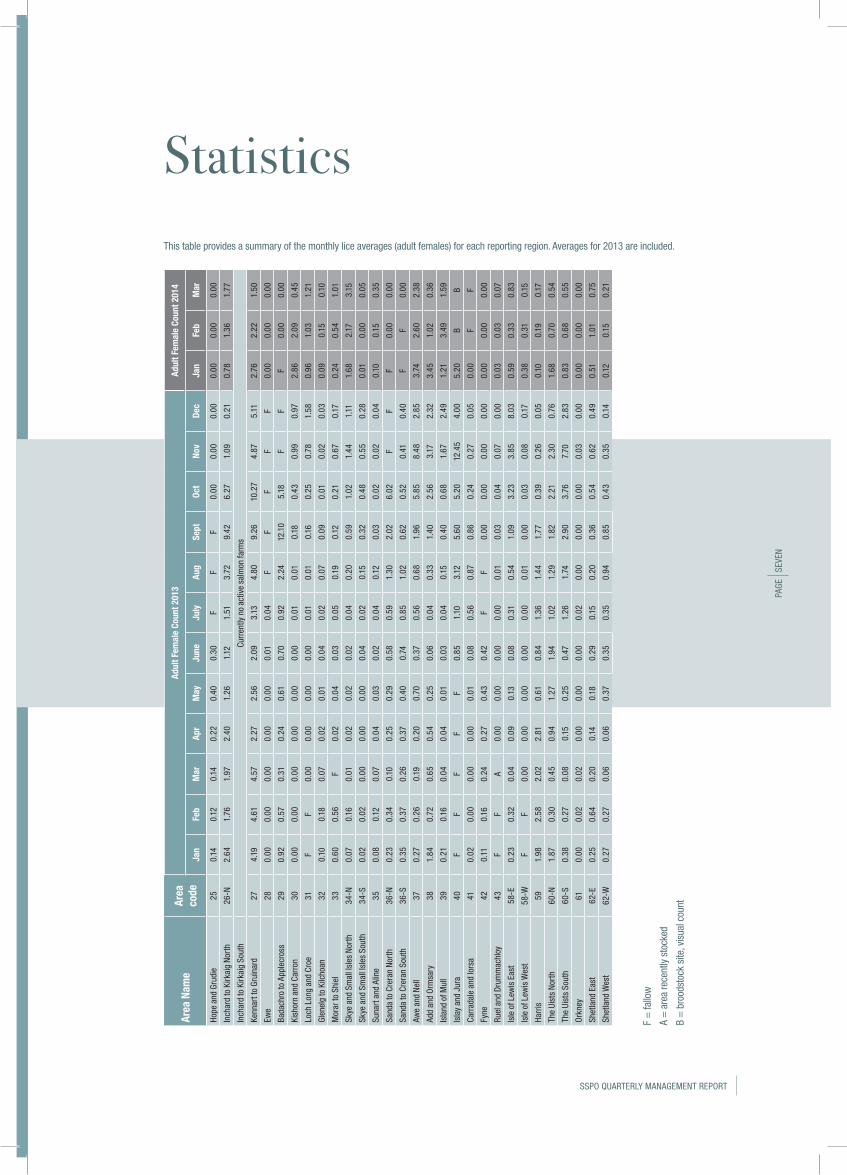
This table provides a summary of the monthly lice averages (adult females) for each reporting region. Averages for 2013 are included.
F =
fallo
w
A =
are
a re
cent
ly s
tock
ed
B =
bro
odst
ock
site
, vis
ual c
ount
PAGE
SE
VEN
PAGE
TW
O
Scottish Salmon Producers’ Organisation Limited, Durn, Isla Road, Perth PH2 7HG
T 01738 587 000 F 01738 621 [email protected]
www.scottishsalmon.co.uk