Embed Size (px)
Citation preview
1
Supporting Information
Sweet Supramolecular Elastomers from α,-(β-Cyclodextrin terminated)
PDMS
Talena Rambarran, Arthur Bertrand, Ferdinand Gonzaga, Fernande Boisson, Julien Bernard, Etienne
Fleury, François Ganachaud,* Michael. A. Brook*
Table of contents
Experimental Section 2
Materials 2
Characterization 2
General Synthesis 3
Synthesis of propiolate-terminated polydimethylsiloxane 2, 3 3
Synthesis of β-CD functional PDMS 4, 5 4
Click reaction with copper catalyst 5
Reaction of 2 with 3-azido-1-propanol 5
Synthesis of mono-(6-deoxy-6-azido)-peracylated-β-cyclodextrin 6 5
Acylated-β-Cyclodextrin-functional PDMS 7 (Thermal Cycloaddition) 6
Characterization of synthons
Figure S1. Electrospray-mass spectrum of azido β-CD protonated by Na+. 7
Figure S2. FTIR spectra of starting material. 7
Figure S3. 1H NMR spectra in CDCl3 of starting materials. 8
Figure S4. TGA of starting material. 8
Characterization of CD-PDMS triblocks 9
Figure S5. Zoom on the FTIR region of OH stretch. 9
Figure S6. 1H HRMAS spectrum of the elastomer 5. 9
Figure S7. DSC cycles of the elastomer 4. 10
Figure S8: TGA of 4 (thin line) and 5 (thick line) elastomers. 10
Rheology study 11
Figure S9. Frequency sweeps at constant strain for propiolate-PDMSs. 11
Figure S10. Temperature sweeps at constant strain for elastomer 4. 11
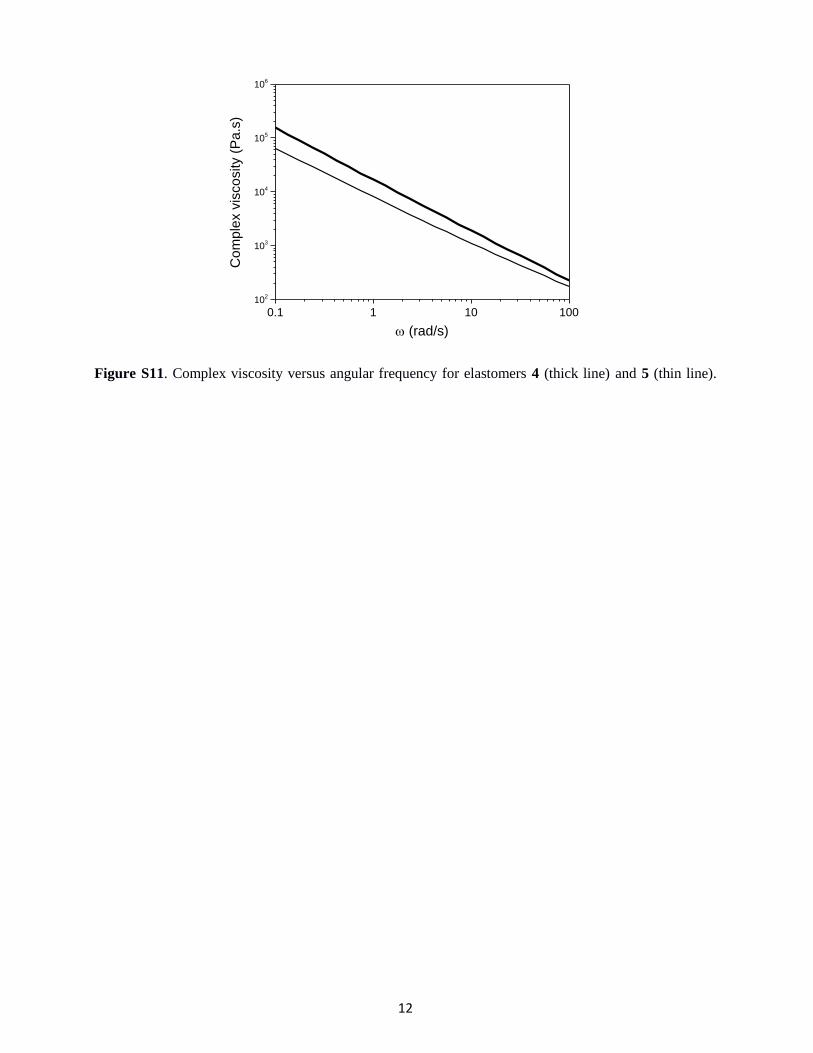
Figure S11. Complex viscosity versus angular frequency for elastomers. 12
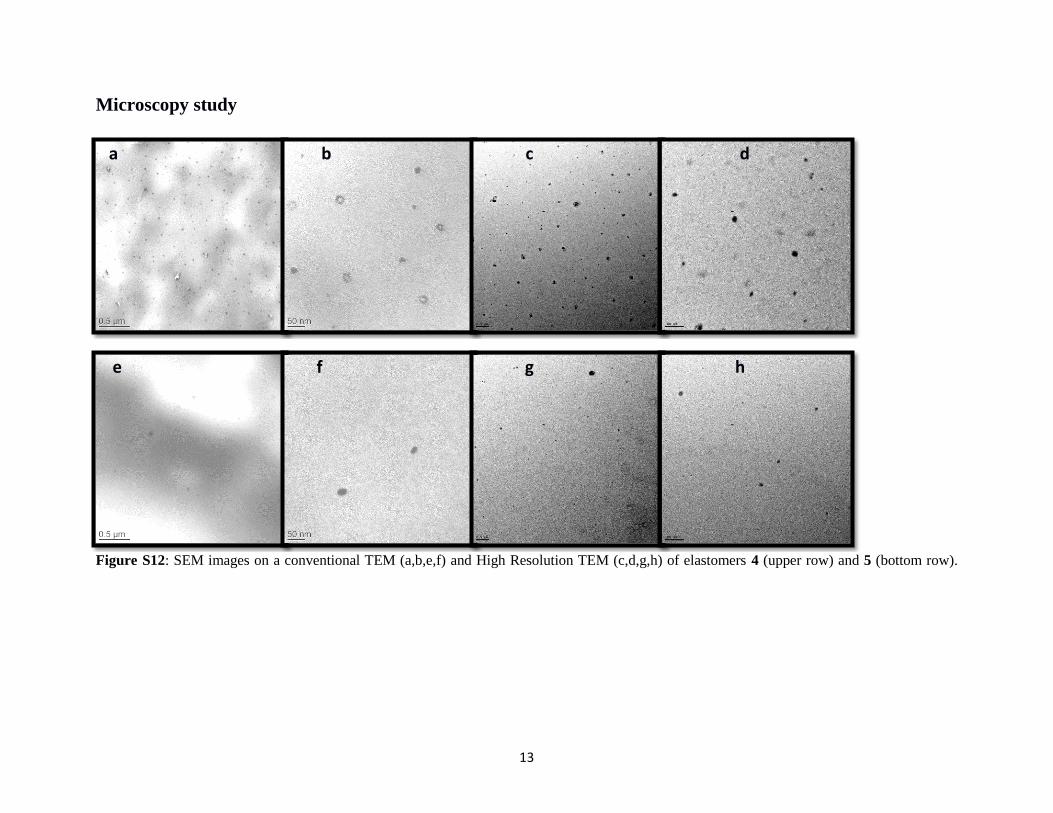
Microscopy study 13
Figure S12: SEM images on a conventional and High Resolution TEM. 13
Electronic Supplementary Material (ESI) for ChemComm.This journal is © The Royal Society of Chemistry 2016

2
Complementary analyses 14
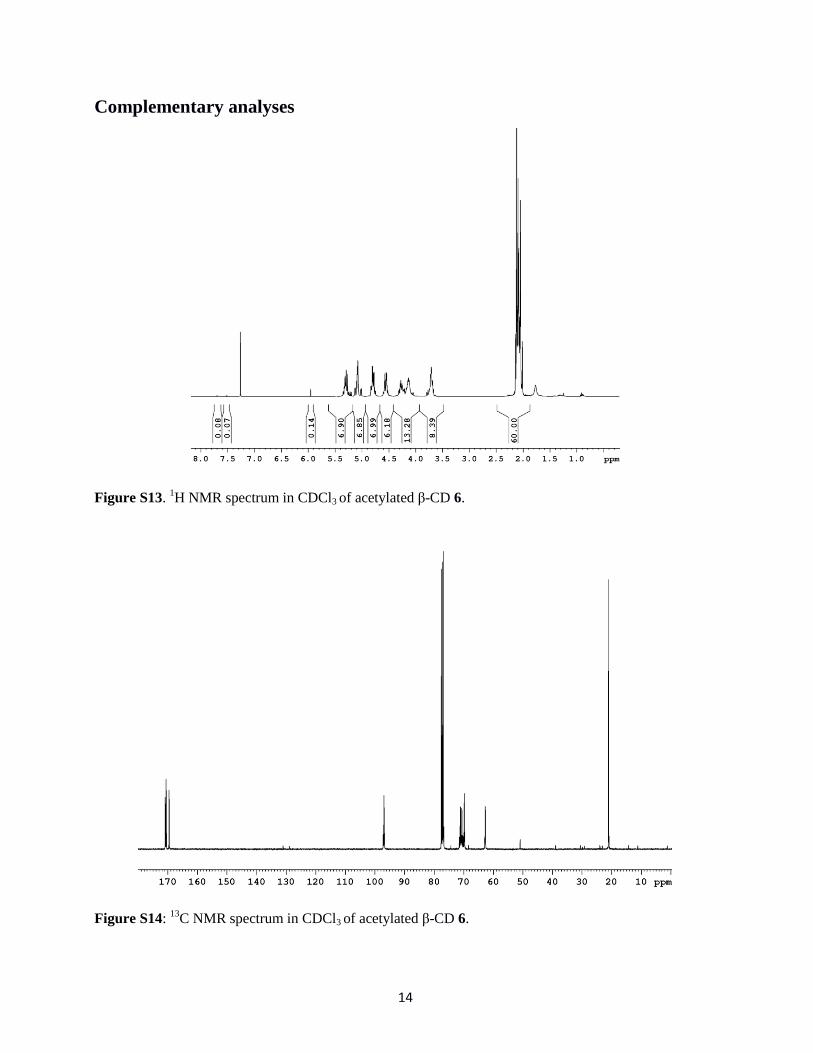
Figure S13. 1H NMR spectrum in CDCl3 of acetylated β-CD 6. 14
Figure S14: 13
C NMR spectrum in CDCl3 of acetylated β-CD 6. 14
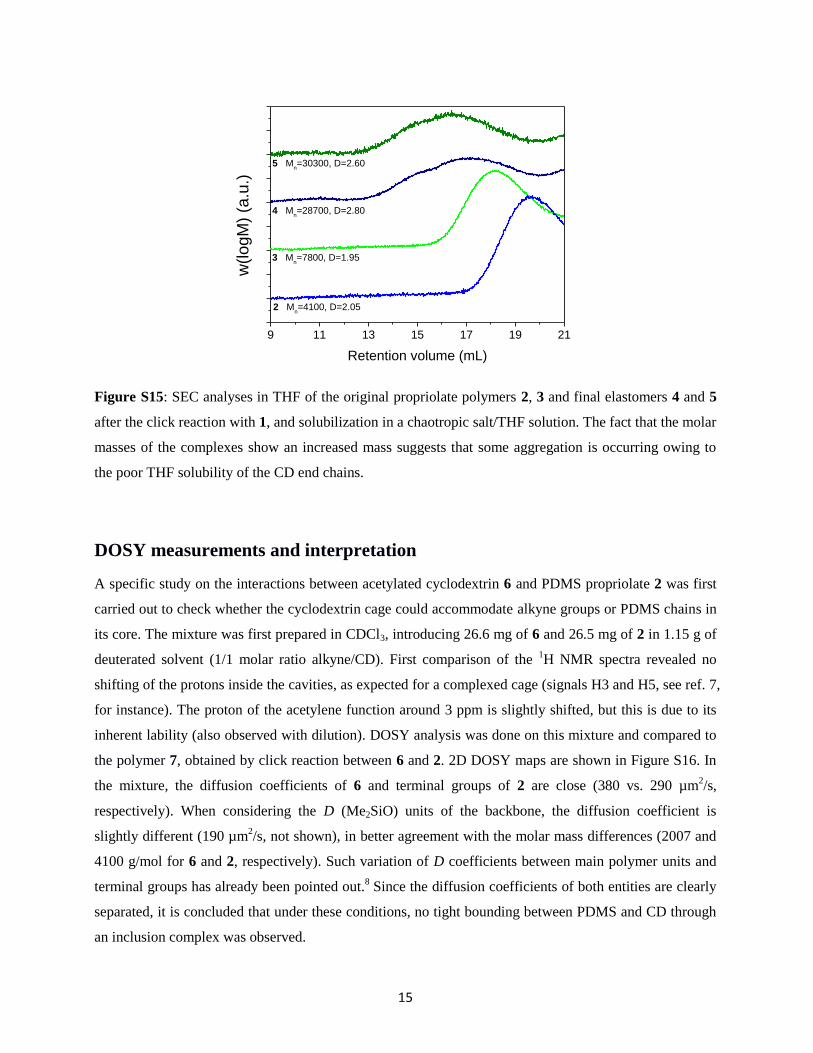
Figure S15: SEC analyses of genuine propiolate polymers and final elastomers. 15
DOSY measurements and interpretation 15
Figure S16: 2D DOSY maps of 6 and 2 mixed together in CDCl3 and polymer 7 in CDCl3 16
References for Supporting Information 17
Experimental Section
Materials
Octamethylcyclotetrasiloxane (D4, 98%), and 1,3-bis(4-hydroxybutyl)tetramethyldisiloxane (95%) were
obtained from Gelest. Propiolic acid (95%), N-(3-dimethylaminopropyl)-N'-ethyl-carbodiimide
hydrochloride (EDC-HCl, commercial grade), 1,1,3,3-tetramethylguanidine (TMG, 99%) and
dimethylaminopyridine (DMAP, 99%) were obtained from Sigma-Aldrich. Trifluoroacetic acid
(analytical grade) (TFA) was obtained from Carlo Erba Reagents. Mono-6-deoxy-6-azido--cyclodextrin
1 was synthesized according to a published procedure,1 using materials purchased from Sigma Aldrich.
ESI-MS and FTIR spectra are given in Figures S1 and S2, respectively. Solvents DMSO-d6, CDCl3,
THF, isopropanol, CH2Cl2 (DCM), and toluene were all obtained from Sigma Aldrich and used as
received.
Characterization
1H NMR spectra were recorded at room temperature on a Bruker AC-250 spectrometer (at 250 MHz for
1H), a Bruker AVANCE 500MHz Spectrometer (500 MHz for
1H and 125 MHz for
13C) or a Bruker
AVANCE II spectrometer (at 400 MHz for 1H and 100.6 MHz for
13C) using deuterated solvents (CDCl3
or DMSO-d6). 13
C chemical shifts are reported with respect to CDCl3 as an internal standard, set at 77.23
ppm. 1H NMR chemical shifts are reported with respect to chloroform (CHCl3) as an internal standard, set
at 7.26 ppm or with respect to residual proton signal of DMSO-d6 set at 2.50 ppm. Coupling constants (J)
are recorded in Hertz (Hz). The abbreviations s=singlet, d=doublet, t=triplet, m=multiplet, are used to
report spectra.
DOSY experiments were performed on a Bruker Avance III 400 spectrometer equipped with a 5 mm
multinuclear broad band probe (BBFO+) with z-gradient coil. A double stimulated echo sequence
(DSTE) incorporating bipolar gradient pulses was used for the measurement of self-diffusion coefficients.
Gradients were incremented from 0.96 G cm-1
to 47.19 G cm-1
in 40 steps using an exponential ramp. 64
scans were acquired with 16k data points. A gradient pulse length of ms was used with a

3
diffusion delay set to 100 ms. Fourier transformation was applied in F2 with 2 Hz exponential
broadening. The diffusion dimension of the 2D DOSY spectra was processed with TOPSPIN DOSY
software.
Size exclusion chromatography (SEC) in THF eluent was measured on a Shimadzu apparatus equipped
with a CTO-20A oven, set at 35°C, a RID 10A refractive index detector, and a Viscotek 270 Dual
detector (viscometer and light scattering). A mixture of TFA (0.342 g, 0.33 mmol) and TMG (0.115 g,
0.11 mmol) was first weighed into a vial with 1 mL of THF and mixed vigorously. The rubber (15 mg)
was then placed in a vial with 3 drops of the chaotropic salt solution and 4 mL of THF solvent and left for
24 h, at which time it was found to have dissolved.
Infrared spectra were measured on a Nicolet iS10 Thermo Scientific, using the ATR mode, at room
temperature. Differential scanning calorimetry and thermogravimetric analyses were measured on TA
Instruments Q500 and Q20, respectively. Rheological measurements were taken on an ARES SN
Rheometer from TA Instruments. All specimens were tested as 1-mm thick disks, under a nitrogen
atmosphere, using 25 mm parallel plate geometry. Oscillatory sweep measurements were taken as a
function of angular frequency in the range 0.1-100 rad/s, at 3% strain, whereas temperature sweeps
measurements were done between 30 and 150 °C, at constant frequency and strain (1 Hz, 3%).
Transmission electron microscopy was measured either on Philips CM120 TEM (Lyon) or on a Titan 1
FEI Titan 80-300 Cubed (Hamilton). Thin slices (~60 nm) of the elastomers were prepared by
microtoming. Ruthenium tetraoxide vapor (popular for heterogeneous polymer systems) was used as a
stain, as it has been shown to enhance electron density contrast for polymers containing ethers, alcohols
and aromatics.2 Given the nature of cyclodextrin and the fact that it is connected to the PDMS through an
aromatic linkage, cyclodextrin rich areas in the material were expected to provide greater contrast.
General Syntheses
Synthesis of propiolate-terminated polydimethylsiloxane 2, 3
Two 1,3-bis(propiolatobutyl)-terminated polydimethylsiloxanes 2 and 3 (see Figure 1 in main text),
which differ in molar mass, were synthesized following the procedure by Rambarran et al.3 The
polysiloxane chain 2 was constituted from ~52 dimethylsiloxane units, corresponding to an average molar
mass of 4,100 g·mol-1
as determined by 1H NMR and confirmed by GPC (THF: Mn= 4,100 g·mol
-1; PDI
= 2.05.). Polysiloxane 3 has ~114 dimethylsiloxane units, corresponding to an average molar mass of
8,600 g·mol-1
as determined by
1H NMR and confirmed by GPC (THF: Mn= 7,800 g·mol
-1; PDI = 1.95).

4
Compound 2: 1
H NMR (CDCl3, 500 MHz, δ): 0.07 (s, 312H, SiCH3); 0.52 (t, 4H, J=8.3 Hz,
SiCH2CH2CH2CH2); 1.38 (m, 4H, SiCH2CH2CH2CH2); 1.69 (m, 4H, SiCH2CH2CH2CH2); 2.87 (s, 2H,
C≡CH); 4.19 (t, 4H, J=6.5 Hz, SiCH2CH2CH2CH2). See FTIR and 1H NMR spectra in Figures S2 and S3,
respectively.
Compound 3: 1
H NMR (CDCl3, 500 MHz, δ): 0.07 (s, 684H, SiCH3); 0.52 (t, 4H, J=8.3 Hz,
SiCH2CH2CH2CH2); 1.38 (m, 4H, SiCH2CH2CH2CH2); 1.69 (m, 4H, SiCH2CH2CH2CH2); 2.87 (s, 2H,
C≡CH); 4.20 (t, 4H, J=6.5 Hz, SiCH2CH2CH2CH2).
Synthesis of β-CD functional PDMSs 4, 5
Compounds 1 (0.17 g, 0.15 mmol per azide) and 2 (0.31g, 0.075 mmol, 0.15 mmol per alkyne) were
mixed in a glass vial with 8 mL of 1:1 water:isopropanol at 80 °C. The reaction was initially turbid. After
5 d, the solution became transparent and a monolithic yellow elastomer 4 (0.40 g, 82% of the original
starting mass) precipitated out of the solution. 4 could be swollen in dichloromethane after a few hours
but did not dissolve. Partially reacted PDMS remaining in solution was removed simply by decanting.
Any material not tightly bound within the network could be extracted with DCM, reducing the mass of
the rubber to 0.21 g, 43% of the original mass of the reagents. The un-extracted material was
characterized by IR, 1H NMR (HRMAS), SEC (THF eluent), TGA, DSC, TEM and rheology.
This process was repeated starting from 3 (0.32 g 0.037 mmol, 0.074 mmol per alkyne) to create the
elastomer 5 (0.28 g, 70% of the original mass of the reagents) taking 5 days to reach completion. After
extraction with DCM, the mass was reduced to 0.25 g, 63% of the original mass of the reagents.
Compound 4: 1H NMR (CDCl3, 400 MHz, δ): 0.07 (s, 342 H, SiCH3); 0.62 (m, 4H, SiCH2CH2CH2CH2);
1.49 (m, 4H, SiCH2CH2CH2CH2); 1.83 (m, 4H, SiCH2CH2CH2CH2); 2.86 (s, 0.6H, C≡CH); 4.37 (m, 4H,
SiCH2CH2CH2CH2), 4.66 (broad s, H2O), 8.18, 8.83 (s, 1.4H, C-H aromatic). Note that some of the
silicone polymers reacted at only one end, such that residual SiCH2CH2CH2CH2 groups were present,
with additional signals at 1.37, 1.69 and 4.23 ppm. SEC (after chaotropic salt treatment): Mn=28,700
g/mol, PDI=2.80.
Compound 5: 1H NMR (CDCl3, 400 MHz, δ): 0.07 (s, 654 H, SiCH3); 0.62 (m, 4H, SiCH2CH2CH2CH2);
1.49 (m, 4H, SiCH2CH2CH2CH2); 1.83 (m, 4H, SiCH2CH2CH2CH2); 2.86 (s, 0.7H, C≡CH); 4.37 (t, 4H,
SiCH2CH2CH2CH2), 4.66 (broad s, H2O), 8.18, 8.83 (s, 1.3H, C-H aromatic). As noted above, peaks from
residual SiCH2CH2CH2CH2 groups were present at 1.37, 1.69 and 4.23 ppm. SEC (after chaotropic salt
treatment): Mn=30,300 g/mol, PDI=2.60.
5
Click reaction with copper catalyst
1 (0.114 g, 56 µmol), 2 (0.059 g, 51 µmol), copper sulfate pentahydrate (99.99%, Sigma-Aldrich, 0.003g
12 µmol) and sodium ascorbate (>98%, Sigma, 0.006 g, 28 µmol) were mixed with 3mL of 1:1
H2O:isopropanol. The cloudy dispersion was stirred at room temperature. After 45 min, the solution
turned transparent and small drops of gels formed and stuck to the sides of the glass. The final elastomer
was comparable to the thermally prepared counterpart in terms of its supramolecular state (it dissolves in
THF/chaotropic salt solution, but only swells, and does not dissolve in good solvents for silicones).
Reaction of 2 with 3-azido-1-propanol
3-Azido-1-propanol was synthesized according to a previously described procedure.4
Propiolate-
terminated PDMS (0.44 g, 0.21 mmol of alkyne) and 3-azido-1-propanol (0.09 g, 0.29 mmol) were added
to a scintillation vial with 7 mL of 1:1 H2O:IPA and left to stir at 80 C for 5 days at which time a viscous
oil was observed that was comprised of triazole-modified silicone, as confirmed by 1H NMR.
1H NMR (CDCl3, 250 MHz, δ): 0.05 (s, 320H, SiCH3); 0.59 (t, 4H, J=8.3 Hz, SiCH2CH2CH2CH2); 1.44
(m, 4H, SiCH2CH2CH2CH2); 1.81 (m, 4H, HOCH2CH2CH2); 2.15 (m, 4H, SiCH2CH2CH2CH2); 3,65 (m,
4H, HOCH2CH2CH2); 4.33 (t, 4H, J=6.5 Hz, SiCH2CH2CH2CH2); 4.58 (t, 4H, J=6.9 Hz,
HOCH2CH2CH2); 8.10, 8.11 (s, 2H, CH aromatic).
Synthesis of mono-(6-deoxy-6-azido)-peracylated-β-cyclodextrin 6
Mono-6-deoxy-6-azido-β-cyclodextrin was synthesized according to the previously published
procedure:5 an adaptation of the procedure by Noomen et al.
6 was used to synthesize the azido
peracylated-β-cyclodextrin. Azido-β-cyclodextrin 1 (0.45 g, 0.38 mmol), DMAP (cat, 3.50 mg), acetic
anhydride (3 ml ~3.24 g, 31.74 mmol) and pyridine (5 mL) were added to a 20 mL scintillation vial,
sealed and stirred at 80 °C for 96 h (the mixture turned transparent upon mixing and heating). The
reaction was removed from heat and allowed to cool to room temperature. Upon cooling in an ice bath, no
product precipitated. The mixture was precipitated in 100 mL of cold water, vacuum filtered and allowed
to dry on the filter paper and placed in a vacuum desiccator for 48 h, at which time 0.55 g of product
(73% yield) was recovered.
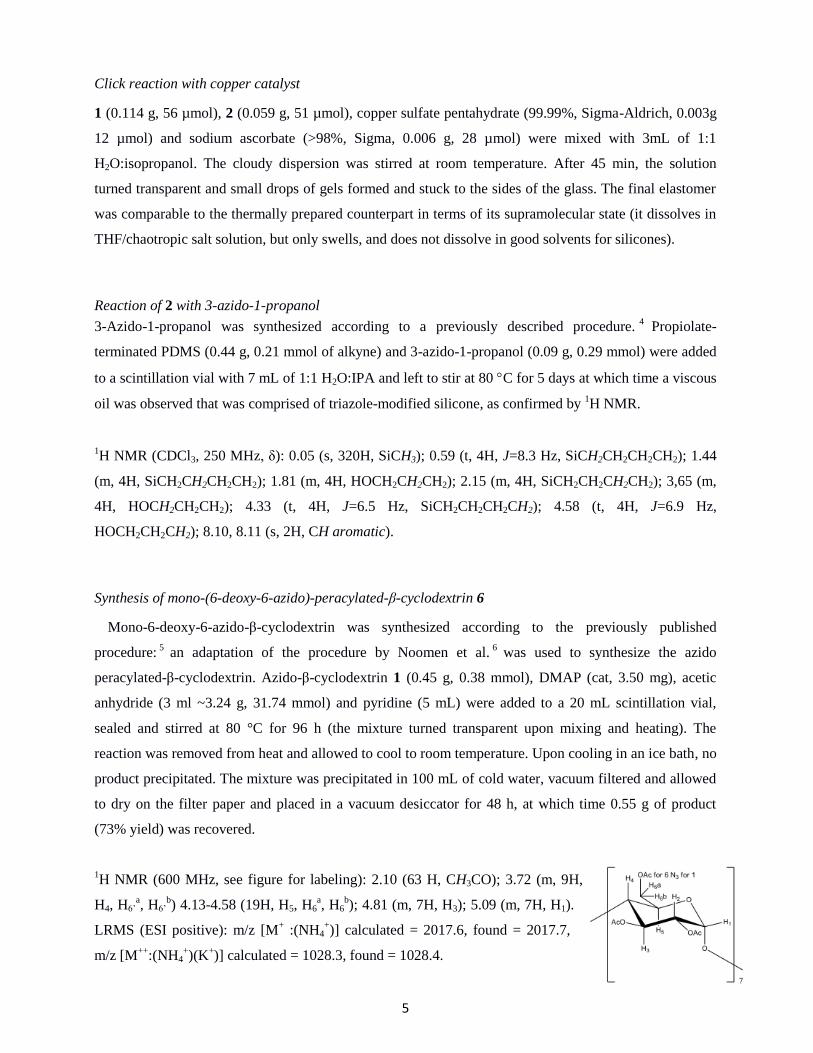
1H NMR (600 MHz, see figure for labeling): 2.10 (63 H, CH3CO); 3.72 (m, 9H,
H4, H6’a, H6’
b) 4.13-4.58 (19H, H5, H6
a, H6
b); 4.81 (m, 7H, H3); 5.09 (m, 7H, H1).
LRMS (ESI positive): m/z [M+ :(NH4
+)] calculated = 2017.6, found = 2017.7,
m/z [M++
:(NH4+)(K
+)] calculated = 1028.3, found = 1028.4.
6
Acylated-β-Cyclodextrin-functional PDMS 7 (Thermal Cycloaddition)
6 (0.41 g, 0.20 mmol) and 2 (0.40 g, 0.20 mmol of alkynyl groups) were weighed into a 10 mL round-
bottomed flask fit with a condenser. The reagents were homogenized with 1 mL of toluene + 1 mL of
CHCl3 and stirred at 90 °C. The initial reaction mixture was colorless and transparent. As the reaction
progressed, the mixture turned to yellow and finally to a light brown. At 144 h, the reaction was found to
be complete by proton NMR (75% conversion) as demonstrated by the disappearance of the C-H signal
from the propiolate (2.87 ppm), the appearance of the C-H aromatic signals from triazole of the product
(8.15 - 8.24 ppm) and the splitting pattern of the CH2 Si. Two signals were observed, one
corresponding to the product integrating to 1.5 and one corresponding to the starting material integrating
to 0.5. The reaction was stopped at this time to mirror the reaction progress with the non-acylated
cyclodextrin. Upon removal of the solvent, the product was transparent brown solid of mass 0.74 g (91%
yield). The product could be dissolved in various organic solvents.
1H NMR (600 MHz): 0.07 (s, 288 H, SiCH3); 0.58 (t, 4H, J=9 Hz, SiCH2CH2CH2CH2); 1.45 (m, 4H,
SiCH2CH2CH2CH2); 1.81 (m, 4H, SiCH2CH2CH2CH2) 2.10 (126 H, CH3CO); 3.72 (m, 18H, H4, H6’a, H6’
b)
4.13-4.58 (42H, H5, H6a, H6
b, SiCH2CH2CH2CH2); 4.81 (m, 14H, H3); 5.09 (m, 14H, H1); 8.05, 8.16 (s,
2H, C-H aromatic). Note that some of the silicone polymers reacted at only one end, such that residual
SiCH2CH2CH2CH2OCOCH groups were present with additional signals at 0.53, 1.38, 1.68 and 2.87 ppm
along with a small amount of unreacted compound 6 whose signals overlapped with the product.

7
Characterization of synthons
Figure S1. Electrospray-mass spectrum of N3-β-CD protonated by Na+ (main peak at 1183.4 g/mol).
Figure S2. FTIR spectra of starting material: (top) N3-β-CD 1; (bottom) Propiolate-PDMS 2.
Wavenumber (cm-1)
Tran
smit
ance
(%
)
8
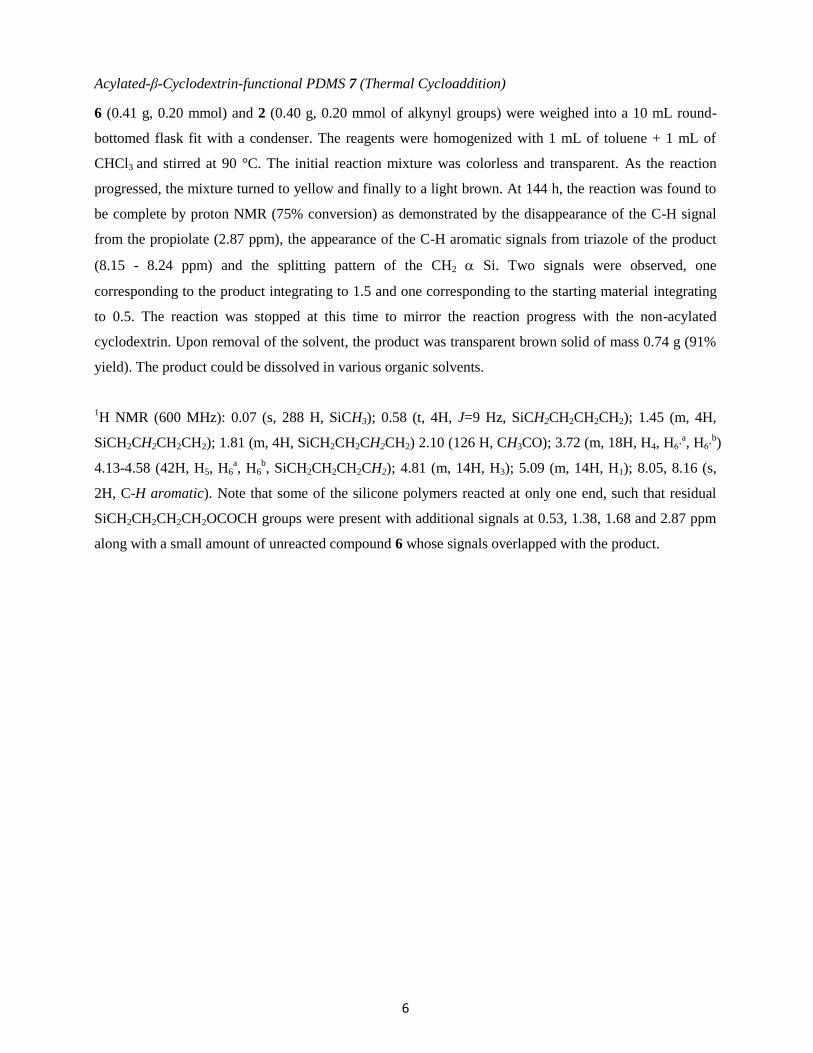
Figure S3. 1H NMR spectra of propiolate-PDMS 2 in CDCl3:
Figuree S4. TGA of N3-β-CD 1 and and propiolate-PDMS 2.
100
80
60
40
20
00 200 400 600 800
Wei
ght
(%)
Temperature (°C)
N3-β-CD
Propriolate-PDMS 2

9
Characterization of α,- (β-CD functionalized) -PDMS
Figure S5. Zoom on the FTIR region of OH stretch for propriolate PDMS 2 (top) and elastomer 4
(bottom).
Figure S6. 1H HRMAS spectrum of the elastomer 5.

10
Figure S7. DSC cycles of the elastomer 4.
Figure S8: TGA of 4 (thin line) and 5 (thick line) elastomers.
50 150 250 350 450 550 650
0
20
40
60
80
100
Weig
ht (%
)
Temperature (°C)
Temperature (°C)
Hea
t fl
ow
(W
/g)
11
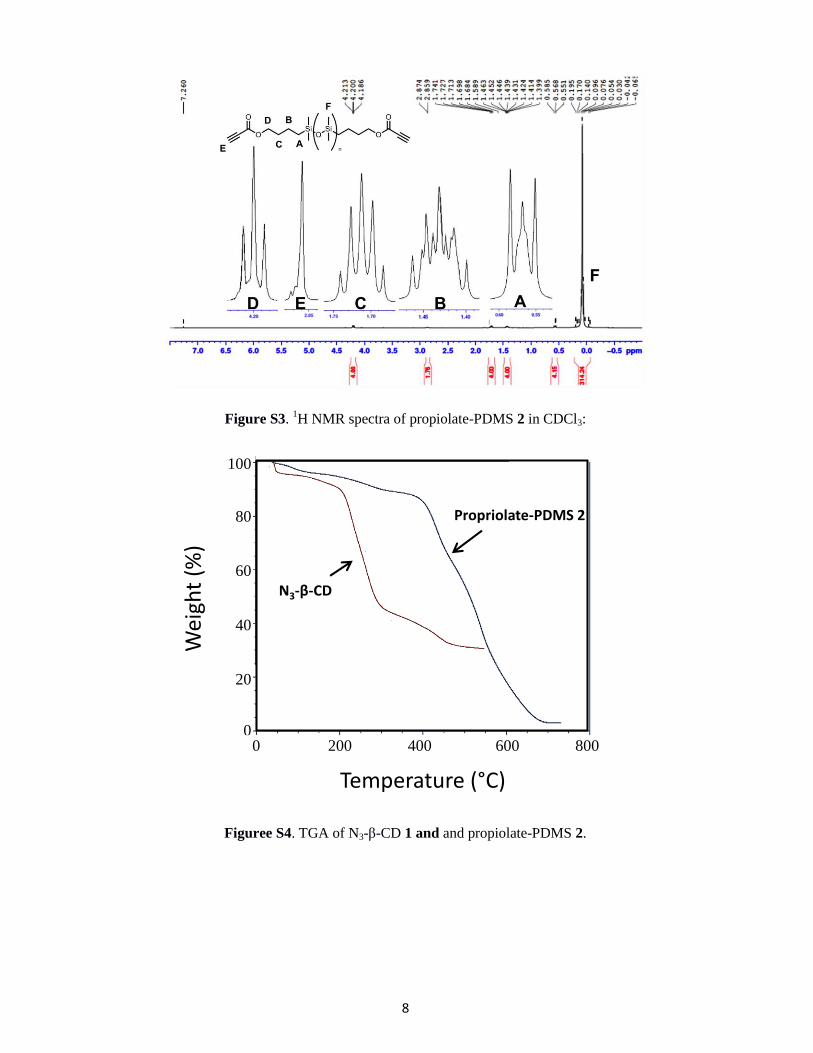
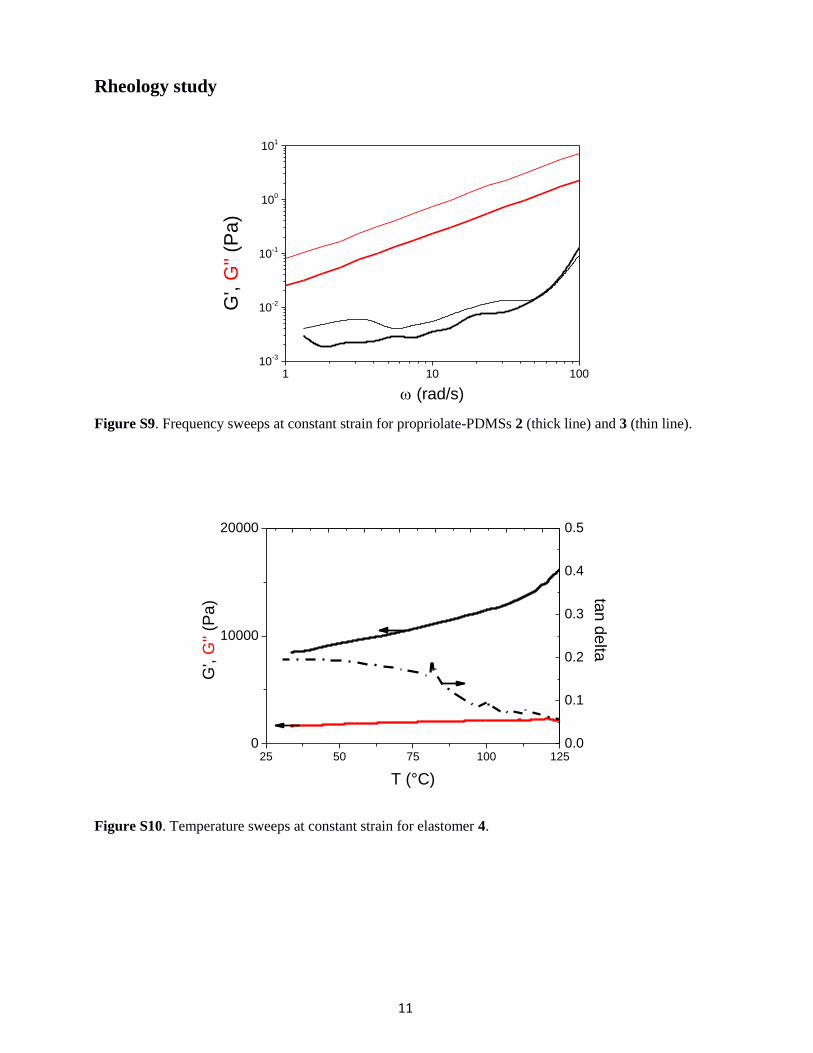
Rheology study
Figure S9. Frequency sweeps at constant strain for propriolate-PDMSs 2 (thick line) and 3 (thin line).
Figure S10. Temperature sweeps at constant strain for elastomer 4.
1 10 10010
-3
10-2
10-1
100
101
G',
G''
(Pa
)
(rad/s)
25 50 75 100 1250
10000
20000
G',
G''
(Pa)
T (°C)
0.0
0.1
0.2
0.3
0.4
0.5
tan d
elta
12
Figure S11. Complex viscosity versus angular frequency for elastomers 4 (thick line) and 5 (thin line).
0.1 1 10 10010
2
103
104
105
106
Co
mple
x v
isco
sity (
Pa.s
)
(rad/s)
13
Microscopy study
Figure S12: SEM images on a conventional TEM (a,b,e,f) and High Resolution TEM (c,d,g,h) of elastomers 4 (upper row) and 5 (bottom row).
a b c d
e f g h
14
Complementary analyses
Figure S13. 1H NMR spectrum in CDCl3 of acetylated β-CD 6.
Figure S14: 13
C NMR spectrum in CDCl3 of acetylated β-CD 6.
15
Figure S15: SEC analyses in THF of the original propriolate polymers 2, 3 and final elastomers 4 and 5
after the click reaction with 1, and solubilization in a chaotropic salt/THF solution. The fact that the molar
masses of the complexes show an increased mass suggests that some aggregation is occurring owing to
the poor THF solubility of the CD end chains.
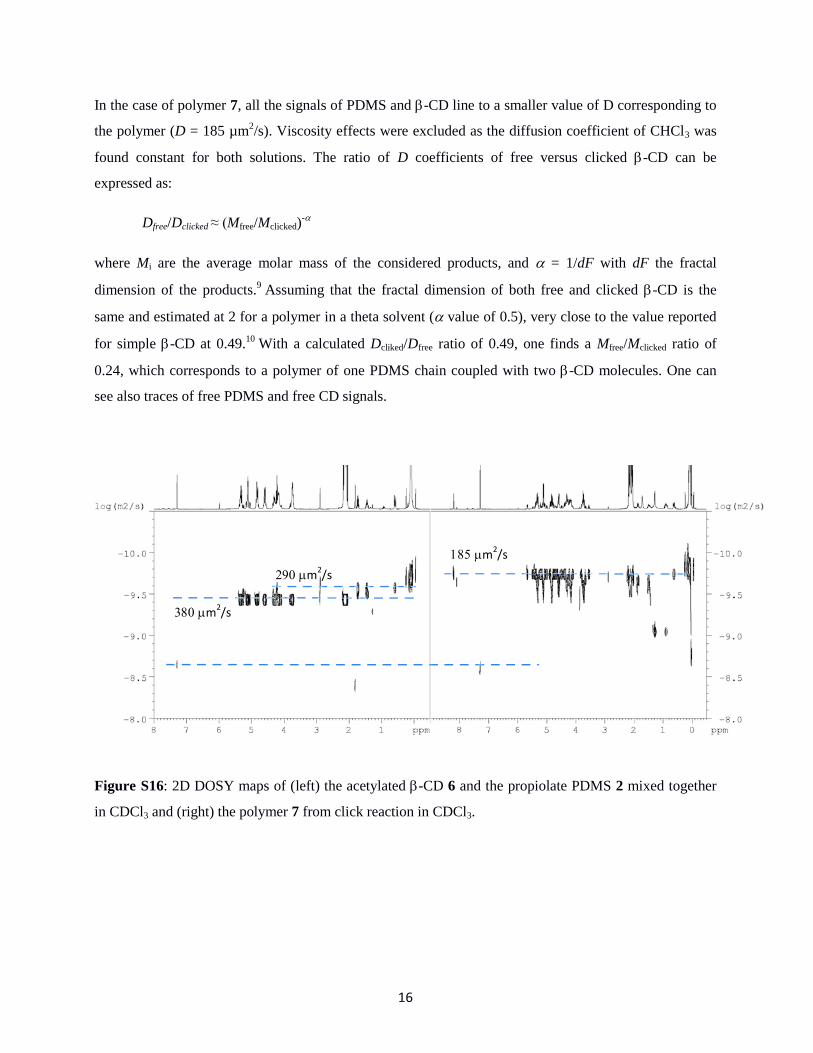
DOSY measurements and interpretation
A specific study on the interactions between acetylated cyclodextrin 6 and PDMS propriolate 2 was first
carried out to check whether the cyclodextrin cage could accommodate alkyne groups or PDMS chains in
its core. The mixture was first prepared in CDCl3, introducing 26.6 mg of 6 and 26.5 mg of 2 in 1.15 g of
deuterated solvent (1/1 molar ratio alkyne/CD). First comparison of the 1H NMR spectra revealed no
shifting of the protons inside the cavities, as expected for a complexed cage (signals H3 and H5, see ref. 7,
for instance). The proton of the acetylene function around 3 ppm is slightly shifted, but this is due to its
inherent lability (also observed with dilution). DOSY analysis was done on this mixture and compared to
the polymer 7, obtained by click reaction between 6 and 2. 2D DOSY maps are shown in Figure S16. In
the mixture, the diffusion coefficients of 6 and terminal groups of 2 are close (380 vs. 290 µm2/s,
respectively). When considering the D (Me2SiO) units of the backbone, the diffusion coefficient is
slightly different (190 µm2/s, not shown), in better agreement with the molar mass differences (2007 and
4100 g/mol for 6 and 2, respectively). Such variation of D coefficients between main polymer units and
terminal groups has already been pointed out.8 Since the diffusion coefficients of both entities are clearly
separated, it is concluded that under these conditions, no tight bounding between PDMS and CD through
an inclusion complex was observed.
9 11 13 15 17 19 21
5 Mn=30300, D=2.60
4 Mn=28700, D=2.80
3 Mn=7800, D=1.95
w(log
M)
(a.u
.)
Retention volume (mL)
2 Mn=4100, D=2.05
16
In the case of polymer 7, all the signals of PDMS and -CD line to a smaller value of D corresponding to
the polymer (D = 185 µm2/s). Viscosity effects were excluded as the diffusion coefficient of CHCl3 was
found constant for both solutions. The ratio of D coefficients of free versus clicked -CD can be
expressed as:
Dfree/Dclicked ≈ (Mfree/Mclicked)-
where Mi are the average molar mass of the considered products, and = 1/dF with dF the fractal
dimension of the products.9 Assuming that the fractal dimension of both free and clicked -CD is the
same and estimated at 2 for a polymer in a theta solvent ( value of 0.5), very close to the value reported
for simple -CD at 0.49.10
With a calculated Dcliked/Dfree ratio of 0.49, one finds a Mfree/Mclicked ratio of
0.24, which corresponds to a polymer of one PDMS chain coupled with two -CD molecules. One can
see also traces of free PDMS and free CD signals.
Figure S16: 2D DOSY maps of (left) the acetylated -CD 6 and the propiolate PDMS 2 mixed together
in CDCl3 and (right) the polymer 7 from click reaction in CDCl3.
m2/s
m2/s
m2/s
17
References for supporting information
1. R. C. Petter, J. S. Salek, C. T. Sikorski, G. Kumaravel, F. T. Lin J. Am. Chem. Soc. 1990, 112, 3860.
2. J. S. Trent, J. I. Scheinbeim, P. R. Couchman Macromolecules 1983, 16, 589.
3. T. Rambarran, F. Gonzaga, M. A. Brook Macromolecules 2012, 45, 2276.
4. S. El Habnouni , V. Darcos , X. Garric , J.-P. Lavigne , B. Nottelet, J. Couda Adv. Funct. Mater. 2011,
21, 3321.
5. W. Tang, S. C. Ng, Nature Protocols 2008, 3, 691.
6. A. Noomen, A. Penciu, S. Hbaieb, H. Parrot-Lopez et al. Mat. Sci. Eng. C 2008, 28, 705.
7. A. Calderini, F. B. T. Pessine, M. H. Martins, J. Incl. Phenom. Macrocycl. Chem. 2013, 75, 77; R.
Ferrazza, B. Rossi, G. Guella, J. Phys. Chem. B 2014, 118, 7147.
8. J. Viéville, M. Tanty, M.-A. Delsuc, J. Magnet. Res. 2011, 212, 169. See also a recent paper showing
the interest of using PDMS in DOSY experiments: S. Huan, J. Gao, R. Wu, S. Li, Z. Bai, Angew. Chem.
Int. Ed. 2014, 53, 11592.
9. S. Augé, P.-O. Schmit, C. A. Crutchfield, M. T. Islam et al. J. Phys. Chem. B 2009, 113, 1914.
10. S. Viel, D. Capitani, L. Mannina, A. Segre, Biomacromolecules 2003, 4, 1843.