Embed Size (px)
Citation preview

Syngeneic Models
for Drug-Host Immune System Interactions Study
December 2015
About Syngeneic Models…
Rodent tumor cells
• Express the mouse/rat homologues of the targets
• Tumor tend to grow fast
Long history of use
• Strong baseline of drug response data
• Wide variety of tumor types
Easy study
• Drug-host immune system interaction study
• Relatively low cost
• Reproducible
page 2 Confidential 2/9/2016

SYNGENEIC MODELS AT
ONCODESIGN
page 3 Confidential 2/9/2016
page 4 Confidential 2/9/2016
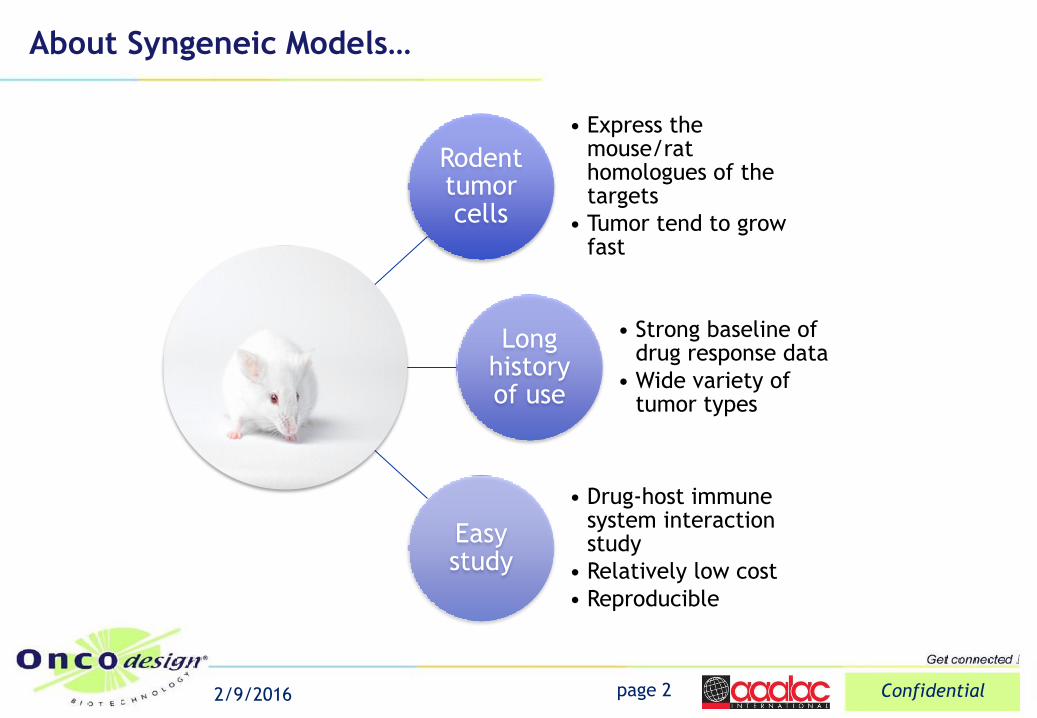
Syngeneic Models at Oncodesign
Model Organ Host rodent
species
Injection
site Tested drugs
Metastatic
Dissemination
4T1 Breast carcinoma Balb/c mouse OT Radiotherapy, Doxorubicin, PD-1 mAb,
CTLA-4 mAb
A20 B cell lymphoma Balb/c mouse SC IV CTLA-4 mAb, PD-1 mAb
AB12 Mesothelioma Balb/c mouse SC
AY27 Bladder transitional
carcinoma Ficher rat OT BCG, CDDP
B16-F10 Malignant melanoma C57Bl/6 mouse SC IV IC Paclitaxel, Doxorubicin, TMZ, PD-1 mAb,
Cyclophosphamide, CTLA-4 mAb, PD-L1 mAb
C1498 AML C57Bl/6 mouse SC IV
C26 Colon adenocarcinoma Balb/c mouse IP SC CDDP
C38 Colon carcinoma C57Bl/6 mouse SC Radiotherapy, CPT-11, L-OHP, CTLA-4
C-51 Colon carcinoma Balb/c mouse SC CPT-11, LOHP
C6 Glioma Wistar rat OT SC BCNU
CT26 Colon carcinoma Balb/c mouse OT SC 5-FU, CPT-11, PD-1 mAb, CTLA-4 mAb,
PD-L1 mAb
*DHD/K12/TRb =
PROb Colon adenocarcinoma BDIX rat IP SC
CDDP, Doxorubicin, BCG, 5-FU, L-OHP,
Mitoxantrone
*DHD/K12/TSb =
REGb Colon adenocarcinoma BDIX rat SC
EMT6 Breast carcinoma Balb/c mouse OT SC Doxorubicin, Paclitaxel, Radiotherapy, PD-1
mAb, CTLA-4 mAb
GS-9L Gliosarcoma Ficher rat OT SC BCNU, TMZ
Good characterization
Characterization not complete
Limited characterization
* Ask for rat availability
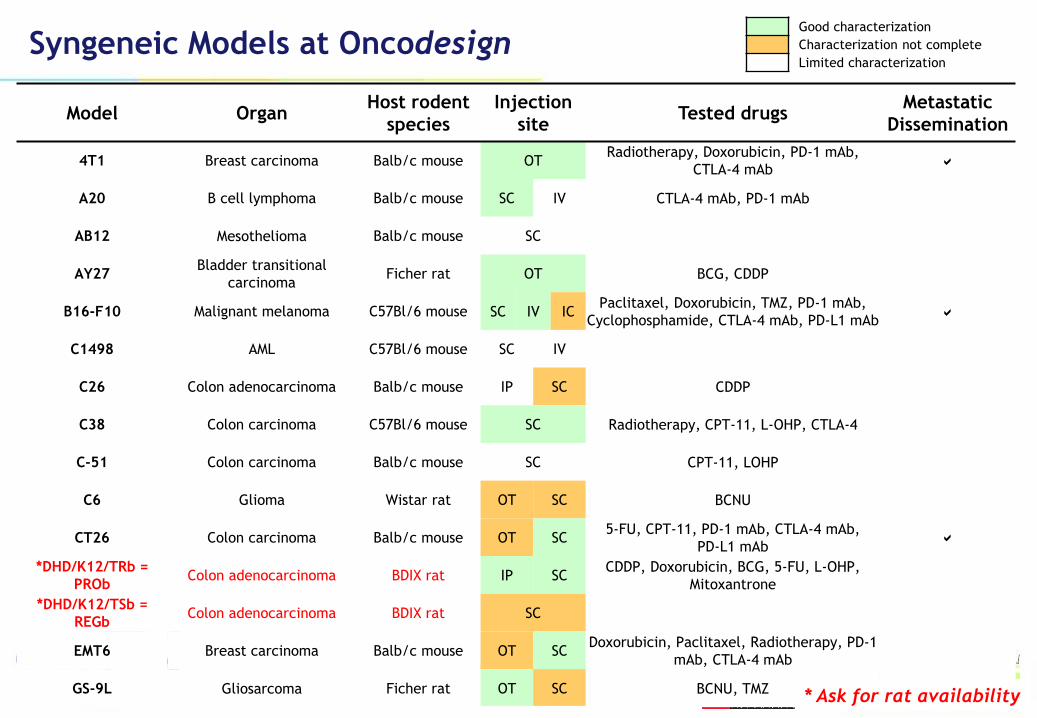
Syngeneic Models at Oncodesign
Model Organ Host rodent
species
Injection
site Tested drugs
Metastatic
Dissemination
*GV1A1 Glioma BDIX rat OT SC
Hepa1-6 Hepatocarcinoma C57Bl/6 mouse OT Sorafenib, CTLA-4 mAb
L1210 Lymphocytic leukemia DBA/2 mouse IP BCNU, CDDP, Doxorubicin, 5-FU
L-OHP, Mitoxantrone
L1210/CDDP Lymphocytic leukemia DBA/2 mouse IP CDDP, L-OHP
LLC1 Lewis lung carcinoma C57Bl/6 mouse IV SC Vinorelbine, Cyclophosphamide
CTLA-4 mAb, PD-1 mAb
MAT-LyLu Prostate adenocarcinoma Cop rat SC
MBT-2 Bladder carcinoma C3H mouse OT SC BCG, Mitomycin C, PD-1
MPC-11 Plasmacytoma Balb/c mouse SC
NBT-II Bladder carcinoma Wistar rat OT
P388 Leukemia DBA/2 mouse IP BCNU, Doxorubicin,
Mitoxantrone
P388/ADR Leukemia DBA/2 mouse IP BCNU, Doxorubicin,
Vinblastine
R3327-AT3 Prostate adenocarcinoma Cop rat SC
R3327H Prostate adenocarcinoma Cop rat OT SC
Paclitaxel, Mitoxantrone, Trastuzumab,
Leuroprolin, Castration, Decapeptyl,
Bicalutamide, Radiotherapy
Renca Kidney carcinoma Balb/c mouse OT SC CDDP, Paclitaxel, Radiotherapy,
Gemcitabine, Carboplatin, Sorafenib
Good characterization
Characterization not complete
Limited characterization
page 5 Confidential 2/9/2016 * Ask for rat availability
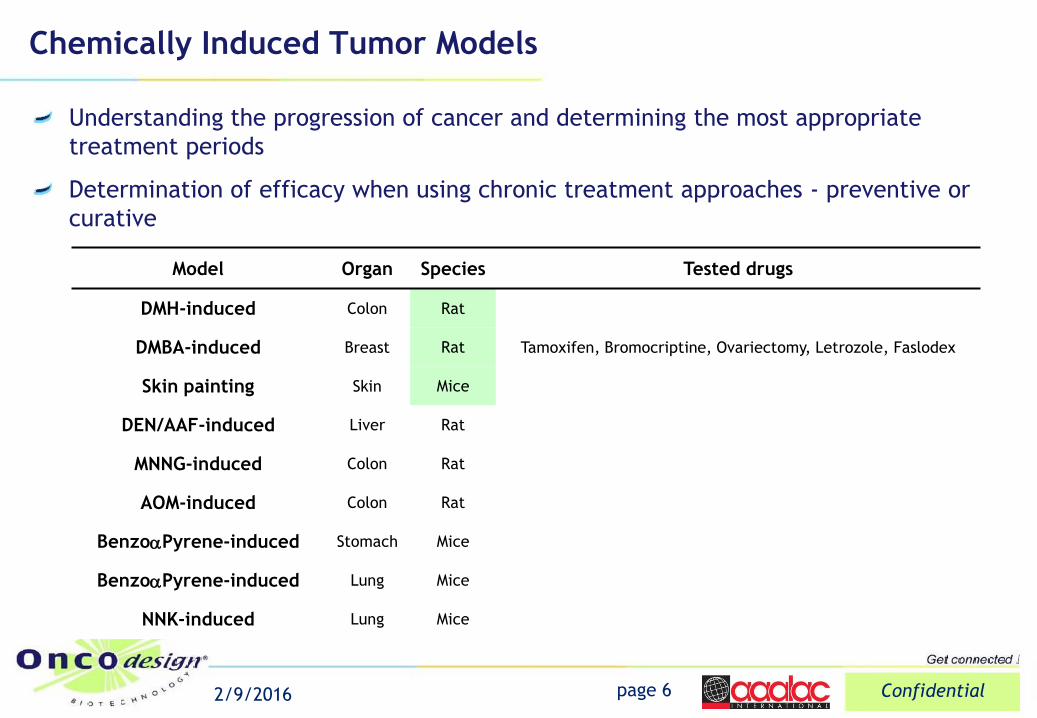
Chemically Induced Tumor Models
Understanding the progression of cancer and determining the most appropriate
treatment periods
Determination of efficacy when using chronic treatment approaches - preventive or
curative
page 6 Confidential 2/9/2016
Model Organ Species Tested drugs
DMH-induced Colon Rat
DMBA-induced Breast Rat Tamoxifen, Bromocriptine, Ovariectomy, Letrozole, Faslodex
Skin painting Skin Mice
DEN/AAF-induced Liver Rat
MNNG-induced Colon Rat
AOM-induced Colon Rat
BenzoPyrene-induced Stomach Mice
BenzoPyrene-induced Lung Mice
NNK-induced Lung Mice
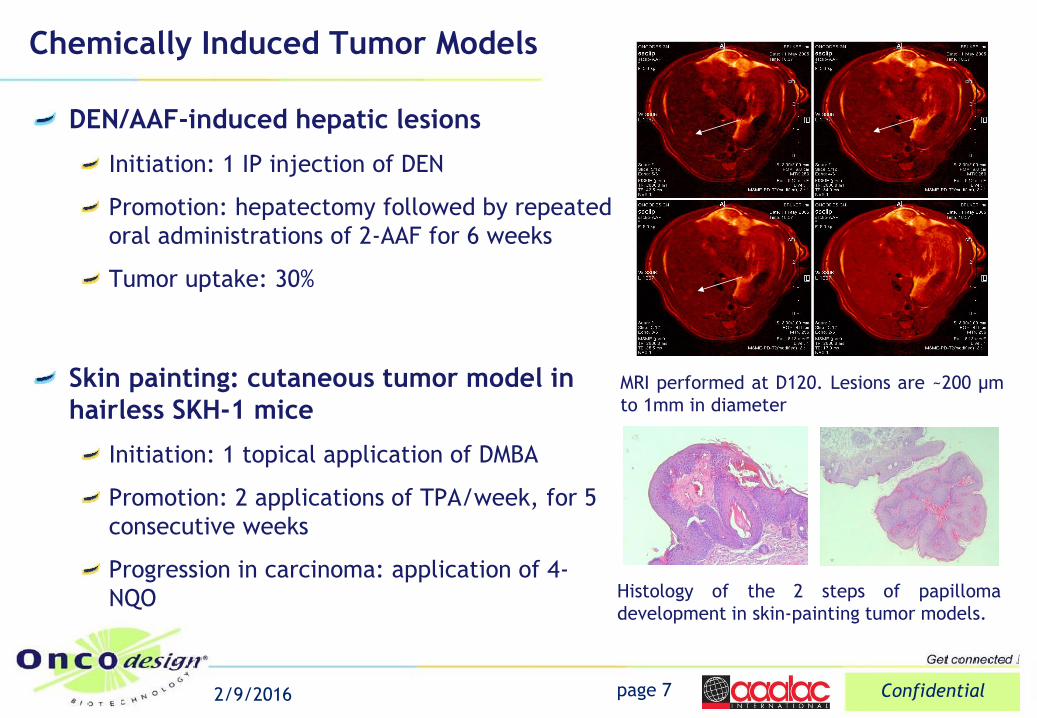
Chemically Induced Tumor Models
DEN/AAF-induced hepatic lesions
Initiation: 1 IP injection of DEN
Promotion: hepatectomy followed by repeated
oral administrations of 2-AAF for 6 weeks
Tumor uptake: 30%
Skin painting: cutaneous tumor model in
hairless SKH-1 mice
Initiation: 1 topical application of DMBA
Promotion: 2 applications of TPA/week, for 5
consecutive weeks
Progression in carcinoma: application of 4-
NQO
page 7 Confidential 2/9/2016
Histology of the 2 steps of papilloma
development in skin-painting tumor models.
MRI performed at D120. Lesions are ~200 µm
to 1mm in diameter

VALIDATED SYNGENEIC MODELS
AND ASSOCIATED DATA
page 8 Confidential 2/9/2016
0
25
50
75
100
125
150
175
Lung metastasis Liver metastasis
Media
n a
nd m
eta
stasi
s num
ber
repart
itio
n (
D28)
per
mouse
4T1Balb/c Female MiceMfp engrafment at D0
Sacrifice: D28
(C)
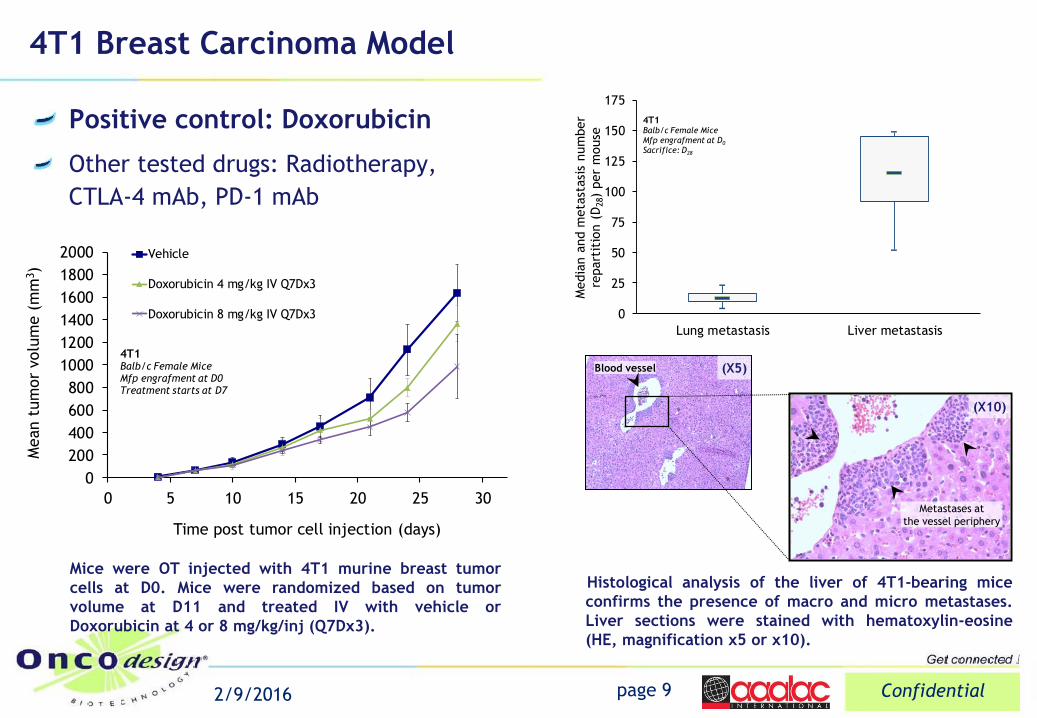
4T1 Breast Carcinoma Model
Positive control: Doxorubicin
Other tested drugs: Radiotherapy,
CTLA-4 mAb, PD-1 mAb
page 9 Confidential 2/9/2016
(X5)
(X10)
Blood vessel
Metastases at
the vessel periphery
0
200
400
600
800
1000
1200
1400
1600
1800
2000
0 5 10 15 20 25 30
Mean t
um
or
volu
me (
mm
3)
Time post tumor cell injection (days)
Vehicle
Doxorubicin 4 mg/kg IV Q7Dx3
Doxorubicin 8 mg/kg IV Q7Dx3
4T1Balb/c Female MiceMfp engrafment at D0Treatment starts at D7
Mice were OT injected with 4T1 murine breast tumor
cells at D0. Mice were randomized based on tumor
volume at D11 and treated IV with vehicle or
Doxorubicin at 4 or 8 mg/kg/inj (Q7Dx3).
Histological analysis of the liver of 4T1-bearing mice
confirms the presence of macro and micro metastases.
Liver sections were stained with hematoxylin-eosine
(HE, magnification x5 or x10).
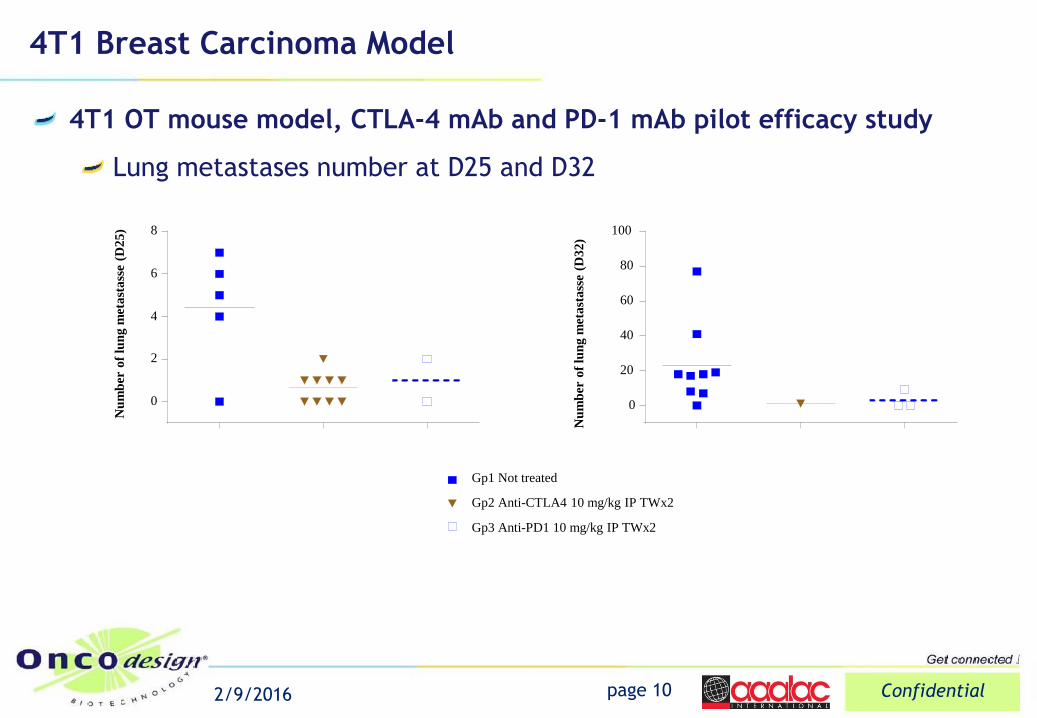
4T1 Breast Carcinoma Model
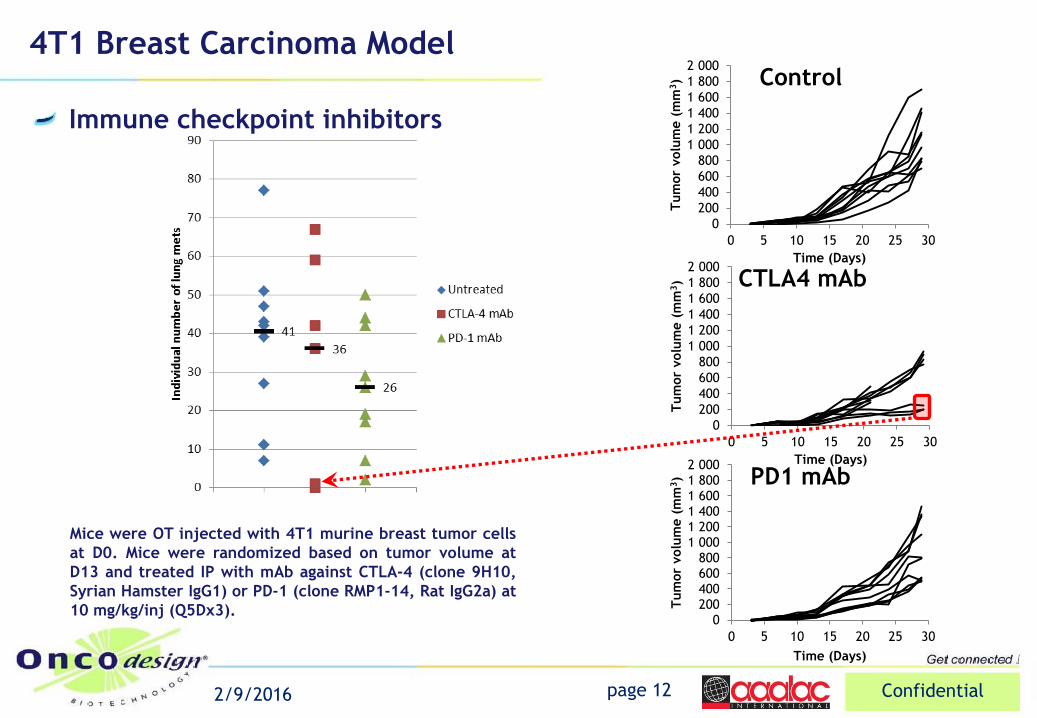
4T1 OT mouse model, CTLA-4 mAb and PD-1 mAb pilot efficacy study
Lung metastases number at D25 and D32
page 10 Confidential 2/9/2016
Nu
mb
er o
f lu
ng
met
ast
ass
e (D
25
)
0
2
4
6
8
0
20
40
60
80
100
Nu
mb
er o
f lu
ng
met
ast
ass
e (D
32
)
Gp1 Not treated
Gp2 Anti-CTLA4 10 mg/kg IP TWx2
Gp3 Anti-PD1 10 mg/kg IP TWx2
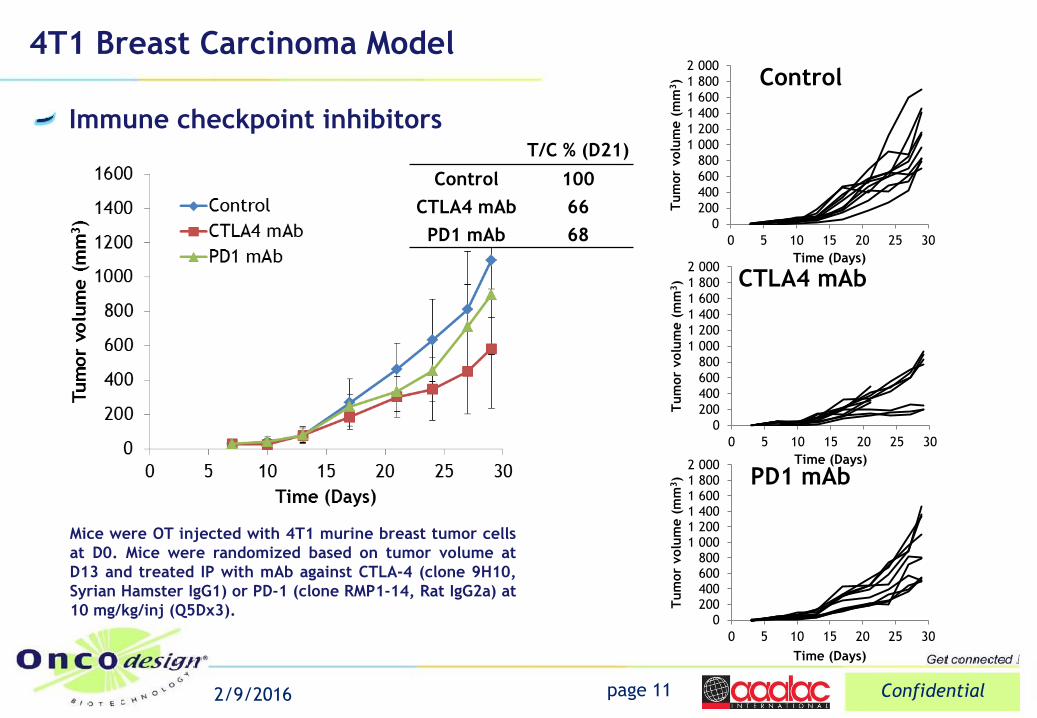
4T1 Breast Carcinoma Model
page 11 Confidential 2/9/2016
Mice were OT injected with 4T1 murine breast tumor cells
at D0. Mice were randomized based on tumor volume at
D13 and treated IP with mAb against CTLA-4 (clone 9H10,
Syrian Hamster IgG1) or PD-1 (clone RMP1-14, Rat IgG2a) at
10 mg/kg/inj (Q5Dx3).
Immune checkpoint inhibitors
0
200
400
600
800
1 000
1 200
1 400
1 600
1 800
2 000
0 5 10 15 20 25 30
Tum
or
volu
me (
mm
3)
Time (Days)
Control
0
200
400
600
800
1 000
1 200
1 400
1 600
1 800
2 000
0 5 10 15 20 25 30
Tum
or
volu
me (
mm
3)
Time (Days)
CTLA4 mAb
0200400600800
1 0001 2001 4001 6001 8002 000
0 5 10 15 20 25 30
Tum
or
volu
me (
mm
3)
Time (Days)
PD1 mAb
T/C % (D21)
Control 100
CTLA4 mAb 66
PD1 mAb 68
4T1 Breast Carcinoma Model
Mice were OT injected with 4T1 murine breast tumor cells
at D0. Mice were randomized based on tumor volume at
D13 and treated IP with mAb against CTLA-4 (clone 9H10,
Syrian Hamster IgG1) or PD-1 (clone RMP1-14, Rat IgG2a) at
10 mg/kg/inj (Q5Dx3).
Immune checkpoint inhibitors
0
200
400
600
800
1 000
1 200
1 400
1 600
1 800
2 000
0 5 10 15 20 25 30
Tum
or
volu
me (
mm
3)
Time (Days)
Control
0
200
400
600
800
1 000
1 200
1 400
1 600
1 800
2 000
0 5 10 15 20 25 30
Tum
or
volu
me (
mm
3)
Time (Days)
CTLA4 mAb
0200400600800
1 0001 2001 4001 6001 8002 000
0 5 10 15 20 25 30
Tum
or
volu
me (
mm
3)
Time (Days)
PD1 mAb
page 12 Confidential 2/9/2016
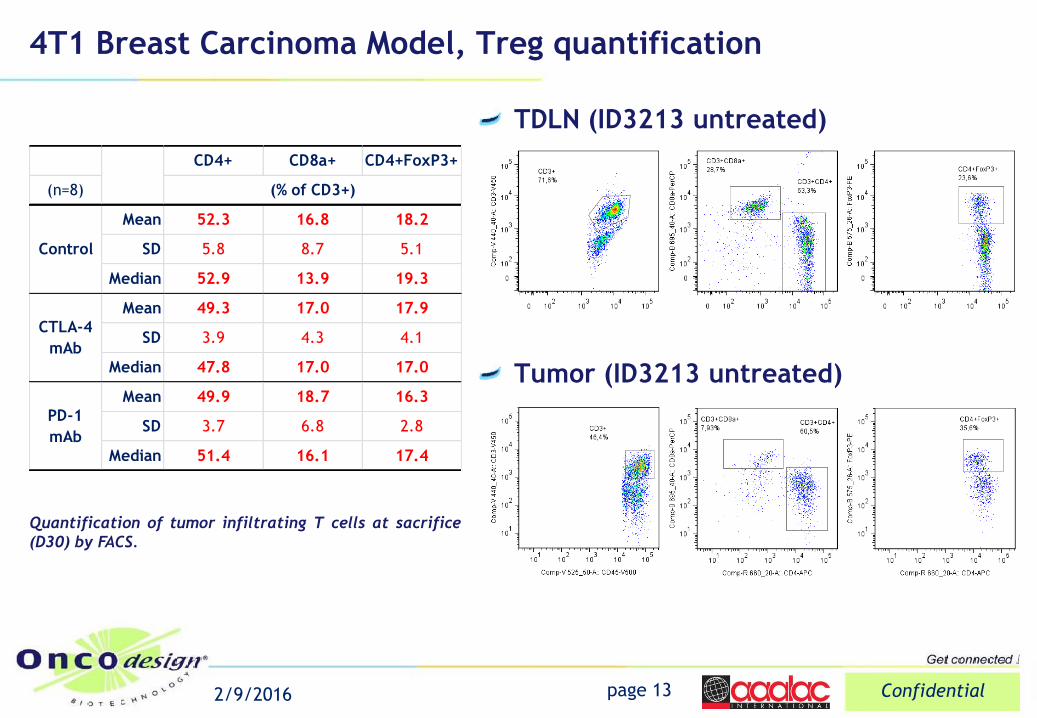
CD4+ CD8a+ CD4+FoxP3+
(n=8)
Mean 52.3 16.8 18.2
SD 5.8 8.7 5.1
Median 52.9 13.9 19.3
Mean 49.3 17.0 17.9
SD 3.9 4.3 4.1
Median 47.8 17.0 17.0
Mean 49.9 18.7 16.3
SD 3.7 6.8 2.8
Median 51.4 16.1 17.4
(% of CD3+)
Control
CTLA-4
mAb
PD-1
mAb
4T1 Breast Carcinoma Model, Treg quantification
TDLN (ID3213 untreated)
page 13 Confidential 2/9/2016
Tumor (ID3213 untreated)
Quantification of tumor infiltrating T cells at sacrifice
(D30) by FACS.
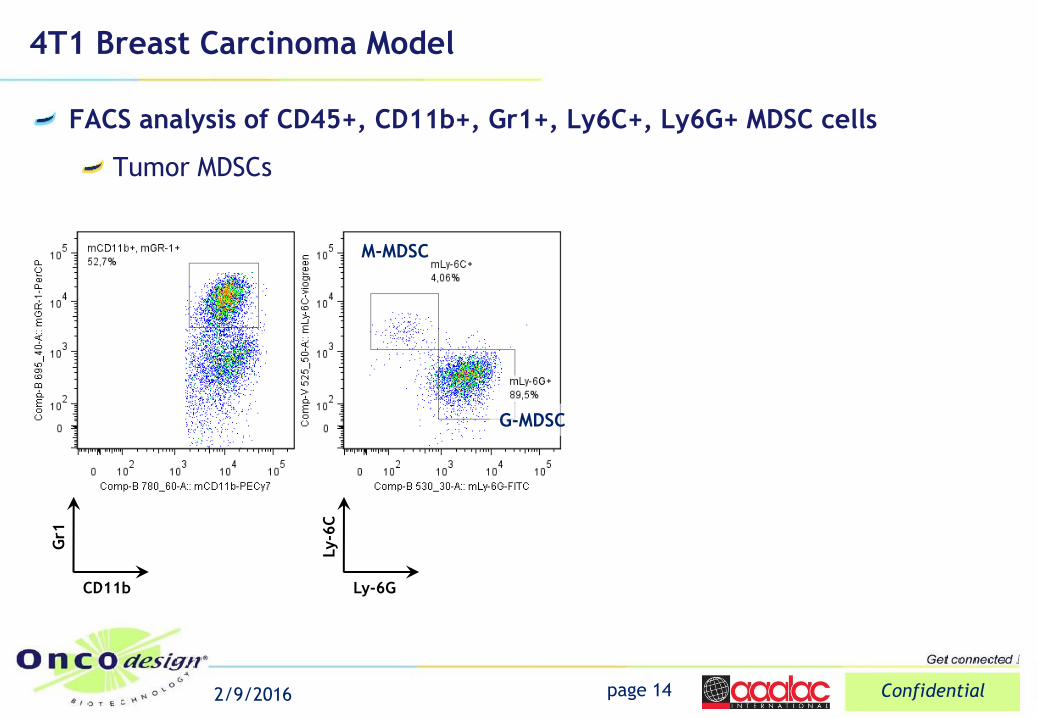
4T1 Breast Carcinoma Model
page 14 Confidential 2/9/2016
FACS analysis of CD45+, CD11b+, Gr1+, Ly6C+, Ly6G+ MDSC cells
Tumor MDSCs
G-MDSC
M-MDSC
Ly-6G
Ly-6
C
CD11b
Gr1
0
500
1 000
1 500
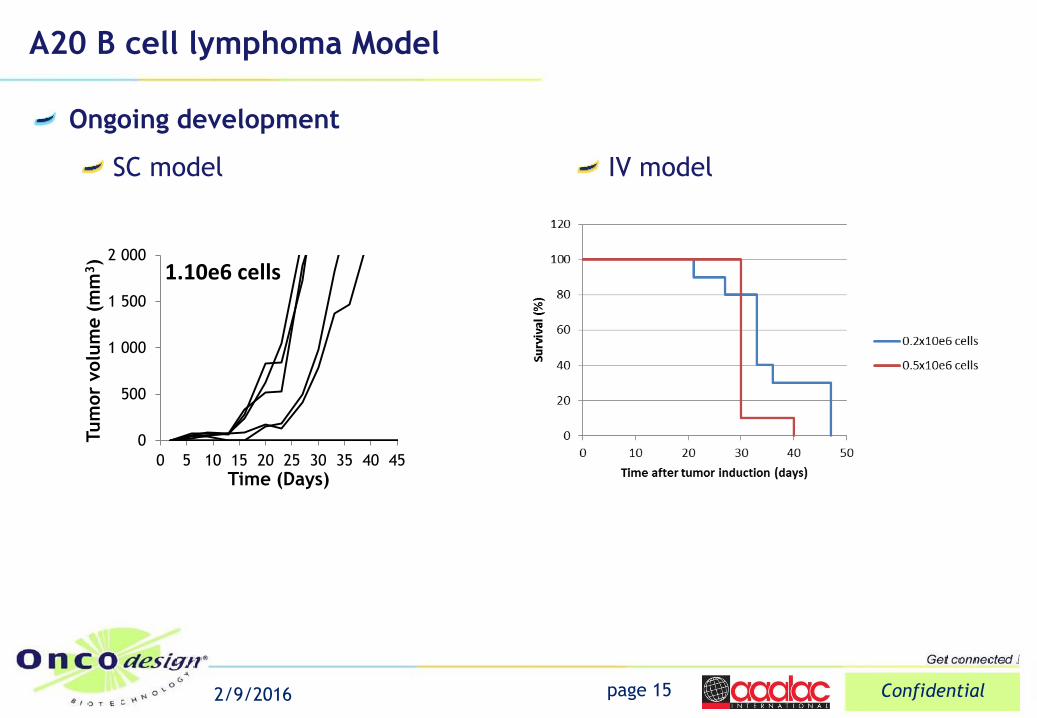
2 000
0 5 10 15 20 25 30 35 40 45
Tum
or
volu
me (
mm
3)
Time (Days)
1.10e6 cells
A20 B cell lymphoma Model
Ongoing development
SC model
page 15 Confidential 2/9/2016
IV model
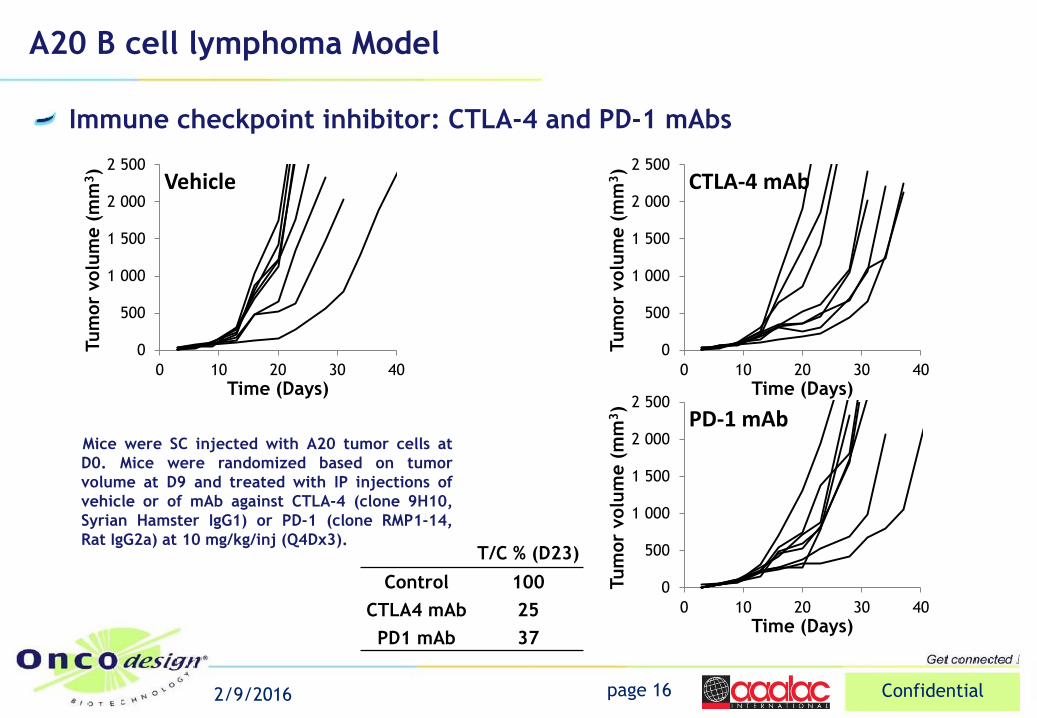
A20 B cell lymphoma Model
Mice were SC injected with A20 tumor cells at
D0. Mice were randomized based on tumor
volume at D9 and treated with IP injections of
vehicle or of mAb against CTLA-4 (clone 9H10,
Syrian Hamster IgG1) or PD-1 (clone RMP1-14,
Rat IgG2a) at 10 mg/kg/inj (Q4Dx3).
Immune checkpoint inhibitor: CTLA-4 and PD-1 mAbs
page 16 Confidential 2/9/2016
T/C % (D23)
Control 100
CTLA4 mAb 25
PD1 mAb 37
0
500
1 000
1 500
2 000
2 500
0 10 20 30 40
Tum
or
volu
me (
mm
3)
Time (Days)
Vehicle
0
500
1 000
1 500
2 000
2 500
0 10 20 30 40Tum
or
volu
me (
mm
3)
Time (Days)
PD-1 mAb
0
500
1 000
1 500
2 000
2 500
0 10 20 30 40
Tum
or
volu
me (
mm
3)
Time (Days)
CTLA-4 mAb
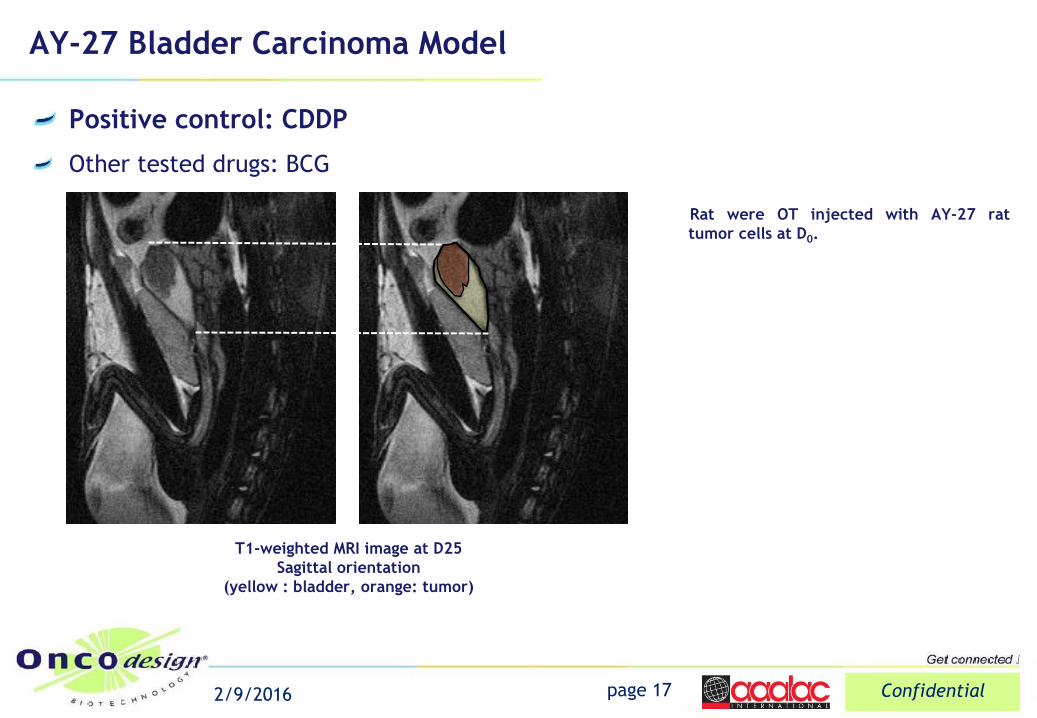
AY-27 Bladder Carcinoma Model
Positive control: CDDP
Other tested drugs: BCG
page 17 Confidential 2/9/2016
Rat were OT injected with AY-27 rat
tumor cells at D0.
T1-weighted MRI image at D25
Sagittal orientation
(yellow : bladder, orange: tumor)
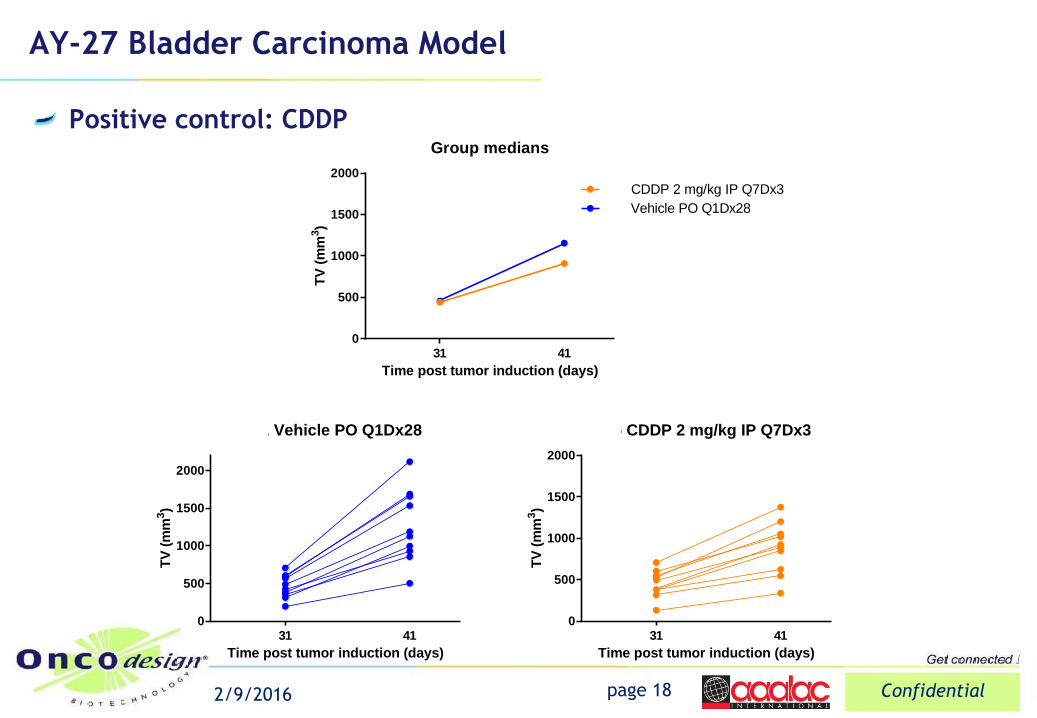
AY-27 Bladder Carcinoma Model
Positive control: CDDP
page 18 Confidential 2/9/2016
0
500
1000
1500
2000
Group medians
Time post tumor induction (days)
TV
(m
m3)
31 41
G5 CDDP 2 mg/kg IP Q7Dx3
G1 Vehicle PO Q1Dx28
0
500
1000
1500
2000
G1 Vehicle PO Q1Dx28
Time post tumor induction (days)
TV
(m
m3)
31 410
500
1000
1500
2000
G5 CDDP 2 mg/kg IP Q7Dx3
Time post tumor induction (days)
TV
(m
m3)
31 41
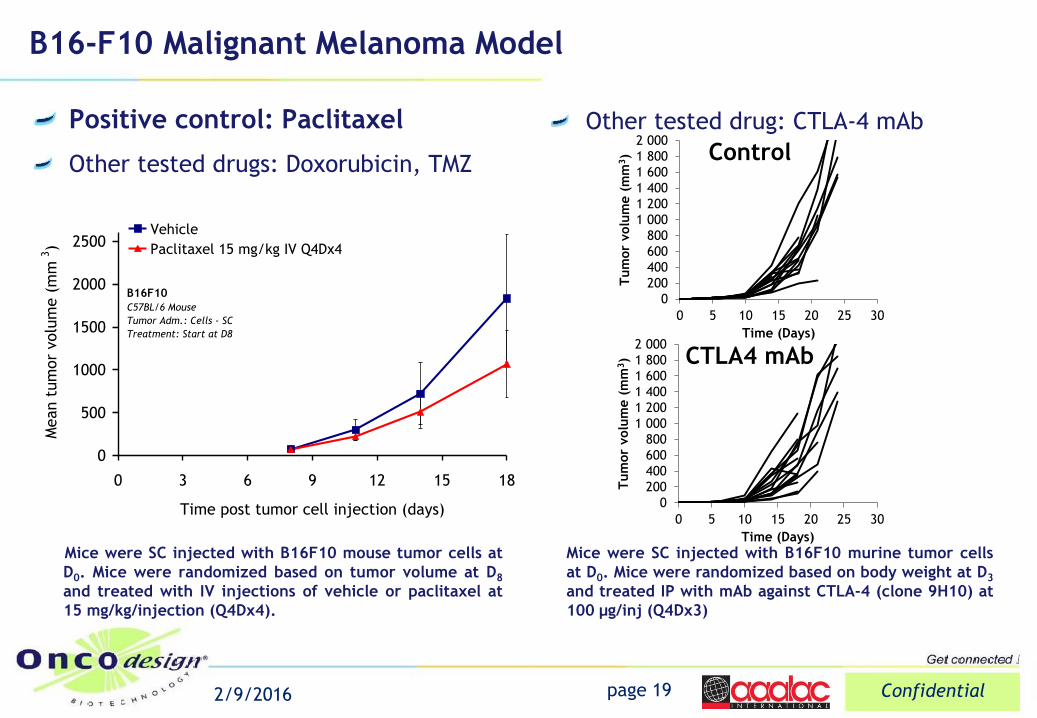
B16-F10 Malignant Melanoma Model
Positive control: Paclitaxel
Other tested drugs: Doxorubicin, TMZ
page 19 Confidential 2/9/2016
0
500
1000
1500
2000
2500
0 3 6 9 12 15 18
Time post tumor cell injection (days)
Mean t
um
or
volu
me (
mm
3)
Vehicle
Paclitaxel 15 mg/kg IV Q4Dx4
B16F10
C57BL/6 Mouse
Tumor Adm.: Cells - SC
Treatment: Start at D8
Mice were SC injected with B16F10 mouse tumor cells at
D0. Mice were randomized based on tumor volume at D8
and treated with IV injections of vehicle or paclitaxel at
15 mg/kg/injection (Q4Dx4).
Other tested drug: CTLA-4 mAb
Mice were SC injected with B16F10 murine tumor cells
at D0. Mice were randomized based on body weight at D3
and treated IP with mAb against CTLA-4 (clone 9H10) at
100 µg/inj (Q4Dx3)
0
200
400
600
800
1 000
1 200
1 400
1 600
1 800
2 000
0 5 10 15 20 25 30
Tum
or
volu
me (
mm
3)
Time (Days)
Control
0
200
400
600
800
1 000
1 200
1 400
1 600
1 800
2 000
0 5 10 15 20 25 30
Tum
or
volu
me (
mm
3)
Time (Days)
CTLA4 mAb
0
500
1 000
1 500
2 000
2 500
0 5 10 15 20 25 30 35
Tum
or
volu
me (
mm
3)
Time (Days)
Control
0
500
1 000
1 500
2 000
2 500
0 5 10 15 20 25 30 35Tum
or
volu
me (
mm
3)
Time (Days)
PD-L1
0
500
1 000
1 500
2 000
2 500
0 5 10 15 20 25 30 35
Tum
or
volu
me (
mm
3)
Time (Days)
CTLA-4
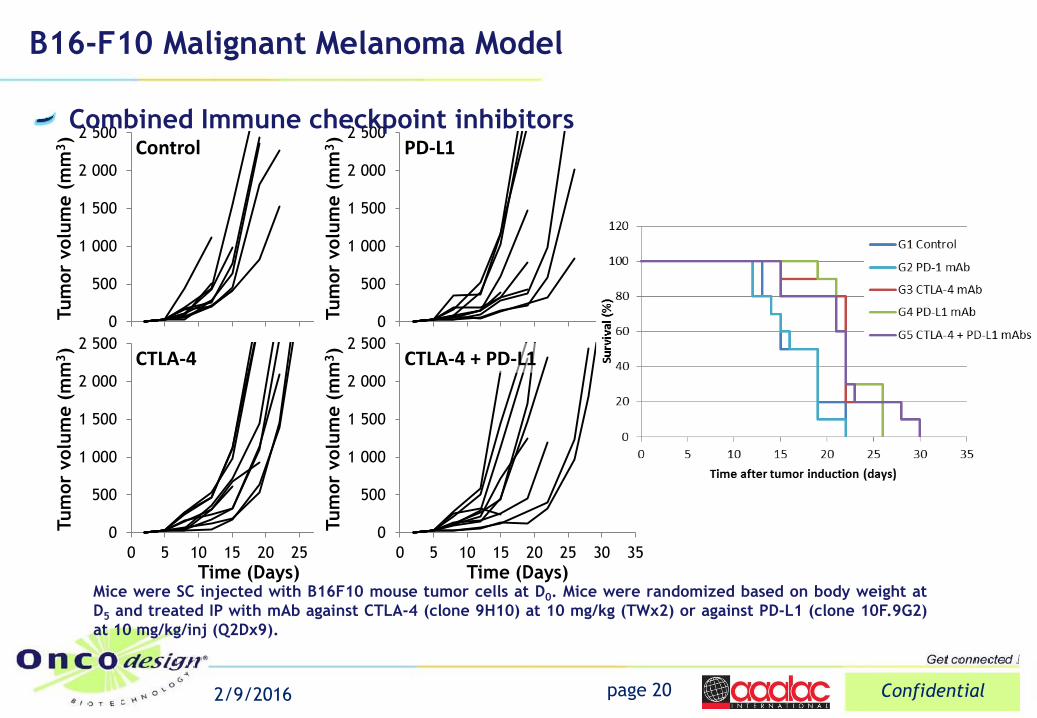
B16-F10 Malignant Melanoma Model
page 20 Confidential 2/9/2016
Mice were SC injected with B16F10 mouse tumor cells at D0. Mice were randomized based on body weight at
D5 and treated IP with mAb against CTLA-4 (clone 9H10) at 10 mg/kg (TWx2) or against PD-L1 (clone 10F.9G2)
at 10 mg/kg/inj (Q2Dx9).
Combined Immune checkpoint inhibitors
0
500
1 000
1 500
2 000
2 500
0 5 10 15 20 25 30 35
Tum
or
volu
me (
mm
3)
Time (Days)
CTLA-4 + PD-L1
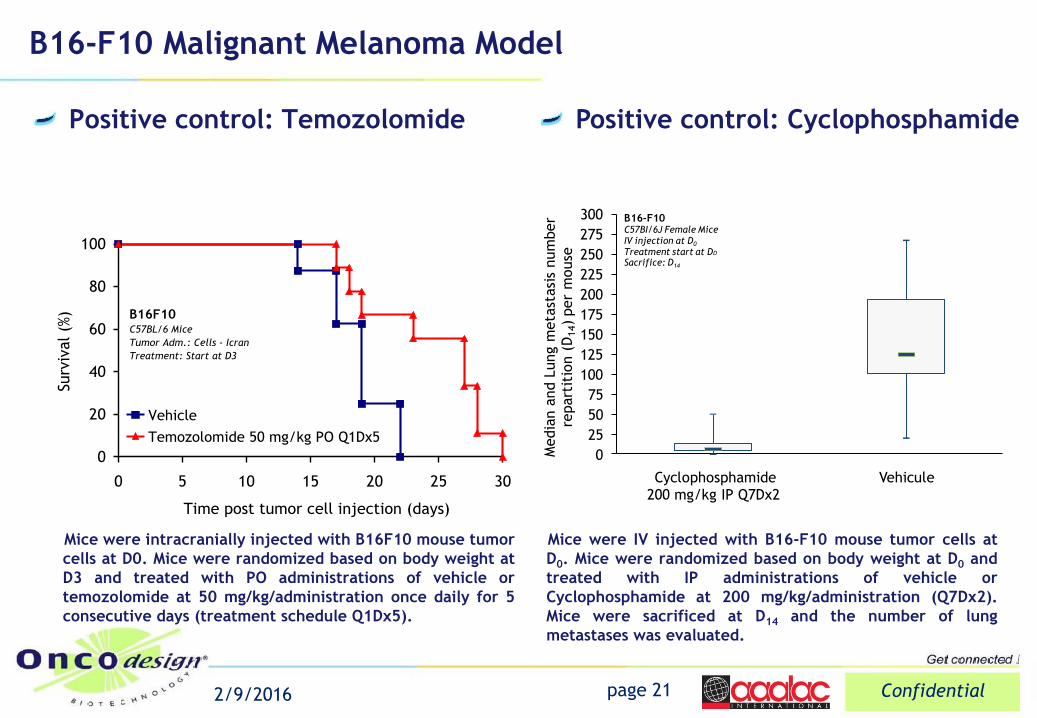
B16-F10 Malignant Melanoma Model
Positive control: Temozolomide
page 21 Confidential 2/9/2016
Mice were intracranially injected with B16F10 mouse tumor
cells at D0. Mice were randomized based on body weight at
D3 and treated with PO administrations of vehicle or
temozolomide at 50 mg/kg/administration once daily for 5
consecutive days (treatment schedule Q1Dx5).
0
20
40
60
80
100
0 5 10 15 20 25 30
Time post tumor cell injection (days)
Surv
ival (%
)
Vehicle
Temozolomide 50 mg/kg PO Q1Dx5
B16F10C57BL/6 Mice
Tumor Adm.: Cells - Icran
Treatment: Start at D3
0
25
50
75
100
125
150
175
200
225
250
275
300
Cyclophosphamide 200 mg/kg IP Q7Dx2
Vehicule
Media
n a
nd L
ung m
eta
stasi
s num
ber
repart
itio
n (
D14)
per
mouse
B16-F10C57BI/6J Female MiceIV injection at D0
Treatment start at DD
Sacrifice: D14
Mice were IV injected with B16-F10 mouse tumor cells at
D0. Mice were randomized based on body weight at D0 and
treated with IP administrations of vehicle or
Cyclophosphamide at 200 mg/kg/administration (Q7Dx2).
Mice were sacrificed at D14 and the number of lung
metastases was evaluated.
Positive control: Cyclophosphamide
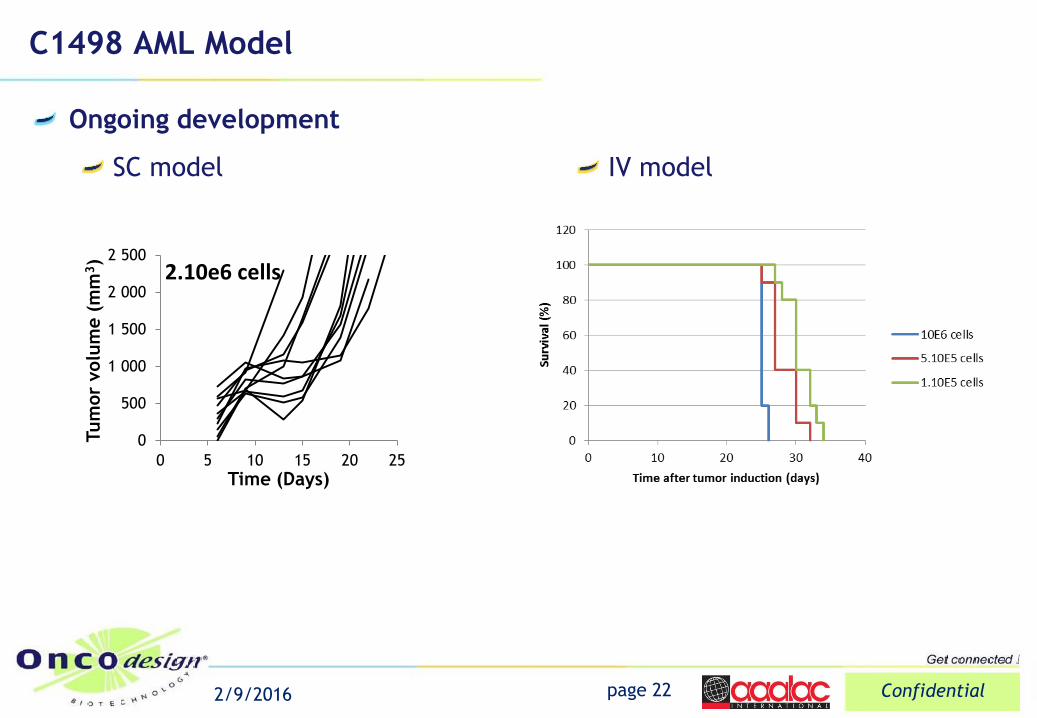
C1498 AML Model
Ongoing development
SC model
page 22 Confidential 2/9/2016
IV model
0
500
1 000
1 500
2 000
2 500
0 5 10 15 20 25
Tum
or
volu
me (
mm
3)
Time (Days)
2.10e6 cells
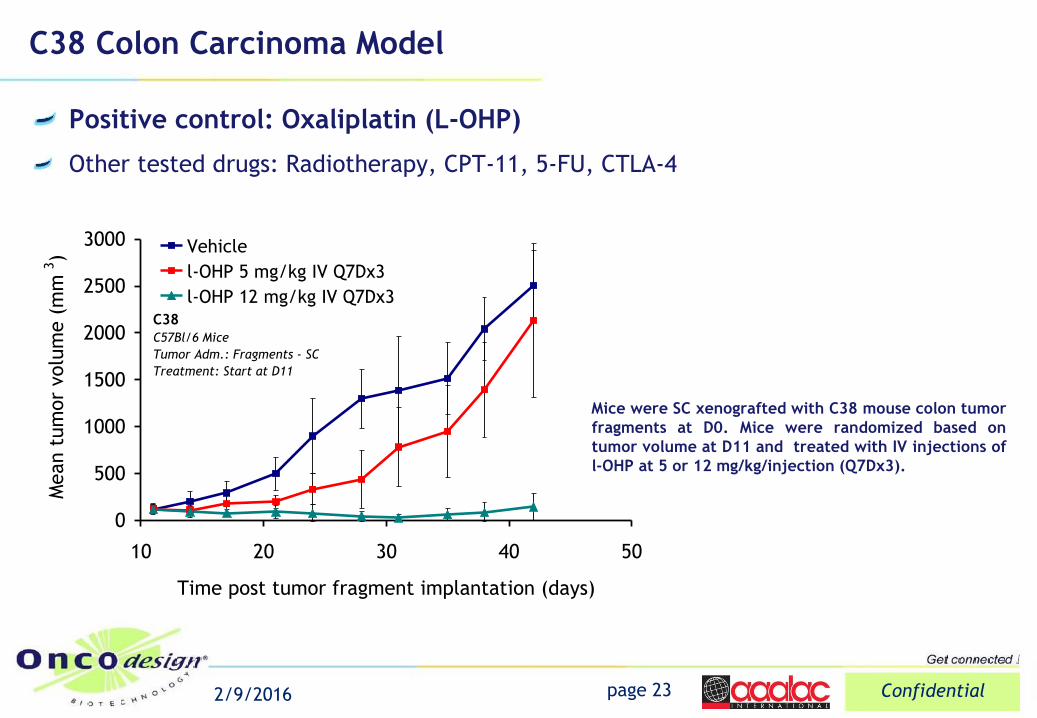
C38 Colon Carcinoma Model
Positive control: Oxaliplatin (L-OHP)
Other tested drugs: Radiotherapy, CPT-11, 5-FU, CTLA-4
page 23 Confidential 2/9/2016
0
500
1000
1500
2000
2500
3000
10 20 30 40 50
Time post tumor fragment implantation (days)
Mean t
um
or
volu
me (
mm
3)
Vehicle
l-OHP 5 mg/kg IV Q7Dx3
l-OHP 12 mg/kg IV Q7Dx3C38
C57Bl/6 Mice
Tumor Adm.: Fragments - SC
Treatment: Start at D11
Mice were SC xenografted with C38 mouse colon tumor
fragments at D0. Mice were randomized based on
tumor volume at D11 and treated with IV injections of
l-OHP at 5 or 12 mg/kg/injection (Q7Dx3).
page 24 Confidential 2/9/2016
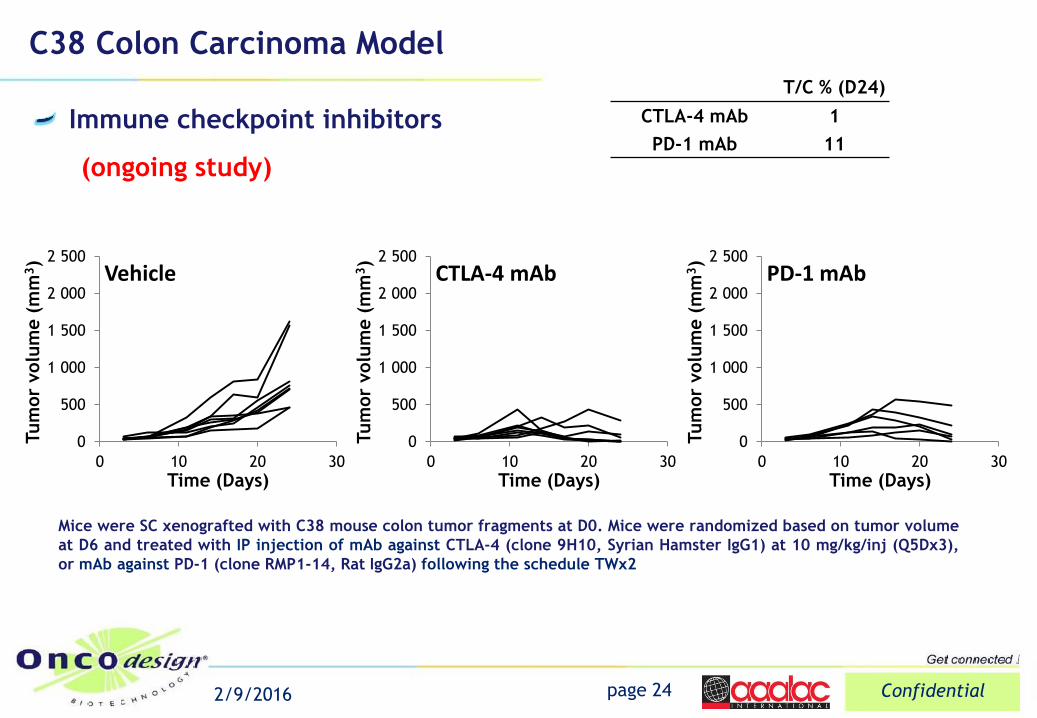
C38 Colon Carcinoma Model
0
500
1 000
1 500
2 000
2 500
0 10 20 30
Tum
or
volu
me (
mm
3)
Time (Days)
Vehicle
Immune checkpoint inhibitors
(ongoing study)
T/C % (D24)
CTLA-4 mAb 1
PD-1 mAb 11
0
500
1 000
1 500
2 000
2 500
0 10 20 30
Tum
or
volu
me (
mm
3)
Time (Days)
CTLA-4 mAb
0
500
1 000
1 500
2 000
2 500
0 10 20 30
Tum
or
volu
me (
mm
3)
Time (Days)
PD-1 mAb
Mice were SC xenografted with C38 mouse colon tumor fragments at D0. Mice were randomized based on tumor volume
at D6 and treated with IP injection of mAb against CTLA-4 (clone 9H10, Syrian Hamster IgG1) at 10 mg/kg/inj (Q5Dx3),
or mAb against PD-1 (clone RMP1-14, Rat IgG2a) following the schedule TWx2
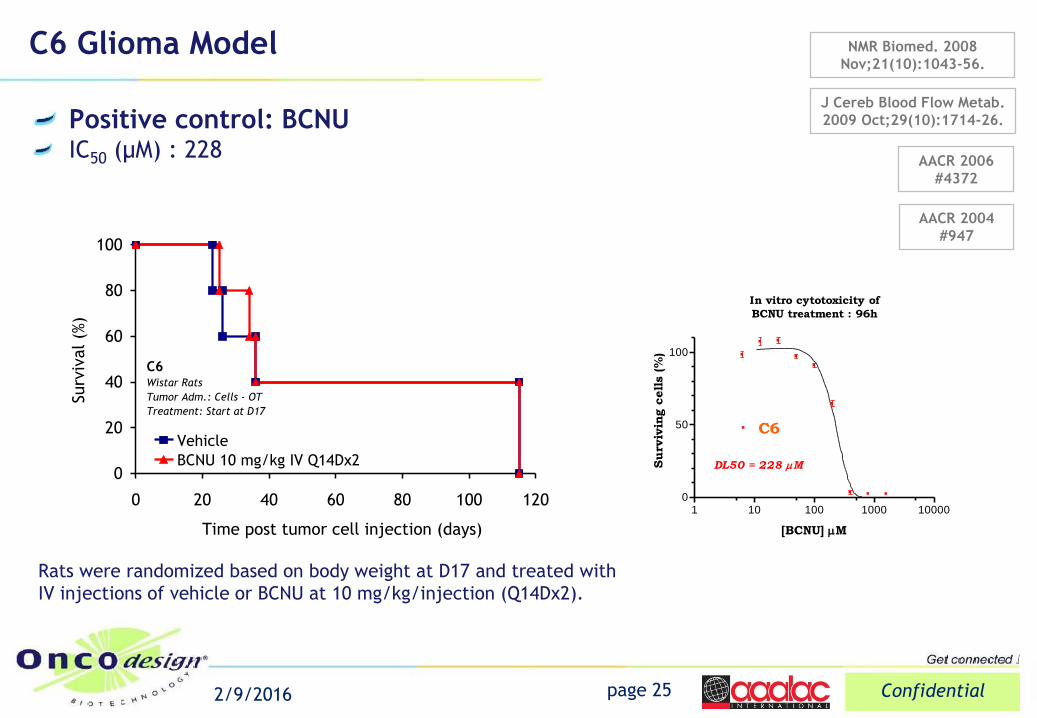
C6 Glioma Model
Positive control: BCNU IC50 (µM) : 228
page 25 Confidential 2/9/2016
NMR Biomed. 2008
Nov;21(10):1043-56.
J Cereb Blood Flow Metab.
2009 Oct;29(10):1714-26.
In vitro cytotoxicity of
BCNU treatment : 96h
1 10 100 1000 100000
50
100
C6
DL50 = 228 M
[BCNU] M
Surv
ivin
g c
ells (%
)
AACR 2006
#4372
AACR 2004
#947
0
20
40
60
80
100
0 20 40 60 80 100 120
Time post tumor cell injection (days)
Surv
ival (%
)
Vehicle
BCNU 10 mg/kg IV Q14Dx2
C6Wistar Rats
Tumor Adm.: Cells - OT
Treatment: Start at D17
Rats were randomized based on body weight at D17 and treated with
IV injections of vehicle or BCNU at 10 mg/kg/injection (Q14Dx2).
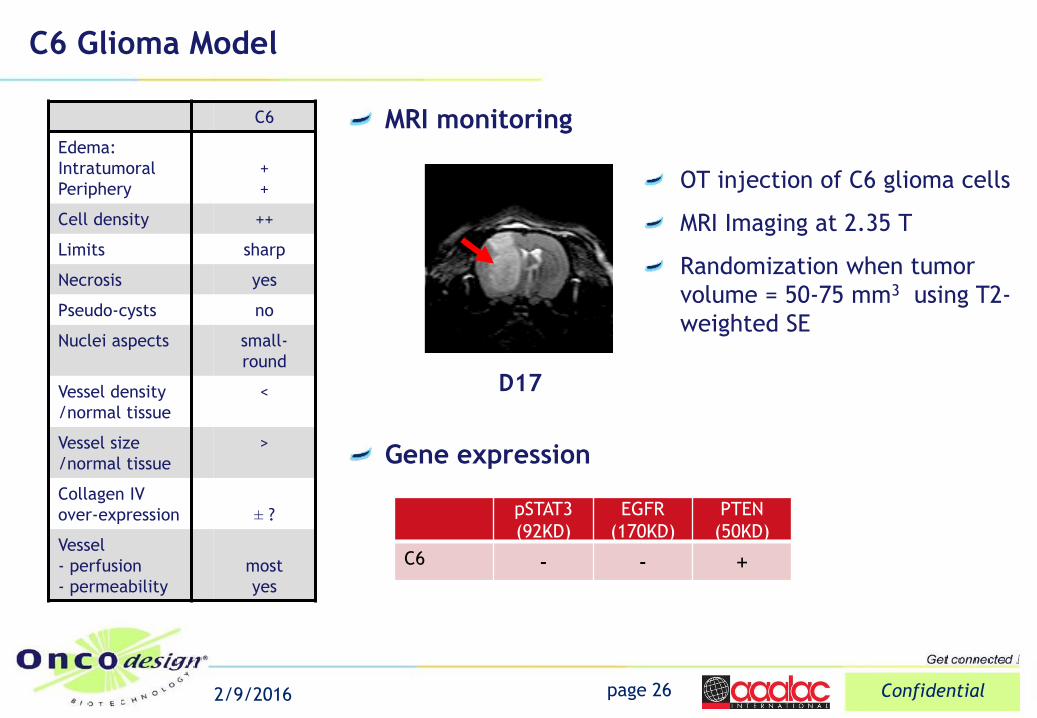
C6 Glioma Model
MRI monitoring
Gene expression
page 26 Confidential 2/9/2016
D17
C6
Edema:
Intratumoral
Periphery
+
+
Cell density ++
Limits sharp
Necrosis yes
Pseudo-cysts no
Nuclei aspects small-
round
Vessel density
/normal tissue
<
Vessel size
/normal tissue
>
Collagen IV
over-expression
± ?
Vessel
- perfusion
- permeability
most
yes
pSTAT3
(92KD)
EGFR
(170KD)
PTEN
(50KD)
C6 - - +
OT injection of C6 glioma cells
MRI Imaging at 2.35 T
Randomization when tumor
volume = 50-75 mm3 using T2-
weighted SE
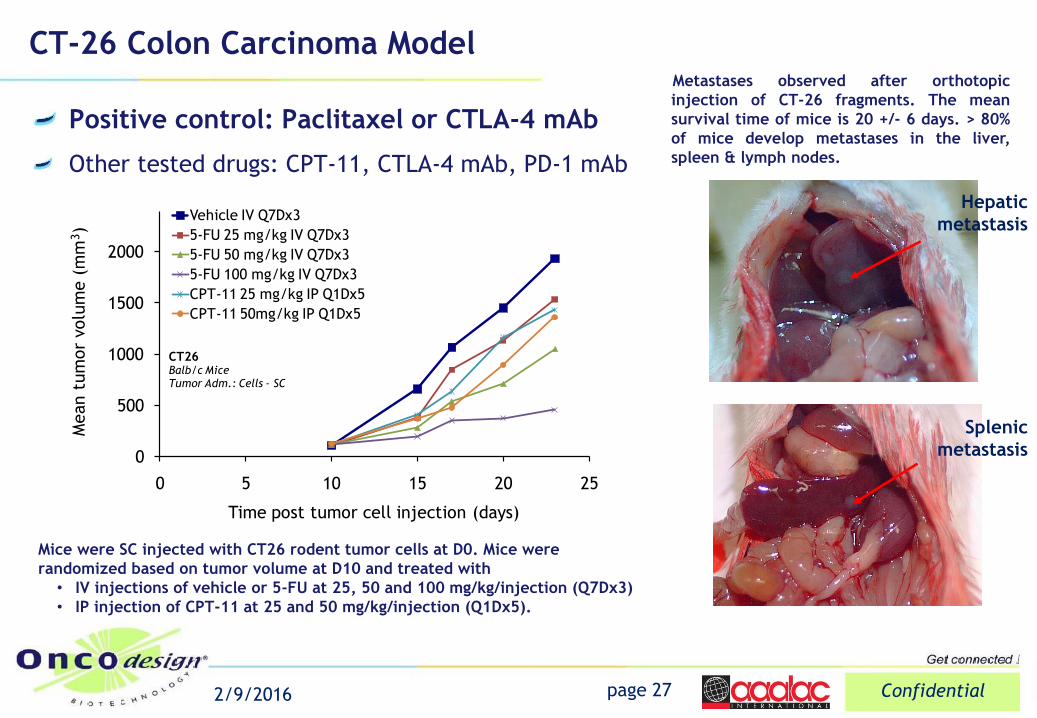
CT-26 Colon Carcinoma Model
Positive control: Paclitaxel or CTLA-4 mAb
Other tested drugs: CPT-11, CTLA-4 mAb, PD-1 mAb
page 27 Confidential 2/9/2016
Mice were SC injected with CT26 rodent tumor cells at D0. Mice were
randomized based on tumor volume at D10 and treated with
• IV injections of vehicle or 5-FU at 25, 50 and 100 mg/kg/injection (Q7Dx3)
• IP injection of CPT-11 at 25 and 50 mg/kg/injection (Q1Dx5).
Metastases observed after orthotopic
injection of CT-26 fragments. The mean
survival time of mice is 20 +/- 6 days. > 80%
of mice develop metastases in the liver,
spleen & lymph nodes.
Hepatic
metastasis
Splenic
metastasis 0
500
1000
1500
2000
0 5 10 15 20 25
Mean t
um
or
volu
me (
mm
3)
Time post tumor cell injection (days)
Vehicle IV Q7Dx3
5-FU 25 mg/kg IV Q7Dx3
5-FU 50 mg/kg IV Q7Dx3
5-FU 100 mg/kg IV Q7Dx3
CPT-11 25 mg/kg IP Q1Dx5
CPT-11 50mg/kg IP Q1Dx5
CT26Balb/c MiceTumor Adm.: Cells - SC
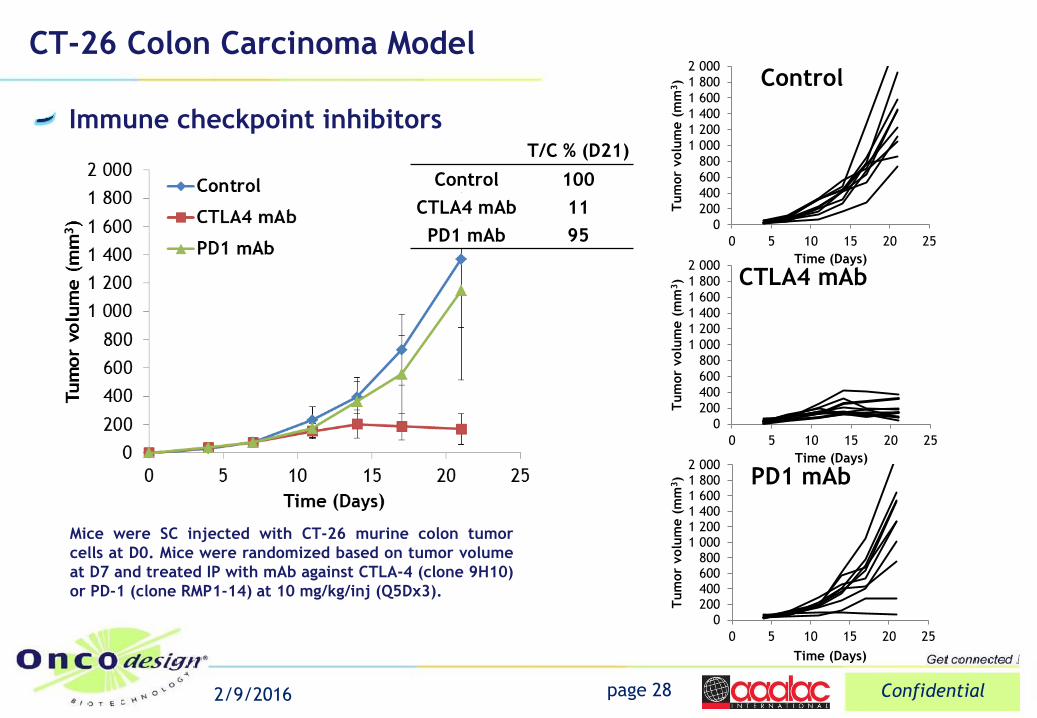
CT-26 Colon Carcinoma Model
page 28 Confidential 2/9/2016
Mice were SC injected with CT-26 murine colon tumor
cells at D0. Mice were randomized based on tumor volume
at D7 and treated IP with mAb against CTLA-4 (clone 9H10)
or PD-1 (clone RMP1-14) at 10 mg/kg/inj (Q5Dx3).
Immune checkpoint inhibitors T/C % (D21)
Control 100
CTLA4 mAb 11
PD1 mAb 95 0
200
400
600
800
1 000
1 200
1 400
1 600
1 800
2 000
0 5 10 15 20 25
Tum
or
volu
me (
mm
3)
Time (Days)
Control
0
200
400
600
800
1 000
1 200
1 400
1 600
1 800
2 000
0 5 10 15 20 25
Tum
or
volu
me (
mm
3)
Time (Days)
CTLA4 mAb
0200400600800
1 0001 2001 4001 6001 8002 000
0 5 10 15 20 25
Tum
or
volu
me (
mm
3)
Time (Days)
PD1 mAb
page 29 Confidential 2/9/2016
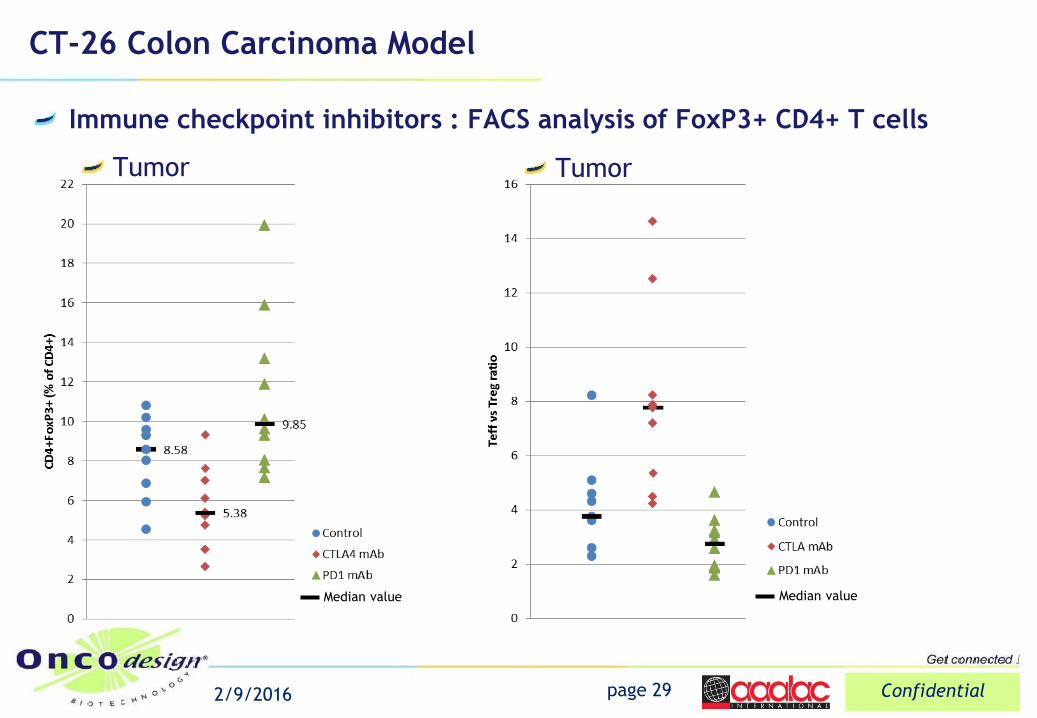
CT-26 Colon Carcinoma Model
Immune checkpoint inhibitors : FACS analysis of FoxP3+ CD4+ T cells
Tumor
Median value Median value
Tumor
page 30 Confidential 2/9/2016
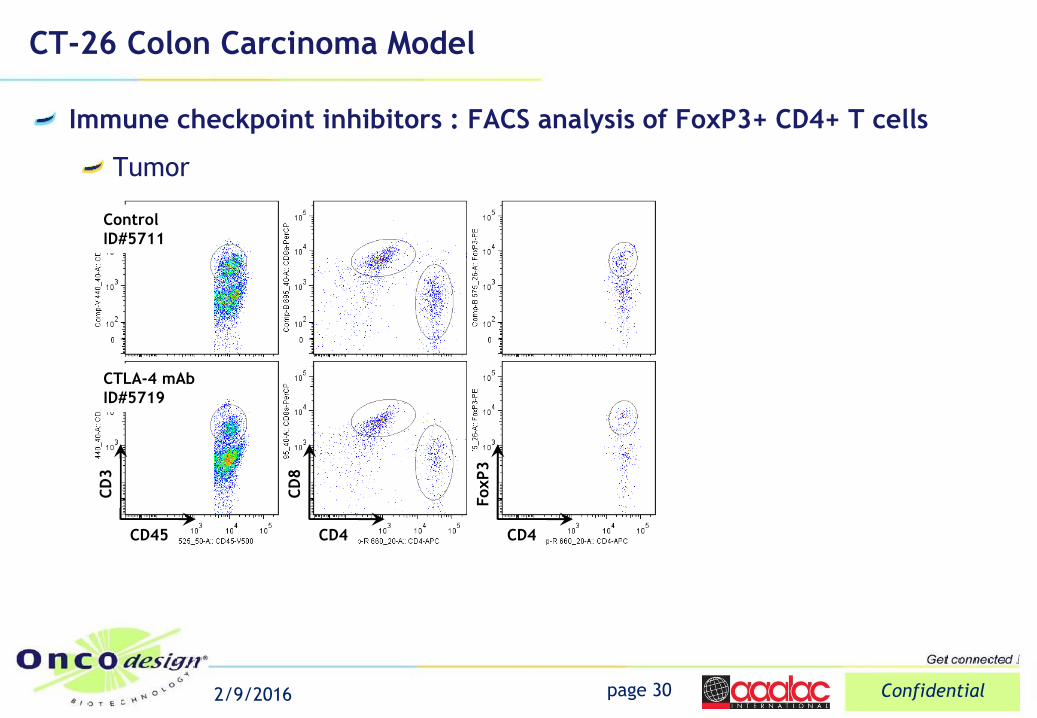
Control
ID#5711
CTLA-4 mAb
ID#5719
CD45
CD
3
CD
8
CD4
FoxP3
CD4
CT-26 Colon Carcinoma Model
Immune checkpoint inhibitors : FACS analysis of FoxP3+ CD4+ T cells
Tumor
CT-26 Colon Carcinoma Model
page 31 Confidential 2/9/2016
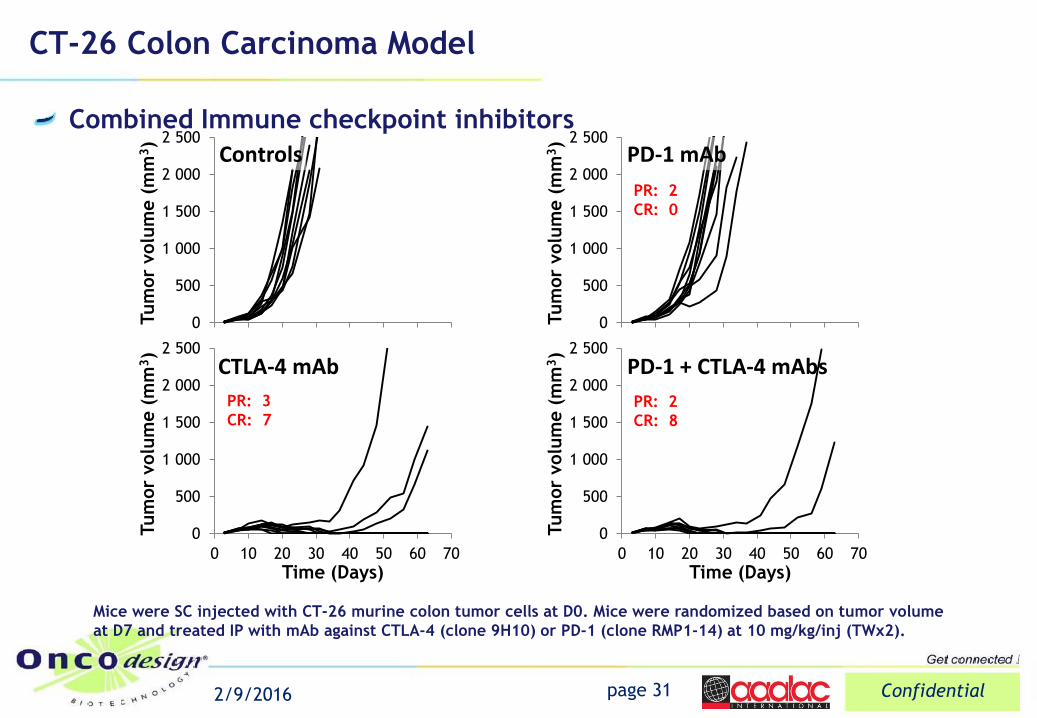
Mice were SC injected with CT-26 murine colon tumor cells at D0. Mice were randomized based on tumor volume
at D7 and treated IP with mAb against CTLA-4 (clone 9H10) or PD-1 (clone RMP1-14) at 10 mg/kg/inj (TWx2).
Combined Immune checkpoint inhibitors
0
500
1 000
1 500
2 000
2 500
0 10 20 30 40 50 60 70
Tum
or
volu
me (
mm
3)
Time (Days)
Controls
0
500
1 000
1 500
2 000
2 500
0 10 20 30 40 50 60 70
Tum
or
volu
me (
mm
3)
Time (Days)
PD-1 mAb
0
500
1 000
1 500
2 000
2 500
0 10 20 30 40 50 60 70
Tum
or
volu
me (
mm
3)
Time (Days)
CTLA-4 mAb
0
500
1 000
1 500
2 000
2 500
0 10 20 30 40 50 60 70Tum
or
volu
me (
mm
3)
Time (Days)
PD-1 + CTLA-4 mAbs
PR: 2
CR: 0
PR: 3
CR: 7 PR: 2
CR: 8
CT-26 Colon Carcinoma Model
page 32 Confidential 2/9/2016
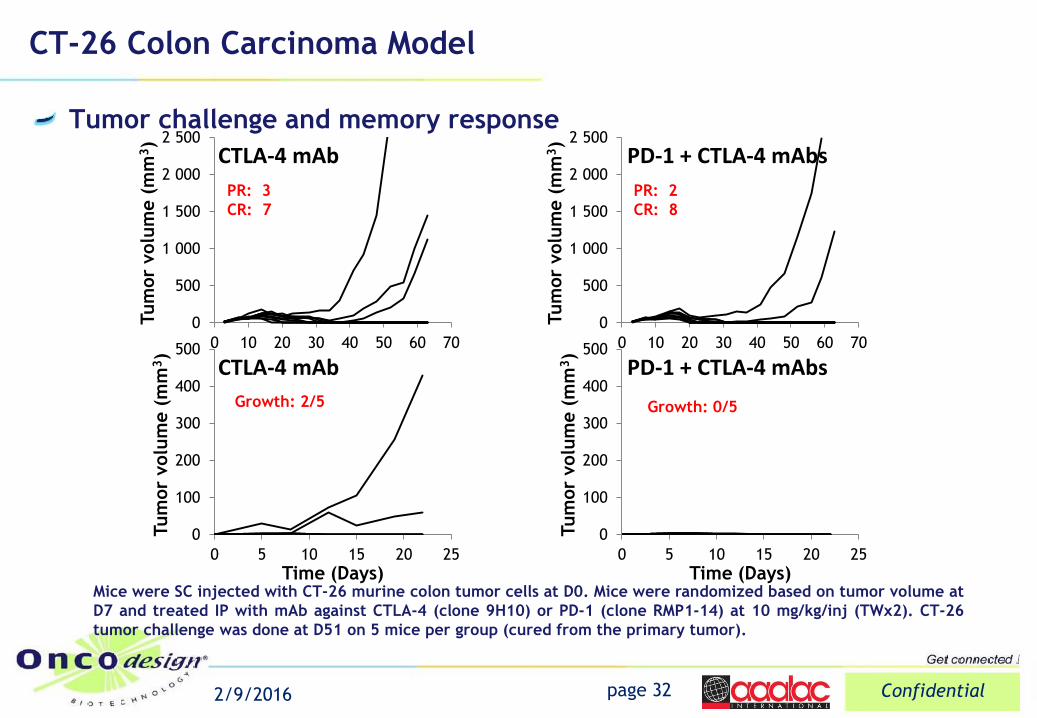
Mice were SC injected with CT-26 murine colon tumor cells at D0. Mice were randomized based on tumor volume at
D7 and treated IP with mAb against CTLA-4 (clone 9H10) or PD-1 (clone RMP1-14) at 10 mg/kg/inj (TWx2). CT-26
tumor challenge was done at D51 on 5 mice per group (cured from the primary tumor).
Tumor challenge and memory response
0
500
1 000
1 500
2 000
2 500
0 10 20 30 40 50 60 70
Tum
or
volu
me (
mm
3)
Time (Days)
CTLA-4 mAb
0
500
1 000
1 500
2 000
2 500
0 10 20 30 40 50 60 70
Tum
or
volu
me (
mm
3)
Time (Days)
PD-1 + CTLA-4 mAbs
PR: 3
CR: 7
PR: 2
CR: 8
0
100
200
300
400
500
0 5 10 15 20 25
Tum
or
volu
me (
mm
3)
Time (Days)
CTLA-4 mAb
Growth: 2/5
0
100
200
300
400
500
0 5 10 15 20 25Tum
or
volu
me (
mm
3)
Time (Days)
PD-1 + CTLA-4 mAbs
Growth: 0/5
0
500
1 000
1 500
2 000
2 500
0 5 10 15 20 25
Tum
or
volu
me (
mm
3)
Time (Days)
PD-L1 mAb
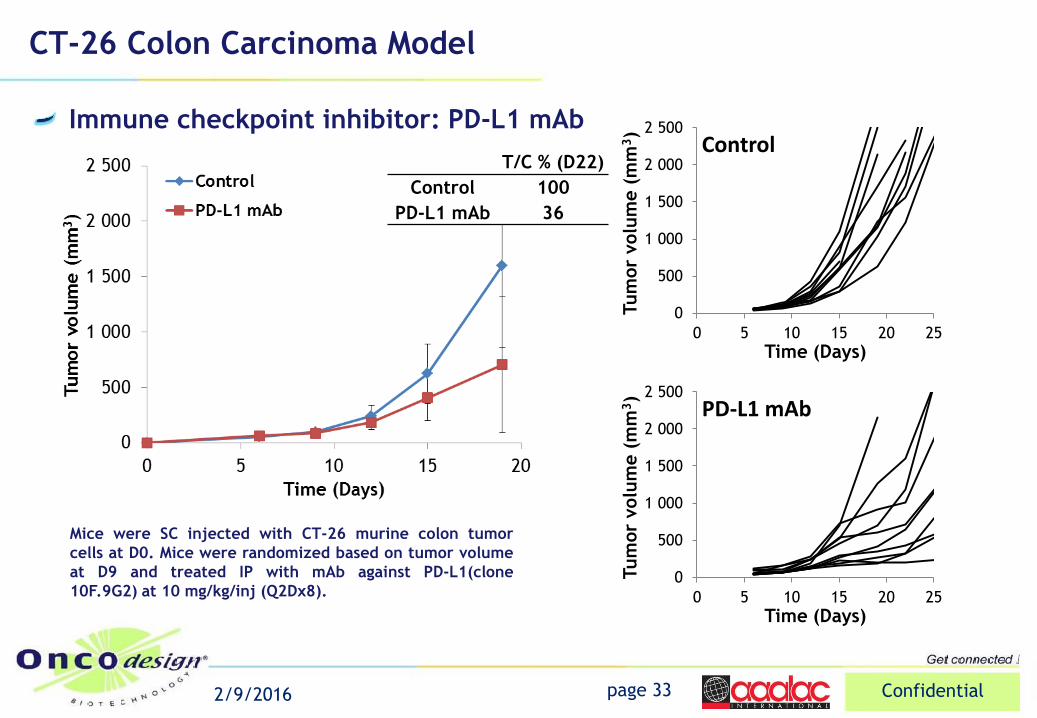
CT-26 Colon Carcinoma Model
Immune checkpoint inhibitor: PD-L1 mAb
Mice were SC injected with CT-26 murine colon tumor
cells at D0. Mice were randomized based on tumor volume
at D9 and treated IP with mAb against PD-L1(clone
10F.9G2) at 10 mg/kg/inj (Q2Dx8).
T/C % (D22)
Control 100
PD-L1 mAb 36
0
500
1 000
1 500
2 000
2 500
0 5 10 15 20 25
Tum
or
volu
me (
mm
3)
Time (Days)
Control
page 33 Confidential 2/9/2016
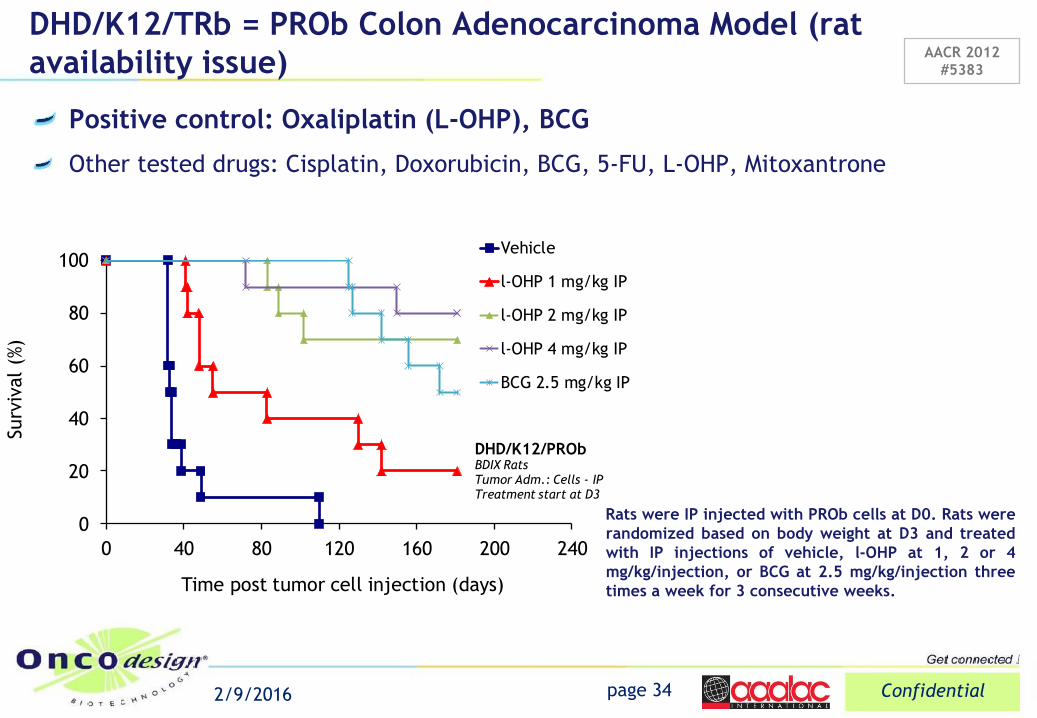
DHD/K12/TRb = PROb Colon Adenocarcinoma Model (rat
availability issue)
Positive control: Oxaliplatin (L-OHP), BCG
Other tested drugs: Cisplatin, Doxorubicin, BCG, 5-FU, L-OHP, Mitoxantrone
page 34 Confidential 2/9/2016
0
20
40
60
80
100
0 40 80 120 160 200 240
Surv
ival
(%)
Time post tumor cell injection (days)
Vehicle
l-OHP 1 mg/kg IP
l-OHP 2 mg/kg IP
l-OHP 4 mg/kg IP
BCG 2.5 mg/kg IP
DHD/K12/PRObBDIX RatsTumor Adm.: Cells - IPTreatment start at D3
Rats were IP injected with PROb cells at D0. Rats were
randomized based on body weight at D3 and treated
with IP injections of vehicle, l-OHP at 1, 2 or 4
mg/kg/injection, or BCG at 2.5 mg/kg/injection three
times a week for 3 consecutive weeks.
AACR 2012
#5383
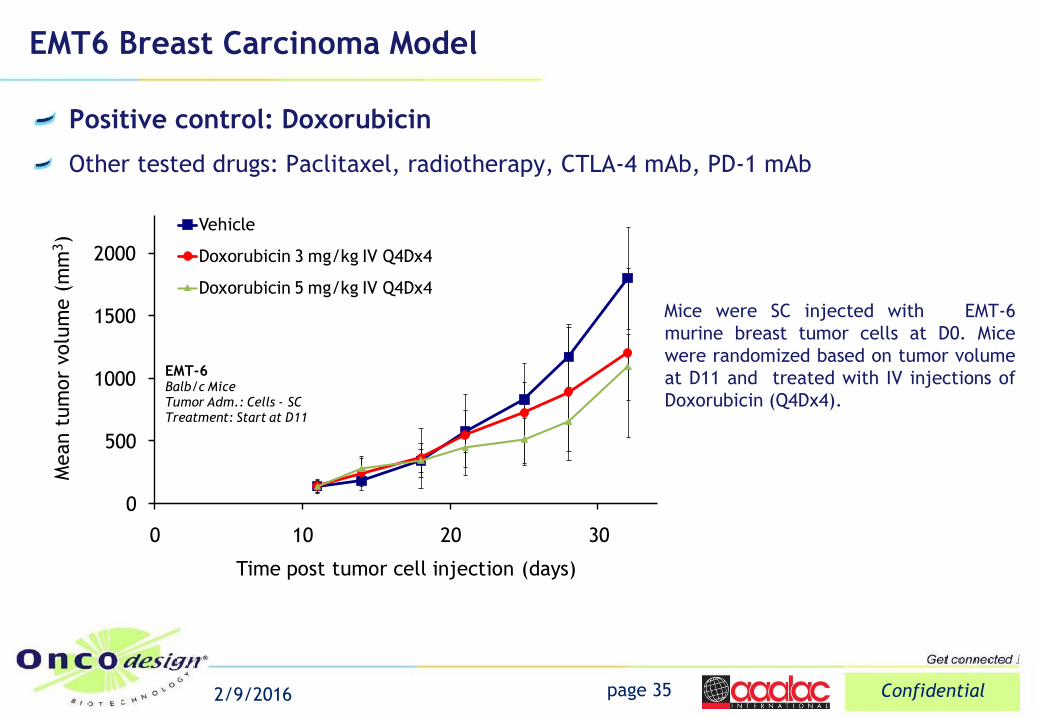
EMT6 Breast Carcinoma Model
Positive control: Doxorubicin
Other tested drugs: Paclitaxel, radiotherapy, CTLA-4 mAb, PD-1 mAb
page 35 Confidential 2/9/2016
0
500
1000
1500
2000
0 10 20 30
Mean t
um
or
volu
me (
mm
3)
Time post tumor cell injection (days)
Vehicle
Doxorubicin 3 mg/kg IV Q4Dx4
Doxorubicin 5 mg/kg IV Q4Dx4
EMT-6Balb/c MiceTumor Adm.: Cells - SCTreatment: Start at D11
Mice were SC injected with EMT-6
murine breast tumor cells at D0. Mice
were randomized based on tumor volume
at D11 and treated with IV injections of
Doxorubicin (Q4Dx4).
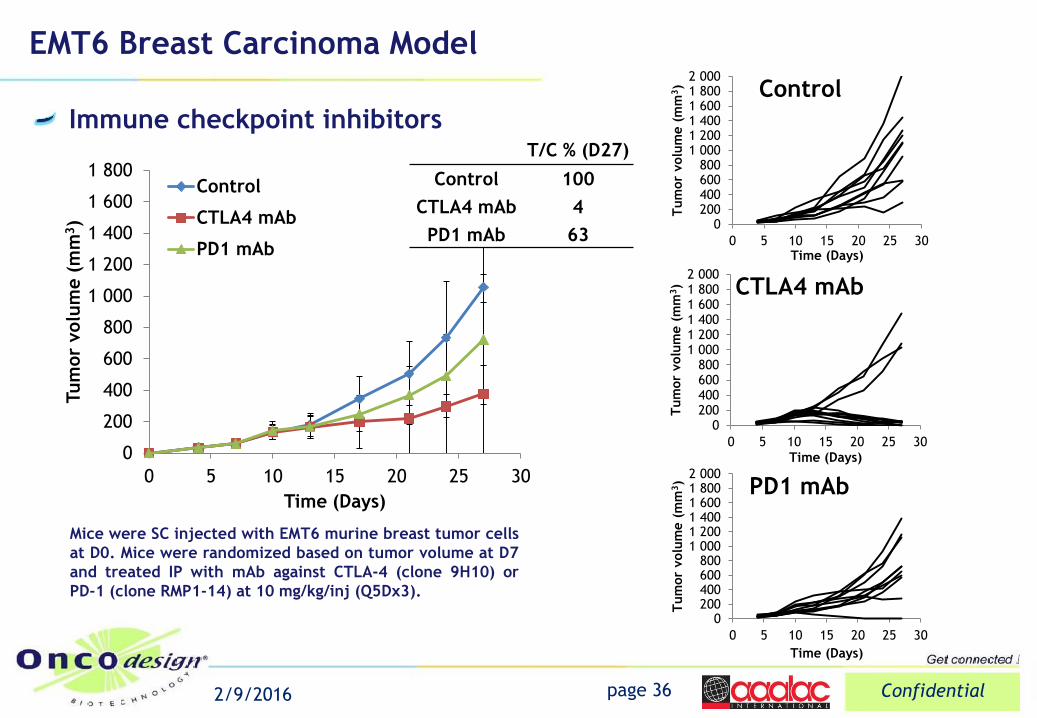
EMT6 Breast Carcinoma Model
page 36 Confidential 2/9/2016
Mice were SC injected with EMT6 murine breast tumor cells
at D0. Mice were randomized based on tumor volume at D7
and treated IP with mAb against CTLA-4 (clone 9H10) or
PD-1 (clone RMP1-14) at 10 mg/kg/inj (Q5Dx3).
Immune checkpoint inhibitors
0200400600800
1 0001 2001 4001 6001 8002 000
0 5 10 15 20 25 30
Tum
or
volu
me (
mm
3)
Time (Days)
Control
0200400600800
1 0001 2001 4001 6001 8002 000
0 5 10 15 20 25 30
Tum
or
volu
me (
mm
3)
Time (Days)
PD1 mAb
0200400600800
1 0001 2001 4001 6001 8002 000
0 5 10 15 20 25 30
Tum
or
volu
me (
mm
3)
Time (Days)
CTLA4 mAb
0
200
400
600
800
1 000
1 200
1 400
1 600
1 800
0 5 10 15 20 25 30
Tum
or
volu
me (
mm
3)
Time (Days)
Control
CTLA4 mAb
PD1 mAb
T/C % (D27)
Control 100
CTLA4 mAb 4
PD1 mAb 63
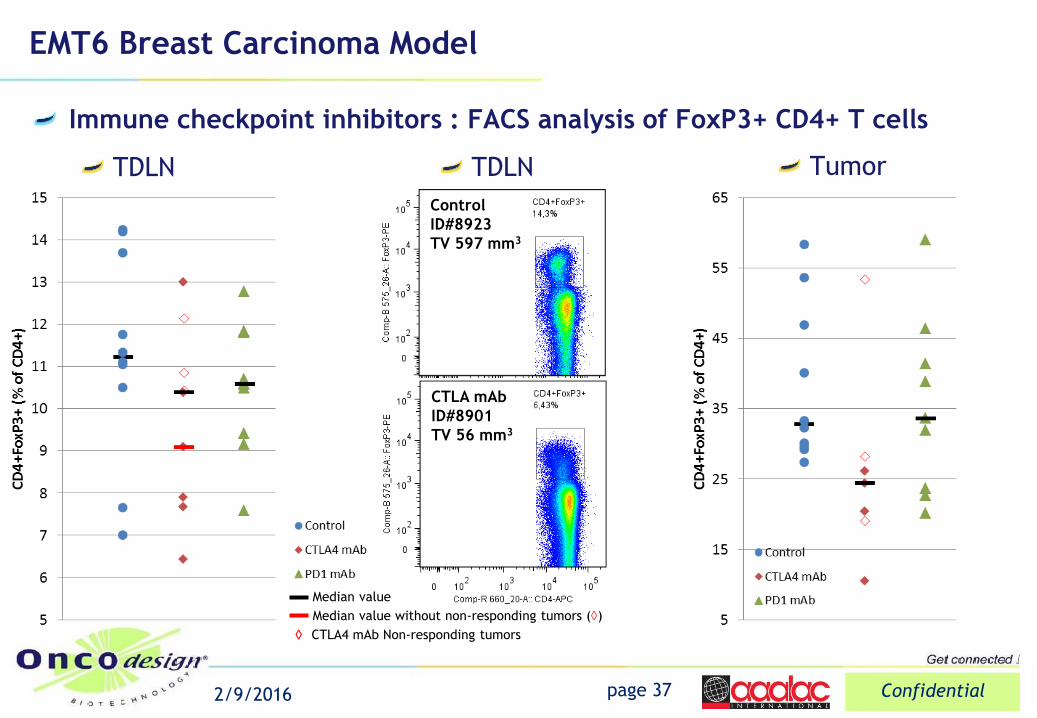
EMT6 Breast Carcinoma Model
page 37 Confidential 2/9/2016
Immune checkpoint inhibitors : FACS analysis of FoxP3+ CD4+ T cells
TDLN
Control
ID#8923
TV 597 mm3
CTLA mAb
ID#8901
TV 56 mm3
Median value
Median value without non-responding tumors ()
TDLN Tumor
CTLA4 mAb Non-responding tumors
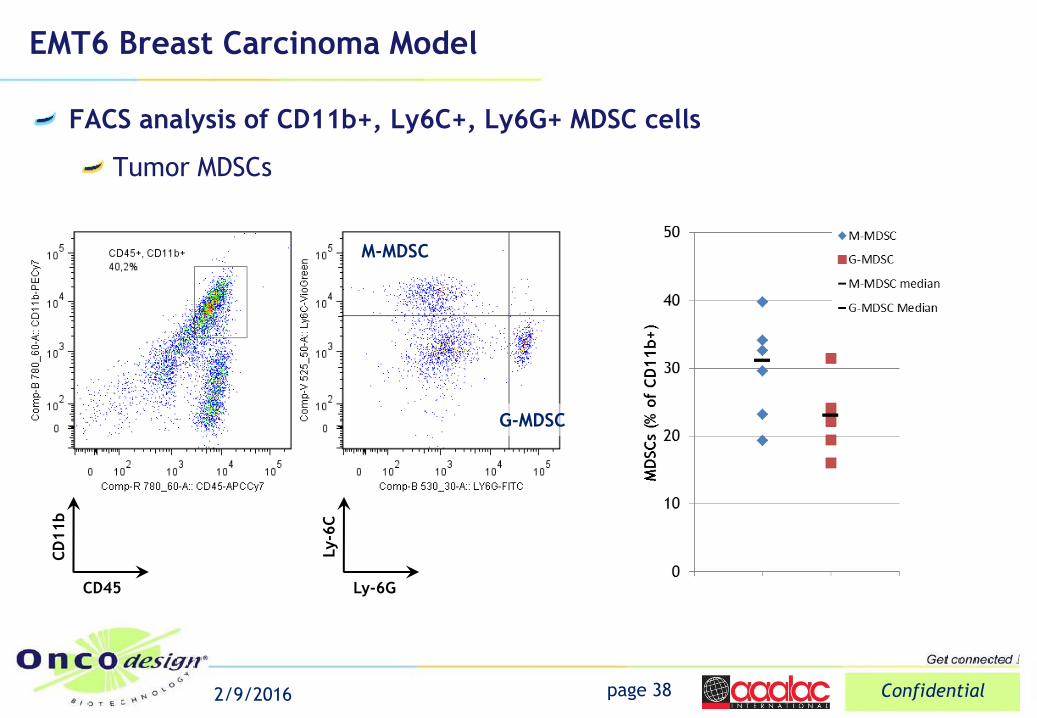
EMT6 Breast Carcinoma Model
page 38 Confidential 2/9/2016
FACS analysis of CD11b+, Ly6C+, Ly6G+ MDSC cells
Tumor MDSCs
G-MDSC
M-MDSC
Ly-6G
Ly-6
C
CD45
CD
11b
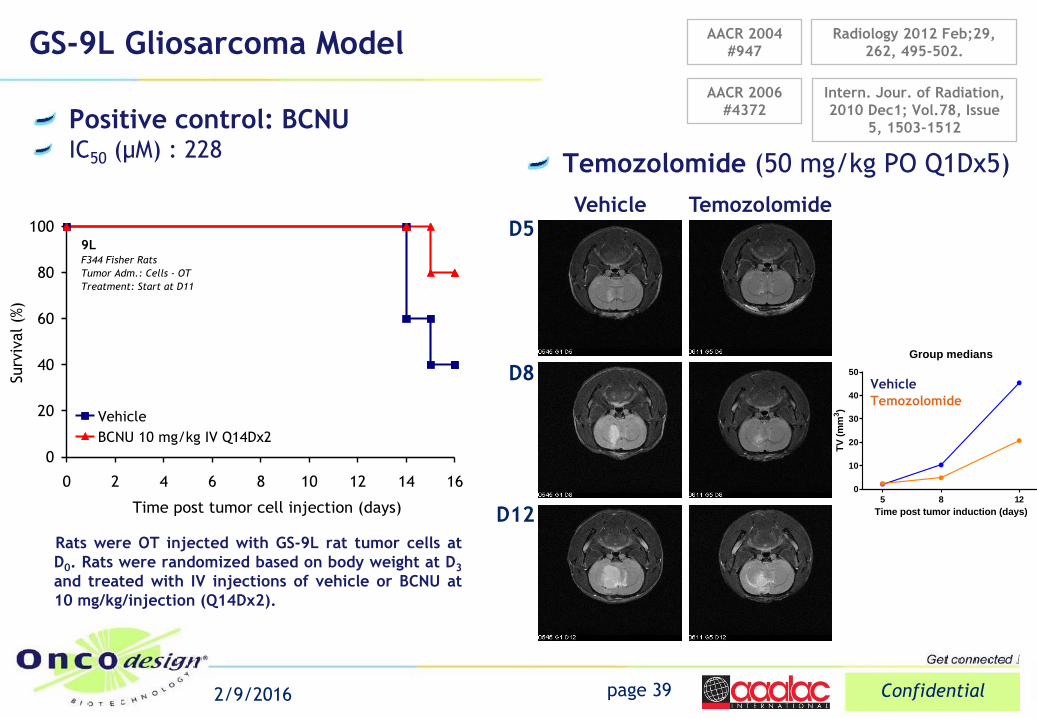
GS-9L Gliosarcoma Model
Positive control: BCNU IC50 (µM) : 228
page 39 Confidential 2/9/2016
0
20
40
60
80
100
0 2 4 6 8 10 12 14 16
Time post tumor cell injection (days)
Surv
ival (%
)
Vehicle
BCNU 10 mg/kg IV Q14Dx2
9LF344 Fisher Rats
Tumor Adm.: Cells - OT
Treatment: Start at D11
Rats were OT injected with GS-9L rat tumor cells at
D0. Rats were randomized based on body weight at D3
and treated with IV injections of vehicle or BCNU at
10 mg/kg/injection (Q14Dx2).
Radiology 2012 Feb;29,
262, 495-502.
Intern. Jour. of Radiation,
2010 Dec1; Vol.78, Issue
5, 1503-1512
AACR 2006
#4372
AACR 2004
#947
Temozolomide (50 mg/kg PO Q1Dx5)
Vehicle D5
D8
D12
Temozolomide
0
10
20
30
40
50
Group medians
Time post tumor induction (days)
TV
(m
m3)
5 8 12
G5 TEMODAL 50mg/kg PO Q1Dx5
G1 Vehicle PO Q1Dx28
0
20
40
60
80
100
G1 Vehicle PO Q1Dx28
Time post tumor induction (days)
TV
(m
m3)
5 8 120
20
40
60
80
100
G5 TEMODAL 50mg/kg PO Q1Dx5
Time post tumor induction (days)
TV
(m
m3)
5 8 12
Vehicle
Temozolomide
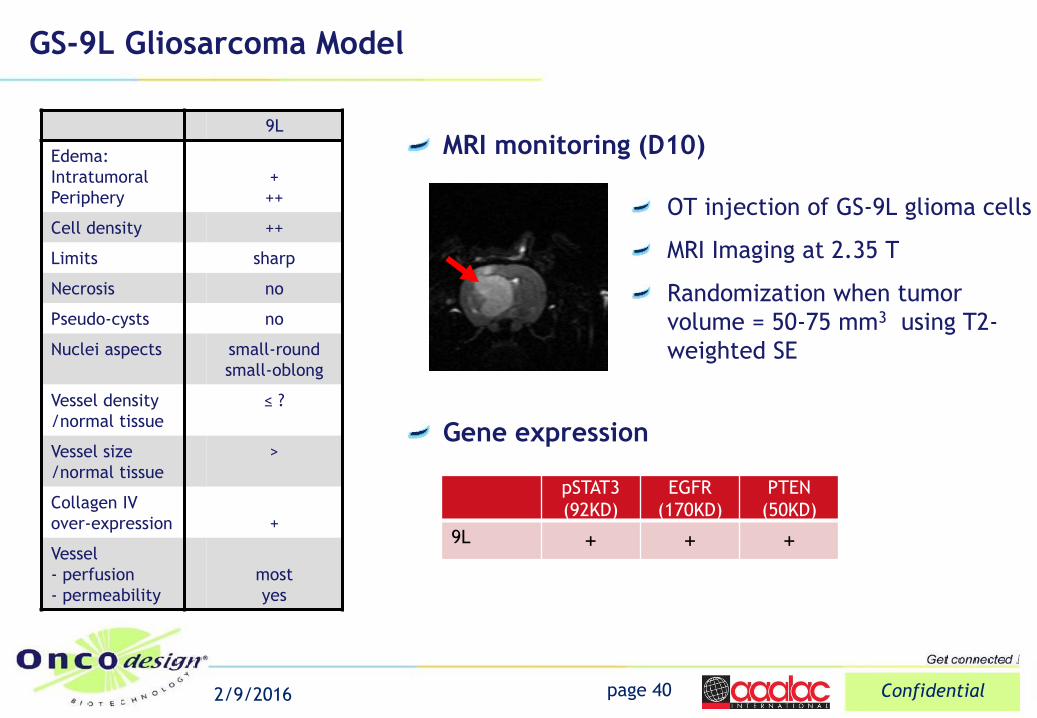
GS-9L Gliosarcoma Model
MRI monitoring (D10)
Gene expression
page 40 Confidential 2/9/2016
9L
Edema:
Intratumoral
Periphery
+
++
Cell density ++
Limits sharp
Necrosis no
Pseudo-cysts no
Nuclei aspects small-round
small-oblong
Vessel density
/normal tissue
≤ ?
Vessel size
/normal tissue
>
Collagen IV
over-expression
+
Vessel
- perfusion
- permeability
most
yes
pSTAT3
(92KD)
EGFR
(170KD)
PTEN
(50KD)
9L + + +
OT injection of GS-9L glioma cells
MRI Imaging at 2.35 T
Randomization when tumor
volume = 50-75 mm3 using T2-
weighted SE
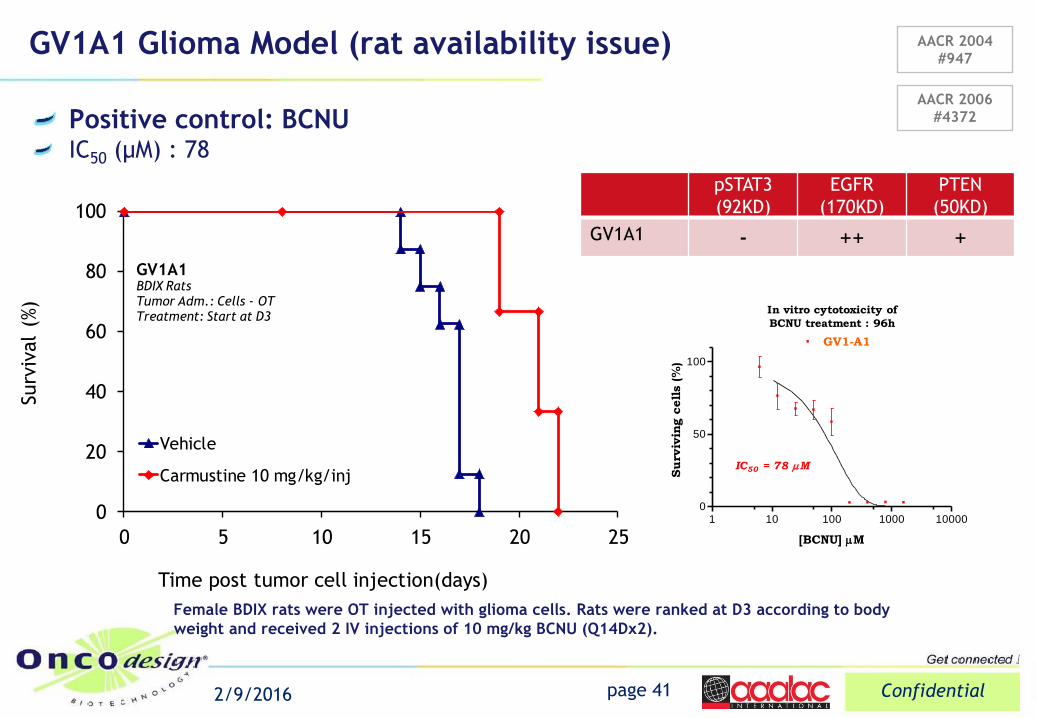
GV1A1 Glioma Model (rat availability issue)
Positive control: BCNU IC50 (µM) : 78
page 41 Confidential 2/9/2016
0
20
40
60
80
100
0 5 10 15 20 25
Surv
ival
(%)
Time post tumor cell injection(days)
Vehicle
Carmustine 10 mg/kg/inj
GV1A1BDIX RatsTumor Adm.: Cells - OTTreatment: Start at D3
Female BDIX rats were OT injected with glioma cells. Rats were ranked at D3 according to body
weight and received 2 IV injections of 10 mg/kg BCNU (Q14Dx2).
pSTAT3
(92KD)
EGFR
(170KD)
PTEN
(50KD)
GV1A1 - ++ +
In vitro cytotoxicity of
BCNU treatment : 96h
1 10 100 1000 100000
50
100
GV1-A1
IC50 = 78 M
[BCNU] M
Surv
ivin
g c
ells (%
)
AACR 2004
#947
AACR 2006
#4372
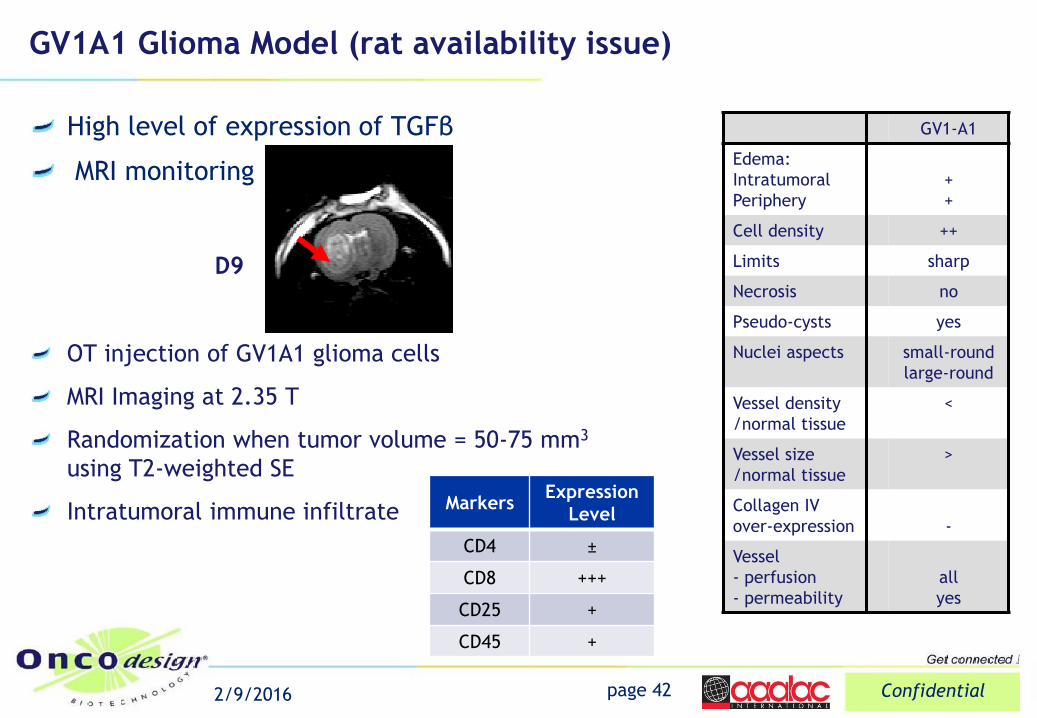
GV1A1 Glioma Model (rat availability issue)
page 42 Confidential 2/9/2016
High level of expression of TGFβ
MRI monitoring
Markers Expression
Level
CD4 ±
CD8 +++
CD25 +
CD45 +
D9
GV1-A1
Edema:
Intratumoral
Periphery
+
+
Cell density ++
Limits sharp
Necrosis no
Pseudo-cysts yes
Nuclei aspects small-round
large-round
Vessel density
/normal tissue
<
Vessel size
/normal tissue
>
Collagen IV
over-expression
-
Vessel
- perfusion
- permeability
all
yes
OT injection of GV1A1 glioma cells
MRI Imaging at 2.35 T
Randomization when tumor volume = 50-75 mm3
using T2-weighted SE
Intratumoral immune infiltrate
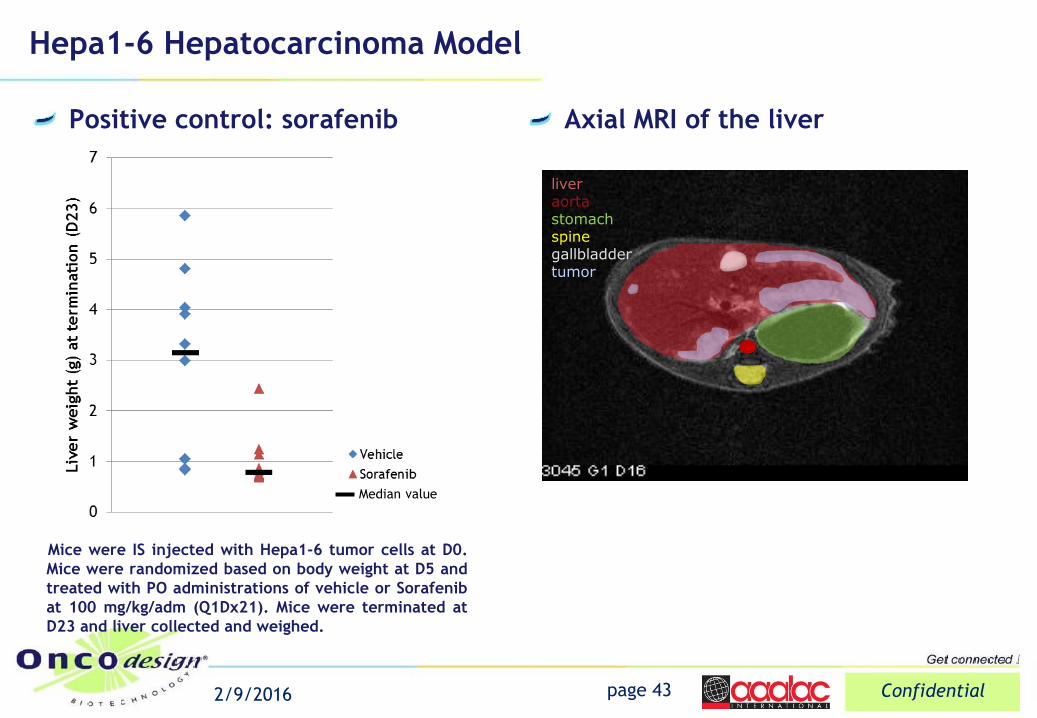
Hepa1-6 Hepatocarcinoma Model
Positive control: sorafenib
page 43 Confidential 2/9/2016
liver aorta stomach spine gallbladder tumor
Axial MRI of the liver
Mice were IS injected with Hepa1-6 tumor cells at D0.
Mice were randomized based on body weight at D5 and
treated with PO administrations of vehicle or Sorafenib
at 100 mg/kg/adm (Q1Dx21). Mice were terminated at
D23 and liver collected and weighed.
Median value
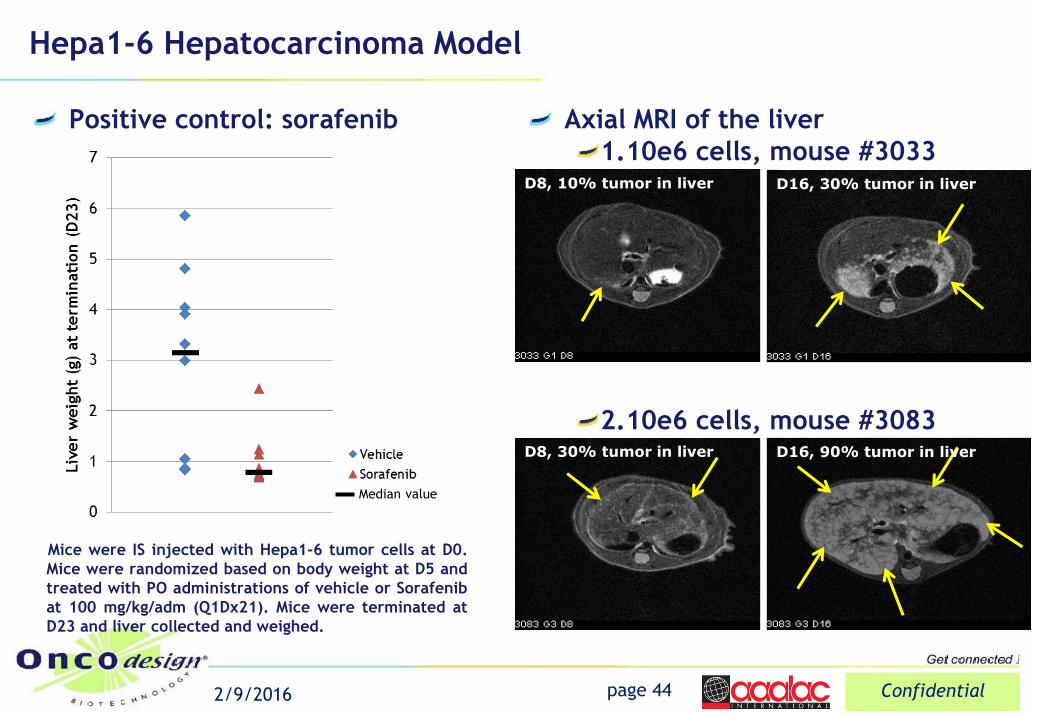
Hepa1-6 Hepatocarcinoma Model
Positive control: sorafenib
page 44 Confidential 2/9/2016
Mice were IS injected with Hepa1-6 tumor cells at D0.
Mice were randomized based on body weight at D5 and
treated with PO administrations of vehicle or Sorafenib
at 100 mg/kg/adm (Q1Dx21). Mice were terminated at
D23 and liver collected and weighed.
Median value
Axial MRI of the liver
1.10e6 cells, mouse #3033 D8, 10% tumor in liver D16, 30% tumor in liver
2.10e6 cells, mouse #3083 D8, 30% tumor in liver D16, 90% tumor in liver
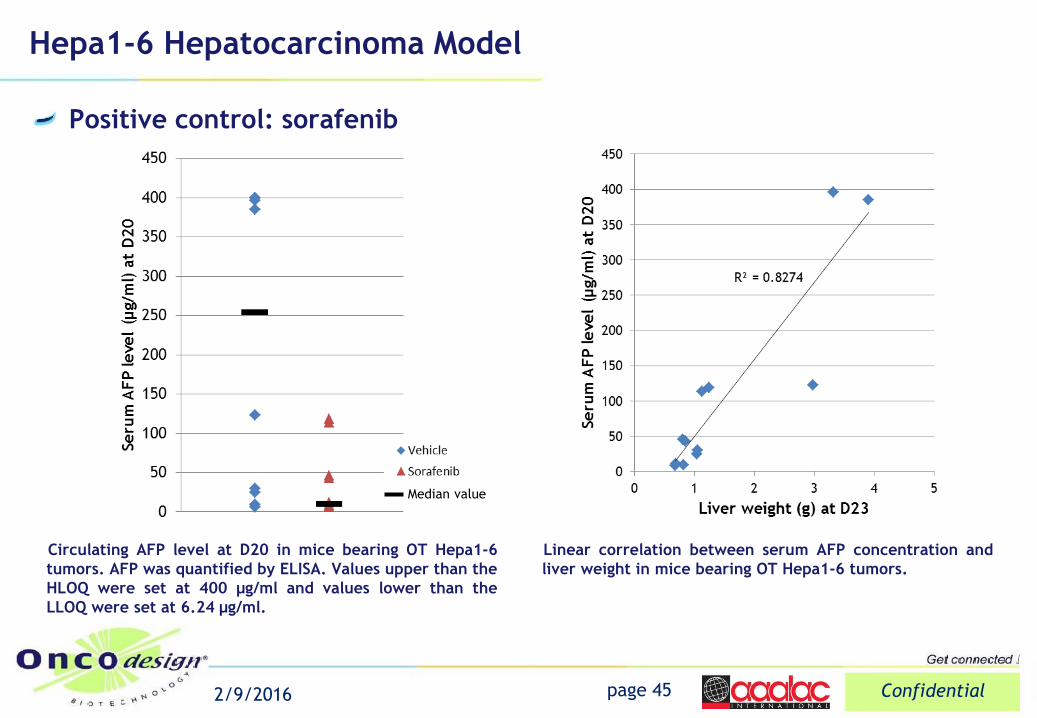
Circulating AFP level at D20 in mice bearing OT Hepa1-6
tumors. AFP was quantified by ELISA. Values upper than the
HLOQ were set at 400 µg/ml and values lower than the
LLOQ were set at 6.24 µg/ml.
Hepa1-6 Hepatocarcinoma Model
Positive control: sorafenib
page 45 Confidential 2/9/2016
Median value
Linear correlation between serum AFP concentration and
liver weight in mice bearing OT Hepa1-6 tumors.
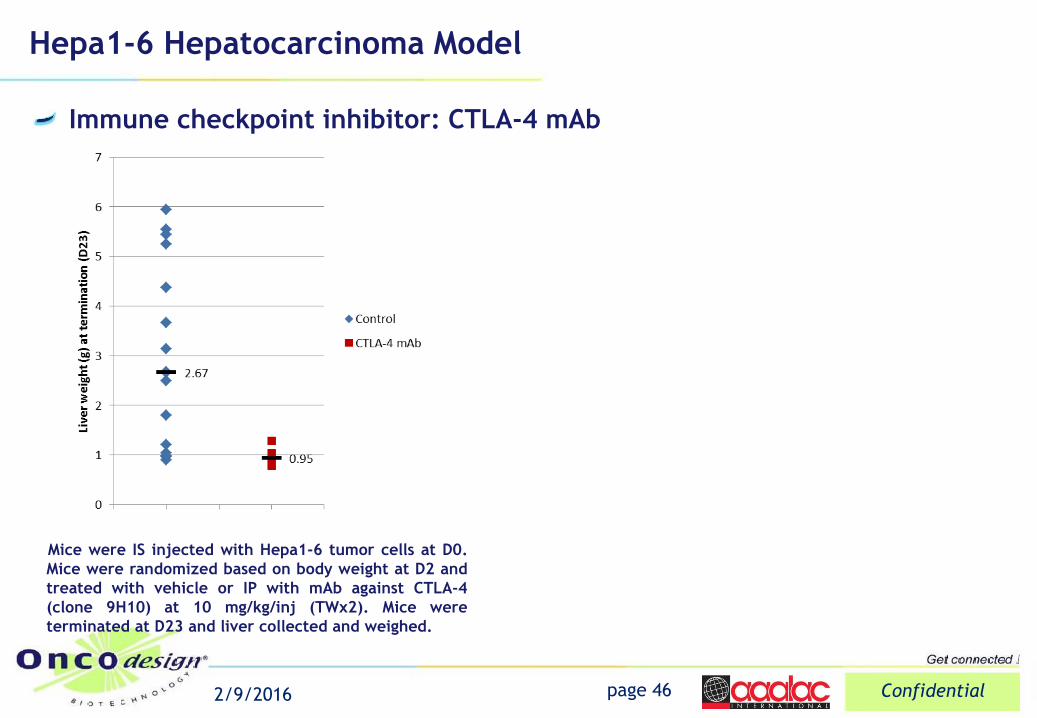
Hepa1-6 Hepatocarcinoma Model
Immune checkpoint inhibitor: CTLA-4 mAb
page 46 Confidential 2/9/2016
Mice were IS injected with Hepa1-6 tumor cells at D0.
Mice were randomized based on body weight at D2 and
treated with vehicle or IP with mAb against CTLA-4
(clone 9H10) at 10 mg/kg/inj (TWx2). Mice were
terminated at D23 and liver collected and weighed.
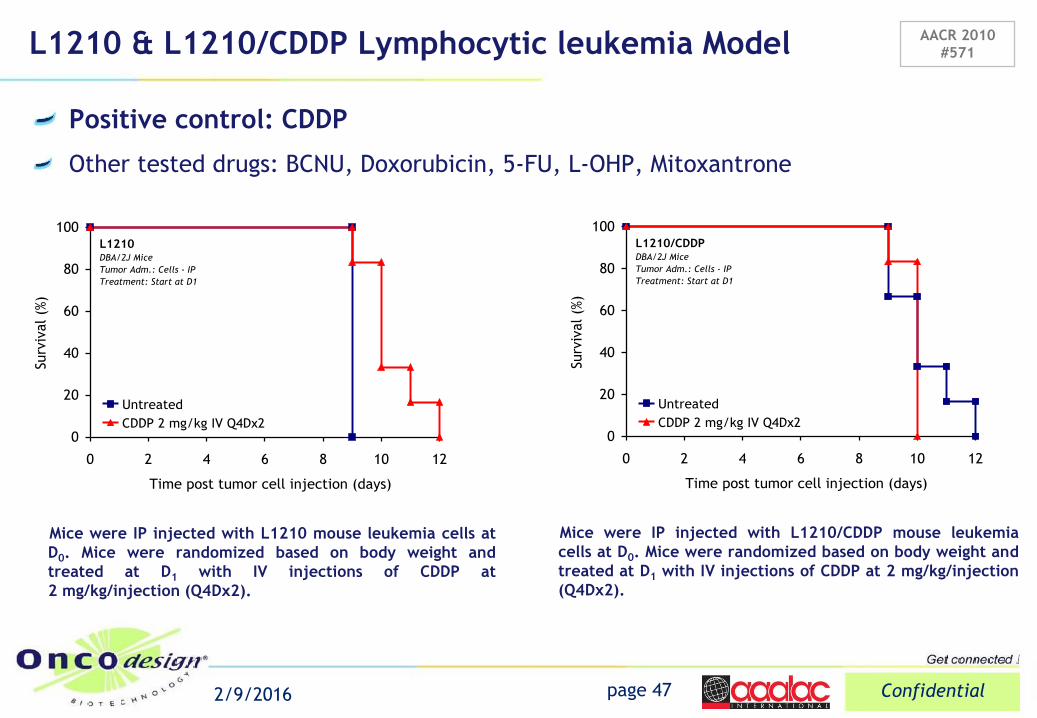
L1210 & L1210/CDDP Lymphocytic leukemia Model
Positive control: CDDP
Other tested drugs: BCNU, Doxorubicin, 5-FU, L-OHP, Mitoxantrone
page 47 Confidential 2/9/2016
AACR 2010
#571
0
20
40
60
80
100
0 2 4 6 8 10 12
Time post tumor cell injection (days)
Surv
ival (%
)
Untreated
CDDP 2 mg/kg IV Q4Dx2
L1210DBA/2J Mice
Tumor Adm.: Cells - IP
Treatment: Start at D1
Mice were IP injected with L1210/CDDP mouse leukemia
cells at D0. Mice were randomized based on body weight and
treated at D1 with IV injections of CDDP at 2 mg/kg/injection
(Q4Dx2).
0
20
40
60
80
100
0 2 4 6 8 10 12
Time post tumor cell injection (days)
Surv
ival (%
)
Untreated
CDDP 2 mg/kg IV Q4Dx2
L1210/CDDPDBA/2J Mice
Tumor Adm.: Cells - IP
Treatment: Start at D1
Mice were IP injected with L1210 mouse leukemia cells at
D0. Mice were randomized based on body weight and
treated at D1 with IV injections of CDDP at
2 mg/kg/injection (Q4Dx2).
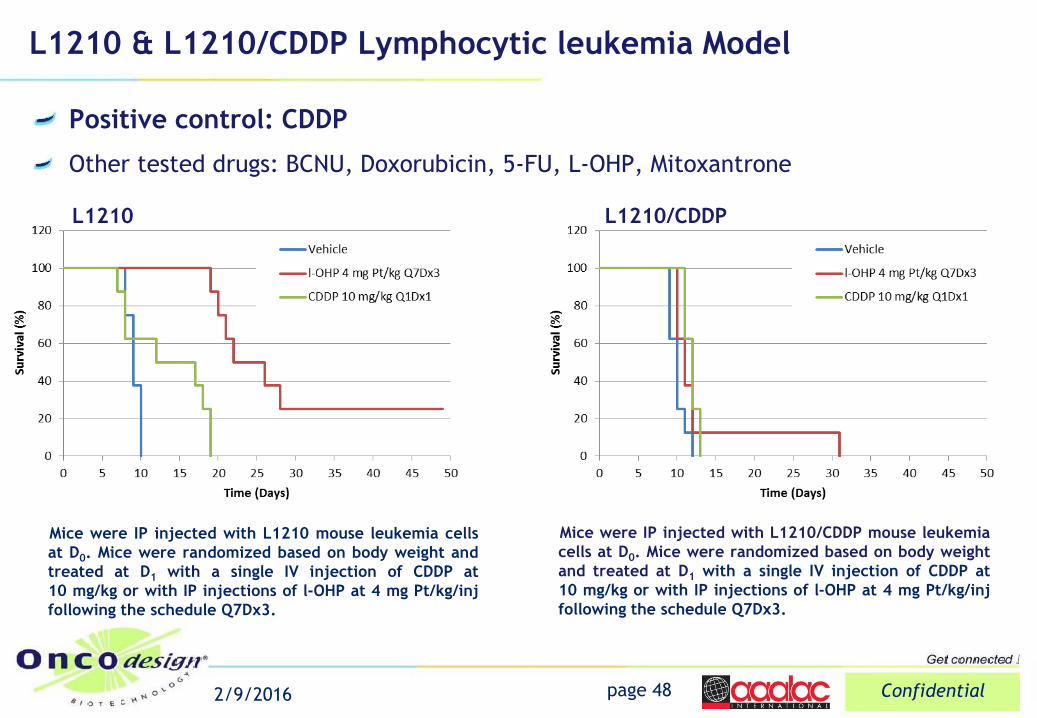
L1210 & L1210/CDDP Lymphocytic leukemia Model
Positive control: CDDP
Other tested drugs: BCNU, Doxorubicin, 5-FU, L-OHP, Mitoxantrone
page 48 Confidential 2/9/2016
Mice were IP injected with L1210/CDDP mouse leukemia
cells at D0. Mice were randomized based on body weight
and treated at D1 with a single IV injection of CDDP at
10 mg/kg or with IP injections of l-OHP at 4 mg Pt/kg/inj
following the schedule Q7Dx3.
Mice were IP injected with L1210 mouse leukemia cells
at D0. Mice were randomized based on body weight and
treated at D1 with a single IV injection of CDDP at
10 mg/kg or with IP injections of l-OHP at 4 mg Pt/kg/inj
following the schedule Q7Dx3.
L1210 L1210/CDDP
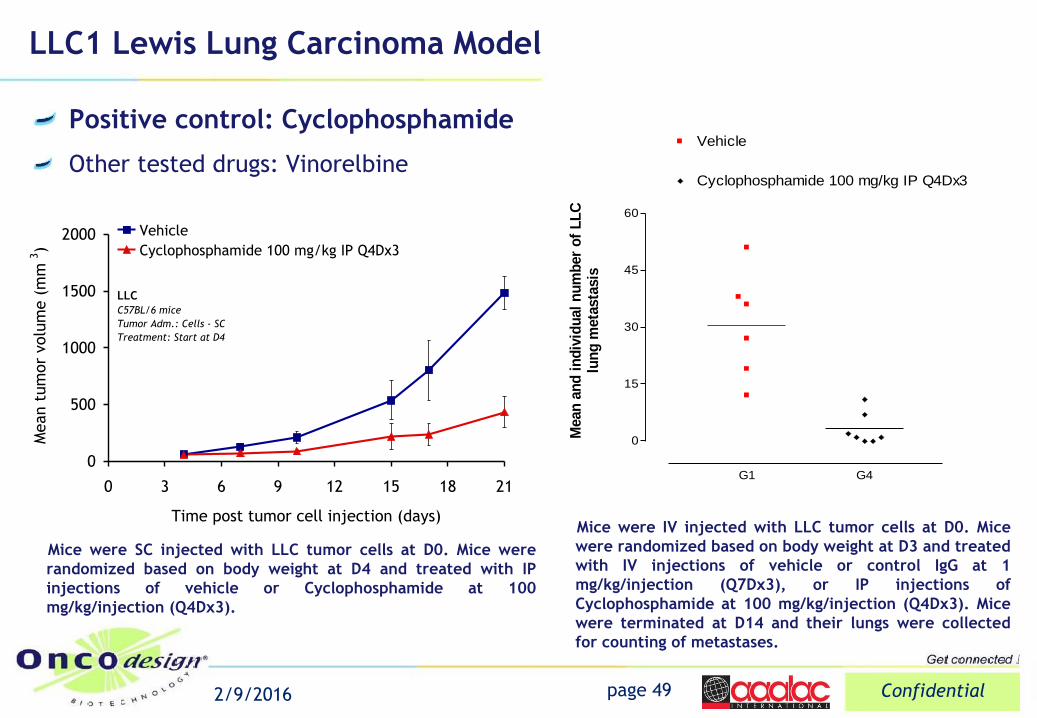
LLC1 Lewis Lung Carcinoma Model
Positive control: Cyclophosphamide
Other tested drugs: Vinorelbine
page 49 Confidential 2/9/2016
0
500
1000
1500
2000
0 3 6 9 12 15 18 21
Time post tumor cell injection (days)
Mean t
um
or
volu
me (
mm
3)
Vehicle
Cyclophosphamide 100 mg/kg IP Q4Dx3
LLC
C57BL/6 mice
Tumor Adm.: Cells - SC
Treatment: Start at D4
Mice were SC injected with LLC tumor cells at D0. Mice were
randomized based on body weight at D4 and treated with IP
injections of vehicle or Cyclophosphamide at 100
mg/kg/injection (Q4Dx3).
G1 G4
0
15
30
45
60
Vehicle
Cyclophosphamide 100 mg/kg IP Q4Dx3
Mean
an
d i
nd
ivid
ual
nu
mb
er
of
LL
Clu
ng
meta
sta
sis
Mice were IV injected with LLC tumor cells at D0. Mice
were randomized based on body weight at D3 and treated
with IV injections of vehicle or control IgG at 1
mg/kg/injection (Q7Dx3), or IP injections of
Cyclophosphamide at 100 mg/kg/injection (Q4Dx3). Mice
were terminated at D14 and their lungs were collected
for counting of metastases.
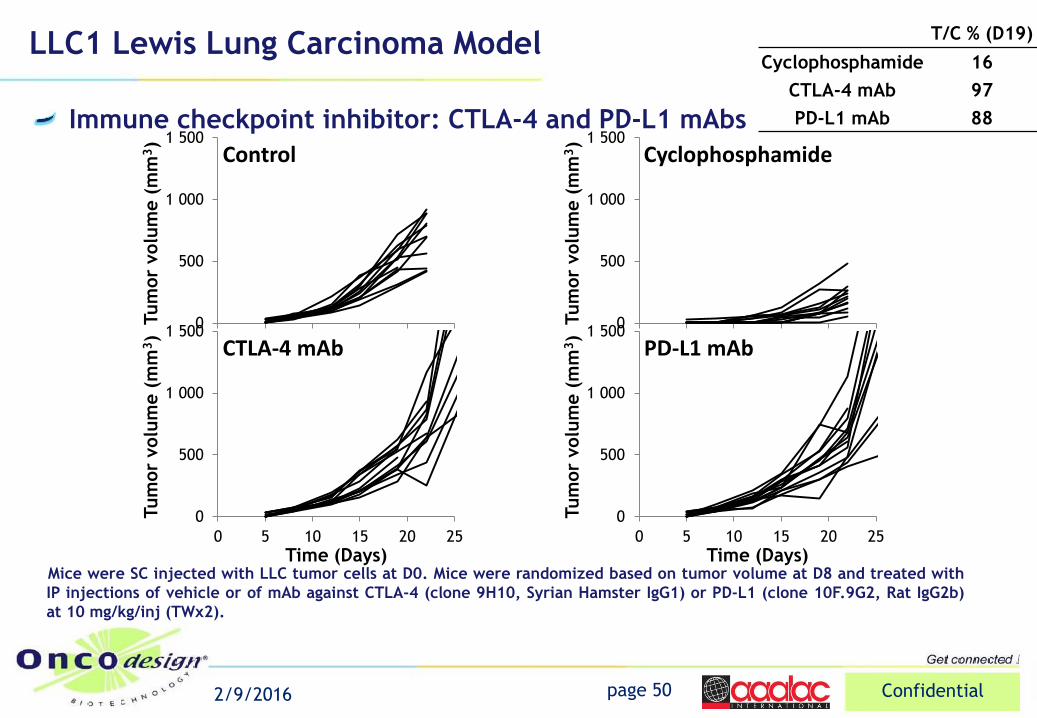
LLC1 Lewis Lung Carcinoma Model
Mice were SC injected with LLC tumor cells at D0. Mice were randomized based on tumor volume at D8 and treated with
IP injections of vehicle or of mAb against CTLA-4 (clone 9H10, Syrian Hamster IgG1) or PD-L1 (clone 10F.9G2, Rat IgG2b)
at 10 mg/kg/inj (TWx2).
Immune checkpoint inhibitor: CTLA-4 and PD-L1 mAbs
0
500
1 000
1 500
0 5 10 15 20 25
Tum
or
volu
me (
mm
3)
Time (Days)
Control
0
500
1 000
1 500
0 5 10 15 20 25
Tum
or
volu
me (
mm
3)
Time (Days)
Cyclophosphamide
0
500
1 000
1 500
0 5 10 15 20 25
Tum
or
volu
me (
mm
3)
Time (Days)
PD-L1 mAb
0
500
1 000
1 500
0 5 10 15 20 25
Tum
or
volu
me (
mm
3)
Time (Days)
CTLA-4 mAb
page 50 Confidential 2/9/2016
T/C % (D19)
Cyclophosphamide 16
CTLA-4 mAb 97
PD-L1 mAb 88
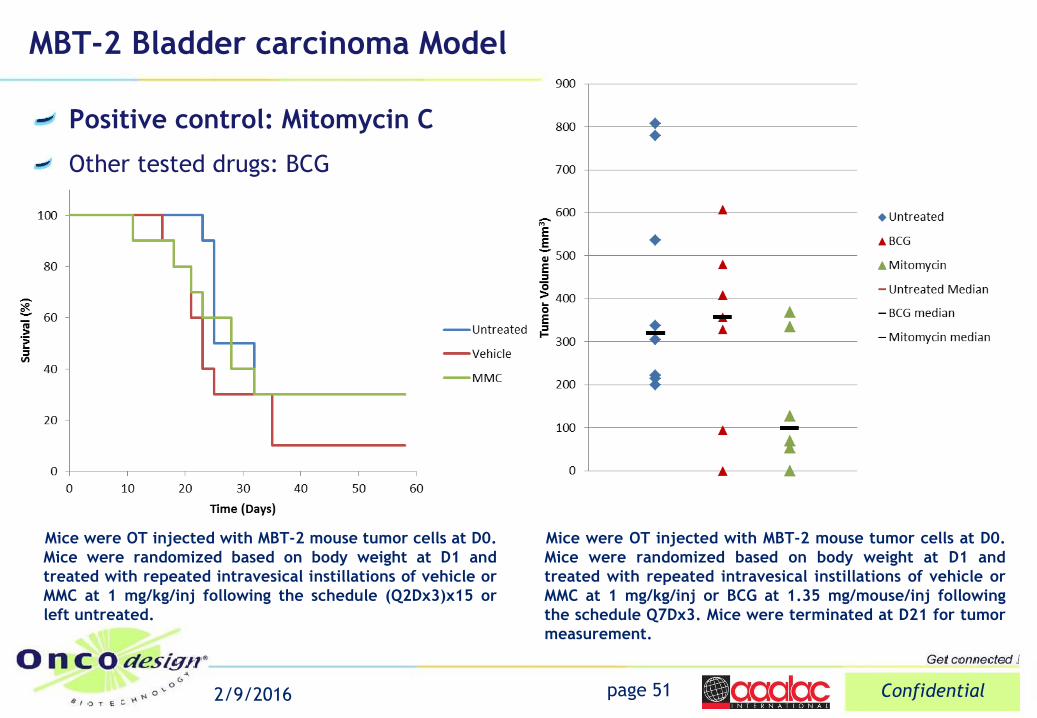
MBT-2 Bladder carcinoma Model
Positive control: Mitomycin C
Other tested drugs: BCG
page 51 Confidential 2/9/2016
Mice were OT injected with MBT-2 mouse tumor cells at D0.
Mice were randomized based on body weight at D1 and
treated with repeated intravesical instillations of vehicle or
MMC at 1 mg/kg/inj or BCG at 1.35 mg/mouse/inj following
the schedule Q7Dx3. Mice were terminated at D21 for tumor
measurement.
Mice were OT injected with MBT-2 mouse tumor cells at D0.
Mice were randomized based on body weight at D1 and
treated with repeated intravesical instillations of vehicle or
MMC at 1 mg/kg/inj following the schedule (Q2Dx3)x15 or
left untreated.
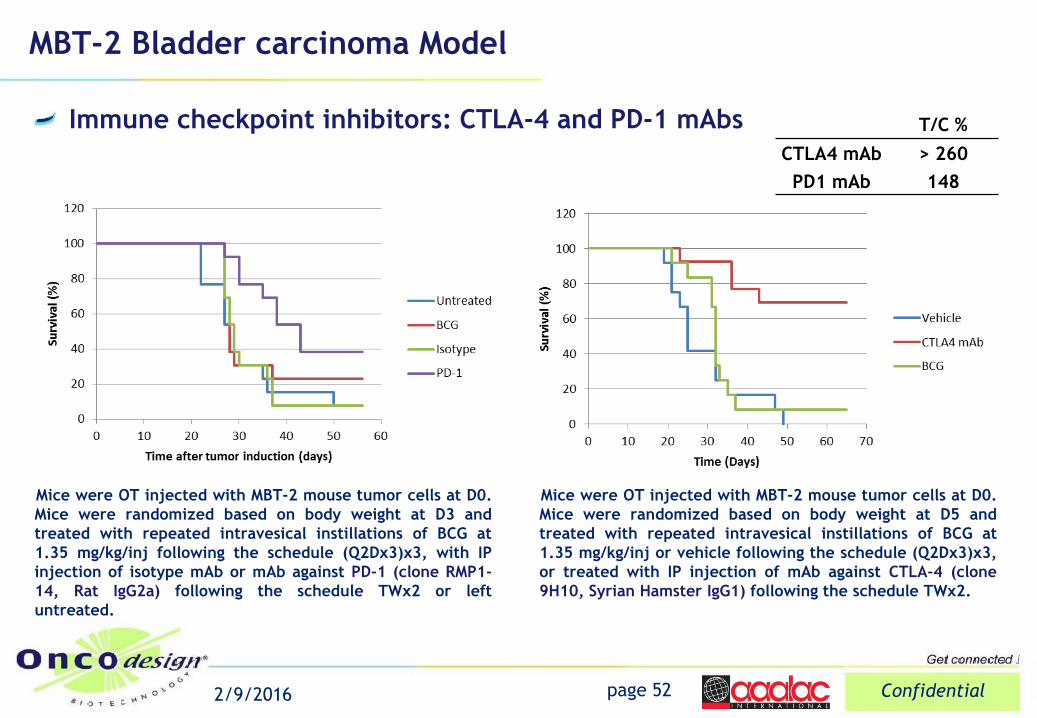
MBT-2 Bladder carcinoma Model
Immune checkpoint inhibitors: CTLA-4 and PD-1 mAbs
page 52 Confidential 2/9/2016
Mice were OT injected with MBT-2 mouse tumor cells at D0.
Mice were randomized based on body weight at D3 and
treated with repeated intravesical instillations of BCG at
1.35 mg/kg/inj following the schedule (Q2Dx3)x3, with IP
injection of isotype mAb or mAb against PD-1 (clone RMP1-
14, Rat IgG2a) following the schedule TWx2 or left
untreated.
Mice were OT injected with MBT-2 mouse tumor cells at D0.
Mice were randomized based on body weight at D5 and
treated with repeated intravesical instillations of BCG at
1.35 mg/kg/inj or vehicle following the schedule (Q2Dx3)x3,
or treated with IP injection of mAb against CTLA-4 (clone
9H10, Syrian Hamster IgG1) following the schedule TWx2.
T/C %
CTLA4 mAb > 260
PD1 mAb 148
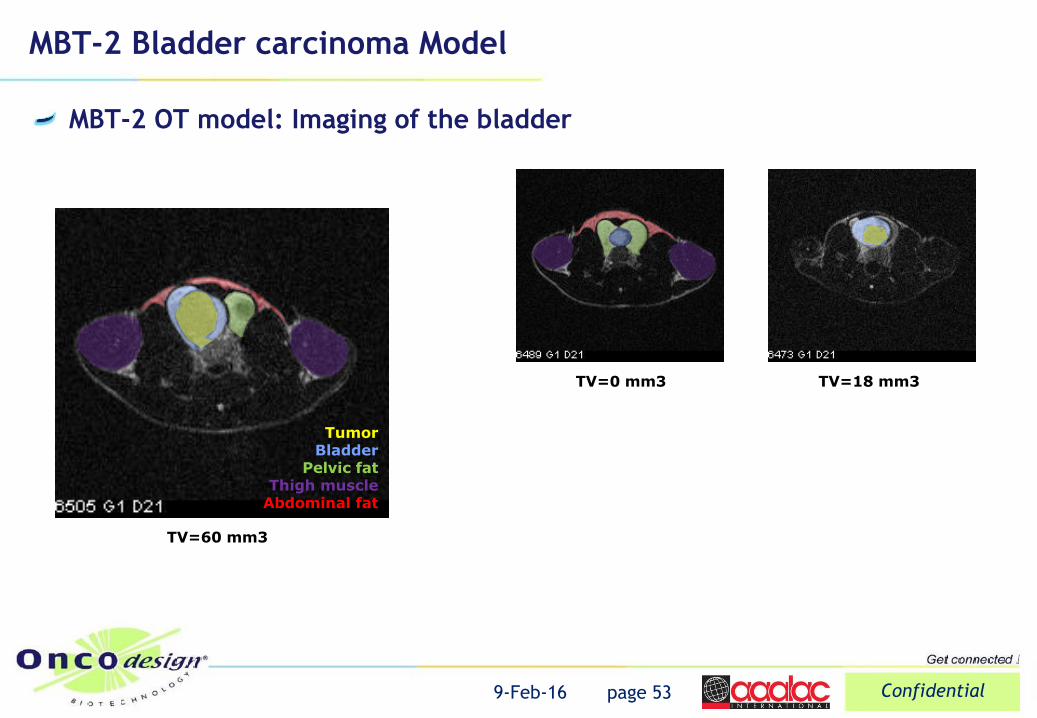
MBT-2 Bladder carcinoma Model
MBT-2 OT model: Imaging of the bladder
page 53 Confidential 9-Feb-16
TV=18 mm3 TV=0 mm3
TV=60 mm3
Tumor Bladder
Pelvic fat Thigh muscle
Abdominal fat
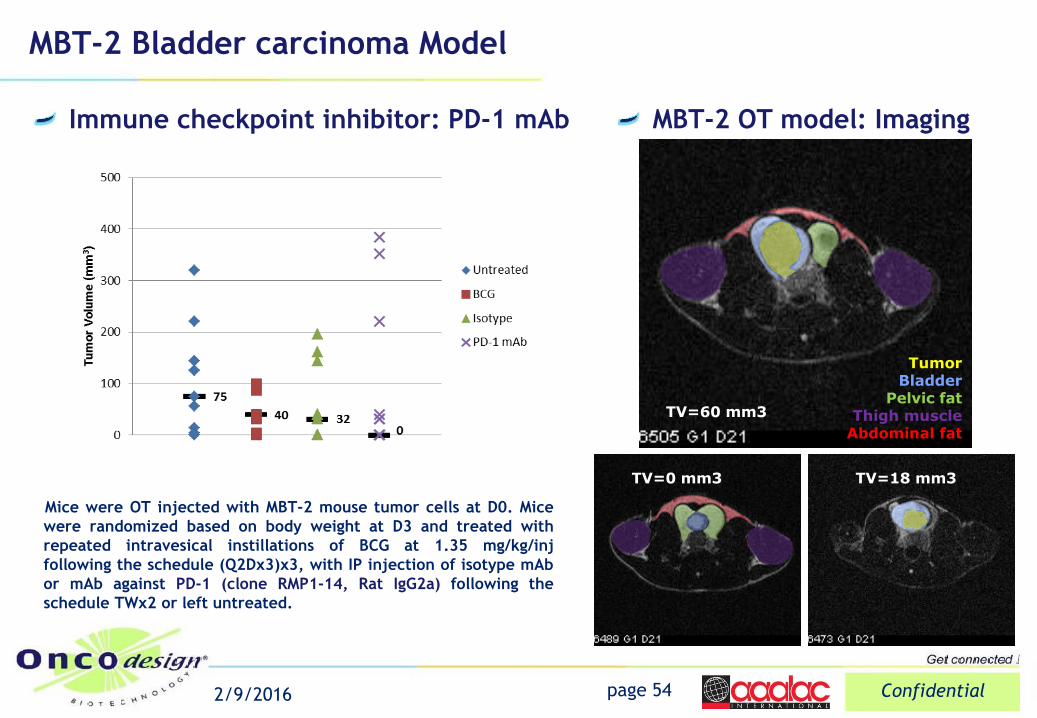
MBT-2 Bladder carcinoma Model
Immune checkpoint inhibitor: PD-1 mAb
page 54 Confidential 2/9/2016
Mice were OT injected with MBT-2 mouse tumor cells at D0. Mice
were randomized based on body weight at D3 and treated with
repeated intravesical instillations of BCG at 1.35 mg/kg/inj
following the schedule (Q2Dx3)x3, with IP injection of isotype mAb
or mAb against PD-1 (clone RMP1-14, Rat IgG2a) following the
schedule TWx2 or left untreated.
MBT-2 OT model: Imaging
TV=60 mm3
Tumor Bladder
Pelvic fat Thigh muscle
Abdominal fat
TV=18 mm3 TV=0 mm3
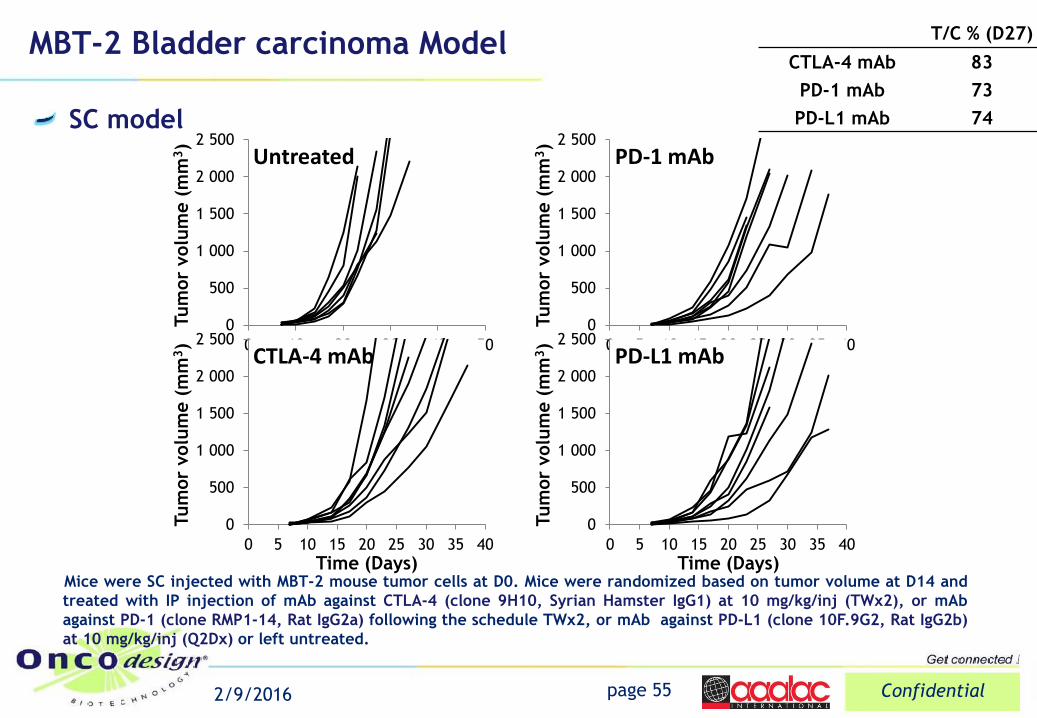
MBT-2 Bladder carcinoma Model
SC model
page 55 Confidential 2/9/2016
Mice were SC injected with MBT-2 mouse tumor cells at D0. Mice were randomized based on tumor volume at D14 and
treated with IP injection of mAb against CTLA-4 (clone 9H10, Syrian Hamster IgG1) at 10 mg/kg/inj (TWx2), or mAb
against PD-1 (clone RMP1-14, Rat IgG2a) following the schedule TWx2, or mAb against PD-L1 (clone 10F.9G2, Rat IgG2b)
at 10 mg/kg/inj (Q2Dx) or left untreated.
0
500
1 000
1 500
2 000
2 500
0 10 20 30 40 50
Tum
or
volu
me (
mm
3)
Time (Days)
Untreated
0
500
1 000
1 500
2 000
2 500
0 5 10 15 20 25 30 35 40
Tum
or
volu
me (
mm
3)
Time (Days)
CTLA-4 mAb
T/C % (D27)
CTLA-4 mAb 83
PD-1 mAb 73
PD-L1 mAb 74
0
500
1 000
1 500
2 000
2 500
0 5 10 15 20 25 30 35 40
Tum
or
volu
me (
mm
3)
Time (Days)
PD-1 mAb
0
500
1 000
1 500
2 000
2 500
0 5 10 15 20 25 30 35 40Tum
or
volu
me (
mm
3)
Time (Days)
PD-L1 mAb
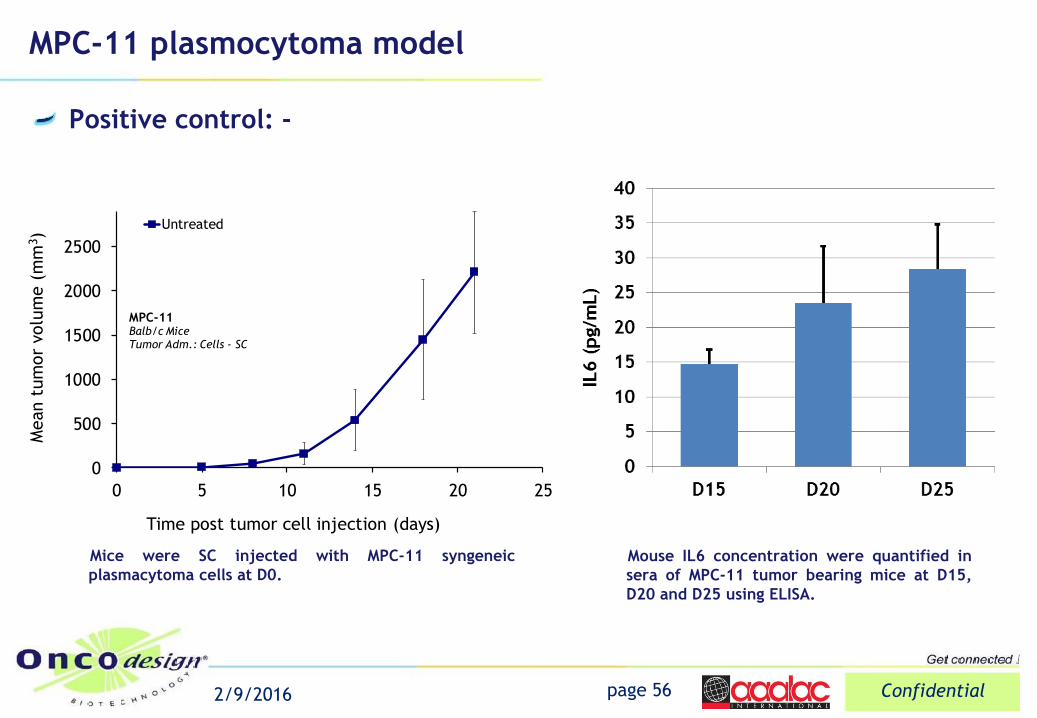
MPC-11 plasmocytoma model
Positive control: -
page 56 Confidential 2/9/2016
Mice were SC injected with MPC-11 syngeneic
plasmacytoma cells at D0.
0
500
1000
1500
2000
2500
0 5 10 15 20 25
Mean t
um
or
volu
me (
mm
3)
Time post tumor cell injection (days)
Untreated
MPC-11Balb/c MiceTumor Adm.: Cells - SC
Mouse IL6 concentration were quantified in
sera of MPC-11 tumor bearing mice at D15,
D20 and D25 using ELISA.
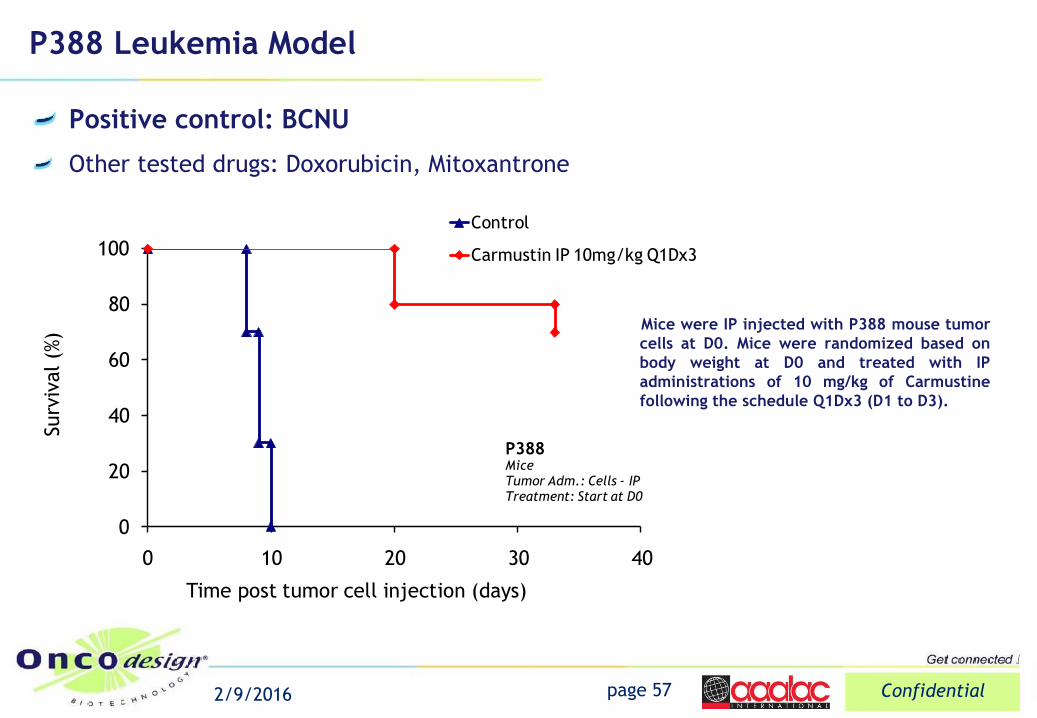
P388 Leukemia Model
Positive control: BCNU
Other tested drugs: Doxorubicin, Mitoxantrone
page 57 Confidential 2/9/2016
0
20
40
60
80
100
0 10 20 30 40
Surv
ival (%
)
Time post tumor cell injection (days)
Control
Carmustin IP 10mg/kg Q1Dx3
P388MiceTumor Adm.: Cells - IPTreatment: Start at D0
Mice were IP injected with P388 mouse tumor
cells at D0. Mice were randomized based on
body weight at D0 and treated with IP
administrations of 10 mg/kg of Carmustine
following the schedule Q1Dx3 (D1 to D3).
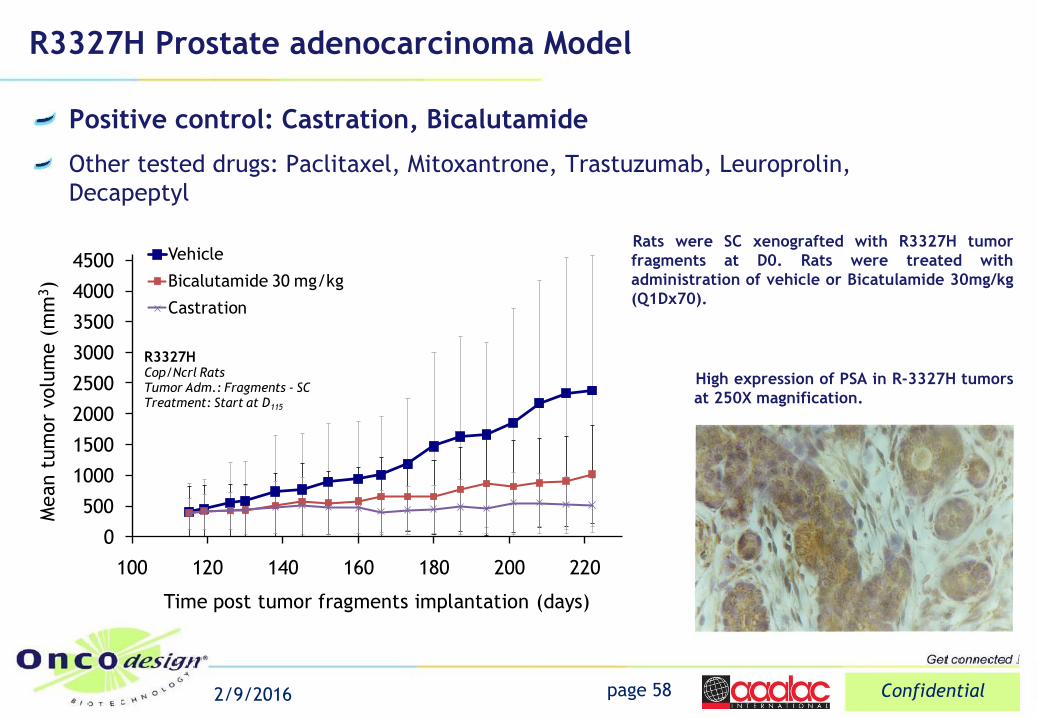
R3327H Prostate adenocarcinoma Model
Positive control: Castration, Bicalutamide
Other tested drugs: Paclitaxel, Mitoxantrone, Trastuzumab, Leuroprolin,
Decapeptyl
page 58 Confidential 2/9/2016
Rats were SC xenografted with R3327H tumor
fragments at D0. Rats were treated with
administration of vehicle or Bicatulamide 30mg/kg
(Q1Dx70).
High expression of PSA in R-3327H tumors
at 250X magnification.
0
500
1000
1500
2000
2500
3000
3500
4000
4500
100 120 140 160 180 200 220
Mean t
um
or
volu
me (
mm
3)
Time post tumor fragments implantation (days)
Vehicle
Bicalutamide 30 mg/kg
Castration
R3327H Cop/Ncrl RatsTumor Adm.: Fragments - SCTreatment: Start at D115
0
500
1 000
1 500
2 000
0 10 20 30 40 50
Time (Days)
TLFRT (2Gy/day)
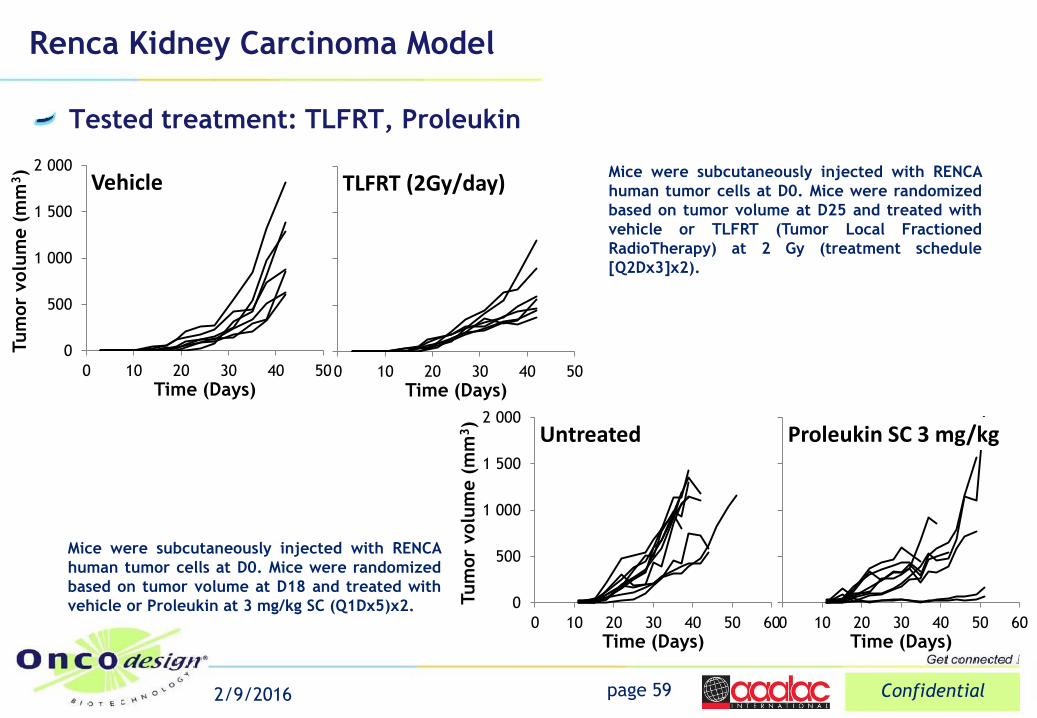
Renca Kidney Carcinoma Model
Tested treatment: TLFRT, Proleukin
page 59 Confidential 2/9/2016
Mice were subcutaneously injected with RENCA
human tumor cells at D0. Mice were randomized
based on tumor volume at D25 and treated with
vehicle or TLFRT (Tumor Local Fractioned
RadioTherapy) at 2 Gy (treatment schedule
[Q2Dx3]x2).
0
500
1 000
1 500
2 000
0 10 20 30 40 50 60
Time (Days)
Proleukin SC 3 mg/kg
Mice were subcutaneously injected with RENCA
human tumor cells at D0. Mice were randomized
based on tumor volume at D18 and treated with
vehicle or Proleukin at 3 mg/kg SC (Q1Dx5)x2.
0
500
1 000
1 500
2 000
0 10 20 30 40 50
Tum
or
volu
me (
mm
3)
Time (Days)
Vehicle
0
500
1 000
1 500
2 000
0 10 20 30 40 50 60
Tum
or
volu
me (
mm
3)
Time (Days)
Untreated
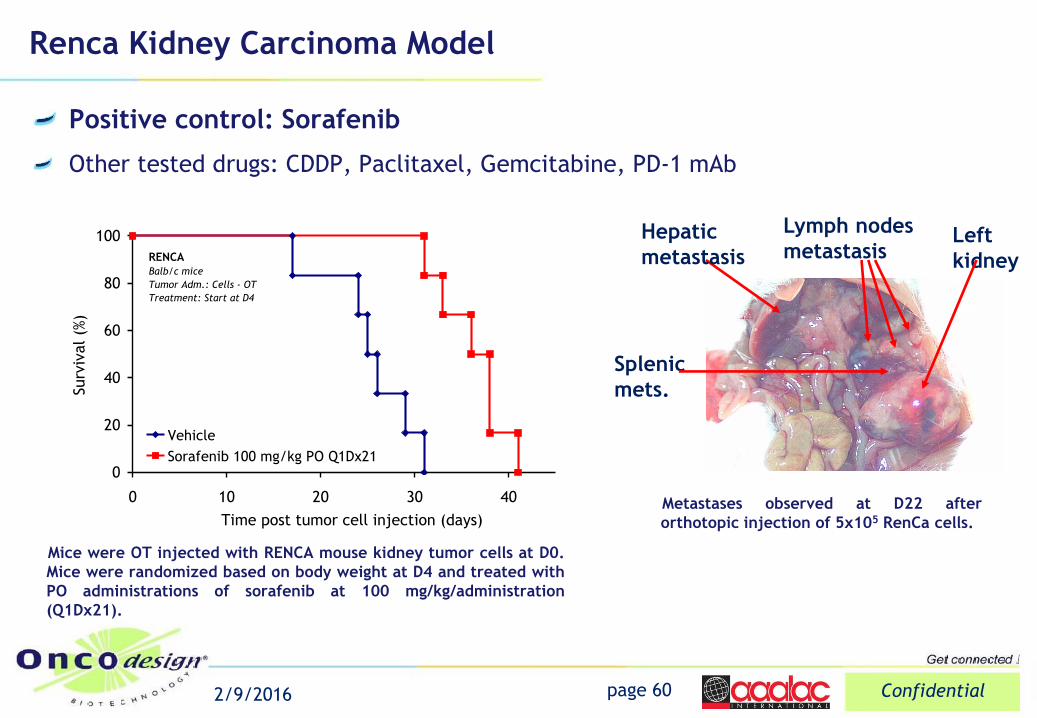
Renca Kidney Carcinoma Model
Positive control: Sorafenib
Other tested drugs: CDDP, Paclitaxel, Gemcitabine, PD-1 mAb
page 60 Confidential 2/9/2016
0
20
40
60
80
100
0 10 20 30 40
Time post tumor cell injection (days)
Surv
ival (%
)
Vehicle
Sorafenib 100 mg/kg PO Q1Dx21
RENCA
Balb/c mice
Tumor Adm.: Cells - OT
Treatment: Start at D4
Left
kidney
Lymph nodes
metastasis Hepatic
metastasis
Splenic
mets.
Metastases observed at D22 after
orthotopic injection of 5x10⁵ RenCa cells.
Mice were OT injected with RENCA mouse kidney tumor cells at D0.
Mice were randomized based on body weight at D4 and treated with
PO administrations of sorafenib at 100 mg/kg/administration
(Q1Dx21).
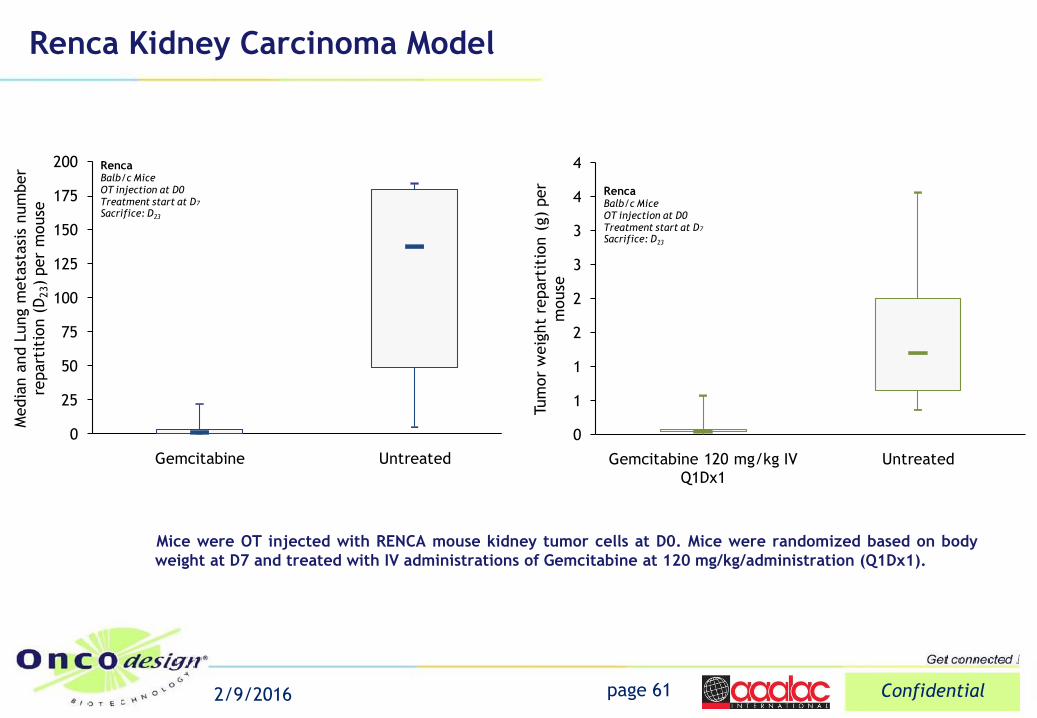
Renca Kidney Carcinoma Model
page 61 Confidential 2/9/2016
0
25
50
75
100
125
150
175
200
Gemcitabine Untreated
Media
n a
nd L
ung m
eta
stasi
s num
ber
repart
itio
n (
D23)
per
mouse
RencaBalb/c MiceOT injection at D0Treatment start at D7
Sacrifice: D23
Mice were OT injected with RENCA mouse kidney tumor cells at D0. Mice were randomized based on body
weight at D7 and treated with IV administrations of Gemcitabine at 120 mg/kg/administration (Q1Dx1).
0
1
1
2
2
3
3
4
4
Gemcitabine 120 mg/kg IV Q1Dx1
Untreated
Tum
or
weig
ht
repart
itio
n (
g)
per
mouse
RencaBalb/c MiceOT injection at D0Treatment start at D7
Sacrifice: D23
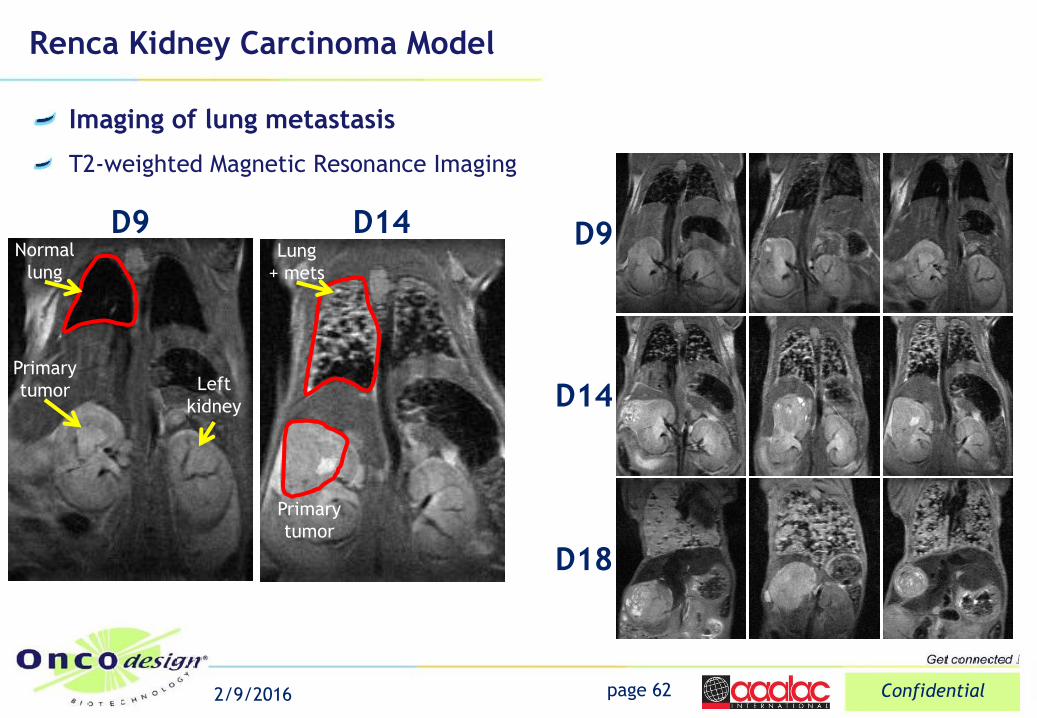
Renca Kidney Carcinoma Model
page 62 Confidential 2/9/2016
Imaging of lung metastasis
T2-weighted Magnetic Resonance Imaging
Left
kidney
Primary
tumor
Normal
lung Lung
+ mets
Primary
tumor
D14 D9 D9
D14
D18
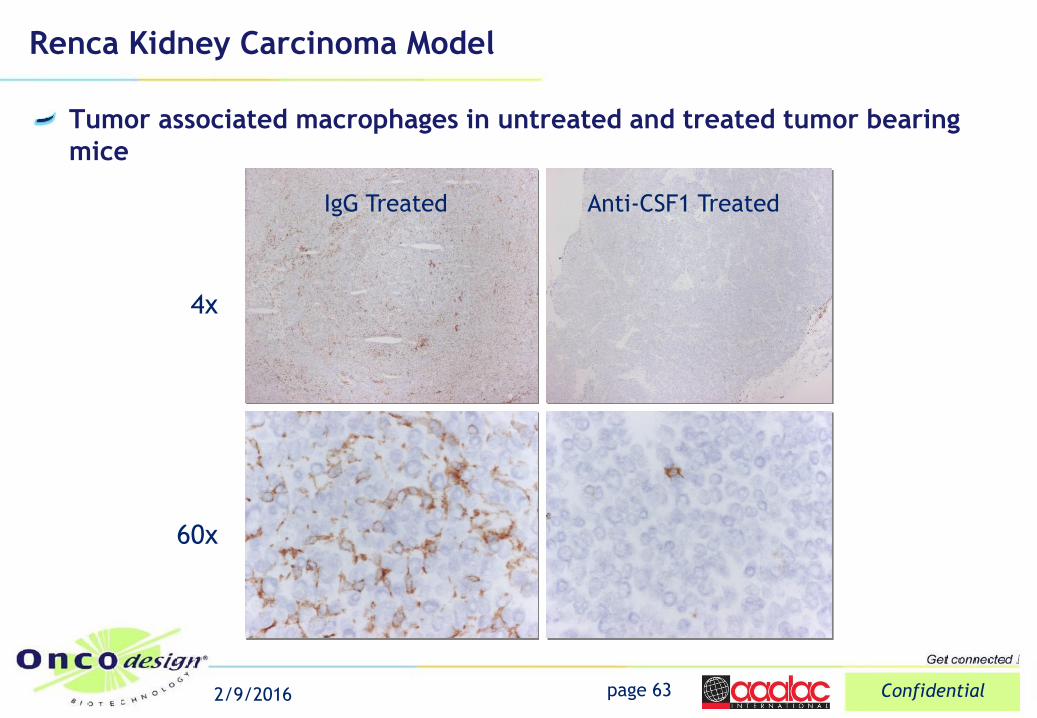
Renca Kidney Carcinoma Model
Tumor associated macrophages in untreated and treated tumor bearing
mice
page 63 Confidential 2/9/2016
4x
60x
IgG Treated Anti-CSF1 Treated
Cytokines release quantification
ELISA / CBA / Luminex
Immune cells phenotyping and quantification
FACS, IHC
Immune cells functionality
Cell preparation and/or sorting using FACS or magnetic beads
Cytotoxic activity based on Cr51 release assay
Proliferation ability based on H3-Thd incorporation assay
Specific cytokine release based on ELISPOT assay
CFU
Immunological endpoints
page 64 Confidential 2/9/2016
Immunological endpoints
page 65 Confidential 2/9/2016
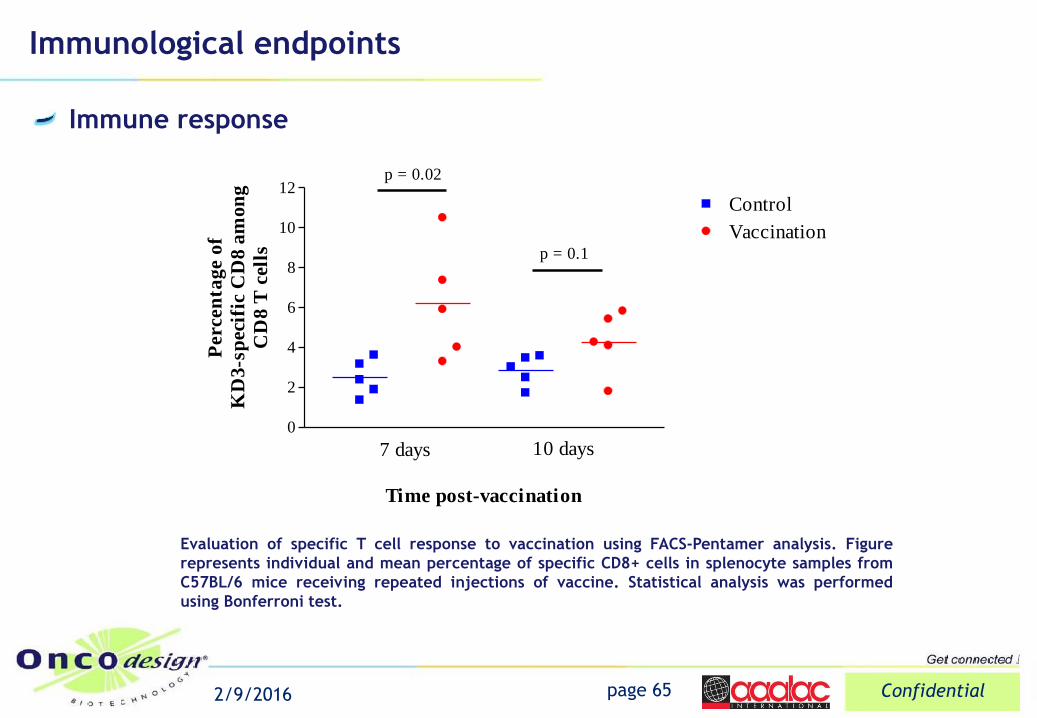
Immune response
0
2
4
6
8
10
12Control
Vaccination
7 days 10 days
p = 0.02
p = 0.1
Time post-vaccination
Percen
tag
e o
f
KD
3-s
pec
ific
CD
8 a
mon
g
CD
8 T
cel
ls
Evaluation of specific T cell response to vaccination using FACS-Pentamer analysis. Figure
represents individual and mean percentage of specific CD8+ cells in splenocyte samples from
C57BL/6 mice receiving repeated injections of vaccine. Statistical analysis was performed
using Bonferroni test.
Immunological endpoints
page 66 Confidential 2/9/2016
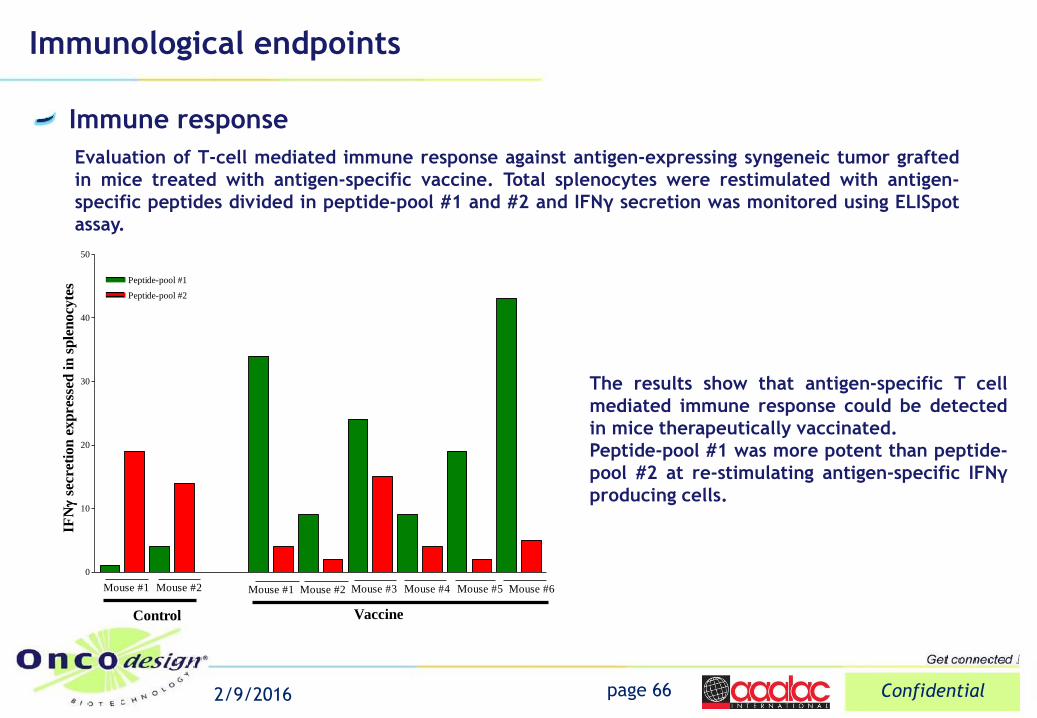
Evaluation of T-cell mediated immune response against antigen-expressing syngeneic tumor grafted
in mice treated with antigen-specific vaccine. Total splenocytes were restimulated with antigen-
specific peptides divided in peptide-pool #1 and #2 and IFNγ secretion was monitored using ELISpot
assay.
0
10
20
30
40
50
Control Vaccine
Mouse #1 Mouse #2 Mouse #1 Mouse #2 Mouse #3 Mouse #4 Mouse #5 Mouse #6
Peptide-pool #1
Peptide-pool #2
IFN
secre
tion
exp
res
sed
in
sp
len
ocy
tes
The results show that antigen-specific T cell
mediated immune response could be detected
in mice therapeutically vaccinated.
Peptide-pool #1 was more potent than peptide-
pool #2 at re-stimulating antigen-specific IFNγ
producing cells.
Immune response
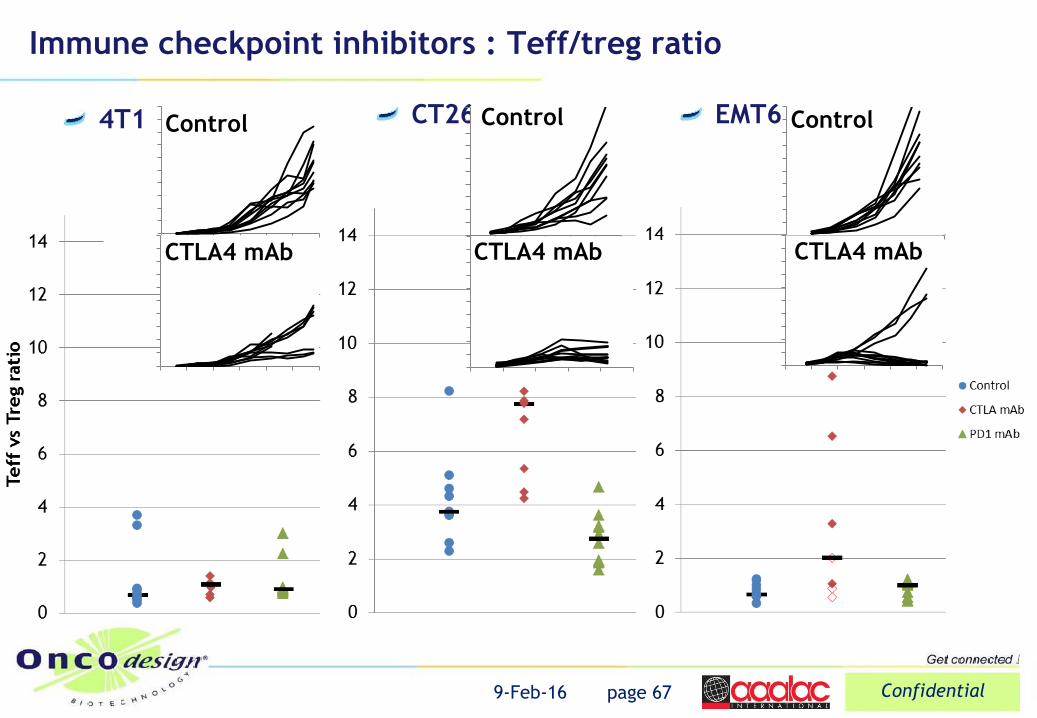
Immune checkpoint inhibitors : Teff/treg ratio
page 67 Confidential 9-Feb-16
CT26 EMT6 Control
CTLA4 mAb
4T1 Control
CTLA4 mAb
Control
CTLA4 mAb
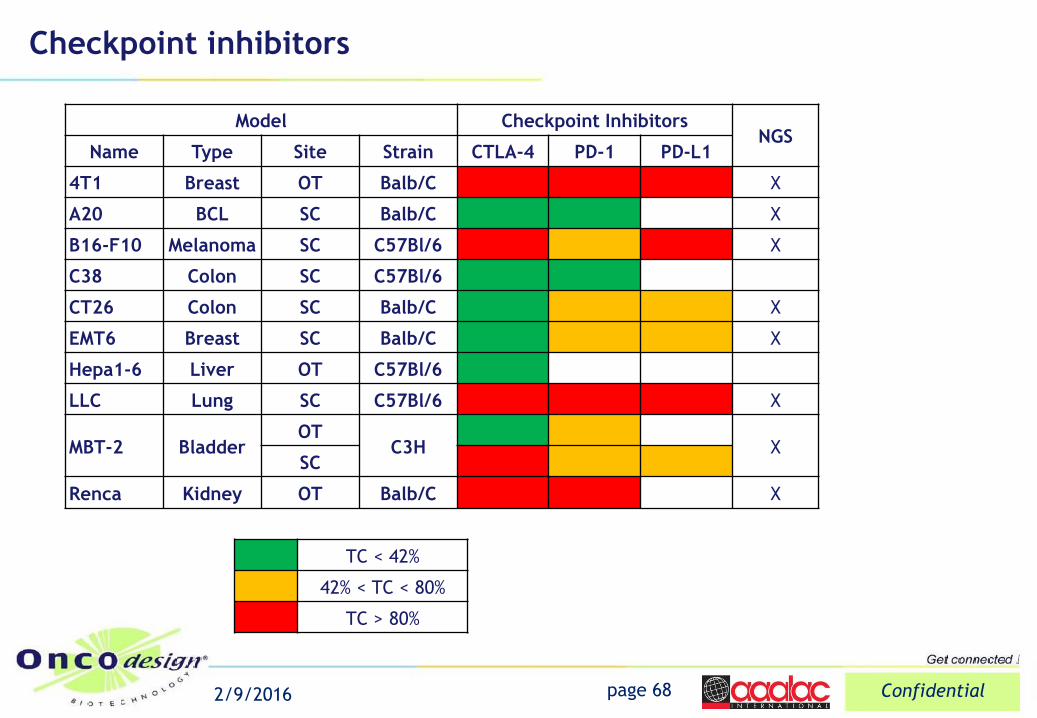
Checkpoint inhibitors
Model Checkpoint Inhibitors NGS
Name Type Site Strain CTLA-4 PD-1 PD-L1
4T1 Breast OT Balb/C X
A20 BCL SC Balb/C X
B16-F10 Melanoma SC C57Bl/6 X
C38 Colon SC C57Bl/6
CT26 Colon SC Balb/C X
EMT6 Breast SC Balb/C X
Hepa1-6 Liver OT C57Bl/6
LLC Lung SC C57Bl/6 X
MBT-2 Bladder OT
C3H
X SC
Renca Kidney OT Balb/C X
page 68 Confidential 2/9/2016
TC < 42%
42% < TC < 80%
TC > 80%
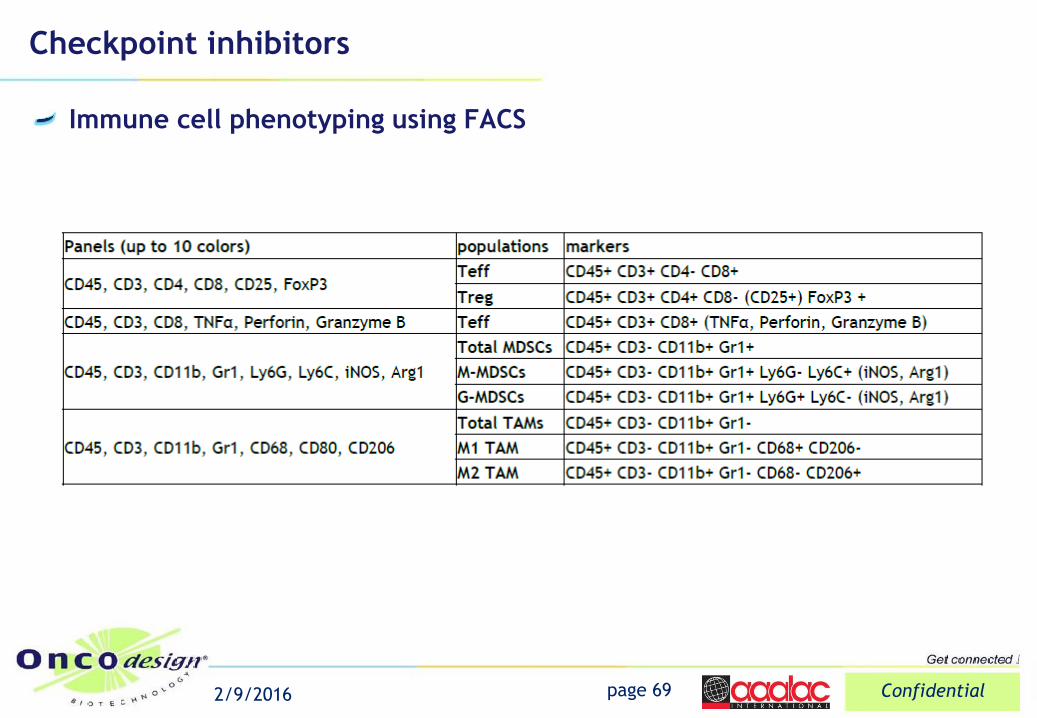
Checkpoint inhibitors
page 69 Confidential 2/9/2016
Immune cell phenotyping using FACS