Embed Size (px)
Citation preview
Maria del Carmen Lavilla Gomez
Licenciada em Bioquímica
Synthesis and Characterization of pH
Stimuli-Responsive Mesoporous Silica Nanoparticles
Dissertação para obtenção do Grau de Mestre em
Genética Molecular e Biomedicina
Orientador: José Paulo Farinha, Professor Doutor, IST-UL.
Co-orientador: Carlos Baleizão, Doutor, IST-UL.
Presidente: Prof. Doutora Paula Maria Theriaga Mendes
Bernardo Gonçalves
Arguente: Prof. Doutor Frederico Castelo Ferreira
Vogal: Prof. Doutor José Paulo Sequeira Farinha
Dezembro 2016

II
III
UNIVERSIDADE NOVA DE LISBOA
FACULDADE DE CIÊNCIAS E TECNOLOGIA
DEPARTAMENTO DE CIÊNCIAS DA VIDA
Maria del Carmen Lavilla Gomez
Synthesis and Characterization of pH Stimuli-Responsive
Mesoporous Silica Nanoparticles
Dissertação apresentada para a obtenção do Grau de Mestre
em Genética Molecular e Biomedicina, pela Universidade Nova
de Lisboa, Faculdade de Ciências e Tecnologia
Orientador:
Professor Doutor José Paulo Farinha
LISBOA
2016

IV
V
Synthesis and Characterization of pH Stimuli-Responsive Mesoporous Silica Nanoparticles
Copyright © Maria del Carmen Lavilla Gomez, Faculdade de Ciências e Tecnologia, Universidade
Nova de Lisboa.
A Faculdade de Ciências e Tecnologia e a Universidade Nova de Lisboa tem o direito, perpétuo
e sem limites geográficos, de arquivar e publicar esta dissertação através de exemplares
impressos reproduzidos em papel ou de forma digital, ou por qualquer outro meio conhecido ou
que venha a ser inventado, e de a divulgar através de repositórios científicos e de admitir a sua
cópia e distribuição com objectivos educacionais ou de investigação, não comerciais, desde que
seja dado crédito ao autor e editor.

VI

VII
Acknowledgements
First and foremost, I would like to express my heartfelt gratitude and indebtedness to my
supervisor Prof. José Paulo Farinha for accepting me in his laboratory and for his valuable
guidance, encouragement, patience, critical review and worthy suggestions for this project,
without which this work would not have materialized. Likewise, I would like to thank my co-
Supervisor, Dr. Carlos Baleizão for his moral support and valuable advice.
For all the trust, advice, orientation and support in the lab and in this last year I would like to
express my appreciation to Carina Crucho. Her expertise and experience as well as her
willingness to teach others have been of great value to my current knowledge. There will be no
organic laboratory that does not remind me of her.
I would like to thank to all the members of this group and from the Centro de Química-Física
Molecular, Instituto Superior Técnico for their constant guidance, encouragement, patience and
help given when needed as well as for the good moments offered. Especially, to Ana Sofia,
Elizabete, Ines and Tânia for the good moments in the office. Moreover, I would like to express
my gratitude to Bruno, Gema, Laurinda, Ritu and Susana, with whom I have shared my scientific
and personal doubts, for all they have done for me. For all the patience, help and for the countless
coffees shared I will never forget Ana Catarina, Filipa and Tiago.
Also, I could not forget Catarina, Cascão, Rita and Tiago for all the good moments, talks and
laughs during the college. They have been always a constant encouragement for me in thick and
thin. I am overwhelmed that life has enabled our paths to cross, their never ending support and
advice brought out the best of me. I would also like to thank to my flat mates for all the great time
together, for taking care of me and for reminding me that there is life outside from work.
Six years ago I undertook a knowledge adventure, it was not an easy pathway, and I could not
be here without the support and trust of my loving parents and brother. I will always be grateful to
them for the way they raised me, the moral values that they have taught me and for the way they
always presented themselves available for any problem I had. To them and to my good friends
that had given me the strength to never stop walking, I will always be grateful.
Finally, I could not forget to mention my sister Bárbara, that even if she left us a long time ago,
she always had been next to me to remind me who I am and where I want to go. Because, life is
too short for not being who you are and for not doing what you love.

VIII
IX
Resumo
No campo da bionanotecnologia tem sido crescente o interesse em desenvolver dispositivos
médicos pelas suas possíveis aplicações na monitorização de doenças, terapia e diagnóstico.
Nanopartículas mesoporosas de sílica (MSNs) têm sido usadas em sistemas de libertação de
fármacos como veículos de transporte pela sua excelente biocompatibilidade, pela uniformidade
e adaptabilidade do tamanho dos poros e pela grande diversidade de funcionalização da
superfície. O revestimento das MSNs com um polímero stimuli-responsive permite o controlo
sobre a libertação de fármaco como resposta a uma condição fisiológica específica, e/ou como
resposta a um estímulo externo. Desta forma, é possível proteger o agente terapêutico de ser
metabolizado pelo organismo e aumentar a sua eficiência e biodisponibilidade no sangue, ao
mesmo tempo que são reduzidos os seus efeitos adversos.
O objectivo deste trabalho consistiu em desenvolver MSN híbridas núcleo-coroa, contendo um
composto fluorescente no núcleo, e com uma coroa polimérica que apresenta uma mudança
conformacional entre expandido e colapsado induzida por alteração do pH, combinando num
único vector capacidades terapêuticas e de diagnóstico. A coroa polimérica foi preparada por
polimerização RAFT (Reversible Addition-Fragmentation Chain Transfer) de forma a obter uma
coroa homogénea e bem definida.
A distribuição de tamanhos do sistema híbrido foi determinada por microscopia de transmissão
electrónica (TEM) e por dispersão de luz dinâmica (DLS), tendo sido obtidos diâmetros de
aproximadamente 150 nm. A caracterização da coroa polimérica foi realizada por espectroscopia
de Ressonância Magnética Nuclear de protão (1H NMR), Infravermelho (FT-IR) e mobilidade
electroforética (potencial zeta). A resposta ao pH foi comprovada por Potencial-Zeta tendo sido
estimado o pH ao qual ocorre a transição conformacional de aproximadamente 6.2 – 6.5.
As nanopartículas híbridas indicam ser biocompatíveis após ensaios em células de
adenocarcinoma pulmonar humano (MCF-7), em que para uma concentração de 125 µg/mL a
viabilidade celular é superior a 70 %.
Palavras Chave: coroa polimérica, nanopartículas mesoporosas de sílica, nanopartículas
híbridas, RAFT, resposta ao pH.

X

XI
Abstract
In the field of bionanotechnology, the interest in the development of healthcare devices has
increased due to their applications on diagnostics and therapeutics. Mesoporous silica
nanoparticles (MSNs) have been used in drug delivery systems (DDSs) as nanocarriers due their
excellent biocompatibility, high surface areas, large pore volumes, high payload, uniform and
tunable pore sizes, and versatile of surface functionalization. The incorporation of a
stimuli-responsive polymeric shell allows the drug release control response through a
disease-specific physiological conditions, and/or from external applied stimuli. Additionally, it will
protect the therapeutic molecules from physiological metabolization and enhance its efficiency
and bioavailability in the bloodstream, as well as reduce the side effects. The goal of this work
was to prepare a fluorescent core-shell MSNs, coated with a pH-responsive polymeric shell,
combining diagnostic and therapeutic properties in a single vector. Reversible Addition-
Fragmentation Chain Transfer (RAFT) polymerization was used to obtain a homogeneous
polymeric shell with a well-defined structure.
The hybrid nanoparticles were characterized by Transmission Electronic Microscopy (TEM) and
Dynamic Light Scattering (DLS), allowing diameters around 150 nm. The polymeric shell was
characterized by Proton Nuclear Magnetic Resonance spectroscopy (1H NMR), Fourier
Transform Infrared Spectroscopy (FT-IR) and electrophoretic mobility (ζ-potential). The pH
responsive behavior was proven by ζ-Potential with an estimated conformational transition at pH
between 6.2 – 6.5.
The hybrid nanoparticles indicate being biocompatible tested by cell viability assays in human
breast adenocarcinoma (MCF-7), which showed that for a concentration of 125 µg/mL the cell
viability is over 70 %.
Key-Words: hybrid nanoparticles, mesoporous silica nanoparticles, RAFT, pH-response,
polymeric shell.

XII
XIII
General Contents
Figure Index ................................................................................................................................ XV
Scheme Index............................................................................................................................ XIX
Table Index ................................................................................................................................ XXI
Abbreviation List ...................................................................................................................... XXIII
Unit List ..................................................................................................................................... XXV
Symbol List ............................................................................................................................. XXVII
1. Introduction.......................................................................................................................... 1
1.1. Mesoporous Silica Nanoparticles .............................................................................. 2
1.2. Silica Nanoparticle Synthesis .................................................................................... 3
1.2.1. Sol-Gel Synthesis ..................................................................................................... 3
1.2.2. Surface Modification ................................................................................................. 6
1.3. Polymer-based Controlled Release Systems ............................................................ 8
1.4. Hybrid Nanoparticles ............................................................................................... 10
1.5. Control Radical Polymerization ............................................................................... 11
1.6. Objective .................................................................................................................. 14
2. Materials and Methods ...................................................................................................... 17
2.1. Materials .................................................................................................................. 17
2.2. Equipment ............................................................................................................... 18
2.2.1. Centrifuge ................................................................................................................ 18
2.2.2. Transmission Electronic Microscopy (TEM) ............................................................ 18
2.2.3. Dynamic Light Scattering (DLS) and ζ-potential ..................................................... 18
2.2.4. Rotary Evaporator ................................................................................................... 19
2.2.5. UV-Vis Spectroscopy ............................................................................................... 19
2.2.6. 1H NMR .................................................................................................................... 19
2.2.7. FT-IR Spectroscopy ................................................................................................. 19
2.3. Methods ................................................................................................................... 19
2.3.1. Mesoporous Silica Nanoparticles Synthesis ........................................................... 19
2.3.2. Mesoporous Silica Nanoparticles Surface Modification .......................................... 20
2.3.3. 2 – (Diisopropylamino) ethyl methacrylate Monomer Synthesis ............................. 20
XIV
2.3.4. Grafting from: RAFT Polymerization at the MSN Surface ....................................... 21
2.3.5. Grafting to: Polymer immobilization at the MSN Surface ........................................ 21
3. Results and Discussion ..................................................................................................... 22
3.1. MSN Size Distribution .............................................................................................. 22
3.1.1. Transmission Electronic Microscopy (TEM) ........................................................... 22
3.1.2. Dynamic Light Scattering (DLS) ............................................................................. 24
3.2. MSN Surface Modification Analysis ........................................................................ 25
3.2.1. 1H NMR ................................................................................................................... 25
3.2.2. UV-Vis Spectroscopy .............................................................................................. 26
3.2.3. ζ-potential Determination ........................................................................................ 27
3.3. Monomer and Polymer Characterization ................................................................. 28
3.3.1. 1H NMR ................................................................................................................... 28
3.3.2. UV-Vis Spectroscopy .............................................................................................. 30
3.4. Hybrid Nanoparticles ............................................................................................... 31
3.4.1. Size Distribution ...................................................................................................... 31
3.4.2. 1H NMR ................................................................................................................... 34
3.4.3. FT-IR Spectroscopy ................................................................................................ 36
3.4.4. ζ-Potential ............................................................................................................... 37
3.5. Cell Viability ............................................................................................................. 39
4. Conclusion and Future Perspectives ................................................................................ 40
5. References ........................................................................................................................ 42
Appendix A .................................................................................................................................... a
Appendix B .................................................................................................................................... c
XV
Figure Index
Figure 1.1. Examples of different organic, inorganic and hybrid nanocarriers. ............................ 2
Figure 1.2. The different pore structure of mesoporous silica materials. ..................................... 2
Figure 1.3. Chemical formula for silica precursor tetraethyl orthosilicate (TEOS). ...................... 4
Figure 1.4. Hydrolysis and condensation reaction of TEOS described for Stöber method. ......... 5
Figure 1.5. Illustration of mesoporous material formation (Adapted from Beck et al., 1992). ...... 6
Figure 1.6. Schematic illustration of silica nanoparticles’ surface functionalization with various
functional groups and (bio)molecules (Adapted from Schulz et al., 2012). .................................. 7
Figure 1.7. Functionalization in different regions of MSN: (a) at the external surface, (b) at the
pore entrances, or (c) within the walls (Slowing et al., 2010). ....................................................... 7
Figure 1.8. Schematic amine internal (A) and external (B) surface functionalization with APTES
molecule. ....................................................................................................................................... 8
Figure 1.9. Stimuli that can induce polymeric conformational transitions. ................................... 9
Figure 1.10. Adaptation of the schematic illustration of drug loading and release by core-shell
mesoporous silica nanoparticle coated with a polymer (Adapted from Wang et al., 2009). ....... 11
Figure 1.11. General structure of RAFT agent (A), trithiocarbonate (B) and dithioester (C). .... 12
Figure 1.12. 2,2′-Azobis(2-methylpropionitrile) AIBN decomposition reaction. .......................... 12
Figure 1.13. Schematic illustration for hybrid mesoporous silica nanoparticles prepared during
this project. .................................................................................................................................. 14
Figure 1.14. Schematic illustration of controlled drug release by MSN.P(DPAEM). .................. 16
Figure 2.1. APTES surface modification scheme. ...................................................................... 20
Figure 2.2. CTA Immobilization scheme on MSN surface. ........................................................ 20
Figure 2.3. Condensation reaction. ............................................................................................ 21
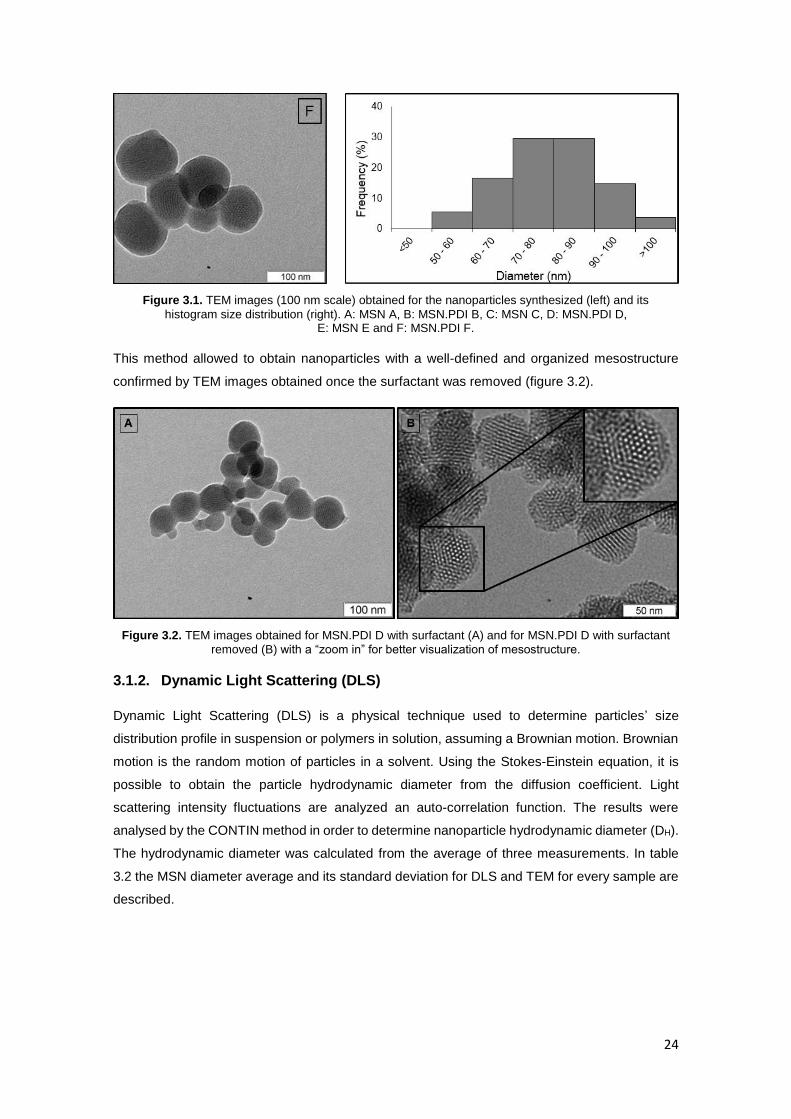
Figure 3.1. TEM images (100 nm scale) obtained for the nanoparticles synthesized (left) and its
histogram size distribution (right). A: MSN A, B: MSN.PDI B, C: MSN C, D: MSN.PDI D, E: MSN
E and F: MSN.PDI F. ................................................................................................................... 24
XVI
Figure 3.2. TEM images obtained for MSN.PDI D with surfactant (A) and for MSN.PDI D with
surfactant removed (B) with a “zoom in” for better visualization of mesostructure. .................... 24
Figure 3.3. UV-Vis Spectrum for MSN.NH2 adjusted (grey) and for MSN.RAFT (on green). ... 26
Figure 3.4. 1H NMR spectra recorded at 400 MHz of DPAEM in chloroform. ............................ 28
Figure 3.5. The 1H NMR spectra recorded at 400 MHz of P(DPAEM) II prepared in
chloroform. ................................................................................................................................... 29
Figure 3.6. Transmittance spectrum for P(DPAEM) I sample at different pH. ........................... 30
Figure 3.7. Transmittance at 500 nm of P(DPAEM) as a function of pH. The pH was increased
by adding 1 M NaOH () and decreased by adding 0.1 M HCl (). .......................................... 31
Figure 3.8. TEM images obtained for MSN D.P(DPAEM) I (A), MSN E.P(DPAEM) II b (B),
MSN E.P(DPAEM) III a (C), MSN C.G P(DPAEM) I (D) and MSN F.G P(DPAEM) I (E). .......... 33
Figure 3.9. 1H NMR spectrum for P(DPAEM) I grafting from polymerization on MSN B
(MSN D.P(DPAEM) I). ................................................................................................................. 34
Figure 3.10. 1H NMR spectra of P(DPAEM) I grafting to on MSN F surface
(MSN F.G P(DPAEM) I). ............................................................................................................. 35
Figure 3.11. FT-IR spectra of MSN.RAFT (a), MSN.P(DPAEM) I (b) and free P(DPAEM) I (c)
samples. ...................................................................................................................................... 36
Figure 3.12. Electrokinetic charge expected for the hybrid systems at different pH values....... 37
Figure 3.13. ζ-potential titrations for MSN (♦), MSN.APTES (), MSN.RAFT() and
MSN.P(DPAEM) II b (). ............................................................................................................. 38
Figure 3.14. ζ-potential titrations for MSN (♦), MSN.APTES() and MSN.G P(DPAEM) I (). .. 38
Figure 3.15. Cell viability obtained by MTT assay for MSN.P(DPAEM) II b (dark grey) and
MSN.G P(DPAEM) I (light grey) with different concentrations during 24 h. ................................ 39
Figure a.1. Size distribution by intensity obtained by DLS for MSN D.P(DPAEM) I (red),
MSN E.P(DPAEM) II a (green) and MSN E.P(DPAEM) II b (blue)……………………………………a
Figure a.2. Size distribution by number obtained by DLS for MSN D.P(DPAEM) I (red),
MSN E.P(DPAEM) II a (green) and MSN E.P(DPAEM) II b (blue)……………………………………a
Figure a.3. Correlogram obtained by DLS for MSN D.P(DPAEM) I (red),
MSN E.P(DPAEM) II a (green) and MSN E.P(DPAEM) II b (blue)……………………………………b

XVII
Figure a.3. Cumulants fit obtained by DLS for MSN D.P(DPAEM) I (red),
MSN E.P(DPAEM) II a (green) and MSN E.P(DPAEM) II b (blue)……………………………………b
Figure b.1. Size distribution by intensity obtained by DLS for MSN E.P(DPAEM) III a (red) and
MSN E.P(DPAEM) III b (green), MSN C.G P(DPAEM) I (blue),
MSN F.G P(DPAEM) I (black) and MSN E.P(DPAEM) III a (pink)……………………………………c
Figure b.2. Size distribution by number obtained by DLS for MSN E.P(DPAEM) III a (red) and
MSN E.P(DPAEM) III b (green), MSN C.G P(DPAEM) I (blue), MSN F.G P(DPAEM) I (black)
and MSN E.P(DPAEM) III a (pink)……………………………………………………………………….c
Figure b.3. Correlogram obtained by DLS for MSN E.P(DPAEM) III a (red) and MSN
E.P(DPAEM) III b (green), MSN C.G P(DPAEM) I (blue), MSN F.G P(DPAEM) I (black) and
MSN E.P(DPAEM) III a (pink)……………………………………………………………………………d
Figure b.4. Cumlants fit obtained by DLS for MSN E.P(DPAEM) III a (red) and MSN E.P(DPAEM)
III b (green), MSN C.G P(DPAEM) I (blue), MSN F.G P(DPAEM) I (black) and
MSN E.P(DPAEM) III a pink)………......………………………………………………………………...d

XVIII

XIX
Scheme Index
Scheme 1.1. General scheme for hydrolysis (A) and condensation (B) and (C) in sol-gel. ......... 4
Scheme 1.2. RAFT polymerization mechanism (Moad et al., 2005). ......................................... 13

XX

XXI
Table Index
Table 2.1. Temperature, time and TFA equivalent used for the different polymerization
reactions ...................................................................................................................................... 21
Table 3.1. Catalyst concentration (NaOH) used for the synthesis of each sample and its
correspondent TEM image in figure 17. ...................................................................................... 22
Table 3.2. MSN diameter average and its standard deviation obtained by DLS and TEM. ....... 25
Table 3.3. APTES concentration on the MSN surface, calculated by 1H NMR. ......................... 26
Table 3.4. RAFT concentration calculated through the Lambert-Beer equation. ....................... 27
Table 3.5. ζ-potential of MSN samples on every step of its surface modification
measure at pH=5. ........................................................................................................................ 27
Table 3.6. Monomer and CTA molecular weight used for calculate Mn,NMR ............................ 29
Table 3.7. Average hydrodynamic diameter (DH) obtained by DLS and the diameters
obtained by TEM (DTEM). ............................................................................................................ 32

XXII
XXIII
Abbreviation List
Abs Absorbance
AIBN 2,2′-Azobis(2-methylpropionitrile)
APTES (3-Aminopropyl) triethoxysilane
ATRP Atom Transfer Radical Polymerization
CMC Critical Micellar Concentration
CP Chain Polymerization
CRP Controlled Radical Polymerization
CSIRO Commonwealth Scientific and Industrial Research Organisation
CTA Chain Transfer Agent
CTAB Hexadecyltrimethylammonium Bromide
DH Hydrodynamic Diameter
DI Deionized
DLS Dynamic Light Scattering
DPAEM 2-(diisopropylamino)ethyl methacrylate
DTEM Diameter obtained by Transmission Electronic Microscopy
EDC N-(3-dimethylaminopropyl) -N′-ethylcarbodiimide
FT-IR Fourier Transform Infrared
H1 NMR Pronton Nuclear Magnetic Resonance
MCM-41 Mobil Composition of Matter Number 41
MSN Mesoporous Silica Nanoparticles
MSN.APTES Mesoporous Silica Nanoparticles Surface Modified with APTES
MSN.RAFT MSN.APTES linked to RAFT Agent
MSN.P(DPAEM) MSN coated with DPAEM polymer obtained by grafting from
XXIV
MSN.G P(DPAEM) MSN coated with DPAEM polymer obtained by grafting to
MW Molecular Weight
NMP Nitroxide-Mediated Polymerization
NNI National Nanotechnology Initiative
P(DPAEM) Poly (2-(diisopropylamino)ethyl methacrylate)
PBS Phosphate Buffered Saline
PDI Perylenediimide
IEP Isoelectric Point
pKa Acid Dissociation Constant
RAFT Reversible Addition-Fragmentation Chain Transfer
RP Radical Polymerization
TEM Transmission Electronic Microscopy
TEOS Tetraethyl Orthosilicate
TFA Tetrahydrofuran
THF Tetrahydrofuran
UV Ultraviolet
ZP ζ-Potential
XXV
Unit List
Da Dalton
Eq Equivalent
g; mg Grams; milligrams (10-3 g)
h; min; s hours; minutes; seconds
K Kelvin
kV; mV Kilovolts (103 V); millivolts (10-3 V)
L; mL Litre; millilitre (10-3 L)
M Molar
m, cm, μm, nm meter; centimeter (10-2 m); micrometer (10-6 m); nanometer (10-9 m)
MHz Megahertz
mol; mmol Mol; millimol (10-3 mol)
MΩ Megaohm
ppm Parts per million
rpm Rotations per minute
x g Times gravity

XXVI
XXVII
Symbol List
[AIBN] AIBN concentration
[APTES] APTES concentration
δ Bending vibration
c Concentration
ρ Conversion
MCTA CTA MW
[CTA]0 Initial CTA concentration
[M]0 Initial Monomer concentration
l Length
ε Molar Absorptivity
Mmon Monomer MW
[NaOH] NaOH concentration
Mn Polymer MW
Ν Stretching vibration
Λ Wavelength

XXVIII
1
1. Introduction
The nanotechnology concept appears in 1959 with the physicist Richard Feynman in a lecture
entitled “There’s Plenty of Room at the Bottom”, where he refers for the first time the possibility
of handling materials in a nanoscale by using atomic and molecular units (Feynman, 1959;
Goodsell, 2004; “National Nanotechnology Initiative”, 2015; Singh, 2010). Nowadays,
nanotechnology is known as a multidisciplinary scientific field that involves the manipulation of
matter to design and engineer devices at the nanoscale, according to the National
Nanotechnology Initiative (NNI) between 1 and 100 nm range at least in one dimension (Ferrari,
2005; Jain, 2005; “National Nanotechnology Initiative”, 2015). The interest in those materials lies
in their great potential applications in several disciplines due to their unique physical and chemical
properties derived from their nano size (Ferrari, 2005; Jain, 2005; Mousa et al., 2011; Singh,
2010).
In bio-nanotechnology, the development of healthcare devices has a great impact for its
applications in diagnostics and therapeutics, by mimicking the “magic bullet concept”, proposed
by Paul Ehrlich (Strebhardt et al., 2008; Li et al., 2012). This idea arises from the concern about
low specificity and effectiveness due to the difficulties displayed by drugs in order to overcome
the biological hurdles until reaching their target. Nevertheless, it is possible to overcome those
pharmacokinetic and pharmacodynamics issues with selective and effective delivery systems by
using nanocarriers, enhancing the efficiency and reducing the side effects (Argyo et al., 2013;
Cuenca et al., 2006; Ferrari, 2005; Jain, 2005; Li, 2012; Mousa et al., 2011; Singh, 2010;
Tan et al., 2004). Besides avoiding adverse side effects and increasing selectivity and specificity,
drug delivery systems (DDS) have a great potential for personalized medicine on behalf of
eradicating complex diseases, such as cancer, by integrating on the same dispositive detection,
treatment, and monitoring of the disease in real time. These bionanotechnological devices are
meant to replace invasive conventional methods used to track and treat diseases (Ferrari, 2005;
Mousa et al., 2011; Singh, 2010).
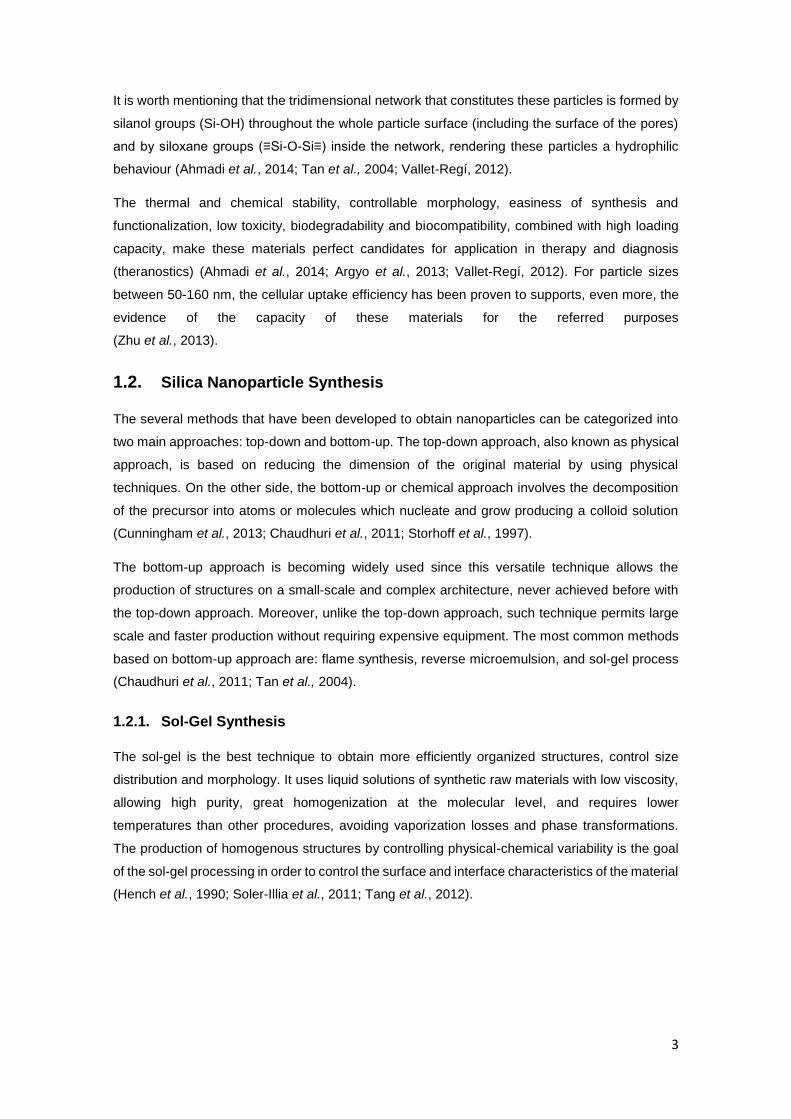
Several nanocarriers (Figure 1.1) have been developed in the field of nanomedicine classified as
organic (liposomes, biodegradable polymers, dendrimers, carbon nanotubes, etc.), inorganic
(quantum dots, inorganic nanoparticles, etc.) or hybrid (with two different compounds). These
systems are able to improve the methods used for diagnostics and therapeutics by having in mind
biocompatibility and biodegradability of the materials used in nanocarriers fabrication (Cuenca et
al., 2006; Mousa et al., 2011; Singh, 2010).
Nanoparticles have shown a great potential in medicine not only due to its unique chemical and
physical properties derived from their nano size, but also due to its maximum surface to volume
ratio that allowing surface functionalization as well as the incorporation of a therapeutics load. All
these features enable better access to the target as compared to conventional nanocarriers.
Therefore, the use of nanoparticles as DDS improves tissue selectivity uptake and provides drugs
protection against degradation (Li, 2012; Mousa et al., 2011; Tan et al., 2004).

2
Figure 1.1. Examples of different organic, inorganic and hybrid nanocarriers.
1.1. Mesoporous Silica Nanoparticles
The importance of silica nanoparticles rises from its unique properties such as mechanical
strength, permeability, thermal and chemical stability, low refractive index, high surface area as
well as its versatile surface chemistry. The last two properties allow bioconjugation with other
molecules through surface modification, either by the reaction the silanols groups (at the surface
of the nanoparticle) or by adsorption on the surface. Apart from the previously mentioned
characteristics, size, shape, and inner structure can be tuned accordingly to the desired
application (Ahmadi et al., 2014; Argyo et al., 2013; Huh et al., 2003; Li et al., 2012; Schulz et al.,
2012; Slowing et al., 2006; Trewyn et al., 2007; Vallet-Regí, 2012; Wang et al., 2009). This
discovery was made by Mobil Oil Corporation in 1992 through the development of highly ordered
mesoporous silica materials known as Mobil Composition of Matter Number 41 (MCM-41) (Argyo
et al., 2013; Trewyn et al., 2007; Vallet-Regí, 2012). Those materials are characterized by uniform
cylindrical pores with tuneable diameters (between 2 and 50 nm) which result in a large pore
volume and high surface area (700–1500 m2/g) and large pore volume (1 mL/g). All these features
make them ideal materials for DDS, making possible to host several molecules inside the pores,
regardless of their nature (Argyo et al., 2013; Trewyn et al., 2007; Vallet-Regí, 2012).
Mesoporous silica nanoparticles for DDs requires controlling the diameter of the nanoparticles,
as well as the volume, shape and organization of the mesopores, depending on its application
(Figure 1.2). These modifications can be performed by tuning different parameters, such as the
template, temperature, pH, etc. (Argyo et al., 2013; Trewyn et al., 2007; Vallet-Regí, 2012).
Figure 1.2. The different pore structure of mesoporous silica materials.
3
It is worth mentioning that the tridimensional network that constitutes these particles is formed by
silanol groups (Si-OH) throughout the whole particle surface (including the surface of the pores)
and by siloxane groups (≡Si-O-Si≡) inside the network, rendering these particles a hydrophilic
behaviour (Ahmadi et al., 2014; Tan et al., 2004; Vallet-Regí, 2012).
The thermal and chemical stability, controllable morphology, easiness of synthesis and
functionalization, low toxicity, biodegradability and biocompatibility, combined with high loading
capacity, make these materials perfect candidates for application in therapy and diagnosis
(theranostics) (Ahmadi et al., 2014; Argyo et al., 2013; Vallet-Regí, 2012). For particle sizes
between 50-160 nm, the cellular uptake efficiency has been proven to supports, even more, the
evidence of the capacity of these materials for the referred purposes
(Zhu et al., 2013).
1.2. Silica Nanoparticle Synthesis
The several methods that have been developed to obtain nanoparticles can be categorized into
two main approaches: top-down and bottom-up. The top-down approach, also known as physical
approach, is based on reducing the dimension of the original material by using physical
techniques. On the other side, the bottom-up or chemical approach involves the decomposition
of the precursor into atoms or molecules which nucleate and grow producing a colloid solution
(Cunningham et al., 2013; Chaudhuri et al., 2011; Storhoff et al., 1997).
The bottom-up approach is becoming widely used since this versatile technique allows the
production of structures on a small-scale and complex architecture, never achieved before with
the top-down approach. Moreover, unlike the top-down approach, such technique permits large
scale and faster production without requiring expensive equipment. The most common methods
based on bottom-up approach are: flame synthesis, reverse microemulsion, and sol-gel process
(Chaudhuri et al., 2011; Tan et al., 2004).
1.2.1. Sol-Gel Synthesis
The sol-gel is the best technique to obtain more efficiently organized structures, control size
distribution and morphology. It uses liquid solutions of synthetic raw materials with low viscosity,
allowing high purity, great homogenization at the molecular level, and requires lower
temperatures than other procedures, avoiding vaporization losses and phase transformations.
The production of homogenous structures by controlling physical-chemical variability is the goal
of the sol-gel processing in order to control the surface and interface characteristics of the material
(Hench et al., 1990; Soler-Illia et al., 2011; Tang et al., 2012).
4
The synthesis of silica nanoparticles is usually based on this procedure due to its ability to easily
control particle size, size distribution, and morphology by simply monitoring the reaction
parameters. The sol-gel synthesis can be performed using either acidic (hydrochloric acid, nitric
acid, etc.) or basic conditions (sodium or ammonium hydroxide) to catalyse the hydrolysis of the
silica precursor, yielding a colloidal solution (sol) constituted by silanol groups (Scheme 1.1 - A).
Two types of silica precursors are usually used for silica nanoparticles synthesis: inorganic salts
(sodium silicates) or metal alkoxides (tetra-alkyl oxide of silane). Afterwards, the condensation
between the silanol groups (Scheme 1.1 - B) or between silanol groups and ethoxy groups
(Scheme 1.1 - C) originates siloxane bridges (Si-O-Si) that establish the silica network (gel)
(Green et al., 2003).
Scheme 1.1. General scheme for hydrolysis (A) and condensation (B) and (C) in sol-gel.
Great efforts have been made to synthesise monodispersed and well define size and shape silica
nanoparticles for research applications, offering experimental and theoretical advantages by
simplifying data analyses and understand physiochemical properties and physiopathological
effects of those particles (Stöber et al., 1968).
1.2.1.1. Stöber Method
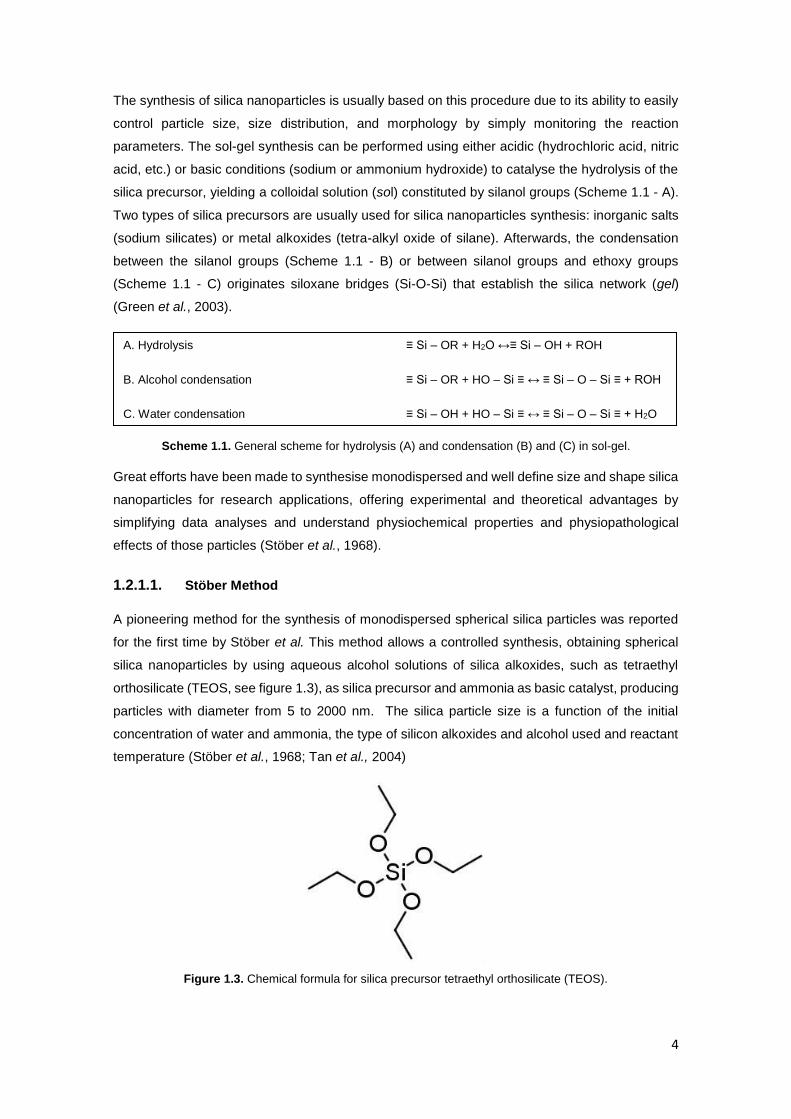
A pioneering method for the synthesis of monodispersed spherical silica particles was reported
for the first time by Stöber et al. This method allows a controlled synthesis, obtaining spherical
silica nanoparticles by using aqueous alcohol solutions of silica alkoxides, such as tetraethyl
orthosilicate (TEOS, see figure 1.3), as silica precursor and ammonia as basic catalyst, producing
particles with diameter from 5 to 2000 nm. The silica particle size is a function of the initial
concentration of water and ammonia, the type of silicon alkoxides and alcohol used and reactant
temperature (Stöber et al., 1968; Tan et al., 2004)
Figure 1.3. Chemical formula for silica precursor tetraethyl orthosilicate (TEOS).
A. Hydrolysis ≡ Si – OR + H2O ↔≡ Si – OH + ROH
B. Alcohol condensation ≡ Si – OR + HO – Si ≡ ↔ ≡ Si – O – Si ≡ + ROH
C. Water condensation ≡ Si – OH + HO – Si ≡ ↔ ≡ Si – O – Si ≡ + H2O
5
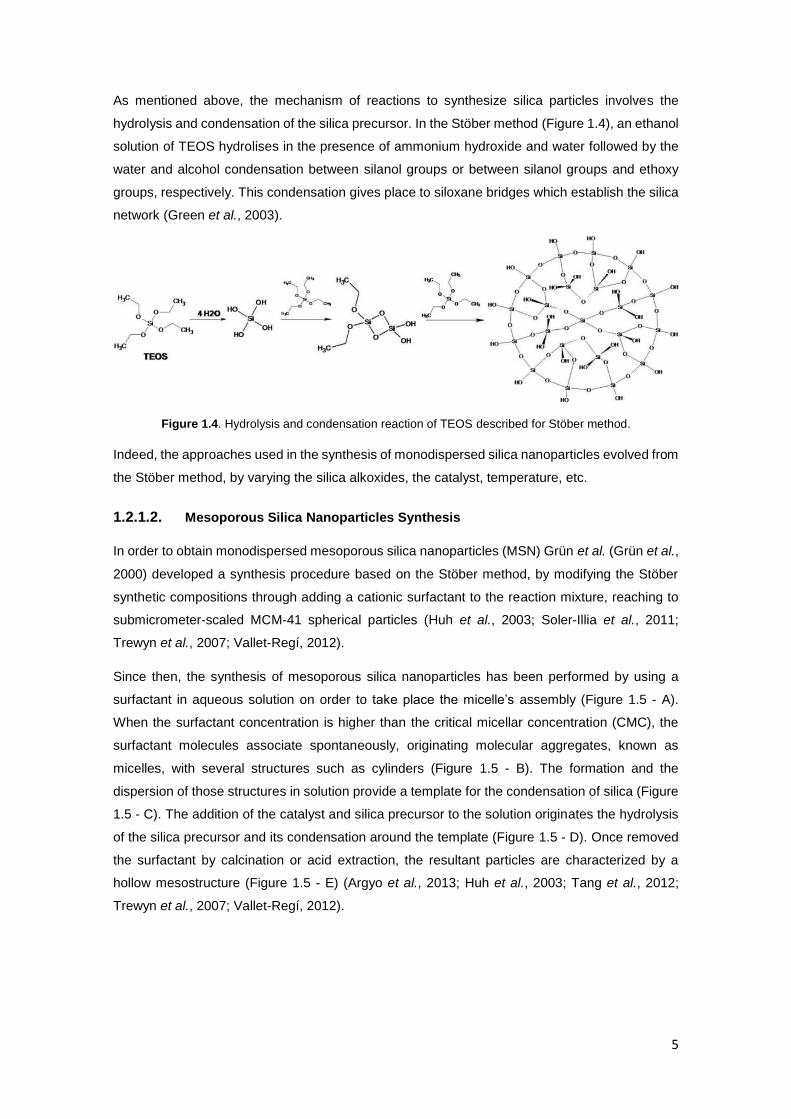
As mentioned above, the mechanism of reactions to synthesize silica particles involves the
hydrolysis and condensation of the silica precursor. In the Stöber method (Figure 1.4), an ethanol
solution of TEOS hydrolises in the presence of ammonium hydroxide and water followed by the
water and alcohol condensation between silanol groups or between silanol groups and ethoxy
groups, respectively. This condensation gives place to siloxane bridges which establish the silica
network (Green et al., 2003).
Figure 1.4. Hydrolysis and condensation reaction of TEOS described for Stöber method.
Indeed, the approaches used in the synthesis of monodispersed silica nanoparticles evolved from
the Stöber method, by varying the silica alkoxides, the catalyst, temperature, etc.
1.2.1.2. Mesoporous Silica Nanoparticles Synthesis
In order to obtain monodispersed mesoporous silica nanoparticles (MSN) Grün et al. (Grün et al.,
2000) developed a synthesis procedure based on the Stöber method, by modifying the Stöber
synthetic compositions through adding a cationic surfactant to the reaction mixture, reaching to
submicrometer-scaled MCM-41 spherical particles (Huh et al., 2003; Soler-Illia et al., 2011;
Trewyn et al., 2007; Vallet-Regí, 2012).
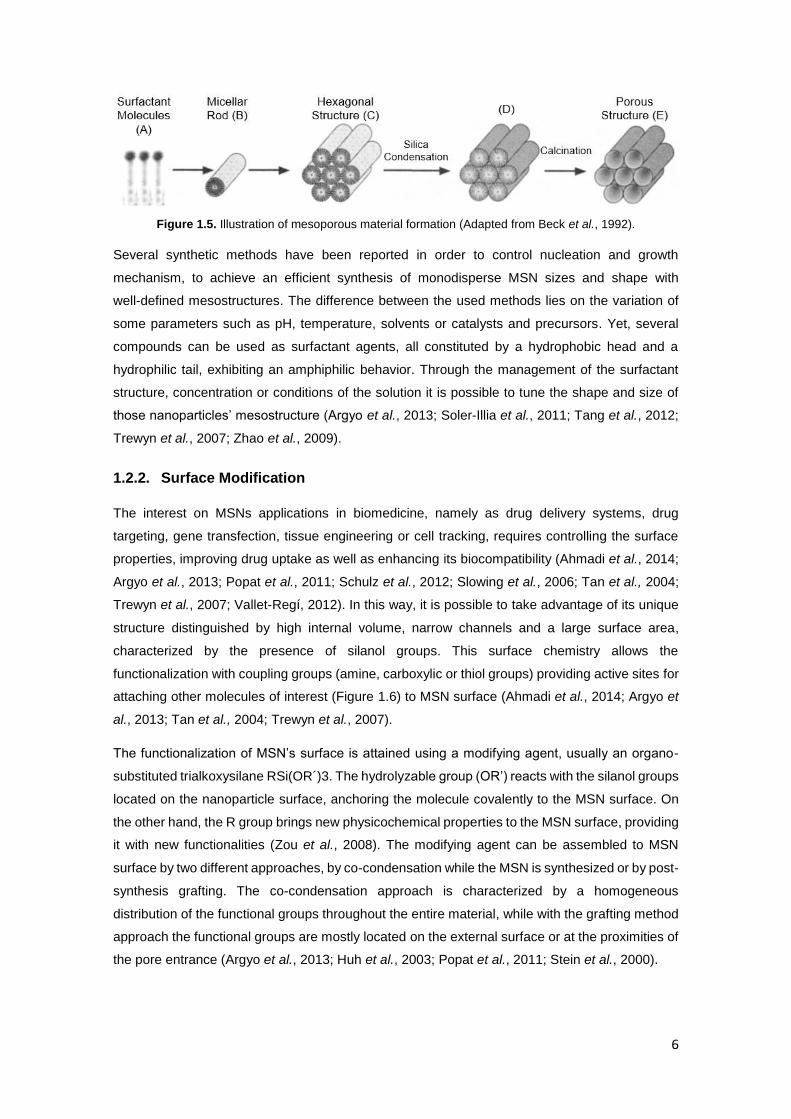
Since then, the synthesis of mesoporous silica nanoparticles has been performed by using a
surfactant in aqueous solution on order to take place the micelle’s assembly (Figure 1.5 - A).
When the surfactant concentration is higher than the critical micellar concentration (CMC), the
surfactant molecules associate spontaneously, originating molecular aggregates, known as
micelles, with several structures such as cylinders (Figure 1.5 - B). The formation and the
dispersion of those structures in solution provide a template for the condensation of silica (Figure
1.5 - C). The addition of the catalyst and silica precursor to the solution originates the hydrolysis
of the silica precursor and its condensation around the template (Figure 1.5 - D). Once removed
the surfactant by calcination or acid extraction, the resultant particles are characterized by a
hollow mesostructure (Figure 1.5 - E) (Argyo et al., 2013; Huh et al., 2003; Tang et al., 2012;
Trewyn et al., 2007; Vallet-Regí, 2012).
6
Figure 1.5. Illustration of mesoporous material formation (Adapted from Beck et al., 1992).
Several synthetic methods have been reported in order to control nucleation and growth
mechanism, to achieve an efficient synthesis of monodisperse MSN sizes and shape with
well-defined mesostructures. The difference between the used methods lies on the variation of
some parameters such as pH, temperature, solvents or catalysts and precursors. Yet, several
compounds can be used as surfactant agents, all constituted by a hydrophobic head and a
hydrophilic tail, exhibiting an amphiphilic behavior. Through the management of the surfactant
structure, concentration or conditions of the solution it is possible to tune the shape and size of
those nanoparticles’ mesostructure (Argyo et al., 2013; Soler-Illia et al., 2011; Tang et al., 2012;
Trewyn et al., 2007; Zhao et al., 2009).
1.2.2. Surface Modification
The interest on MSNs applications in biomedicine, namely as drug delivery systems, drug
targeting, gene transfection, tissue engineering or cell tracking, requires controlling the surface
properties, improving drug uptake as well as enhancing its biocompatibility (Ahmadi et al., 2014;
Argyo et al., 2013; Popat et al., 2011; Schulz et al., 2012; Slowing et al., 2006; Tan et al., 2004;
Trewyn et al., 2007; Vallet-Regí, 2012). In this way, it is possible to take advantage of its unique
structure distinguished by high internal volume, narrow channels and a large surface area,
characterized by the presence of silanol groups. This surface chemistry allows the
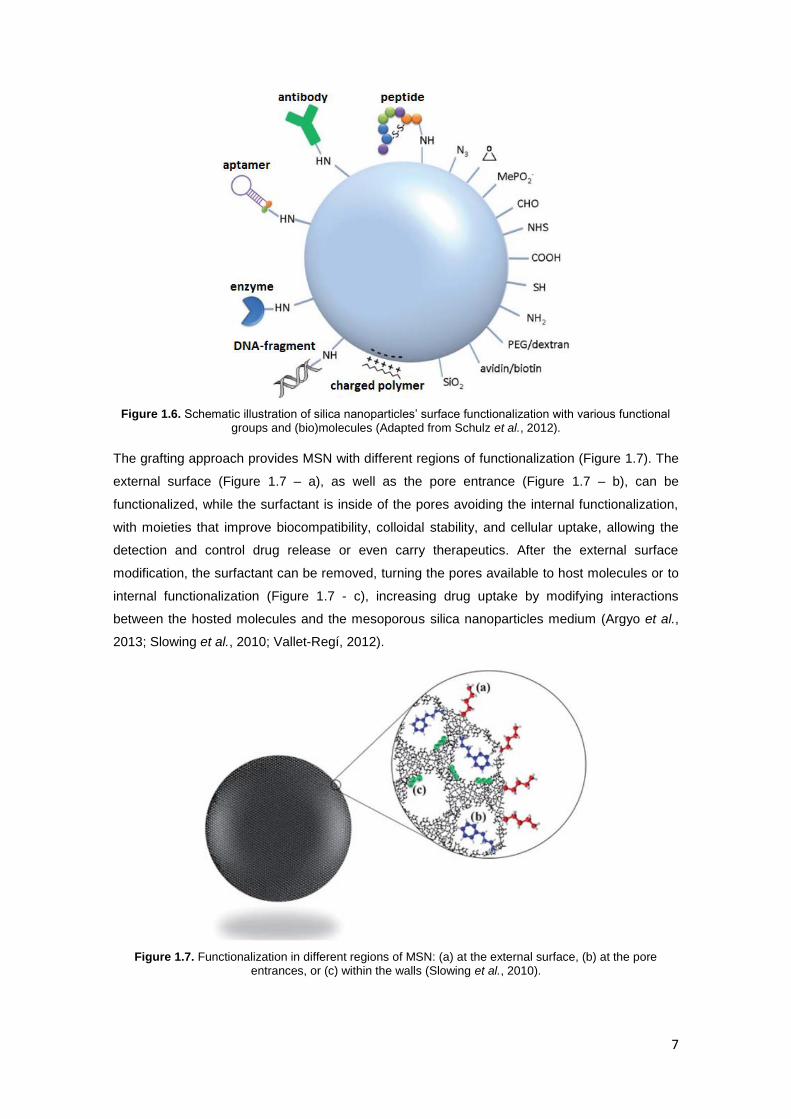
functionalization with coupling groups (amine, carboxylic or thiol groups) providing active sites for
attaching other molecules of interest (Figure 1.6) to MSN surface (Ahmadi et al., 2014; Argyo et
al., 2013; Tan et al., 2004; Trewyn et al., 2007).
The functionalization of MSN’s surface is attained using a modifying agent, usually an organo-
substituted trialkoxysilane RSi(OR´)3. The hydrolyzable group (OR’) reacts with the silanol groups
located on the nanoparticle surface, anchoring the molecule covalently to the MSN surface. On
the other hand, the R group brings new physicochemical properties to the MSN surface, providing
it with new functionalities (Zou et al., 2008). The modifying agent can be assembled to MSN
surface by two different approaches, by co-condensation while the MSN is synthesized or by post-
synthesis grafting. The co-condensation approach is characterized by a homogeneous
distribution of the functional groups throughout the entire material, while with the grafting method
approach the functional groups are mostly located on the external surface or at the proximities of
the pore entrance (Argyo et al., 2013; Huh et al., 2003; Popat et al., 2011; Stein et al., 2000).
7
Figure 1.6. Schematic illustration of silica nanoparticles’ surface functionalization with various functional groups and (bio)molecules (Adapted from Schulz et al., 2012).
The grafting approach provides MSN with different regions of functionalization (Figure 1.7). The
external surface (Figure 1.7 – a), as well as the pore entrance (Figure 1.7 – b), can be
functionalized, while the surfactant is inside of the pores avoiding the internal functionalization,
with moieties that improve biocompatibility, colloidal stability, and cellular uptake, allowing the
detection and control drug release or even carry therapeutics. After the external surface
modification, the surfactant can be removed, turning the pores available to host molecules or to
internal functionalization (Figure 1.7 - c), increasing drug uptake by modifying interactions
between the hosted molecules and the mesoporous silica nanoparticles medium (Argyo et al.,
2013; Slowing et al., 2010; Vallet-Regí, 2012).
Figure 1.7. Functionalization in different regions of MSN: (a) at the external surface, (b) at the pore entrances, or (c) within the walls (Slowing et al., 2010).
8
It is known that the uptake and release of drugs are dependent on the type of functional groups
found at MSN surface and consequently to the of interaction between this groups and the drug
molecules. Therefore, the aim of MSN’s functionalization on biomedicine field is to ensure better
drug delivery, higher adsorption of the drug as well as retain the drug release until it reaches the
target, improving effectiveness and minimizing drug adverse effects. In addition, the versatility of
the silica surface has been used to immobilize different functional groups as needed for
biosensing, bioimaging applications and to improve cellular uptake (Ahmadi et al., 2014; Argyo et
al., 2013; Natarajan et al., 2014; Popat et al., 2011; Slowing et al.,2006; Tan et al., 2004; Trewyn
et al., 2007).
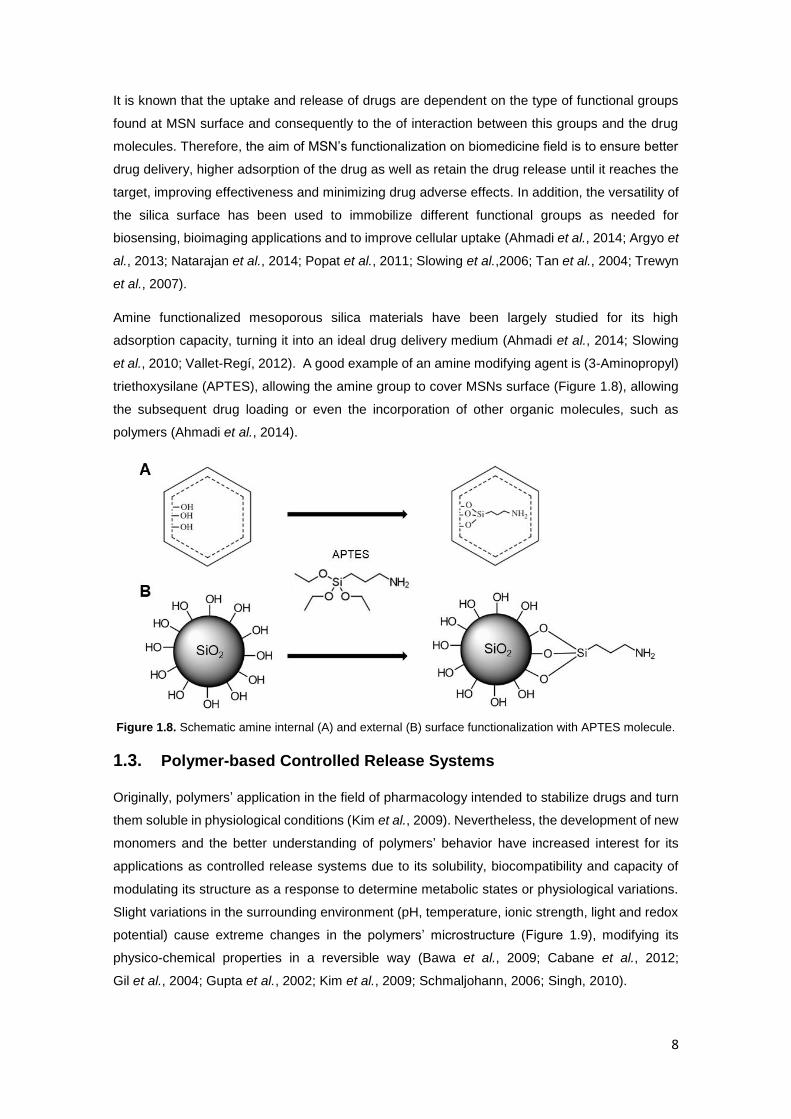
Amine functionalized mesoporous silica materials have been largely studied for its high
adsorption capacity, turning it into an ideal drug delivery medium (Ahmadi et al., 2014; Slowing
et al., 2010; Vallet-Regí, 2012). A good example of an amine modifying agent is (3-Aminopropyl)
triethoxysilane (APTES), allowing the amine group to cover MSNs surface (Figure 1.8), allowing
the subsequent drug loading or even the incorporation of other organic molecules, such as
polymers (Ahmadi et al., 2014).
Figure 1.8. Schematic amine internal (A) and external (B) surface functionalization with APTES molecule.
1.3. Polymer-based Controlled Release Systems
Originally, polymers’ application in the field of pharmacology intended to stabilize drugs and turn
them soluble in physiological conditions (Kim et al., 2009). Nevertheless, the development of new
monomers and the better understanding of polymers’ behavior have increased interest for its
applications as controlled release systems due to its solubility, biocompatibility and capacity of
modulating its structure as a response to determine metabolic states or physiological variations.
Slight variations in the surrounding environment (pH, temperature, ionic strength, light and redox
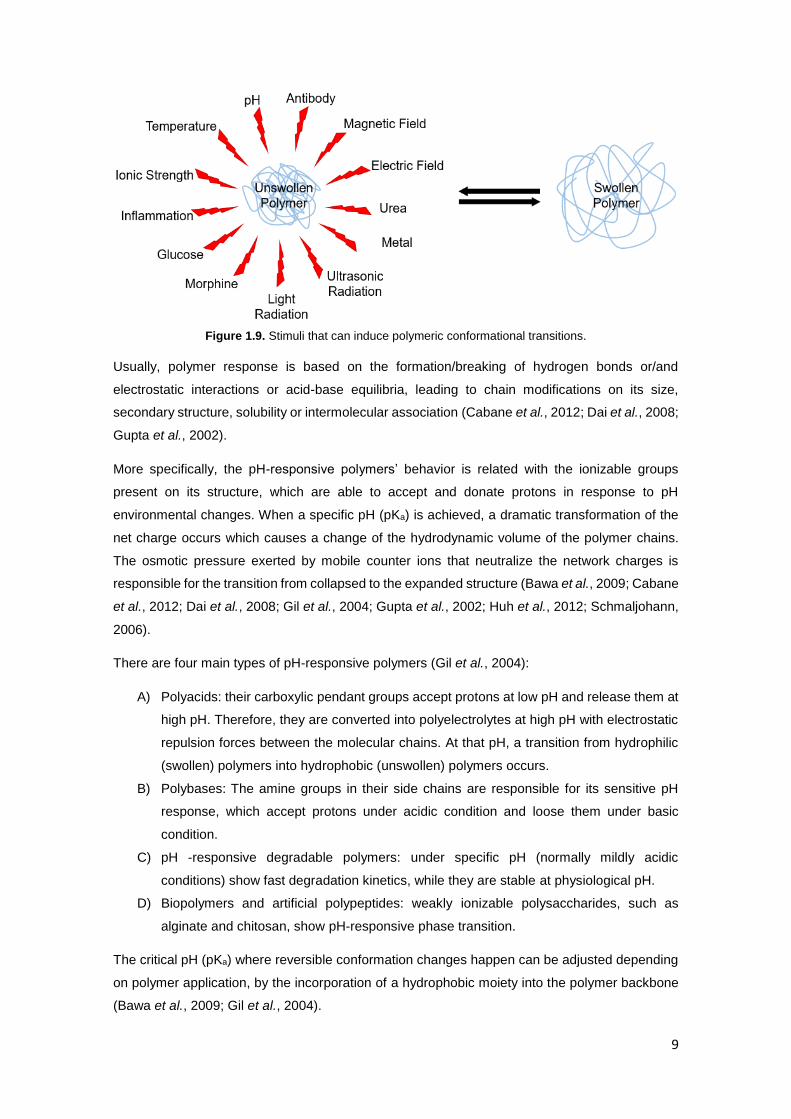
potential) cause extreme changes in the polymers’ microstructure (Figure 1.9), modifying its
physico-chemical properties in a reversible way (Bawa et al., 2009; Cabane et al., 2012;
Gil et al., 2004; Gupta et al., 2002; Kim et al., 2009; Schmaljohann, 2006; Singh, 2010).
9
Figure 1.9. Stimuli that can induce polymeric conformational transitions.
Usually, polymer response is based on the formation/breaking of hydrogen bonds or/and
electrostatic interactions or acid-base equilibria, leading to chain modifications on its size,
secondary structure, solubility or intermolecular association (Cabane et al., 2012; Dai et al., 2008;
Gupta et al., 2002).
More specifically, the pH-responsive polymers’ behavior is related with the ionizable groups
present on its structure, which are able to accept and donate protons in response to pH
environmental changes. When a specific pH (pKa) is achieved, a dramatic transformation of the
net charge occurs which causes a change of the hydrodynamic volume of the polymer chains.
The osmotic pressure exerted by mobile counter ions that neutralize the network charges is
responsible for the transition from collapsed to the expanded structure (Bawa et al., 2009; Cabane
et al., 2012; Dai et al., 2008; Gil et al., 2004; Gupta et al., 2002; Huh et al., 2012; Schmaljohann,
2006).
There are four main types of pH-responsive polymers (Gil et al., 2004):
A) Polyacids: their carboxylic pendant groups accept protons at low pH and release them at
high pH. Therefore, they are converted into polyelectrolytes at high pH with electrostatic
repulsion forces between the molecular chains. At that pH, a transition from hydrophilic
(swollen) polymers into hydrophobic (unswollen) polymers occurs.
B) Polybases: The amine groups in their side chains are responsible for its sensitive pH
response, which accept protons under acidic condition and loose them under basic
condition.
C) pH -responsive degradable polymers: under specific pH (normally mildly acidic
conditions) show fast degradation kinetics, while they are stable at physiological pH.
D) Biopolymers and artificial polypeptides: weakly ionizable polysaccharides, such as
alginate and chitosan, show pH-responsive phase transition.
The critical pH (pKa) where reversible conformation changes happen can be adjusted depending
on polymer application, by the incorporation of a hydrophobic moiety into the polymer backbone
(Bawa et al., 2009; Gil et al., 2004).
10
The use of these polymers as drug delivery systems increases drug efficiency since they are
released in specific conditions enhancing the therapeutic effect. Furthermore, as mentioned
before, the use of polymers improves the solubility and biocompatibility of the drug or the material
inside its structure (Cabane et al., 2012; Gupta et al., 2002; Kim et al., 2009).
Regarding biomedical applications, pH is an important environmental parameter, since pH
changes occur in many specific or pathological compartments. More precisely, extracellular
tumour tissue has shown a pH decrease (6.5 ~ 7.2) compared with healthy tissue. This enables
the possibility to develop smart polymeric devices to carry anti-cancer treatment which respond
to acidic conditions that characterize the tumour tissue (Bawa et al., 2009; Cabane et al., 2012;
Dai et al., 2008; Huh et al., 2012; Kim et al., 2009).
1.4. Hybrid Nanoparticles
Despite the fact that nanoparticles have been frequently used in the field of biomedicine through
many years, they present some restrictions that can be overcome through the conjugation with
another type of material (hybrid nanoparticles). Core-shell nanoparticles have been extensively
studied due to their wide range of possible combinations (inorganic – inorganic, inorganic –
organic, organic – inorganic and organic – organic) that yield hybrid materials with improved
properties (Singh et al., 2011).
As mentioned before, mesoporous silica nanoparticles exhibit some interesting properties
regarding its application in biomedicine (See 1.1). However, the hydrophilic groups (silanol
groups) located on the silica surface interact with cell membranes and promote reaction between
particles through hydrogen bonds, inducing aggregation and disturbing nanoparticles’
physicochemical properties behavior (Singh et al., 2011). It is possible to overcome this pitfall by
coating silica with a polymer, bringing not only the needed stability as well as improving
biocompatibility and some other properties very useful for the biomedical applications (Argyo et
al., 2013; Liu et al., 2009; Singh et al., 2011; Zhao et al., 2009).
Hybrid nanoparticles composed by silica-polymer core-shell are hard to obtain, due to the
incompatibility between inorganic-organic materials. Usually, the synthesis of these hybrid
nanoparticles is assisted by functionalization of silica surface (as described on 1.2.2), increasing
compatibility as well as interactions between the two phases (Santiago et al., 2015;
Singh et al., 2011).
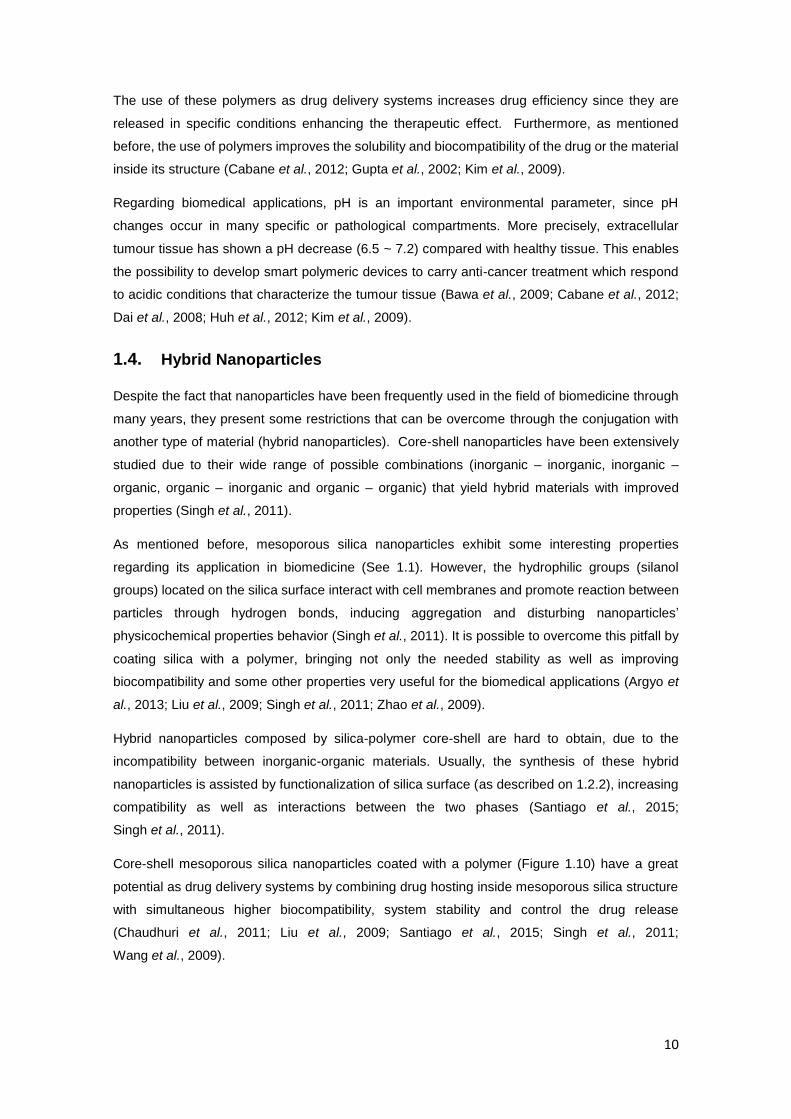
Core-shell mesoporous silica nanoparticles coated with a polymer (Figure 1.10) have a great
potential as drug delivery systems by combining drug hosting inside mesoporous silica structure
with simultaneous higher biocompatibility, system stability and control the drug release
(Chaudhuri et al., 2011; Liu et al., 2009; Santiago et al., 2015; Singh et al., 2011;
Wang et al., 2009).
11
Figure 1.10. Adaptation of the schematic illustration of drug loading and release by core-shell mesoporous
silica nanoparticle coated with a polymer (Adapted from Wang et al., 2009).
1.5. Control Radical Polymerization
In the last two decades, great efforts have been made in order to obtain (co)polymers with
well-defined weight and low polydispersity, as the polymers obtained by ionic chain
polymerization, in relatively simple conditions that radical polymerization approach offers.
Controlled Radical Polymerization (CRP) rises as the ideal approach to obtain polymers with a
controlled structure in quite simple conditions by using the intermittent formation of active
propagation species (Favier et al., 2006; Gaynor et al., 1994; Matyjaszewski, 1996; Odian, 2004;
Vega-Rios et al., 2011).
There are three main CRP techniques, namely atom transfer radical polymerization (ATRP),
nitroxide-mediated polymerization (NMP) and reversible addition-fragmentation chain transfer
(RAFT) (Moad et al., 2005; Odian, 2004).
Reversible addition fragmentation chain transfer (RAFT) polymerization was first reported by
CSIRO group in 1998 and it has been shown to be a highly effective and versatile method of
controlled radical polymerization. Unlike other CRP, this technique is able to induce living
behavior on a wide range of monomers in the same conditions as used in radical polymerization
reaction (initiators, solvents, and reaction temperature) by adding an appropriate RAFT agent,
leading to the synthesis of several polymers with a controlled MW and well-defined structure
(Favier et al., 2006; Moad et al., 1998; Odian, 2004; Vega-Rios et al., 2011).
This method provides living characteristics to radical polymerization through a reversible addition-
fragmentation reaction mediated by chain transfer agents (CTAs), as thiocarbonylthio groups
(S=C-S). CTAs, unlike radical polymerization, are capable of reversibly deactivate propagation
radicals, maintaining the majority of the living chain in dormant form, providing living character to
this kind of reaction. It is important to achieve the right conditions to support a fast equilibrium
between the dormant polymer chain and the propagating radicals (Favier et al., 2006; Moad et
al., 1998; Moad et al., 2005; Odian, 2004; Vega-Rios et al., 2011).
12
The importance of the living character of RAFT technique lies in the slight polydispersity between
polymers obtained, the linear MW conversion profile, the MW predictability
(Equation 1.1) and the capacity of producing blocks or higher MW polymers merely by adding
more monomer (Favier et al., 2006; Moad et al., 1998; Odian, 2004; Vega-Rios et al., 2011).
Mn ≅[M]0 × Mmon × ρ
[CTA]0+ MCTA (1.1)
Where [M]0 is the initial monomer concentration, Mmon is the molecular weight of the monomer, ρ
is the conversion, MCTA is the molecular weight of the CTA, and [CTA]0 is the initial concentration
of the CTA (Vega-Rios et al., 2011).
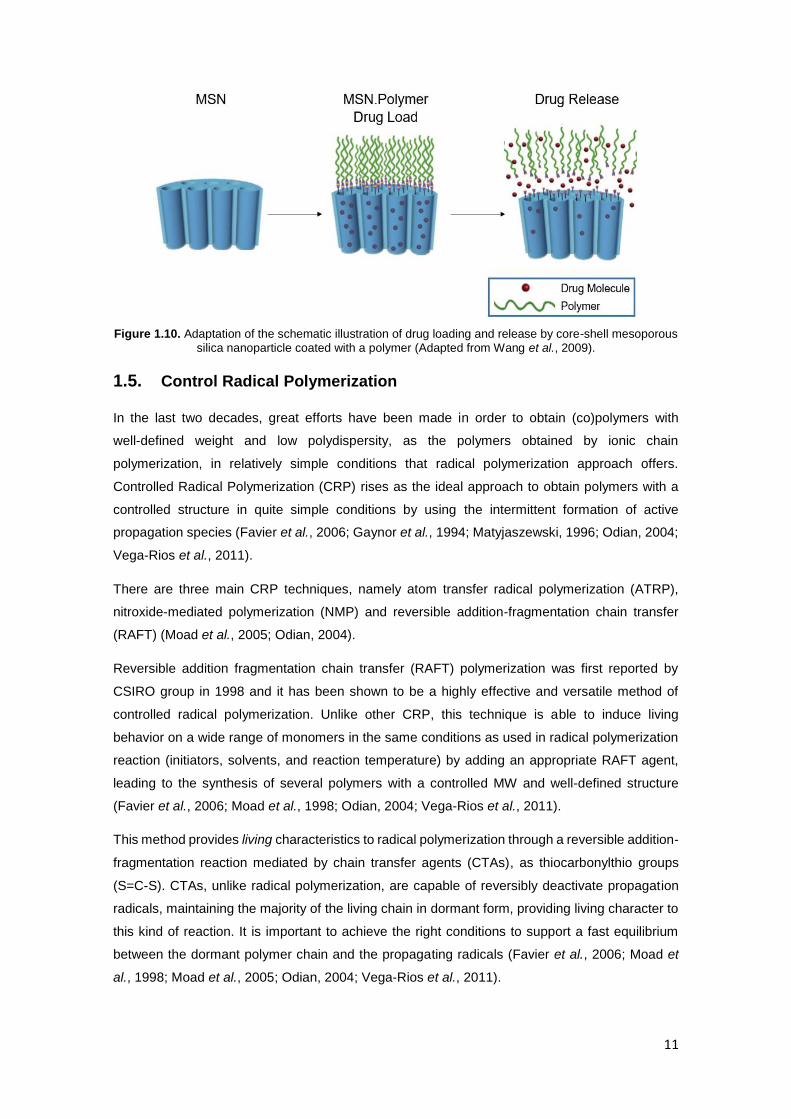
According to the monomers, as well as the conditions used in the polymerization, it is important
to choose the right CTA to obtain the desired polymeric architecture. The CTA molecular structure
is composed by a trithiocarbonate and dithioester (figure 1.11), providing specific characteristics
to the CTA agent and controlling reaction kinetics. Free radical leaving group (R) must be able to
reinitiate polymerization and the bond between R and S should be weak. The rate of radical
addition and fragmentation depends on C=S reactive bond that is controlled by the Z group. Since
Sigma-Aldrich started selling different CTAs, research on this field has increased significantly
(Favier et al., 2006; Moad et al., 1998; Odian, 2004; Vega-Rios et al., 2011).
Figure 1.11. General structure of RAFT agent (A), trithiocarbonate (B) and dithioester (C).
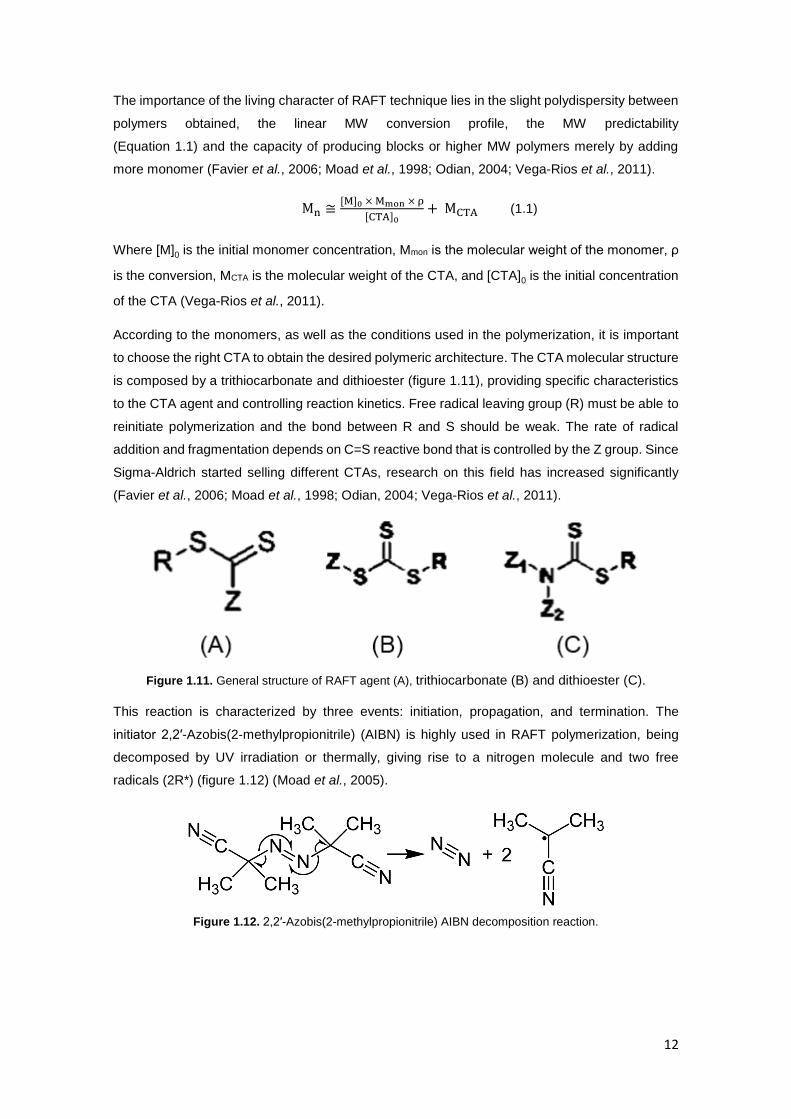
This reaction is characterized by three events: initiation, propagation, and termination. The
initiator 2,2′-Azobis(2-methylpropionitrile) (AIBN) is highly used in RAFT polymerization, being
decomposed by UV irradiation or thermally, giving rise to a nitrogen molecule and two free
radicals (2R*) (figure 1.12) (Moad et al., 2005).
Figure 1.12. 2,2′-Azobis(2-methylpropionitrile) AIBN decomposition reaction.
13
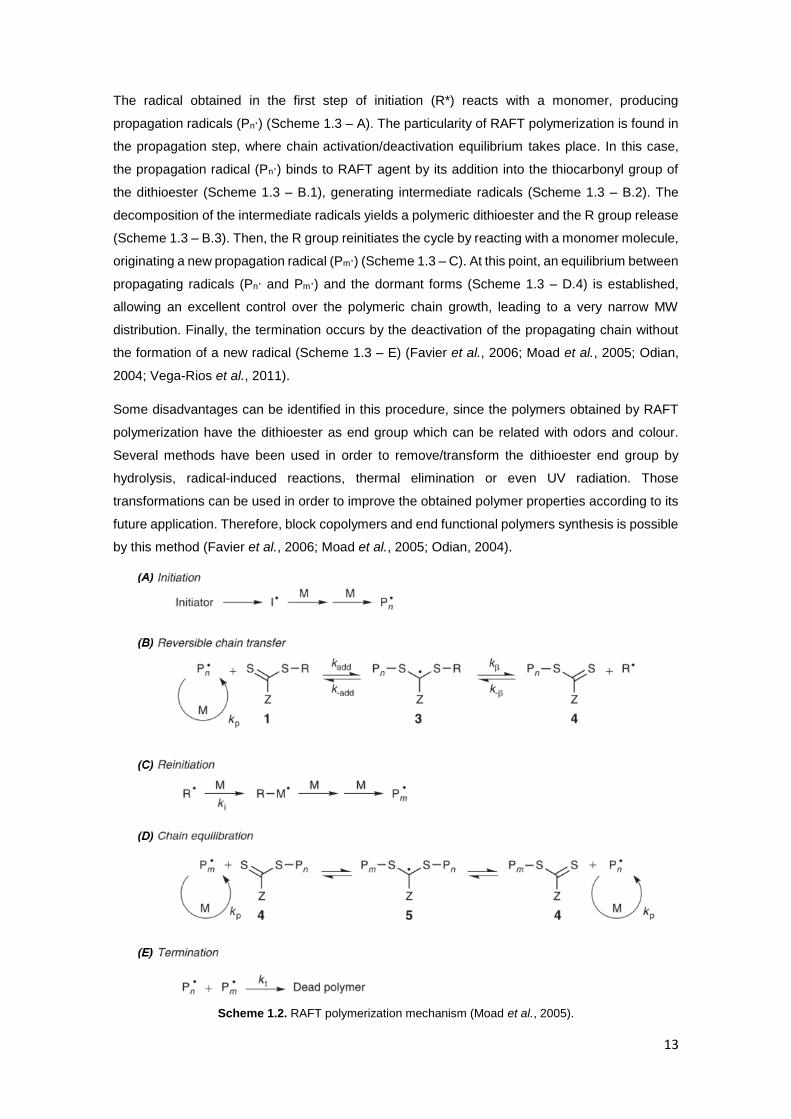
The radical obtained in the first step of initiation (R*) reacts with a monomer, producing
propagation radicals (Pn∙) (Scheme 1.3 – A). The particularity of RAFT polymerization is found in
the propagation step, where chain activation/deactivation equilibrium takes place. In this case,
the propagation radical (Pn∙) binds to RAFT agent by its addition into the thiocarbonyl group of
the dithioester (Scheme 1.3 – B.1), generating intermediate radicals (Scheme 1.3 – B.2). The
decomposition of the intermediate radicals yields a polymeric dithioester and the R group release
(Scheme 1.3 – B.3). Then, the R group reinitiates the cycle by reacting with a monomer molecule,
originating a new propagation radical (Pm∙) (Scheme 1.3 – C). At this point, an equilibrium between
propagating radicals (Pn∙ and Pm∙) and the dormant forms (Scheme 1.3 – D.4) is established,
allowing an excellent control over the polymeric chain growth, leading to a very narrow MW
distribution. Finally, the termination occurs by the deactivation of the propagating chain without
the formation of a new radical (Scheme 1.3 – E) (Favier et al., 2006; Moad et al., 2005; Odian,
2004; Vega-Rios et al., 2011).
Some disadvantages can be identified in this procedure, since the polymers obtained by RAFT
polymerization have the dithioester as end group which can be related with odors and colour.
Several methods have been used in order to remove/transform the dithioester end group by
hydrolysis, radical-induced reactions, thermal elimination or even UV radiation. Those
transformations can be used in order to improve the obtained polymer properties according to its
future application. Therefore, block copolymers and end functional polymers synthesis is possible
by this method (Favier et al., 2006; Moad et al., 2005; Odian, 2004).
Scheme 1.2. RAFT polymerization mechanism (Moad et al., 2005).

14
RAFT polymerization is of great interest due to the possibility of anchoring the CTA onto
nanoparticle surface. This allows the polymers chains to grow from the core nanoparticles
(grafting from method), obtaining polymer brushes grafted on the nanoparticle surface,
with controlled thickness and high grafting polymeric density (Huang et al., 2011;
Santiago et al., 2015).
1.6. Objective
The aim of this work was to develop and characterize hybrid mesoporous silica nanoparticles with
silica nanostructured core and a shell of pH-responsive polymer. The biocompatible polymer used
is based on a polybase tertiary amine methacrylate monomer known as 2-(diisopropylamino)ethyl
methacrylate (DPAEM or DPA). A high quantum yield fluorescent perylenediimide (PDI) dye was
incorporated into the MSN pore structure, for monitoring the MSNs, combining diagnostic and
therapeutic properties on a single vector (Ribeiro et al., 2013; Santiago et al., 2015).
Figure 1.13. Schematic illustration for hybrid mesoporous silica nanoparticles prepared during this project.
15
The MSNs were synthesized, as described in figure 1.13, by the hydrolysis and condensation of
tetraethoxysilane (TEOS) around hexadecyltrimethylammonium bromide (CTAB), used as
surfactant, micelles with perylenediimide (PDI) adsorbed in its structure, obtaining fluorescent
MSNs (Rodrigues et al., 2013; Zhao et al., 2009). Then, an amino surface modification was
performed with (3-Aminopropyl) triethoxysilane (APTES) (Rodrigues et al., 2013; Santiago et al.,
2015), followed by surfactant removal, ensuring the availability of the porous for later molecule
incorporation (Ahmadi et al., 2014; Rodrigues et al., 2013; Vallet-Regí, 2012).
After that, CTA immobilization on MSNs surface was executed by attaching the carboxylic group
of the CTA to the amine group located on MSN surface covalently, using a specific CTA
(3- (benzylsulfanylthiocarbonylsulfanyl) propionic acid) in order to initiate a controlled
2-(diisopropylamino)ethyl methacrylate (DPAEM) monomer polymerization from the surface. This
procedure is known as grafting from. This process allows hybrid MSNs synthesis with great
polymeric density, distribution and controlled thickness, obtaining MSN.P(DPAEM) (Gao et al.,
2009; Ma et al., 2014; Santiago et al., 2015).
In order to characterize and verify the efficiency of grafting from procedure, some modifications
of the procedure of polymer attachment to MSNs surface were performed.
2-(diisopropylamino)ethyl methacrylate RAFT polymerization was accomplished without
nanoparticles on the same conditions and attached, posteriorly, to the MSNs surface. Such
procedure is known as grafting to approach. The same CTA composed by a reactive group on its
end chain that links covalently to the MSNs surface was also used. The polymer used for coating
MSN, poly(2-(diisopropylamino)ethyl methacrylate) (PDPAEM), is highly biocompatible and pH
sensitive, with pKa around 6.5.
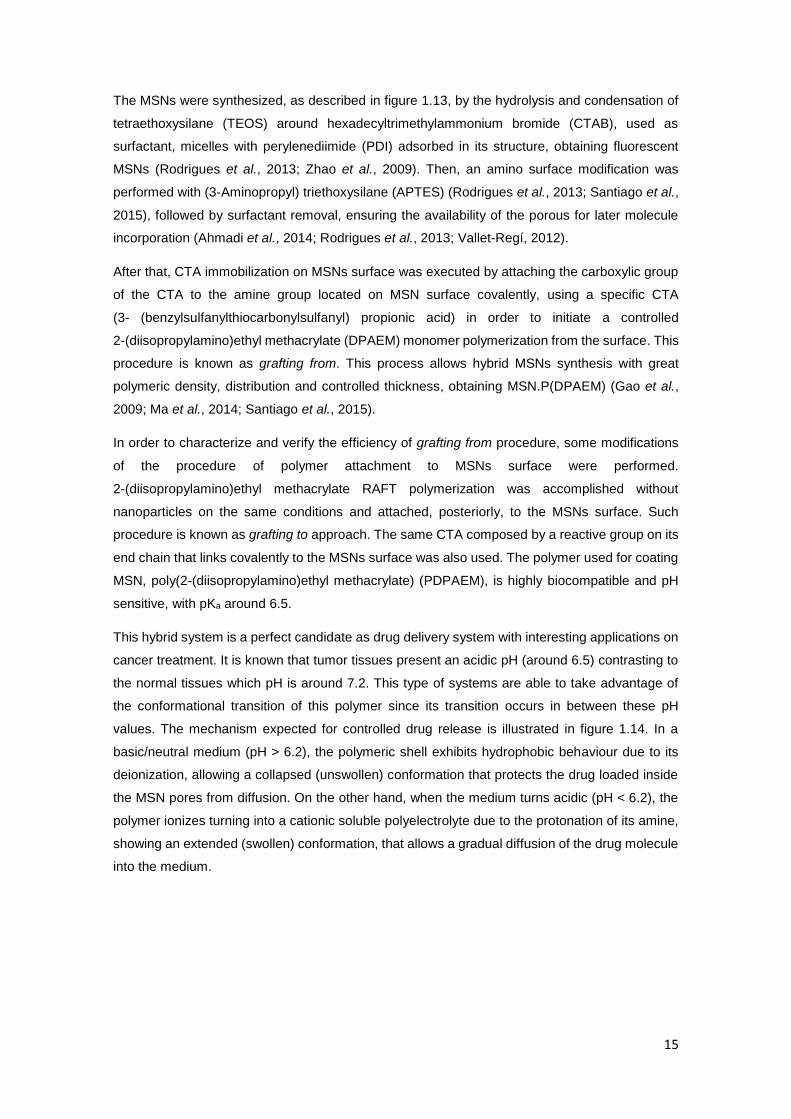
This hybrid system is a perfect candidate as drug delivery system with interesting applications on
cancer treatment. It is known that tumor tissues present an acidic pH (around 6.5) contrasting to
the normal tissues which pH is around 7.2. This type of systems are able to take advantage of
the conformational transition of this polymer since its transition occurs in between these pH
values. The mechanism expected for controlled drug release is illustrated in figure 1.14. In a
basic/neutral medium (pH > 6.2), the polymeric shell exhibits hydrophobic behaviour due to its
deionization, allowing a collapsed (unswollen) conformation that protects the drug loaded inside
the MSN pores from diffusion. On the other hand, when the medium turns acidic (pH < 6.2), the
polymer ionizes turning into a cationic soluble polyelectrolyte due to the protonation of its amine,
showing an extended (swollen) conformation, that allows a gradual diffusion of the drug molecule
into the medium.
16
Figure 1.14. Schematic illustration of controlled drug release by MSN.P(DPAEM).
Transmission Electronic Microscopy (TEM) and Dynamic Light Scattering (DLS) techniques were
used to characterize MSN and MSN.P(DPAEM) dimension and polydispersity. H1 NMR was
performed in order to verify and quantify APTES functionalization, to characterize the synthesized
monomer and polymer as well as to verify its presence after being attached to the particles. UV-
Visible Spectroscopy was necessary to quantify CTA as well as to determine P(DPAEM) pH
response behaviour. FT-IR Spectroscopy was analyzed for qualitative characterization of the
hybrid system. Lastly, ζ-Potential (ZP) technique was used, not only to determine surface charge
changes along the surface modification process, but also to understand the charge transition with
the pH.
17
2. Materials and Methods
2.1. Materials
Absolute Ethanol (99.9 % EtOH, Scharlau, Barcelona, Spain), hexadecyltrimethylammonium
bromide (99 % CTAB, Sigma, St. Louis, MO, USA), sodium hydroxide (Pure NaOH, EKA Pellets,
Bohus, Sweden) and tetraethoxysilane (99 % TEOS, Aldrich, St. Louis, MO, USA) were all used
as received for synthesis of mesoporous silica nanoparticles (MSNs). The deionized (DI) water
was generated using a Millipore Milli-Q system (≥18 MΩcm, Merck, NJ, USA). The dye
incorporated into MSNs, PDI derivative, was synthesized according to the literature (Luo & Lin,
2006).
(3-Aminopropyl) triethoxysilane (98 % APTES, Sigma-Aldrich), without any treatment, was used
for surface modification in dry toluene which was distilled over calcium hydride before use. The
surfactant templates were removed using a 0.5 M hydrochloric acid solution (37 % HCl, AnalaR
NORMAPUR - VWR, Radnor, Pennsylvania) in absolute EtOH.
For chain transfer agent (CTA) immobilization N-(3-dimethylaminopropyl) -N′-ethylcarbodiimide
(98 % EDC, Sigma-Aldrich) in commercial distilled dichloromethane and 3-
(benzylsulfanylthiocarbonylsulfanyl) propionic acid as CTA, synthesized according to the
literature (Stenzel et al., 2003), were used.
In order to synthesize the monomer 2–(diisopropylamino) ethyl methacrylate, hydroquinone
(99 %, Aldrich Chemistry), methacryloyl chloride (97 %, Aldrich), and 2–(diisopropylamino)
ethanol (98 %, Aldrich Chemistry) were all used as received. Also, tetrahydrofuran
(99 % THF, Aldrich) distilled with sodium and dry triethylamine distilled over calcium hydride were
used.
Lastly, for 2–(diisopropylamino) ethyl methacrylate (DPAEM) RAFT polymerization
tetrahydrofuran (99.9 % TFA, Aldrich), azobisisobutyronitrile (AIBN pure) synthesized as
described in the literature and 1,4 - Dioxane previously dried with sodium and distilled were used.
The samples preparation for DLS and ζ-Potential measurement required 3 mL plastic syringes
(B-BRAUN, Germany), sodium dodecyl sulphate (98 % SDS, Aldrich) and cellulose 0.45 μm
cellulose filters (VWR). Disposable capillary cells (DTS1070) (Malvern Instruments,
Worcestershire, UK) were used for ζ-Potential measurements and disposable polystyrene
cuvettes (Brand GMBH, Germany) for DLS measurement. TEM images were acquired by
preparing well-dispersed MSNs and MSN.P(DPAEM) samples and placed in carbon grid (Ted
Pella, USA) by using iTEM software.
For pH-response assays phosphate buffer solution (PBS) was prepared with sodium phosphate
monobasic (98 % NaH2PO4, PanReac AppliChem, Barcelona, Spain) and sodium hydroxide
(98 % NaOH, Sigma-Aldrich).
18
Chloroform-D (99.8 %, Cambridge Isotope Laboratories, MA, USA) and deuterium oxide (D2O
99.9 %, Cambridge Isotope Laboratories), supplemented with NaOH and 1,3,5-trioxane (99.0 %,
Fluka, Germany) or PBS, were used for quantitative and qualitative characterization by H1 NMR.
UV- Visible Spectroscopy was performed using MSN sample dispersion in quartz cuvettes
(Hellma Analytics, Müllheim, Germany) with 1 cm x 1 cm dimension. Potassium bromide
(KBr 99 %, Aldrich) was used to prepare pellet for FT-IR Spectroscopy.
For in vitro studies human mammary carcinoma cell line MCF-7 from European Collection of
Authenticated Cell Cultures (ECACC), Dulbecco's Modified Eagle's medium (DMEM, Thermo
Fisher Scientific, Massachusetts, USA), Fetal Bovine Serum (FBS, Thermo Fisher Scientific),
Penicillin-Streptomycin (Thermo Fisher Scientific) and Thiazolyl Blue Tetrazolium Bromide (MTT,
Sigma-Aldrich) were used. HCl (PanReac AppliChem), 2-propanol (PanReac AppliChem),
Nonidet P-40 (NP40, Sigma) and Dulbecco's phosphate-buffered saline (DPBS, Thermo Fisher
Scientific) were needed to prepare MTT solution and MTT solvent. For cell viability assay cells
were seeded onto the 96 well plates (Corning, New York, USA).
2.2. Equipment
2.2.1. Centrifuge
Avanti J – 30I Centrifuge (Beckman Coulter, California, USA), rotor JA – 30.50 Ti, was used for
washing MSNs. For the centrifugations, 50 mL centrifuge tubes from the same manufacturer were
used. Centrifugal Refrigerator (3-16K) (Sigma Zentrifugen, Osterode am Harz Germany), rotor
12141, was used for washing MSN.PDPAEM. Disposable 10 mL polypropylene tubes were used
for the centrifugations. At the end of the washing process of every MSNs modification procedure,
a sample was taken into a 1.5 mL eppendorf for posterior.
2.2.2. Transmission Electronic Microscopy (TEM)
TEM images were obtained on a Hitachi transmission electron microscope (Hitachi High –
technologies, Tokyo, Japan), model H-8100, with a LaB6 filament (Hitachi) complemented with an
accelerator voltage of 200 kV. A camera KeenView (Soft Imaging System, Münster, Germany) is
incorporated in this equipment, which through iTEM software, allows acquiring TEM images. The
size/dimension, polydispersity, and morphology of the particles were estimated by evaluating at
least 100 nanoparticles by Image J software.
2.2.3. Dynamic Light Scattering (DLS) and ζ-potential
Zetasizer Nano ZS (Malvern Instruments, UK), model ZEN3600, with 173º and 90º detector was
used in order to determine hydrodynamic particle radii in solution. The estimation of the
nanoparticles size is based on the dynamic light scattering (DLS) assuming a Brownian
movement of nanoparticles.
19
2.2.4. Rotary Evaporator
In order to evaporate the solvent on DPA synthesis a Heidolph – Laborota 4000 – Efficient
(Sigma- Aldrich) was used at 313 K and 150 rpm.
2.2.5. UV-Vis Spectroscopy
UV-660 UV-VIS Spectrophotometer (JASCO International, Tokyo, Japan), supplied with a double
monochromator and a photomultiplier detector for higher resolution, was employed for UV-Vis
spectroscopy assays and cell viability assays.
2.2.6. 1H NMR
Proton Nuclear Magnetic Resonance (1H NMR) (δH) spectra were recorded on an AMX-400
instrument (Bruker, MA, USA).
2.2.7. FT-IR Spectroscopy
The Nicolet Impact 400D FT-IR Infrared Spectrophotometer (LabX, Midland, Canada) was used
for FT-IR spectroscopy assays.
2.3. Methods
2.3.1. Mesoporous Silica Nanoparticles Synthesis
MSNs were synthesized by a sol–gel modified process. In a 500 mL polypropylene flask, 0.5 g of
CTAB were dissolved in 240 mL of deionized water. Then, 1.75 mL NaOH with the desired
concentration (1.40 M or 1.70 M) and 2.5 mL TEOS (0.88 M) were added dropwise under vigorous
stirring at 353 K and left aged for 2 h. The MSNs were recovered by centrifugation at 30,000 x g
for 10 min at 288 K, and washed three times with distilled water, discarding each time the
supernatant. The solid product obtained by centrifugation was dried at 323 K overnight.
For perylenediimide (PDI) incorporated mesoporous silica nanoparticles (MSN.PDI), a solution of
CTAB (0.5 g) and PDI (6 mg) in 2.5 mL THF was prepared in a 15 mL polypropylene flask and
was left stirring at room temperature until THF be evaporated (approximately 24 h). The obtained
solid was transferred to a 500 mL polypropylene flask and the same protocol described before
was executed.

20
2.3.2. Mesoporous Silica Nanoparticles Surface Modification
Amino modification of the silica surface was performed by suspending the obtained nanoparticles
in dry toluene (10 mL toluene per 200 mg of MSN) and sonicating it for 15 min. Afterwards, (3-
aminopropyl) triethoxysilane (APTES) was added dropwise (0.468 mL per 200 mg of MSN). The
resulting dispersion was heated at 398 K under reflux for 24 h in an argon atmosphere. Finally,
the MSN.APTES were recovered by centrifugation at 30,000 x g for 10 min at 288 K, and washed
one time with dichloromethane and three times with absolute ethanol, discarding each time the
supernatant. The solid product obtained by centrifugation was dried at 323 K overnight.
Figure 2.1. APTES surface modification scheme.
An acidic ethanol solution (0.5 M HCl, 20 mL of acidic solution for each 500 mg of MSN) was used
to remove surfactant template, by re-suspending MSN.APTES on this solution and sonicating it.
Subsequently, it was left under stirring at 313 K for 24 h. MSN were recovered by centrifugation
at 30,000 x g for 10 min at 288 K, and washed four times with absolute ethanol, discarding each
time the supernatant. The solid product obtained by centrifugation was dried at 323 K overnight.
In order to immobilize CTA on the nanoparticles’ surface 10 mL of dry dichloromethane was added
for each 500 mg of MSN into a 25 mL flask under the argon atmosphere and sonicated for 20
min. Then, 0.136 g of 3-(benzylsulfanylthiocarbonylsulfanyl) propionic acid (1 Eq APTES) and
0.106 mL of EDC (1.2 Eq APTES) were added to the mixture at 273 K, which was left under
stirring with ice at room temperature for 24 h. MSN.RAFT were recovered by centrifugation at
30,000 x g for 10 min at 288 K, and washed three times with absolute ethanol, discarding each
time the supernatant. The solid product obtained by centrifugation was dried at 323 K overnight.
Figure 2.2. CTA Immobilization scheme on MSN surface.
2.3.3. 2 – (Diisopropylamino) ethyl methacrylate Monomer Synthesis
To a solution of hydroquinone (40 mg) in THF (40 mL) under argon atmosphere was added dry
triethylamine (4 mL, 28 mmol, 1 Eq) and 2- (diisopropylamino) ethanol (4.8 mL, 28 mmol, 1 Eq)
and stirred on ice. Afterwards, methacryloyl chloride (2.8 mL, 28 mmol, 1 Eq) was added dropwise
and the mixture was left under stirring on ice at room temperature for 24 h. The product of the
reaction was filtered on vacuum and the solvent was evaporated until an oil was obtained. Lastly,
in order to separate the reaction intermediates from the monomer, the oil was distilled at 387 K
on the vacuum.

21
Figure 2.3. Condensation reaction.
2.3.4. Grafting from: RAFT Polymerization at the MSN Surface
In a schlenk tube A MSN.RAFT (50 mg), AIBN (1:10 AIBN/RAFT) and a magnet were added and
placed in the vacuum. In a schlenk tube B 3 mL of 1, 4 – Dioxane, DPA, and TFA as described
In table 2.1 was added. Atmosphere oxygen was removed from schlenk tube B through
freeze-pump taw (4 to 5 cycles of freeze with vacuum and defreeze). The content of schlenk tube
B was transferred to the schlenk tube A with the help of a cannula and argon. After that, the
mixture was sonicated for 3 min and placed on a plate under stirring in the following conditions:
Table 2.1. Temperature, time and TFA equivalent used for the different polymerization reactions.
Polymerization Reaction Temperature (K) Time (h) TFA (Eq) DPA (Eq)
P(DPAEM) I 343 20 100
P(DPAEM) II 343 22 1.2 100
MSN.P(DPAEM) I 353 20 100
MSN.P(DPAEM) II a
343 20
100 b 1.2
MSN.P(DPAEM) III a
343 20
200 b 1.2
MSN were recovered by centrifugation at 30,000 x g for 10 min at 288 K, and washed three times
with absolute ethanol, discarding each time the supernatant. The solid product obtained by
centrifugation was dried at 323 K overnight.
2.3.5. Grafting to: Polymer immobilization at the MSN Surface
For polymer synthesis the same procedure as described for 2 – (Diisopropylamino) ethyl
methacrylate RAFT Polymerization from Surface Nanoparticle (see 3.3.4) with the difference that
in schlenk tube A instead of MSN, the same quantity of RAFT proportional to 50 mg of MSN was
added. The polymer was suspended in dichloromethane and precipitated with diethyl ether for
two days. The supernatant was discarded and the remaining diethyl ether was evaporated.
To immobilize P(DPAEM) on the MSN surface, the same procedure used for RAFT immobilization
was used (see 3.3.2). In this case, instead of 1 Eq of CTA, 1:1 P(DPAEM) chain/APTES was
added to the reaction.
22
3. Results and Discussion
3.1. MSN Size Distribution
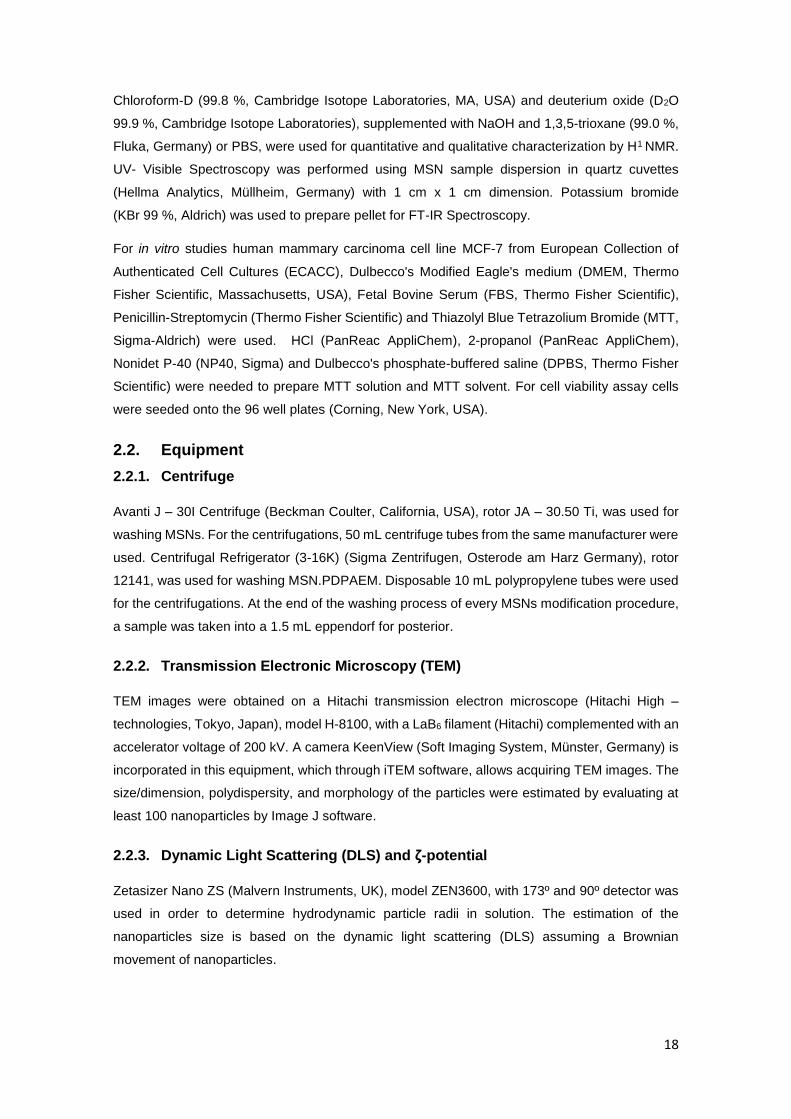
MSN size distribution was analyzed at a controlled temperature on TEM and DLS (293 K) in order
to estimate their diameter in the same conditions. The concentration of the sample was 0.3 mg/mL
in ethanol and water, for TEM and DLS measurements, respectively. The samples prepared for
TEM were well dried on a grid before its analysis.
For MSN synthesis, two different concentrations of NaOH were used (Table 3.1) in order to see
the relation between diameter size and catalyst concentration, using the same conditions
(temperature, stirring speed, surfactant, etc.) (Zhao et al., 2009).
Table 3.1. Catalyst concentration (NaOH) used for the synthesis of each sample and its correspondent
TEM image in figure 17.
SAMPLE [NaOH] (M) Figure 3.1
MSN A 1.7 A
MSN.PDI B 1.4 B
MSN C 1.4 C
MSN.PDI D 1.7 D
MSN E 1.4 E
MSN.PDI F 1.7 F
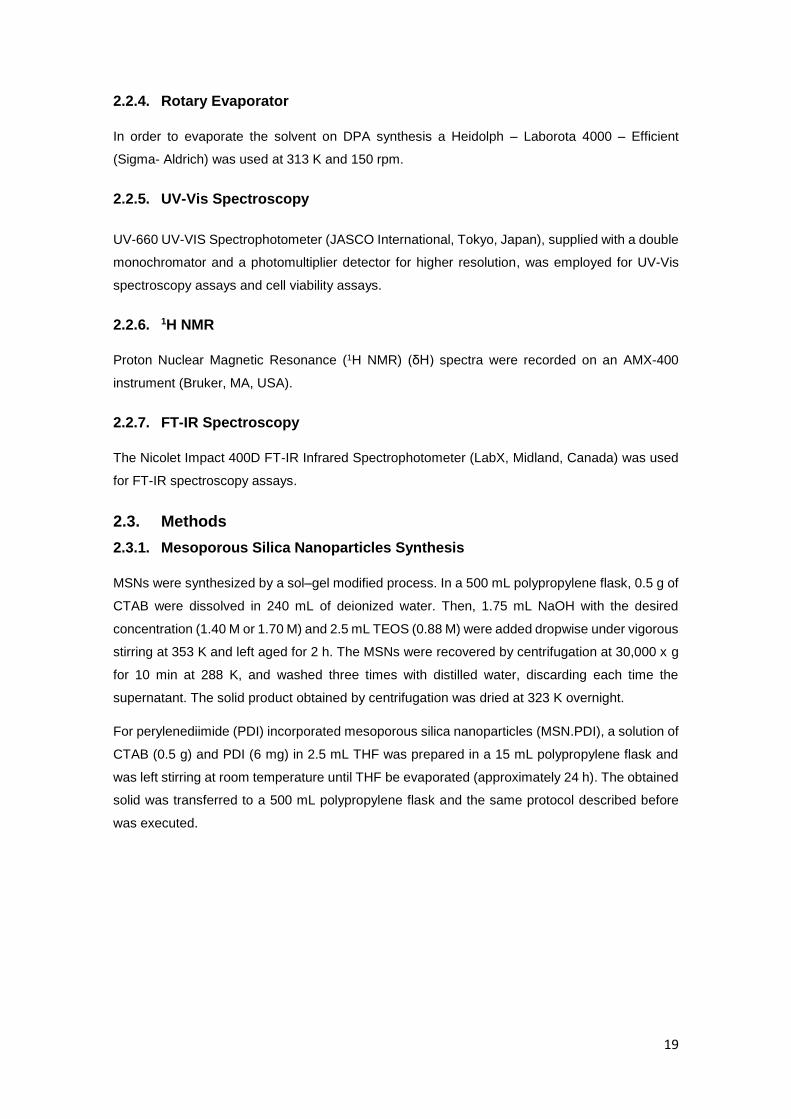
3.1.1. Transmission Electronic Microscopy (TEM)
For TEM size distribution analysis MSN dispersed in ethanol were prepared and dried on a carbon
grid. Trough TEM image analyses it was possible to estimate the size distribution using Image J
software by the measurement of a minimum MSN population of 100, excluding aggregates. In
figure 3.1 we represent one TEM image of each sample, and the respective diameter distribution.
23
24
Figure 3.1. TEM images (100 nm scale) obtained for the nanoparticles synthesized (left) and its
histogram size distribution (right). A: MSN A, B: MSN.PDI B, C: MSN C, D: MSN.PDI D, E: MSN E and F: MSN.PDI F.
This method allowed to obtain nanoparticles with a well-defined and organized mesostructure
confirmed by TEM images obtained once the surfactant was removed (figure 3.2).
Figure 3.2. TEM images obtained for MSN.PDI D with surfactant (A) and for MSN.PDI D with surfactant
removed (B) with a “zoom in” for better visualization of mesostructure.
3.1.2. Dynamic Light Scattering (DLS)
Dynamic Light Scattering (DLS) is a physical technique used to determine particles’ size
distribution profile in suspension or polymers in solution, assuming a Brownian motion. Brownian
motion is the random motion of particles in a solvent. Using the Stokes-Einstein equation, it is
possible to obtain the particle hydrodynamic diameter from the diffusion coefficient. Light
scattering intensity fluctuations are analyzed an auto-correlation function. The results were
analysed by the CONTIN method in order to determine nanoparticle hydrodynamic diameter (DH).
The hydrodynamic diameter was calculated from the average of three measurements. In table
3.2 the MSN diameter average and its standard deviation for DLS and TEM for every sample are
described.

25
Table 3.2. MSN diameter average and its standard deviation obtained by DLS and TEM.
SAMPLE [NaOH] (M) DH (nm) DTEM (nm)
MSN A 1.7 77 ± 30 71 ± 13
MSN B 1.4 63 ± 24 51 ± 10
MSN.PDI C 1.4 52 ± 20 35 ± 4
MSN.PDI D 1.7 87 ± 32 63 ± 11
MSN E 1.4 52 ± 27 50 ± 7
MSN.PDI F 1.7 153 ± 33 79 ± 12
It is possible to see that the diameter obtained by DLS is higher than the obtained by TEM
analysis. This can be explained by the 1) hydrated layer around MSN when they are dispersed
and 2) the tendency of the nanoparticles to form clusters.
The method used for MSN synthesis is promising since the nanoparticles obtained are on the
ideal diameter range for targeting cancer cells (between 35 to 100 nm), with regular shape and
narrow polydispersity in each synthesis. In addition, it was possible to obtain two ranges of
diameter by using different NaOH concentration, one between 35 – 50 nm for 1.4 M NaOH and
other between 60 – 80 nm for 1.7 M NaOH.
3.2. MSN Surface Modification Analysis
3.2.1. 1H NMR
NMR spectroscopy is a fundamental tool that provides information about structure, composition,
interactions and dynamic of organic molecules at atomic resolution. It can be used as a
quantitative or qualitative method.
After MSN synthesis, an amino surface modification was performed by adding (3-aminopropyl)
triethoxysilane (APTES) to the silanol group of the nanoparticle surface
1H NMR was performed after this process in order to assess and quantify the immobilization of
this compound (Slowing et al., 2010). The samples were prepared in 500 µL of D2O with a high
concentration of NaOH, 0.5 mg of the sample and 0.5 mg of 1,3,5-trioxane and sonicated until
obtain a transparent solution. This method is used to perform a better quantification of the
molecules linked to the surface by destroying the MSNs. The molecules in solution have better
mobility, obtaining a more defined 1H NMR spectra (Crucho, et al., 2016). In table 4.3 we show
the estimated concentrations of APTES per gram of MSN.
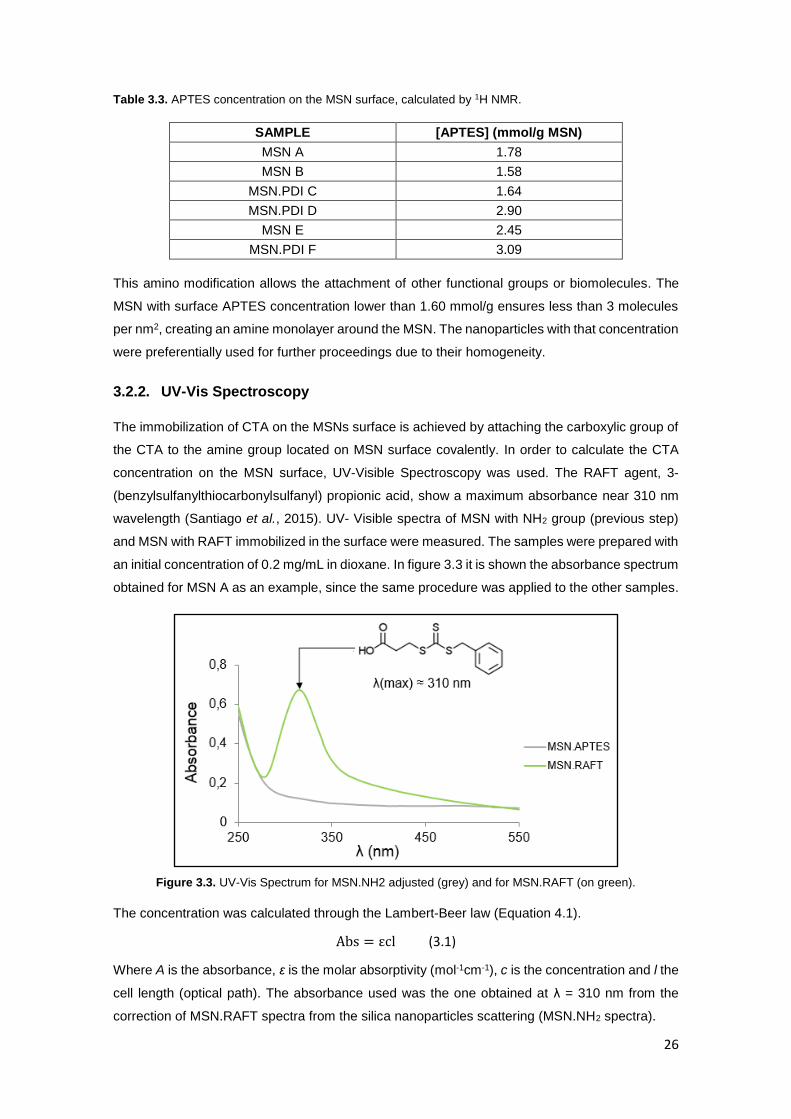
26
Table 3.3. APTES concentration on the MSN surface, calculated by 1H NMR.
SAMPLE [APTES] (mmol/g MSN)
MSN A 1.78
MSN B 1.58
MSN.PDI C 1.64
MSN.PDI D 2.90
MSN E 2.45
MSN.PDI F 3.09
This amino modification allows the attachment of other functional groups or biomolecules. The
MSN with surface APTES concentration lower than 1.60 mmol/g ensures less than 3 molecules
per nm2, creating an amine monolayer around the MSN. The nanoparticles with that concentration
were preferentially used for further proceedings due to their homogeneity.
3.2.2. UV-Vis Spectroscopy
The immobilization of CTA on the MSNs surface is achieved by attaching the carboxylic group of
the CTA to the amine group located on MSN surface covalently. In order to calculate the CTA
concentration on the MSN surface, UV-Visible Spectroscopy was used. The RAFT agent, 3-
(benzylsulfanylthiocarbonylsulfanyl) propionic acid, show a maximum absorbance near 310 nm
wavelength (Santiago et al., 2015). UV- Visible spectra of MSN with NH2 group (previous step)
and MSN with RAFT immobilized in the surface were measured. The samples were prepared with
an initial concentration of 0.2 mg/mL in dioxane. In figure 3.3 it is shown the absorbance spectrum
obtained for MSN A as an example, since the same procedure was applied to the other samples.
Figure 3.3. UV-Vis Spectrum for MSN.NH2 adjusted (grey) and for MSN.RAFT (on green).
The concentration was calculated through the Lambert-Beer law (Equation 4.1).
Abs = εcl (3.1)
Where A is the absorbance, ε is the molar absorptivity (mol-1cm-1), c is the concentration and l the
cell length (optical path). The absorbance used was the one obtained at λ = 310 nm from the
correction of MSN.RAFT spectra from the silica nanoparticles scattering (MSN.NH2 spectra).
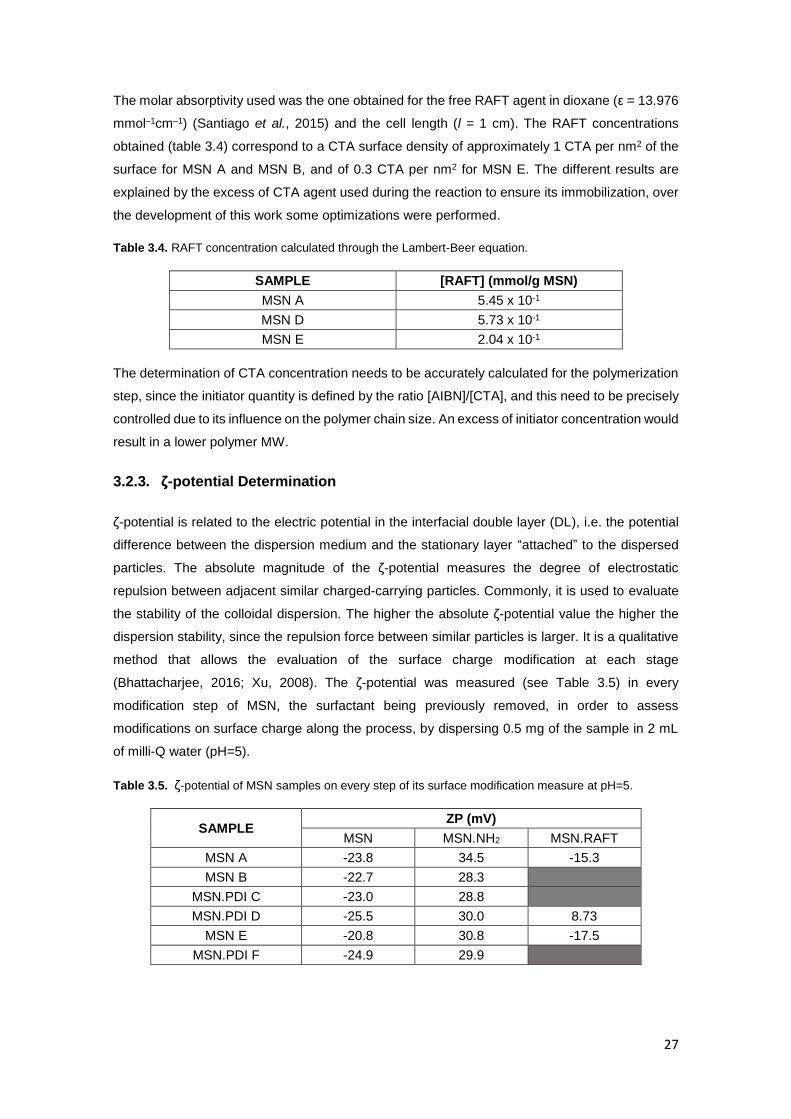
27
The molar absorptivity used was the one obtained for the free RAFT agent in dioxane (ε = 13.976
mmol–1cm–1) (Santiago et al., 2015) and the cell length (l = 1 cm). The RAFT concentrations
obtained (table 3.4) correspond to a CTA surface density of approximately 1 CTA per nm2 of the
surface for MSN A and MSN B, and of 0.3 CTA per nm2 for MSN E. The different results are
explained by the excess of CTA agent used during the reaction to ensure its immobilization, over
the development of this work some optimizations were performed.
Table 3.4. RAFT concentration calculated through the Lambert-Beer equation.
SAMPLE [RAFT] (mmol/g MSN)
MSN A 5.45 x 10⁻¹
MSN D 5.73 x 10⁻¹
MSN E 2.04 x 10⁻¹
The determination of CTA concentration needs to be accurately calculated for the polymerization
step, since the initiator quantity is defined by the ratio [AIBN]/[CTA], and this need to be precisely
controlled due to its influence on the polymer chain size. An excess of initiator concentration would
result in a lower polymer MW.
3.2.3. ζ-potential Determination
ζ-potential is related to the electric potential in the interfacial double layer (DL), i.e. the potential
difference between the dispersion medium and the stationary layer “attached” to the dispersed
particles. The absolute magnitude of the ζ-potential measures the degree of electrostatic
repulsion between adjacent similar charged-carrying particles. Commonly, it is used to evaluate
the stability of the colloidal dispersion. The higher the absolute ζ-potential value the higher the
dispersion stability, since the repulsion force between similar particles is larger. It is a qualitative
method that allows the evaluation of the surface charge modification at each stage
(Bhattacharjee, 2016; Xu, 2008). The ζ-potential was measured (see Table 3.5) in every
modification step of MSN, the surfactant being previously removed, in order to assess
modifications on surface charge along the process, by dispersing 0.5 mg of the sample in 2 mL
of milli-Q water (pH=5).
Table 3.5. ζ-potential of MSN samples on every step of its surface modification measure at pH=5.
SAMPLE ZP (mV)
MSN MSN.NH2 MSN.RAFT
MSN A -23.8 34.5 -15.3
MSN B -22.7 28.3
MSN.PDI C -23.0 28.8
MSN.PDI D -25.5 30.0 8.73
MSN E -20.8 30.8 -17.5
MSN.PDI F -24.9 29.9
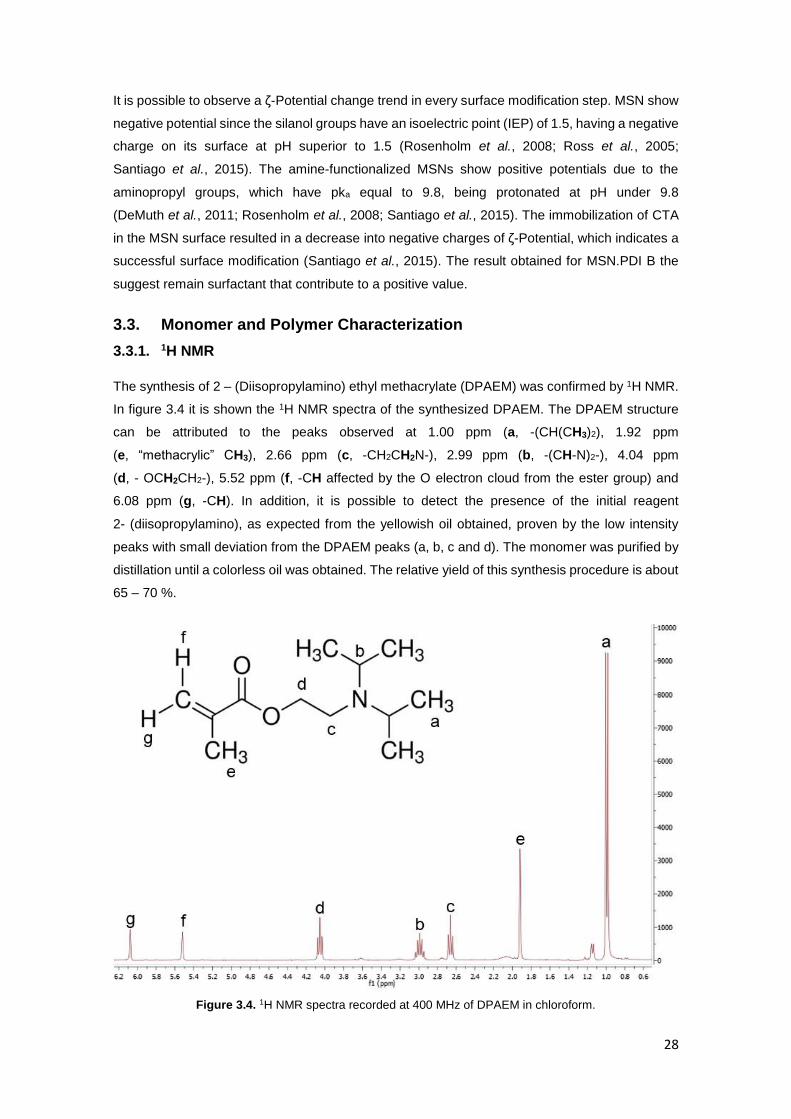
28
It is possible to observe a ζ-Potential change trend in every surface modification step. MSN show
negative potential since the silanol groups have an isoelectric point (IEP) of 1.5, having a negative
charge on its surface at pH superior to 1.5 (Rosenholm et al., 2008; Ross et al., 2005;
Santiago et al., 2015). The amine-functionalized MSNs show positive potentials due to the
aminopropyl groups, which have pka equal to 9.8, being protonated at pH under 9.8
(DeMuth et al., 2011; Rosenholm et al., 2008; Santiago et al., 2015). The immobilization of CTA
in the MSN surface resulted in a decrease into negative charges of ζ-Potential, which indicates a
successful surface modification (Santiago et al., 2015). The result obtained for MSN.PDI B the
suggest remain surfactant that contribute to a positive value.
3.3. Monomer and Polymer Characterization
3.3.1. 1H NMR
The synthesis of 2 – (Diisopropylamino) ethyl methacrylate (DPAEM) was confirmed by 1H NMR.
In figure 3.4 it is shown the 1H NMR spectra of the synthesized DPAEM. The DPAEM structure
can be attributed to the peaks observed at 1.00 ppm (a, -(CH(CH3)2), 1.92 ppm
(e, “methacrylic” CH3), 2.66 ppm (c, -CH2CH2N-), 2.99 ppm (b, -(CH-N)2-), 4.04 ppm
(d, - OCH2CH2-), 5.52 ppm (f, -CH affected by the O electron cloud from the ester group) and
6.08 ppm (g, -CH). In addition, it is possible to detect the presence of the initial reagent
2- (diisopropylamino), as expected from the yellowish oil obtained, proven by the low intensity
peaks with small deviation from the DPAEM peaks (a, b, c and d). The monomer was purified by
distillation until a colorless oil was obtained. The relative yield of this synthesis procedure is about
65 – 70 %.
Figure 3.4. 1H NMR spectra recorded at 400 MHz of DPAEM in chloroform.

29
1H NMR spectroscopy also allowed to evaluate 2 – (Diisopropylamino) ethyl methacrylate RAFT
polymerization assisted by 3-(benzylsulfanylthiocarbonylsulfanyl) propionic acid as CTA and
determine the resultant chemistry structure. A 1H NMR spectra of P(DPAEM) II sample dissolved
in deuterated chloroform is shown in figure 3.5. The peaks observed at 1.00 ppm (a, -(CH(CH3)2;
e, “methacrylic” CH3; f, -CH2- of the polymer backbone), 2.90 ppm (c, -CH2CH2N-), 3.28 ppm
(b, -(CH-N)2-) and 3.97 ppm (d, -OCH2CH2-) are in agreement with the P(DPAEM) structure (Góis
et al., 2014; Hu et al., 2007). The enlargement of the signals when compared with the 1H NMR
spectra of DPAEM (figure 3.4) is an evidence of its polymerization, aside from the deviation from
1.92 to 1.00 ppm of the methacrylic CH3 (e). The peak at 2,68 ppm (h, -SCH2CH2-; i, -CH2COOH)
belongs to the Z group of the RAFT agent. However, the total conversion of monomer to polymer
was not achieved as shown by the presence of the signals at 1.54 ppm (e*, “methacrylic” CH3),
5.22 ppm (f*, -CH affected by the O electrons from the ester group) and 5.74 ppm (g*, -CH)
associated with the monomer structure. The overlapping of polymer signals and the low intensity
of the CTA resonances hindered the calculation of Mn,NMR. Nevertheless, the degree of
polymerization was estimated through the correlation between the integral of h and i methylene
protons at 3.09 ppm and b at 3.68 ppm (Góis et al., 2014). From the ratio 4n/(n(2n)=Ii/If, n=30.56
was obtained and so the estimation of the polymer molecular weight: Mn,NMR = nMmon + MCTA ≈
7,064 Da. The theoretical Mn for this polymerization was nearly 21,600 Da per chain. The
estimated yield for this reaction is 32.70 %.
.
Figure 3.5. The 1H NMR spectra recorded at 400 MHz of P(DPAEM) II prepared in chloroform.
Table 3.6. Monomer and CTA molecular weight used for calculate Mn,NMR
Compound Symbol MW (Da)
2 – (Diisopropylamino) ethyl methacrylate Mmon 213.32
3-(benzylsulfanylthiocarbonylsulfanyl) propionic acid MCTA 272.41

30
3.3.2. UV-Vis Spectroscopy
The polymer pH response was characterized by the evaluation of the pH effects on optical
transmittance. In figure 3.6 it is shown the spectrum obtained for the same sample prepared in
phosphate-buffered saline (PBS) at different pH. It is possible to observe the optical transmittance
difference between the extended conformation (pH lower than 6.5) and the collapsed
conformation (pH higher than 6.3). The extreme decrease in optical transmittance at pH higher
than 6.3 is caused by the deprotonation of the DPAEM units, becoming hydrophobic, and
consequently precipitating (Peng et al., 2010).
Figure 3.6. Transmittance spectrum for P(DPAEM) I sample at different pH.
In figure 3.7 we represent the transmittance variations at this wavelength as a function of pH. It
was possible to see the decrease on transmittance values as the solution becomes more basic
(Peng et al., 2010). The reversibility of the transition phenomenon from hydrophobic state
(collapsed conformation) to hydrophilic state (extended conformation) was evaluated by
increasing the pH of an acidic solution of the sample, by adding dropwise 1 M NaOH, and
decreasing the pH again, by adding 0.10 M HCl, measuring the transmittance for each pH. It was
also possible to observe that the highest transmittance was reached once the pH of the sample
decreased below the pKa. These assays confirmed the reversibility of this transition.

31
Figure 3.7. Transmittance at 500 nm of P(DPAEM) as a function of pH. The pH was increased
by adding 1 M NaOH () and decreased by adding 0.1 M HCl ().
3.4. Hybrid Nanoparticles
3.4.1. Size Distribution
The hydrodynamic diameters for MSN.P(DPAEM) were determined by DLS in ethanol, milli-Q
water and phosphate-buffered solution with different pH. We had some problems to obtain the
size distribution of the samples due to the formation of aggregates in the used solvents. The
samples were prepared with 1mg/mL and different dissolutions were tested. In order to compare
with the results obtained for free MSN, the measurements were performed at 298 K.
The hydrodynamic diameters for MSN.P(DPAEM) determined by DLS are shown in table 3.7. It
was not possible to reproduce the conditions of measurement for all the samples, due to
aggregation of the particles. Nevertheless, the best results were obtained in milli-Q water at pH 5
with dissolution 1:3, confirming a size increase when compared with free MSN, which suggests
the presence of a polymeric shell. These results are shown in Appendix A. The interactions
between the polymeric chain could be the cause of the system instability, which could explain the
results obtained for size distribution by intensity and number, as well as for their correlogram and
cumulant fit, shown in Appendix B.
The diameters predicted by TEM analysis were calculated by the measurement of a population
of 25 nanoparticles. The analysis of such low population emerges as a consequence of the
samples preparation requirements due to the presence of polymer (such as short sonication time)
not being possible to obtain a well dispersed sample. The results obtained are shown in table 3.7.
By comparing these results with the ones obtained for free MSN samples it was possible to see
a decrease on size diameter, which can be explained by low population analysis and the
sedimentation of MSN.P(DPAEM) during the experiment.
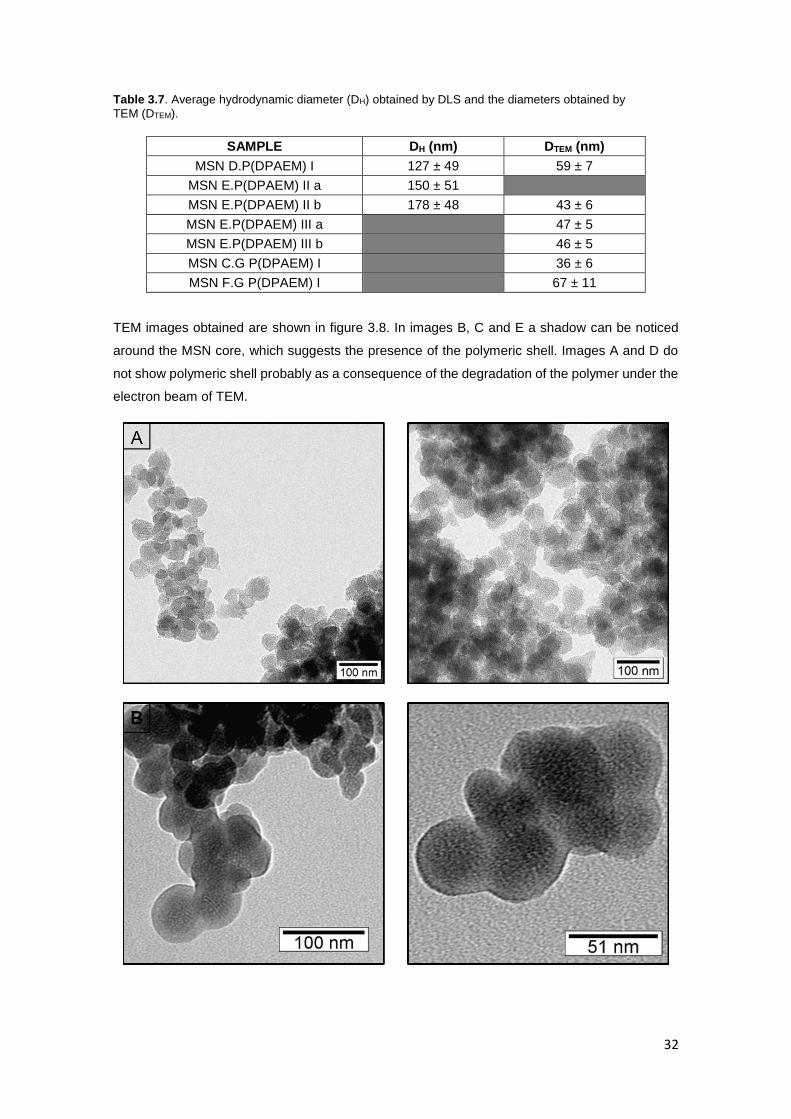
32
Table 3.7. Average hydrodynamic diameter (DH) obtained by DLS and the diameters obtained by
TEM (DTEM).
SAMPLE DH (nm) DTEM (nm)
MSN D.P(DPAEM) I 127 ± 49 59 ± 7
MSN E.P(DPAEM) II a 150 ± 51
MSN E.P(DPAEM) II b 178 ± 48 43 ± 6
MSN E.P(DPAEM) III a 47 ± 5
MSN E.P(DPAEM) III b 46 ± 5
MSN C.G P(DPAEM) I 36 ± 6
MSN F.G P(DPAEM) I 67 ± 11
TEM images obtained are shown in figure 3.8. In images B, C and E a shadow can be noticed
around the MSN core, which suggests the presence of the polymeric shell. Images A and D do
not show polymeric shell probably as a consequence of the degradation of the polymer under the
electron beam of TEM.

33
Figure 3.8. TEM images obtained for MSN D.P(DPAEM) I (A), MSN E.P(DPAEM) II b (B),
MSN E.P(DPAEM) III a (C), MSN C.G P(DPAEM) I (D) and MSN F.G P(DPAEM) I (E).
The pH effect on the diameter size of the hybrid nanoparticle was studied by DLS, but it was not
successfully concluded, due to the presence of agreggates (Appendix B).
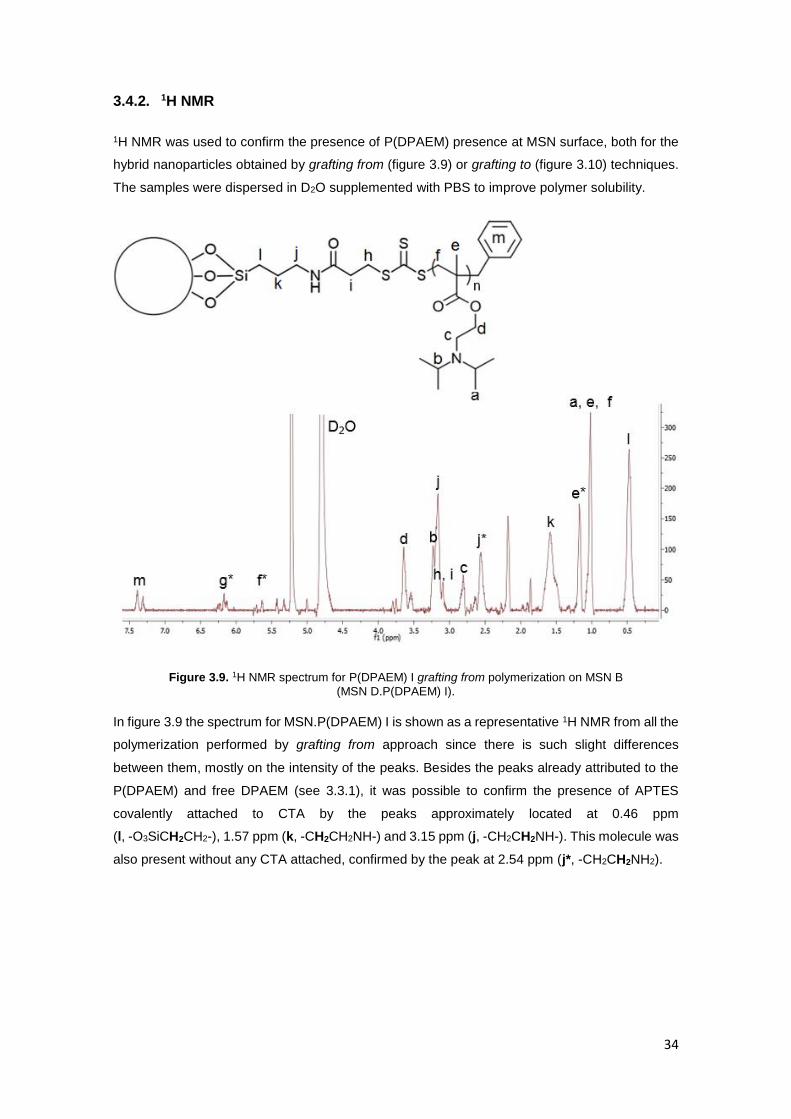
34
3.4.2. 1H NMR
1H NMR was used to confirm the presence of P(DPAEM) presence at MSN surface, both for the
hybrid nanoparticles obtained by grafting from (figure 3.9) or grafting to (figure 3.10) techniques.
The samples were dispersed in D2O supplemented with PBS to improve polymer solubility.
Figure 3.9. 1H NMR spectrum for P(DPAEM) I grafting from polymerization on MSN B
(MSN D.P(DPAEM) I).
In figure 3.9 the spectrum for MSN.P(DPAEM) I is shown as a representative 1H NMR from all the
polymerization performed by grafting from approach since there is such slight differences
between them, mostly on the intensity of the peaks. Besides the peaks already attributed to the
P(DPAEM) and free DPAEM (see 3.3.1), it was possible to confirm the presence of APTES
covalently attached to CTA by the peaks approximately located at 0.46 ppm
(l, -O3SiCH2CH2-), 1.57 ppm (k, -CH2CH2NH-) and 3.15 ppm (j, -CH2CH2NH-). This molecule was
also present without any CTA attached, confirmed by the peak at 2.54 ppm (j*, -CH2CH2NH2).

35
Figure 3.10. 1H NMR spectra of P(DPAEM) I grafting to on MSN F surface (MSN F.G P(DPAEM) I).
In figure 3.10 the spectra recorded for MSN.G P(DPAEM) I, obtained by grafting to approach, is
represented. It was not possible to identify the peaks attributed to the monomer, which is
consistent with the method used, since the polymer was produced separately and then attached
to the MSN surface. On the other hand, the small peaks present on the spectra could be attributed
to CTA and polymer structure. In addition, most of the APTES molecule is in the free form,
confirmed by the intensity of the peak at 2.58 ppm (j*). These two facts suggest an inefficient
polymer attachment to the MSN surface. The signal at 2.21 ppm belongs to remaining EDC
chemical, used to crosslink the carboxylic acid from the CTA to the primary amine from the APTES
molecule.

36
3.4.3. FT-IR Spectroscopy
FT-IR Spectroscopy was used as a qualitative tool to assess MSN surface modification after
RAFT polymerization. With this purpose, FT-IR spectra were recorded for the MSN samples
before and after polymerization as well as for free polymer synthesized under the same
conditions.
Figure 3.11. FT-IR spectra of MSN.RAFT (a), MSN.P(DPAEM) I (b) and free P(DPAEM) I (c) samples.
In figure 3.11 it is shown the FT-IR spectra for MSN.RAFT, MSN.P(DPAEM) I and P(DPAEM) I.
The evaluation of surface modification was made through the comparison between the spectra
obtained for MSN after RAFT polymerization with the polymer and the MSN before
polymerization. The three spectra showed bands at 1632 cm-1 and at 3410 cm-1 which belong to
the adsorbed water. Specifically, the one at 3410 cm-1 is characteristic of ν(−OH) vibrations from
the molecular water interacting by H-bonding with the carboxylic acid from RAFT agent present
on the polymer and with the silanol groups located on the MSN surface. In both MSN’s infrared
spectra, the typical silica spectra was observed. The bands at 1204–1042 cm-1 and 795 cm−1
belong to the symmetrical and anti-symmetric vibrations of ν(Si–O–Si) and the vibrational band
at 956 cm−1 is characteristic of silanol groups ν(Si–OH). In addition, the APTES surface
modification can be proved by the presence of the band at 1550 cm-1 which is attributed to
ν(N–H) vibrations, while the bands at 2357 – 2324 cm-1 belong to the vibrations of ν(–NCO) from
the covalent bond between APTES and CTA, indicating a successful CTA surface immobilization.
The bands at 2965 – 2870 cm-1 and 1465 cm-1 – 1361 cm-1 are assigned to the ν(C–H) and
δ(C–H) vibration from the alkyl chains of the polymer as well as of the functional groups present
on MSN surface. Finally, the peak at 1729 cm-1 is attributed to the ν(C=O) vibrations of the ester
group from the monomer’s methacrylate side (De Barros et al., 2015; Faccia et al., 2013; Zhang
et al., 2014). This result confirm a successful MSNs surface modification, as well as its coating
with the polymeric shell.
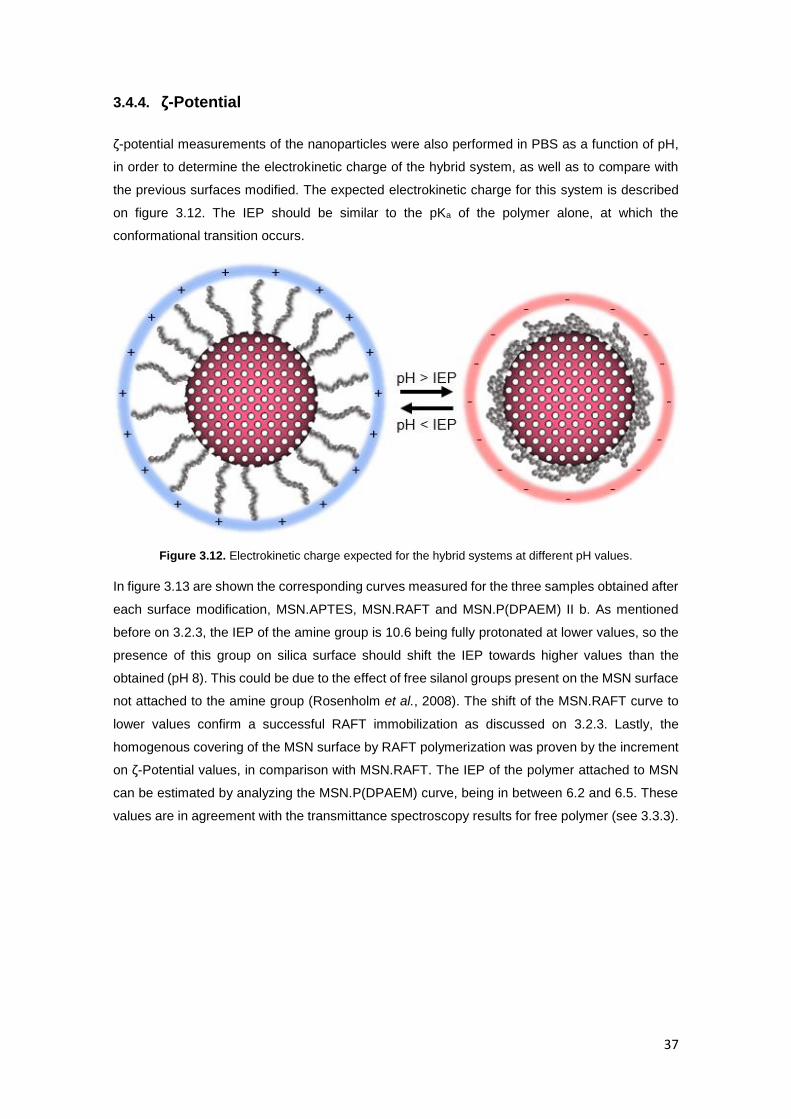
37
3.4.4. ζ-Potential
ζ-potential measurements of the nanoparticles were also performed in PBS as a function of pH,
in order to determine the electrokinetic charge of the hybrid system, as well as to compare with
the previous surfaces modified. The expected electrokinetic charge for this system is described
on figure 3.12. The IEP should be similar to the pKa of the polymer alone, at which the
conformational transition occurs.
Figure 3.12. Electrokinetic charge expected for the hybrid systems at different pH values.
In figure 3.13 are shown the corresponding curves measured for the three samples obtained after
each surface modification, MSN.APTES, MSN.RAFT and MSN.P(DPAEM) II b. As mentioned
before on 3.2.3, the IEP of the amine group is 10.6 being fully protonated at lower values, so the
presence of this group on silica surface should shift the IEP towards higher values than the
obtained (pH 8). This could be due to the effect of free silanol groups present on the MSN surface
not attached to the amine group (Rosenholm et al., 2008). The shift of the MSN.RAFT curve to
lower values confirm a successful RAFT immobilization as discussed on 3.2.3. Lastly, the
homogenous covering of the MSN surface by RAFT polymerization was proven by the increment
on ζ-Potential values, in comparison with MSN.RAFT. The IEP of the polymer attached to MSN
can be estimated by analyzing the MSN.P(DPAEM) curve, being in between 6.2 and 6.5. These
values are in agreement with the transmittance spectroscopy results for free polymer (see 3.3.3).
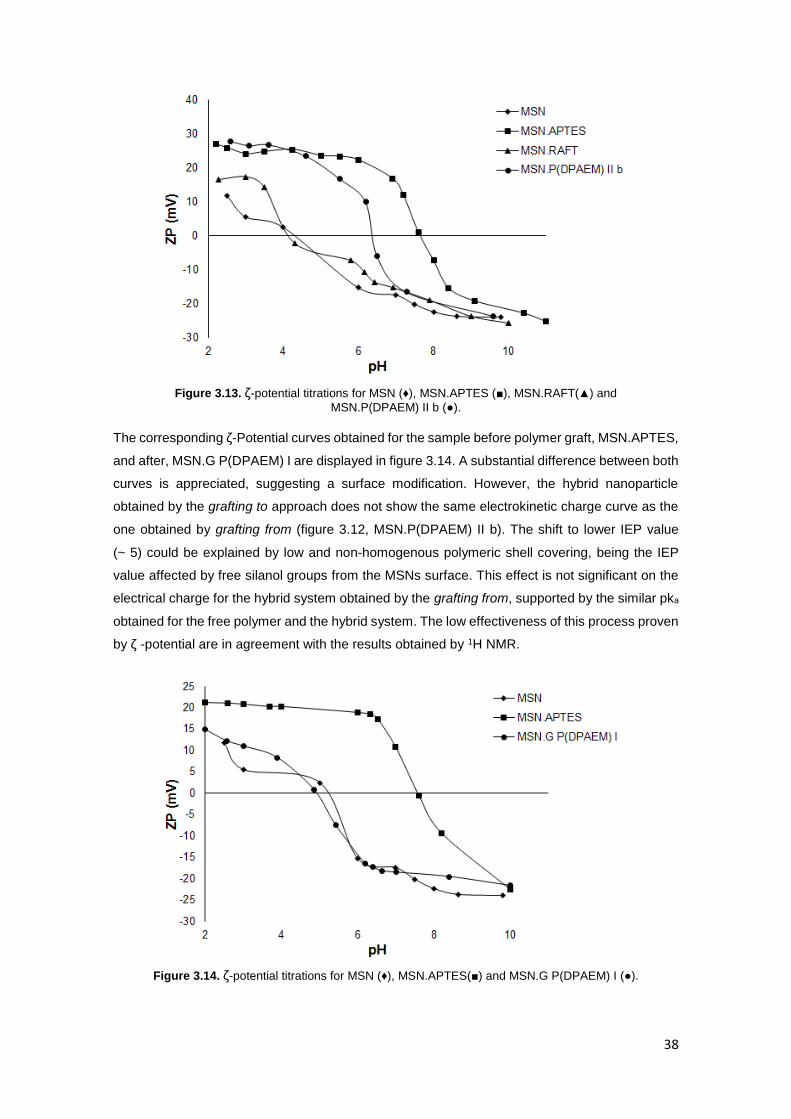
38
Figure 3.13. ζ-potential titrations for MSN (♦), MSN.APTES (), MSN.RAFT() and
MSN.P(DPAEM) II b ().
The corresponding ζ-Potential curves obtained for the sample before polymer graft, MSN.APTES,
and after, MSN.G P(DPAEM) I are displayed in figure 3.14. A substantial difference between both
curves is appreciated, suggesting a surface modification. However, the hybrid nanoparticle
obtained by the grafting to approach does not show the same electrokinetic charge curve as the
one obtained by grafting from (figure 3.12, MSN.P(DPAEM) II b). The shift to lower IEP value
(~ 5) could be explained by low and non-homogenous polymeric shell covering, being the IEP
value affected by free silanol groups from the MSNs surface. This effect is not significant on the
electrical charge for the hybrid system obtained by the grafting from, supported by the similar pka
obtained for the free polymer and the hybrid system. The low effectiveness of this process proven
by ζ -potential are in agreement with the results obtained by 1H NMR.
Figure 3.14. ζ-potential titrations for MSN (♦), MSN.APTES() and MSN.G P(DPAEM) I ().
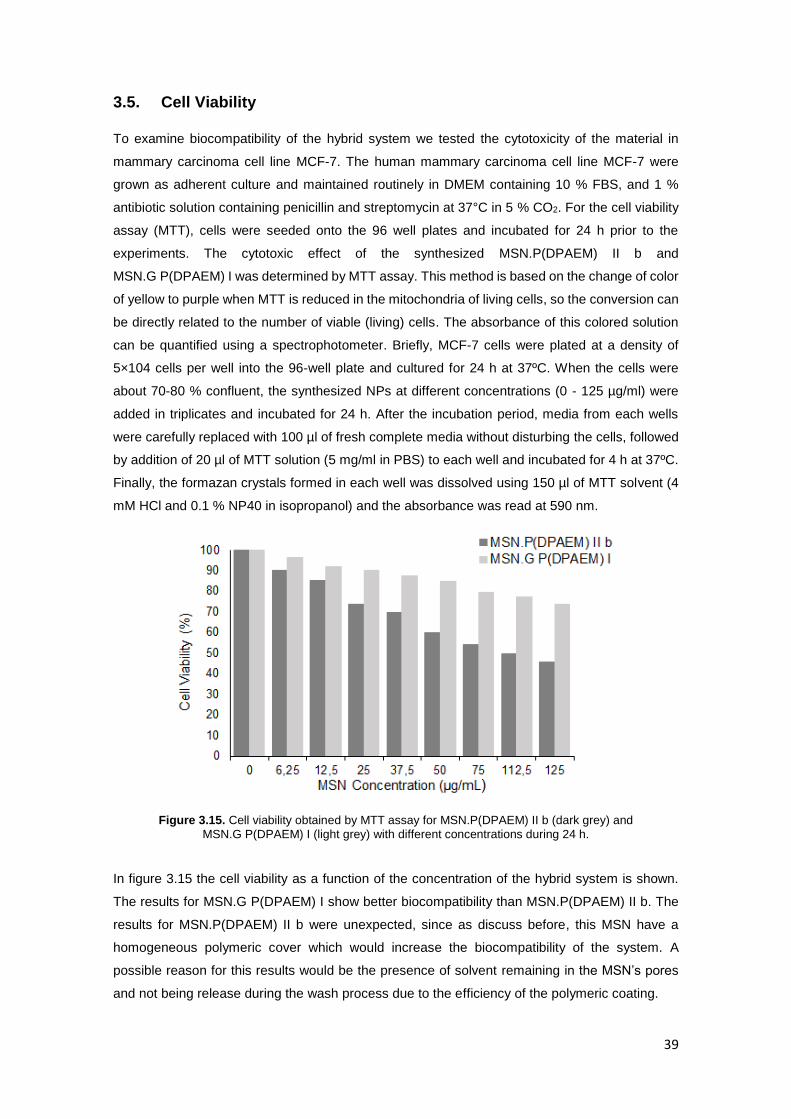
39
3.5. Cell Viability
To examine biocompatibility of the hybrid system we tested the cytotoxicity of the material in
mammary carcinoma cell line MCF-7. The human mammary carcinoma cell line MCF-7 were
grown as adherent culture and maintained routinely in DMEM containing 10 % FBS, and 1 %
antibiotic solution containing penicillin and streptomycin at 37°C in 5 % CO2. For the cell viability
assay (MTT), cells were seeded onto the 96 well plates and incubated for 24 h prior to the
experiments. The cytotoxic effect of the synthesized MSN.P(DPAEM) II b and
MSN.G P(DPAEM) I was determined by MTT assay. This method is based on the change of color
of yellow to purple when MTT is reduced in the mitochondria of living cells, so the conversion can
be directly related to the number of viable (living) cells. The absorbance of this colored solution
can be quantified using a spectrophotometer. Briefly, MCF-7 cells were plated at a density of
5×10⁴ cells per well into the 96-well plate and cultured for 24 h at 37ºC. When the cells were
about 70-80 % confluent, the synthesized NPs at different concentrations (0 - 125 µg/ml) were
added in triplicates and incubated for 24 h. After the incubation period, media from each wells
were carefully replaced with 100 µl of fresh complete media without disturbing the cells, followed
by addition of 20 µl of MTT solution (5 mg/ml in PBS) to each well and incubated for 4 h at 37ºC.
Finally, the formazan crystals formed in each well was dissolved using 150 µl of MTT solvent (4
mM HCl and 0.1 % NP40 in isopropanol) and the absorbance was read at 590 nm.
Figure 3.15. Cell viability obtained by MTT assay for MSN.P(DPAEM) II b (dark grey) and
MSN.G P(DPAEM) I (light grey) with different concentrations during 24 h.
In figure 3.15 the cell viability as a function of the concentration of the hybrid system is shown.
The results for MSN.G P(DPAEM) I show better biocompatibility than MSN.P(DPAEM) II b. The
results for MSN.P(DPAEM) II b were unexpected, since as discuss before, this MSN have a
homogeneous polymeric cover which would increase the biocompatibility of the system. A
possible reason for this results would be the presence of solvent remaining in the MSN’s pores
and not being release during the wash process due to the efficiency of the polymeric coating.
40
4. Conclusion and Future Perspectives
The continuous effort to improve the effectiveness of the drugs and a decrease of their side effects
originates the need to develop new systems able to carry the drug molecules to the target,
avoiding its metabolization/degradation by the body and improving its selectivity. In this work,
synthesis and characterization of a new hybrid system, based on a mesoporous silica
nanoparticle (MSN) core and a pH-responsive polymeric shell, was performed.
MSN were synthesized with a fluorescent dye on its structure and were submitted to amine
surface modification process using APTES. The APTES molecule served as an anchor for the
CTA immobilization which allowed the 2 – (Diisopropylamino) ethyl methacrylate (DPAEM)
monomer controlled polymerization from the MSN surface.
TEM and DLS characterization confirmed the success on the synthesis of spherical MSN with
narrow polydispersity and a well-defined mesostructure was successfully obtained by the method
used. Different NaOH concentrations yielded nanoparticles of different diameter.
Amine surface modification was assessed by 1H NMR, obtaining 1.6 – 3.1 mmol per gram of
MSN, and a successful CTA immobilization was verified by UV-Vis Spectroscopy with an
estimated CTA surface concentration between 2.0 and 3.1 mmol per gram of MSN. Those surface
modifications were confirmed by the variation on ζ-potential. The ζ-potential average for free MSN
was -23.5 mV, 30.4 mV for MSN.APTES and -8.0 mV for MSN.RAFT.
2 – (Diisopropylamino) ethyl methacrylate (DPAEM) monomer and 2 – (Diisopropylamino) ethyl
methacrylate polymer (P(DPAEM)) structures were determined by 1H NMR. The yield of monomer
synthesis was around 60 – 70 % and the estimated yield for DPAEM polymerization was 32.70
%. The pH responsive behaviour of P(DPAEM) was tested by UV-Vis Spectroscopy and through
the transmittance titration the value of the pKa could be estimated, being between 6.3 and 6.5.
The hybrid MSN were synthesized by the grafting from and the grafting to approaches, in order
to compare the effectiveness of those processes. The average size obtained in milli-Q water pH
(~ 5) for hybrid MSN by DLS was between 127 and 170 nm. In addition, TEM images suggest the
presence of the polymeric shell. For greater confirmation, 1H NMR, FT-IR Spectroscopy and Zeta
-Potential techniques were used.
The 1H NMR spectra obtained for the hybrid nanoparticles produced by grafting from approach
suggests that the polymerization occurs, although it was not complete, proved by the presence
of peaks attributed to the monomer structure, even after the washing process. On the other hand,
the spectra of the hybrid nanoparticles produced by grafting to approach suggests a low polymer
attachment on the MSN surface, due to the mostly free APTES molecule present on the sample
and due to the low intensity of peaks associated with the polymer.
41
ζ-potential titration confirmed the presence of the homogeneous polymeric coating. The
electrokinetic behaviour of the hybrid nanoparticles, with IEP for the hybrid MSN obtained by
grafting from approach estimated by ζ-potential analysis between 6.2 and 6.5. The lowest IEP
shown by the hybrid MSN obtained by grafting to approach can be related with a low and non-
homogeneous polymeric coating, this event supported by 1H NMR results.
FT-IR Spectroscopy was recorded for MSN.P(DPAEM) obtained by grafting from approach,
proving APTES, CTA and polymer attachment to the MSN surface.
The goals of this work were successfully accomplished, since hybrid mesoporous silica
nanoparticles, coated with a pH-responsive polymer synthesis and characterization was
achieved. In addition, it was proved that grafting from approach is more effective than grafting to
strategy even it is necessary to improve the washing process for those materials and verify the
biocompatibility of the system.
For the characterization of the polymer obtained by RAFT polymerization, gel permeation
chromatography (GPC) was performed, but the polymer adsorbed to the different columns tested.
Furthermore, the pH-responsive behavior could be better understood by a controlled release
assay through fluorescence spectroscopy, by incorporating a fluorescent compound, such as
sulforhodamine B (SRB), or even a fluorescent drug, as doxorubicin, into the hybrid system.
Once these assays are concluded, it should be of great interest to repeat viability assay and
determine the internalization of this hybrid system, as well as to study the drug controlled release
in vitro to confirm the advantage of using this platform as a future and promising strategy,
compared to the conventional treatments applied until now. For those assays it would be of great
interest to analyse the relation between nanoparticle size and the polymer length with its
biocompatibility and its effectiveness of cargo host/release in order to develop an optimize system
of great interest for medical applications.
42
5. References
Ahmadi, E., Dehghannejad, N., Hashemikia, S., Ghasemnejad, M., & Tabebordbar, H. 2014.
Synthesis and surface modification of mesoporous silica nanoparticles and its application
as carriers for sustained drug delivery. Drug delivery, 21(3), 164-172.
Argyo, C., Weiss, V., Brauchle, C., & Bein, T. 2013. Multifunctional mesoporous silica
nanoparticles as a universal platform for drug delivery. Chemistry of Materials, 26(1), 435-
451.
Bawa, P., Pillay, V., Choonara, Y. E., & Du Toit, L. C. 2009. Stimuli-responsive polymers and their
applications in drug delivery. Biomedical materials, 4(2), 022001.
Beck, J. S., Vartuli, J. C., Roth, W. J., Leonowicz, M. E., Kresge, C. T., Schmitt, K. D., Chu,
C. T. W., Olson, D. H., Sheppard, E. W., McCullen, S. B., Higgins, J. B., & Schlenker, J.
L. 1992. A new family of mesoporous molecular sieves prepared with liquid crystal
templates. Journal of the American Chemical Society, 114(27), 10834-10843.
Bhattacharjee, S. 2016. DLS and zeta potential–What they are and what they are not?.
Journal of Controlled Release.
Cabane, E., Zhang, X., Langowska, K., Palivan, C. G., & Meier, W. 2012. Stimuli-responsive
polymers and their applications in nanomedicine. Biointerphases, 7(1), 9.
Chaudhuri, R., & Paria, S. 2011. Core/shell nanoparticles: classes, properties, synthesis
mechanisms, characterization, and applications. Chemical reviews, 112(4), 2373-2433.
Crucho, C. I. C., Baleizão, C. M., Farinha, J. P. 2016. Functional group coverage and conversion
quantification in nanostructured silica by 1H-NMR. Analytical Chemistry.
Cuenca, A. G., Jiang, H., Hochwald, S. N., Delano, M., Cance, W. G., & Grobmyer, S. R. 2006.
Emerging implications of nanotechnology on cancer diagnostics and
therapeutics. Cancer, 107(3), 459-466.
Cunningham, A., & Bürgi, T. 2013. Bottom-up Organisation of Metallic Nanoparticles. Springer
Berlin Heidelberg. Amorphous Nanophotonics, 1-37.
Dai, S., Ravi, P., & Tam, K. C. 2008. pH-Responsive polymers: synthesis, properties and
applications. Soft Matter, 4(3), 435-449.
De Barros, A. L. B., de Oliveira Ferraz, K. S., Dantas, T. C. S., Andrade, G. F., Cardoso, V. N., &
de Sousa, E. M. B. 2015. Synthesis, characterization, and biodistribution studies of 99m
Tc-labelled SBA-16 mesoporous silica nanoparticles. Materials Science and Engineering:
C, 56, 181-188.
43
DeMuth, P., Hurley, M., Wu, C., Galanie, S., Zachariah, M. R., & DeShong, P. 2011. Mesoscale
porous silica as drug delivery vehicles: Synthesis, characterization, and pH-sensitive
release profiles. Microporous and Mesoporous Materials, 141(1), 128-134.
Faccia, P. A., & Amalvy, J. I. 2013. Synthesis, characterization, and swelling behavior of new pH‐
sensitive hydrogels derived from copolymers of 2‐hydroxyethyl methacrylate and
2‐(diisopropylamino)ethyl methacrylate. Journal of Applied Polymer Science, 127(3),
1974-1980.
Favier, A., & Charreyre, M. T. 2006. Experimental Requirements for an Efficient Control of Free‐
Radical Polymerizations via the Reversible Addition‐Fragmentation Chain Transfer
(RAFT) Process. Macromolecular Rapid Communications, 27(9), 653-692.
Ferrari, M. 2005. Cancer nanotechnology: opportunities and challenges. Nature Reviews
Cancer, 5(3), 161-171.
Feynman, R. P. December 29th 1959. There’s plenty of room at the bottom. The Vega Science
Trust. The American Physical Society at CalTech, California.
Gao, X., Kucerka, N., Nieh, M. P., Katsaras, J., Zhu, S., Brash, J. L., & Sheardown, H. 2009.
Chain conformation of a new class of PEG-based thermoresponsive polymer brushes
grafted on silicon as determined by neutron reflectometry. Langmuir, 25(17),
10271-10278.
Gaynor, S., Greszta, D., Mardare, D., Teodorescu, M., & Matyjaszewski, K. 1994. Controlled
radical polymerization. Journal of Macromolecular Science, Part A, 31(11), 1561-1578.
Gil, E. S., & Hudson, S. M. 2004. Stimuli-reponsive polymers and their bioconjugates.
Progress in polymer science, 29(12), 1173-1222.
Góis, J. R., Rocha, N., Popov, A. V., Guliashvili, T., Matyjaszewski, K., Serra, A. C., & Coelho, J.
F. 2014. Synthesis of well-defined functionalized poly (2-(diisopropylamino) ethyl
methacrylate) using ATRP with sodium dithionite as a SARA agent.
Polymer Chemistry, 5(12), 3919-3928.
Goodsell, D. S. 2004. Bionanotechnology: lessons from nature. Willey-Less, 311, 1-8.
Green, D. L., Jayasundara, S., Lam, Y. F., & Harris, M. T. 2003. Chemical reaction kinetics leading
to the first Stober silica nanoparticles–NMR and SAXS investigation.
Journal of non-crystalline solids, 315(1), 166-179.
44
Grün, M., Büchel, G., Kumar, D., Schumacher, K., Bidlingmaier, B., & Unger, K. K. 2000. Rational
design, tailored synthesis and characterisation of ordered mesoporous silica in the micron
and submicron size range. Studies in surface science and catalysis, 128, 155-165.
Gupta, P., Vermani, K., & Garg, S. 2002. Hydrogels: from controlled release to pH-responsive
drug delivery. Drug discovery today, 7(10), 569-579.
Hench, L. L., & West, J. K. 1990. The sol-gel process. Chemical Reviews,90(1), 33-72.
Hu, Y. Q., Kim, M. S., Kim, B. S., & Lee, D. S. 2007. Synthesis and pH-dependent micellization
of 2-(diisopropylamino) ethyl methacrylate based amphiphilic diblock copolymers via
RAFT polymerization. Polymer, 48(12), 3437-3443.
Huang, X., Appelhans, D., Formanek, P., Simon, F., & Voit, B. 2011. Synthesis of well-defined
photo-cross-linked polymeric nanocapsules by surface-initiated RAFT
polymerization. Macromolecules, 44(21), 8351-8360.
Huh, K. M., Kang, H. C., Lee, Y. J., & Bae, Y. H. 2012. pH-sensitive polymers for drug
delivery. Macromolecular research, 20(3), 224-233.
Huh, S., Wiench, J. W., Yoo, J. C., Pruski, M., & Lin, V. S. Y. 2003. Organic functionalization and
morphology control of mesoporous silicas via a co-condensation synthesis
method. Chemistry of materials, 15(22), 4247-4256.
Jain, K. K. 2005. Nanotechnology-based drug delivery for cancer. Technology in cancer research
& treatment, 4(4), 407-416.
Kim, S., Kim, J. H., Jeon, O., Kwon, I. C., & Park, K. 2009. Engineered polymers for advanced
drug delivery. European Journal of Pharmaceutics and Biopharmaceutics, 71(3),
420-430.
Li, Z., Barnes, J. C., Bosoy, A., Stoddart, J. F., & Zink, J. I. 2012. Mesoporous silica nanoparticles
in biomedical applications. Chemical Society Reviews, 41(7), 2590-2605.
Liu, C., Guo, J., Yang, W., Hu, J., Wang, C., & Fu, S. 2009. Magnetic mesoporous silica
microspheres with thermo-sensitive polymer shell for controlled drug release. Journal of
Materials Chemistry, 19(27), 4764-4770.
Ma, M., Zheng, S., Chen, H., Yao, M., Zhang, K., Jia, X., Mou, J., Xu, H., Wu, R., & Shi, J. 2014.
A combined “RAFT” and “Graft From” polymerization strategy for surface modification of
mesoporous silica nanoparticles: towards enhanced tumor accumulation and cancer
therapy efficacy. Journal of Materials Chemistry B,2(35), 5828-5836.

45
Matyjaszewski, K. 1996. Controlled radical polymerization. Current Opinion in Solid State and
Materials Science, 1(6), 769-776.
Moad, G., Rizzardo, E., & Thang, S. H. 1998. Living free-radical polymerization by reversible
addition-fragmentation chain transfer: the RAFT process. Macromolecules, 31(16), 5559-
5562.
Moad, G., Rizzardo, E., & Thang, S. H. 2005. Living radical polymerization by the RAFT
process. Australian journal of chemistry, 58(6), 379-410.
Mousa, S. A., & Bharali, D. J. 2011. Nanotechnology-based detection and targeted therapy in
cancer: nano-bio paradigms and applications. Cancers, 3(3), 2888-2903.
Natarajan, S. K., & Selvaraj, S. 2014. Mesoporous silica nanoparticles: importance of surface
modifications and its role in drug delivery. Rsc Advances, 4(28), 14328-14334.
National Nanotechnology Initiative (NNI). 2014. What is nanotechnology? Available online:
http://www.nano.gov/nanotech-101/what/definition (accessed on 12th October 2015).
Odian, G. 2004. Radical chain polymerization. Principles of polymerization. John Wiley & Sons,
4, 198-349.
Peng, C. L., Yang, L. Y., Luo, T. Y., Lai, P. S., Yang, S. J., Lin, W. J., & Shieh, M. J. 2010.
Development of pH sensitive 2-(diisopropylamino) ethyl methacrylate based
nanoparticles for photodynamic therapy. Nanotechnology,21(15), 155103.
Popat, A., Hartono, S. B., Stahr, F., Liu, J., Qiao, S. Z., & Lu, G. Q. M. 2011. Mesoporous silica
nanoparticles for bioadsorption, enzyme immobilisation, and delivery
carriers. Nanoscale, 3(7), 2801-2818.
Ribeiro, T., Raja, S., Rodrigues, A. S., Fernandes, F., Farinha, J. P. S., & Baleizão, C. 2013.
High performance NIR fluorescent silica nanoparticles for bioimaging. RSC
Advances, 3(24), 9171-9174.
Rodrigues, A. S., Ribeiro, T., Fernandes, F., Farinha, J. P. S., & Baleizão, C. 2013. Intrinsically
fluorescent silica nanocontainers: a promising theranostic platform. Microscopy and
Microanalysis, 19(05), 1216-1221.
Rosenholm, J. M., & Lindén, M. 2008. Towards establishing structure–activity relationships for
mesoporous silica in drug delivery applications. Journal of controlled release, 128(2),
157-164.
Ross, J., Schreiber, I., & Vlad, M. O. 2005. Determination of complex reaction mechanisms:
analysis of chemical, biological, and genetic networks. Oxford University Press.
46
Santiago, A. M., Ribeiro, T., Rodrigues, A. S., Ribeiro, B., Frade, R. F., Baleizão, C., &
Farinha, J. P. S. 2015. Multifunctional Hybrid Silica Nanoparticles with a Fluorescent Core
and Active Targeting Shell for Fluorescence Imaging Biodiagnostic
Applications. European Journal of Inorganic Chemistry, 2015(27), 4579-4587.
Schmaljohann, D. 2006. Thermo-and pH-responsive polymers in drug delivery. Advanced drug
delivery reviews, 58(15), 1655-1670.
Schulz, A., & McDonagh, C. 2012. Intracellular sensing and cell diagnostics using fluorescent
silica nanoparticles. Soft Matter, 8(9), 2579-2585.
Singh, N., Karambelkar, A., Gu, L., Lin, K., Miller, J. S., Chen, C. S., Sailor, M. J., &
Bhatia, S. N. 2011. Bioresponsive mesoporous silica nanoparticles for triggered drug
release. Journal of the American Chemical Society, 133(49), 19582-19585.
Singh, S. 2010. Nanomedicine–nanoscale drugs and delivery systems. Journal of nanoscience
and nanotechnology, 10(12), 7906-7918.
Slowing, I., Trewyn, B. G., & Lin, V. S. Y. 2006. Effect of surface functionalization of
MCM-41-type mesoporous silica nanoparticles on the endocytosis by human cancer
cells. Journal of the American Chemical Society, 128(46), 14792-14793.
Slowing, I., Vivero-Escoto, J. L., Trewyn, B. G., & Lin, V. S. Y. 2010. Mesoporous silica
nanoparticles: structural design and applications. Journal of Materials Chemistry, 20(37),
7924-7937.
Soler-Illia, G. J., & Azzaroni, O. 2011. Multifunctional hybrids by combining ordered mesoporous
materials and macromolecular building blocks. Chemical Society Reviews, 40(2),
1107-1150.
Stein, A., Melde, B. J., & Schroden, R. C. 2000. Hybrid inorganic–organic mesoporous silicates—
nanoscopic reactors coming of age. Advanced Materials, 12(19), 1403-1419.
Stenzel, M. H., Davis, T. P., & Fane, A. G. 2003. Honeycomb structured porous films prepared
from carbohydrate based polymers synthesized via the RAFT process. Journal of
Materials Chemistry, 13(9), 2090-2097.
Stöber, W., Fink, A., & Bohn, E. 1968. Controlled growth of monodisperse silica spheres in the
micron size range. Journal of colloid and interface science, 26(1), 62-69.
Storhoff, J. J., Mucic, R. C., & Mirkin, C. A. 1997. Strategies for organizing nanoparticles into
aggregate structures and functional materials. Journal of Cluster Science, 8(2),
179-216.
47
Strebhardt, K., & Ullrich, A. 2008. Paul Ehrlich's magic bullet concept: 100 years of progress.
Nature Reviews Cancer, 8(6), 473-480.
Tan, W., Wang, K., He, X., Zhao, X. J., Drake, T., Wang, L., & Bagwe, R. P. 2004.
Bionanotechnology based on silica nanoparticles. Medicinal research reviews, 24(5),
621-638.
Tang, F., Li, L., & Chen, D. 2012. Mesoporous silica nanoparticles: synthesis, biocompatibility
and drug delivery. Advanced Materials, 24(12), 1504-1534.
Trewyn, B. G., Slowing, I. I., Giri, S., Chen, H. T., & Lin, V. S. Y. 2007. Synthesis and
functionalization of a mesoporous silica nanoparticle based on the sol–gel process and
applications in controlled release. Accounts of Chemical Research, 40(9), 846-853.
Vallet-Regí, M. 2012. Mesoporous silica nanoparticles: their projection in nanomedicine.
ISRN Materials Science.
Vega-Rios, A., & Licea-Claveríe, A. 2011. Controlled synthesis of block copolymers containing N-
isopropylacrylamide by reversible addition-fragmentation chain-transfer (RAFT)
polymerization. Journal of the Mexican Chemical Society, 55(1), 21-32.
Wang, Y., Han, N., Zhao, Q., Bai, L., Li, J., Jiang, T., & Wang, S. 2015. Redox-responsive
mesoporous silica as carriers for controlled drug delivery: a comparative study based on
silica and PEG gatekeepers. European Journal of Pharmaceutical Sciences, 72, 12-20.
Xu, R. 2008. Progress in nanoparticles characterization: Sizing and zeta potential
measurement. Particuology, 6(2), 112-115.
Zhang, Q., Neoh, K. G., Xu, L., Lu, S., Kang, E. T., Mahendran, R., & Chiong, E. 2014.
Functionalized mesoporous silica nanoparticles with mucoadhesive and sustained drug
release properties for potential bladder cancer therapy.Langmuir, 30(21), 6151-6161.
Zhao, Y., Trewyn, B. G., Slowing, I. I., & Lin, V. S. Y. 2009. Mesoporous silica nanoparticle-based
double drug delivery system for glucose-responsive controlled release of insulin and
cyclic AMP. Journal of the American Chemical Society, 131(24), 8398-8400.
Zhu, J., et al. 2013. Size-dependent cellular uptake efficiency, mechanism, and cytotoxicity of
silica nanoparticles toward HeLa cells. Talanta, 107, 408-415.
Zou, H., Wu, S., & Shen, J. 2008. Polymer/silica nanocomposites: preparation, characterization,
properties, and applications. Chem. Rev, 108(9), 3893-3957.
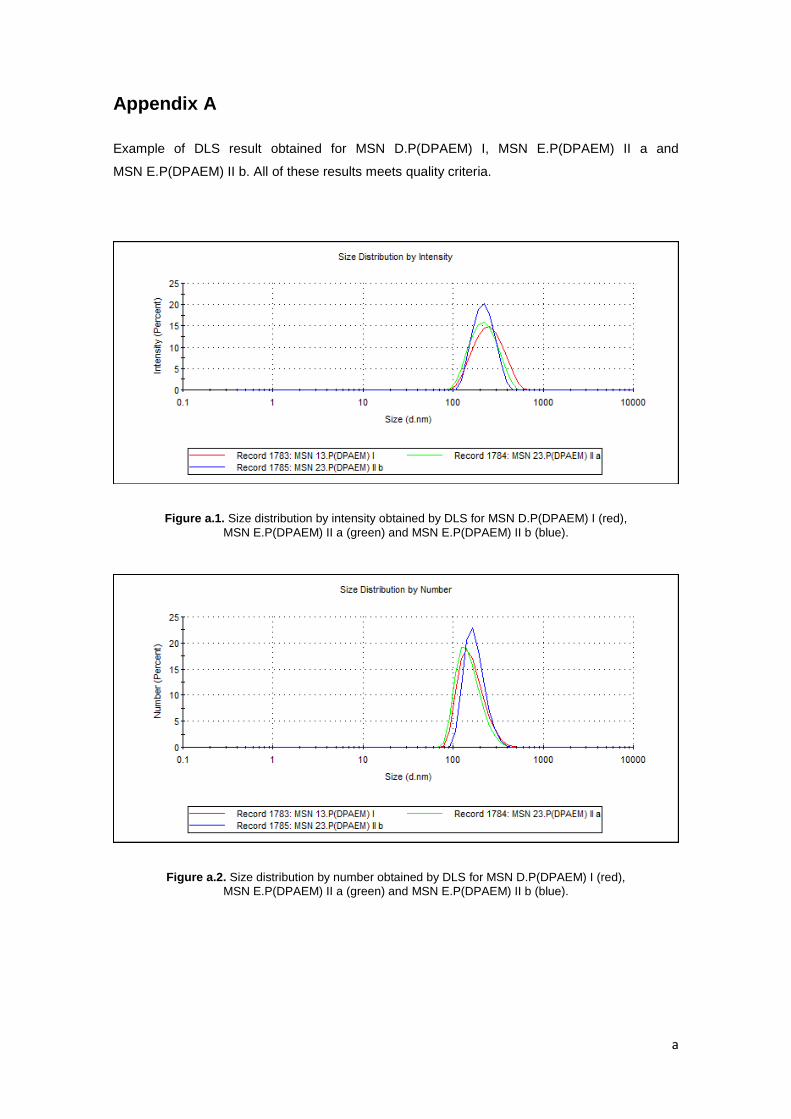
a
Appendix A
Example of DLS result obtained for MSN D.P(DPAEM) I, MSN E.P(DPAEM) II a and
MSN E.P(DPAEM) II b. All of these results meets quality criteria.
Figure a.1. Size distribution by intensity obtained by DLS for MSN D.P(DPAEM) I (red),
MSN E.P(DPAEM) II a (green) and MSN E.P(DPAEM) II b (blue).
Figure a.2. Size distribution by number obtained by DLS for MSN D.P(DPAEM) I (red),
MSN E.P(DPAEM) II a (green) and MSN E.P(DPAEM) II b (blue).
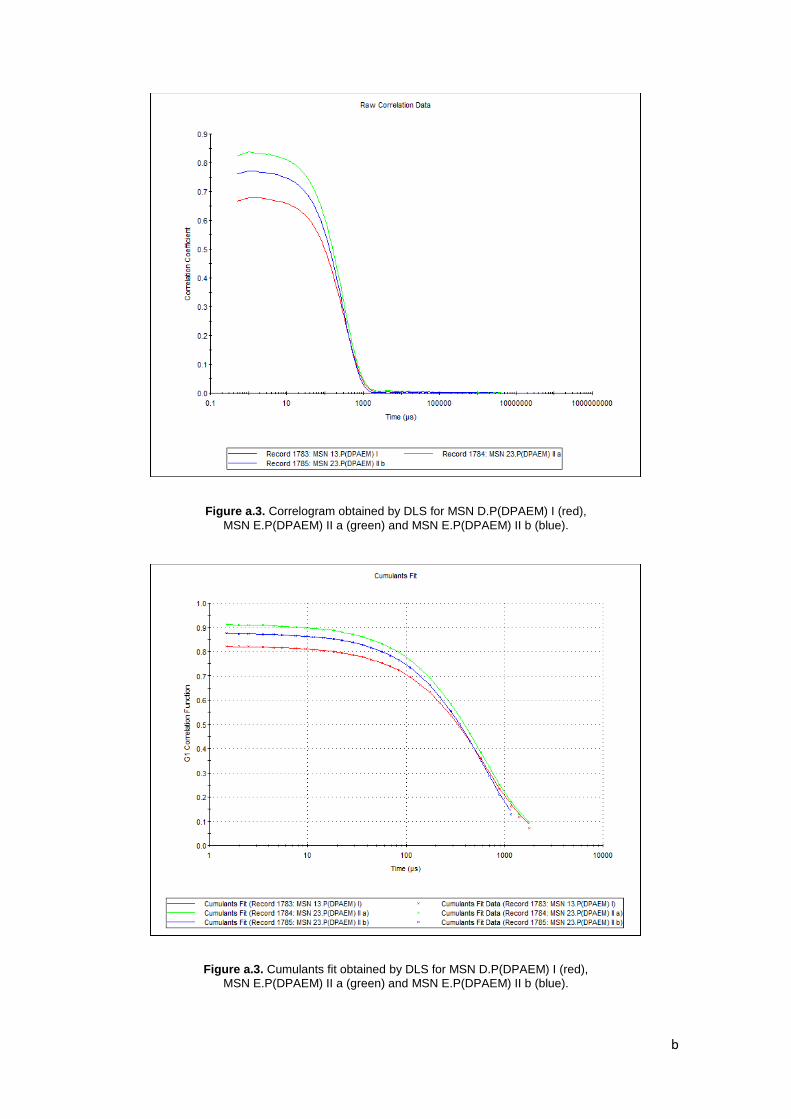
b
Figure a.3. Correlogram obtained by DLS for MSN D.P(DPAEM) I (red),
MSN E.P(DPAEM) II a (green) and MSN E.P(DPAEM) II b (blue).
Figure a.3. Cumulants fit obtained by DLS for MSN D.P(DPAEM) I (red),
MSN E.P(DPAEM) II a (green) and MSN E.P(DPAEM) II b (blue).
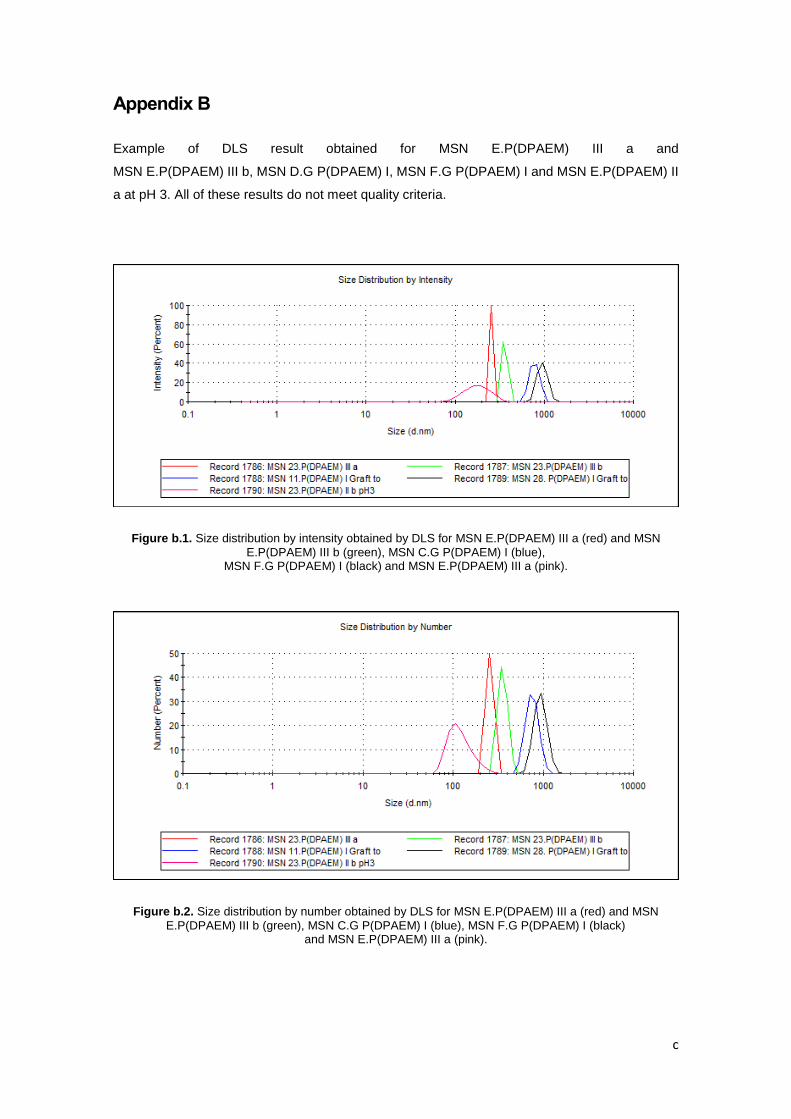
c
Appendix B
Example of DLS result obtained for MSN E.P(DPAEM) III a and
MSN E.P(DPAEM) III b, MSN D.G P(DPAEM) I, MSN F.G P(DPAEM) I and MSN E.P(DPAEM) II
a at pH 3. All of these results do not meet quality criteria.
Figure b.1. Size distribution by intensity obtained by DLS for MSN E.P(DPAEM) III a (red) and MSN
E.P(DPAEM) III b (green), MSN C.G P(DPAEM) I (blue), MSN F.G P(DPAEM) I (black) and MSN E.P(DPAEM) III a (pink).
Figure b.2. Size distribution by number obtained by DLS for MSN E.P(DPAEM) III a (red) and MSN
E.P(DPAEM) III b (green), MSN C.G P(DPAEM) I (blue), MSN F.G P(DPAEM) I (black) and MSN E.P(DPAEM) III a (pink).
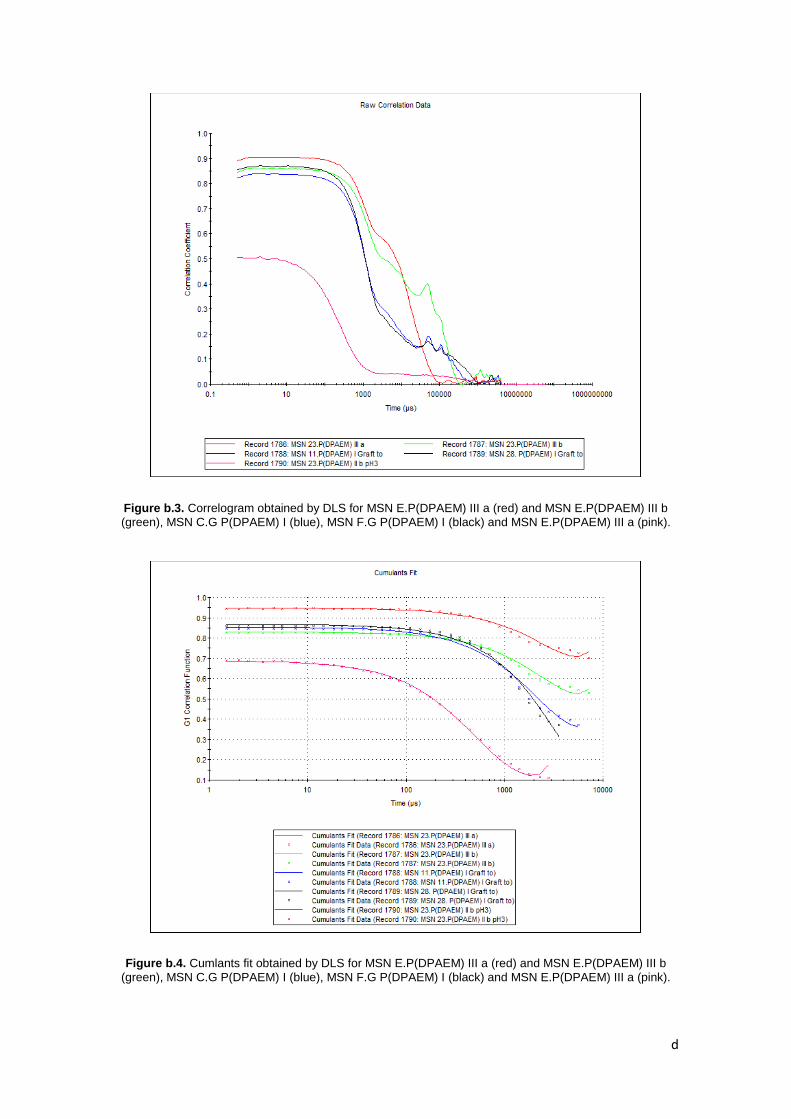
d
Figure b.3. Correlogram obtained by DLS for MSN E.P(DPAEM) III a (red) and MSN E.P(DPAEM) III b
(green), MSN C.G P(DPAEM) I (blue), MSN F.G P(DPAEM) I (black) and MSN E.P(DPAEM) III a (pink).
Figure b.4. Cumlants fit obtained by DLS for MSN E.P(DPAEM) III a (red) and MSN E.P(DPAEM) III b
(green), MSN C.G P(DPAEM) I (blue), MSN F.G P(DPAEM) I (black) and MSN E.P(DPAEM) III a (pink).