Embed Size (px)
Citation preview
Presenter: Dr. Mathias Franke Kinemetrics, Inc. Open Systems & Services Department www.kmioss.com
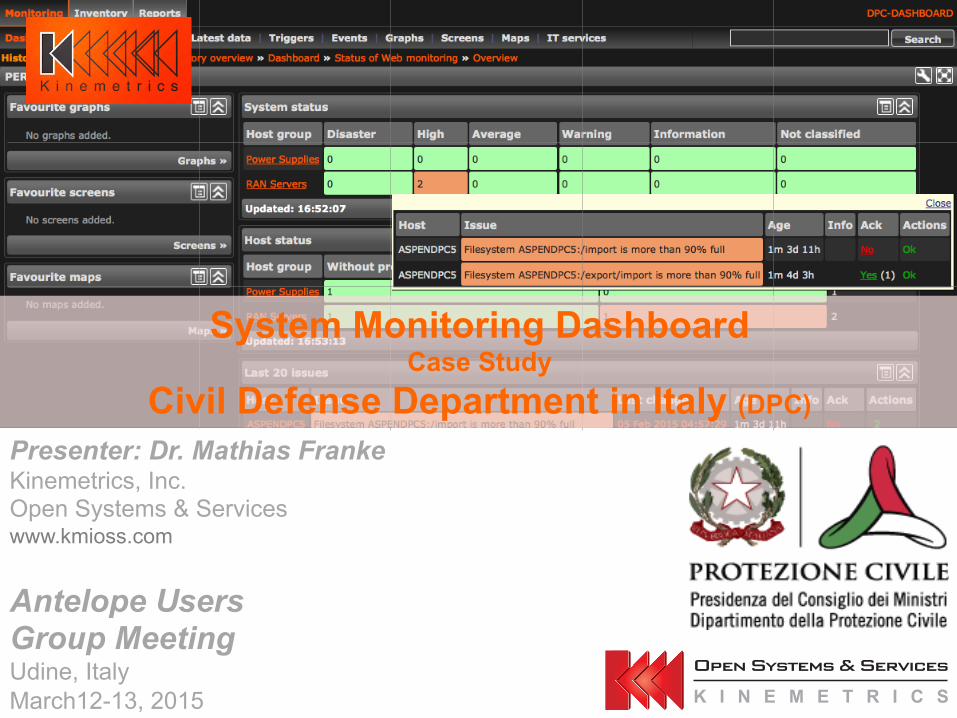
System Monitoring Dashboard Case Study
Civil Defense Department in Italy (DPC)
Antelope Users Group Meeting Udine, Italy March12-13, 2015
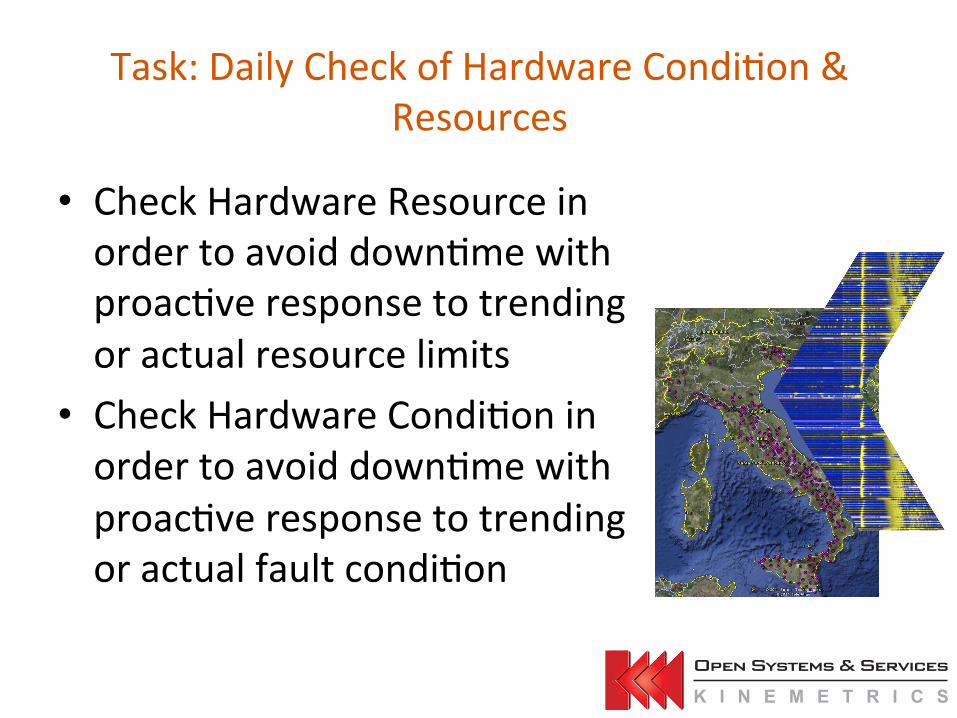
Task: Daily Check of Hardware Condi6on & Resources
• Check Hardware Resource in order to avoid down6me with proac6ve response to trending or actual resource limits
• Check Hardware Condi6on in order to avoid down6me with proac6ve response to trending or actual fault condi6on
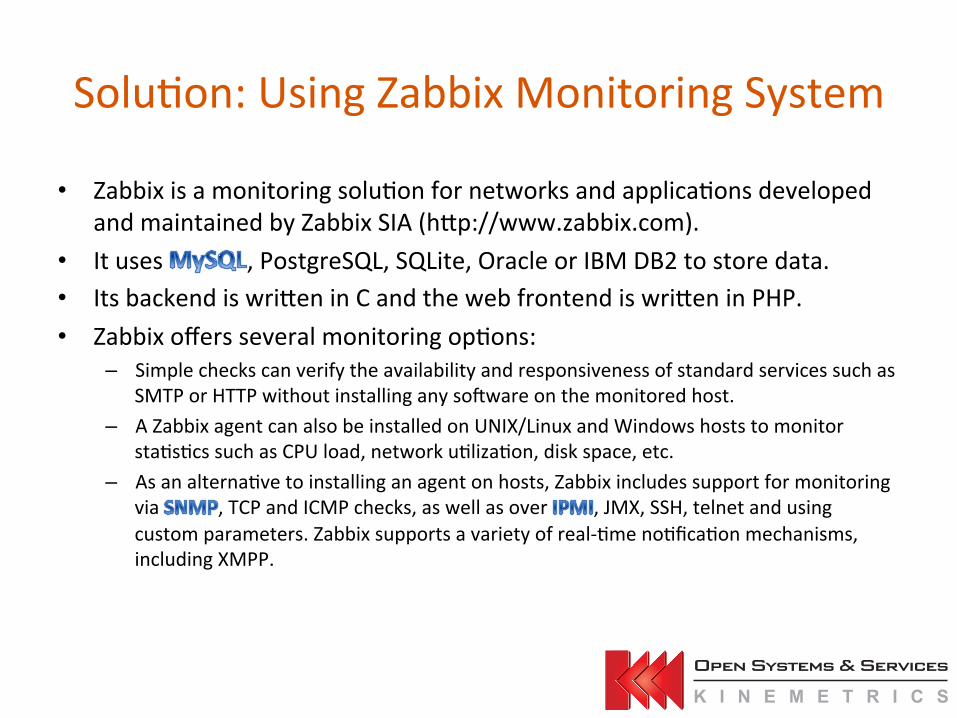
Solu6on: Using Zabbix Monitoring System
• Zabbix is a monitoring solu6on for networks and applica6ons developed and maintained by Zabbix SIA (hHp://www.zabbix.com).
• It uses , PostgreSQL, SQLite, Oracle or IBM DB2 to store data. • Its backend is wriHen in C and the web frontend is wriHen in PHP. • Zabbix offers several monitoring op6ons:
– Simple checks can verify the availability and responsiveness of standard services such as SMTP or HTTP without installing any soUware on the monitored host.
– A Zabbix agent can also be installed on UNIX/Linux and Windows hosts to monitor sta6s6cs such as CPU load, network u6liza6on, disk space, etc.
– As an alterna6ve to installing an agent on hosts, Zabbix includes support for monitoring via , TCP and ICMP checks, as well as over , JMX, SSH, telnet and using custom parameters. Zabbix supports a variety of real-‐6me no6fica6on mechanisms, including XMPP.

What we want to monitor
• CPU u6liza6on • Memory u6liza6on (physical & virtual) • File system u6liza6on • Disk u6liza6on • Network interface u6liza6on • Availability of basic system services like sshd, smtpd, ntpd etc.
• DELL iDRAC sensor/health status

Monitoring Dashboard Development -‐ Requirements
• Apache Web server with PHP Support on monitoring server
• Oracle MySQL Server and Client on monitoring server
• Zabbix Server and Front-‐end installa6on on monitoring server
• Zabbix Proxy on monitoring server • Zabbix Agent and Support Tools on monitoring server & client server
• Some system prepara6ons (Op6onal RPM repository, dedicated file system for MySQL and deployment with Yum repositories, iptables, /etc/hosts)

Monitoring Dashboard Development -‐ Customiza6ons
• Kinemetrics OSS Theme and Support Link • Colors & Graphic (removal of Zabbix watermark) • Many small changes that need to be applied to the PHP source code of the front-‐end
• Kinemetrics-‐specific zabbix-‐web RPM package

Monitoring Dashboard Development -‐ Customiza6ons
• Low Level Device Discovery – One of the main arguments for Zabbix as monitoring system is it’s ability to use special probes to dynamically update lists of items that need to be monitored.
– Templates can be kept simple when low-‐level device discovery is used.
• Agent Extensions & Templates – 12 new or modified templates (xml files)
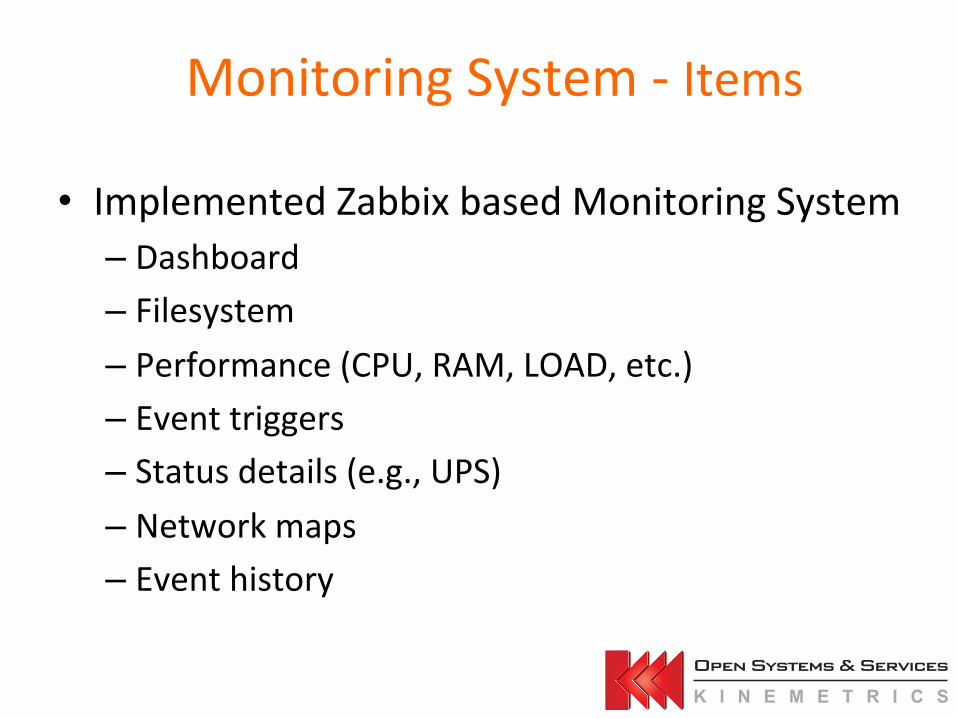
Monitoring System -‐ Items
• Implemented Zabbix based Monitoring System – Dashboard – Filesystem – Performance (CPU, RAM, LOAD, etc.) – Event triggers – Status details (e.g., UPS) – Network maps – Event history
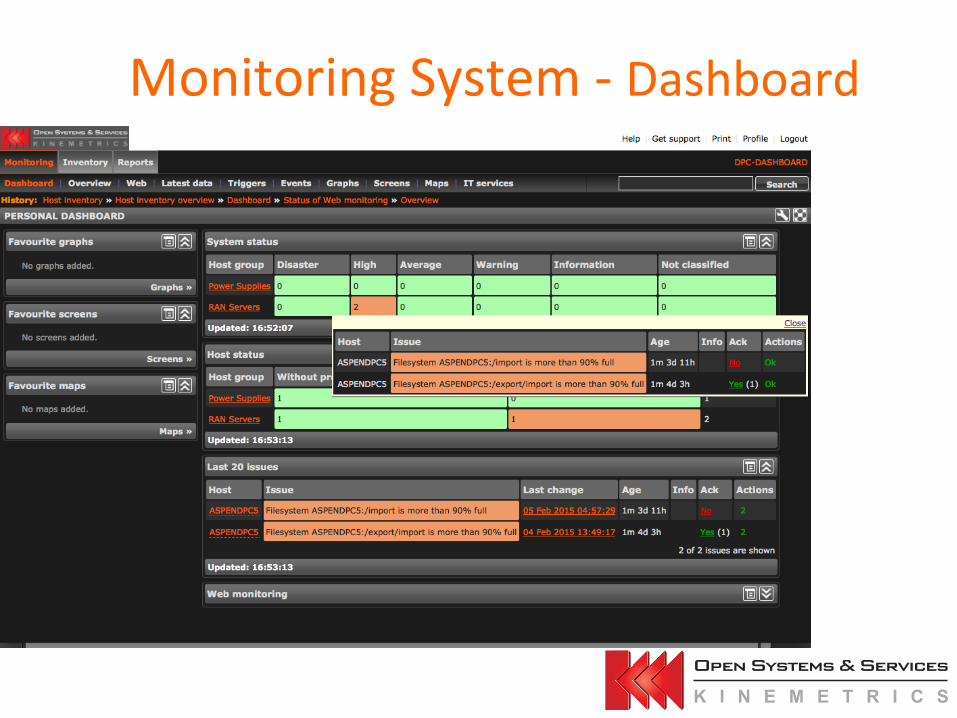
Monitoring System -‐ Dashboard
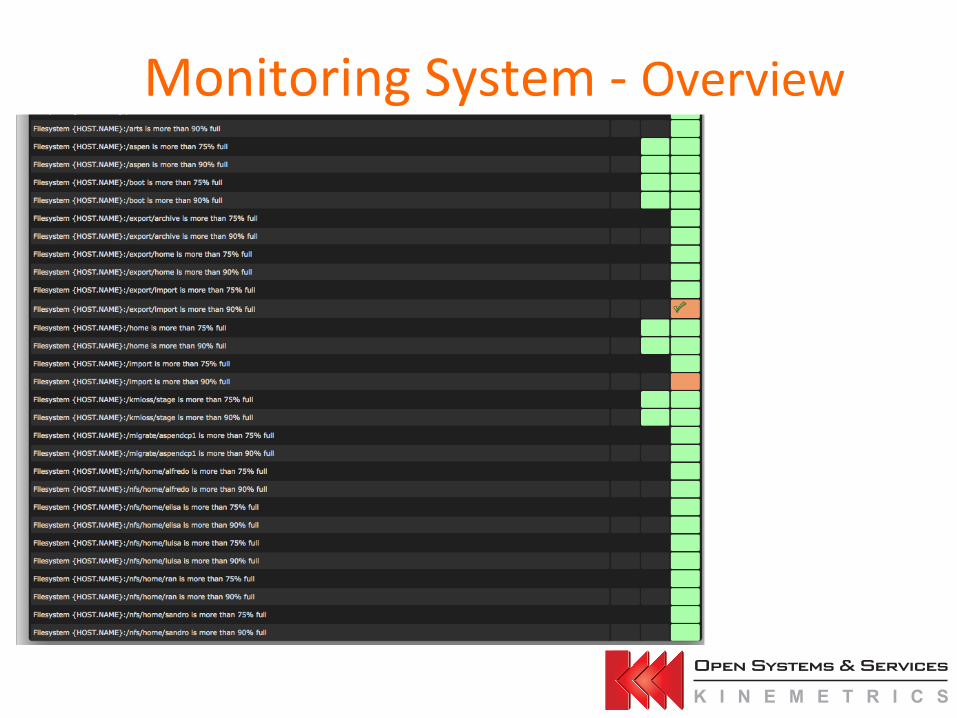
Monitoring System -‐ Overview

Monitoring System – Latest Data
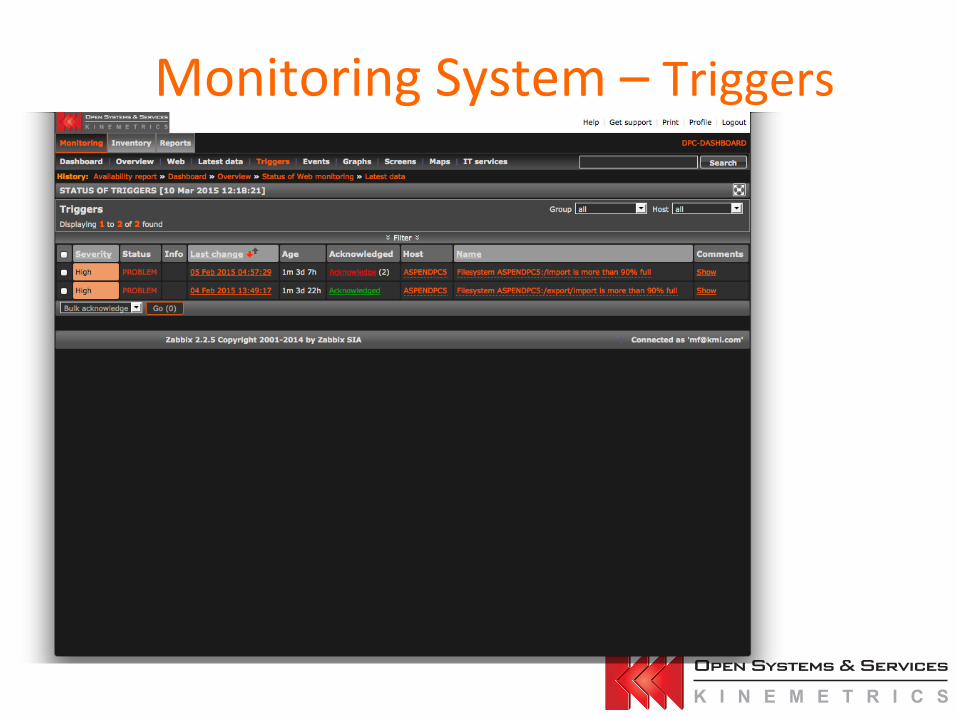
Monitoring System – Triggers
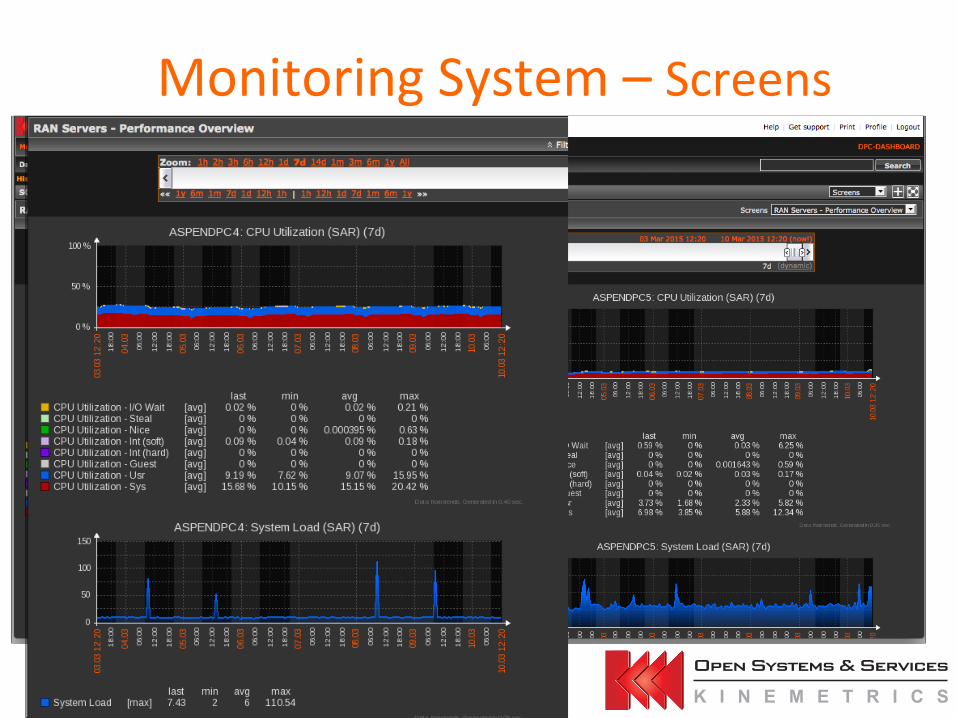
Monitoring System – Screens

Monitoring System – Screens

Monitoring System – Screens

Monitoring System – Reports
Thank You