Embed Size (px)
Citation preview


WOONEUI TAESenior Consultant
Real time S&OP 기반의오라클수요및판촉관리솔루션
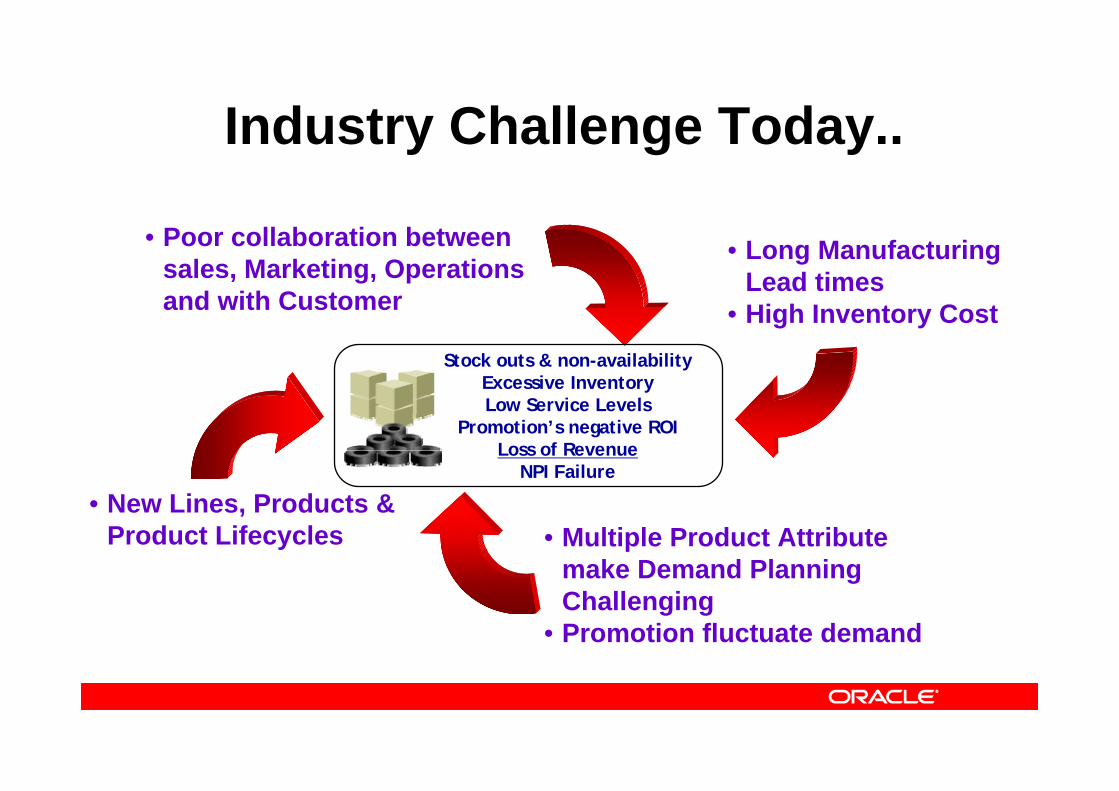
Industry Challenge Today..
• Long Manufacturing Lead times
• High Inventory Cost
• Multiple Product Attribute make Demand Planning Challenging
• Promotion fluctuate demand
• Poor collaboration between sales, Marketing, Operations and with Customer
• New Lines, Products & Product Lifecycles
Stock outs & non-availabilityExcessive InventoryLow Service Levels
Promotion’s negative ROILoss of Revenue
NPI Failure
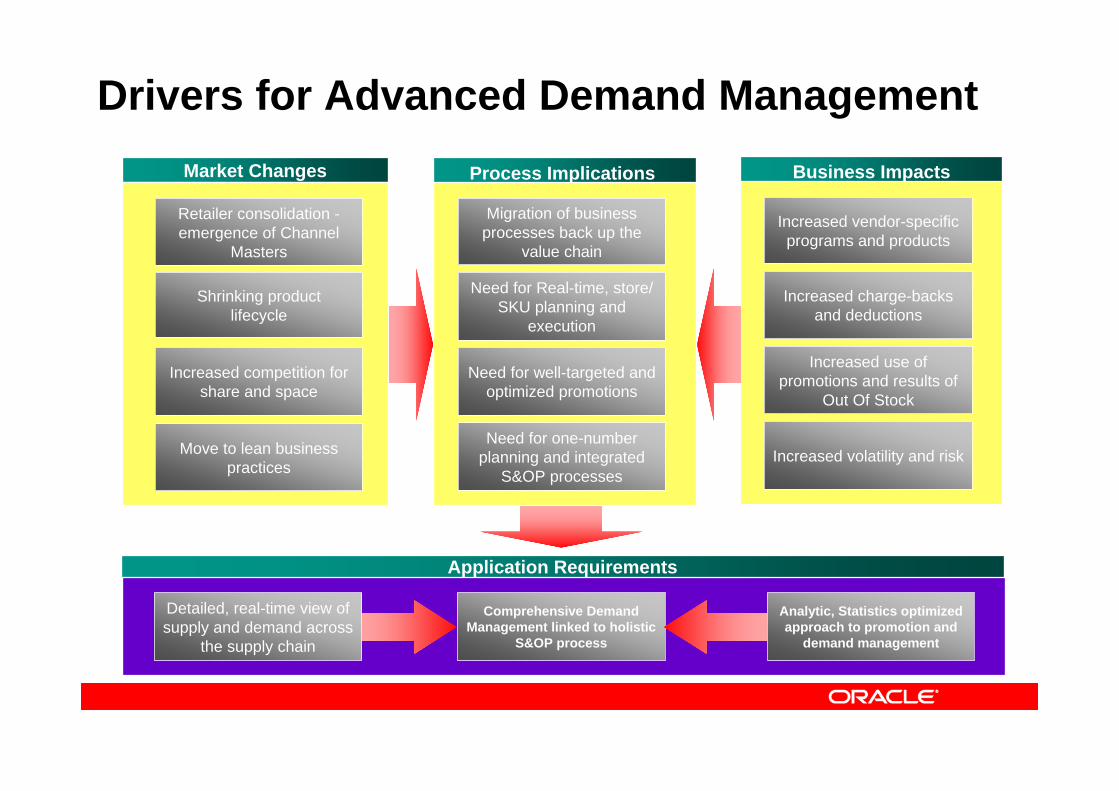
Application Requirements
Comprehensive Demand Management linked to holistic
S&OP process
Analytic, Statistics optimized approach to promotion and
demand management
Detailed, real-time view of supply and demand across
the supply chain
Business Impacts
Increased charge-backs and deductions
Increased vendor-specific programs and products
Increased use of promotions and results of
Out Of Stock
Increased volatility and risk
Market Changes
Shrinking product lifecycle
Increased competition for share and space
Retailer consolidation -emergence of Channel
Masters
Move to lean business practices
Process Implications
Need for Real-time, store/ SKU planning and
execution
Migration of business processes back up the
value chain
Need for well-targeted and optimized promotions
Need for one-number planning and integrated
S&OP processes
Drivers for Advanced Demand Management
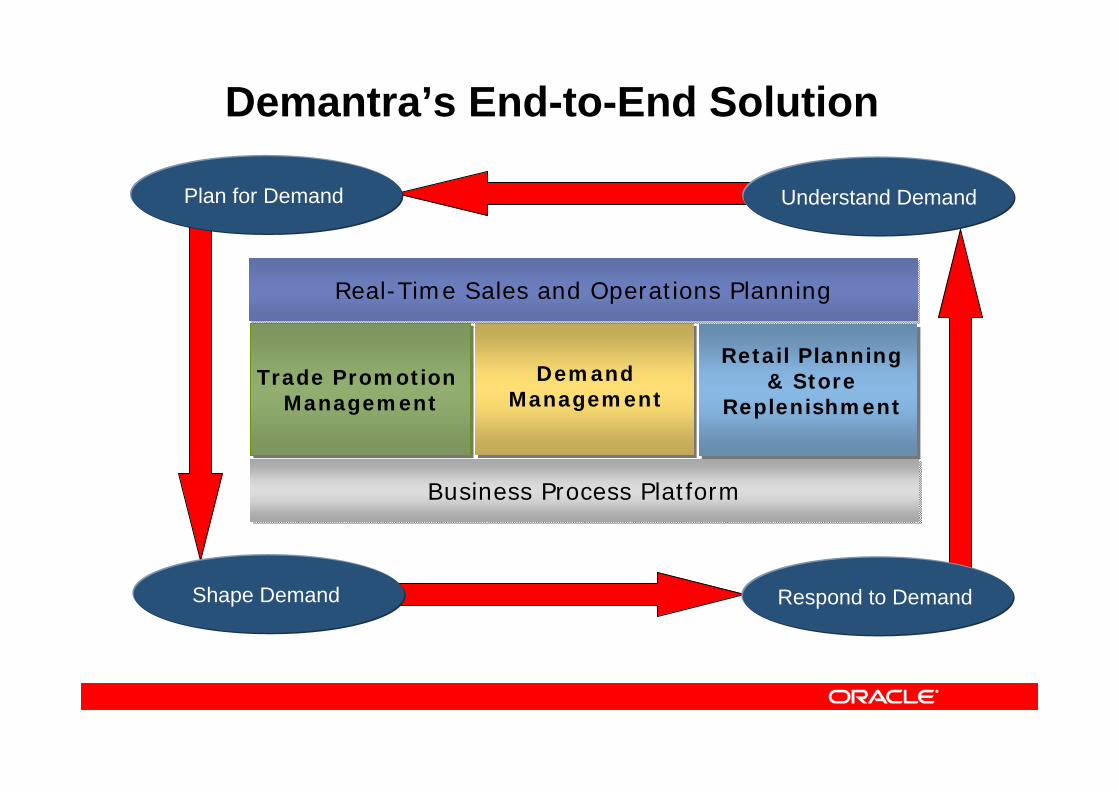
Shape Demand
Understand Demand
Respond to Demand
Plan for Demand
Retail Planning & Store
Replenishment
Demand Management
Trade Promotion Management
Trade Promotion Management
Real-Time Sales and Operations PlanningReal-Time Sales and Operations Planning
Business Process PlatformBusiness Process Platform
Demantra’s End-to-End Solution
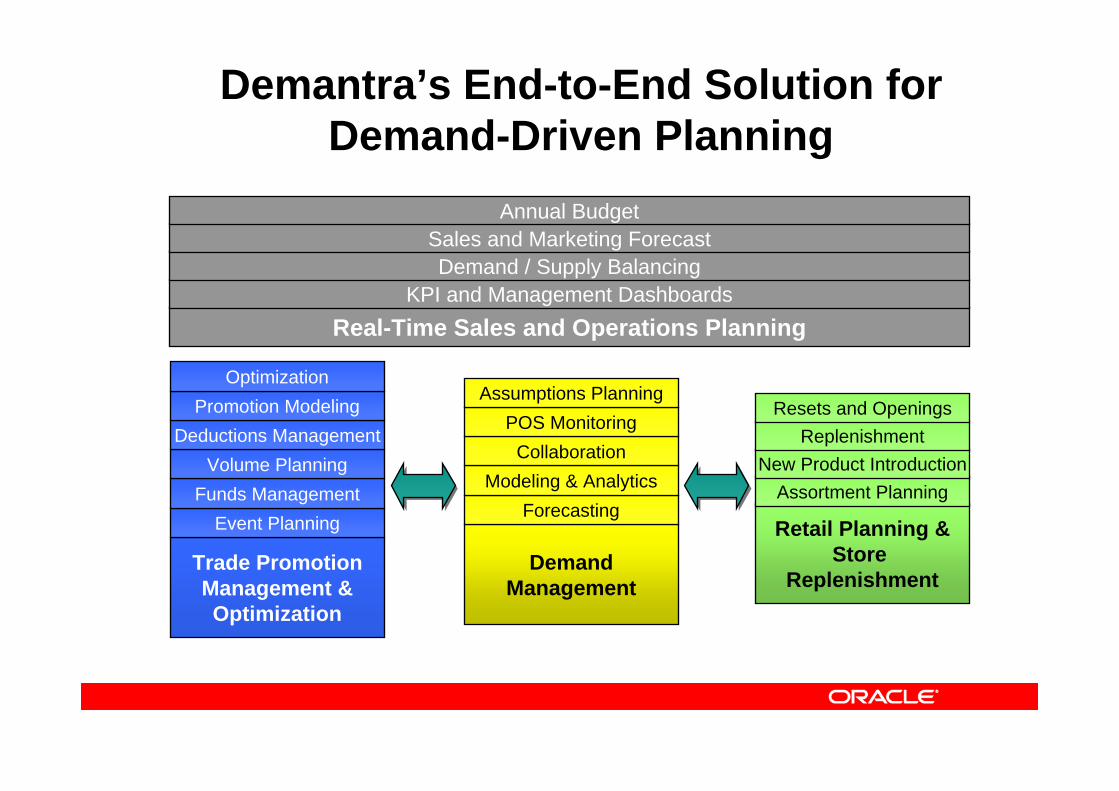
Demantra’s End-to-End Solution for Demand-Driven Planning
Real-Time Sales and Operations PlanningKPI and Management Dashboards
Demand / Supply BalancingSales and Marketing Forecast
Annual Budget
Trade PromotionManagement &Optimization
Event PlanningFunds Management
Volume PlanningDeductions Management
Promotion Modeling
DemandManagement
ForecastingModeling & Analytics
CollaborationPOS Monitoring
Assumptions Planning
Retail Planning &Store
Replenishment
Assortment PlanningNew Product Introduction
ReplenishmentResets and Openings
Optimization
Demand Management• Statistical Forecasting
• Bayesian-Markov Mixed Model Programming• Causal forecasting• ‘Out of box’ accuracy to the half-hourly bucket• Store level forecasting based on POS data
• Support for Multiple Demand Streams • Consensus Forecasting• High-volume Forecasting• Workflow, Alerts, and Exceptions• Multi-dimensional analysis, reports, and graphs• Flexible OLAP Worksheets
Demand Management Differentiators
• Manage at any level of time, product and location aggregation• New Product Introduction
• Supports product lifecycle management• Chaining capabilities to existing products
• Shape Modeling• Use comparable products demand shapes as input• Generate composite new shape and align to actual demand
• Attribute Based Forecasting• Analyze demand for a group of combined attributes• Uses business rules for product level modeling
• Assumption Planning• Supports qualitative forecasting• Current and past assumptions are modeled
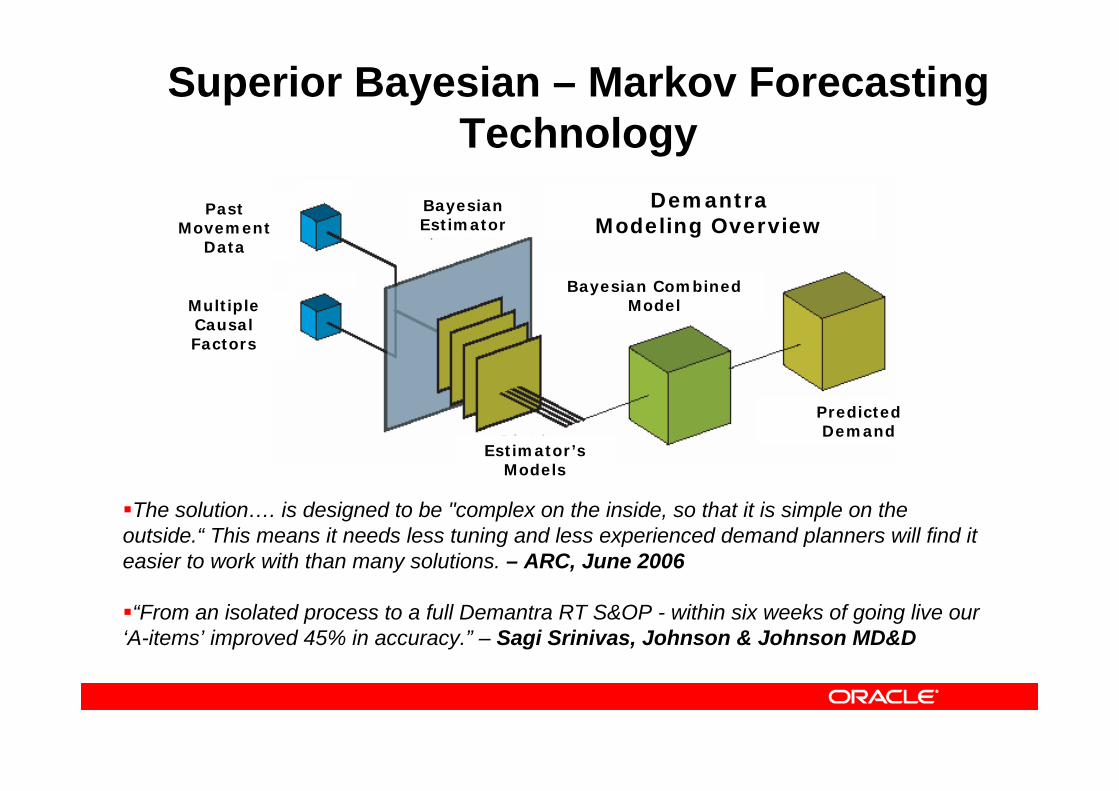
The solution…. is designed to be "complex on the inside, so that it is simple on the outside.“ This means it needs less tuning and less experienced demand planners will find it easier to work with than many solutions. – ARC, June 2006
“From an isolated process to a full Demantra RT S&OP - within six weeks of going live our ‘A-items’ improved 45% in accuracy.” – Sagi Srinivas, Johnson & Johnson MD&D
Past Movement
Data
Bayesian Estimator
Predicted Demand
Estimator’s Models
DemantraModeling Overview
Multiple Causal Factors
Bayesian Combined Model
Superior Bayesian – Markov ForecastingTechnology
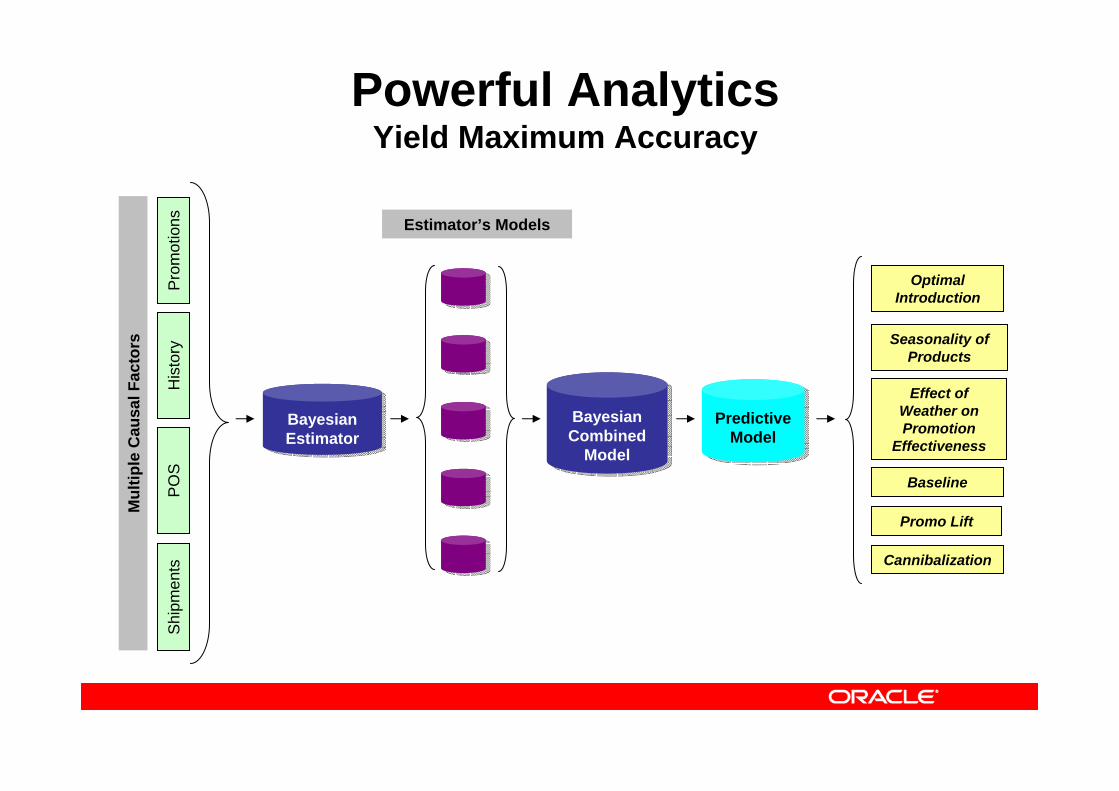
Powerful Analytics Yield Maximum Accuracy
Optimal Introduction
Seasonality of Products
Effect of Weather on Promotion
Effectiveness
Baseline
Promo Lift
Cannibalization
Mul
tiple
Cau
sal F
acto
rs
His
tory
PO
SP
rom
otio
nsSh
ipm
ents
Estimator’s Models
Bayesian Estimator
Bayesian Combined
Model
Predictive Model
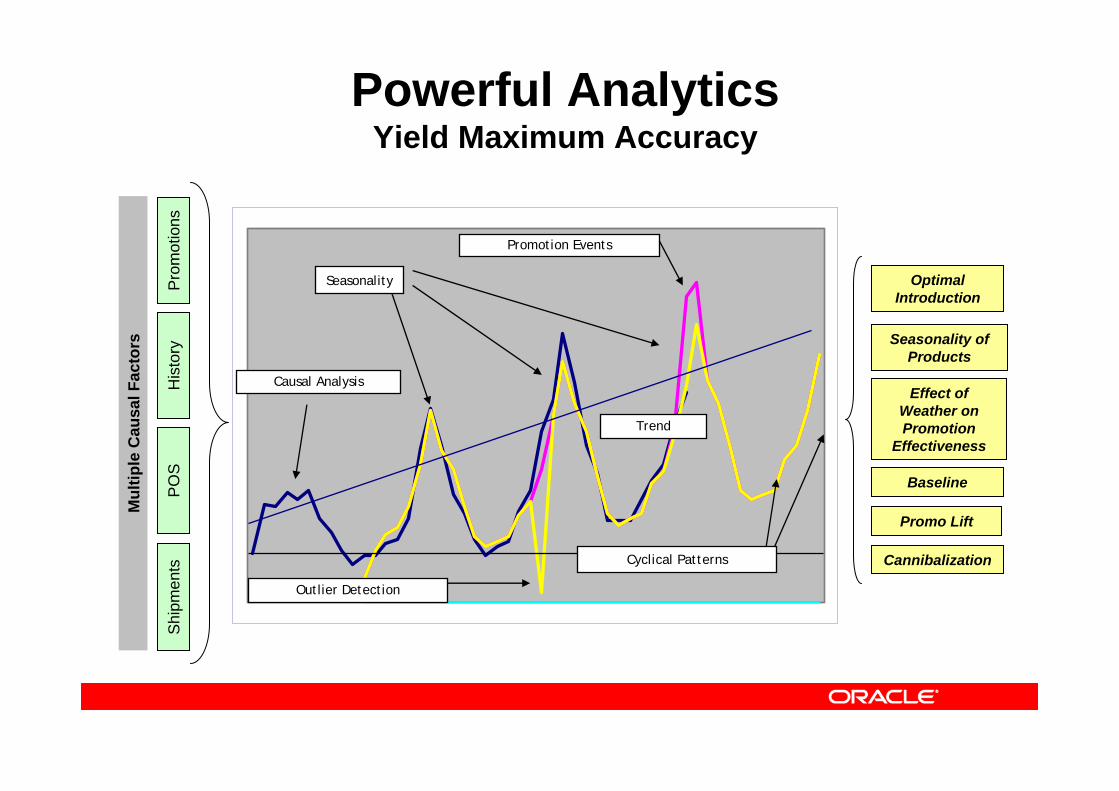
Causal Analysis
Outlier Detection
Promotion Events
Seasonality
Cyclical Patterns
Trend
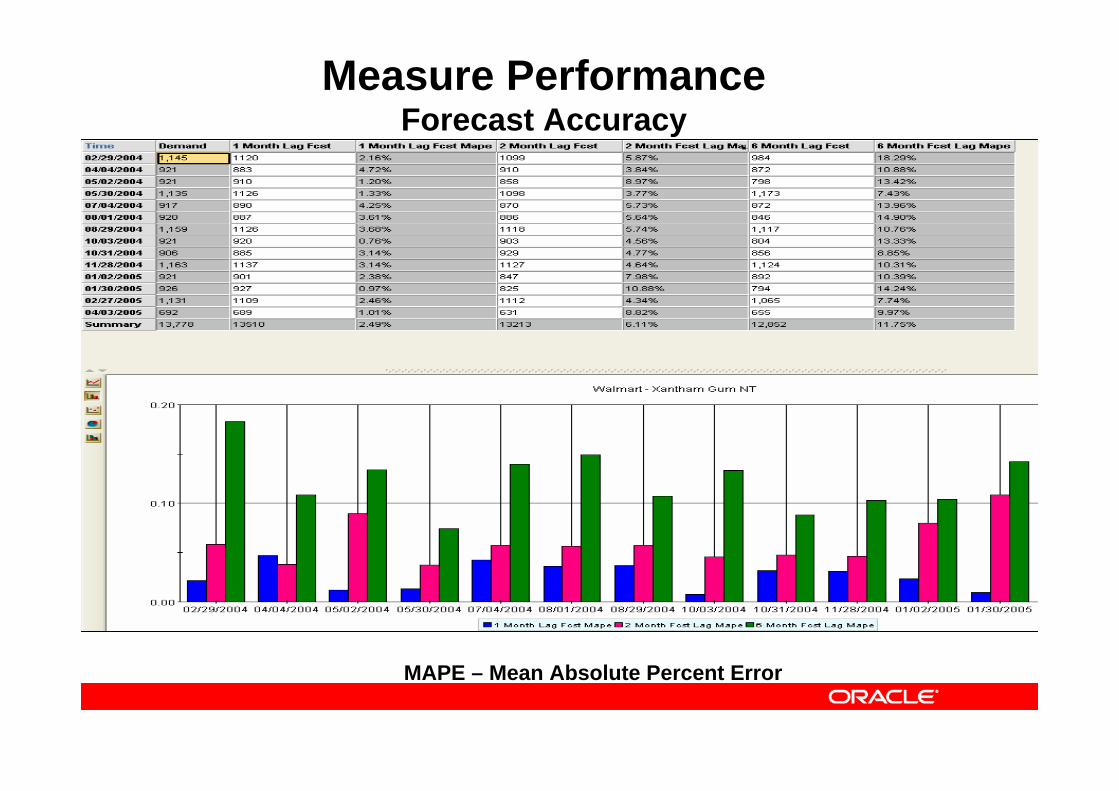
MAPE – Mean Absolute Percent Error
Measure Performance Forecast Accuracy
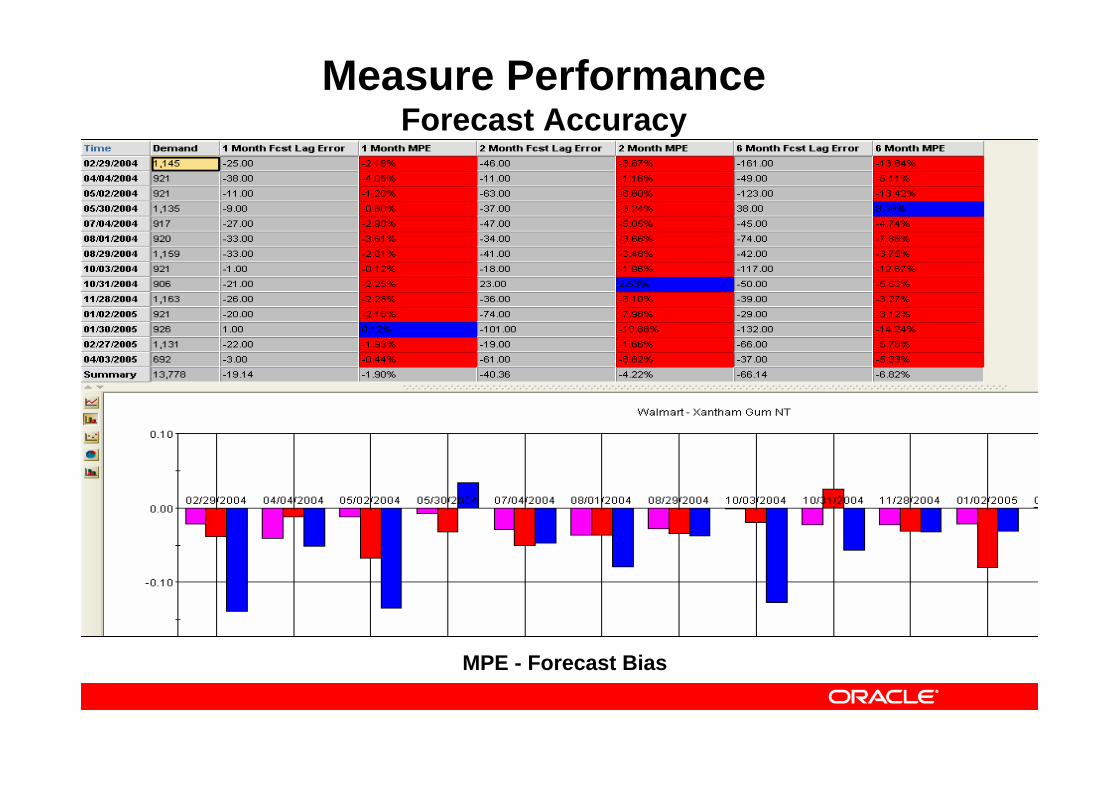
MPE - Forecast Bias
Measure Performance Forecast Accuracy
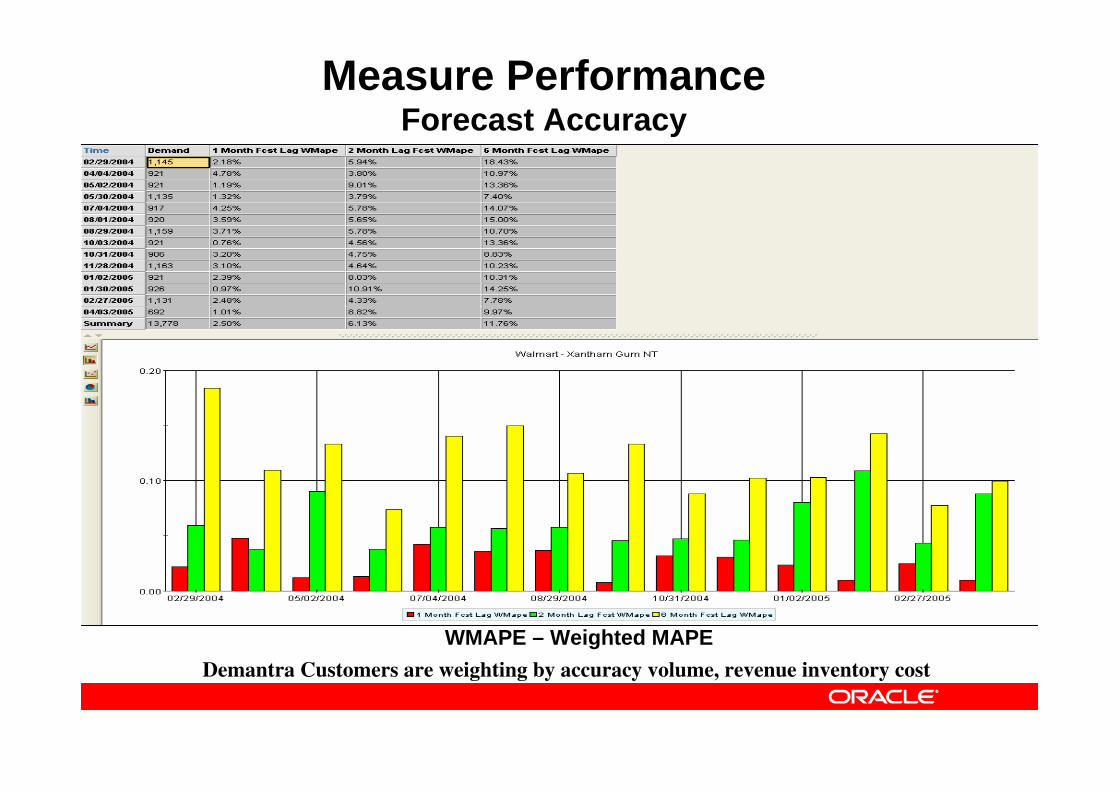
Measure Performance Forecast Accuracy
WMAPE – Weighted MAPEDemantra Customers are weighting by accuracy volume, revenue inventory cost
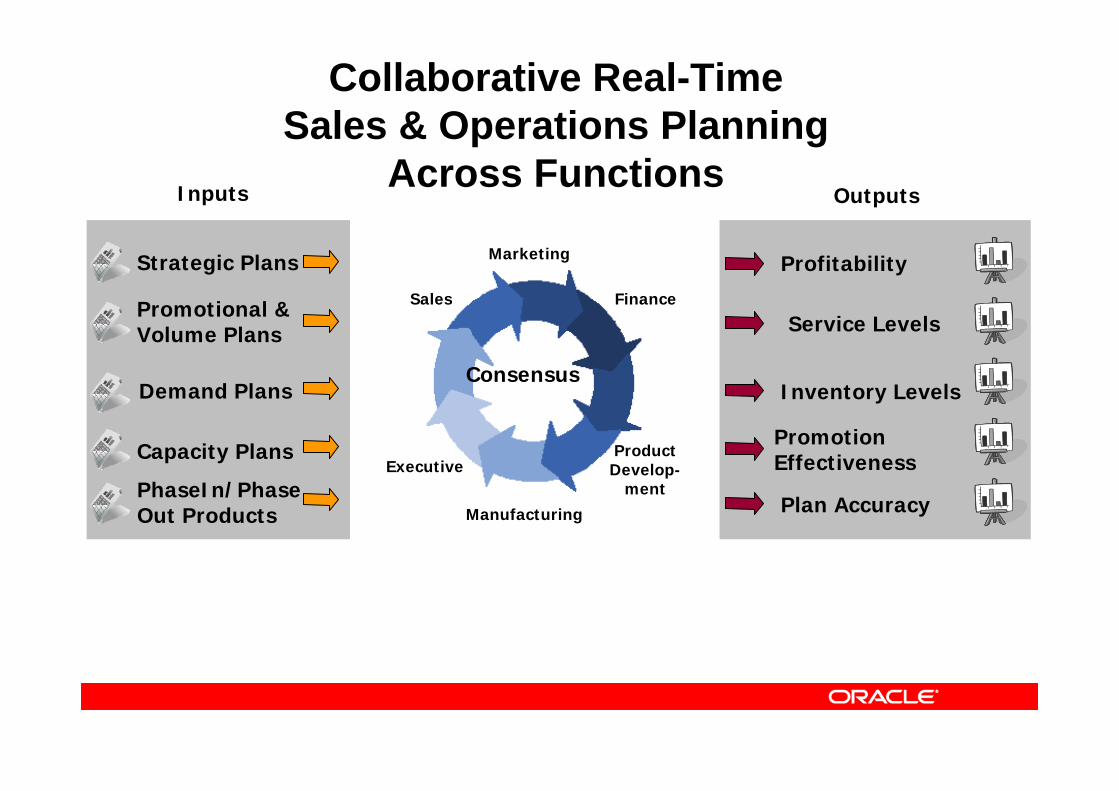
Collaborative Real-Time Sales & Operations Planning
Across Functions
Sales
Marketing
Manufacturing
Finance
ExecutiveProductDevelop-
ment
Consensus
Promotional & Volume Plans
Strategic Plans
Capacity Plans
PhaseIn/Phase Out Products
Demand Plans
Profitability
Service Levels
Inventory Levels
Promotion Effectiveness
Plan Accuracy
Inputs Outputs
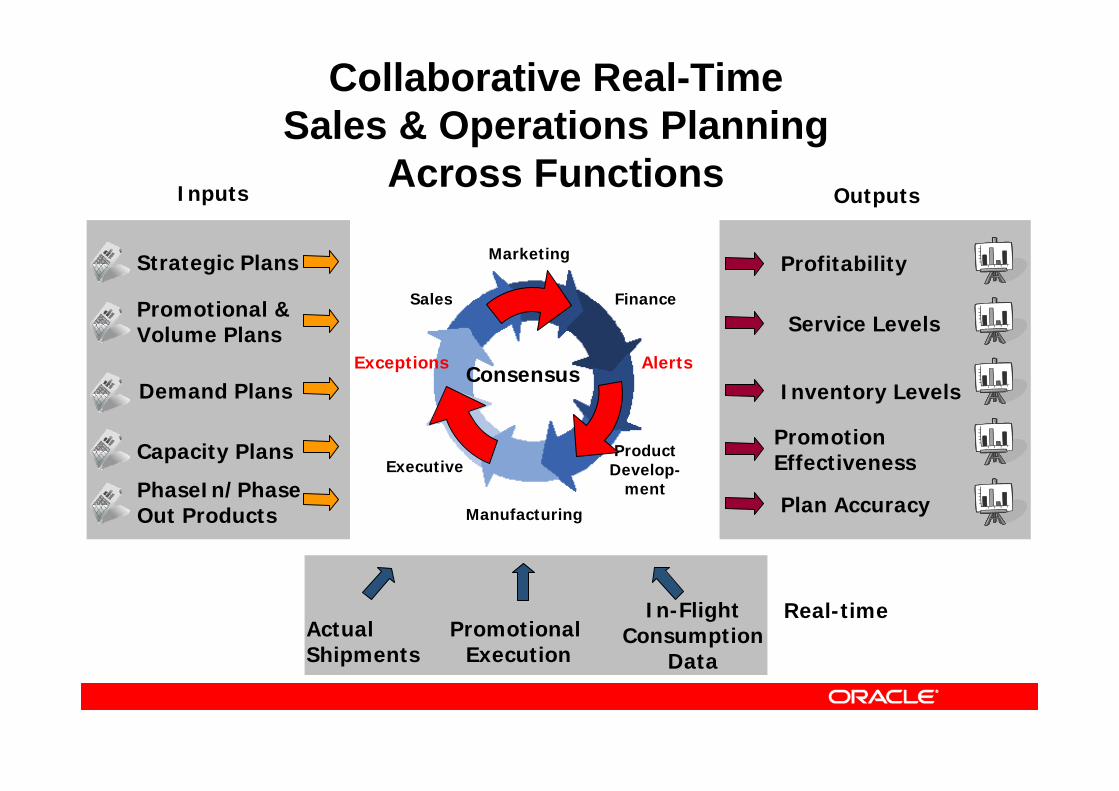
Actual Shipments
Promotional Execution
In-FlightConsumption
Data
Sales
Marketing
Manufacturing
Finance
ExecutiveProductDevelop-
ment
Consensus
Promotional & Volume Plans
Strategic Plans
Capacity Plans
PhaseIn/Phase Out Products
Demand Plans
Profitability
Service Levels
Inventory Levels
Promotion Effectiveness
Plan Accuracy
AlertsExceptions
Inputs Outputs
Collaborative Real-Time Sales & Operations Planning
Across Functions
Real-time
RT S&OP Collaborative Process
• Collaborative Process Enablers• Develop Baseline Forecast• Develop Consensus Plan• Introduce New Products• Manage Promotions • Manage Replenishment• Measure Performance
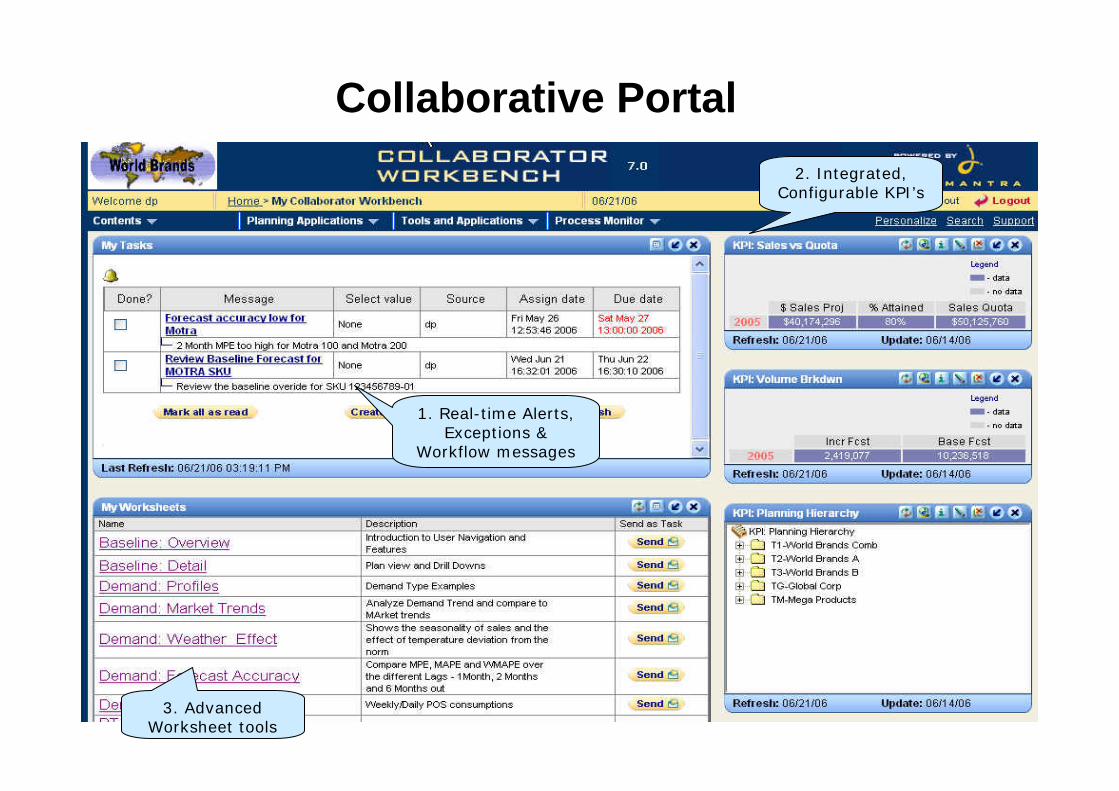
Collaborative Portal2. Integrated,
Configurable KPI’s
1. Real-time Alerts, Exceptions &
Workflow messages
3. Advanced Worksheet tools
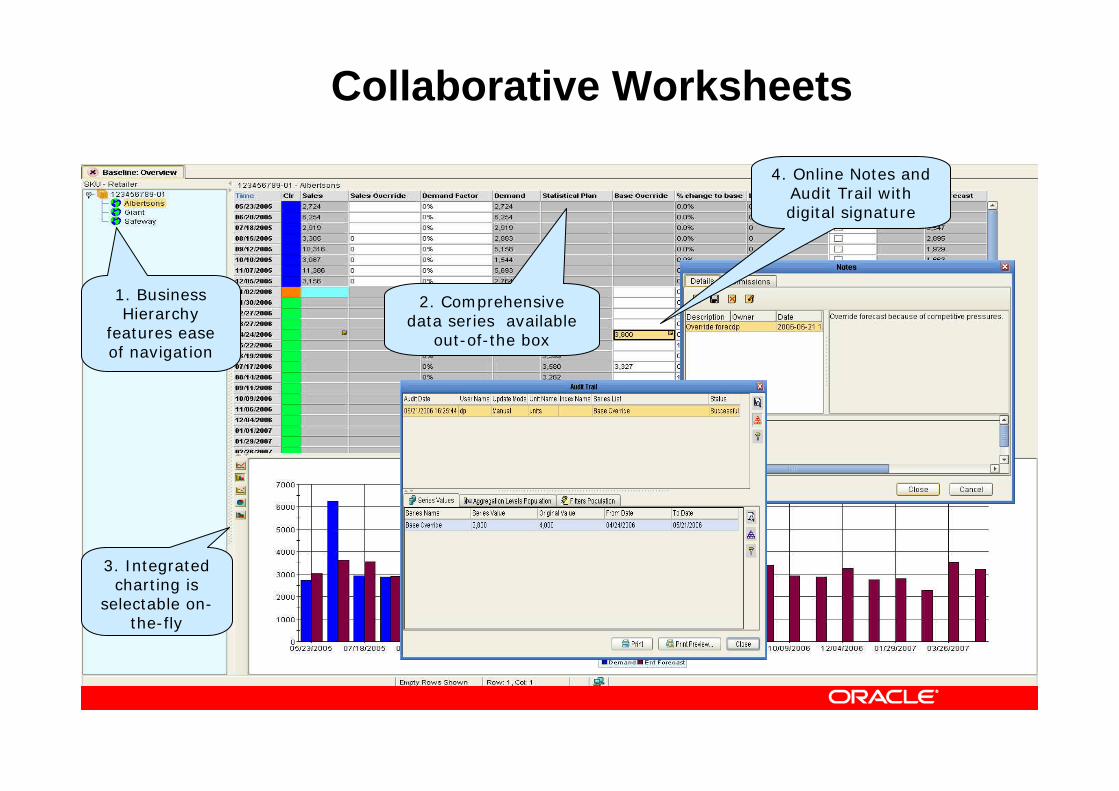
Collaborative Worksheets
1. Business Hierarchy
features ease of navigation
2. Comprehensive data series available
out-of-the box
3. Integrated charting is
selectable on-the-fly
4. Online Notes and Audit Trail with digital signature
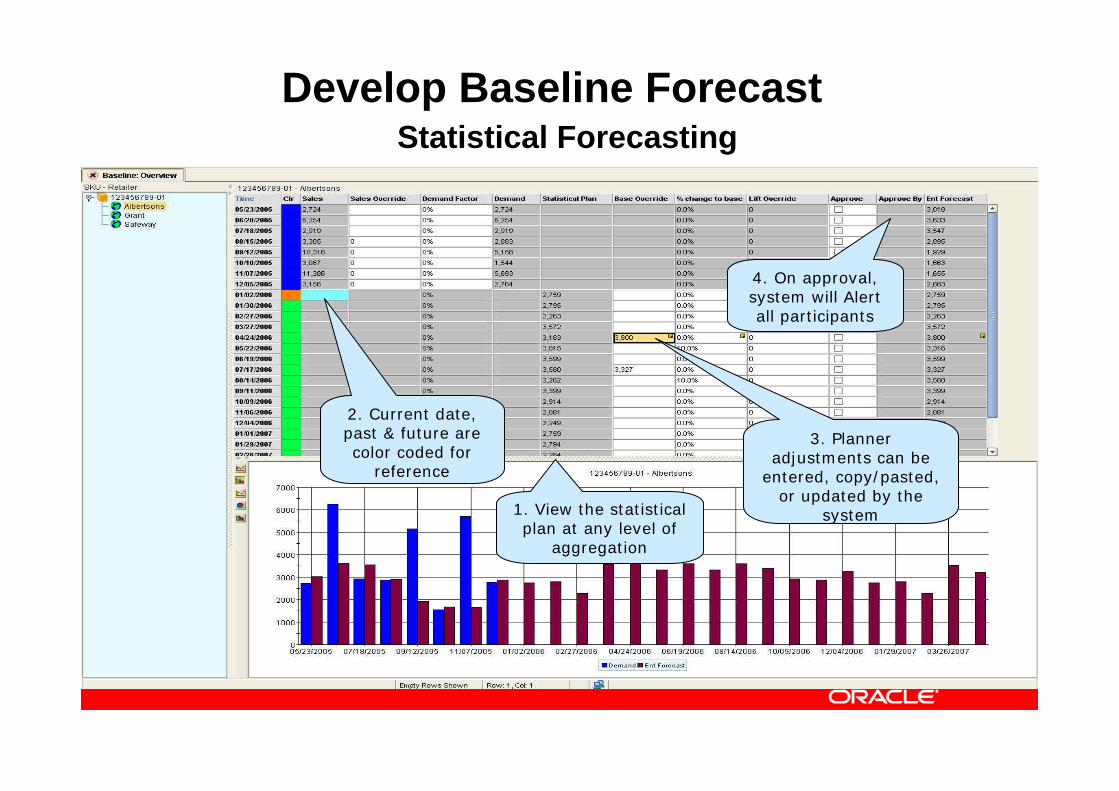
Develop Baseline ForecastStatistical Forecasting
2. Current date, past & future are color coded for
reference
1. View the statistical plan at any level of
aggregation
3. Planner adjustments can be
entered, copy/pasted, or updated by the
system
4. On approval, system will Alert all participants
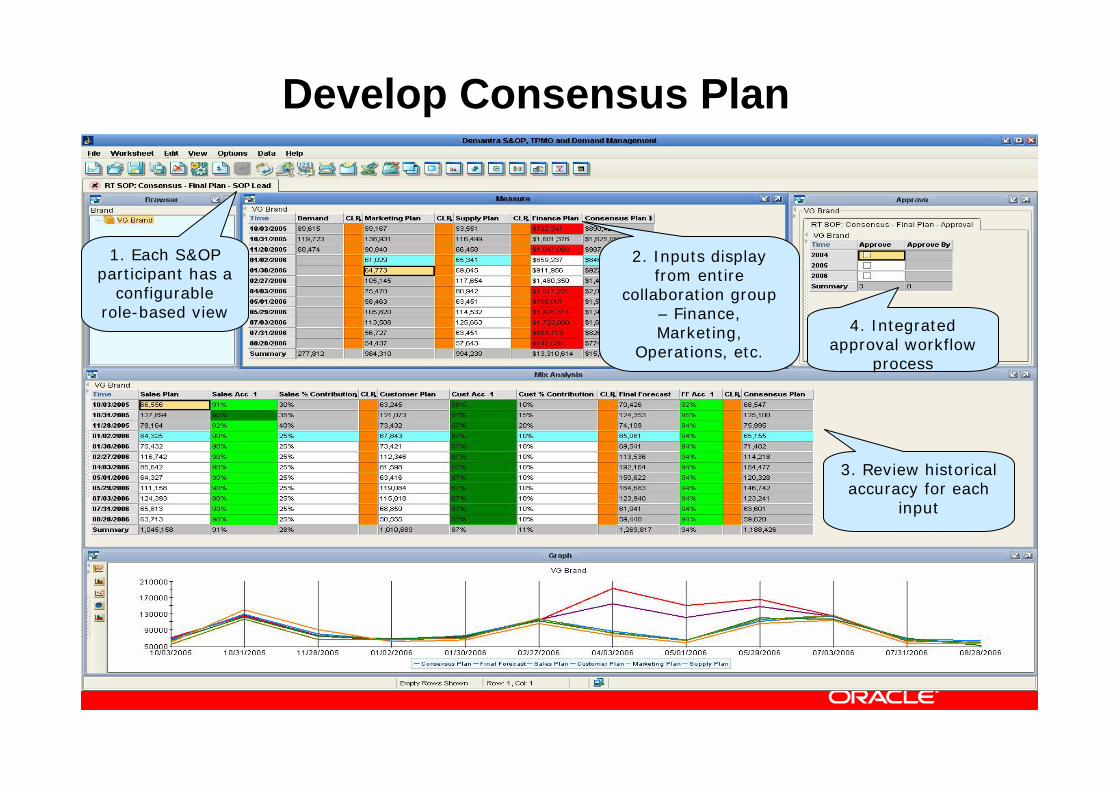
Develop Consensus Plan
2. Inputs display from entire
collaboration group – Finance, Marketing,
Operations, etc.
4. Integrated approval workflow
process
1. Each S&OP participant has a
configurable role-based view
3. Review historical accuracy for each
input
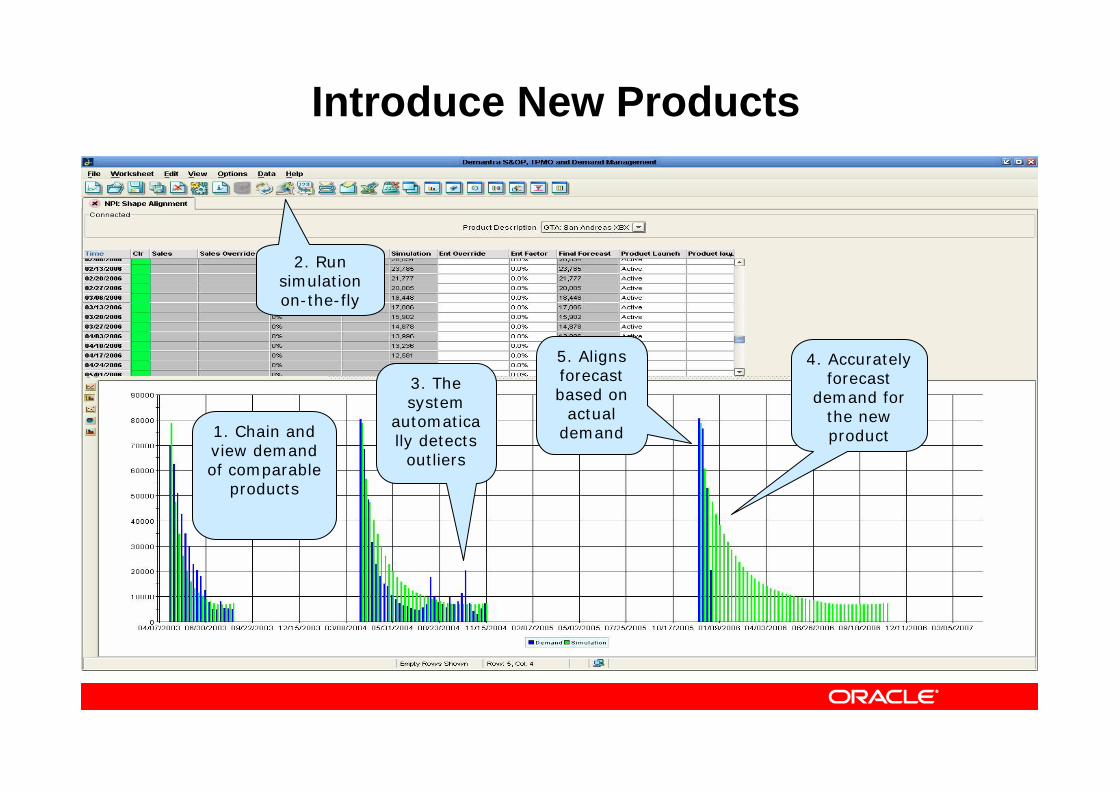
Introduce New Products
1. Chain and view demand of comparable
products
2. Run simulation on-the-fly
4. Accurately forecast
demand for the new product
5. Aligns forecast based on
actual demand
3. The system
automatically detects
outliers
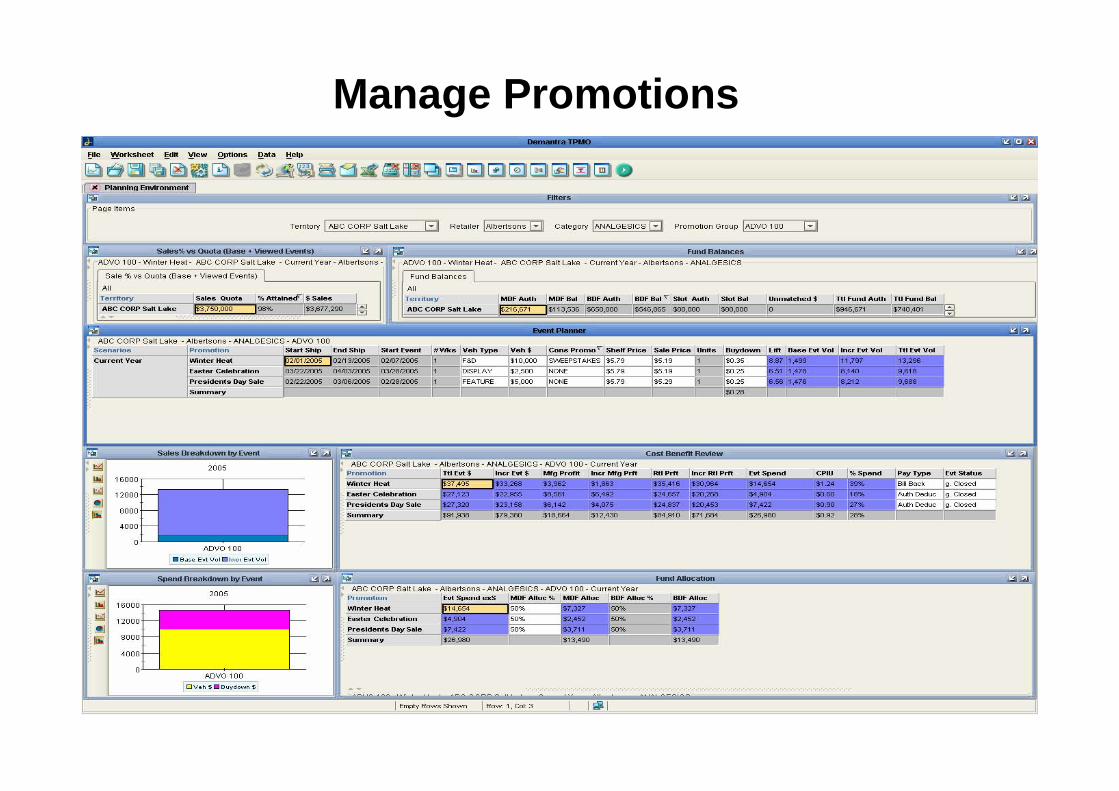
Manage Promotions
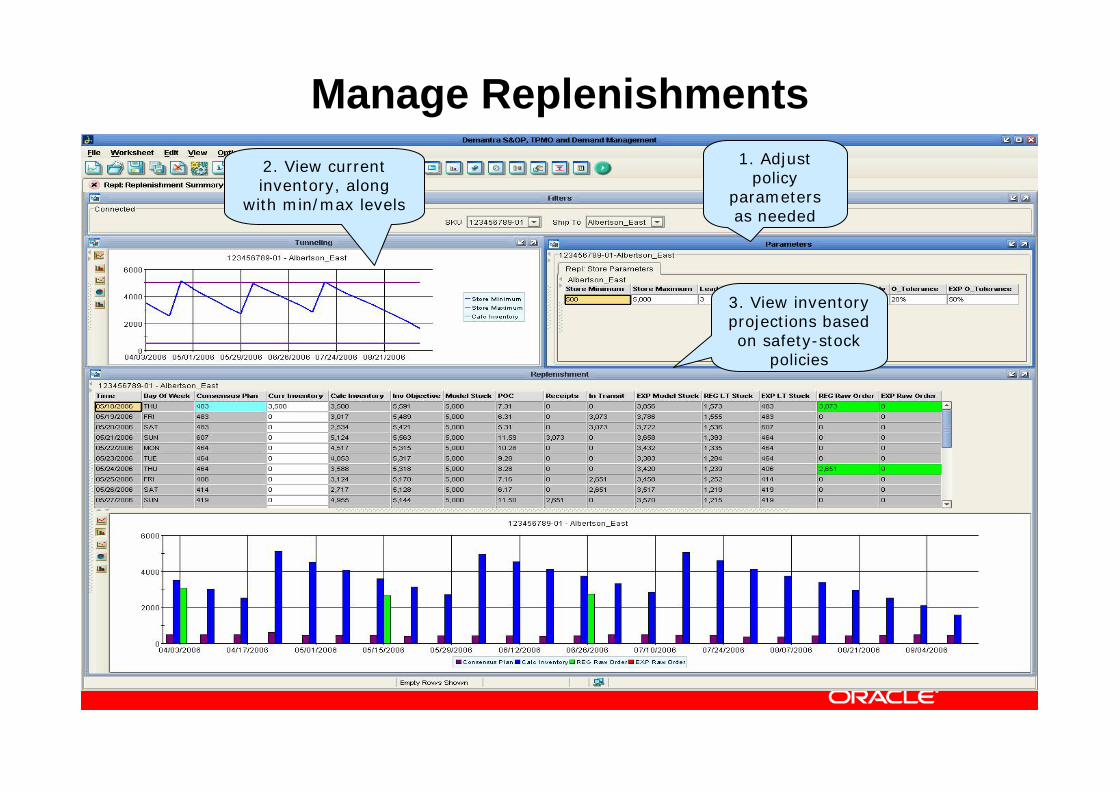
Manage Replenishments2. View current inventory, along
with min/max levels
1. Adjust policy
parameters as needed
3. View inventory projections based on safety-stock
policies
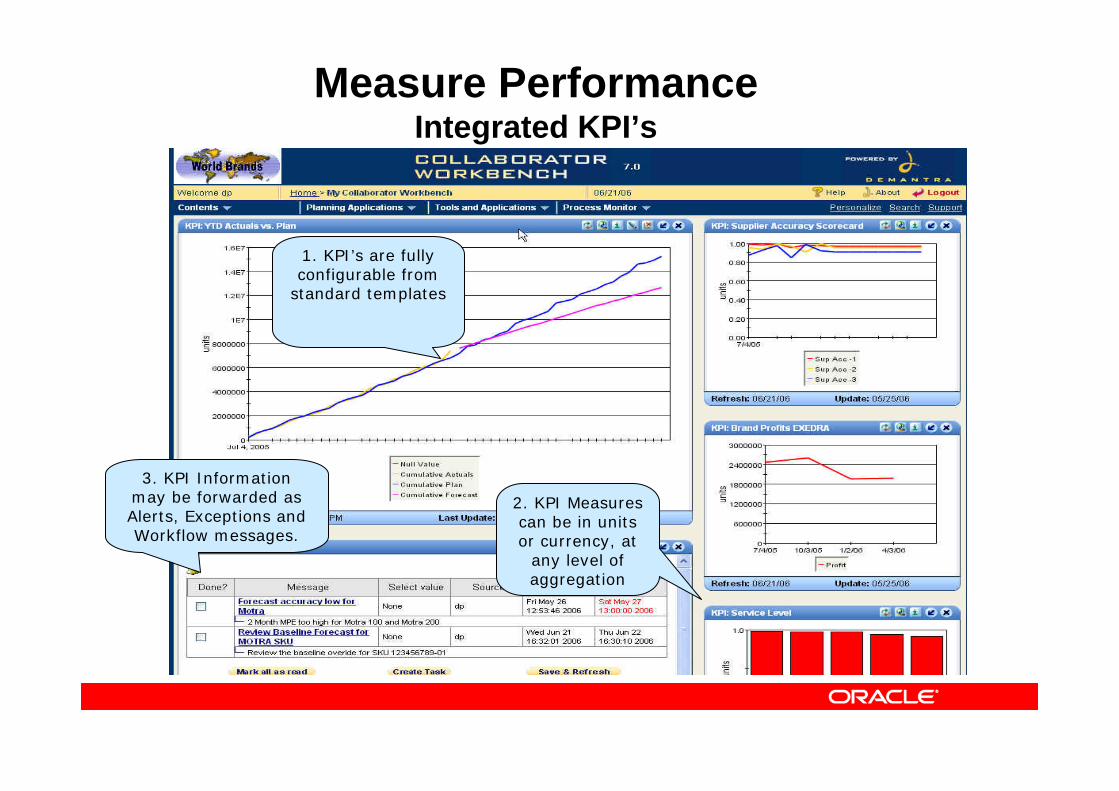
Measure PerformanceIntegrated KPI’s
1. KPI’s are fully configurable from
standard templates
2. KPI Measures can be in units or currency, at
any level of aggregation
3. KPI Information may be forwarded as Alerts, Exceptions and Workflow messages.
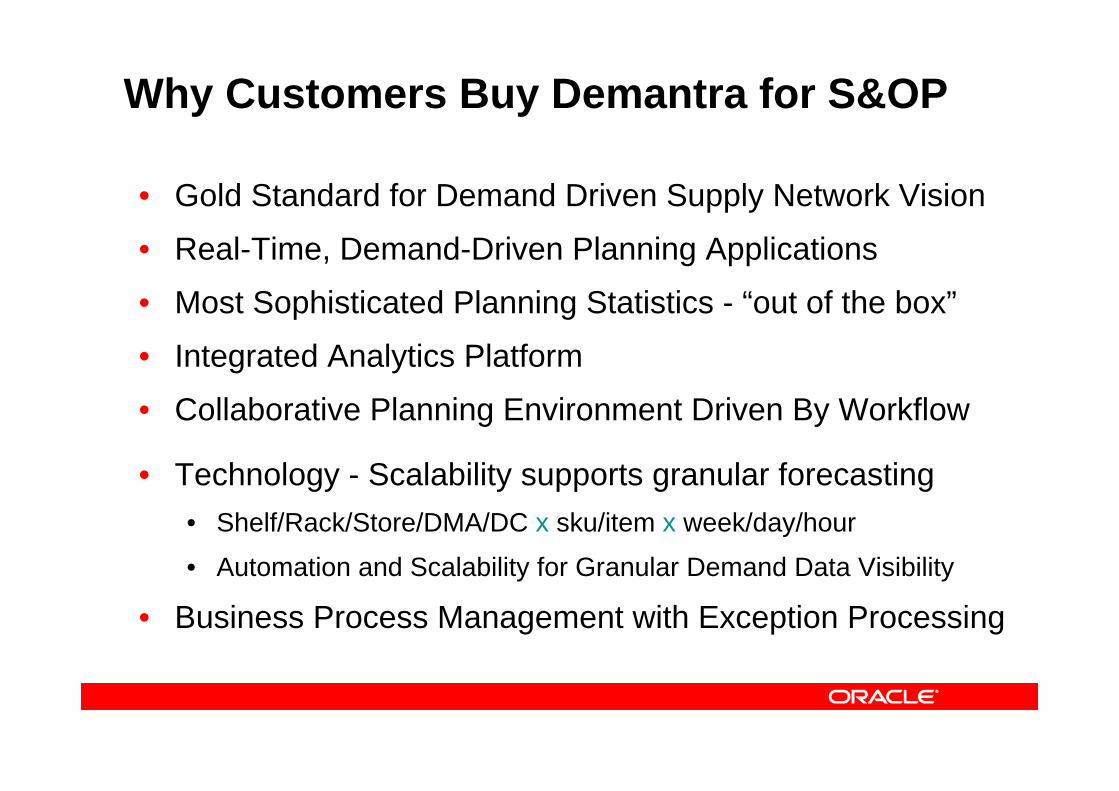
Why Customers Buy Demantra for S&OP
• Gold Standard for Demand Driven Supply Network Vision
• Real-Time, Demand-Driven Planning Applications
• Most Sophisticated Planning Statistics - “out of the box”
• Integrated Analytics Platform
• Collaborative Planning Environment Driven By Workflow
• Technology - Scalability supports granular forecasting• Shelf/Rack/Store/DMA/DC x sku/item x week/day/hour
• Automation and Scalability for Granular Demand Data Visibility
• Business Process Management with Exception Processing
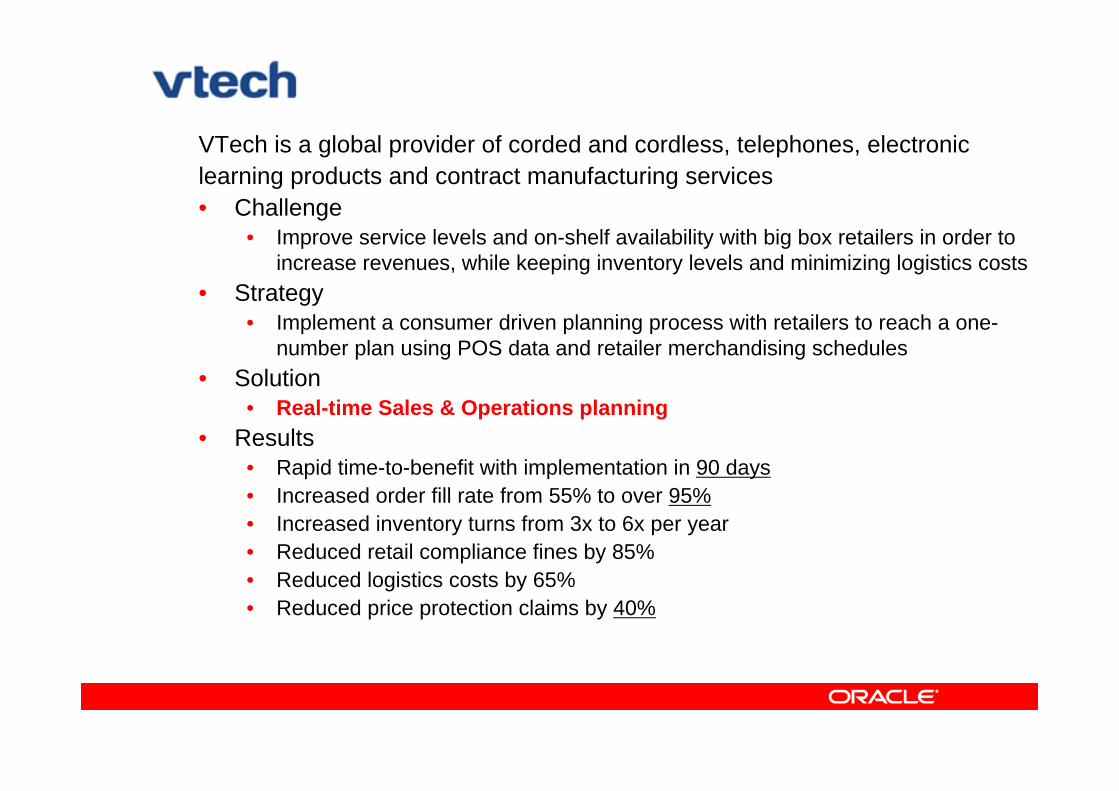
VTech is a global provider of corded and cordless, telephones, electroniclearning products and contract manufacturing services• Challenge
• Improve service levels and on-shelf availability with big box retailers in order to increase revenues, while keeping inventory levels and minimizing logistics costs
• Strategy• Implement a consumer driven planning process with retailers to reach a one-
number plan using POS data and retailer merchandising schedules • Solution
• Real-time Sales & Operations planning• Results
• Rapid time-to-benefit with implementation in 90 days• Increased order fill rate from 55% to over 95%• Increased inventory turns from 3x to 6x per year • Reduced retail compliance fines by 85% • Reduced logistics costs by 65% • Reduced price protection claims by 40%
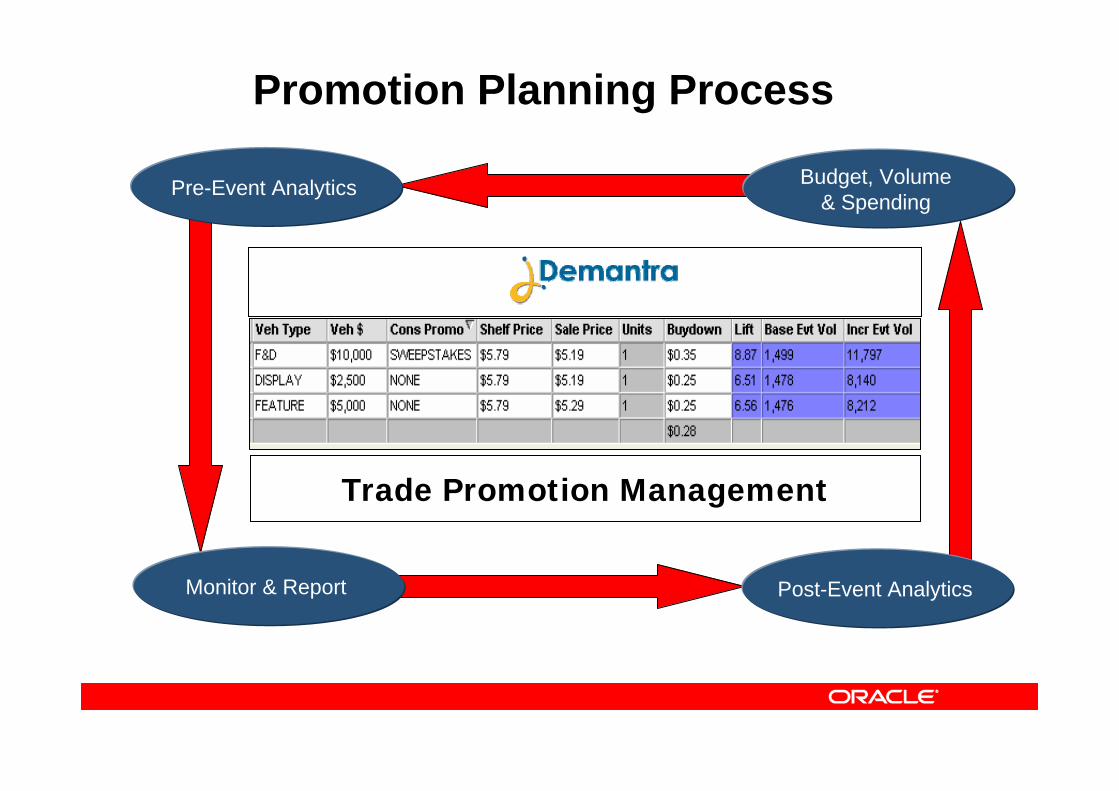
Monitor & Report
Budget, Volume & Spending
Post-Event Analytics
Promotion Planning Process
Pre-Event Analytics
Trade Promotion Management
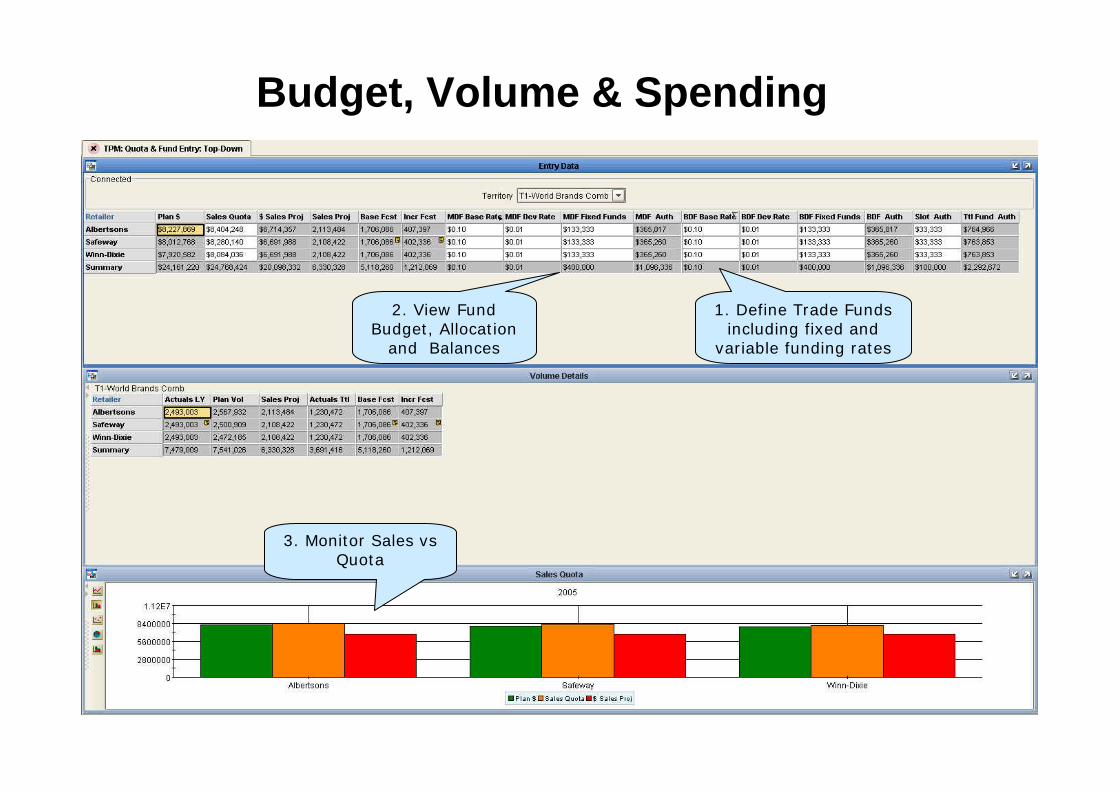
1. Define Trade Funds including fixed and
variable funding rates
2. View Fund Budget, Allocation
and Balances
3. Monitor Sales vsQuota
Screenshot
Budget, Volume & Spending
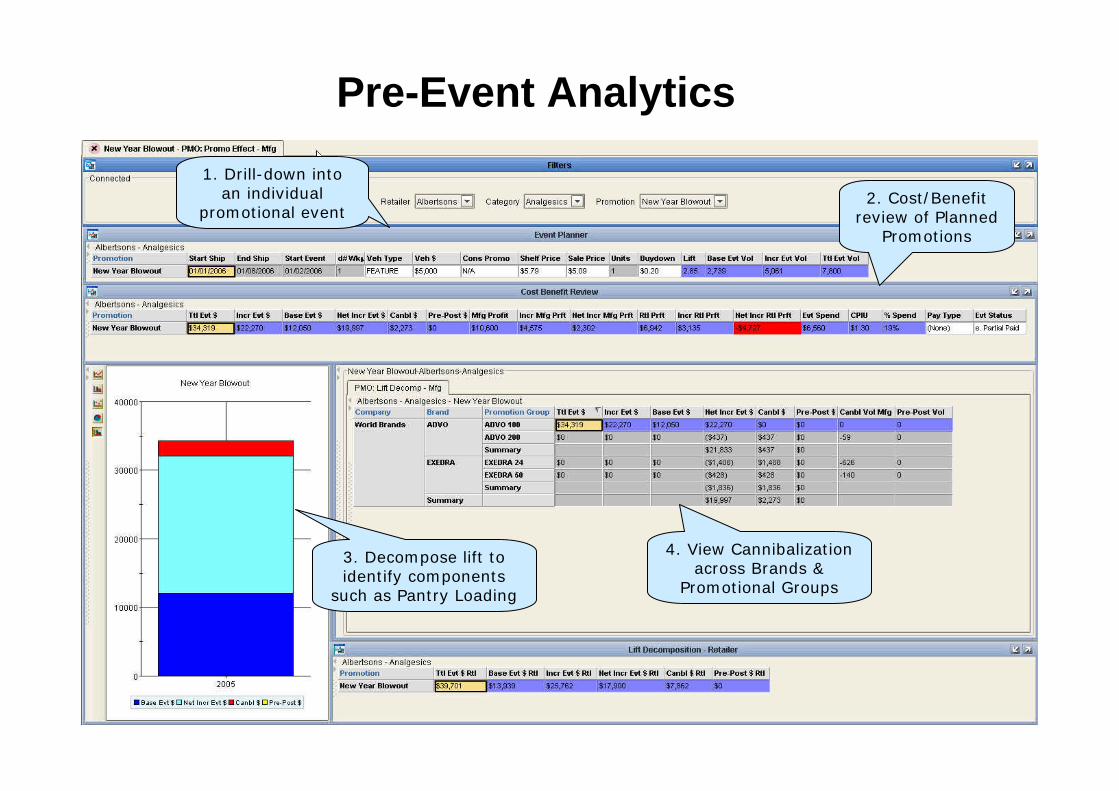
4. View Cannibalization across Brands &
Promotional Groups
2. Cost/Benefit review of Planned
Promotions
1. Drill-down into an individual
promotional event
3. Decompose lift to identify components
such as Pantry Loading
Screenshot
Pre-Event Analytics
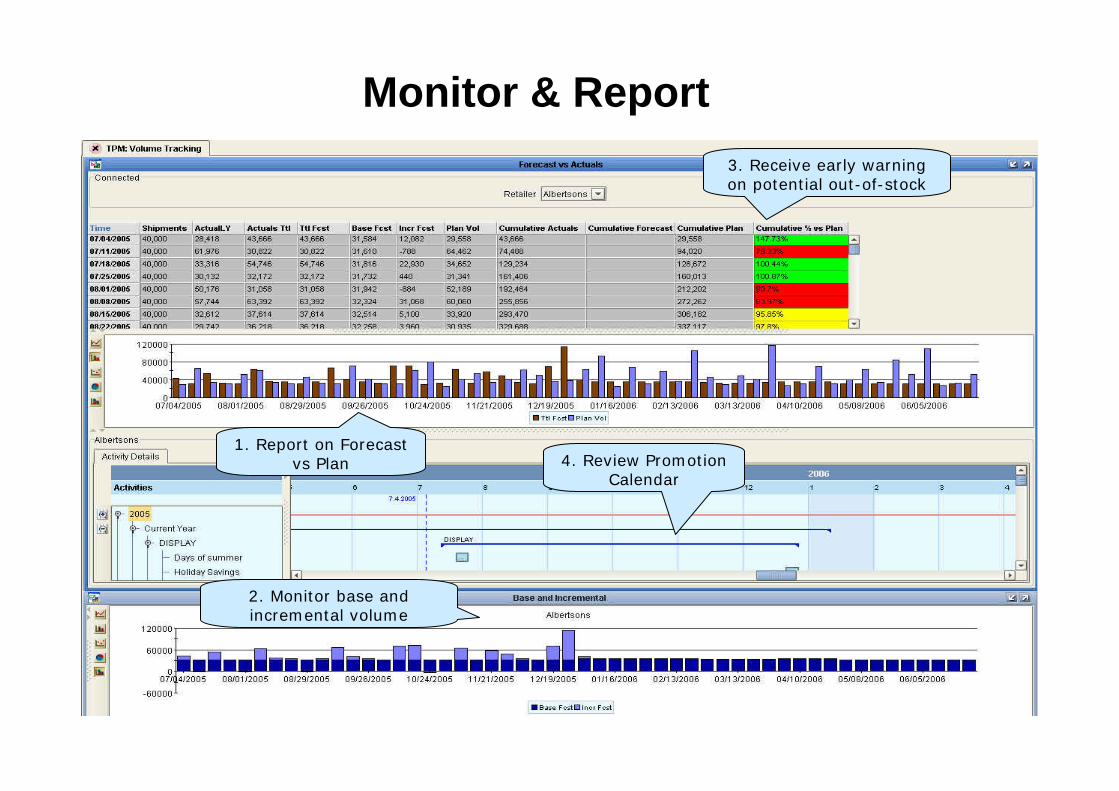
2. Monitor base and incremental volume
1. Report on Forecast vs Plan
3. Receive early warning on potential out-of-stock
4. Review Promotion Calendar
Screenshot
Monitor & Report
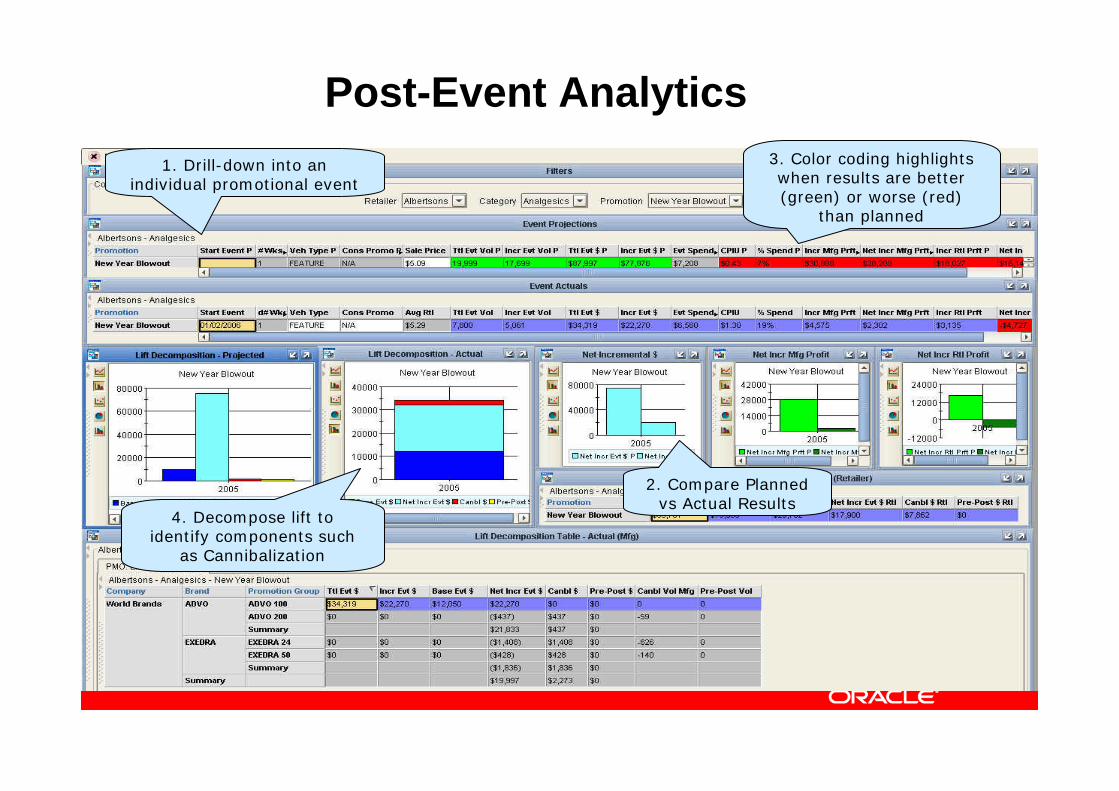
3. Color coding highlights when results are better (green) or worse (red)
than planned
1. Drill-down into an individual promotional event
4. Decompose lift to identify components such
as Cannibalization
2. Compare Planned vs Actual Results
Screenshot
Post-Event Analytics
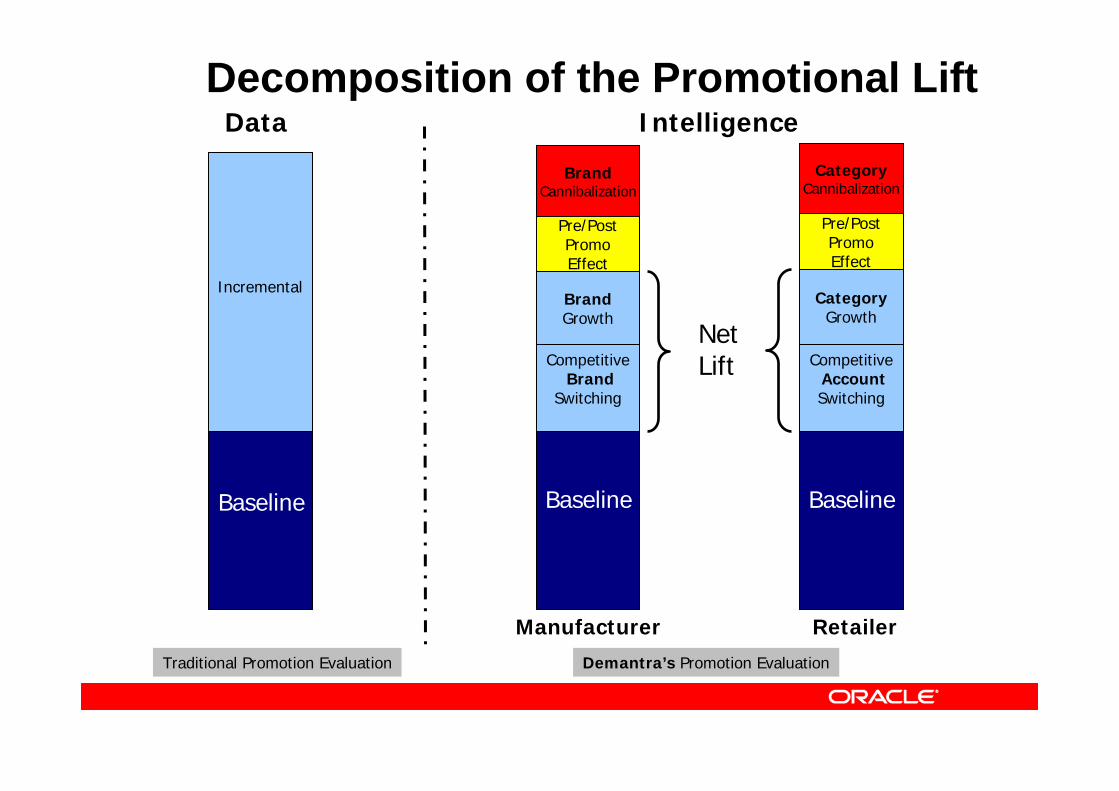
Baseline
Manufacturer Retailer
Incremental
CompetitiveBrand
Switching
BrandGrowth
Pre/PostPromoEffect
BrandCannibalization
Baseline
CompetitiveAccountSwitching
CategoryGrowth
Pre/PostPromoEffect
Baseline
NetLift
Data Intelligence
Traditional Promotion Evaluation
CategoryCannibalization
Demantra’s Promotion Evaluation
Decomposition of the Promotional Lift
Why Customers Buy Demantra for Trade Promotion Management
• Improve the efficiency and effectiveness of their trade dollars• Increase their promotional impact without increasing their trade budget
• Reduce their trade budget while maintaining the same level of promotional impact
• Predict the impact of future promotions• Base and Incremental Volume
• Cost, Profitability, and ROI
• Optimize promotions based on • Goals - profit, revenue, units and constraints - budget, timing, retail margin
• Calculate the true “Net Lift” of a promotion by identifying cannibalization and pantry loading
• Collaborative solution that can be extended to additional functional areas both internally (sales, marketing, finance,…) and externally (brokers, distributors, retail partners,…)
Customer: Welch’s• Welch’s is the world’s leading processor and marketer of grape-based products• Challenge
• Manage, analyze and understand the effectiveness of the thousands of trade promotions that run annually
• Improve sales force productivity• Analyze risks with respect to spending, revenues and profits
• Strategy• Integrate trade promotion management, demand planning and promotion
analytics to provide an accurate one-number plan across the company• Automate trade promotion management and sales planning to increase sales
force productivity, increase promotion ROI, and drive supply chain efficiencies• Solution
• Demand management, Trade Promotion Planning and Optimization• Results
• One-number Plan, with increased SKU-level accuracy• Overall reduction in trade spending• Significant savings in supply chain costs• Productivity improvements in headquarter sales, field sales and broker sales force
• Database - Oracle 9i, Oracle 10G, MS SQL Server 2000, MS SQL Server 2005
• Application Server - Websphere, Weblogic, IAS, Jrun, Apache, Tomcat
• Platforms - AIX 5.2L or 5.3L, Solaris 9, Windows 2000 or 2003• HP and Linux under testing
• Net Weaver Certified
Demantra Infrastructure
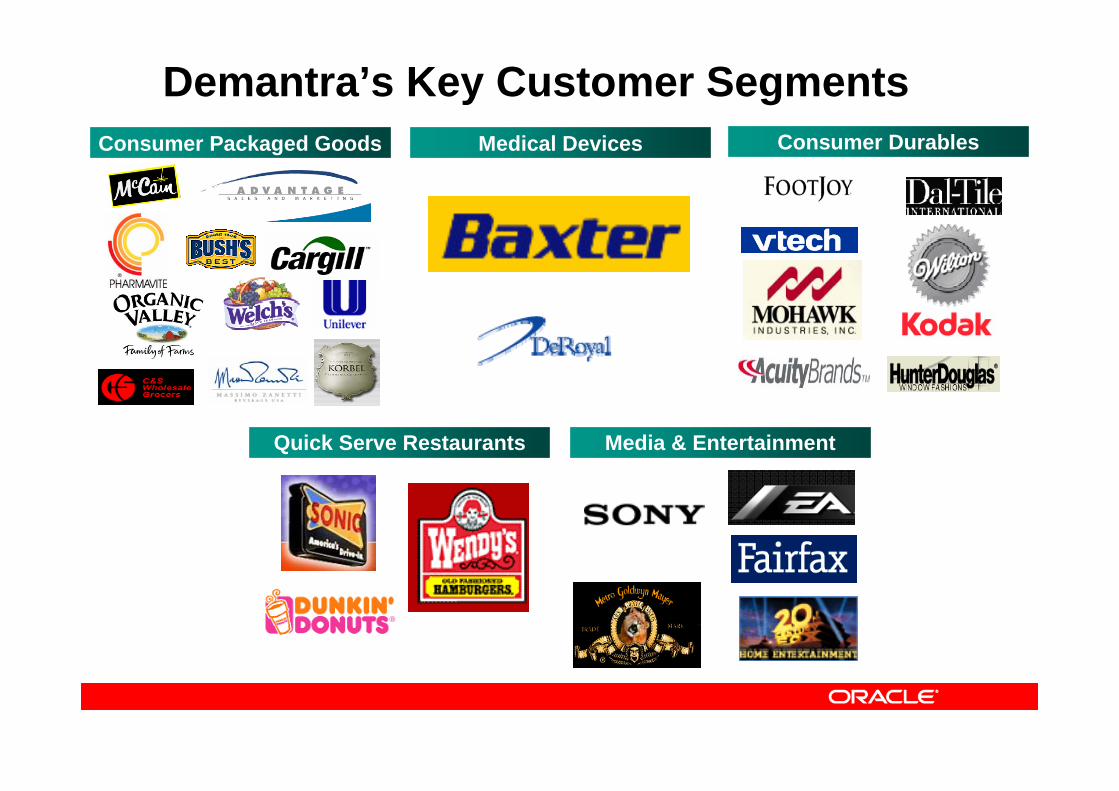
Medical Devices
Media & Entertainment
Consumer Packaged Goods
Quick Serve Restaurants
Consumer Durables
Demantra’s Key Customer Segments
“Six months after implementing Demantra Real Time S&OP we have seen a dramatic increase in forecast accuracy. This resulted in an immediate 20% inventory reduction.” – Wendy Malloy, Wilton Industries
What do Customers Say
“From an isolated process to a full Demantra RT S&OP - within six weeks of going live our ‘A-items’ improved 45% in accuracy. Today we load daily bookings against the forecasted Plan and feed production management to align back-end production based on the true feed of real-time demand.” –Sagi Srinivas, Johnson & Johnson MD&D
Global Medical Devices & Diagnostics Group• The Company is the world’s most comprehensive and broadly based
manufacturer of health care products, as well as a provider of related services, for the consumer, pharmaceutical, and medical devices and diagnostics markets.
• Challenge• MD&D Supply Chains become highly-reliable, effective, efficient and
synchronized to global product consumption • Strategy
• Implement global customer demand-driven planning processes to support Demand Planning, Supply Planning and Manufacturing at multiple World-Wide Franchises and Regional Order Processing / Distribution.
• Solution• Demand management
• Results• WW Franchises implemented• Reduced inventory days of supply• Reduced receivable days outstanding• Forecast accuracy levels increased dramatically• Customer service levels increased
Fairfax is Australia’s and New Zealand’s largest publishing group (Sydney Morning Herald, The Sun-Herald, The Age,…)
• Challenge• Improve demand forecasting (at the kiosk-rack level)• Improve supply allocation• Reduce waste levels and stock-outs
• Value• Scalable forecasting at the most granular level• Effective management of a perishable product (short shelf
life)• More frequent calculation of outlet supply quantities
• Solution• Real-time Sales & Operations Planning, Demand
Planning


![[전문가 발표] 로.열.모. (김홍석 박사)](https://img.pdfslide.tips/doc/110x75/55d1321bbb61ebbe5f8b4739/-55d1321bbb61ebbe5f8b4739.jpg)


![[BLT] 사물인터넷 전문가 좌담회 지식재산정책 제26호_한국지식재산연구원](https://img.pdfslide.tips/doc/110x75/58ab41d61a28ab61758b4d07/blt-26.jpg)