Embed Size (px)
Citation preview
TPCC
Taiwan Prosperity Chemical Corporation
2Q/2013
Investors’ Conference
September 3, 2013
TPCC 2
Disclaimer
The forward-looking statements contained in this presentation are
subject to risks and uncertainties and actual results may differ
materially from those expressed or implied in these forward-looking
statements.
Taiwan Prosperity Chemical Corporation makes no representation or
warranty as to the accuracy or completeness of these forward-looking
statements and nor does Taiwan Prosperity Chemical Corporation
undertake any obligation to update any forward-looking statements,
whether as a result of new information or future events.
TPCC
Agenda
• Company Snapshot
• 2Q/2013 Financial Results
• Business Overview
• Capital Expenditure
• 2H/2013 Business Outlook
3
TPCC 4
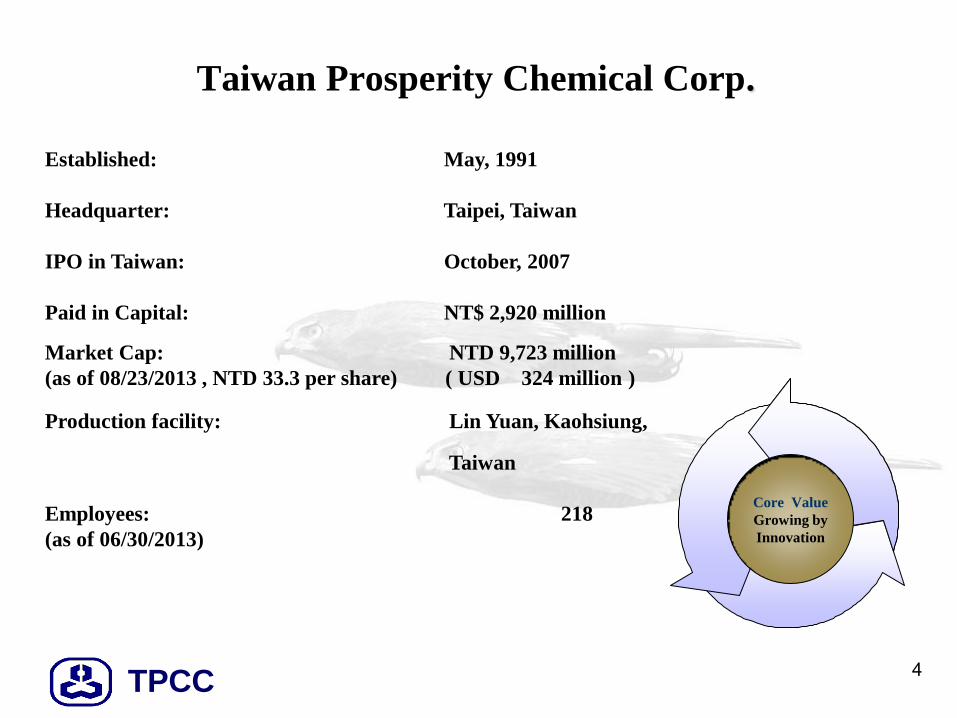
Taiwan Prosperity Chemical Corp.
Core Value
Growing by
Innovation
Established: May, 1991
Headquarter: Taipei, Taiwan
IPO in Taiwan: October, 2007
Paid in Capital: NT$ 2,920 million
Market Cap: NTD 9,723 million
(as of 08/23/2013 , NTD 33.3 per share) ( USD 324 million )
Production facility: Lin Yuan, Kaohsiung,
Taiwan
Employees: 218
(as of 06/30/2013)
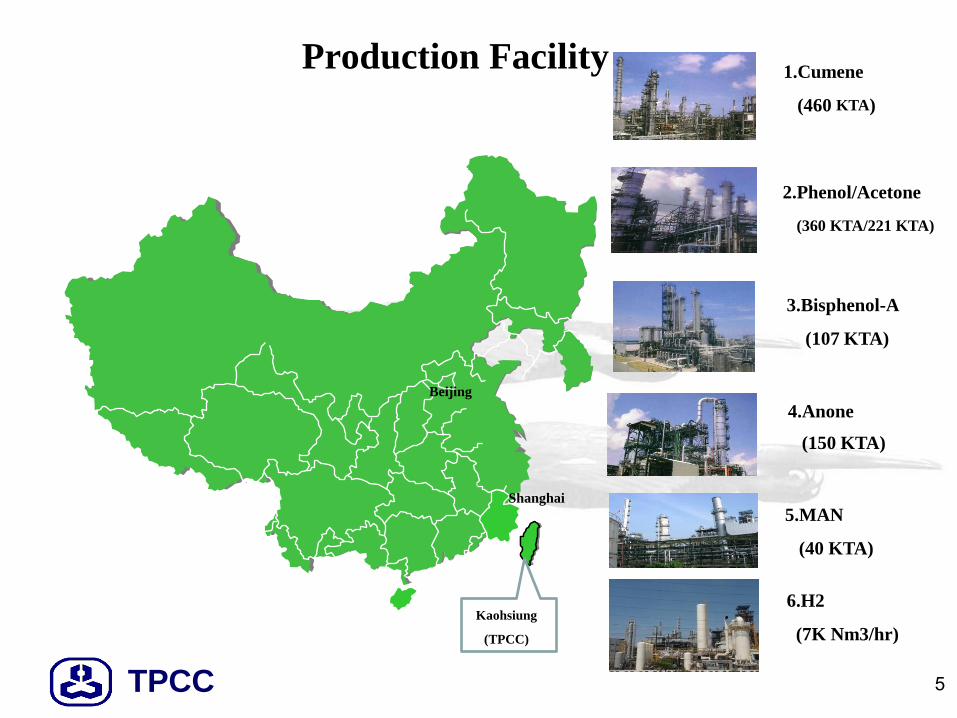
TPCC 5
Production Facility
Kaohsiung
(TPCC)
Beijing
Shanghai
1.Cumene
(460 KTA)
2.Phenol/Acetone
(360 KTA/221 KTA)
3.Bisphenol-A
(107 KTA)
4.Anone
(150 KTA)
5.MAN
(40 KTA)
6.H2
(7K Nm3/hr)
TPCC
Agenda
6
• Company Snapshot
• 2Q/2013 Financial Results
• Business Overview
• Capital Expenditure
• 2H/2013 Business Outlook
TPCC 7
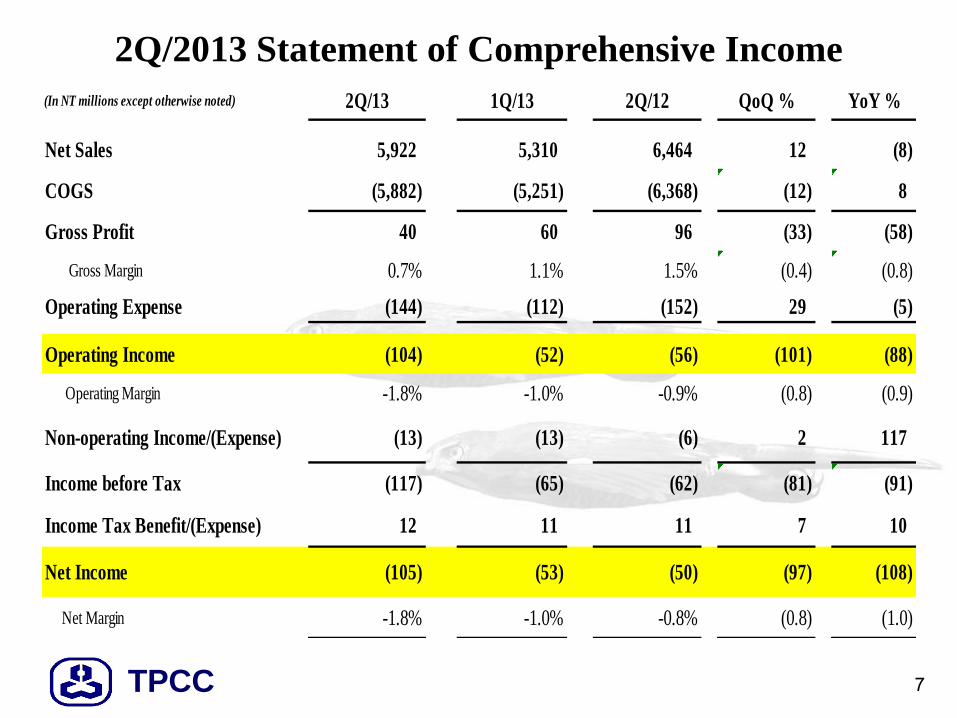
2Q/2013 Statement of Comprehensive Income
(In NT millions except otherwise noted) 2Q/13 1Q/13 2Q/12 QoQ % YoY %
Net Sales 5,922 5,310 6,464 12 (8)
COGS (5,882) (5,251) (6,368) (12) 8
Gross Profit 40 60 96 (33) (58)
Gross Margin 0.7% 1.1% 1.5% (0.4) (0.8)
Operating Expense (144) (112) (152) 29 (5)
Operating Income (104) (52) (56) (101) (88)
Operating Margin -1.8% -1.0% -0.9% (0.8) (0.9)
Non-operating Income/(Expense) (13) (13) (6) 2 117
Income before Tax (117) (65) (62) (81) (91)
Income Tax Benefit/(Expense) 12 11 11 7 10
Net Income (105) (53) (50) (97) (108)
Net Margin -1.8% -1.0% -0.8% (0.8) (1.0)
TPCC 8
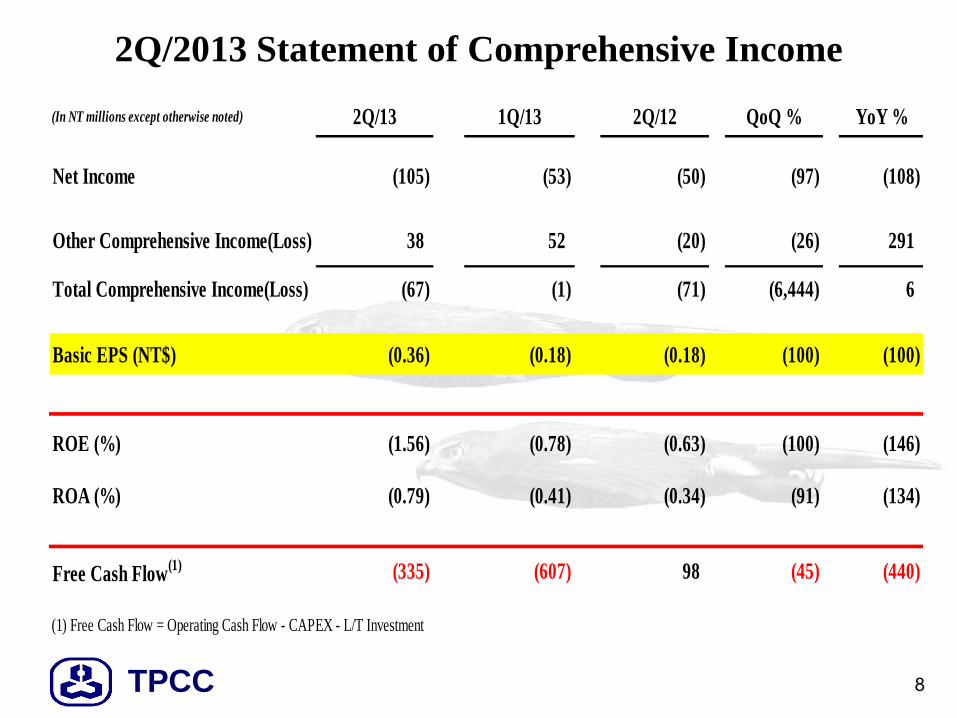
2Q/2013 Statement of Comprehensive Income
(In NT millions except otherwise noted) 2Q/13 1Q/13 2Q/12 QoQ % YoY %
Net Income (105) (53) (50) (97) (108)
Other Comprehensive Income(Loss) 38 52 (20) (26) 291
Total Comprehensive Income(Loss) (67) (1) (71) (6,444) 6
Basic EPS (NT$) (0.36) (0.18) (0.18) (100) (100)
ROE (%) (1.56) (0.78) (0.63) (100) (146)
ROA (%) (0.79) (0.41) (0.34) (91) (134)
Free Cash Flow(1) (335) (607) 98 (45) (440)
(1) Free Cash Flow = Operating Cash Flow - CAPEX - L/T Investment
TPCC 9
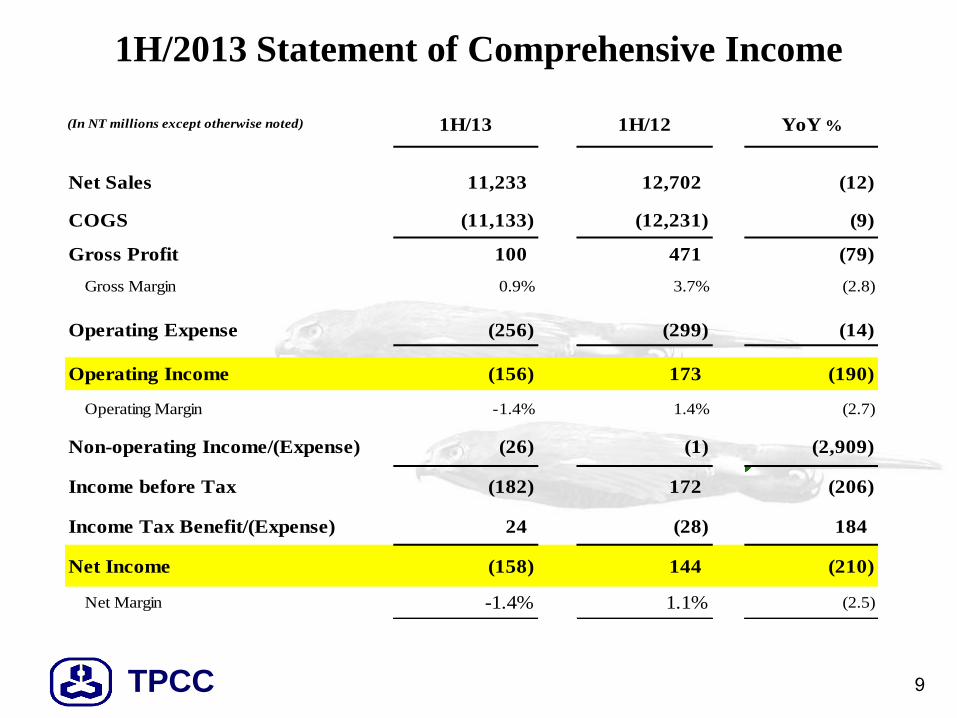
1H/2013 Statement of Comprehensive Income
(In NT millions except otherwise noted) 1H/13 1H/12 YoY %
Net Sales 11,233 12,702 (12)
COGS (11,133) (12,231) (9)
Gross Profit 100 471 (79)
Gross Margin 0.9% 3.7% (2.8)
Operating Expense (256) (299) (14)
Operating Income (156) 173 (190)
Operating Margin -1.4% 1.4% (2.7)
Non-operating Income/(Expense) (26) (1) (2,909)
Income before Tax (182) 172 (206)
Income Tax Benefit/(Expense) 24 (28) 184
Net Income (158) 144 (210)
Net Margin -1.4% 1.1% (2.5)
TPCC 10
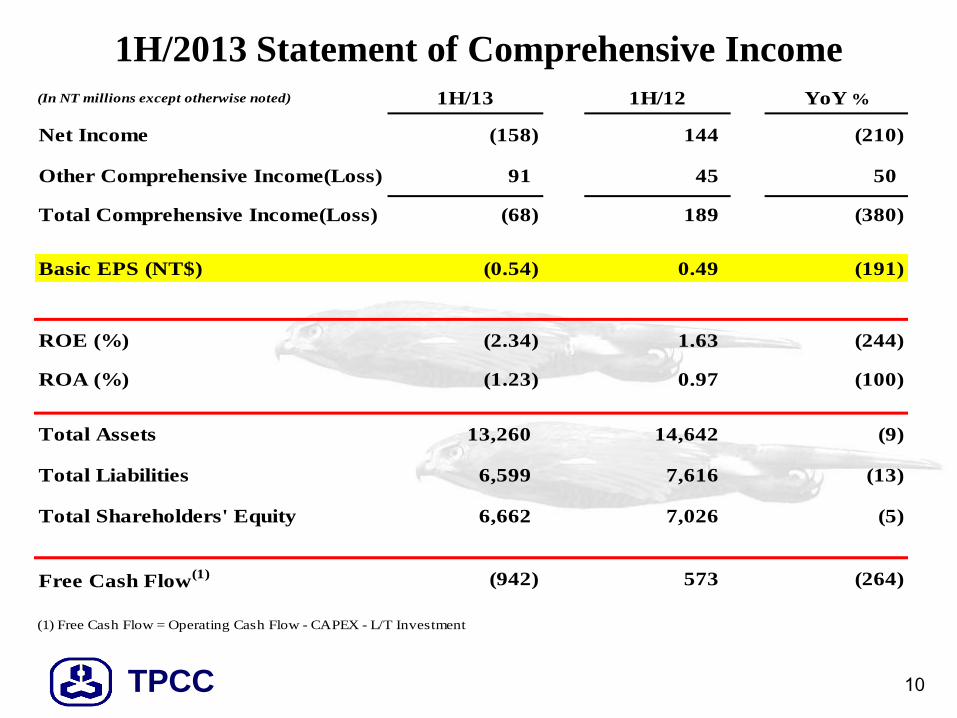
1H/2013 Statement of Comprehensive Income (In NT millions except otherwise noted) 1H/13 1H/12 YoY %
Net Income (158) 144 (210)
Other Comprehensive Income(Loss) 91 45 50
Total Comprehensive Income(Loss) (68) 189 (380)
Basic EPS (NT$) (0.54) 0.49 (191)
ROE (%) (2.34) 1.63 (244)
ROA (%) (1.23) 0.97 (100)
Total Assets 13,260 14,642 (9)
Total Liabilities 6,599 7,616 (13)
Total Shareholders' Equity 6,662 7,026 (5)
Free Cash Flow(1) (942) 573 (264)
(1) Free Cash Flow = Operating Cash Flow - CAPEX - L/T Investment
TPCC 11
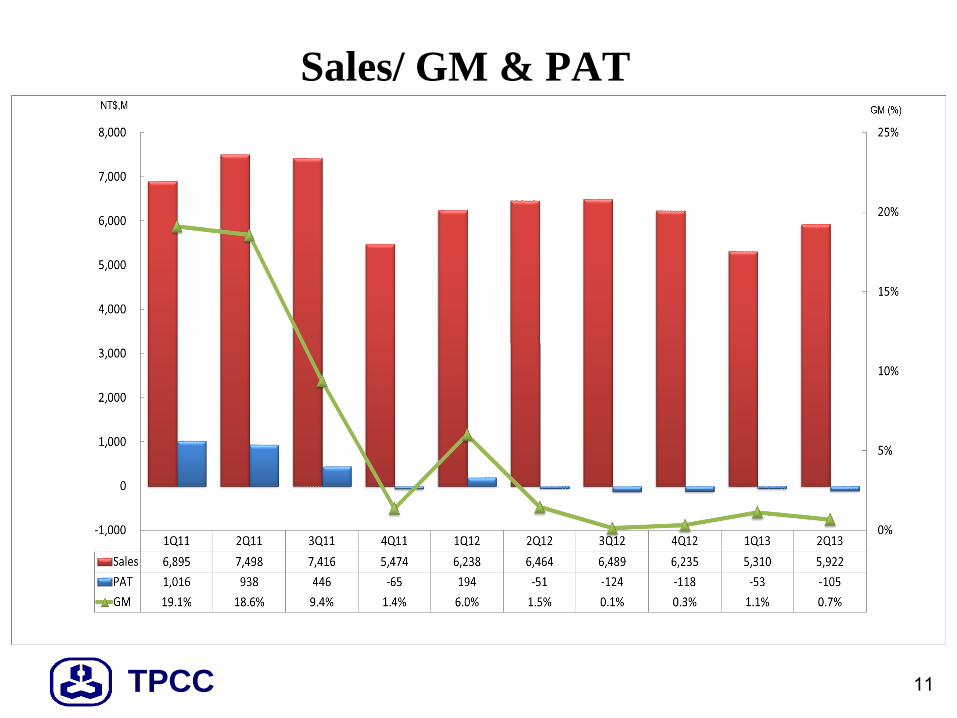
Sales/ GM & PAT
TPCC 12
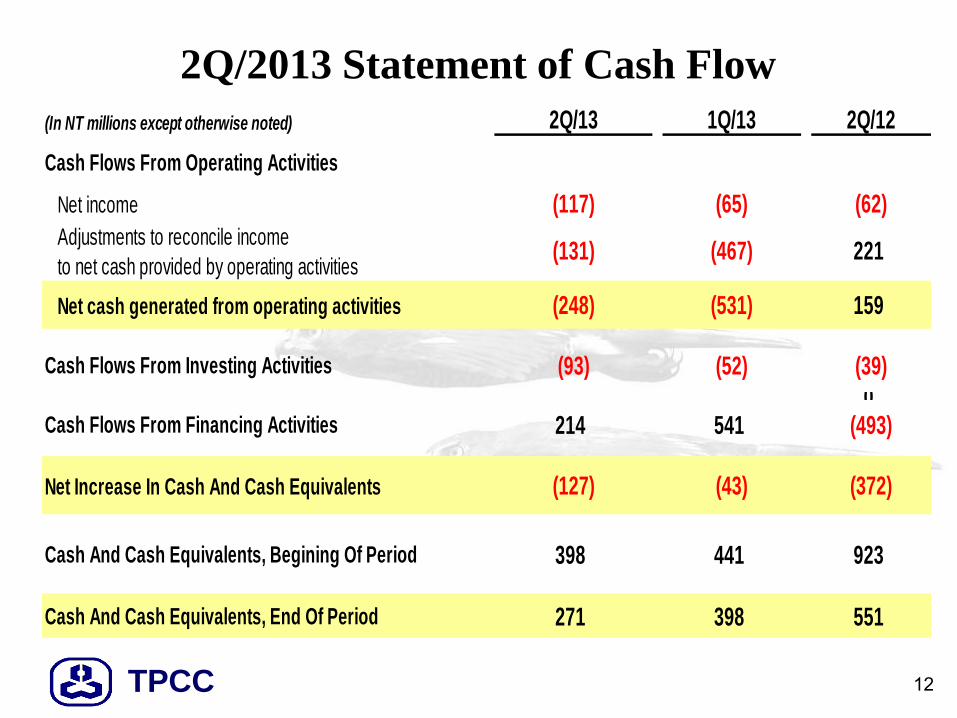
2Q/2013 Statement of Cash Flow
(In NT millions except otherwise noted) 2Q/13 1Q/13 2Q/12
Cash Flows From Operating Activities
Net income (117) (65) (62)
Adjustments to reconcile income
to net cash provided by operating activities(131) (467) 221
Net cash generated from operating activities (248) (531) 159
Cash Flows From Investing Activities (93) (52) (39)
0Cash Flows From Financing Activities 214 541 (493)
Net Increase In Cash And Cash Equivalents (127) (43) (372)
Cash And Cash Equivalents, Begining Of Period 398 441 923
Cash And Cash Equivalents, End Of Period 271 398 551
TPCC 13
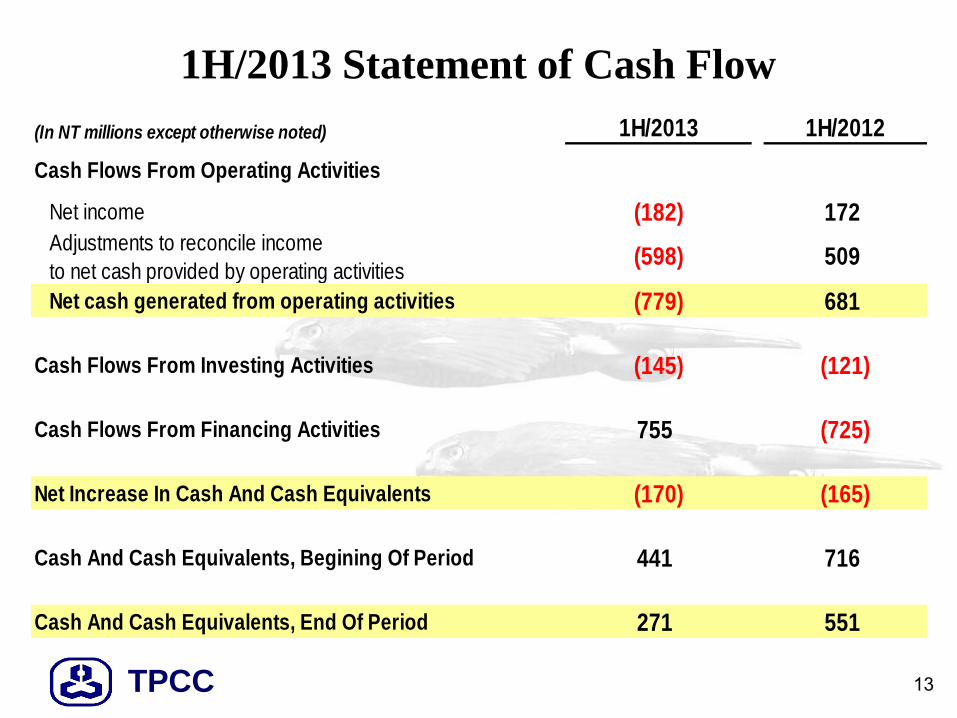
1H/2013 Statement of Cash Flow
(In NT millions except otherwise noted) 1H/2013 1H/2012
Cash Flows From Operating Activities
Net income (182) 172
Adjustments to reconcile income
to net cash provided by operating activities(598) 509
Net cash generated from operating activities (779) 681
Cash Flows From Investing Activities (145) (121)
Cash Flows From Financing Activities 755 (725)
Net Increase In Cash And Cash Equivalents (170) (165)
Cash And Cash Equivalents, Begining Of Period 441 716
Cash And Cash Equivalents, End Of Period 271 551
TPCC
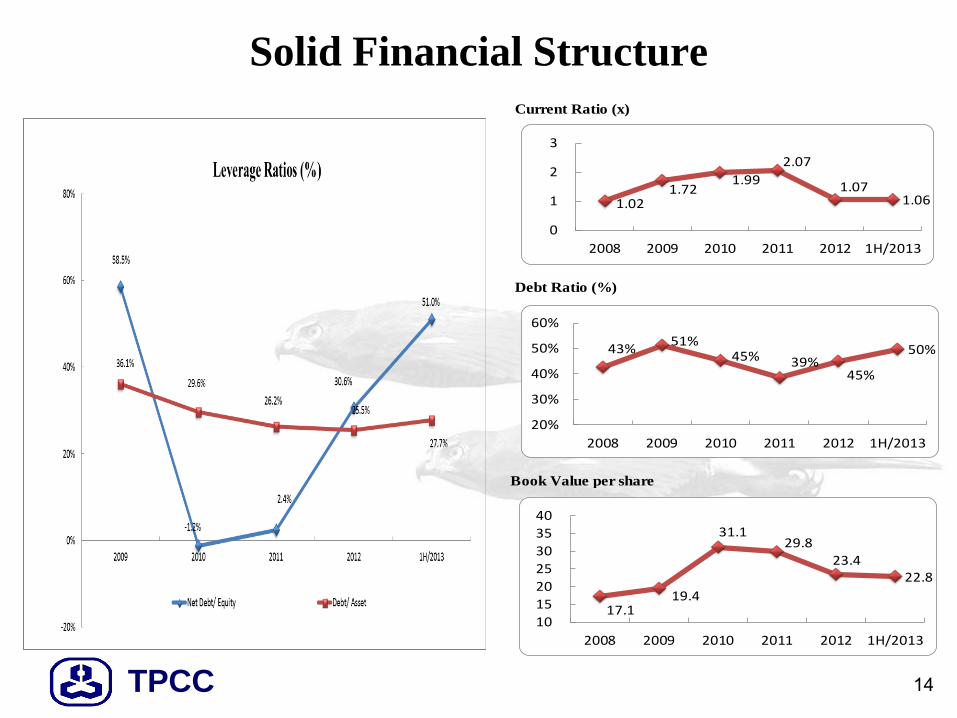
Solid Financial Structure
14
28 26 24
19 27
33
0
10
20
30
40
2007Y 2008Y 2009Y 2010Y 2011Y 1H/12
2.26
1.02
1.72 1.99
2.08
1.28
0.00
0.50
1.00
1.50
2.00
2.50
2007Y 2008Y 2009Y 2010Y 2011Y 1H/12
34% 43%
51% 45%
38%
52%
0%
20%
40%
60%
2007Y 2008Y 2009Y 2010Y 2011Y 1H/12
24.8
17.1 19.5
31.1 29.8
24.1
10.0
20.0
30.0
40.0
2007Y 2008Y 2009Y 2010Y 2011Y 1H/12
Current Ratio (x)
Debt Ratio (%)
Book Value per share
1.02 1.72
1.99
2.07
1.07 1.06
0
1
2
3
2008 2009 2010 2011 2012 1H/2013
43%51%
45% 39%45%
50%
20%
30%
40%
50%
60%
2008 2009 2010 2011 2012 1H/2013
17.119.4
31.129.8
23.422.8
10
15
20
25
30
35
40
2008 2009 2010 2011 2012 1H/2013
TPCC
Agenda
15
• Company Snapshot
• 2Q/2013 Financial Results
• Business Overview
• Capital Expenditure
• 2H/2013 Business Outlook
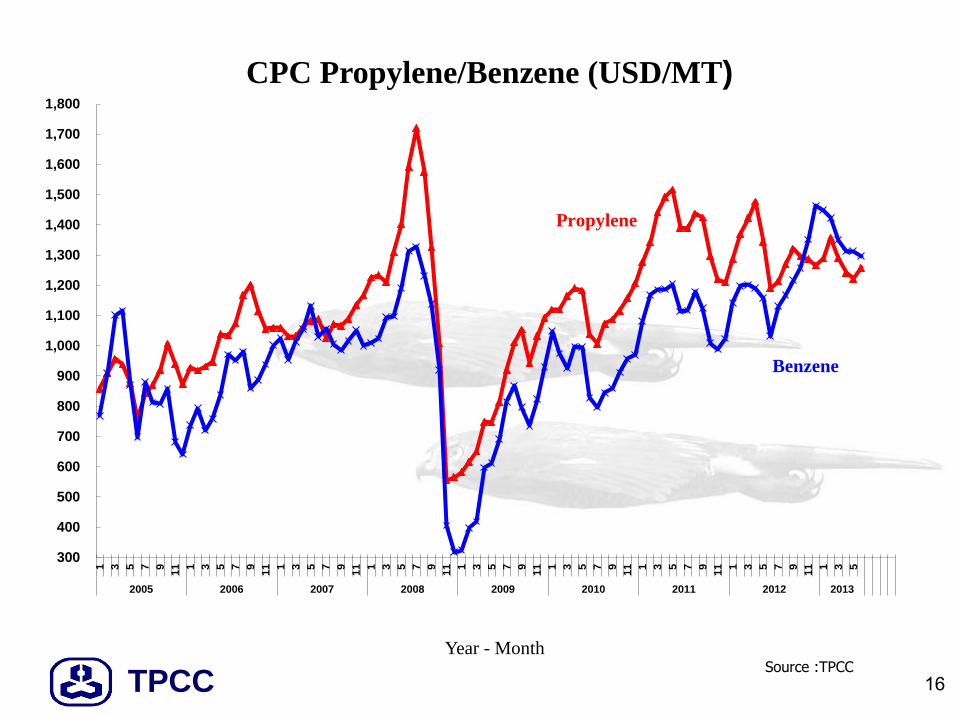
TPCC 16 Source :TPCC
300
400
500
600
700
800
900
1,000
1,100
1,200
1,300
1,400
1,500
1,600
1,700
1,8001 3 5 7 9
11 1 3 5 7 9
11 1 3 5 7 9
11 1 3 5 7 9
11 1 3 5 7 9
11 1 3 5 7 9
11 1 3 5 7 9
11 1 3 5 7 9
11 1 3 5
2005 2006 2007 2008 2009 2010 2011 2012 2013
Year - Month
CPC Propylene/Benzene (USD/MT)
Propylene
Benzene
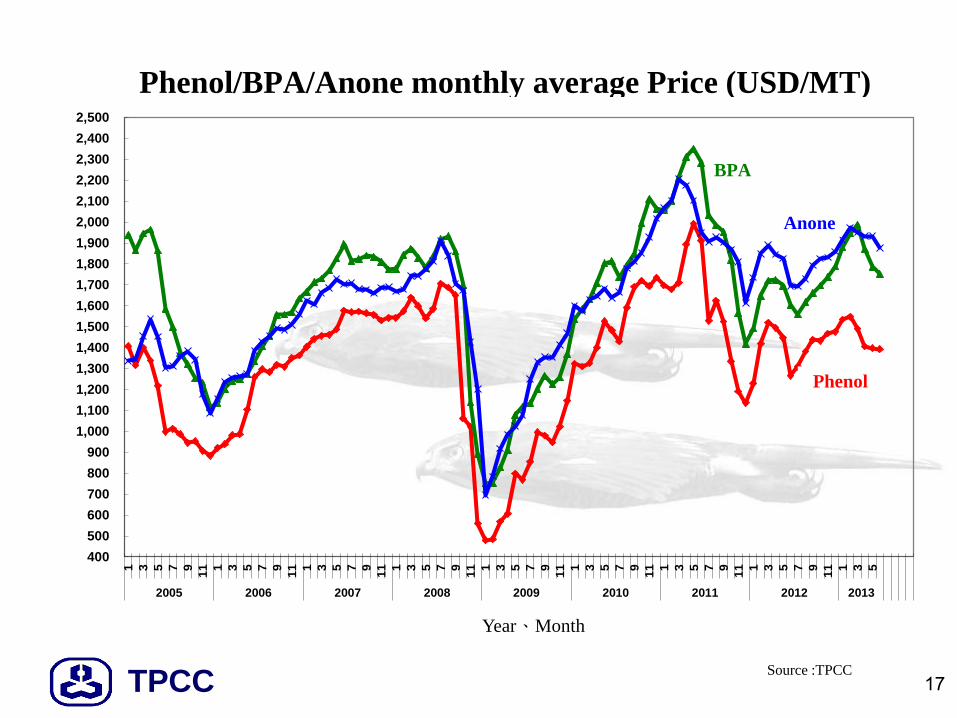
TPCC 17 Source :TPCC
400
500
600
700
800
900
1,000
1,100
1,200
1,300
1,400
1,500
1,600
1,700
1,800
1,900
2,000
2,100
2,200
2,300
2,400
2,5001 3 5 7 9
11 1 3 5 7 9
11 1 3 5 7 9
11 1 3 5 7 9
11 1 3 5 7 9
11 1 3 5 7 9
11 1 3 5 7 9
11 1 3 5 7 9
11 1 3 5
2005 2006 2007 2008 2009 2010 2011 2012 2013
Year、Month
BPA
Phenol
Anone
Phenol/BPA/Anone monthly average Price (USD/MT)
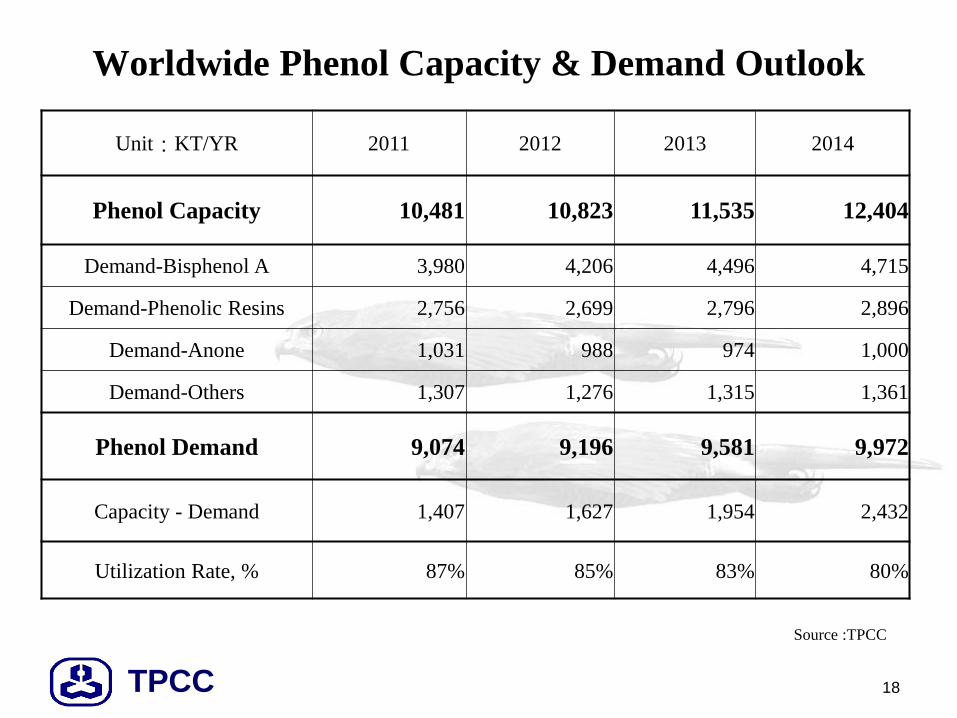
TPCC 18
Worldwide Phenol Capacity & Demand Outlook
Source :TPCC
Unit:KT/YR 2011 2012 2013 2014
Phenol Capacity 10,481 10,823 11,535 12,404
Demand-Bisphenol A 3,980 4,206 4,496 4,715
Demand-Phenolic Resins 2,756 2,699 2,796 2,896
Demand-Anone 1,031 988 974 1,000
Demand-Others 1,307 1,276 1,315 1,361
Phenol Demand 9,074 9,196 9,581 9,972
Capacity - Demand 1,407 1,627 1,954 2,432
Utilization Rate, % 87% 85% 83% 80%
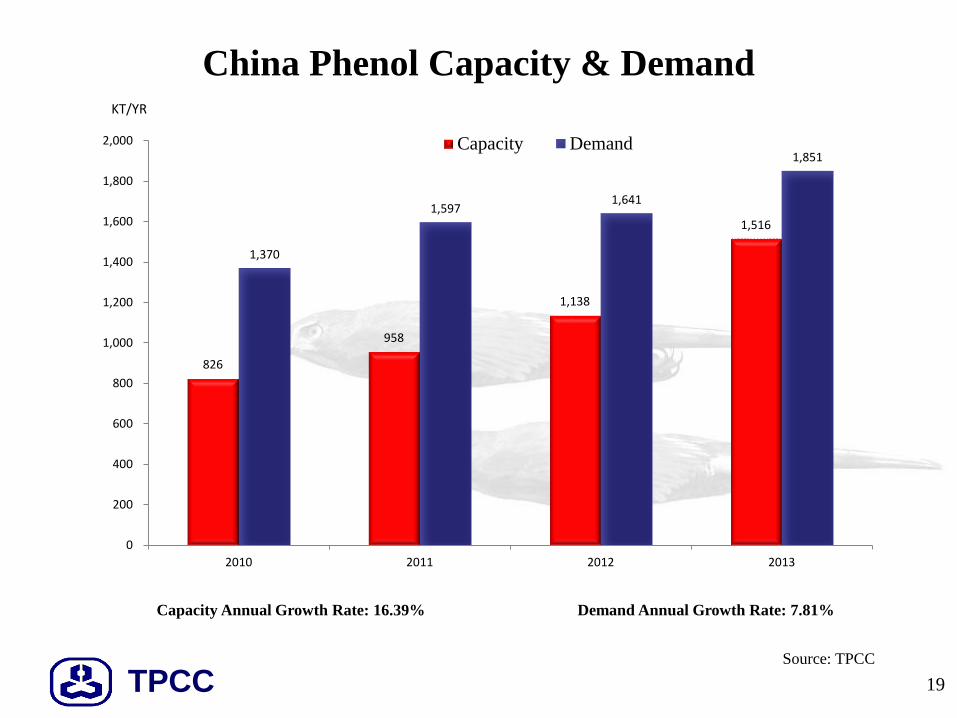
TPCC
826
958
1,138
1,516
1,370
1,597 1,641
1,851
0
200
400
600
800
1,000
1,200
1,400
1,600
1,800
2,000
2010 2011 2012 2013
Capacity Demand
KT/YR
19
China Phenol Capacity & Demand
Source: TPCC
Capacity Annual Growth Rate: 16.39% Demand Annual Growth Rate: 7.81%
TPCC 20
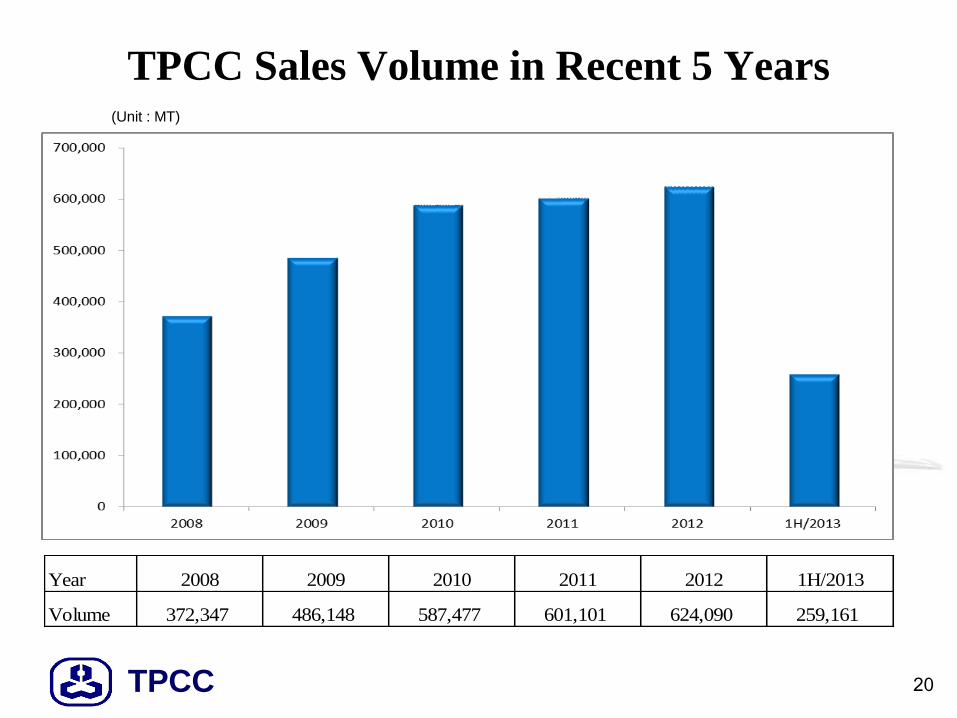
TPCC Sales Volume in Recent 5 Years (Unit : MT)
Year 2008 2009 2010 2011 2012 1H/2013
Volume 372,347 486,148 587,477 601,101 624,090 259,161
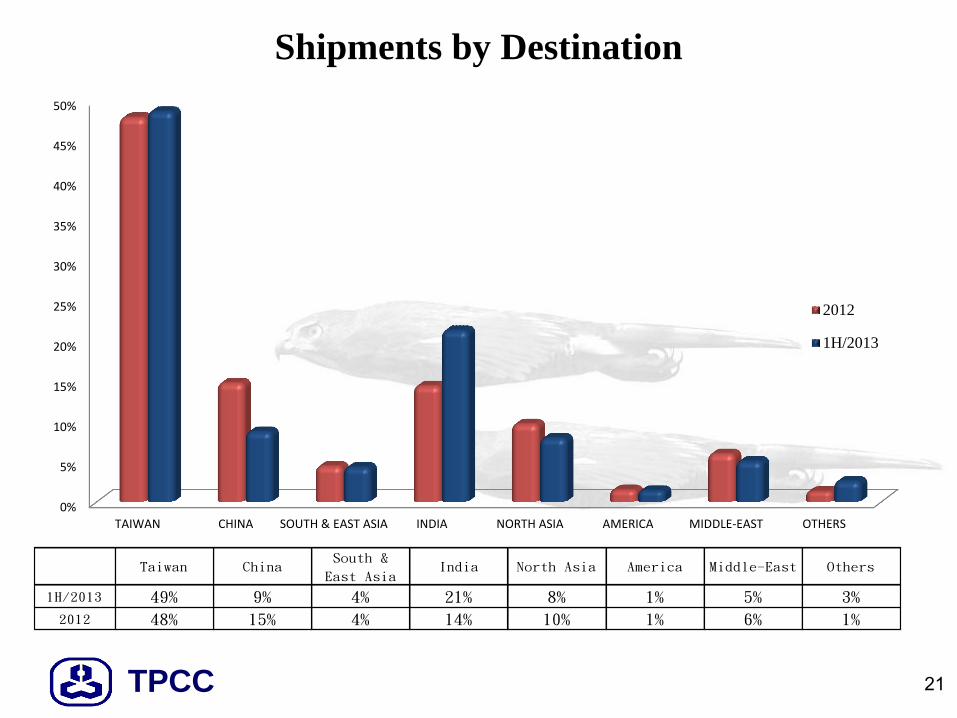
TPCC 21
Shipments by Destination
0%
5%
10%
15%
20%
25%
30%
35%
40%
45%
50%
TAIWAN CHINA SOUTH & EAST ASIA INDIA NORTH ASIA AMERICA MIDDLE-EAST OTHERS
2012
1H/2013
Taiwan ChinaSouth &
East AsiaIndia North Asia America Middle-East Others
1H/2013 49% 9% 4% 21% 8% 1% 5% 3%
2012 48% 15% 4% 14% 10% 1% 6% 1%
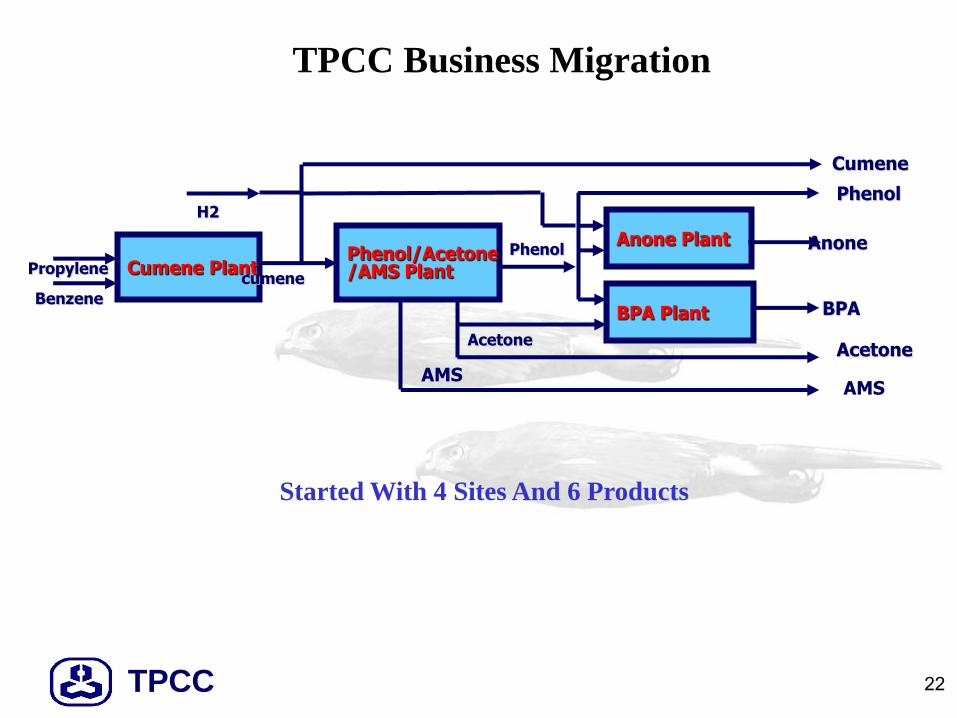
TPCC 22
TPCC Business Migration
Cumene Plant Phenol/Acetone /AMS Plant
Anone Plant
BPA Plant
Propylene
Benzene
cumene
Phenol
Acetone
Anone
BPA
Acetone
Phenol
Cumene
AMS AMS
H2
Started With 4 Sites And 6 Products
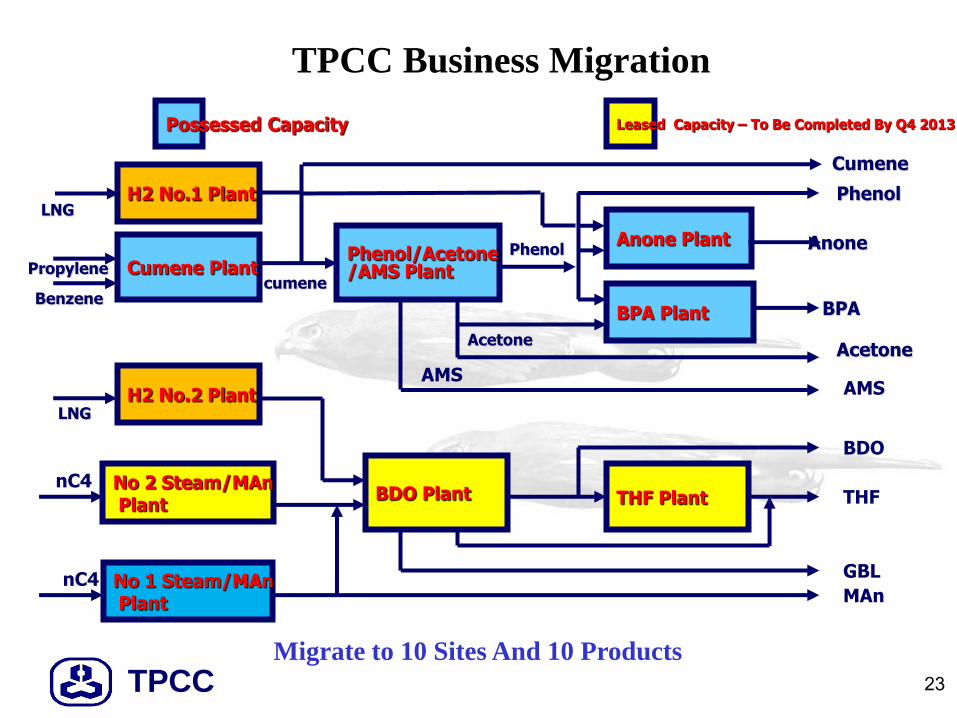
TPCC 23
TPCC Business Migration
Cumene Plant Phenol/Acetone /AMS Plant
Anone Plant
BPA Plant
Propylene
Benzene cumene
Phenol
Acetone
Anone
BPA
Acetone
Phenol
Cumene
AMS AMS
H2 No.1 Plant
H2 No.2 Plant
No 2 Steam/MAn Plant
No 1 Steam/MAn Plant
BDO Plant THF Plant
LNG
BDO
THF
GBL
MAn
LNG
nC4
nC4
Migrate to 10 Sites And 10 Products
Possessed Capacity Leased Capacity – To Be Completed By Q4 2013
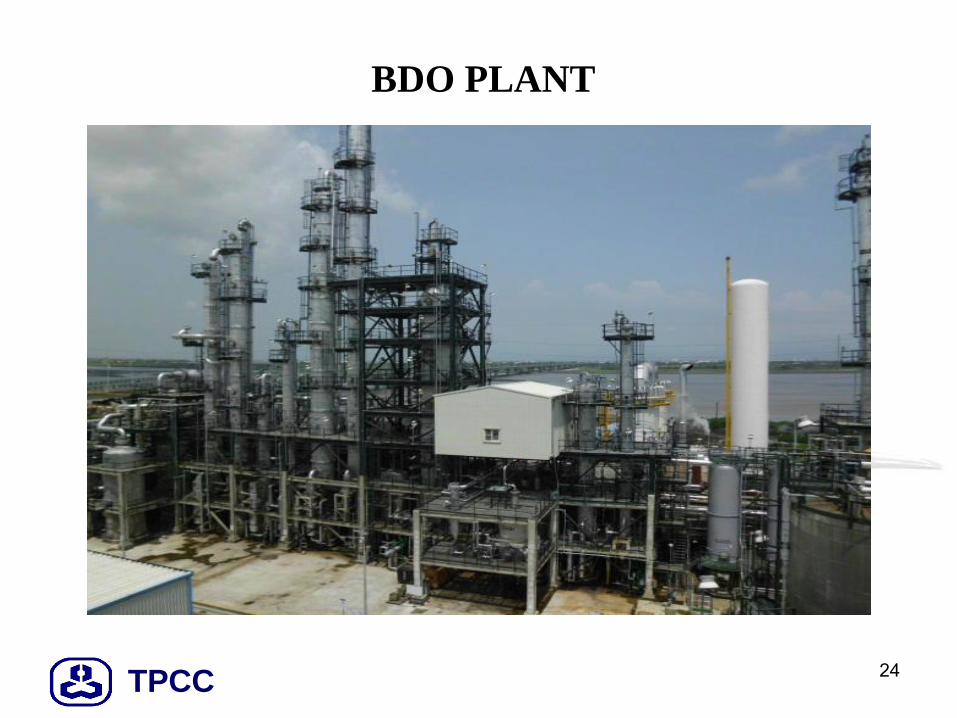
TPCC
BDO PLANT
24
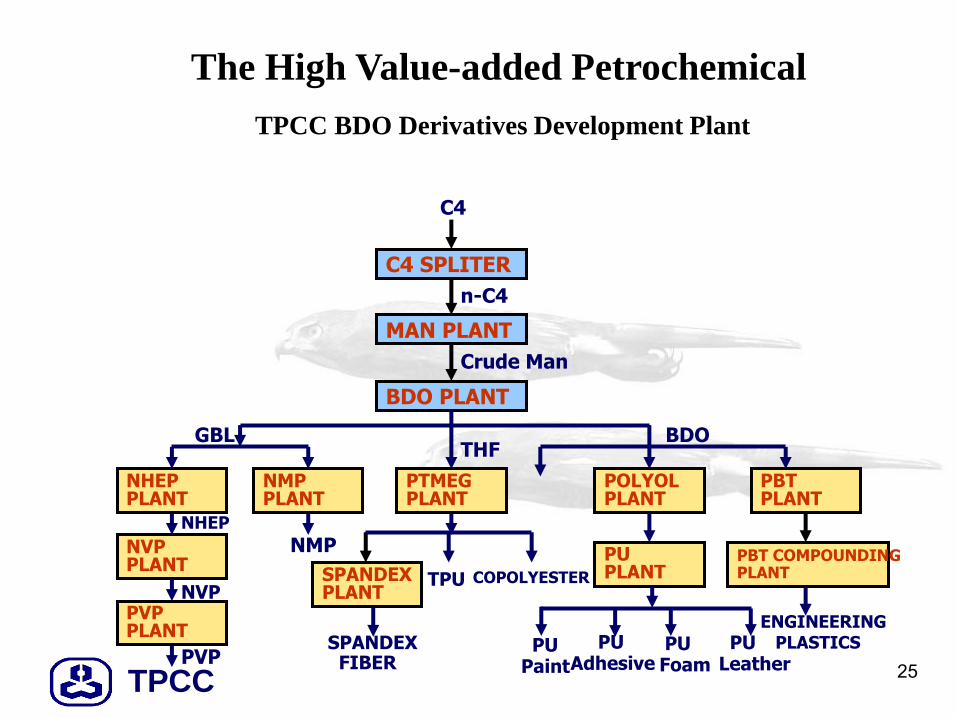
TPCC 25
TPCC BDO Derivatives Development Plant
C4 SPLITER
MAN PLANT
BDO PLANT
PTMEG PLANT
NMP PLANT
NHEP PLANT
POLYOL PLANT
PBT PLANT
C4
n-C4
Crude Man
GBL THF
BDO
NVP PLANT
PVP PLANT
PVP
NHEP
NVP
NMP
SPANDEX PLANT
TPU COPOLYESTER
SPANDEX FIBER
PU PLANT
PU Paint
PU Foam
PU Adhesive
PU Leather
PBT COMPOUNDING PLANT
ENGINEERING PLASTICS
The High Value-added Petrochemical
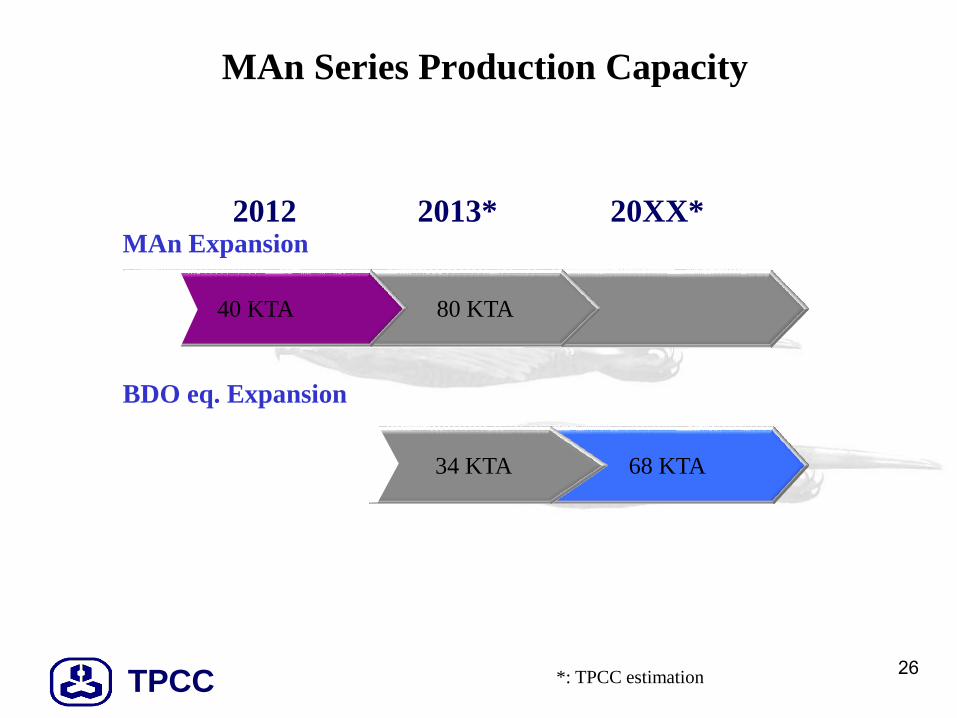
TPCC 26
MAn Series Production Capacity
2013* 2012 20XX*
80 KTA 40 KTA
BDO eq. Expansion
68 KTA 34 KTA
MAn Expansion
*: TPCC estimation
TPCC
Agenda
27
• Company Snapshot
• 2Q/2013 Financial Results
• Business Overview
• Capital Expenditure
• 2H/2013 Business Outlook
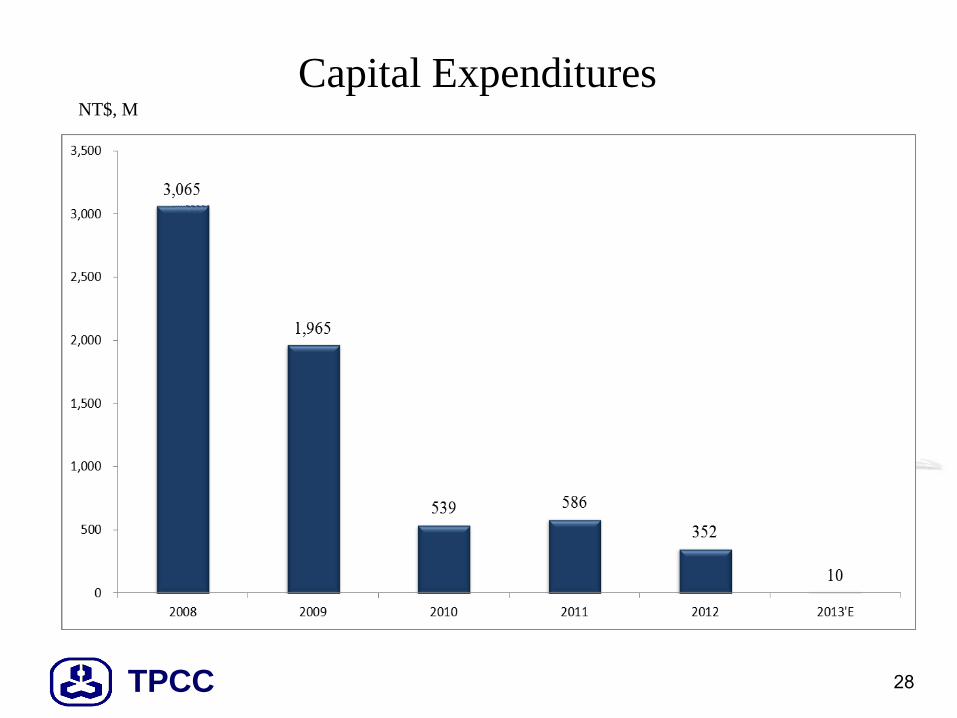
TPCC
Capital Expenditures
28
NT$, M
TPCC
Agenda
29
• Company Snapshot
• 2Q/2013 Financial Results
• Business Overview
• Capital Expenditure
• 2H/2013 Business Outlook
TPCC 30
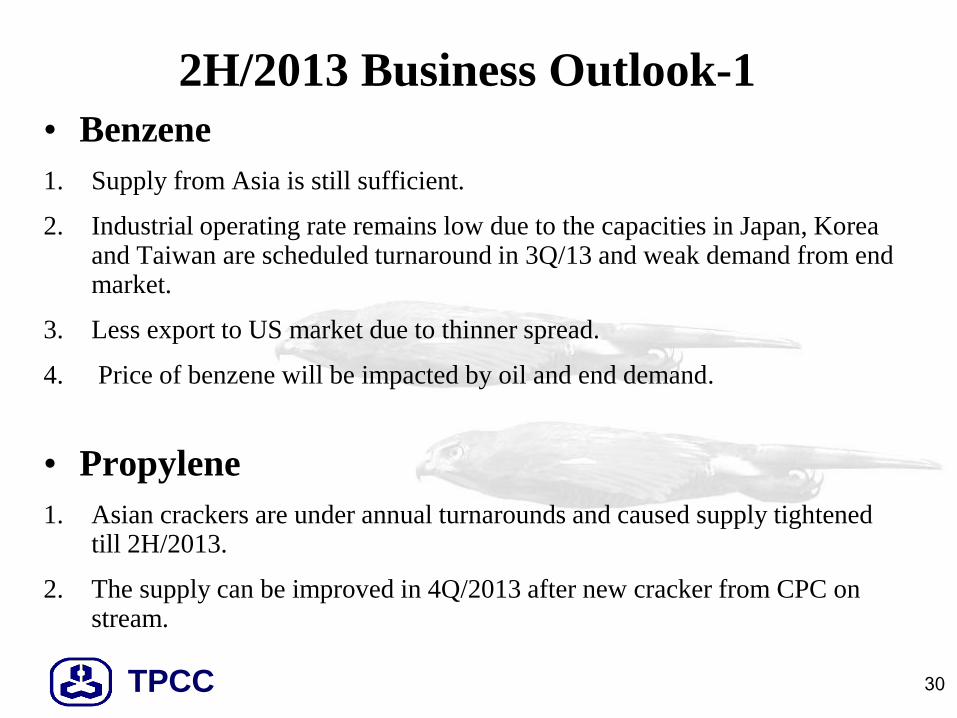
2H/2013 Business Outlook-1
• Benzene
1. Supply from Asia is still sufficient.
2. Industrial operating rate remains low due to the capacities in Japan, Korea and Taiwan are scheduled turnaround in 3Q/13 and weak demand from end market.
3. Less export to US market due to thinner spread.
4. Price of benzene will be impacted by oil and end demand.
• Propylene
1. Asian crackers are under annual turnarounds and caused supply tightened till 2H/2013.
2. The supply can be improved in 4Q/2013 after new cracker from CPC on stream.
TPCC 31
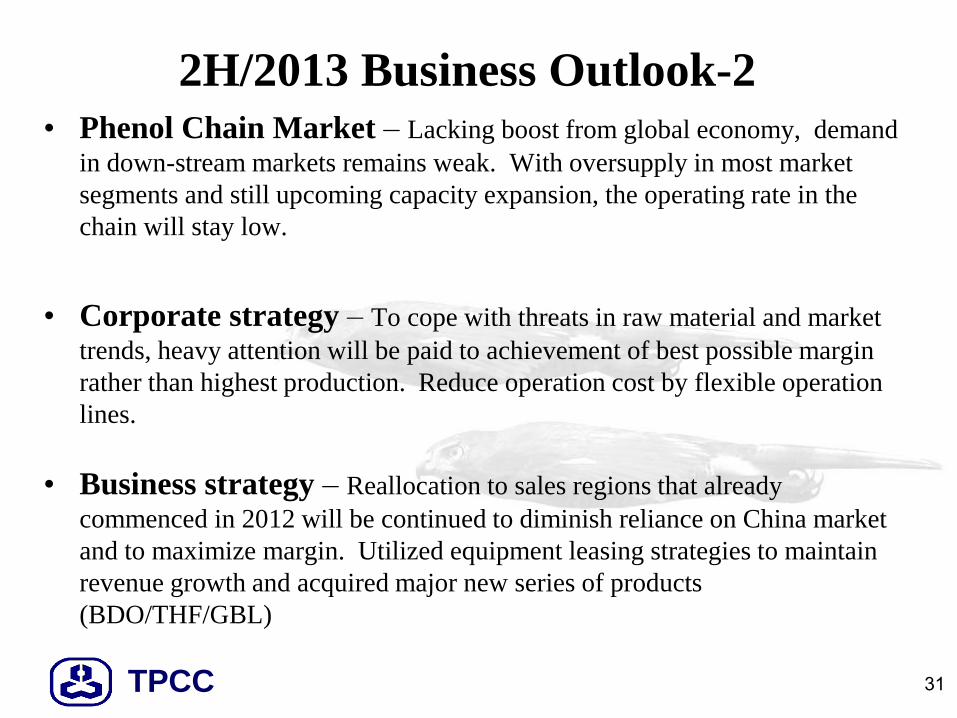
2H/2013 Business Outlook-2 • Phenol Chain Market – Lacking boost from global economy, demand
in down-stream markets remains weak. With oversupply in most market
segments and still upcoming capacity expansion, the operating rate in the
chain will stay low.
• Corporate strategy – To cope with threats in raw material and market
trends, heavy attention will be paid to achievement of best possible margin
rather than highest production. Reduce operation cost by flexible operation
lines.
• Business strategy – Reallocation to sales regions that already
commenced in 2012 will be continued to diminish reliance on China market
and to maximize margin. Utilized equipment leasing strategies to maintain
revenue growth and acquired major new series of products
(BDO/THF/GBL)
TPCC
Thank You
32