Embed Size (px)
Citation preview
7/27/2019 tech3335 SETTAGGIO CAMERE
http://slidepdf.com/reader/full/tech3335-settaggio-camere 1/68

7/27/2019 tech3335 SETTAGGIO CAMERE
http://slidepdf.com/reader/full/tech3335-settaggio-camere 2/68Page intentionally left blank. This document is paginated for two sided printing
7/27/2019 tech3335 SETTAGGIO CAMERE
http://slidepdf.com/reader/full/tech3335-settaggio-camere 3/68
Tech 3335 Measurement of imaging performance of TV cameras
3
Contents
Introduction ............................................................................................... 5
66
6
7
8
8
8
9
10
11
13
13
14
15
15
16
17
17
18
20
20
21
22
22
23
23
24
25
25
26
26
27
27
27
1. Procedures ........................................................................................ 1.1 Precautions .................................................................................................
Test cards .........................................................................................................
Test equipment...................................................................................................
2. Measurements ....................................................................................
2.1. Opto-Electronic transfer curve (Gamma) ..............................................................
2.1.1 Visual method – saw-tooth ....................................................................................
2.1.2 Visual method - test card .....................................................................................
2.1.3 Analytical method – saw-tooth ..............................................................................
2.1.4 Analytical method - test card ...............................................................................
2.2 Noise levels and noise distribution....................................................................
2.2.1 Visual method - noise level ..................................................................................
2.2.2 Analytical method - noise level .............................................................................
2.2.3 Visual method - noise distribution..........................................................................
2.2.4 Analytical method - noise distribution.....................................................................
2.3 Sensitivity.................................................................................................
2.4 Exposure range...........................................................................................
2.4.1 Visual method ..................................................................................................
2.4.2 Analytical method .............................................................................................
2.5 Colour rendering .........................................................................................
2.5.1 Visual method ..................................................................................................
2.5.2 Analytical method .............................................................................................
2.6 Infrared response ........................................................................................
2.7 Spatial resolution, detail settings & aliasing ........................................................
2.7.1 Visual method - resolution ...................................................................................
2.7.2 Analytical method – resolution..............................................................................
2.7.3 Visual method – detail settings..............................................................................
2.7.4 Analytical method – detail settings.........................................................................
2.7.5 Visual method – aliasing ......................................................................................
2.7.6 Analytical method – aliasing .................................................................................
2.8 Lens/optical effects.....................................................................................
2.8.1 Visual method ..................................................................................................
2.8.2 Analytical method .............................................................................................
2.9 Temporal/shutter effects ..............................................................................
7/27/2019 tech3335 SETTAGGIO CAMERE
http://slidepdf.com/reader/full/tech3335-settaggio-camere 4/68
Measurement of imaging performance of TV cameras Tech 3335
4
2.9.1 Visual method.................................................................................................. 28
28
28
29
29
29
30
30
32
33
35
37
39
41
41
41
43
47
48
65
A7.2.1 Gamma and Headroom range .......................................................................65
66
66
67
67
68
68
2.9.2 Analytical method.............................................................................................
3. Presentation of results ........................................................................
4. Derivation of preferred settings .............................................................
4.1 Image rate.................................................................................................
4.2 Resolution .................................................................................................
4.3 Detail enhancement .....................................................................................
4.4 Contrast handling ........................................................................................
5. Bibliography.....................................................................................
Appendix 1 Kodak Gray Cards .......................................................................
Appendix 2: ColorChecker ...........................................................................
Appendix 3: Standard gamma-correction curves................................................
Appendix 4: High-pass noise filter..................................................................
Appendix 5: ITU video coding equations .........................................................
SDTV coding equations, ITU-R Recommendation BT.601.................................................
HDTV coding equations, ITU-R Recommendation BT.709 ................................................
Appendix 6: Programs for data processing..........................................................
Appendix 7: Example of the Presentation of Data.................................................
A7.1. Menu Tables ................................................................................
A7.2. Measurements..............................................................................
A7.2.2 Resolution..............................................................................................
A7.2.2.1 Resolution at 1080-line ...................................................................................
A7.2.2.1 Resolution at 720p.........................................................................................
A7.2.3 Noise ....................................................................................................
A7.2.4 Iris Diffraction and Chromatic Aberration ........................................................
A7.2.5 Conclusion .............................................................................................
Acknowledgement
Although this document is a team effort, the EBU gratefully acknowledges the expertisecontributed by Alan Roberts in crafting this publication.

7/27/2019 tech3335 SETTAGGIO CAMERE
http://slidepdf.com/reader/full/tech3335-settaggio-camere 5/68
Tech 3335 Measurement of imaging performance of TV cameras
5
Methods for the Measurement of the imaging performanceof Television Cameras for the purposes of Characterisation and Setting
EBU Committee First Issued Revised Re-issued
FT-V 01/2012 04/2012*
Keywords: Imaging Performance, TV Camera, Setting and Characterisation.
Introduction
This document describes measurement procedures for assessing the quality of video cameras usedin television production.
These procedures do not supplant existing EBU procedures EBU Tech 3281, EBU Tech 3281Supplement 1 and EBU Tech 3294 for acceptance testing however, some may be used tosupplement acceptance testing as well as establish the best settings for a cameras use in a varietyof programme-types.
The results of these tests greatly simplify the derivation of optimum settings for a camera whichinvolves as much art as it does science, since it defines the ‘look’ that the camera will deliver.
Although it may not be necessary to perform a full set of tests on a camera if a visual inspection of the picture performance does not reveal anything suspicious - whether unusually good or unusuallybad. A full test is normally recommended for confidence and is essential when settings are requiredto deliver a specific ‘look’ for a programme or programme type.
It is essential the full test be carried out for the purpose of applying a camera Tier as defined inEBU R 118. A full written report must be published to accompany any tiering decision made about acamera.
To carry out a full test the following performance parameters will be measured;
Electro-optic transfer function (gamma curve)
Noise levels and noise distribution
Sensitivity
Exposure range, including the effects of black stretch/press and knee
Colour rendering
Infra-red response
Spatial resolution, detail settings and aliasing
Lens/optical aberrations
Temporal/shutter effects
* A mistake was found in the equation for Vrms on page 15. The corrected equation is in the April version of this document.
7/27/2019 tech3335 SETTAGGIO CAMERE
http://slidepdf.com/reader/full/tech3335-settaggio-camere 6/68
Measurement of imaging performance of TV cameras Tech 3335
The techniques described in this document can be applied equally to broadcast and consumercameras, with 4:3 or 16:9 aspect ratios, and operating at SD or HD scanning standards. Nothing inthese tests is specific to any one type of camera.
No test carries any risk of damage to the camera, or to the tester.
1. Procedures
1.1 Precautions
The camera should be mounted on a suitable tripod or other camera mounting, such that it can betrained on the test cards. Test cards can be front lit using two luminaires to ensure reasonablyuniform illumination. Shading is not a problem as it can be corrected as part of the measurementprocedure. Special illumination is required for some tests, particularly when assessing colourrendering.
Measurements can be made in two ways, subjective and/or analytical.
Subjective assessment can be rapid and will always reveal whether analytical measurementsare needed. They can be used as a confirmation of results and to demonstrate any effects.
Analytical measurement takes considerably longer, and requires special equipment and/orsoftware analysis.
In all cases, the camera must be white balanced to the illuminant used for the tests, and also blackbalanced where black balance controls are available.
Test cardsMost testing can be accomplished with only two test cards.
Exposure test card: a simple white and grey combination, with reliably known reflectance. TheKodak cards are ideal for this, although a ColorChecker chart is also suitable.
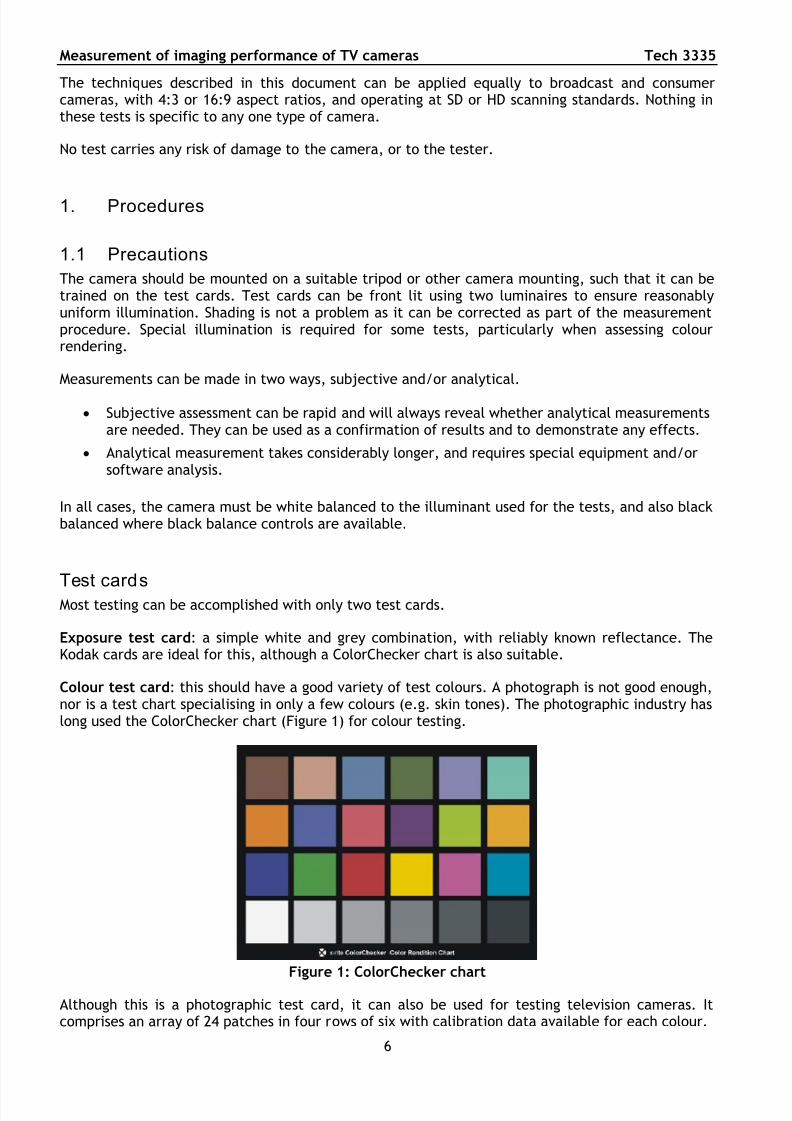
Colour test card: this should have a good variety of test colours. A photograph is not good enough,nor is a test chart specialising in only a few colours (e.g. skin tones). The photographic industry haslong used the ColorChecker chart (Figure 1) for colour testing.
Figure 1: ColorChecker chart
Although this is a photographic test card, it can also be used for testing television cameras. Itcomprises an array of 24 patches in four rows of six with calibration data available for each colour.
6
7/27/2019 tech3335 SETTAGGIO CAMERE
http://slidepdf.com/reader/full/tech3335-settaggio-camere 7/68
Tech 3335 Measurement of imaging performance of TV cameras
From this information it is possible to calculate the signal voltages a camera should produce foreach patch, and therefore it can be used both for subjective and analytical testing.
Only genuine ColorChecker charts should be used; poor copies should be avoided. The authenticColorChecker chart has been manufactured by several companies, originally by Macbeth (then adivision of Kollmorgen) and now by X-rite (a part of Munsell Color), and it is obtainable throughmany television and film hire companies.
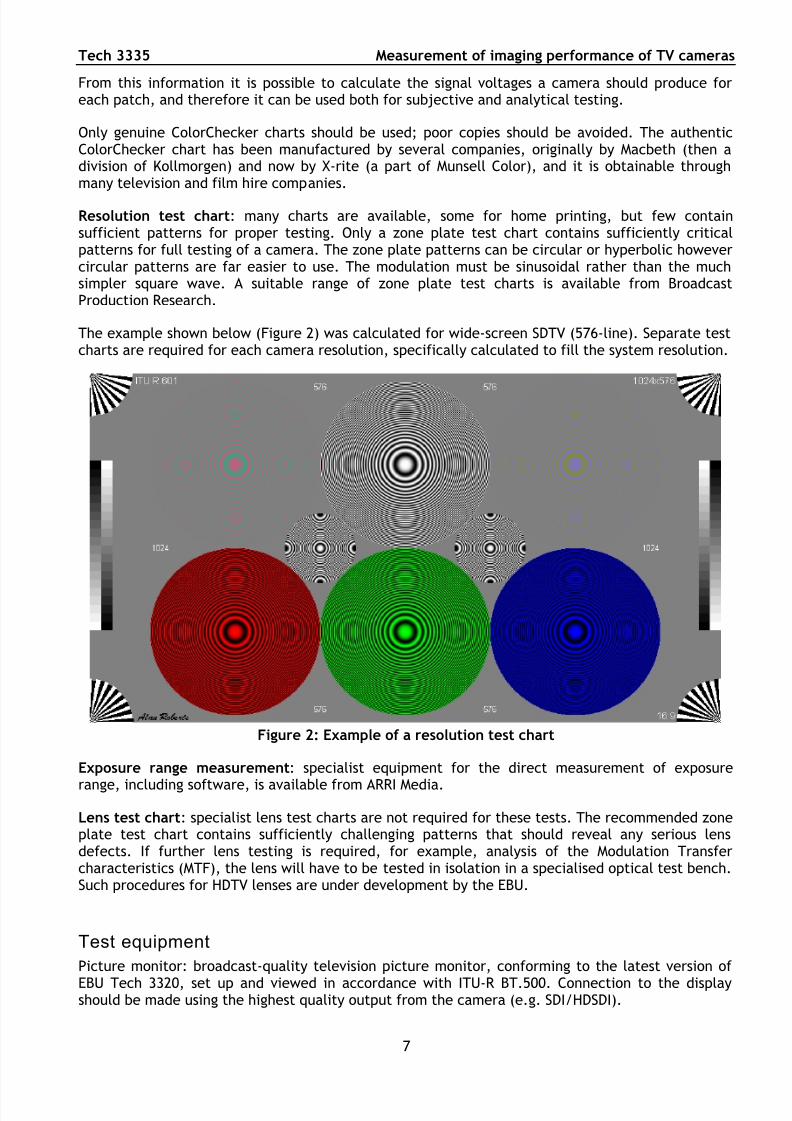
Resolution test chart: many charts are available, some for home printing, but few containsufficient patterns for proper testing. Only a zone plate test chart contains sufficiently criticalpatterns for full testing of a camera. The zone plate patterns can be circular or hyperbolic howevercircular patterns are far easier to use. The modulation must be sinusoidal rather than the muchsimpler square wave. A suitable range of zone plate test charts is available from BroadcastProduction Research.
The example shown below (Figure 2) was calculated for wide-screen SDTV (576-line). Separate testcharts are required for each camera resolution, specifically calculated to fill the system resolution.
Figure 2: Example of a resolution test chart
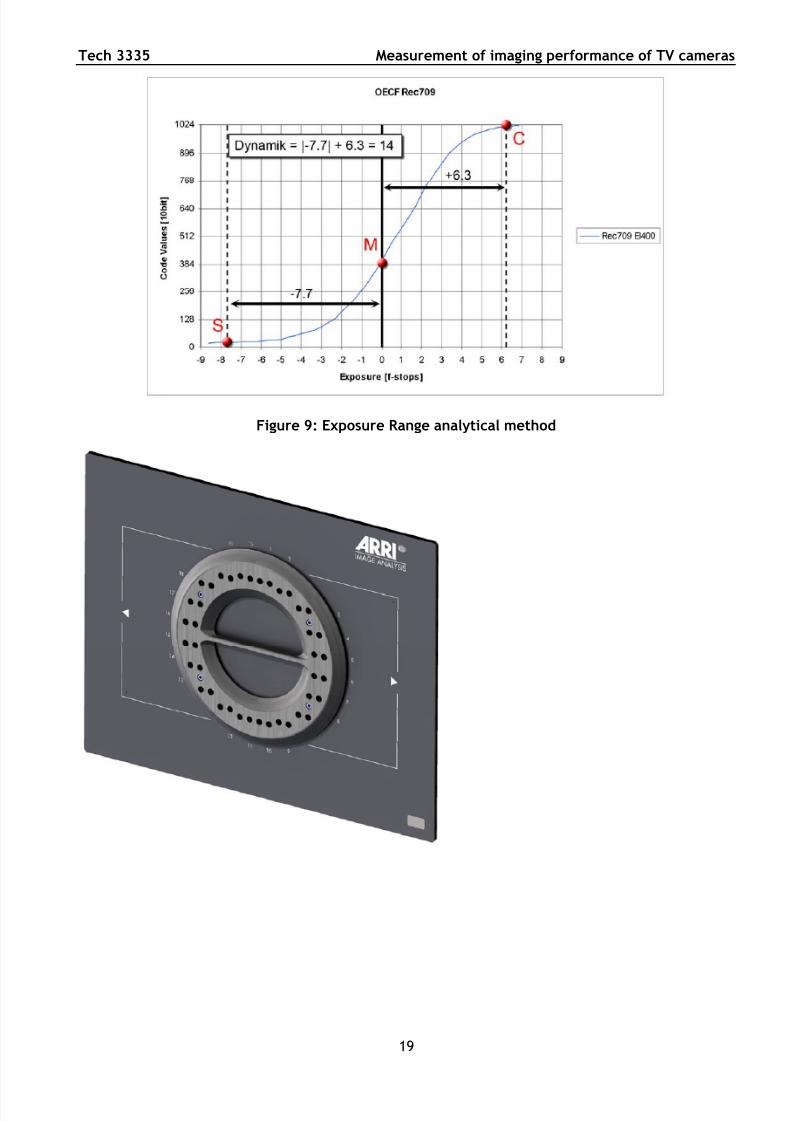
Exposure range measurement: specialist equipment for the direct measurement of exposure
range, including software, is available from ARRI Media.
Lens test chart: specialist lens test charts are not required for these tests. The recommended zoneplate test chart contains sufficiently challenging patterns that should reveal any serious lensdefects. If further lens testing is required, for example, analysis of the Modulation Transfercharacteristics (MTF), the lens will have to be tested in isolation in a specialised optical test bench.Such procedures for HDTV lenses are under development by the EBU.
Test equipment
Picture monitor: broadcast-quality television picture monitor, conforming to the latest version of
EBU Tech 3320, set up and viewed in accordance with ITU-R BT.500. Connection to the displayshould be made using the highest quality output from the camera (e.g. SDI/HDSDI).
7
7/27/2019 tech3335 SETTAGGIO CAMERE
http://slidepdf.com/reader/full/tech3335-settaggio-camere 8/68
Measurement of imaging performance of TV cameras Tech 3335
8
Waveform monitor: broadcast-quality waveform monitor connected via the same high quality feedas the picture monitor and set to the camera’s line and field/frame-scanning standard. In practice,a waveform monitor may not be essential if software analysis of captured images is available. Somecameras have such monitoring in the viewfinder and this may be acceptable if the resolution andcalibration are adequate for reliable measurements to be made. Software waveform-monitoringsolutions are also available (e.g. Black Magic Ultrascope).
Image capture: it is advisable to be able to capture images from the camera for measurements andto record the performance of the camera. The recorder should use the same digital feed as thepicture and/or waveform monitor Capture should be uncompressed SDI/HDSDI, so specialistequipment may be needed. If the camera does not have a digital output (HDMI is acceptableprovided the data-stream is uncompressed), its analogue feed can be converted to serial digits forcapture, using a suitable converter. Results will be less reliable since the camera will not normallybe used in this way. When camcorders with no digital output are tested, only the recorded signalneed be captured. Analysis of captured images requires specialised software, which is describedlater in this document.
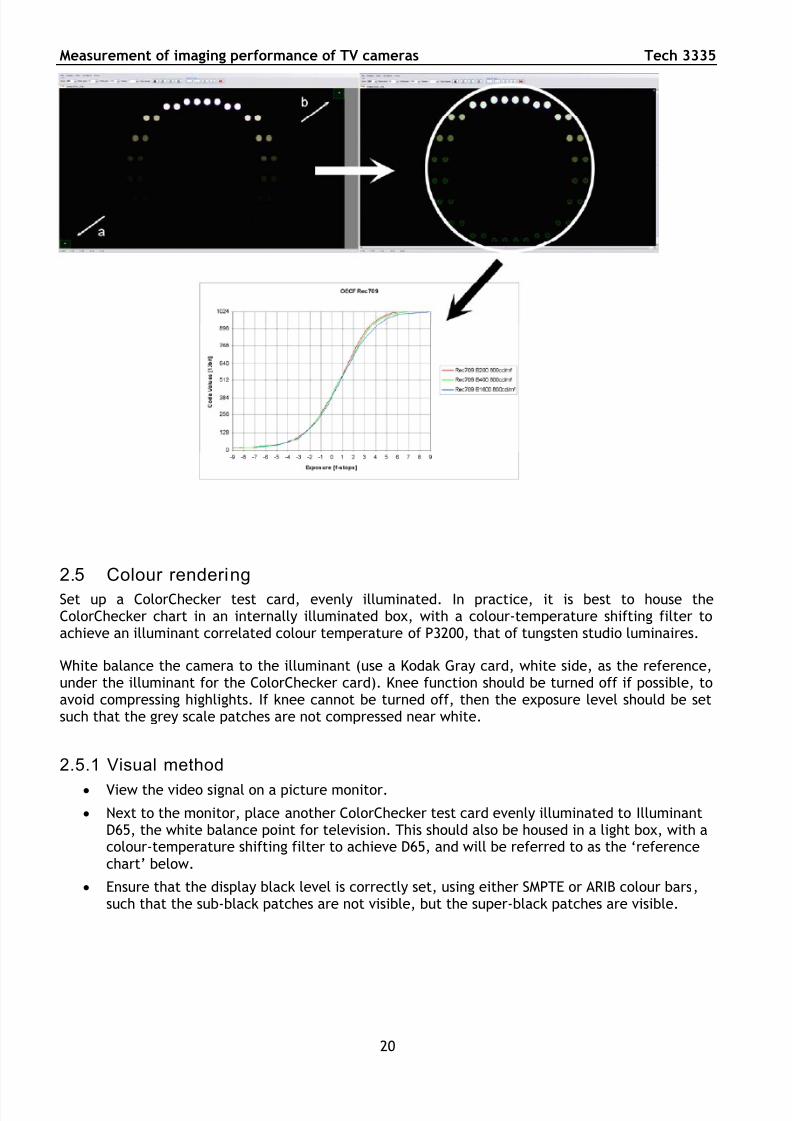
Arri Media exposure test: equipment for this test is available from Arri Media. It comprises a rear-illuminated fully-opaque test card containing many small apertures. Each aperture contains atransparency, modulated with a single spatial frequency and at a range of mean transmittancesfrom near white to near black. A video capture and software analysis system from Arri Media,performs all the measurements and calculations.
Light meter: a calibrated illuminance meter. Ideally, this should carry calibration data traceable toa national standards body. It should be calibrated in lumens/square metre (lux).
Rotary motion: a multi-bladed fan, capable of rotating at variable and controllable speed. Thespeed of rotation must have sufficient range to cause problems with ‘rolling shutter’ sensors. If thefan has b blades, then it must be capable of being set to 3000/b rpm, so that one blade will travelup or down the picture in one field (for 50 Hz, ‘PAL’ cameras) or to 3600/b rpm for 59.94 Hz,
‘NTSC’ cameras. Ideally, the speed should be continuously adjustable. A small fan, specificallymodified for these tests is available from Broadcast Production Research.
2. Measurements
As there are two possible methods of testing for each measurement (visual and analytical), bothmethods will be given, where relevant.
2.1. Opto-Electronic transfer curve (Gamma)
If it is possible to inject a linear saw-tooth into the camera, and a waveform monitor is available,this measurement is relatively straightforward. It is still possible to achieve it by software analysis,but this is a long process.
Tech note: All black stretch/press and knee options must be turned off for this measurement.
2.1.1 Visual method – saw-tooth
It is not possible to make an accurate measurement of the transfer curve by purely visual means. Itis, however, usually possible to determine a camera’s gamma curve, from a list of possibileoptions.
Set the waveform monitor to line-scan.
Set the scan position to nominal scale points such that reliable measurements can be taken,
7/27/2019 tech3335 SETTAGGIO CAMERE
http://slidepdf.com/reader/full/tech3335-settaggio-camere 9/68
Tech 3335 Measurement of imaging performance of TV cameras
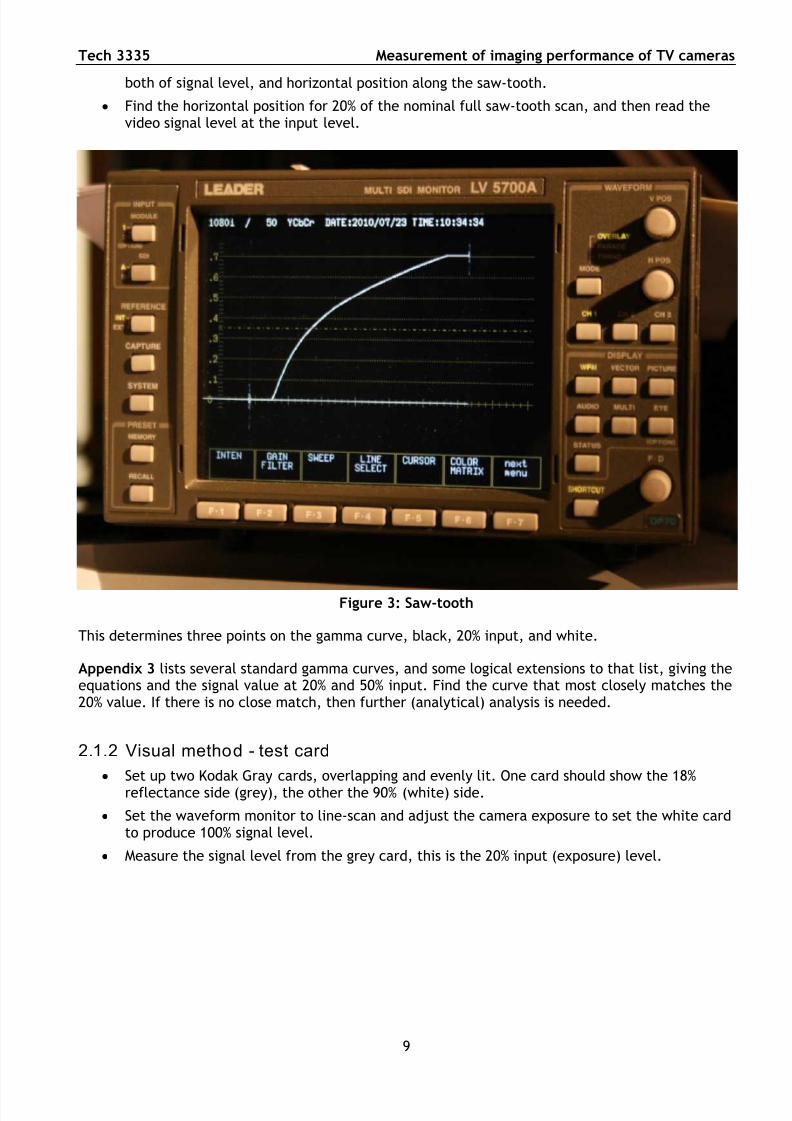
both of signal level, and horizontal position along the saw-tooth.
Find the horizontal position for 20% of the nominal full saw-tooth scan, and then read thevideo signal level at the input level.
Figure 3: Saw-tooth
This determines three points on the gamma curve, black, 20% input, and white.
Appendix 3 lists several standard gamma curves, and some logical extensions to that list, giving theequations and the signal value at 20% and 50% input. Find the curve that most closely matches the20% value. If there is no close match, then further (analytical) analysis is needed.
2.1.2 Visual method - test card
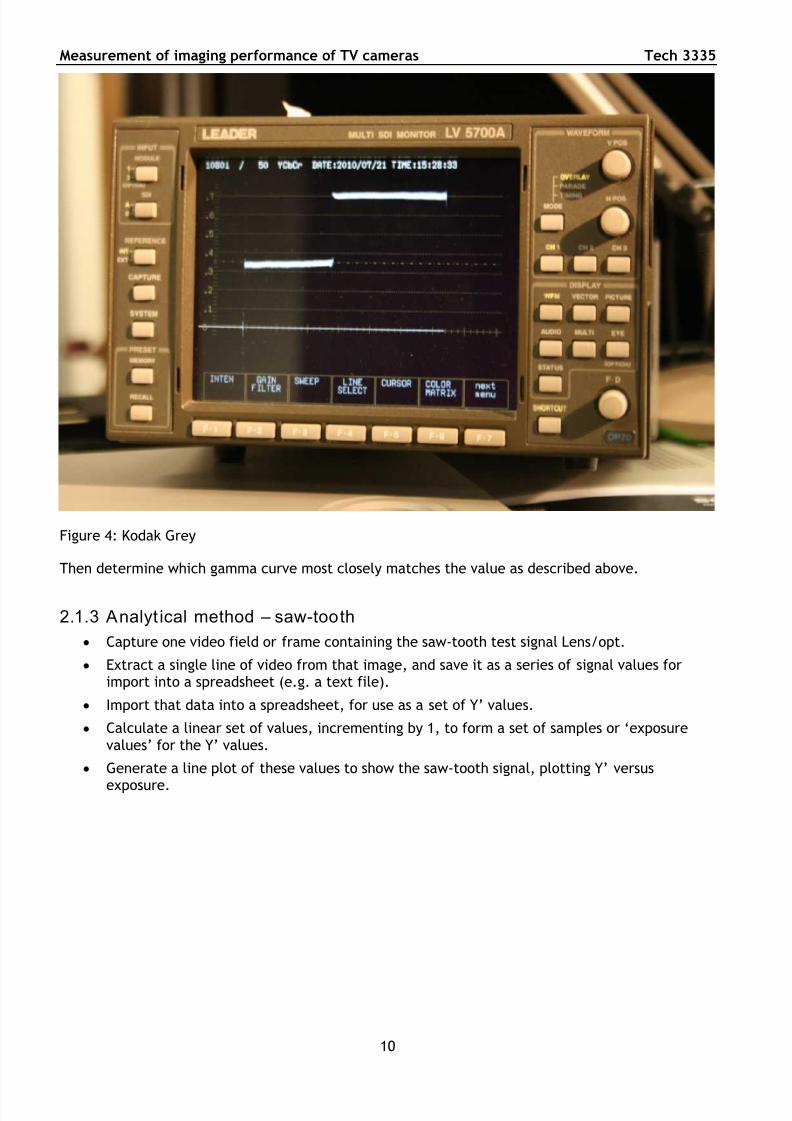
Set up two Kodak Gray cards, overlapping and evenly lit. One card should show the 18%reflectance side (grey), the other the 90% (white) side.
Set the waveform monitor to line-scan and adjust the camera exposure to set the white cardto produce 100% signal level.
Measure the signal level from the grey card, this is the 20% input (exposure) level.
9
7/27/2019 tech3335 SETTAGGIO CAMERE
http://slidepdf.com/reader/full/tech3335-settaggio-camere 10/68
Measurement of imaging performance of TV cameras Tech 3335
Figure 4: Kodak Grey
Then determine which gamma curve most closely matches the value as described above.
2.1.3 Analyt ical method – saw-tooth
Capture one video field or frame containing the saw-tooth test signal Lens/opt.
Extract a single line of video from that image, and save it as a series of signal values forimport into a spreadsheet (e.g. a text file).
Import that data into a spreadsheet, for use as a set of Y’ values.
Calculate a linear set of values, incrementing by 1, to form a set of samples or ‘exposurevalues’ for the Y’ values.
Generate a line plot of these values to show the saw-tooth signal, plotting Y’ versus
exposure.
10
7/27/2019 tech3335 SETTAGGIO CAMERE
http://slidepdf.com/reader/full/tech3335-settaggio-camere 11/68
Tech 3335 Measurement of imaging performance of TV cameras
Simulated example data
Samplenumber
Exposure Signal
3 0 0
4 0 0
5 0 0… … …
103 0 0
104 0.001221001 0.008
105 0.002442002 0.012
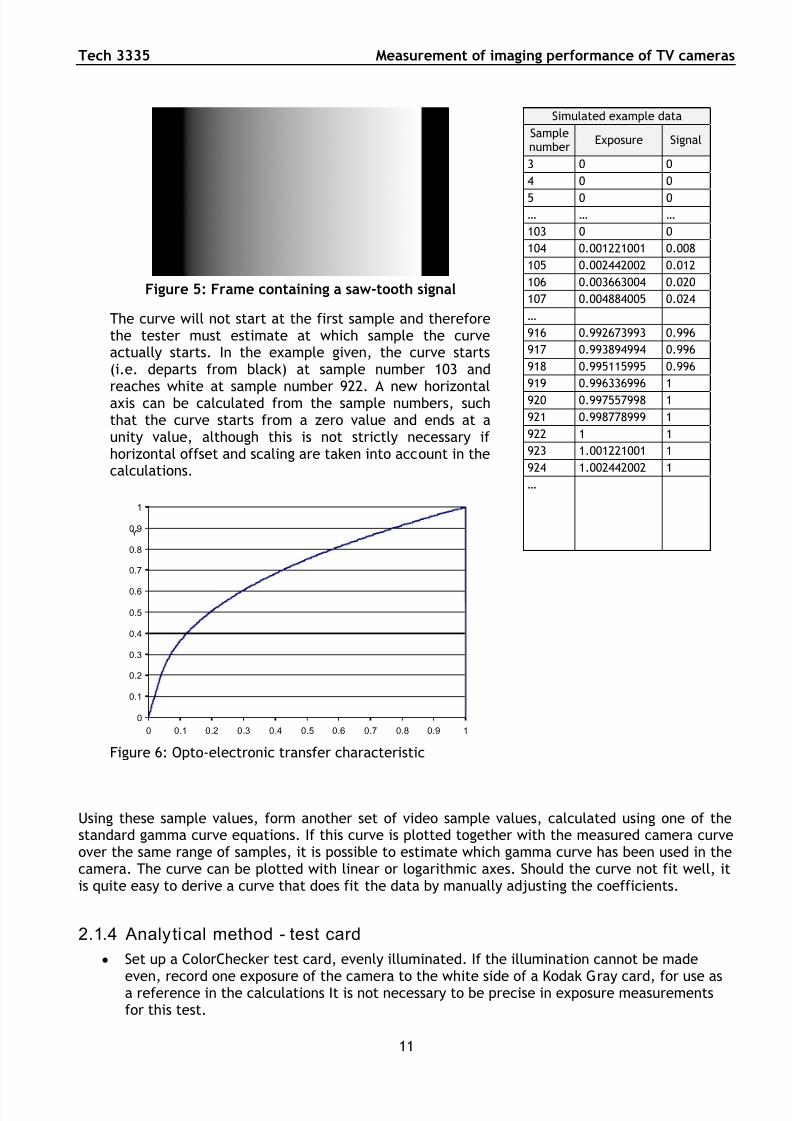
106 0.003663004 0.020Figure 5: Frame containing a saw-tooth signal
107 0.004884005 0.024
…
916 0.992673993 0.996
917 0.993894994 0.996
918 0.995115995 0.996
919 0.996336996 1
920 0.997557998 1
921 0.998778999 1
922 1 1
923 1.001221001 1
The curve will not start at the first sample and thereforethe tester must estimate at which sample the curveactually starts. In the example given, the curve starts(i.e. departs from black) at sample number 103 and
reaches white at sample number 922. A new horizontalaxis can be calculated from the sample numbers, suchthat the curve starts from a zero value and ends at aunity value, although this is not strictly necessary if horizontal offset and scaling are taken into account in thecalculations. 924 1.002442002 1
…
Y'
0
0.1
0.2
0.3
0.4
0.5
0.6
0.7
0.8
0.9
1
0 0.1 0.2 0.3 0.4 0.5 0.6 0.7 0.8 0.9 1
Figure 6: Opto-electronic transfer characteristic
Using these sample values, form another set of video sample values, calculated using one of thestandard gamma curve equations. If this curve is plotted together with the measured camera curveover the same range of samples, it is possible to estimate which gamma curve has been used in thecamera. The curve can be plotted with linear or logarithmic axes. Should the curve not fit well, itis quite easy to derive a curve that does fit the data by manually adjusting the coefficients.
2.1.4 Analytical method - test card
Set up a ColorChecker test card, evenly illuminated. If the illumination cannot be made
even, record one exposure of the camera to the white side of a Kodak Gray card, for use asa reference in the calculations It is not necessary to be precise in exposure measurementsfor this test.
11
7/27/2019 tech3335 SETTAGGIO CAMERE
http://slidepdf.com/reader/full/tech3335-settaggio-camere 12/68
Measurement of imaging performance of TV cameras Tech 3335
12
With the ColorChecker card in view, record an image such that the white patch (bottomleft) produces peak white. It does not matter if the white is slightly clipped, the calculationswill allow for that. Note the lens aperture setting, although it is not necessary to be precisein exposure measurements for this test.
Record a series of exposures, with the lens closed down by one or two stops at a time, untilthe lowest reflectance patches in the grey scale are indistinct.
Capture each of these images into suitable software, and export Y’ values for each patch of the grey scale, at each captured exposure level. These values, together with the knownreflectance of the patches (see Appendix 2) and the estimated exposure levels, form a dataset exploring the gamma curve. Analysis is inevitably tedious and time-consuming, since adegree of human involvement is essential.
Import these values into a spreadsheet as Y’ values, and estimate relative exposure valuesbased on the numerical data for the chart and the approximate exposure levels.
Plot the results as a graph.
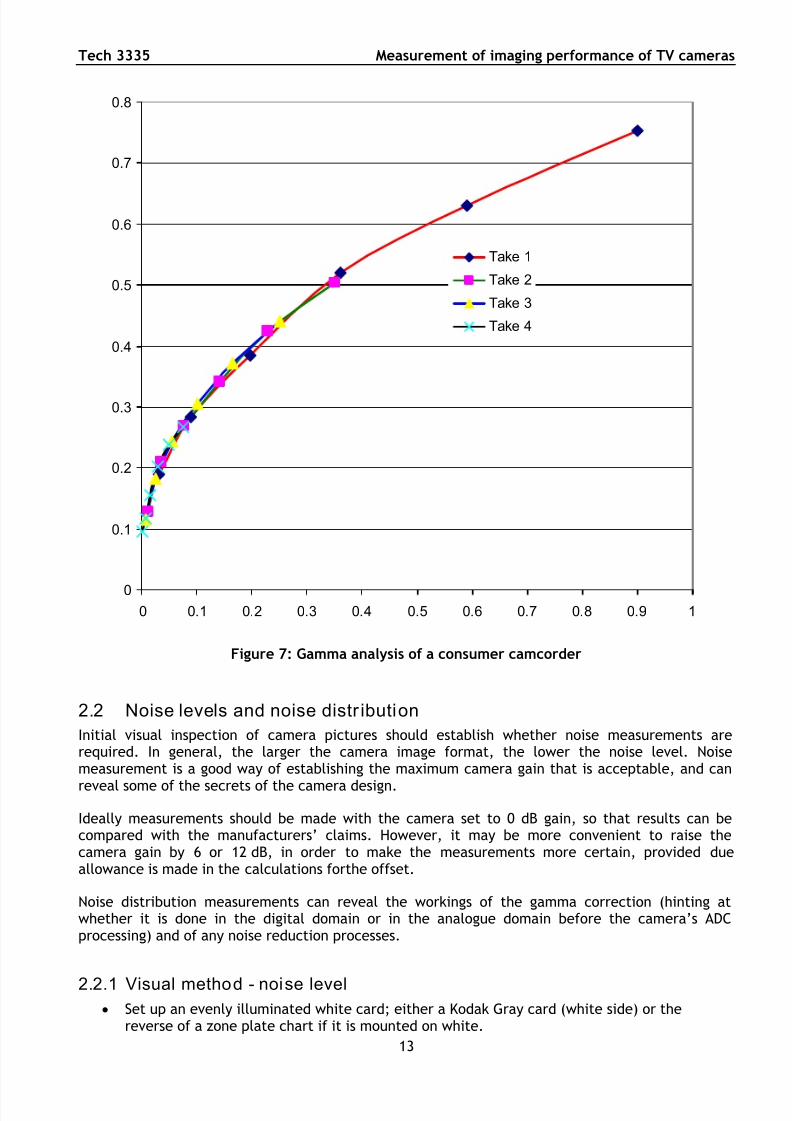
Each exposure produces 6 points on the gamma curve, and the relative exposure values can beestimated such that the Y’ points for each exposure fall onto a single curve rather than a set of similar curves. Once a single curve has been derived, a matching curve can be calculated as above(§ 2.1.3).
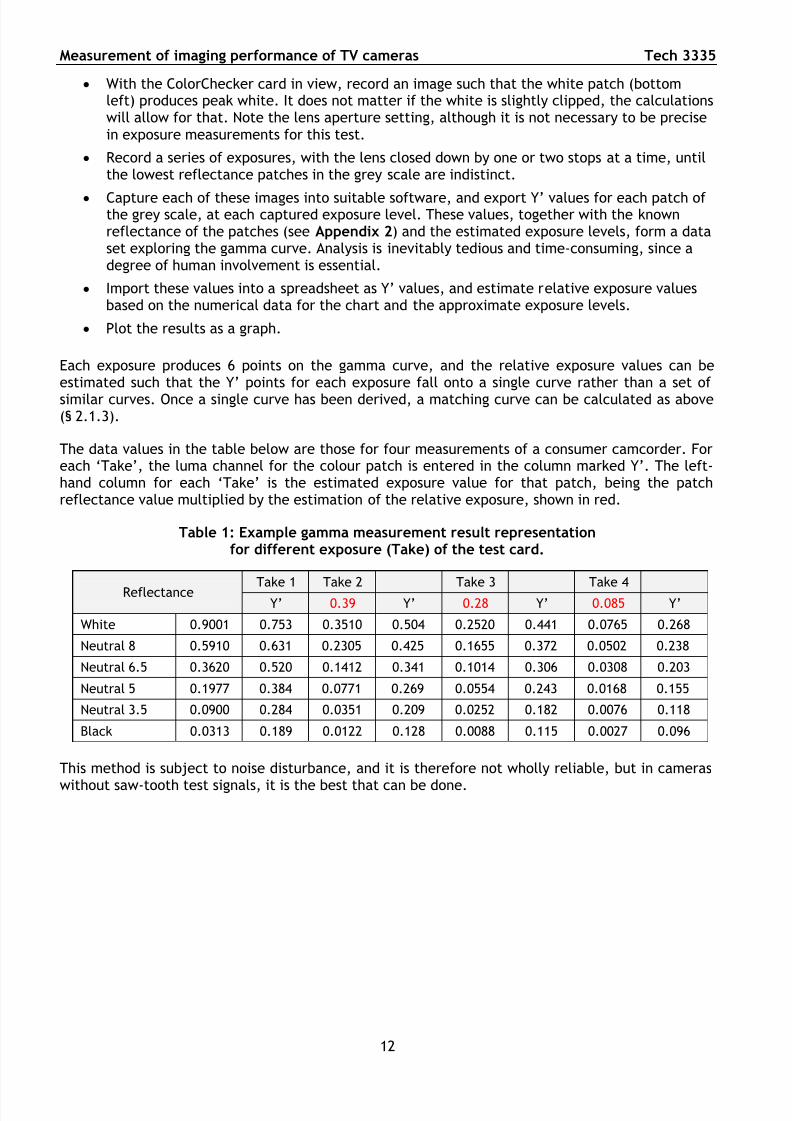
The data values in the table below are those for four measurements of a consumer camcorder. Foreach ‘Take’, the luma channel for the colour patch is entered in the column marked Y’. The left-hand column for each ‘Take’ is the estimated exposure value for that patch, being the patchreflectance value multiplied by the estimation of the relative exposure, shown in red.
Table 1: Example gamma measurement result representationfor different exposure (Take) of the test card.
Take 1 Take 2 Take 3 Take 4Reflectance
Y’ 0.39 Y’ 0.28 Y’ 0.085 Y’
White 0.9001 0.753 0.3510 0.504 0.2520 0.441 0.0765 0.268
Neutral 8 0.5910 0.631 0.2305 0.425 0.1655 0.372 0.0502 0.238
Neutral 6.5 0.3620 0.520 0.1412 0.341 0.1014 0.306 0.0308 0.203
Neutral 5 0.1977 0.384 0.0771 0.269 0.0554 0.243 0.0168 0.155
Neutral 3.5 0.0900 0.284 0.0351 0.209 0.0252 0.182 0.0076 0.118
Black 0.0313 0.189 0.0122 0.128 0.0088 0.115 0.0027 0.096
This method is subject to noise disturbance, and it is therefore not wholly reliable, but in cameras
without saw-tooth test signals, it is the best that can be done.
7/27/2019 tech3335 SETTAGGIO CAMERE
http://slidepdf.com/reader/full/tech3335-settaggio-camere 13/68
Tech 3335 Measurement of imaging performance of TV cameras
0
0.1
0.2
0.3
0.4
0.5
0.6
0.7
0.8
0 0.1 0.2 0.3 0.4 0.5 0.6 0.7 0.8 0.9 1
Take 1
Take 2
Take 3
Take 4
Figure 7: Gamma analysis of a consumer camcorder
2.2 Noise levels and noise distr ibution
Initial visual inspection of camera pictures should establish whether noise measurements arerequired. In general, the larger the camera image format, the lower the noise level. Noisemeasurement is a good way of establishing the maximum camera gain that is acceptable, and can
reveal some of the secrets of the camera design.
Ideally measurements should be made with the camera set to 0 dB gain, so that results can becompared with the manufacturers’ claims. However, it may be more convenient to raise thecamera gain by 6 or 12 dB, in order to make the measurements more certain, provided dueallowance is made in the calculations forthe offset.
Noise distribution measurements can reveal the workings of the gamma correction (hinting atwhether it is done in the digital domain or in the analogue domain before the camera’s ADCprocessing) and of any noise reduction processes.
2.2.1 Visual method - noise level Set up an evenly illuminated white card; either a Kodak Gray card (white side) or the
reverse of a zone plate chart if it is mounted on white.
13
7/27/2019 tech3335 SETTAGGIO CAMERE
http://slidepdf.com/reader/full/tech3335-settaggio-camere 14/68
Measurement of imaging performance of TV cameras Tech 3335
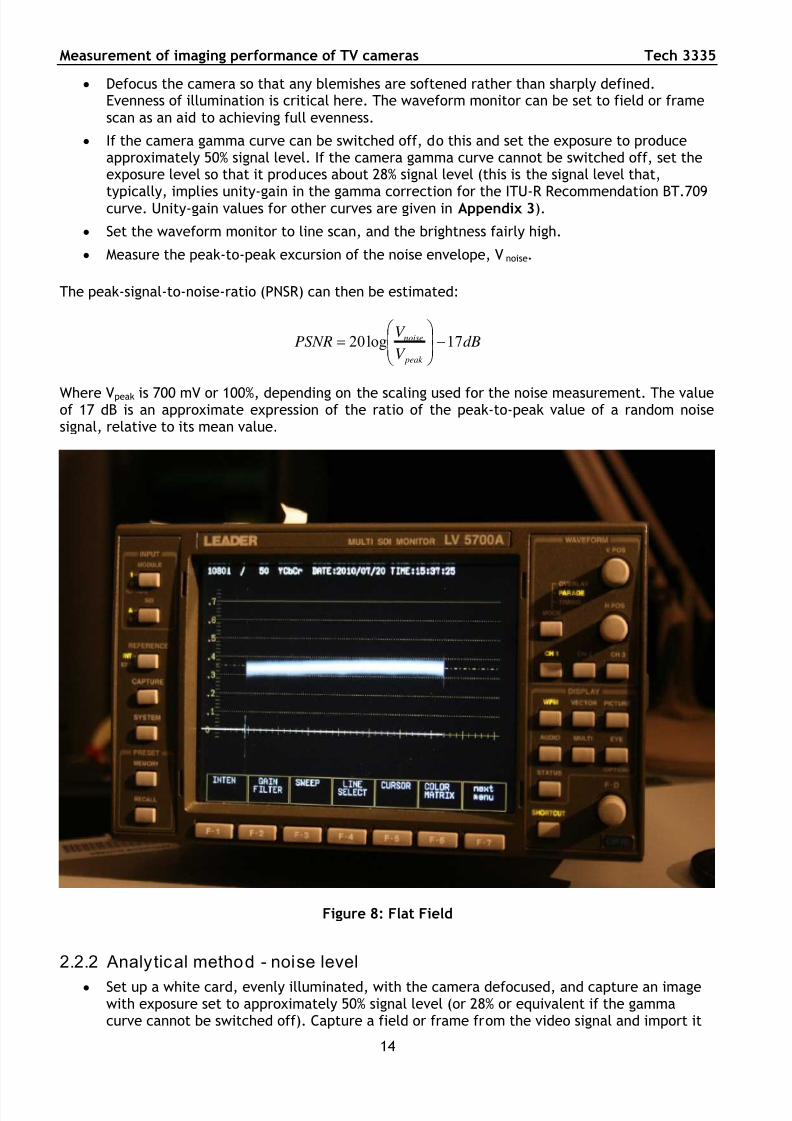
Defocus the camera so that any blemishes are softened rather than sharply defined.Evenness of illumination is critical here. The waveform monitor can be set to field or framescan as an aid to achieving full evenness.
If the camera gamma curve can be switched off, do this and set the exposure to produceapproximately 50% signal level. If the camera gamma curve cannot be switched off, set theexposure level so that it produces about 28% signal level (this is the signal level that,
typically, implies unity-gain in the gamma correction for the ITU-R Recommendation BT.709curve. Unity-gain values for other curves are given in Appendix 3).
Set the waveform monitor to line scan, and the brightness fairly high.
Measure the peak-to-peak excursion of the noise envelope, Vnoise.
The peak-signal-to-noise-ratio (PNSR) can then be estimated:
dBV
V PSNR
peak
noise 17log20
Where Vpeak is 700 mV or 100%, depending on the scaling used for the noise measurement. The valueof 17 dB is an approximate expression of the ratio of the peak-to-peak value of a random noisesignal, relative to its mean value.
Figure 8: Flat Field
2.2.2 Analytical method - noise level
Set up a white card, evenly illuminated, with the camera defocused, and capture an imagewith exposure set to approximately 50% signal level (or 28% or equivalent if the gammacurve cannot be switched off). Capture a field or frame from the video signal and import it
14
7/27/2019 tech3335 SETTAGGIO CAMERE
http://slidepdf.com/reader/full/tech3335-settaggio-camere 15/68
Tech 3335 Measurement of imaging performance of TV cameras
into specialised software
Perform a high-pass frequency filtering operation on the video data to remove the effects of any illumination shading. The filter should add an offset so that the result is not centred onzero, which could clip the noise and affect the measurements. Extra gain may also be usedhere, to ensure that the filtering operation loses no information, but any extra gain must beallowed for in the final calculation. Coefficients for a suitable filter are given in Appendix 4
As an alternative to filtering, the difference between two successive fields or frames can be used,provided it is known for certain that there is no change to the illumination between the recordedimages.
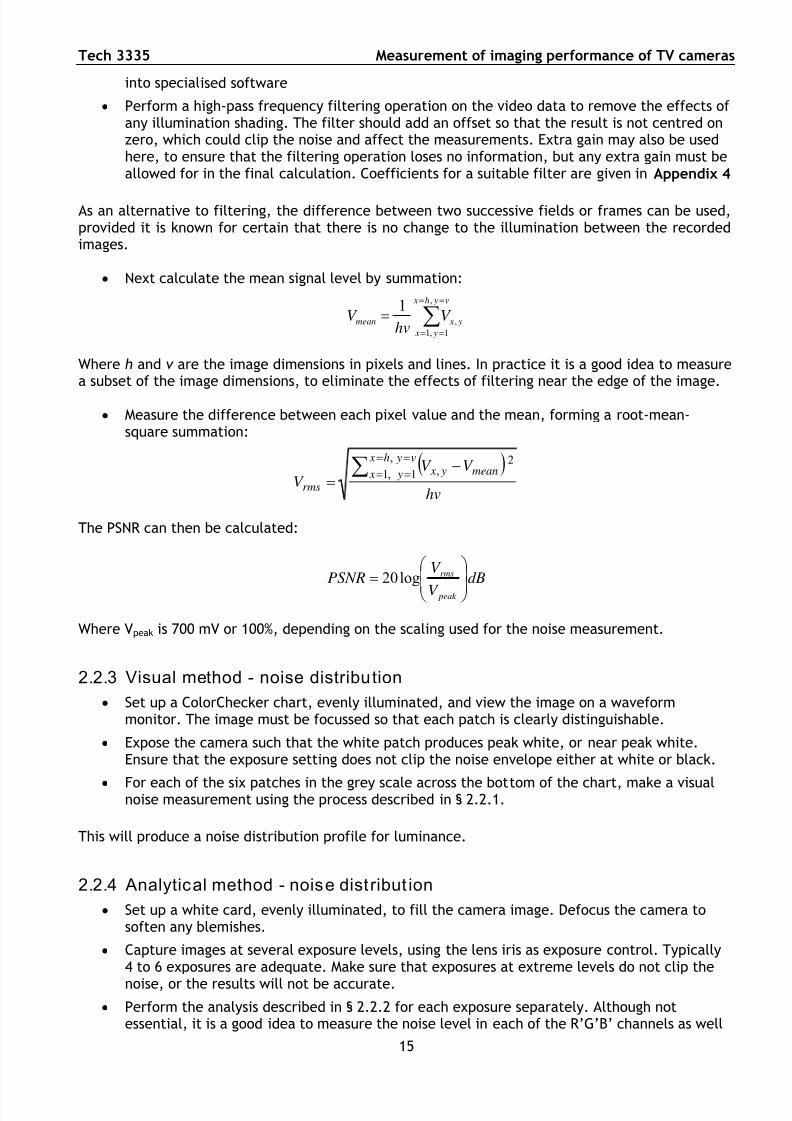
Next calculate the mean signal level by summation:
v yh x
y x
y xmean V hv
V ,
1,1
,
1
Where h and v are the image dimensions in pixels and lines. In practice it is a good idea to measurea subset of the image dimensions, to eliminate the effects of filtering near the edge of the image.
Measure the difference between each pixel value and the mean, forming a root-mean-square summation:
hv
V V V
v yh x
y x mean y x
rms
,
1,1
2,
The PSNR can then be calculated:
dBV
V PSNR
peak
rms
log20
Where Vpeak is 700 mV or 100%, depending on the scaling used for the noise measurement.
2.2.3 Visual method - noise distribution
Set up a ColorChecker chart, evenly illuminated, and view the image on a waveformmonitor. The image must be focussed so that each patch is clearly distinguishable.
Expose the camera such that the white patch produces peak white, or near peak white.Ensure that the exposure setting does not clip the noise envelope either at white or black.
For each of the six patches in the grey scale across the bottom of the chart, make a visualnoise measurement using the process described in § 2.2.1.
This will produce a noise distribution profile for luminance.
2.2.4 Analytical method - noise distribut ion
Set up a white card, evenly illuminated, to fill the camera image. Defocus the camera tosoften any blemishes.
Capture images at several exposure levels, using the lens iris as exposure control. Typically4 to 6 exposures are adequate. Make sure that exposures at extreme levels do not clip the
noise, or the results will not be accurate.
Perform the analysis described in § 2.2.2 for each exposure separately. Although notessential, it is a good idea to measure the noise level in each of the R’G’B’ channels as well
15

7/27/2019 tech3335 SETTAGGIO CAMERE
http://slidepdf.com/reader/full/tech3335-settaggio-camere 16/68
Measurement of imaging performance of TV cameras Tech 3335
as the luma Y’ channel.
Care must be taken to ensure that the correct decoding equations are used for the video signals,those of ITU-R Rec. BT.709 for HDTV, those of ITU-R Rec. BT.601 for SDTV. Noise can also bemeasured in the chroma channels if necessary.
2.3 Sensitivity
Sensitivity cannot be measured visually, but analytical processes are not needed either.
Sensitivity is normally expressed in one of two ways:
Broadcast/Professional cameras: the lens transmission number (T/) at which the camera makespeak white from a 90% reflectance card, lit at 2000 lux, when the camera has 0 dB gain and anormal gamma curve without knee (or with the gamma switched off).
Consumer/‘Pro-sumer’ cameras: the illumination level which produces a peak white signal from a90% reflectance card, when the lens is at maximum aperture, maximum gain, and possibly longestshutter exposure.
The two methods are linearly related and it is possible to derive each from the other.
Set up a Kodak Gray card, white side to the camera, evenly illuminated, and defocus thecamera to spread any blemishes in the card. Alternatively, a ColorChecker chard can beused since the white patch has a reflectance almost identical to that of the Kodak Graycard, white side.
With the camera set to 0 dB gain and standard shutter period, set the exposure such thatthe signal level is 100% (peak white).
Note the lens aperture setting, and measure the illumination in lux as L100%.
The sensitivity can be calculated:
%100
%1002000
2000//
LF F
Where F/2000 is the lens aperture at 2000 Lux illumination and L/100% is the illumination at pealwhite.
Strictly, lens T/ numbers should be used, but these can rarely be derived except in lenses designed
for cinema film shooting, so the F/ number is the best that can be derived.
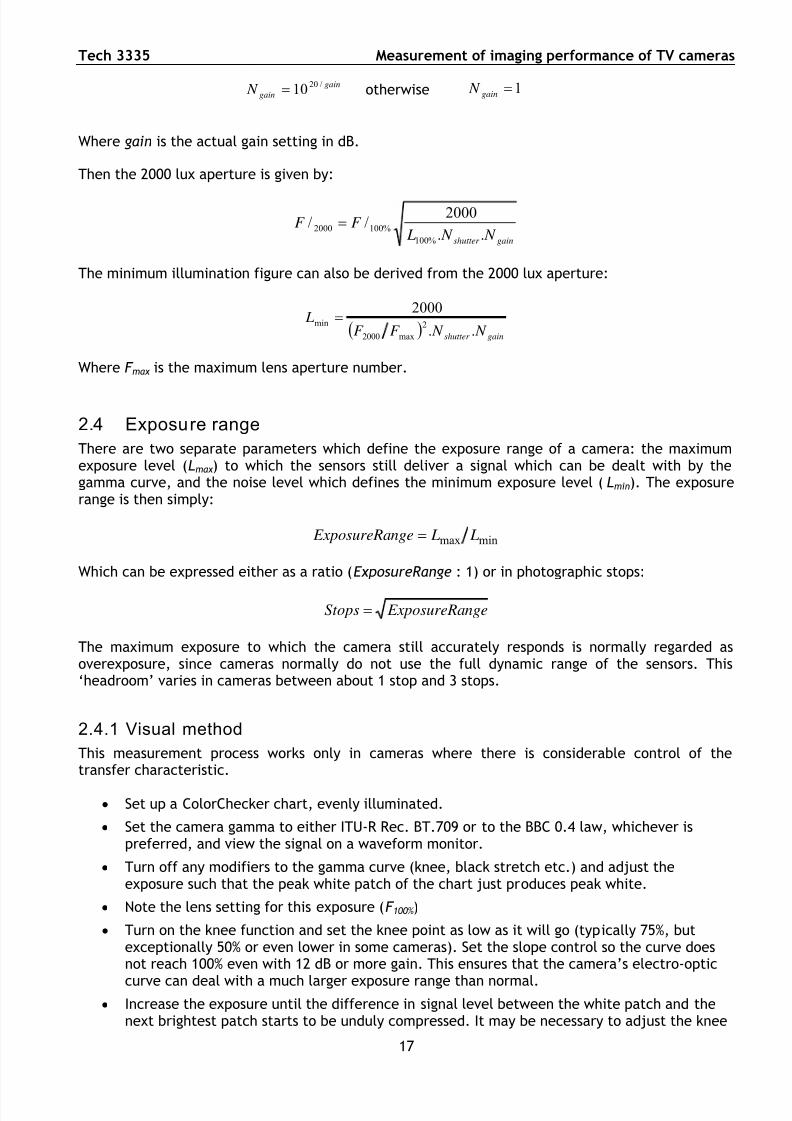
This measure can be derived from the minimum illumination figure by deriving compensations foreach parameter which affects sensitivity:
If the shutter is not nominal (e.g. 1/50 for 50 Hz cameras):
501
501 n
n N shutter
otherwise 1shutter N
Where n is the actual shutter period expressed as 1/n.
If the gain is not nominal (0 dB):
16
7/27/2019 tech3335 SETTAGGIO CAMERE
http://slidepdf.com/reader/full/tech3335-settaggio-camere 17/68
Tech 3335 Measurement of imaging performance of TV cameras
gain
gain N /2010
otherwise 1gain N
Where gain is the actual gain setting in dB.
Then the 2000 lux aperture is given by:
gainshutter N N LF F
..
2000//
%100
%1002000
The minimum illumination figure can also be derived from the 2000 lux aperture:
gainshutter N N F F L
..
20002
max2000
min
Where F max is the maximum lens aperture number.
2.4 Exposure range
There are two separate parameters which define the exposure range of a camera: the maximumexposure level (Lmax ) to which the sensors still deliver a signal which can be dealt with by thegamma curve, and the noise level which defines the minimum exposure level (Lmin). The exposurerange is then simply:
minmax L Lnge ExposureRa
Which can be expressed either as a ratio (ExposureRange : 1) or in photographic stops:
nge ExposureRaStops
The maximum exposure to which the camera still accurately responds is normally regarded asoverexposure, since cameras normally do not use the full dynamic range of the sensors. This‘headroom’ varies in cameras between about 1 stop and 3 stops.
2.4.1 Visual method
This measurement process works only in cameras where there is considerable control of thetransfer characteristic.
Set up a ColorChecker chart, evenly illuminated.
Set the camera gamma to either ITU-R Rec. BT.709 or to the BBC 0.4 law, whichever ispreferred, and view the signal on a waveform monitor.
Turn off any modifiers to the gamma curve (knee, black stretch etc.) and adjust theexposure such that the peak white patch of the chart just produces peak white.
Note the lens setting for this exposure (F 100% )
Turn on the knee function and set the knee point as low as it will go (typically 75%, butexceptionally 50% or even lower in some cameras). Set the slope control so the curve doesnot reach 100% even with 12 dB or more gain. This ensures that the camera’s electro-optic
curve can deal with a much larger exposure range than normal. Increase the exposure until the difference in signal level between the white patch and the
next brightest patch starts to be unduly compressed. It may be necessary to adjust the knee
17
7/27/2019 tech3335 SETTAGGIO CAMERE
http://slidepdf.com/reader/full/tech3335-settaggio-camere 18/68
Measurement of imaging performance of TV cameras Tech 3335
controls until this condition is met. When met, adjust the slope control so the peak whitepatch just reaches 100%.
Note the exposure level for this setting (Fmax). The difference between these values is theheadroom in photographic stops.
max%100 F F ops HeadroomSt or:2
max%100 )( F F Headroom
The minimum usable exposure (Lmin) approximates to the rms value of noise, although this is usuallydefined by the manufacturers with gamma correction switched off, and so does not necessarilyrepresent the noise level near black. Noise levels can be affected by the setting of blackstretch/press, which is used primarily to reveal or conceal detail at very low signal levels, nearblack. Thus:
min L Headroomnge ExposureRa
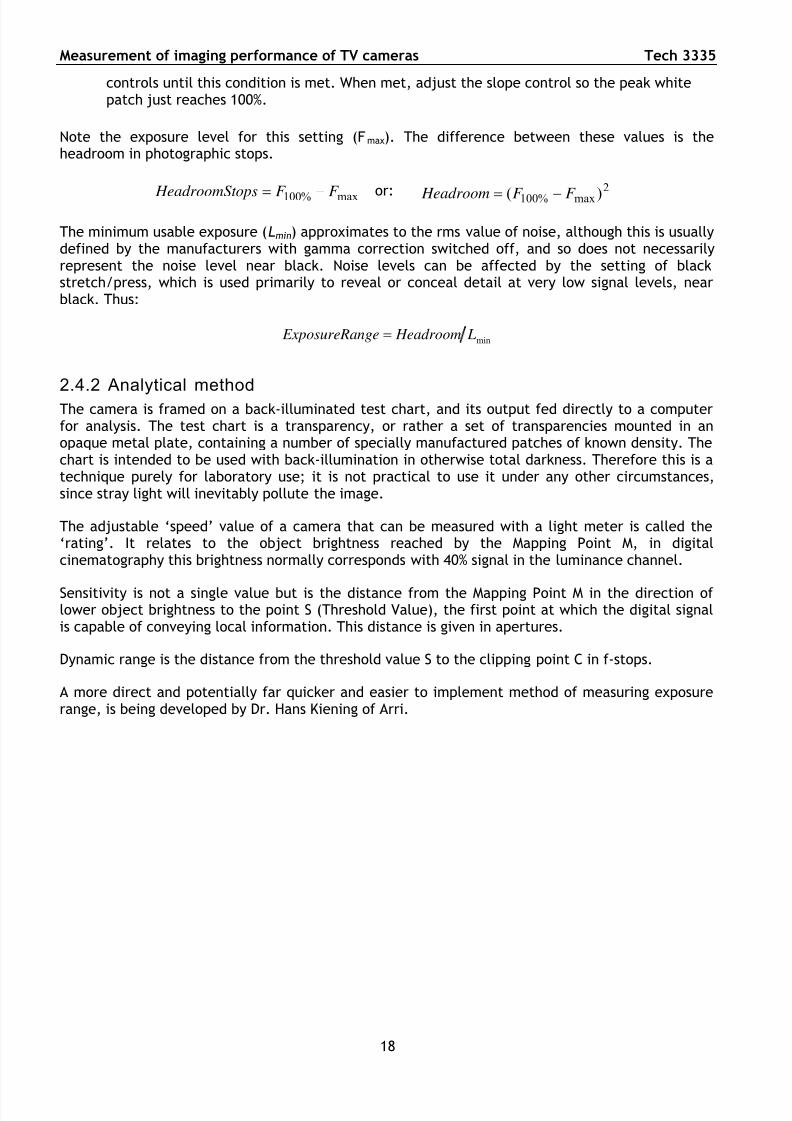
2.4.2 Analytical methodThe camera is framed on a back-illuminated test chart, and its output fed directly to a computerfor analysis. The test chart is a transparency, or rather a set of transparencies mounted in anopaque metal plate, containing a number of specially manufactured patches of known density. Thechart is intended to be used with back-illumination in otherwise total darkness. Therefore this is atechnique purely for laboratory use; it is not practical to use it under any other circumstances,since stray light will inevitably pollute the image.
The adjustable ‘speed’ value of a camera that can be measured with a light meter is called the‘rating’. It relates to the object brightness reached by the Mapping Point M, in digitalcinematography this brightness normally corresponds with 40% signal in the luminance channel.
Sensitivity is not a single value but is the distance from the Mapping Point M in the direction of lower object brightness to the point S (Threshold Value), the first point at which the digital signalis capable of conveying local information. This distance is given in apertures.
Dynamic range is the distance from the threshold value S to the clipping point C in f-stops.
A more direct and potentially far quicker and easier to implement method of measuring exposurerange, is being developed by Dr. Hans Kiening of Arri.
18
7/27/2019 tech3335 SETTAGGIO CAMERE
http://slidepdf.com/reader/full/tech3335-settaggio-camere 19/68
Tech 3335 Measurement of imaging performance of TV cameras
Figure 9: Exposure Range analytical method
19
7/27/2019 tech3335 SETTAGGIO CAMERE
http://slidepdf.com/reader/full/tech3335-settaggio-camere 20/68
Measurement of imaging performance of TV cameras Tech 3335
2.5 Colour rendering
Set up a ColorChecker test card, evenly illuminated. In practice, it is best to house theColorChecker chart in an internally illuminated box, with a colour-temperature shifting filter toachieve an illuminant correlated colour temperature of P3200, that of tungsten studio luminaires.
White balance the camera to the illuminant (use a Kodak Gray card, white side, as the reference,under the illuminant for the ColorChecker card). Knee function should be turned off if possible, toavoid compressing highlights. If knee cannot be turned off, then the exposure level should be setsuch that the grey scale patches are not compressed near white.
2.5.1 Visual method
View the video signal on a picture monitor.
Next to the monitor, place another ColorChecker test card evenly illuminated to IlluminantD65, the white balance point for television. This should also be housed in a light box, with acolour-temperature shifting filter to achieve D65, and will be referred to as the ‘referencechart’ below.
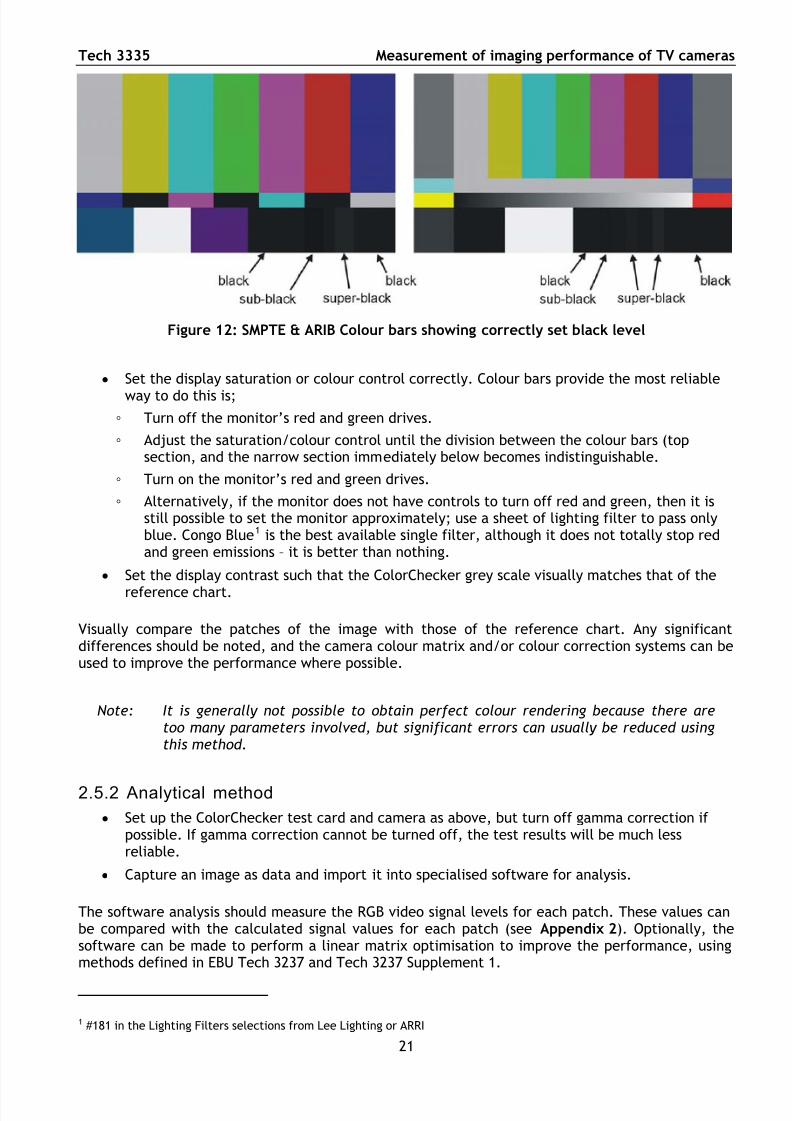
Ensure that the display black level is correctly set, using either SMPTE or ARIB colour bars,such that the sub-black patches are not visible, but the super-black patches are visible.
20
7/27/2019 tech3335 SETTAGGIO CAMERE
http://slidepdf.com/reader/full/tech3335-settaggio-camere 21/68
Tech 3335 Measurement of imaging performance of TV cameras
Figure 12: SMPTE & ARIB Colour bars showing correctly set black level
Set the display saturation or colour control correctly. Colour bars provide the most reliable
way to do this is;
◦ Turn off the monitor’s red and green drives.
◦ Adjust the saturation/colour control until the division between the colour bars (topsection, and the narrow section immediately below becomes indistinguishable.
◦ Turn on the monitor’s red and green drives.
◦ Alternatively, if the monitor does not have controls to turn off red and green, then it isstill possible to set the monitor approximately; use a sheet of lighting filter to pass onlyblue. Congo Blue1 is the best available single filter, although it does not totally stop redand green emissions – it is better than nothing.
Set the display contrast such that the ColorChecker grey scale visually matches that of the
reference chart.
Visually compare the patches of the image with those of the reference chart. Any significantdifferences should be noted, and the camera colour matrix and/or colour correction systems can beused to improve the performance where possible.
Note: It is generally not possible to obtain perfect colour rendering because there aretoo many parameters involved, but significant errors can usually be reduced usingthis method.
2.5.2 Analytical method
Set up the ColorChecker test card and camera as above, but turn off gamma correction if possible. If gamma correction cannot be turned off, the test results will be much lessreliable.
Capture an image as data and import it into specialised software for analysis.
The software analysis should measure the RGB video signal levels for each patch. These values canbe compared with the calculated signal values for each patch (see Appendix 2). Optionally, thesoftware can be made to perform a linear matrix optimisation to improve the performance, usingmethods defined in EBU Tech 3237 and Tech 3237 Supplement 1.
1 #181 in the Lighting Filters selections from Lee Lighting or ARRI
21
7/27/2019 tech3335 SETTAGGIO CAMERE
http://slidepdf.com/reader/full/tech3335-settaggio-camere 22/68
Measurement of imaging performance of TV cameras Tech 3335
If the camera gamma correction cannot be turned off then the software should perform a reversegamma-correction, using the inverse of the formula found by measurement, above (§ 2.1).
2.6 Infrared response
The camera should not respond to infrared illumination, since such illumination is not visible to the
human eye. While the analytical measurement methods described in EBU Tech 3237 can beextended to produce a measure of the infrared response of the camera, a much simpler process canbe used as a pass/fail test.
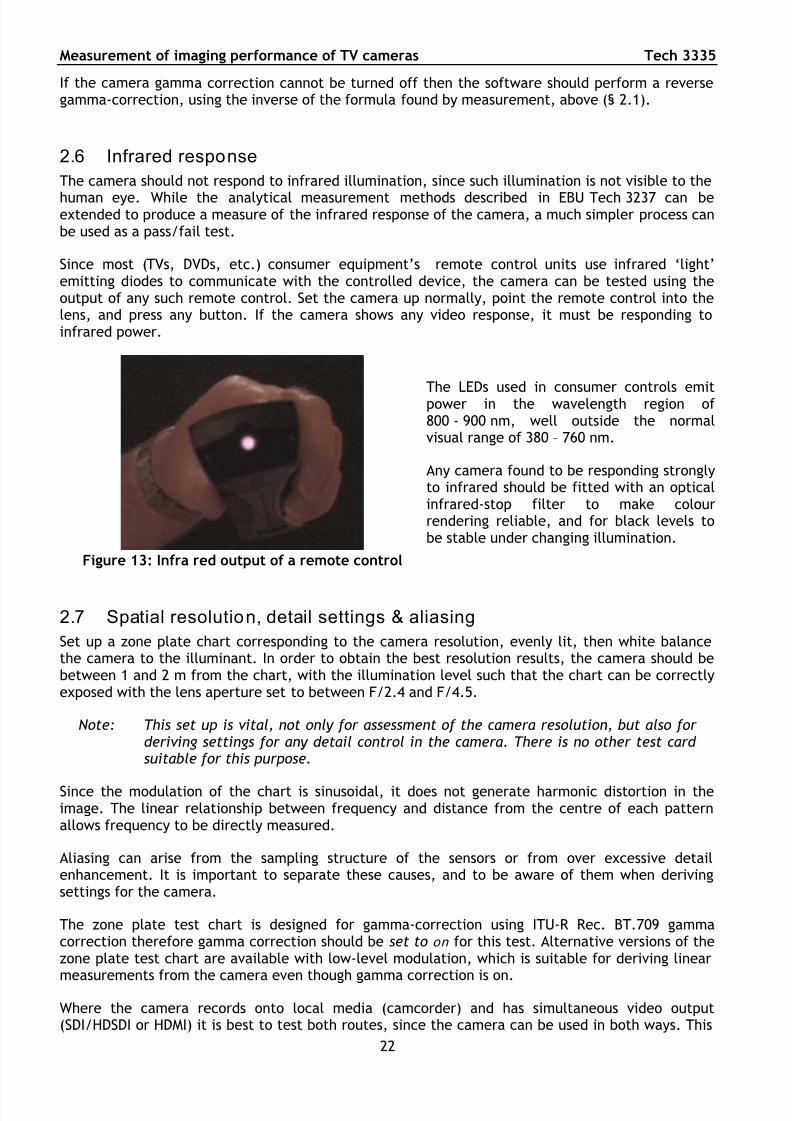
Since most (TVs, DVDs, etc.) consumer equipment’s remote control units use infrared ‘light’emitting diodes to communicate with the controlled device, the camera can be tested using theoutput of any such remote control. Set the camera up normally, point the remote control into thelens, and press any button. If the camera shows any video response, it must be responding toinfrared power.
Figure 13: Infra red output of a remote control
The LEDs used in consumer controls emitpower in the wavelength region of 800 - 900 nm, well outside the normalvisual range of 380 – 760 nm.
Any camera found to be responding stronglyto infrared should be fitted with an opticalinfrared-stop filter to make colourrendering reliable, and for black levels tobe stable under changing illumination.
2.7 Spatial resolution, detail settings & aliasing
Set up a zone plate chart corresponding to the camera resolution, evenly lit, then white balancethe camera to the illuminant. In order to obtain the best resolution results, the camera should bebetween 1 and 2 m from the chart, with the illumination level such that the chart can be correctlyexposed with the lens aperture set to between F/2.4 and F/4.5.
Note: This set up is vital, not only for assessment of the camera resolution, but also for deriving settings for any detail control in the camera. There is no other test card suitable for this purpose.
Since the modulation of the chart is sinusoidal, it does not generate harmonic distortion in theimage. The linear relationship between frequency and distance from the centre of each patternallows frequency to be directly measured.
Aliasing can arise from the sampling structure of the sensors or from over excessive detailenhancement. It is important to separate these causes, and to be aware of them when derivingsettings for the camera.
The zone plate test chart is designed for gamma-correction using ITU-R Rec. BT.709 gammacorrection therefore gamma correction should be set to on for this test. Alternative versions of thezone plate test chart are available with low-level modulation, which is suitable for deriving linear
measurements from the camera even though gamma correction is on.
Where the camera records onto local media (camcorder) and has simultaneous video output(SDI/HDSDI or HDMI) it is best to test both routes, since the camera can be used in both ways. This
22
7/27/2019 tech3335 SETTAGGIO CAMERE
http://slidepdf.com/reader/full/tech3335-settaggio-camere 23/68
Tech 3335 Measurement of imaging performance of TV cameras
will reveal the nature of any sub-sampling and filtering in the recording process.
2.7.1 Visual method - resolution
Switch off any camera detail control, so that the camera is delivering its nativeperformance.
View the image on the picture monitor and /or waveform monitor.
The resolution limits of the camera should be plainly visible on the luma (grey scale) pattern(horizontal frequency horizontally, vertical frequency vertically). Low frequencies should be clearlyvisible as sinusoidal variations in brightness, while frequencies beyond the limits of the camerashould fade smoothly to mid-grey.
The frequency limits can be measured with a ruler or using the waveform monitor’s graticulemarkings, since the individual patterns have a linear relationship between frequency and radius.Should there be any imbalance between the frequency limits of red green and blue, these shouldbe noted, as they give insightful information regarding the structure of the sensors and the signalprocess.
2.7.2 Analytical method – resolution
Switch off any detail controls in the camera.
Capture a frame image and import it into suitable software.
Export horizontal and/or vertical sweeps through the centre of the patterns of interest,forming a series of video samples.
Import these into a spreadsheet and plot the results as a graph.
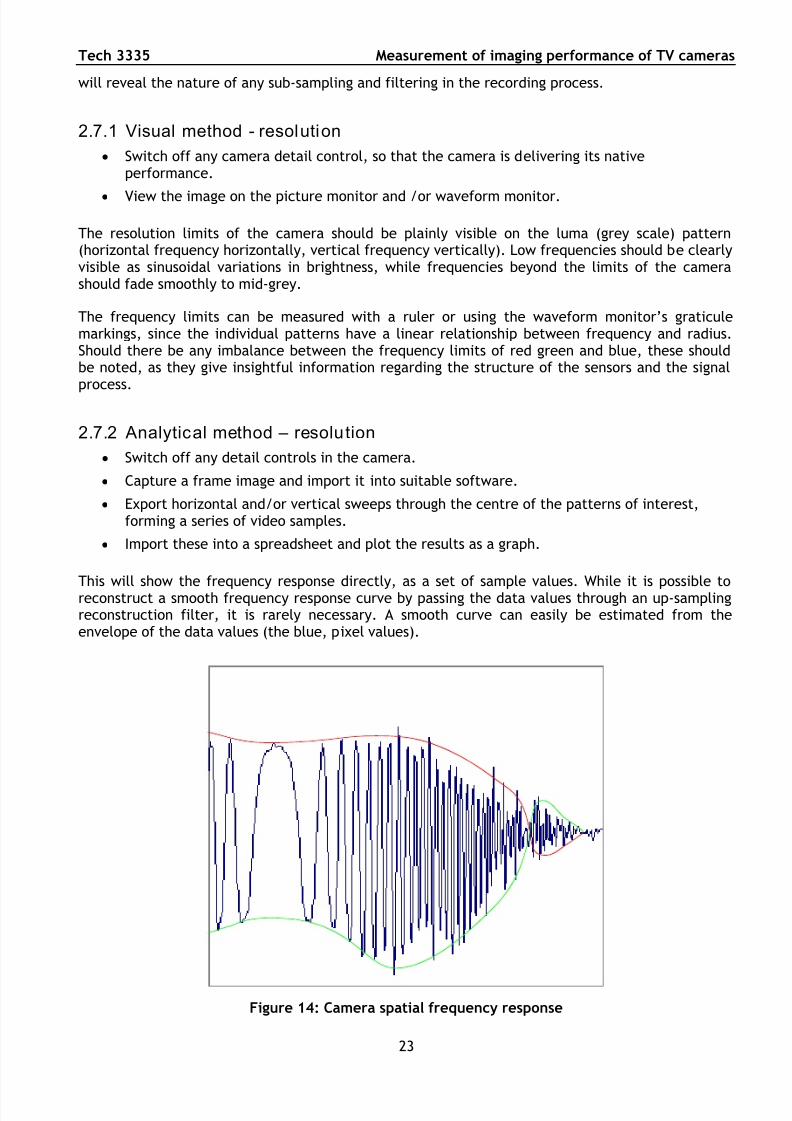
This will show the frequency response directly, as a set of sample values. While it is possible toreconstruct a smooth frequency response curve by passing the data values through an up-samplingreconstruction filter, it is rarely necessary. A smooth curve can easily be estimated from theenvelope of the data values (the blue, pixel values).
Figure 14: Camera spatial frequency response
23
7/27/2019 tech3335 SETTAGGIO CAMERE
http://slidepdf.com/reader/full/tech3335-settaggio-camere 24/68
Measurement of imaging performance of TV cameras Tech 3335
Note that the upper and lower envelopes of these curves (red and green lines) may not besymmetrical, because of the effects of gamma correction. Therefore, results obtained in this wayshould be regarded only as indicative of frequency response and resolution, and cannot be used forany other purpose.
2.7.3 Visual method – detail settings
The derivation of detail-enhancement settings for individual programme genres is difficult andsubjective; it is generally not possible to derive one setting which will please all users.
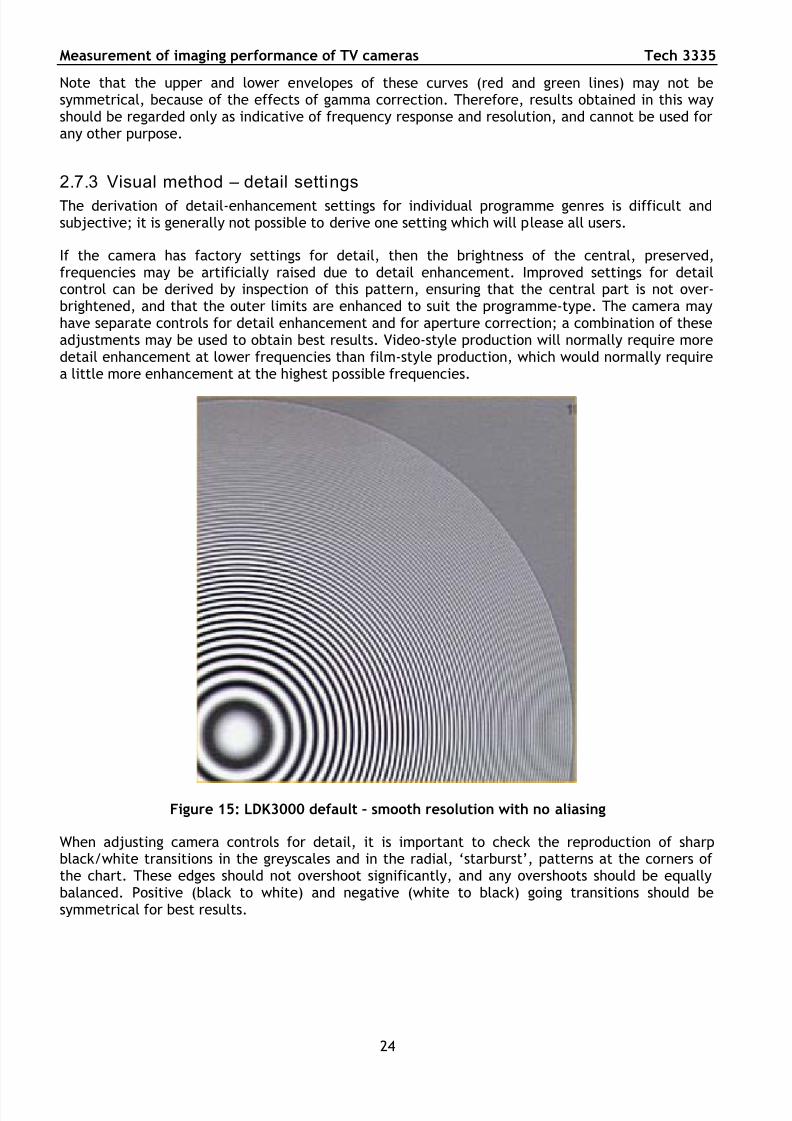
If the camera has factory settings for detail, then the brightness of the central, preserved,frequencies may be artificially raised due to detail enhancement. Improved settings for detailcontrol can be derived by inspection of this pattern, ensuring that the central part is not over-brightened, and that the outer limits are enhanced to suit the programme-type. The camera mayhave separate controls for detail enhancement and for aperture correction; a combination of theseadjustments may be used to obtain best results. Video-style production will normally require moredetail enhancement at lower frequencies than film-style production, which would normally requirea little more enhancement at the highest possible frequencies.
Figure 15: LDK3000 default – smooth resolution with no aliasing
When adjusting camera controls for detail, it is important to check the reproduction of sharpblack/white transitions in the greyscales and in the radial, ‘starburst’, patterns at the corners of the chart. These edges should not overshoot significantly, and any overshoots should be equallybalanced. Positive (black to white) and negative (white to black) going transitions should besymmetrical for best results.
24
7/27/2019 tech3335 SETTAGGIO CAMERE
http://slidepdf.com/reader/full/tech3335-settaggio-camere 25/68
Tech 3335 Measurement of imaging performance of TV cameras
Figure 16: HFD V10 – overshoot between black/white transitions
2.7.4 Analytical method – detail settings
It is not possible to set detail controls by any analytical means, since the effects of the controlsmust be seen in real-time. However, the process is ideal for recording the result of visuallyachieved settings. Capture a frame of video and follow the processes described above (§ 2.7.2).
2.7.5 Visual method – aliasing
View the camera output on the picture monitor.
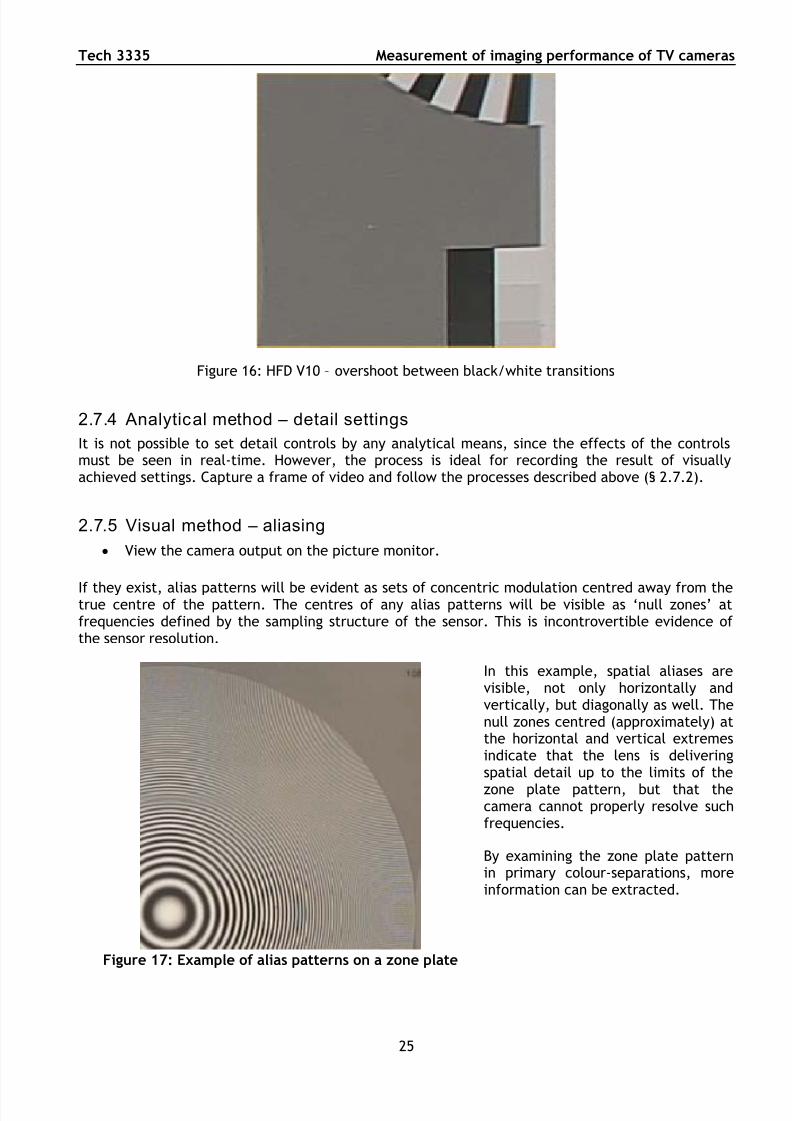
If they exist, alias patterns will be evident as sets of concentric modulation centred away from thetrue centre of the pattern. The centres of any alias patterns will be visible as ‘null zones’ atfrequencies defined by the sampling structure of the sensor. This is incontrovertible evidence of the sensor resolution.
Figure 17: Example of alias patterns on a zone plate
In this example, spatial aliases arevisible, not only horizontally andvertically, but diagonally as well. Thenull zones centred (approximately) atthe horizontal and vertical extremesindicate that the lens is deliveringspatial detail up to the limits of the
zone plate pattern, but that thecamera cannot properly resolve suchfrequencies.
By examining the zone plate patternin primary colour-separations, moreinformation can be extracted.
25
7/27/2019 tech3335 SETTAGGIO CAMERE
http://slidepdf.com/reader/full/tech3335-settaggio-camere 26/68
Measurement of imaging performance of TV cameras Tech 3335
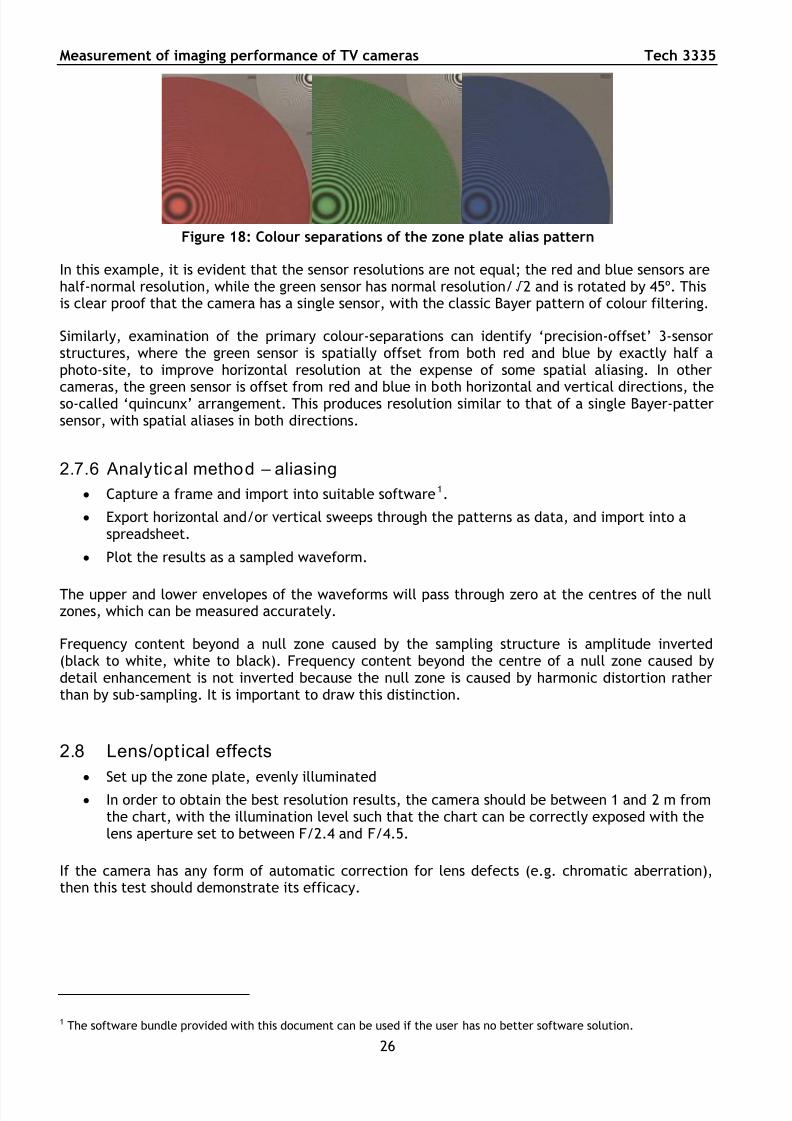
Figure 18: Colour separations of the zone plate alias pattern
In this example, it is evident that the sensor resolutions are not equal; the red and blue sensors arehalf-normal resolution, while the green sensor has normal resolution/√ 2 and is rotated by 45º. Thisis clear proof that the camera has a single sensor, with the classic Bayer pattern of colour filtering.
Similarly, examination of the primary colour-separations can identify ‘precision-offset’ 3-sensorstructures, where the green sensor is spatially offset from both red and blue by exactly half aphoto-site, to improve horizontal resolution at the expense of some spatial aliasing. In other
cameras, the green sensor is offset from red and blue in both horizontal and vertical directions, theso-called ‘quincunx’ arrangement. This produces resolution similar to that of a single Bayer-pattersensor, with spatial aliases in both directions.
2.7.6 Analytical method – aliasing
Capture a frame and import into suitable software 1.
Export horizontal and/or vertical sweeps through the patterns as data, and import into aspreadsheet.
Plot the results as a sampled waveform.
The upper and lower envelopes of the waveforms will pass through zero at the centres of the nullzones, which can be measured accurately.
Frequency content beyond a null zone caused by the sampling structure is amplitude inverted(black to white, white to black). Frequency content beyond the centre of a null zone caused bydetail enhancement is not inverted because the null zone is caused by harmonic distortion ratherthan by sub-sampling. It is important to draw this distinction.
2.8 Lens/opt ical effects
Set up the zone plate, evenly illuminated
In order to obtain the best resolution results, the camera should be between 1 and 2 m fromthe chart, with the illumination level such that the chart can be correctly exposed with thelens aperture set to between F/2.4 and F/4.5.
If the camera has any form of automatic correction for lens defects (e.g. chromatic aberration),then this test should demonstrate its efficacy.
1 The software bundle provided with this document can be used if the user has no better software solution.
26
7/27/2019 tech3335 SETTAGGIO CAMERE
http://slidepdf.com/reader/full/tech3335-settaggio-camere 27/68
7/27/2019 tech3335 SETTAGGIO CAMERE
http://slidepdf.com/reader/full/tech3335-settaggio-camere 28/68
Measurement of imaging performance of TV cameras Tech 3335
2.9.1 Visual method
Set the fan, brightly illuminated.
Position the camera at a convenient distance.
Set the shutter to its nominal value (1/50 second for 50 Hz, 1/60 for 59.94 Hz, or 180degrees for either).
View the pictures on the picture monitor.
Vary the fan speed while watching the images.
A camera with a ‘rolling shutter’ will show asymmetrical blades, a CCD camera will not. The bladescan be ‘frozen’ in the image when the fan speed is set to any harmonic of the scan speed:
b N Speed
3000 rpm for 50 Hz cameras or
b N Speed
3600 rpm for 60 Hz cameras
Where N = Nominal shutter speed and b = number of fan blades
To exaggerate the effect, reduce the camera shutter setting; typically, 1/1000 second should beenough. At this speed or higher, it will be possible to produce frozen images of the blades thatshow significant distortion.
2.9.2 Analytical method
Follow the procedure above (§2.9.1) and capture images as required. No mathematical analysis isneeded as the images are captured only for recording the effect.
3. Presentation of results
The results of measurements can form a useful reference document, summarising the camera’sperformance, and listing the contents of the control menus. It should not be thought of as asubstitute for the camera’s manual, but as an addition to it, summarising the camera’s capabilities.
The presentation should comprise:
An introductory section describing the salient features of the camera under test, pointingout any unusual features.
A listing of the control menu contents. Items in the menus which affect the image quality,and for which preferred settings have been derived that differ from the factory defaultvalues, should be highlighted to attract the reader’s attention. Footnotes can be useful inexplaining the preferred settings.
Results of measurements. Verbal descriptions of results from visual inspection need not becomplex. It is only necessary to state that such an inspection has been made, and whetherthe camera has performed to expected levels or not. Pictorial, graphical or numericalresults from analytical measurements should be accompanied by text that explains why themeasurements were made, together with an interpretation of the results.
A simple explanation of any Tier given to a camera as a result of the test with specificreference to the six points detailed in §5.
An example of a full camera measurement report is given in Appendix 7.
28
7/27/2019 tech3335 SETTAGGIO CAMERE
http://slidepdf.com/reader/full/tech3335-settaggio-camere 29/68
Tech 3335 Measurement of imaging performance of TV cameras
29
4. Derivation of preferred settings
While measurement of camera parameters is purely scientific, the derivation of preferred settingsfor a camera is largely an artistic process. Preferred settings for one programme type may not besuitable for another and are far more dependent upon the opinions of the programme-makersrather than those of technologists or engineers.
Therefore, it is usually true that when attempting to choose preferred camera settings, more thanone set will be required. With that in mind, it is useful to list the major programme-types togetherwith the customary camera performance that is traditionally expected for such programmes.
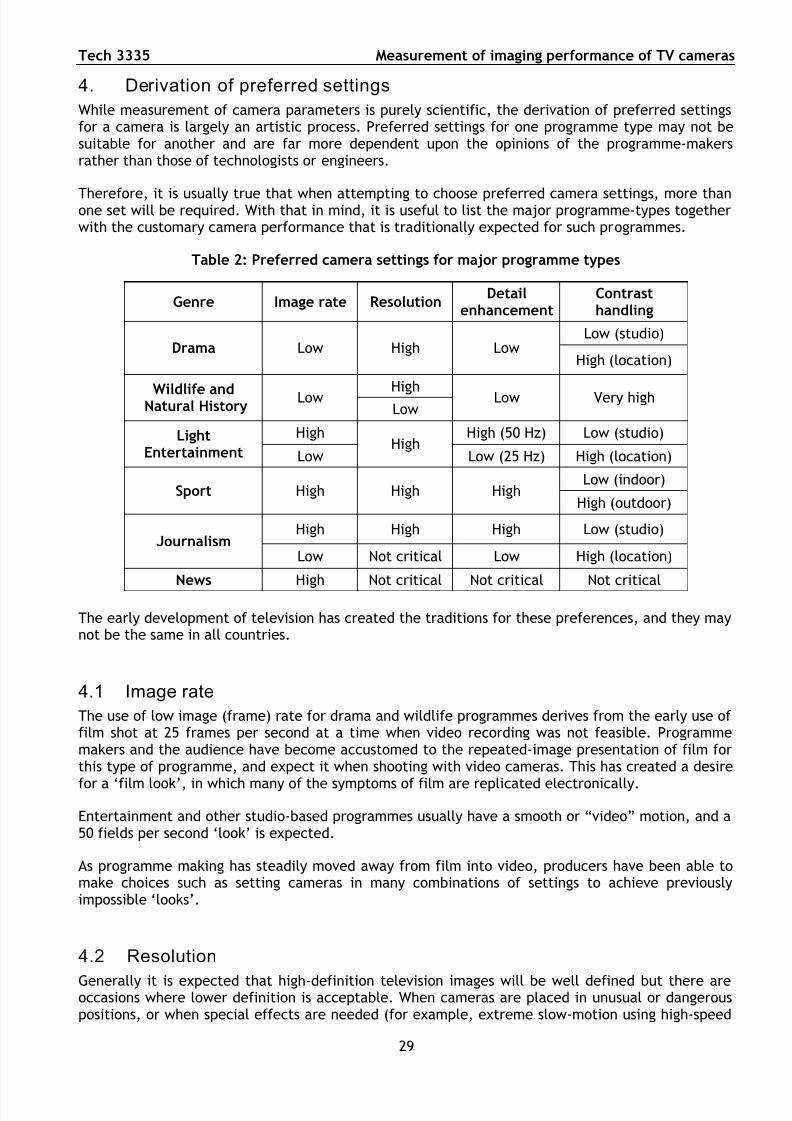
Table 2: Preferred camera settings for major programme types
Genre Image rate ResolutionDetail
enhancementContrasthandling
Low (studio)Drama Low High Low
High (location)
HighWildlife andNatural History
LowLow
Low Very high
High High (50 Hz) Low (studio)LightEntertainment Low
HighLow (25 Hz) High (location)
Low (indoor)Sport High High High
High (outdoor)
High High High Low (studio)Journalism
Low Not critical Low High (location)
News High Not critical Not critical Not critical
The early development of television has created the traditions for these preferences, and they maynot be the same in all countries.
4.1 Image rate
The use of low image (frame) rate for drama and wildlife programmes derives from the early use of film shot at 25 frames per second at a time when video recording was not feasible. Programmemakers and the audience have become accustomed to the repeated-image presentation of film forthis type of programme, and expect it when shooting with video cameras. This has created a desire
for a ‘film look’, in which many of the symptoms of film are replicated electronically.
Entertainment and other studio-based programmes usually have a smooth or “video” motion, and a50 fields per second ‘look’ is expected.
As programme making has steadily moved away from film into video, producers have been able tomake choices such as setting cameras in many combinations of settings to achieve previouslyimpossible ‘looks’.
4.2 Resolution
Generally it is expected that high-definition television images will be well defined but there areoccasions where lower definition is acceptable. When cameras are placed in unusual or dangerouspositions, or when special effects are needed (for example, extreme slow-motion using high-speed
7/27/2019 tech3335 SETTAGGIO CAMERE
http://slidepdf.com/reader/full/tech3335-settaggio-camere 30/68
Measurement of imaging performance of TV cameras Tech 3335
30
cameras), then lower resolution is inevitable.
Generally, low-resolution cameras or camera settings should not be used where high-resolutioncameras are available.
4.3 Detail enhancementHigh-end cameras always have the option to manipulate the frequency content of the image. Thereare usually many controls to enhance detail, and very occasionally to reduce detail. Carefulcombinations of settings can achieve a wide range of picture effects.
For programmes traditionally shot on film, a softer picture is generally preferred, since high-definition cameras can produce higher-amplitude detail at high frequencies than is delivered byfilm when scanned for television.
Programmes traditionally shot on video cameras usually have a sharper ‘crisper’ look. This isusually achieved by over-amplifying the edges of shapes. In the extreme, this can give rise toshadow outlines that may be objectionable, but in high-definition cameras this can be avoided
while still giving crisp-looking pictures.
Manipulation of detail enhancement settings is difficult to do without using a test card, and is verydifficult to do using small monitor displays. It is never satisfactory to set detail on a general scene,since unexpected effects will become apparent when the scene changes. The best method is to usea zone-plate chart under controlled conditions.
Low-detail, smooth, film-look. Set the boost frequency to its highest value then increasethe detail level until the lower frequencies appear to be gaining in contrast, but onlymarginally. It may be necessary to adjust balancing controls, separate controls of positive-and negative-going edges, and of horizontal and vertical detail, to keep the picture looking
neutral. The detail level should never be set so high that high-contrast edges (i.e. black-to-white and white-to-black) overshoot. It may also be necessary to adjust clipping controls toprevent large enhancements, and to avoid enhancing video noise.
High-detail, video-look. Set the boost frequency to a mid value and then raise the detaillevel until the lower frequencies gain in contrast, but not excessively. Use thehorizontal/vertical, positive/negative controls to maintain neutrality in the pictures.Moderate overshooting on high-contrast edges is acceptable, it is a signature of the ‘video-look’
4.4 Contrast handl ing
Wildlife and natural history programmes recording natural scenes require the capture of a largecontrast range. Negative film does this well, handling at least 14 photographic stops or dynamicrange, however video cameras cannot usually handle such a high range. A typical broadcast camerawith video noise levels of about -50dB can capture about 7.5 stops, with the controls set to factorysettings.
At low exposure levels, video signal noise will predominate, obscuring detail in deep shadow. If thenoise level is particularly high, then the effective dynamic range will be reduced by about 1 stopper 6dB of video noise level increase.
At high exposure levels, the sensor’s dynamic range may be exceeded, resulting in video clipping.However, most cameras do not normally use the entire dynamic range of the sensor, and can be set
to capture at least 1 extra photographic stop by manipulation of the gamma curve and/or knee. Insome extreme cases, cameras can capture up to 3 extra stops, and effectively handle 12 to 13 stopsof dynamic range, very close to that of negative film.
7/27/2019 tech3335 SETTAGGIO CAMERE
http://slidepdf.com/reader/full/tech3335-settaggio-camere 31/68
Tech 3335 Measurement of imaging performance of TV cameras
31
Black-stretch (and black-press) can be useful, allowing direct control over the slope of the lowerpart of the gamma curve. Black-stretch reveals dark detail, black-press conceals it. Applying black-stretch involves raising the gain near black, which will inevitably increase the noise level nearblack. It is always better to have higher gain near black in the camera rather than to apply it inpost-production, because fewer data-compression artefacts will be generated in the camerarecording.
Low-contrast performance. Scenic contrast is effectively expanded. Set the gamma curve toeither the BBC0.4 or ITU.709 curve, and set white clipping to not greater than about 104%. This willprevent signal excursions beyond peak white causing problems in analogue transmission systems.
High-contrast performance. Scenic contrast is effectively compressed. Two approaches arepossible.
If the camera has specific film-look gamma curves, use them.
◦ There may be several curves available, for high- and low-contrast scenes, and forshooting conditions which allow signals to excurse only to peak white level (100%) or tothe full signal range (109%). If the programme is to be shot live or as-live (i.e. there will
be no post-processing) then always use curves that do not exceed 100%. If the camera has no specific film-look curves, then use the ITU.709 gamma curve.
◦ Set the knee function on (manual knee) and the knee point to between 80% and 90%. Thiswill ensure that skin tones remain in the normal part of the gamma curve.
◦ Adjust the knee slope so it accommodates the desired degree of overexposure. In anormal gamma curve, the top 14% of the video signal range contains about 1 stop of exposure range, but by setting a lower slope to the knee function, this can be raised byat least one stop.
Beware of attempting to accommodate all the over-exposure that the camera can deliver, mostcamera operators will avoid using this range because the highlight compression will appear to betoo high, unless the knee point is set lower (e.g. to about 75% or lower for wildlife shooting) whenextra overexposure range does not look abnormal.
When setting the knee function, it is best to use the camera’s internal sawtooth test signal and awaveform monitor.
Set the camera gain to +6dB to set a curve to handle 1 stop of overload, +12dB to set for 2stops and so on. If the camera has no internal sawtooth test signal, then a grey scale can beused, the Colorchecker chart is suitable.
Set the knee point and slope, using the signal levels of the bottom-row grey-scale asindicators of the gamma-curve performance.
It is not possible to produce a comprehensive range of camera settings to satisfy all these needs,but it is perfectly possible to derive settings for individual requirements, parts of which can thenbe used separately or together, to satisfy the taste of other programme-makers.
7/27/2019 tech3335 SETTAGGIO CAMERE
http://slidepdf.com/reader/full/tech3335-settaggio-camere 32/68
Measurement of imaging performance of TV cameras Tech 3335
32
5. Bibliography
R. M. Evans Eye, film and camera incolor photography
John Wiley, new York; Chapman & Hall,London, 1959.
C. S. McCamy,H. Marcus and
J. G. Davidson
A color-rendition chart Journal of Applied Photographic Engineering,Vol. 2, #3, Summer 1976.
J. O. Drewery The zone plate as atelevision test pattern
BBC Research Department Report 23, 1978
A. Roberts Colorimetric and resolutionrequirements of cameras
BBC Research and Development DepartmentWhite Paper 034, 2002.
A. Roberts Circles of confusion EBU Technical, Geneva, 2009.
With thanks to Dr Hans Kiening for allowing his work to be represented in this document
7/27/2019 tech3335 SETTAGGIO CAMERE
http://slidepdf.com/reader/full/tech3335-settaggio-camere 33/68
Tech 3335 Measurement of imaging performance of TV cameras
Appendix 1 Kodak Gray Cards
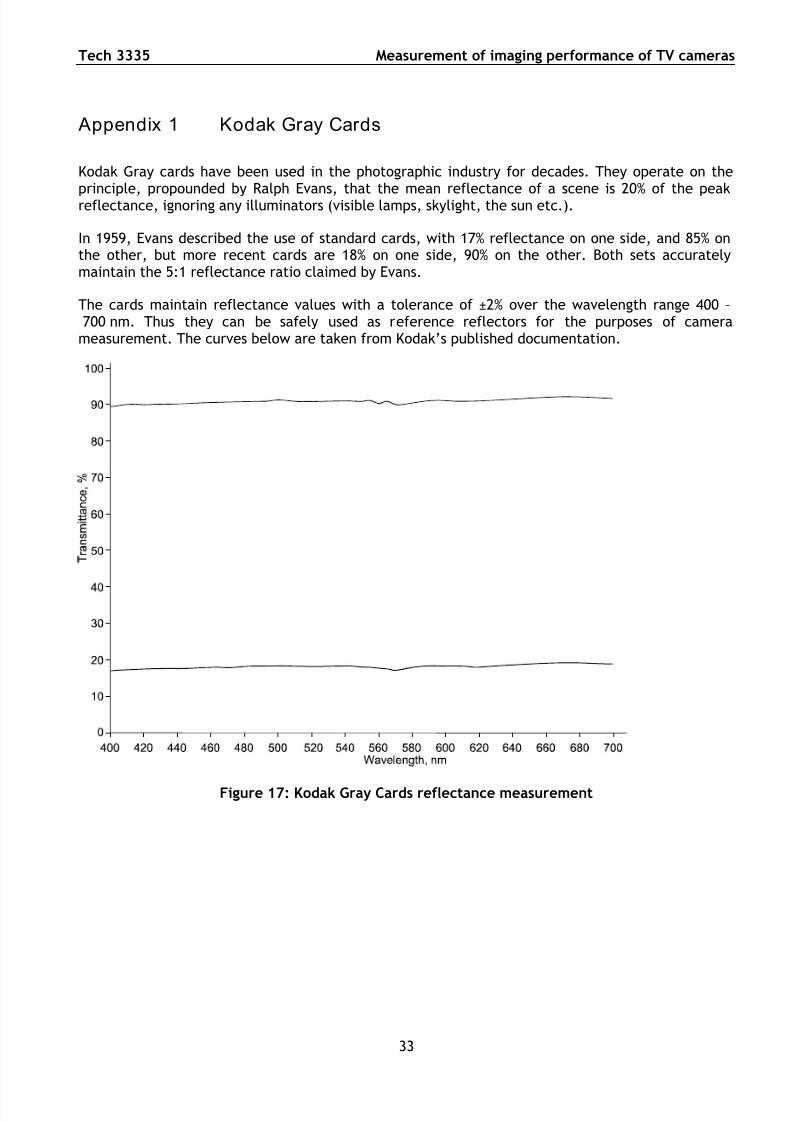
Kodak Gray cards have been used in the photographic industry for decades. They operate on the
principle, propounded by Ralph Evans, that the mean reflectance of a scene is 20% of the peakreflectance, ignoring any illuminators (visible lamps, skylight, the sun etc.).
In 1959, Evans described the use of standard cards, with 17% reflectance on one side, and 85% onthe other, but more recent cards are 18% on one side, 90% on the other. Both sets accuratelymaintain the 5:1 reflectance ratio claimed by Evans.
The cards maintain reflectance values with a tolerance of ±2% over the wavelength range 400 –700 nm. Thus they can be safely used as reference reflectors for the purposes of camerameasurement. The curves below are taken from Kodak’s published documentation.
Figure 17: Kodak Gray Cards reflectance measurement
33

7/27/2019 tech3335 SETTAGGIO CAMERE
http://slidepdf.com/reader/full/tech3335-settaggio-camere 34/68
Measurement of imaging performance of TV cameras Tech 3335
34
Page intentionally left blank. This document is paginated for two sided printing
7/27/2019 tech3335 SETTAGGIO CAMERE
http://slidepdf.com/reader/full/tech3335-settaggio-camere 35/68
Tech 3335 Measurement of imaging performance of TV cameras
35
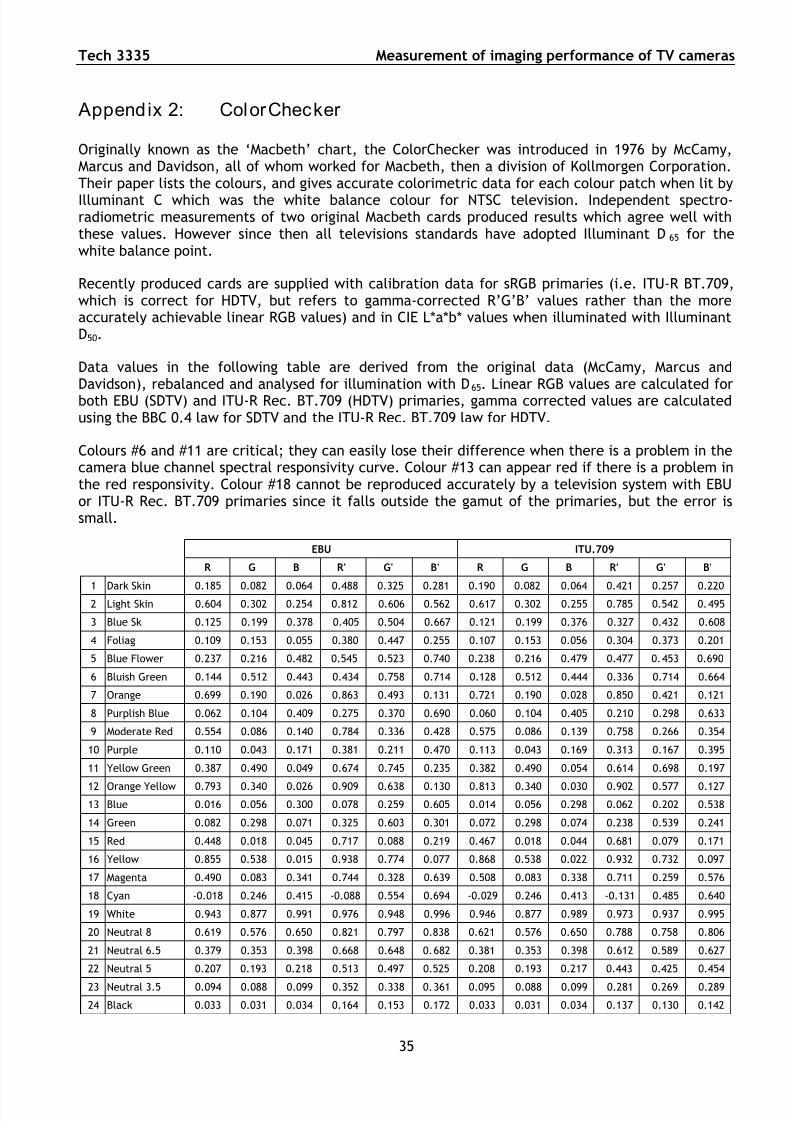
Appendix 2: ColorChecker
Originally known as the ‘Macbeth’ chart, the ColorChecker was introduced in 1976 by McCamy,Marcus and Davidson, all of whom worked for Macbeth, then a division of Kollmorgen Corporation.Their paper lists the colours, and gives accurate colorimetric data for each colour patch when lit by
Illuminant C which was the white balance colour for NTSC television. Independent spectro-radiometric measurements of two original Macbeth cards produced results which agree well withthese values. However since then all televisions standards have adopted Illuminant D65 for thewhite balance point.
Recently produced cards are supplied with calibration data for sRGB primaries (i.e. ITU-R BT.709,which is correct for HDTV, but refers to gamma-corrected R’G’B’ values rather than the moreaccurately achievable linear RGB values) and in CIE L*a*b* values when illuminated with IlluminantD50.
Data values in the following table are derived from the original data (McCamy, Marcus andDavidson), rebalanced and analysed for illumination with D65. Linear RGB values are calculated forboth EBU (SDTV) and ITU-R Rec. BT.709 (HDTV) primaries, gamma corrected values are calculatedusing the BBC 0.4 law for SDTV and the ITU-R Rec. BT.709 law for HDTV.
Colours #6 and #11 are critical; they can easily lose their difference when there is a problem in thecamera blue channel spectral responsivity curve. Colour #13 can appear red if there is a problem inthe red responsivity. Colour #18 cannot be reproduced accurately by a television system with EBUor ITU-R Rec. BT.709 primaries since it falls outside the gamut of the primaries, but the error issmall.
EBU ITU.709
R G B R' G' B' R G B R' G' B'
1 Dark Skin 0.185 0.082 0.064 0.488 0.325 0.281 0.190 0.082 0.064 0.421 0.257 0.2202 Light Skin 0.604 0.302 0.254 0.812 0.606 0.562 0.617 0.302 0.255 0.785 0.542 0.495
3 Blue Sk 0.125 0.199 0.378 0.405 0.504 0.667 0.121 0.199 0.376 0.327 0.432 0.608
4 Foliag 0.109 0.153 0.055 0.380 0.447 0.255 0.107 0.153 0.056 0.304 0.373 0.201
5 Blue Flower 0.237 0.216 0.482 0.545 0.523 0.740 0.238 0.216 0.479 0.477 0.453 0.690
6 Bluish Green 0.144 0.512 0.443 0.434 0.758 0.714 0.128 0.512 0.444 0.336 0.714 0.664
7 Orange 0.699 0.190 0.026 0.863 0.493 0.131 0.721 0.190 0.028 0.850 0.421 0.121
8 Purplish Blue 0.062 0.104 0.409 0.275 0.370 0.690 0.060 0.104 0.405 0.210 0.298 0.633
9 Moderate Red 0.554 0.086 0.140 0.784 0.336 0.428 0.575 0.086 0.139 0.758 0.266 0.354
10 Purple 0.110 0.043 0.171 0.381 0.211 0.470 0.113 0.043 0.169 0.313 0.167 0.395
11 Yellow Green 0.387 0.490 0.049 0.674 0.745 0.235 0.382 0.490 0.054 0.614 0.698 0.197
12 Orange Yellow 0.793 0.340 0.026 0.909 0.638 0.130 0.813 0.340 0.030 0.902 0.577 0.127
13 Blue 0.016 0.056 0.300 0.078 0.259 0.605 0.014 0.056 0.298 0.062 0.202 0.538
14 Green 0.082 0.298 0.071 0.325 0.603 0.301 0.072 0.298 0.074 0.238 0.539 0.241
15 Red 0.448 0.018 0.045 0.717 0.088 0.219 0.467 0.018 0.044 0.681 0.079 0.171
16 Yellow 0.855 0.538 0.015 0.938 0.774 0.077 0.868 0.538 0.022 0.932 0.732 0.097
17 Magenta 0.490 0.083 0.341 0.744 0.328 0.639 0.508 0.083 0.338 0.711 0.259 0.576
18 Cyan -0.018 0.246 0.415 -0.088 0.554 0.694 -0.029 0.246 0.413 -0.131 0.485 0.640
19 White 0.943 0.877 0.991 0.976 0.948 0.996 0.946 0.877 0.989 0.973 0.937 0.995
20 Neutral 8 0.619 0.576 0.650 0.821 0.797 0.838 0.621 0.576 0.650 0.788 0.758 0.806
21 Neutral 6.5 0.379 0.353 0.398 0.668 0.648 0.682 0.381 0.353 0.398 0.612 0.589 0.627
22 Neutral 5 0.207 0.193 0.218 0.513 0.497 0.525 0.208 0.193 0.217 0.443 0.425 0.454
23 Neutral 3.5 0.094 0.088 0.099 0.352 0.338 0.361 0.095 0.088 0.099 0.281 0.269 0.289
24 Black 0.033 0.031 0.034 0.164 0.153 0.172 0.033 0.031 0.034 0.137 0.130 0.142

7/27/2019 tech3335 SETTAGGIO CAMERE
http://slidepdf.com/reader/full/tech3335-settaggio-camere 36/68
Measurement of imaging performance of TV cameras Tech 3335
36
Page intentionally left blank. This document is paginated for two sided printing
7/27/2019 tech3335 SETTAGGIO CAMERE
http://slidepdf.com/reader/full/tech3335-settaggio-camere 37/68
Tech 3335 Measurement of imaging performance of TV cameras
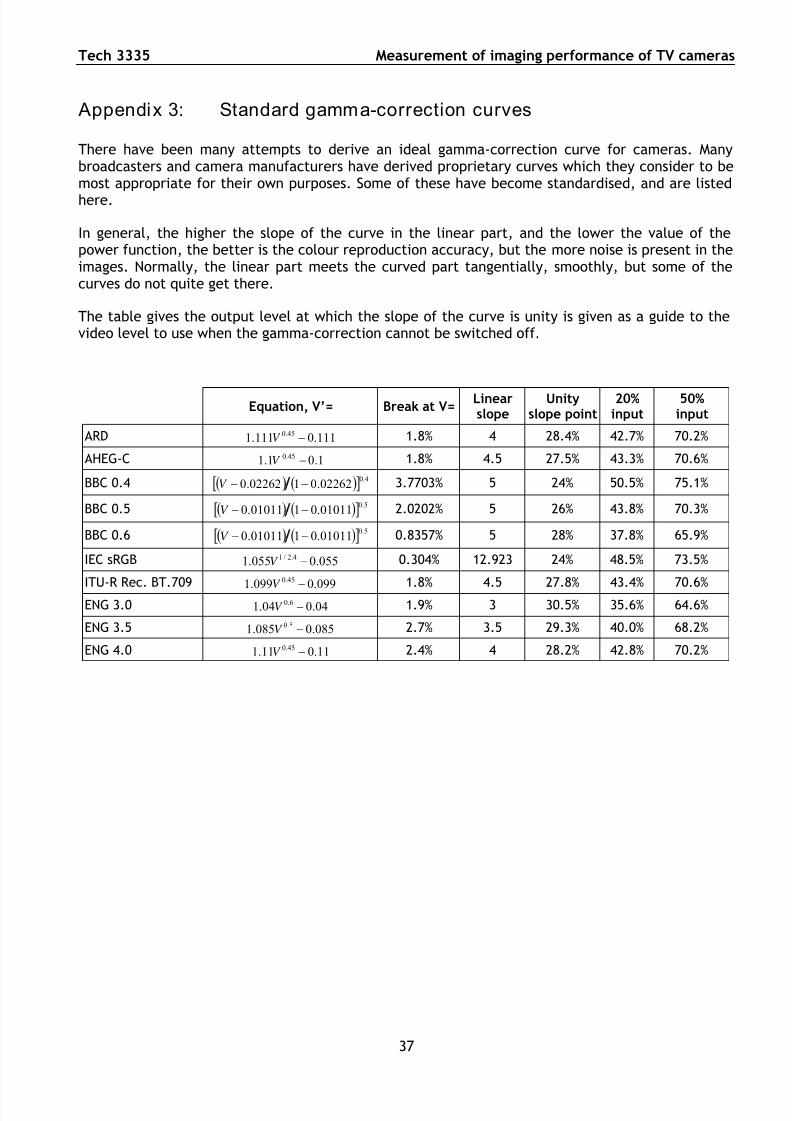
Appendix 3: Standard gamma-correction curves
There have been many attempts to derive an ideal gamma-correction curve for cameras. Manybroadcasters and camera manufacturers have derived proprietary curves which they consider to bemost appropriate for their own purposes. Some of these have become standardised, and are listed
here.
In general, the higher the slope of the curve in the linear part, and the lower the value of thepower function, the better is the colour reproduction accuracy, but the more noise is present in theimages. Normally, the linear part meets the curved part tangentially, smoothly, but some of thecurves do not quite get there.
The table gives the output level at which the slope of the curve is unity is given as a guide to thevideo level to use when the gamma-correction cannot be switched off.
Equation, V’= Break at V=Linearslope
Unityslope point
20%input
50%input
ARD 111.0111.1 45.0 V 1.8% 4 28.4% 42.7% 70.2%
AHEG-C 1.01.1 45.0 V 1.8% 4.5 27.5% 43.3% 70.6%
BBC 0.4 4.002262.0102262.0 V 3.7703% 5 24% 50.5% 75.1%
BBC 0.5 5.001011.0101011.0 V 2.0202% 5 26% 43.8% 70.3%
BBC 0.6 5.001011.0101011.0 V 0.8357% 5 28% 37.8% 65.9%
IEC sRGB 055.0055.1 4.2/1 V 0.304% 12.923 24% 48.5% 73.5%
ITU-R Rec. BT.709 099.0099.1
45.0 V 1.8% 4.5 27.8% 43.4% 70.6%
ENG 3.0 04.004.1 6.0 V 1.9% 3 30.5% 35.6% 64.6%
ENG 3.5 085.0085.1 5.0 V 2.7% 3.5 29.3% 40.0% 68.2%
ENG 4.0 11.011.1 45.0 V 2.4% 4 28.2% 42.8% 70.2%
37

7/27/2019 tech3335 SETTAGGIO CAMERE
http://slidepdf.com/reader/full/tech3335-settaggio-camere 38/68
Measurement of imaging performance of TV cameras Tech 3335
38
Page intentionally left blank. This document is paginated for two sided printing
7/27/2019 tech3335 SETTAGGIO CAMERE
http://slidepdf.com/reader/full/tech3335-settaggio-camere 39/68
Tech 3335 Measurement of imaging performance of TV cameras
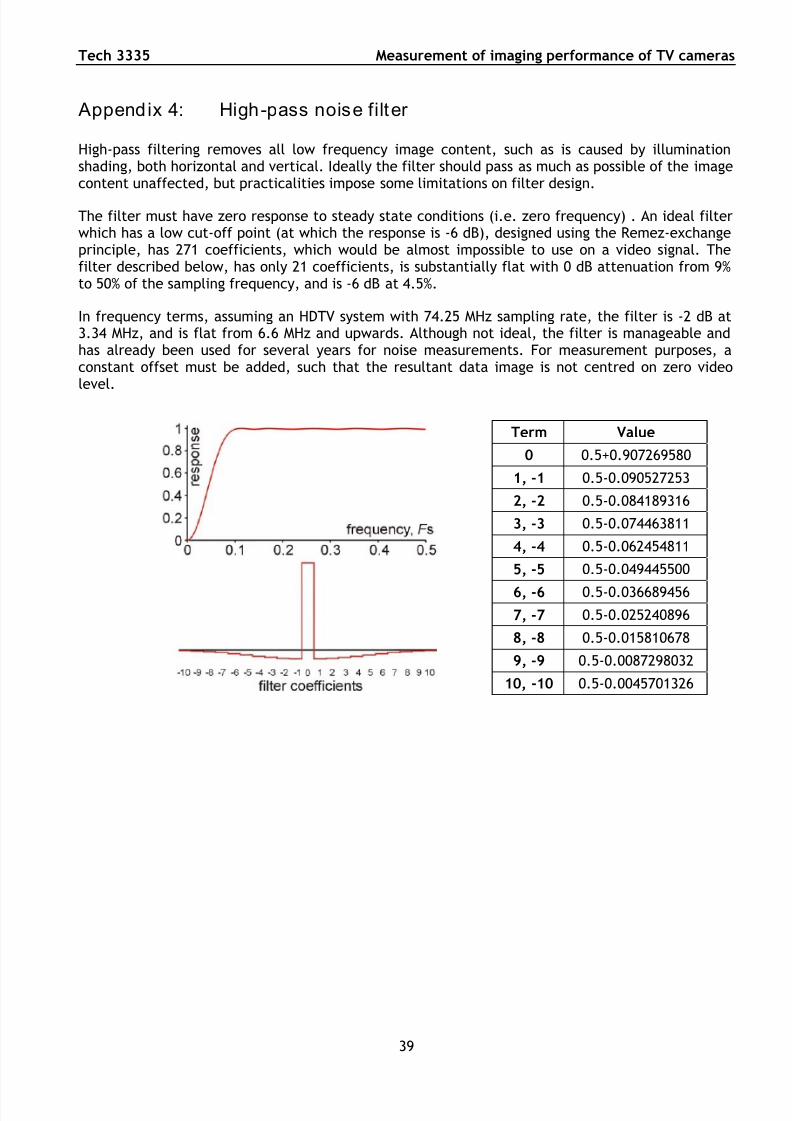
Appendix 4: High-pass noise filter
High-pass filtering removes all low frequency image content, such as is caused by illuminationshading, both horizontal and vertical. Ideally the filter should pass as much as possible of the imagecontent unaffected, but practicalities impose some limitations on filter design.
The filter must have zero response to steady state conditions (i.e. zero frequency) . An ideal filterwhich has a low cut-off point (at which the response is -6 dB), designed using the Remez-exchangeprinciple, has 271 coefficients, which would be almost impossible to use on a video signal. Thefilter described below, has only 21 coefficients, is substantially flat with 0 dB attenuation from 9%to 50% of the sampling frequency, and is -6 dB at 4.5%.
In frequency terms, assuming an HDTV system with 74.25 MHz sampling rate, the filter is -2 dB at3.34 MHz, and is flat from 6.6 MHz and upwards. Although not ideal, the filter is manageable andhas already been used for several years for noise measurements. For measurement purposes, aconstant offset must be added, such that the resultant data image is not centred on zero videolevel.
Term Value
0 0.5+0.907269580
1, -1 0.5-0.090527253
2, -2 0.5-0.084189316
3, -3 0.5-0.074463811
4, -4 0.5-0.062454811
5, -5 0.5-0.049445500
6, -6 0.5-0.036689456
7, -7 0.5-0.025240896
8, -8 0.5-0.015810678
9, -9 0.5-0.0087298032
10, -10 0.5-0.0045701326
39

7/27/2019 tech3335 SETTAGGIO CAMERE
http://slidepdf.com/reader/full/tech3335-settaggio-camere 40/68
Measurement of imaging performance of TV cameras Tech 3335
40
Page intentionally left blank. This document is paginated for two sided printing
7/27/2019 tech3335 SETTAGGIO CAMERE
http://slidepdf.com/reader/full/tech3335-settaggio-camere 41/68
Tech 3335 Measurement of imaging performance of TV cameras
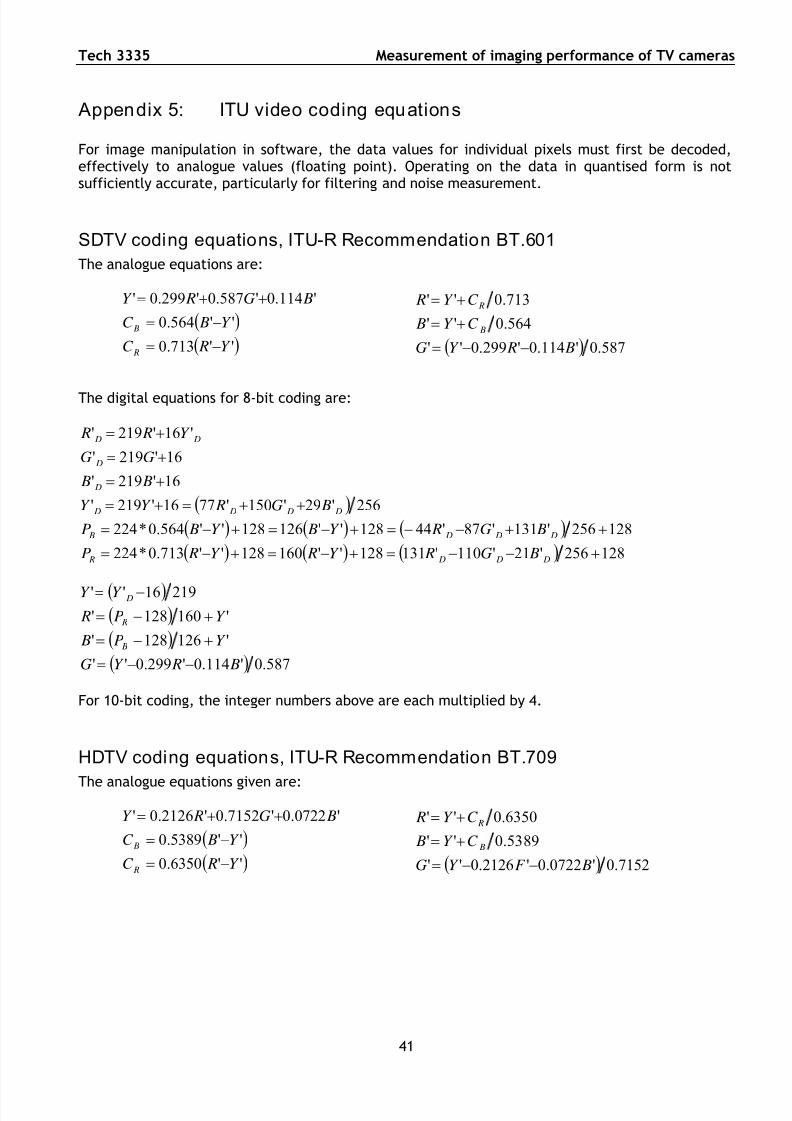
Appendix 5: ITU video coding equations
For image manipulation in software, the data values for individual pixels must first be decoded,effectively to analogue values (floating point). Operating on the data in quantised form is notsufficiently accurate, particularly for filtering and noise measurement.
SDTV coding equations, ITU-R Recommendation BT.601
The analogue equations are:
''713.0
''564.0
'114.0'587.0'299.0'
Y RC
Y BC
BG RY
R
B
587.0'114.0'299.0''
564.0''
713.0''
B RY G
C Y B
C Y R
B
R
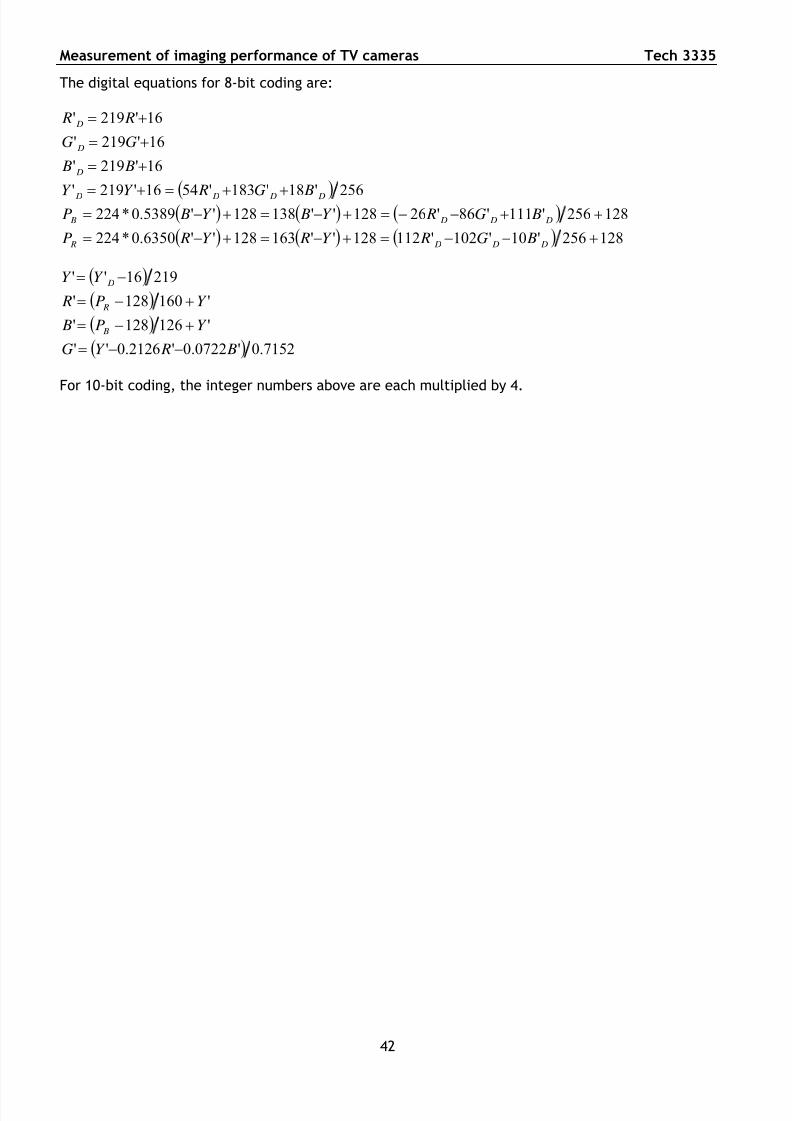
The digital equations for 8-bit coding are:
128256'21'110'131128''160128''713.0*224
128256'131'87'44128''126128''564.0*224
256'29'150'7716'219'
16'219'
16'219'
'16'219'
D D D R
D D D B
D D D D
D
D
D D
BG RY RY RP
BG RY BY BP
BG RY Y
B B
GG
Y R R
587.0'114.0'299.0''
'126128'
'160128'
21916''
B RY G
Y P B
Y P R
Y Y
B
R
D
For 10-bit coding, the integer numbers above are each multiplied by 4.
HDTV coding equations, ITU-R Recommendation BT.709
The analogue equations given are:
''6350.0
''5389.0
'0722.0'7152.0'2126.0'
Y RC
Y BC
BG RY
R
B
7152.0'0722.0'2126.0''
8953.0''
6350.0''
BF Y G
C Y B
C Y R
B
R
41
7/27/2019 tech3335 SETTAGGIO CAMERE
http://slidepdf.com/reader/full/tech3335-settaggio-camere 42/68
Measurement of imaging performance of TV cameras Tech 3335
The digital equations for 8-bit coding are:
128256'10'102'112128''163128''6350.0*224
128256'111'86'26128''138128''5389.0*224256'18'183'5416'219'
16'219'
16'219'
16'219'
D D D R
D D D B
D D D D
D
D
D
BG RY RY RP
BG RY BY BP BG RY Y
B B
GG
R R
7152.0'0722.0'2126.0''
'126128'
'160128'
21916''
B RY G
Y P B
Y P R
Y Y
B
R
D
For 10-bit coding, the integer numbers above are each multiplied by 4.
42
7/27/2019 tech3335 SETTAGGIO CAMERE
http://slidepdf.com/reader/full/tech3335-settaggio-camere 43/68
Tech 3335 Measurement of imaging performance of TV cameras
43
Appendix 6: Programs for data processing
This document describes a suite of programs, written for colorimetric analysis of single framesextracted from digitally captured video sequences. Anyone writing software to perform such
actions would normally concatenate the processes, but here, separation aids comprehension. Theprograms are all written in BBC BASIC for Windows, and the routines have been kept as simple aspossible. BBC BASIC for Windows can be read almost as plain English, and therefore should bereadily understood by anyone familiar with any form of computer programming.
Each program is supplied as a stand-alone EXE file, and as a pdf file. The pdf versions containcomments to explain the algorithms where necessary.
The programs all work, but they should be regarded as examples of algorithms, rather than asuseful for practical measurements. They work best when the computer display screen is larger thanthe image format: for working on images of 1920 x 1080, the display should be at least 1920 x 1145.
They will work with smaller displays but the image files will not be displayed correctly, althoughthe file processing will still be correct.
Each program performs one simple task, and only that task.
There are eight programs:
1 Make YUV BMP from RAW YUV file
Read a file of uncompressed YUV data, 4:2:2 subsampled and 8-bit coded, and generate a Windowsbitmap file (BMP) from it. The raw file is assumed to have been captured from a ‘DVC ClipRecorder
XTreme’, which creates data files without headers, simply a stream of pixel values starting fromthe top left of the image.
The BMP file contains the U (Cb) channel in the B plane of the BMP file, Y’ (luma) in the G plane, V(Cr) in the R plane. The chroma channels are not interpolated in this process, for pixels wherethere is no chroma sample, the chroma channel levels are set to zero (level 128 in the file).
The output file is created in the same location as the source file, and has the same name, but withan extra extension of .bmp.
2 Interpolate 422 YUV BMP
Read a file such as that created by program #1, and interpolate the chroma samples to insertvalues at alternate sites, where they are missing in the original.
The original file is modified, no new file is created.
3 Make RGB BMP from YUV BMP
Create a new BMP file in conventional RGB format, from a file such as that created andinterpolated in program #2. The decoder equations are specified in a text file (supplied) andtherefore can be modified by the user.
The output file is created in the same location as the source file, and has the same name, but theextension will be “-rgb.bmp”.
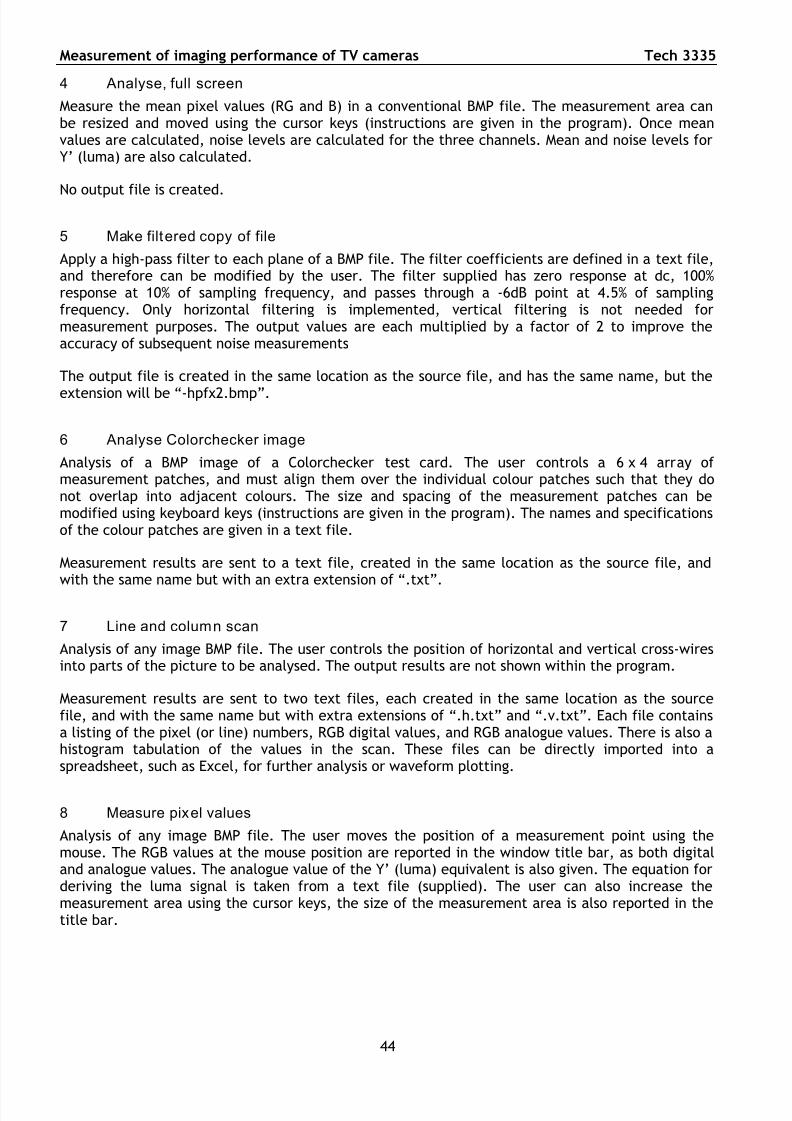
7/27/2019 tech3335 SETTAGGIO CAMERE
http://slidepdf.com/reader/full/tech3335-settaggio-camere 44/68
Measurement of imaging performance of TV cameras Tech 3335
44
4 Analyse, full screen
Measure the mean pixel values (RG and B) in a conventional BMP file. The measurement area canbe resized and moved using the cursor keys (instructions are given in the program). Once meanvalues are calculated, noise levels are calculated for the three channels. Mean and noise levels forY’ (luma) are also calculated.
No output file is created.
5 Make filtered copy of file
Apply a high-pass filter to each plane of a BMP file. The filter coefficients are defined in a text file,and therefore can be modified by the user. The filter supplied has zero response at dc, 100%response at 10% of sampling frequency, and passes through a -6dB point at 4.5% of samplingfrequency. Only horizontal filtering is implemented, vertical filtering is not needed formeasurement purposes. The output values are each multiplied by a factor of 2 to improve theaccuracy of subsequent noise measurements
The output file is created in the same location as the source file, and has the same name, but the
extension will be “-hpfx2.bmp”.
6 Analyse Colorchecker image
Analysis of a BMP image of a Colorchecker test card. The user controls a 6 x 4 array of measurement patches, and must align them over the individual colour patches such that they donot overlap into adjacent colours. The size and spacing of the measurement patches can bemodified using keyboard keys (instructions are given in the program). The names and specificationsof the colour patches are given in a text file.
Measurement results are sent to a text file, created in the same location as the source file, andwith the same name but with an extra extension of “.txt”.
7 Line and column scan
Analysis of any image BMP file. The user controls the position of horizontal and vertical cross-wiresinto parts of the picture to be analysed. The output results are not shown within the program.
Measurement results are sent to two text files, each created in the same location as the sourcefile, and with the same name but with extra extensions of “.h.txt” and “.v.txt”. Each file containsa listing of the pixel (or line) numbers, RGB digital values, and RGB analogue values. There is also ahistogram tabulation of the values in the scan. These files can be directly imported into aspreadsheet, such as Excel, for further analysis or waveform plotting.
8 Measure pixel values
Analysis of any image BMP file. The user moves the position of a measurement point using themouse. The RGB values at the mouse position are reported in the window title bar, as both digitaland analogue values. The analogue value of the Y’ (luma) equivalent is also given. The equation forderiving the luma signal is taken from a text file (supplied). The user can also increase themeasurement area using the cursor keys, the size of the measurement area is also reported in thetitle bar.
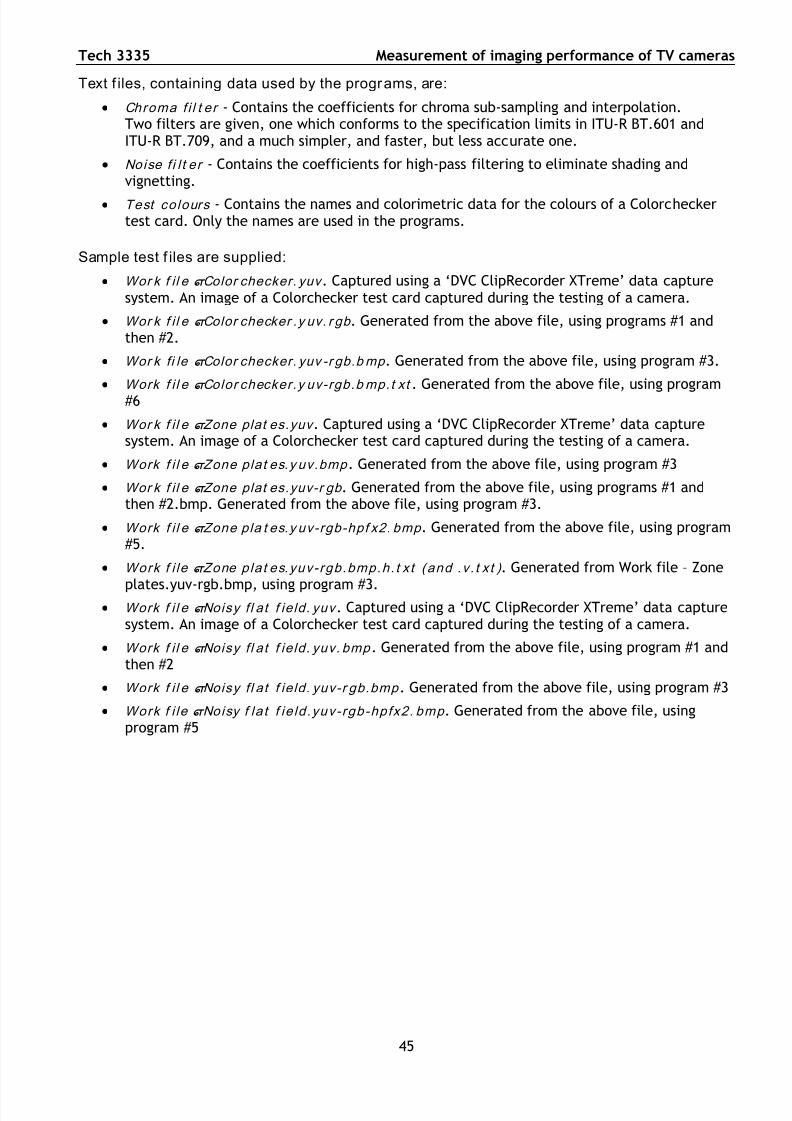
7/27/2019 tech3335 SETTAGGIO CAMERE
http://slidepdf.com/reader/full/tech3335-settaggio-camere 45/68
Tech 3335 Measurement of imaging performance of TV cameras
45
Text f iles, containing data used by the programs, are:
Chroma f i l t er - Contains the coefficients for chroma sub-sampling and interpolation.Two filters are given, one which conforms to the specification limits in ITU-R BT.601 andITU-R BT.709, and a much simpler, and faster, but less accurate one.
Noise f i l t er - Contains the coefficients for high-pass filtering to eliminate shading andvignetting.
Test colours - Contains the names and colorimetric data for the colours of a Colorcheckertest card. Only the names are used in the programs.
Sample test f iles are supplied:
Wor k f i l e – Color checker. yuv . Captured using a ‘DVC ClipRecorder XTreme’ data capturesystem. An image of a Colorchecker test card captured during the testing of a camera.
Wor k f i l e – Color checker .y uv. r gb . Generated from the above file, using programs #1 andthen #2.
Wor k fi le – Color checker. yuv -r gb.bmp . Generated from the above file, using program #3.
Work f i l e – Color checker.y uv-rgb.bmp.t xt . Generated from the above file, using program#6
Wor k f i l e – Zone plat es.yuv . Captured using a ‘DVC ClipRecorder XTreme’ data capturesystem. An image of a Colorchecker test card captured during the testing of a camera.
Work f i l e – Zone plat es.y uv.bmp . Generated from the above file, using program #3
Wor k f i l e – Zone plat es.yuv-r gb . Generated from the above file, using programs #1 andthen #2.bmp. Generated from the above file, using program #3.
Work f i l e – Zone pla t es.y uv-rgb-hpf x2. bmp . Generated from the above file, using program#5.
Work f i le – Zone plat es.yuv-rgb.bmp.h. t xt (and .v. t x t ) . Generated from Work file – Zone
plates.yuv-rgb.bmp, using program #3. Work f i l e – Noisy f l at f ield. yuv . Captured using a ‘DVC ClipRecorder XTreme’ data capture
system. An image of a Colorchecker test card captured during the testing of a camera.
Work f i l e – Noisy f l at f ield. yuv. bmp . Generated from the above file, using program #1 andthen #2
Work f i l e – Noisy f l at f ield. yuv-r gb.bmp . Generated from the above file, using program #3
Work f i le – Noisy f lat f ie ld.yuv-rgb-hpfx2. bmp . Generated from the above file, usingprogram #5

7/27/2019 tech3335 SETTAGGIO CAMERE
http://slidepdf.com/reader/full/tech3335-settaggio-camere 46/68
Measurement of imaging performance of TV cameras Tech 3335
46
Page intentionally left blank. This document is paginated for two sided printing
7/27/2019 tech3335 SETTAGGIO CAMERE
http://slidepdf.com/reader/full/tech3335-settaggio-camere 47/68
Tech 3335 Measurement of imaging performance of TV cameras
47
Appendix 7: Example of the Presentation of Data
The following represents an example of camera test reporting, courtesy of Alan Roberts. It isrecommended as a template for future camera testing.
The following contains results of the cameras tested so far.
Obviously there will be variations especially as new technologies are introduced to cameras.However the end result will always be the pictures and how well they are presented to thetransmission chain for the audience.
Colorimetric and Resolution requirements of cameras Alan Roberts
ADDENDUM 56: Tests and Sett ings on a Sony HDC1500R
Data for this section is taken from the handbook and examination of a production model (serialnumber 400152) of the Sony HDC1500R. The 1400R, 1450R, 1500R and 1550R belong to a family of system cameras built around a common design. The 1500R and 1400R have optical-fibre connection
to the CCU and two SDI outputs, the 1550R and 1450R have triax cable connections and one SDIoutput. The 1400R and 1450R are cut-down versions, having no colour-temperature filter wheel andoperate only at 1080/50i and 720/50P (EU types, the SY types run at 59.94 Hz), while the 1500Rand 1550R have two filter wheels and operate at a wider range of standards, including 1080-progressive at 50 or 59.94 Hz, delivered via 2 BNC connections. Other differences are minor.
The cameras have three 1920 x 1080 CCDs and an F/1.4 optical block. The head weighs 4.5 kg,excluding lens and viewfinder, and consumes about 85 W at 12V DC if the head alone is powered.
It has many internal menus for setting the performance, with a structure very similar to that in theHDCAM camcorders. The menus can be accessed directly from the camera head, such that it canthen be used without external controls, or via the usual remote control panels.
Many of the menu items have little or no effect on image quality. Those that have significant effectare highlighted. The full set of menu items is given for completeness. In boxes with a range of numeric settings, e.g. -99~99, the values indicate the nominal range, and zero means no alterationto factory setting, not zero effect, and no scales are given. For each item, the factory setting isunderlined, “BBC” settings are in the last column, where appropriate, and the reasons for thevalues are given in footnotes throughout the tables where necessary.
Where menus are hierarchical (i.e. one menu item opens another menu page), the items are inset.
“BBC” setting values are given for: Video {v} Negative film {f}
Where different values are needed for these settings, they are marked e.g. thus: On{v} Off{f}. Notethat the film settings are not intended to reproduce precisely the performance of any particularfilm stock, merely to give a ‘look’ that is representative of a generic film type.
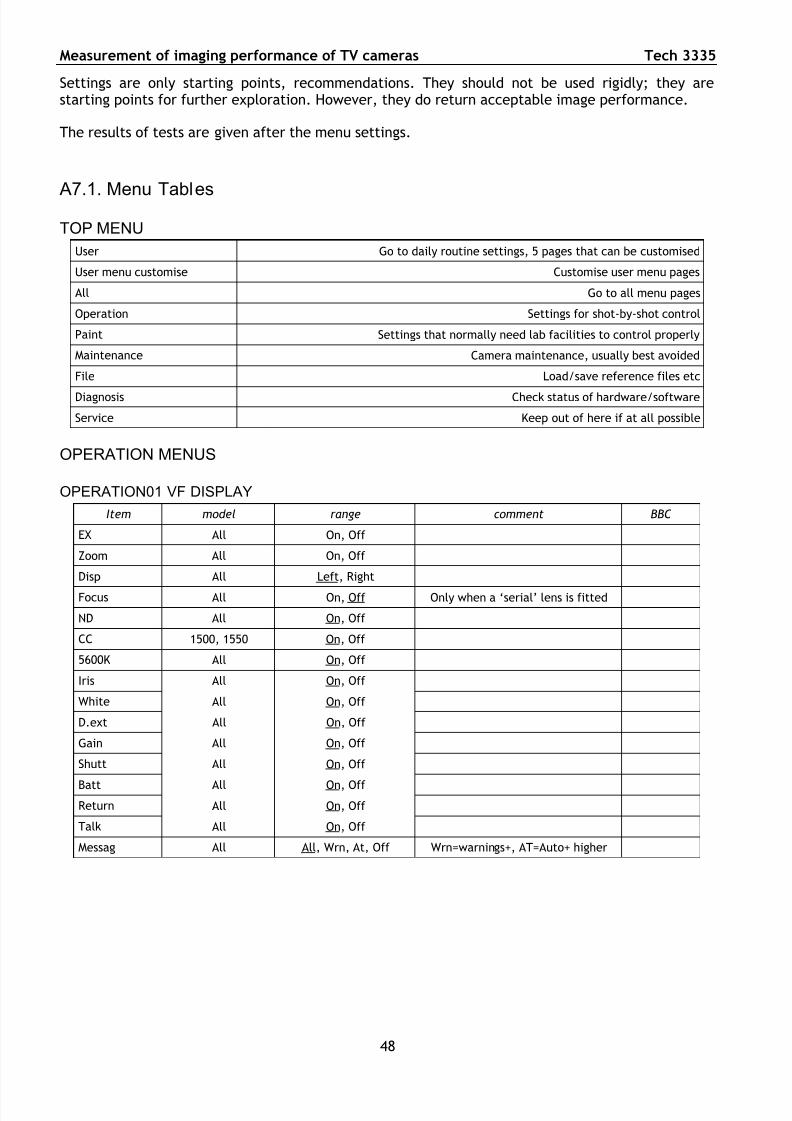
7/27/2019 tech3335 SETTAGGIO CAMERE
http://slidepdf.com/reader/full/tech3335-settaggio-camere 48/68
Measurement of imaging performance of TV cameras Tech 3335
48
Settings are only starting points, recommendations. They should not be used rigidly; they arestarting points for further exploration. However, they do return acceptable image performance.
The results of tests are given after the menu settings.
A7.1. Menu Tables
TOP MENU
User Go to daily routine settings, 5 pages that can be customised
User menu customise Customise user menu pages
All Go to all menu pages
Operation Settings for shot-by-shot control
Paint Settings that normally need lab facilities to control properly
Maintenance Camera maintenance, usually best avoided
File Load/save reference files etc
Diagnosis Check status of hardware/software
Service Keep out of here if at all possible
OPERATION MENUS
OPERATION01 VF DISPLAY
Item model range comment BBC
EX All On, Off
Zoom All On, Off
Disp All Left, Right
Focus All On, Off Only when a ‘serial’ lens is fitted
ND All On, Off
CC 1500, 1550 On, Off
5600K All On, Off
Iris All On, Off
White All On, Off
D.ext All On, Off
Gain All On, Off
Shutt All On, Off
Batt All On, Off
Return All On, Off
Talk All On, Off
Messag All All, Wrn, At, Off Wrn=warnings+, AT=Auto+ higher
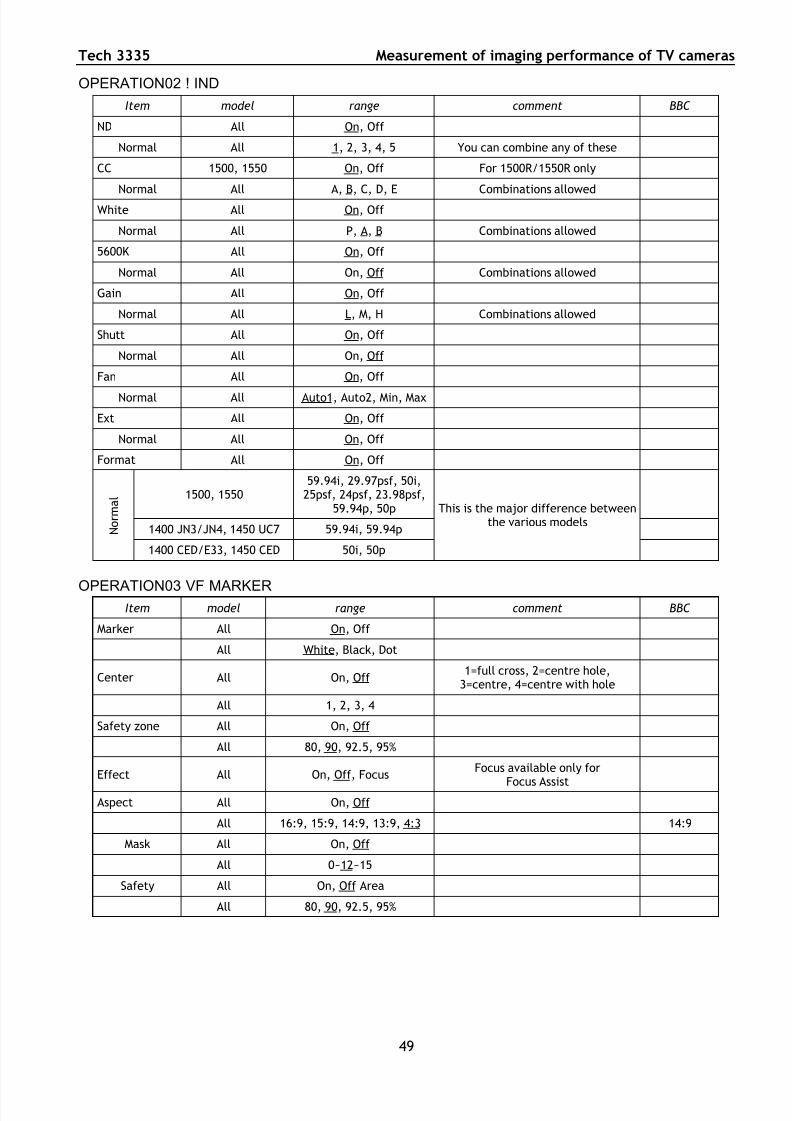
7/27/2019 tech3335 SETTAGGIO CAMERE
http://slidepdf.com/reader/full/tech3335-settaggio-camere 49/68
Tech 3335 Measurement of imaging performance of TV cameras
49
OPERATION02 ! IND
Item model range comment BBC
ND All On, Off
Normal All 1, 2, 3, 4, 5 You can combine any of these
CC 1500, 1550 On, Off For 1500R/1550R only
Normal All A, B, C, D, E Combinations allowed
White All On, Off
Normal All P, A, B Combinations allowed
5600K All On, Off
Normal All On, Off Combinations allowed
Gain All On, Off
Normal All L, M, H Combinations allowed
Shutt All On, Off
Normal All On, Off
Fan All On, Off
Normal All Auto1, Auto2, Min, Max
Ext All On, Off
Normal All On, Off
Format All On, Off
1500, 155059.94i, 29.97psf, 50i,
25psf, 24psf, 23.98psf,59.94p, 50p
1400 JN3/JN4, 1450 UC7 59.94i, 59.94p N o r m a l
1400 CED/E33, 1450 CED 50i, 50p
This is the major difference betweenthe various models
OPERATION03 VF MARKERItem model range comment BBC
Marker All On, Off
All White, Black, Dot
Center All On, Off 1=full cross, 2=centre hole,
3=centre, 4=centre with hole
All 1, 2, 3, 4
Safety zone All On, Off
All 80, 90, 92.5, 95%
Effect All On, Off, FocusFocus available only for
Focus AssistAspect All On, Off
All 16:9, 15:9, 14:9, 13:9, 4:3 14:9
Mask All On, Off
All 0~12~15
Safety All On, Off Area
All 80, 90, 92.5, 95%
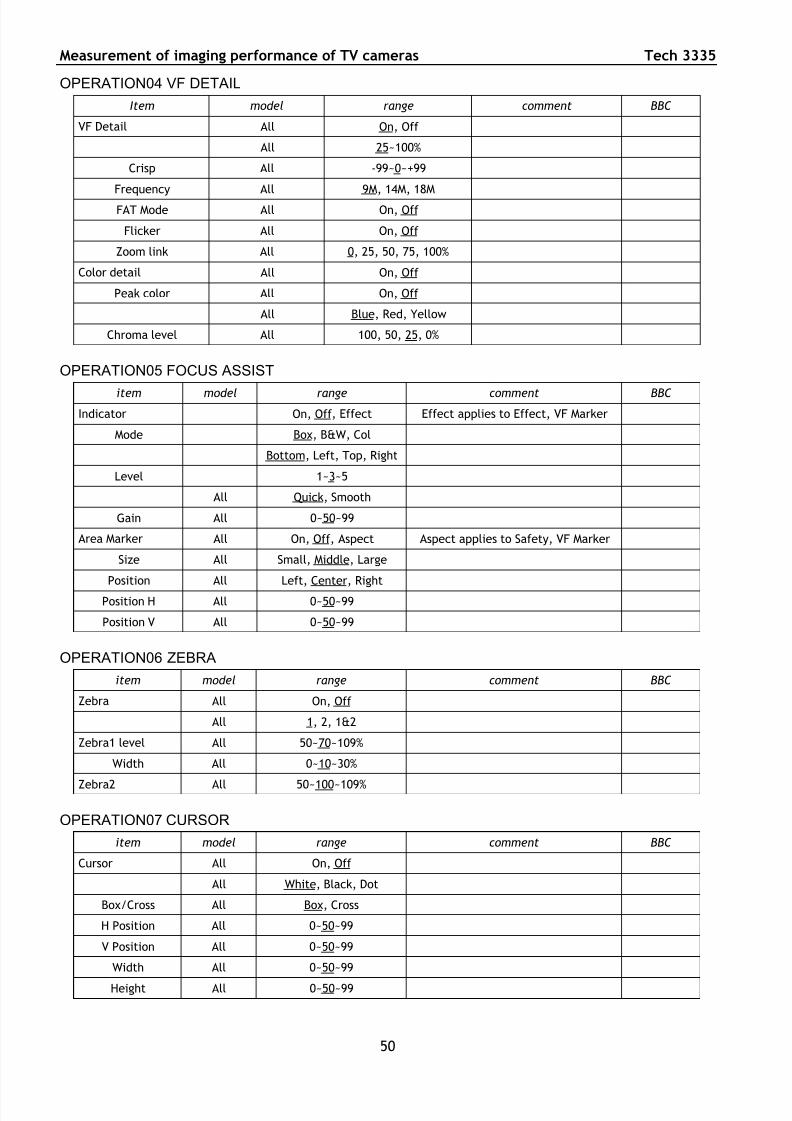
7/27/2019 tech3335 SETTAGGIO CAMERE
http://slidepdf.com/reader/full/tech3335-settaggio-camere 50/68
Measurement of imaging performance of TV cameras Tech 3335
50
OPERATION04 VF DETAIL
Item model range comment BBC
VF Detail All On, Off
All 25~100%
Crisp All -99~0~+99
Frequency All 9M, 14M, 18M
FAT Mode All On, Off
Flicker All On, Off
Zoom link All 0, 25, 50, 75, 100%
Color detail All On, Off
Peak color All On, Off
All Blue, Red, Yellow
Chroma level All 100, 50, 25, 0%
OPERATION05 FOCUS ASSIST
item model range comment BBC
Indicator On, Off , Effect Effect applies to Effect, VF Marker
Mode Box, B&W, Col
Bottom, Left, Top, Right
Level 1~3~5
All Quick, Smooth
Gain All 0~50~99
Area Marker All On, Off, Aspect Aspect applies to Safety, VF Marker
Size All Small, Middle, Large
Position All Left, Center, Right
Position H All 0~50~99
Position V All 0~50~99
OPERATION06 ZEBRA
item model range comment BBC
Zebra All On, Off
All 1, 2, 1&2
Zebra1 level All 50~70~109%
Width All 0~10~30%
Zebra2 All 50~100~109%
OPERATION07 CURSOR
item model range comment BBC
Cursor All On, Off
All White, Black, Dot
Box/Cross All Box, Cross
H Position All 0~50~99
V Position All 0~50~99
Width All 0~50~99
Height All 0~50~99
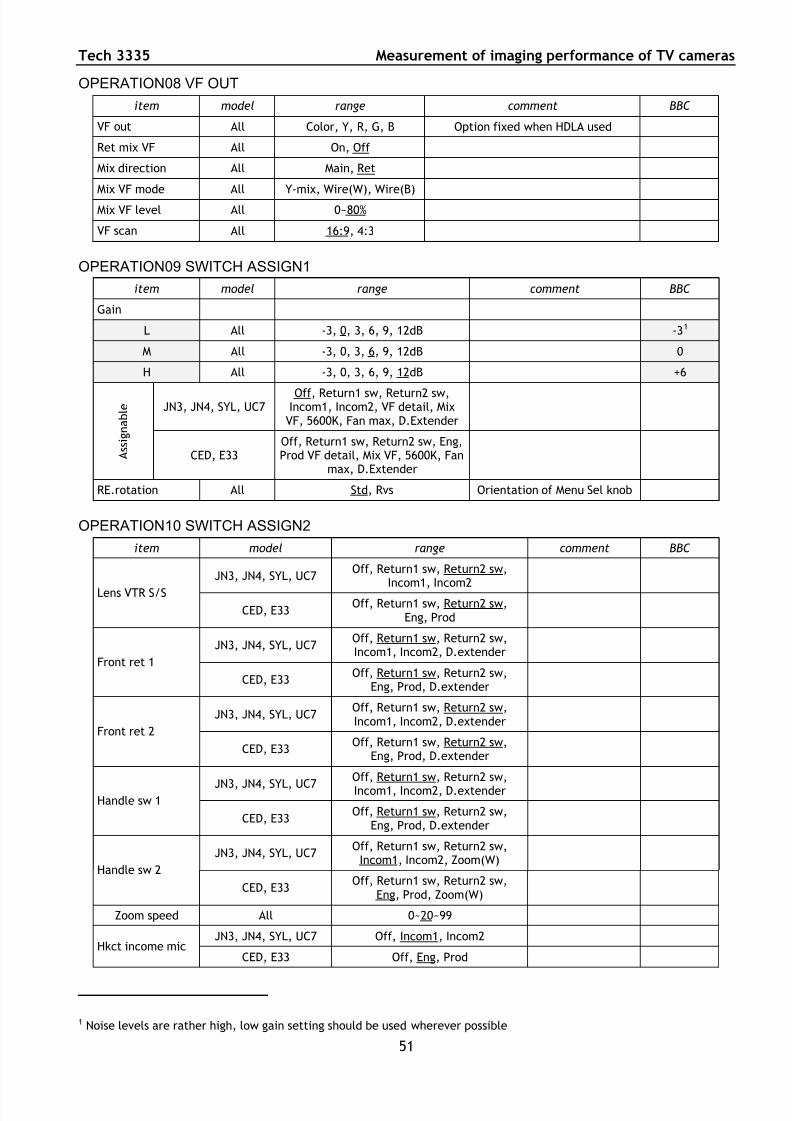
7/27/2019 tech3335 SETTAGGIO CAMERE
http://slidepdf.com/reader/full/tech3335-settaggio-camere 51/68
Tech 3335 Measurement of imaging performance of TV cameras
51
OPERATION08 VF OUT
item model range comment BBC
VF out All Color, Y, R, G, B Option fixed when HDLA used
Ret mix VF All On, Off
Mix direction All Main, Ret
Mix VF mode All Y-mix, Wire(W), Wire(B)
Mix VF level All 0~80%
VF scan All 16:9, 4:3
OPERATION09 SWITCH ASSIGN1
item model range comment BBC
Gain
L All -3, 0, 3, 6, 9, 12dB -31
M All -3, 0, 3, 6, 9, 12dB 0
H All -3, 0, 3, 6, 9, 12dB +6
JN3, JN4, SYL, UC7Off, Return1 sw, Return2 sw,
Incom1, Incom2, VF detail, MixVF, 5600K, Fan max, D.Extender
A s s i g n a b l e
CED, E33Off, Return1 sw, Return2 sw, Eng,Prod VF detail, Mix VF, 5600K, Fan
max, D.Extender
RE.rotation All Std, Rvs Orientation of Menu Sel knob
OPERATION10 SWITCH ASSIGN2
item model range comment BBC
JN3, JN4, SYL, UC7Off, Return1 sw, Return2 sw,
Incom1, Incom2Lens VTR S/S
CED, E33Off, Return1 sw, Return2 sw,
Eng, Prod
JN3, JN4, SYL, UC7Off, Return1 sw, Return2 sw,Incom1, Incom2, D.extender
Front ret 1
CED, E33Off, Return1 sw, Return2 sw,
Eng, Prod, D.extender
JN3, JN4, SYL, UC7Off, Return1 sw, Return2 sw,Incom1, Incom2, D.extender
Front ret 2
CED, E33Off, Return1 sw, Return2 sw,
Eng, Prod, D.extender
JN3, JN4, SYL, UC7Off, Return1 sw, Return2 sw,Incom1, Incom2, D.extender
Handle sw 1
CED, E33Off, Return1 sw, Return2 sw,
Eng, Prod, D.extender
JN3, JN4, SYL, UC7Off, Return1 sw, Return2 sw,
Incom1, Incom2, Zoom(W)Handle sw 2
CED, E33Off, Return1 sw, Return2 sw,
Eng, Prod, Zoom(W)
Zoom speed All 0~20~99
JN3, JN4, SYL, UC7 Off, Incom1, Incom2Hkct income mic
CED, E33 Off, Eng, Prod
1 Noise levels are rather high, low gain setting should be used wherever possible
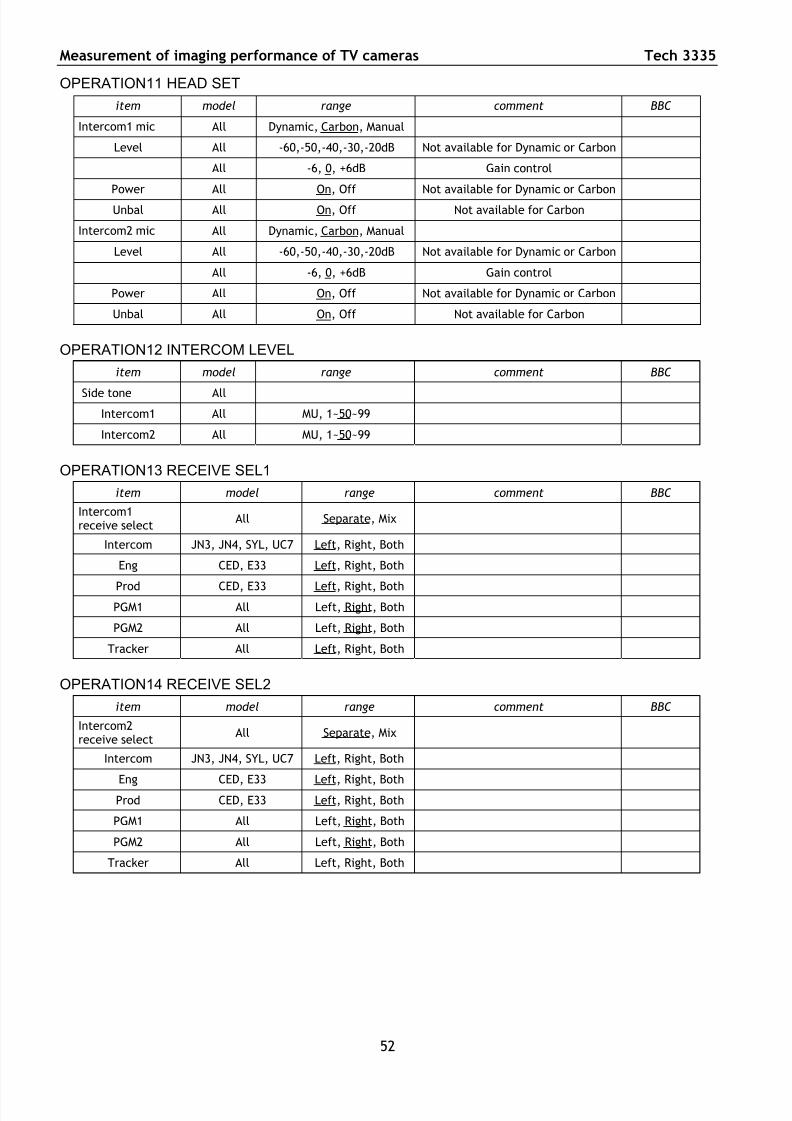
7/27/2019 tech3335 SETTAGGIO CAMERE
http://slidepdf.com/reader/full/tech3335-settaggio-camere 52/68
Measurement of imaging performance of TV cameras Tech 3335
52
OPERATION11 HEAD SET
item model range comment BBC
Intercom1 mic All Dynamic, Carbon, Manual
Level All -60,-50,-40,-30,-20dB Not available for Dynamic or Carbon
All -6, 0, +6dB Gain control
Power All On, Off Not available for Dynamic or Carbon
Unbal All On, Off Not available for Carbon
Intercom2 mic All Dynamic, Carbon, Manual
Level All -60,-50,-40,-30,-20dB Not available for Dynamic or Carbon
All -6, 0, +6dB Gain control
Power All On, Off Not available for Dynamic or Carbon
Unbal All On, Off Not available for Carbon
OPERATION12 INTERCOM LEVEL
item model range comment BBC
Side tone All
Intercom1 All MU, 1~50~99
Intercom2 All MU, 1~50~99
OPERATION13 RECEIVE SEL1
item model range comment BBC
Intercom1receive select
All Separate, Mix
Intercom JN3, JN4, SYL, UC7 Left, Right, Both
Eng CED, E33 Left, Right, Both
Prod CED, E33 Left, Right, BothPGM1 All Left, Right, Both
PGM2 All Left, Right, Both
Tracker All Left, Right, Both
OPERATION14 RECEIVE SEL2
item model range comment BBC
Intercom2receive select
All Separate, Mix
Intercom JN3, JN4, SYL, UC7 Left, Right, Both
Eng CED, E33 Left, Right, BothProd CED, E33 Left, Right, Both
PGM1 All Left, Right, Both
PGM2 All Left, Right, Both
Tracker All Left, Right, Both
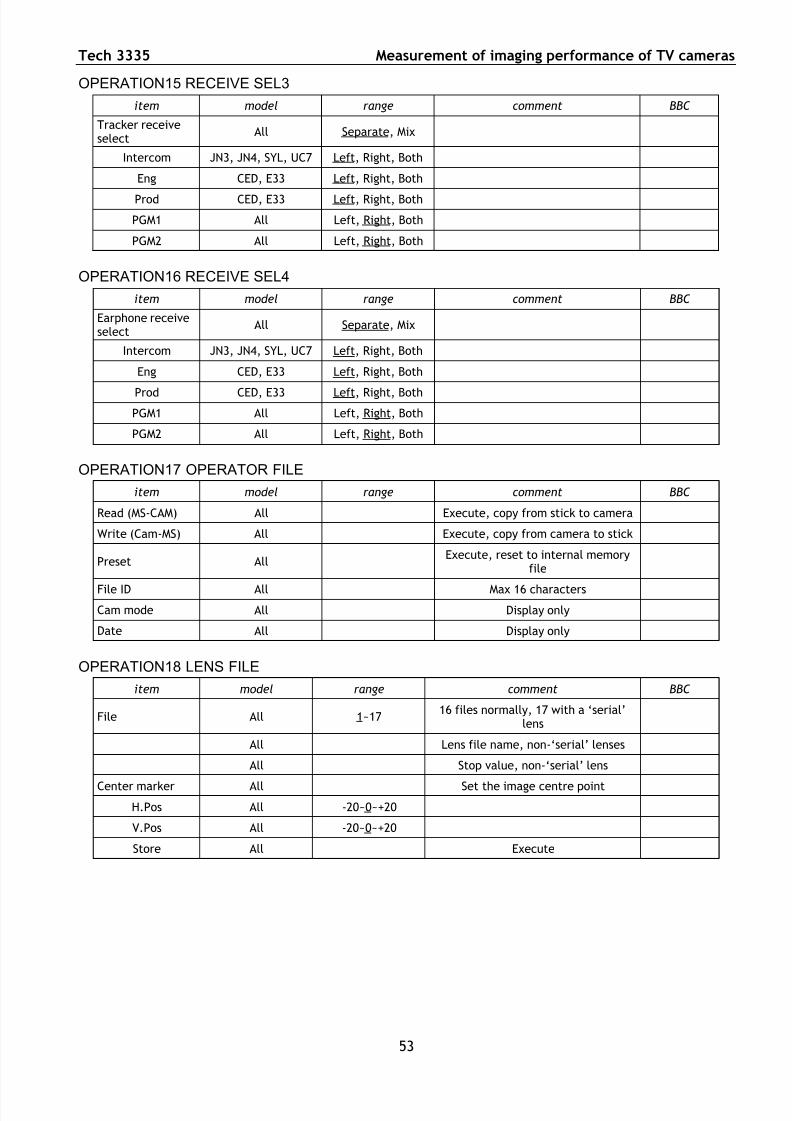
7/27/2019 tech3335 SETTAGGIO CAMERE
http://slidepdf.com/reader/full/tech3335-settaggio-camere 53/68
Tech 3335 Measurement of imaging performance of TV cameras
53
OPERATION15 RECEIVE SEL3
item model range comment BBC
Tracker receiveselect
All Separate, Mix
Intercom JN3, JN4, SYL, UC7 Left, Right, Both
Eng CED, E33 Left, Right, Both
Prod CED, E33 Left, Right, Both
PGM1 All Left, Right, Both
PGM2 All Left, Right, Both
OPERATION16 RECEIVE SEL4
item model range comment BBC
Earphone receiveselect
All Separate, Mix
Intercom JN3, JN4, SYL, UC7 Left, Right, Both
Eng CED, E33 Left, Right, Both
Prod CED, E33 Left, Right, Both
PGM1 All Left, Right, Both
PGM2 All Left, Right, Both
OPERATION17 OPERATOR FILE
item model range comment BBC
Read (MS-CAM) All Execute, copy from stick to camera
Write (Cam-MS) All Execute, copy from camera to stick
Preset AllExecute, reset to internal memory
file
File ID All Max 16 characters
Cam mode All Display only
Date All Display only
OPERATION18 LENS FILE
item model range comment BBC
File All 1~1716 files normally, 17 with a ‘serial’
lens
All Lens file name, non-‘serial’ lenses
All Stop value, non-‘serial’ lens
Center marker All Set the image centre point
H.Pos All -20~0~+20
V.Pos All -20~0~+20
Store All Execute
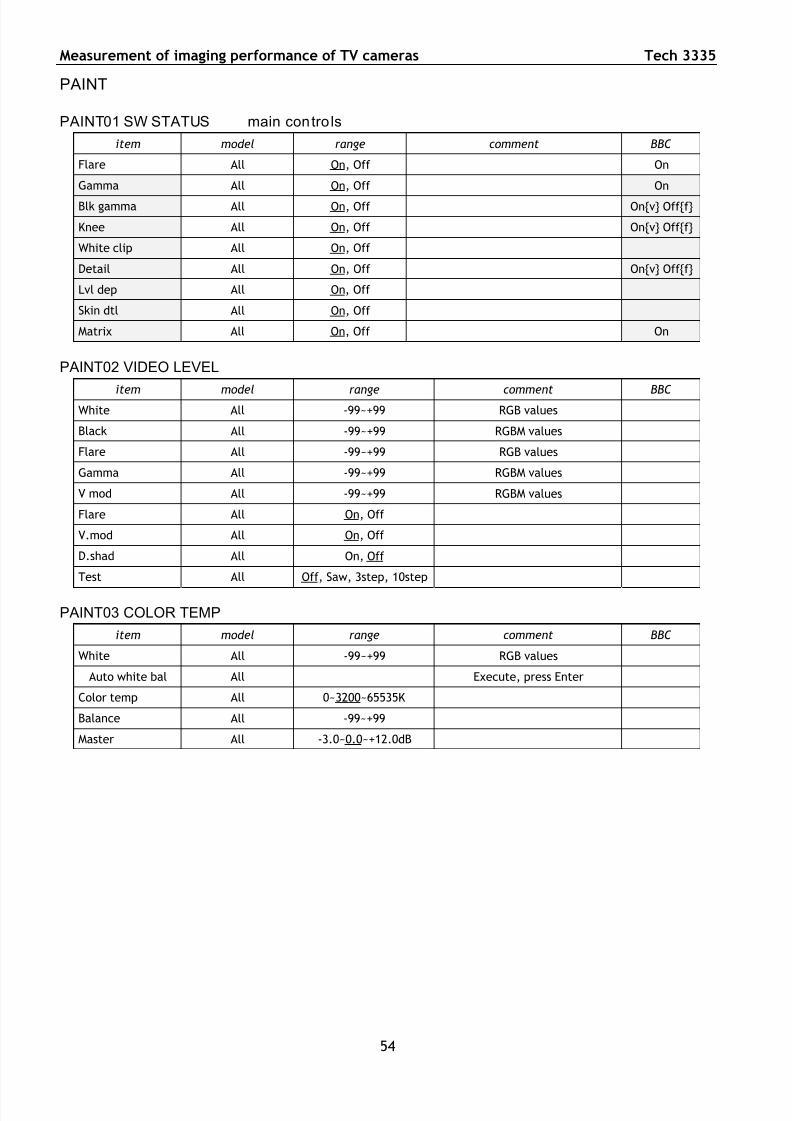
7/27/2019 tech3335 SETTAGGIO CAMERE
http://slidepdf.com/reader/full/tech3335-settaggio-camere 54/68
Measurement of imaging performance of TV cameras Tech 3335
54
PAINT
PAINT01 SW STATUS main contro ls
item model range comment BBC
Flare All On, Off On
Gamma All On, Off On
Blk gamma All On, Off On{v} Off{f}
Knee All On, Off On{v} Off{f}
White clip All On, Off
Detail All On, Off On{v} Off{f}
Lvl dep All On, Off
Skin dtl All On, Off
Matrix All On, Off On
PAINT02 VIDEO LEVEL
item model range comment BBCWhite All -99~+99 RGB values
Black All -99~+99 RGBM values
Flare All -99~+99 RGB values
Gamma All -99~+99 RGBM values
V mod All -99~+99 RGBM values
Flare All On, Off
V.mod All On, Off
D.shad All On, Off
Test All Off, Saw, 3step, 10step
PAINT03 COLOR TEMP
item model range comment BBC
White All -99~+99 RGB values
Auto white bal All Execute, press Enter
Color temp All 0~3200~65535K
Balance All -99~+99
Master All -3.0~0.0~+12.0dB
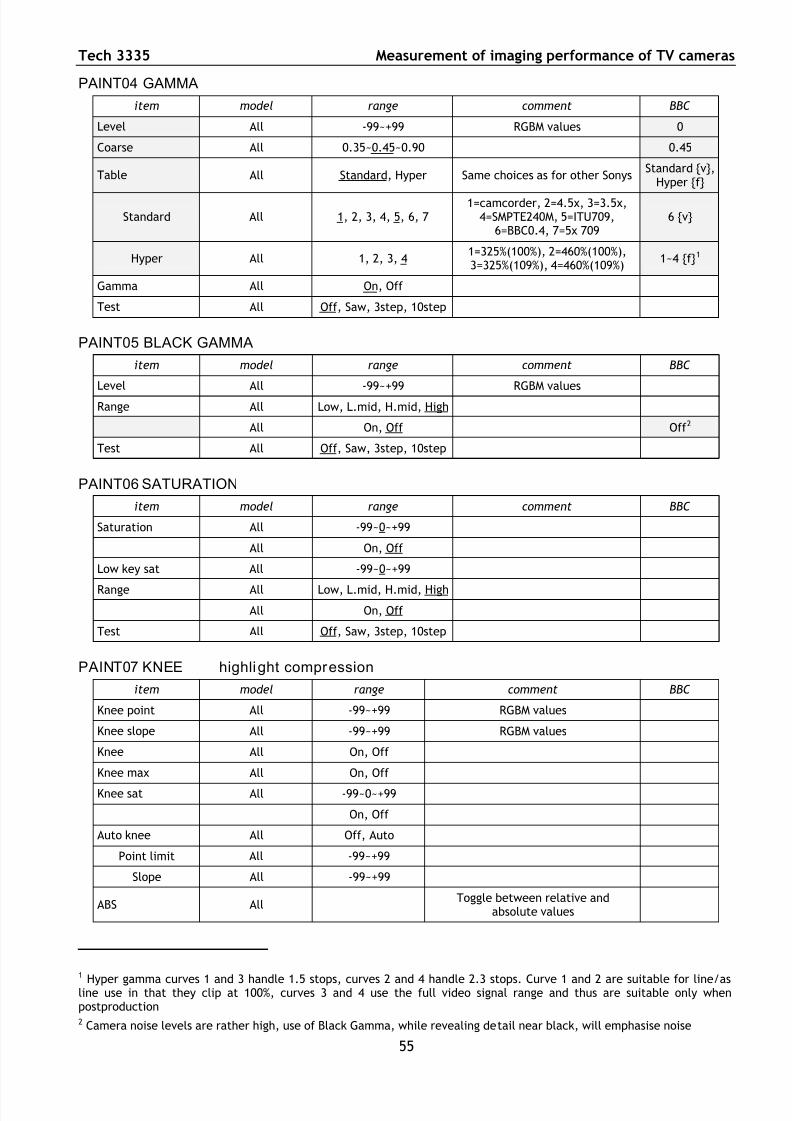
7/27/2019 tech3335 SETTAGGIO CAMERE
http://slidepdf.com/reader/full/tech3335-settaggio-camere 55/68
Tech 3335 Measurement of imaging performance of TV cameras
55
PAINT04 GAMMA
item model range comment BBC
Level All -99~+99 RGBM values 0
Coarse All 0.35~0.45~0.90 0.45
Table All Standard, Hyper Same choices as for other SonysStandard {v},
Hyper {f}
Standard All 1, 2, 3, 4, 5, 6, 71=camcorder, 2=4.5x, 3=3.5x,
4=SMPTE240M, 5=ITU709,6=BBC0.4, 7=5x 709
6 {v}
Hyper All 1, 2, 3, 41=325%(100%), 2=460%(100%),3=325%(109%), 4=460%(109%)
1~4 {f}1
Gamma All On, Off
Test All Off, Saw, 3step, 10step
PAINT05 BLACK GAMMA
item model range comment BBC
Level All -99~+99 RGBM values
Range All Low, L.mid, H.mid, High
All On, Off Off 2
Test All Off, Saw, 3step, 10step
PAINT06 SATURATION
item model range comment BBC
Saturation All -99~0~+99
All On, Off
Low key sat All -99~0~+99
Range All Low, L.mid, H.mid, High
All On, Off
Test All Off, Saw, 3step, 10step
PAINT07 KNEE highlight compression
item model range comment BBC
Knee point All -99~+99 RGBM values
Knee slope All -99~+99 RGBM values
Knee All On, Off
Knee max All On, Off
Knee sat All -99~0~+99
On, Off
Auto knee All Off, Auto
Point limit All -99~+99
Slope All -99~+99
ABS AllToggle between relative and
absolute values
1
Hyper gamma curves 1 and 3 handle 1.5 stops, curves 2 and 4 handle 2.3 stops. Curve 1 and 2 are suitable for line/asline use in that they clip at 100%, curves 3 and 4 use the full video signal range and thus are suitable only whenpostproduction2 Camera noise levels are rather high, use of Black Gamma, while revealing detail near black, will emphasise noise
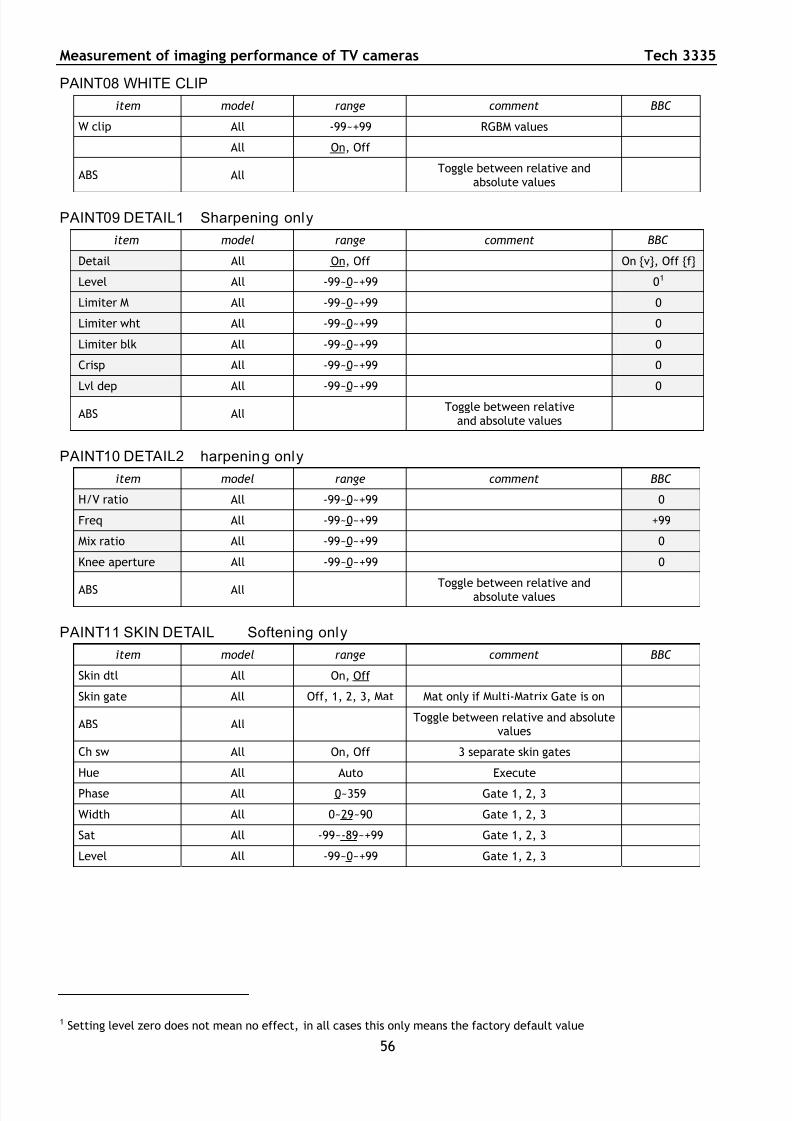
7/27/2019 tech3335 SETTAGGIO CAMERE
http://slidepdf.com/reader/full/tech3335-settaggio-camere 56/68
Measurement of imaging performance of TV cameras Tech 3335
56
PAINT08 WHITE CLIP
item model range comment BBC
W clip All -99~+99 RGBM values
All On, Off
ABS AllToggle between relative and
absolute values
PAINT09 DETAIL1 Sharpening only
item model range comment BBC
Detail All On, Off On {v}, Off {f}
Level All -99~0~+99 01
Limiter M All -99~0~+99 0
Limiter wht All -99~0~+99 0
Limiter blk All -99~0~+99 0
Crisp All -99~0~+99 0
Lvl dep All -99~0~+99 0
ABS AllToggle between relative
and absolute values
PAINT10 DETAIL2 harpening only
item model range comment BBC
H/V ratio All -99~0~+99 0
Freq All -99~0~+99 +99
Mix ratio All -99~0~+99 0
Knee aperture All -99~0~+99 0
ABS All Toggle between relative andabsolute values
PAINT11 SKIN DETAIL Softening only
item model range comment BBC
Skin dtl All On, Off
Skin gate All Off, 1, 2, 3, Mat Mat only if Multi-Matrix Gate is on
ABS AllToggle between relative and absolute
values
Ch sw All On, Off 3 separate skin gates
Hue All Auto Execute
Phase All 0~359 Gate 1, 2, 3
Width All 0~29~90 Gate 1, 2, 3
Sat All -99~-89~+99 Gate 1, 2, 3
Level All -99~0~+99 Gate 1, 2, 3
1 Setting level zero does not mean no effect, in all cases this only means the factory default value
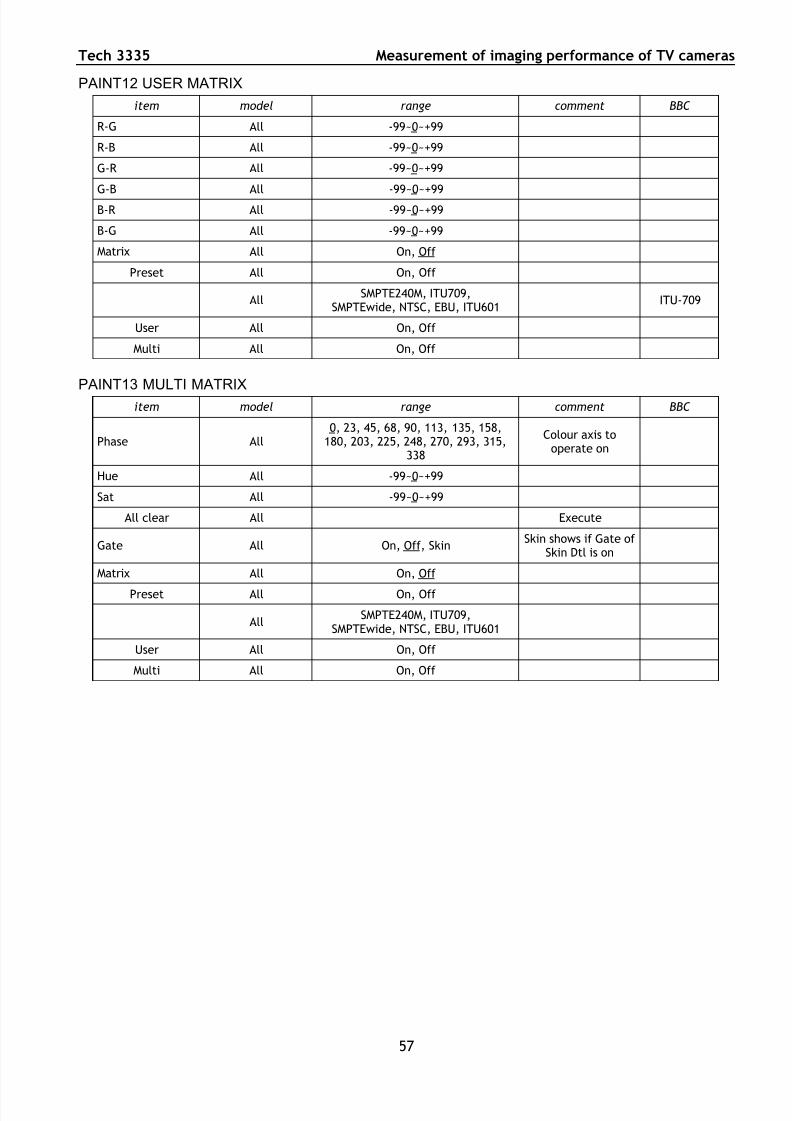
7/27/2019 tech3335 SETTAGGIO CAMERE
http://slidepdf.com/reader/full/tech3335-settaggio-camere 57/68
Tech 3335 Measurement of imaging performance of TV cameras
57
PAINT12 USER MATRIX
item model range comment BBC
R-G All -99~0~+99
R-B All -99~0~+99
G-R All -99~0~+99
G-B All -99~0~+99
B-R All -99~0~+99
B-G All -99~0~+99
Matrix All On, Off
Preset All On, Off
AllSMPTE240M, ITU709,
SMPTEwide, NTSC, EBU, ITU601ITU-709
User All On, Off
Multi All On, Off
PAINT13 MULTI MATRIX
item model range comment BBC
Phase All0, 23, 45, 68, 90, 113, 135, 158,
180, 203, 225, 248, 270, 293, 315,338
Colour axis tooperate on
Hue All -99~0~+99
Sat All -99~0~+99
All clear All Execute
Gate All On, Off, SkinSkin shows if Gate of
Skin Dtl is on
Matrix All On, Off
Preset All On, Off
AllSMPTE240M, ITU709,
SMPTEwide, NTSC, EBU, ITU601
User All On, Off
Multi All On, Off
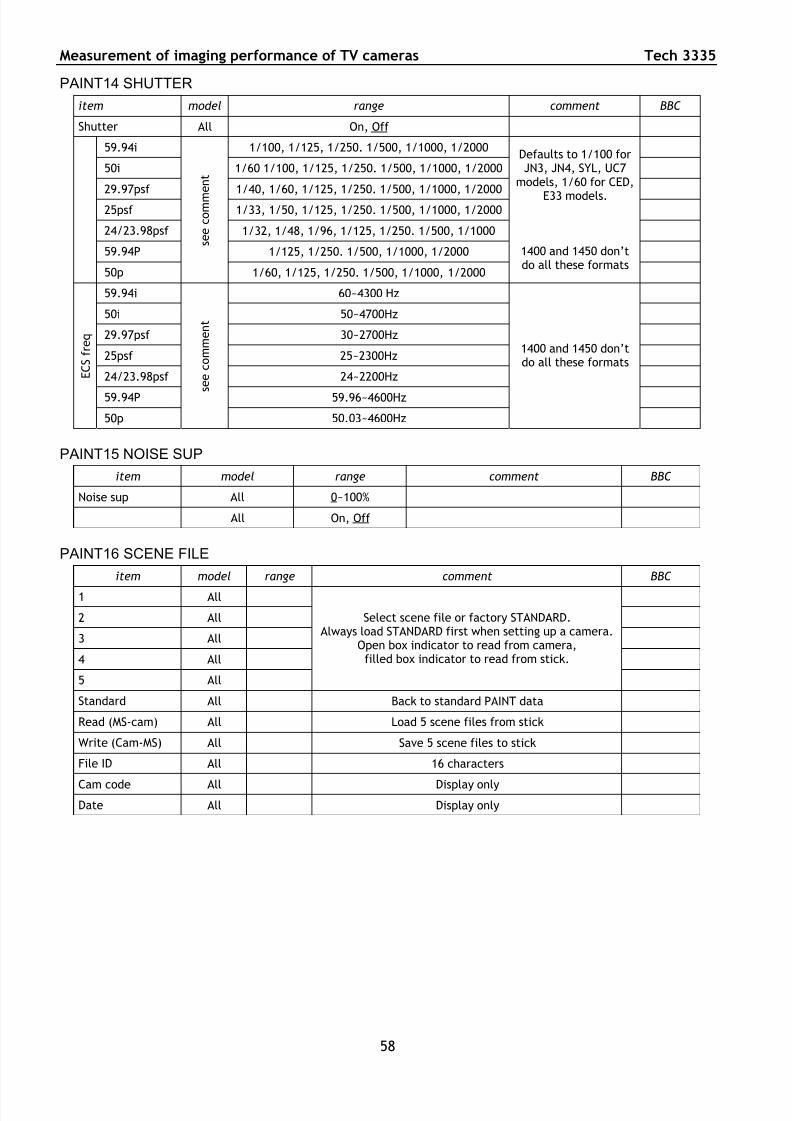
7/27/2019 tech3335 SETTAGGIO CAMERE
http://slidepdf.com/reader/full/tech3335-settaggio-camere 58/68
Measurement of imaging performance of TV cameras Tech 3335
58
PAINT14 SHUTTER
item model range comment BBC
Shutter All On, Off
59.94i 1/100, 1/125, 1/250. 1/500, 1/1000, 1/2000
50i 1/60 1/100, 1/125, 1/250. 1/500, 1/1000, 1/2000
29.97psf 1/40, 1/60, 1/125, 1/250. 1/500, 1/1000, 1/2000
25psf 1/33, 1/50, 1/125, 1/250. 1/500, 1/1000, 1/2000
24/23.98psf 1/32, 1/48, 1/96, 1/125, 1/250. 1/500, 1/1000
59.94P 1/125, 1/250. 1/500, 1/1000, 1/2000
50p
s e e c o m m
e n t
1/60, 1/125, 1/250. 1/500, 1/1000, 1/2000
Defaults to 1/100 forJN3, JN4, SYL, UC7
models, 1/60 for CED,
E33 models.
1400 and 1450 don’tdo all these formats
59.94i 60~4300 Hz
50i 50~4700Hz
29.97psf 30~2700Hz
25psf 25~2300Hz
24/23.98psf 24~2200Hz
59.94P 59.96~4600Hz
E C S f r e q
50p
s e e c o m m e n t
50.03~4600Hz
1400 and 1450 don’tdo all these formats
PAINT15 NOISE SUP
item model range comment BBC
Noise sup All 0~100%
All On, Off
PAINT16 SCENE FILE
item model range comment BBC
1 All
2 All
3 All
4 All
5 All
Select scene file or factory STANDARD.Always load STANDARD first when setting up a camera.
Open box indicator to read from camera,filled box indicator to read from stick.
Standard All Back to standard PAINT data
Read (MS-cam) All Load 5 scene files from stick
Write (Cam-MS) All Save 5 scene files to stick
File ID All 16 characters
Cam code All Display only
Date All Display only
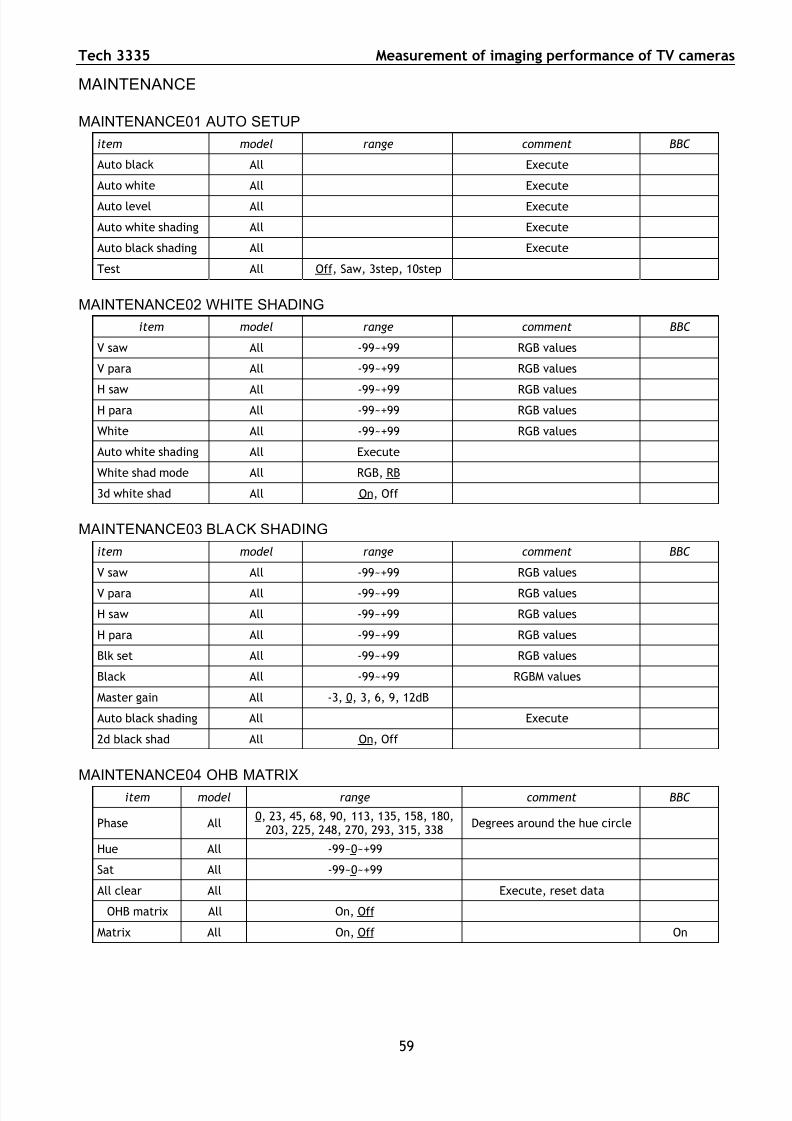
7/27/2019 tech3335 SETTAGGIO CAMERE
http://slidepdf.com/reader/full/tech3335-settaggio-camere 59/68
Tech 3335 Measurement of imaging performance of TV cameras
59
MAINTENANCE
MAINTENANCE01 AUTO SETUP
item model range comment BBC
Auto black All Execute
Auto white All Execute
Auto level All Execute
Auto white shading All Execute
Auto black shading All Execute
Test All Off, Saw, 3step, 10step
MAINTENANCE02 WHITE SHADING
item model range comment BBC
V saw All -99~+99 RGB values
V para All -99~+99 RGB values
H saw All -99~+99 RGB valuesH para All -99~+99 RGB values
White All -99~+99 RGB values
Auto white shading All Execute
White shad mode All RGB, RB
3d white shad All On, Off
MAINTENANCE03 BLACK SHADING
item model range comment BBC
V saw All -99~+99 RGB values
V para All -99~+99 RGB values
H saw All -99~+99 RGB values
H para All -99~+99 RGB values
Blk set All -99~+99 RGB values
Black All -99~+99 RGBM values
Master gain All -3, 0, 3, 6, 9, 12dB
Auto black shading All Execute
2d black shad All On, Off
MAINTENANCE04 OHB MATRIX
item model range comment BBC
Phase All0, 23, 45, 68, 90, 113, 135, 158, 180,
203, 225, 248, 270, 293, 315, 338Degrees around the hue circle
Hue All -99~0~+99
Sat All -99~0~+99
All clear All Execute, reset data
OHB matrix All On, Off
Matrix All On, Off On
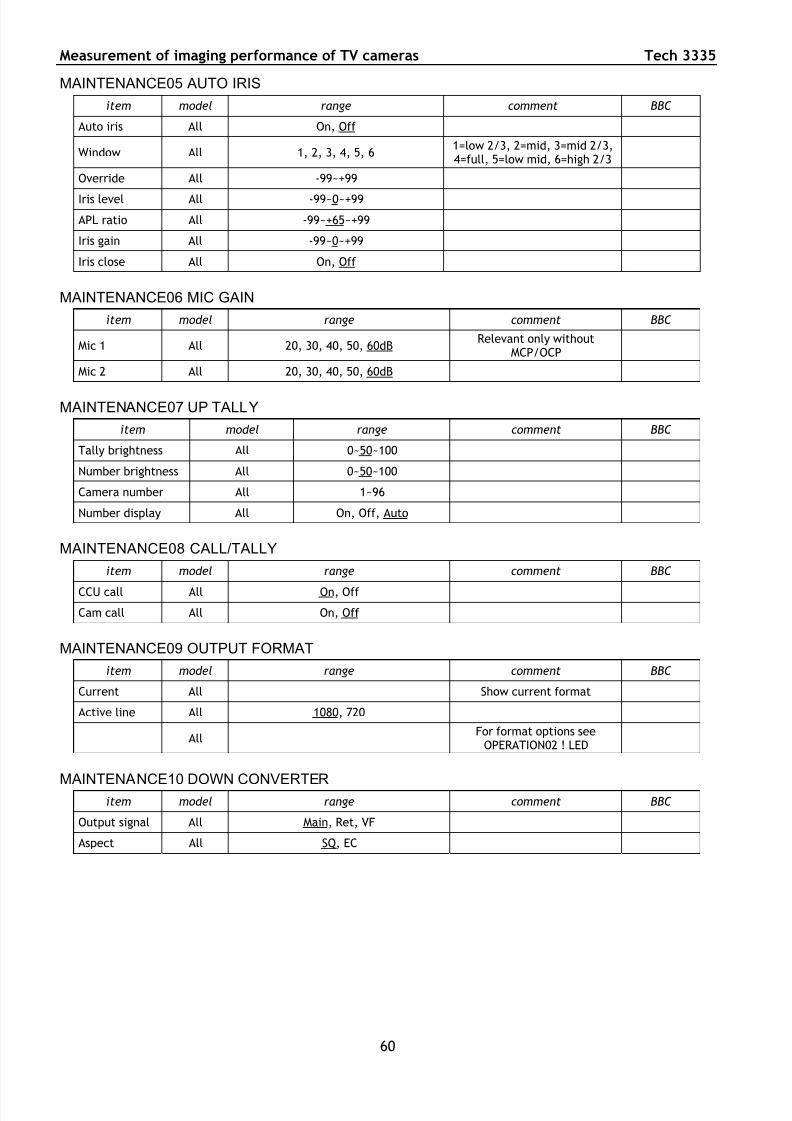
7/27/2019 tech3335 SETTAGGIO CAMERE
http://slidepdf.com/reader/full/tech3335-settaggio-camere 60/68
Measurement of imaging performance of TV cameras Tech 3335
60
MAINTENANCE05 AUTO IRIS
item model range comment BBC
Auto iris All On, Off
Window All 1, 2, 3, 4, 5, 61=low 2/3, 2=mid, 3=mid 2/3,4=full, 5=low mid, 6=high 2/3
Override All -99~+99
Iris level All -99~0~+99
APL ratio All -99~+65~+99
Iris gain All -99~0~+99
Iris close All On, Off
MAINTENANCE06 MIC GAIN
item model range comment BBC
Mic 1 All 20, 30, 40, 50, 60dBRelevant only without
MCP/OCP
Mic 2 All 20, 30, 40, 50, 60dB
MAINTENANCE07 UP TALLY
item model range comment BBC
Tally brightness All 0~50~100
Number brightness All 0~50~100
Camera number All 1~96
Number display All On, Off, Auto
MAINTENANCE08 CALL/TALLY
item model range comment BBC
CCU call All On, Off
Cam call All On, Off
MAINTENANCE09 OUTPUT FORMAT
item model range comment BBC
Current All Show current format
Active line All 1080, 720
AllFor format options see
OPERATION02 ! LED
MAINTENANCE10 DOWN CONVERTERitem model range comment BBC
Output signal All Main, Ret, VF
Aspect All SQ, EC
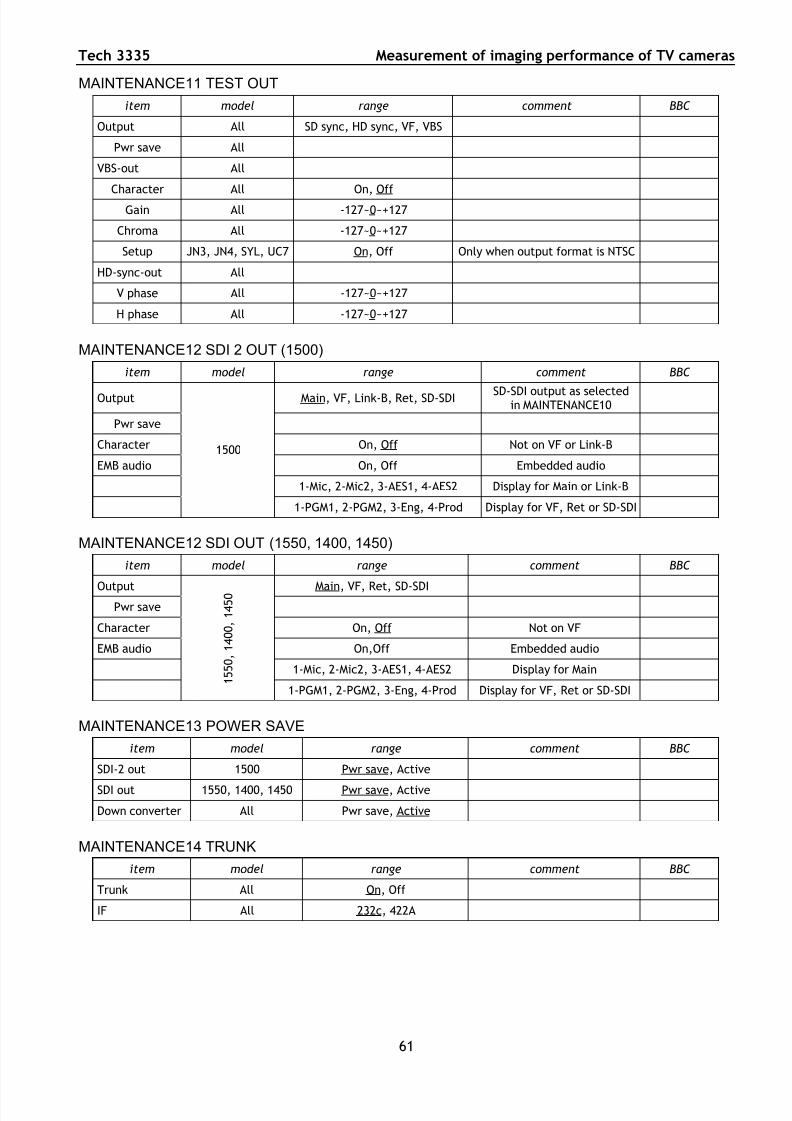
7/27/2019 tech3335 SETTAGGIO CAMERE
http://slidepdf.com/reader/full/tech3335-settaggio-camere 61/68
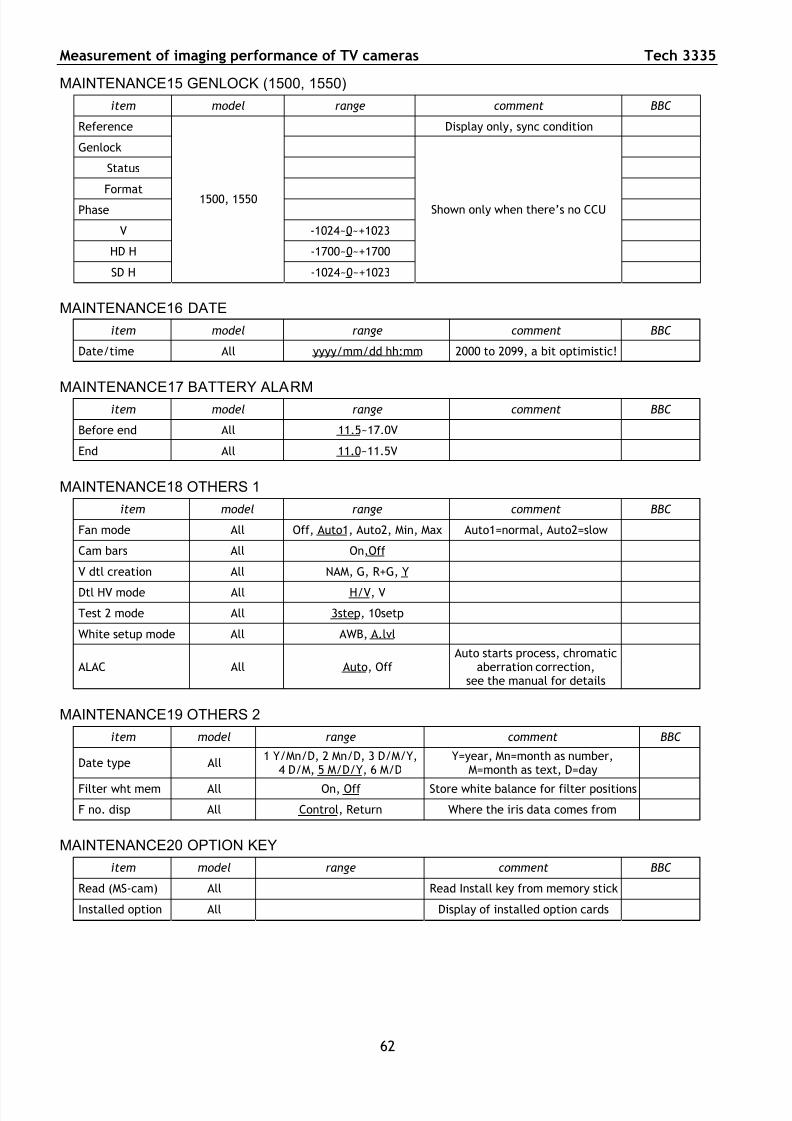
7/27/2019 tech3335 SETTAGGIO CAMERE
http://slidepdf.com/reader/full/tech3335-settaggio-camere 62/68
Measurement of imaging performance of TV cameras Tech 3335
62
MAINTENANCE15 GENLOCK (1500, 1550)
item model range comment BBC
Reference Display only, sync condition
Genlock
Status
Format
Phase
V -1024~0~+1023
HD H -1700~0~+1700
SD H
1500, 1550
-1024~0~+1023
Shown only when there’s no CCU
MAINTENANCE16 DATE
item model range comment BBC
Date/time All yyyy/mm/dd hh:mm 2000 to 2099, a bit optimistic!
MAINTENANCE17 BATTERY ALARMitem model range comment BBC
Before end All 11.5~17.0V
End All 11.0~11.5V
MAINTENANCE18 OTHERS 1
item model range comment BBC
Fan mode All Off, Auto1, Auto2, Min, Max Auto1=normal, Auto2=slow
Cam bars All On,Off
V dtl creation All NAM, G, R+G, Y
Dtl HV mode All H/V, V
Test 2 mode All 3step, 10setp
White setup mode All AWB, A.lvl
ALAC All Auto, Off Auto starts process, chromatic
aberration correction,see the manual for details
MAINTENANCE19 OTHERS 2
item model range comment BBC
Date type All1 Y/Mn/D, 2 Mn/D, 3 D/M/Y,
4 D/M, 5 M/D/Y, 6 M/DY=year, Mn=month as number,
M=month as text, D=day
Filter wht mem All On, Off Store white balance for filter positions
F no. disp All Control, Return Where the iris data comes from
MAINTENANCE20 OPTION KEY
item model range comment BBC
Read (MS-cam) All Read Install key from memory stick
Installed option All Display of installed option cards
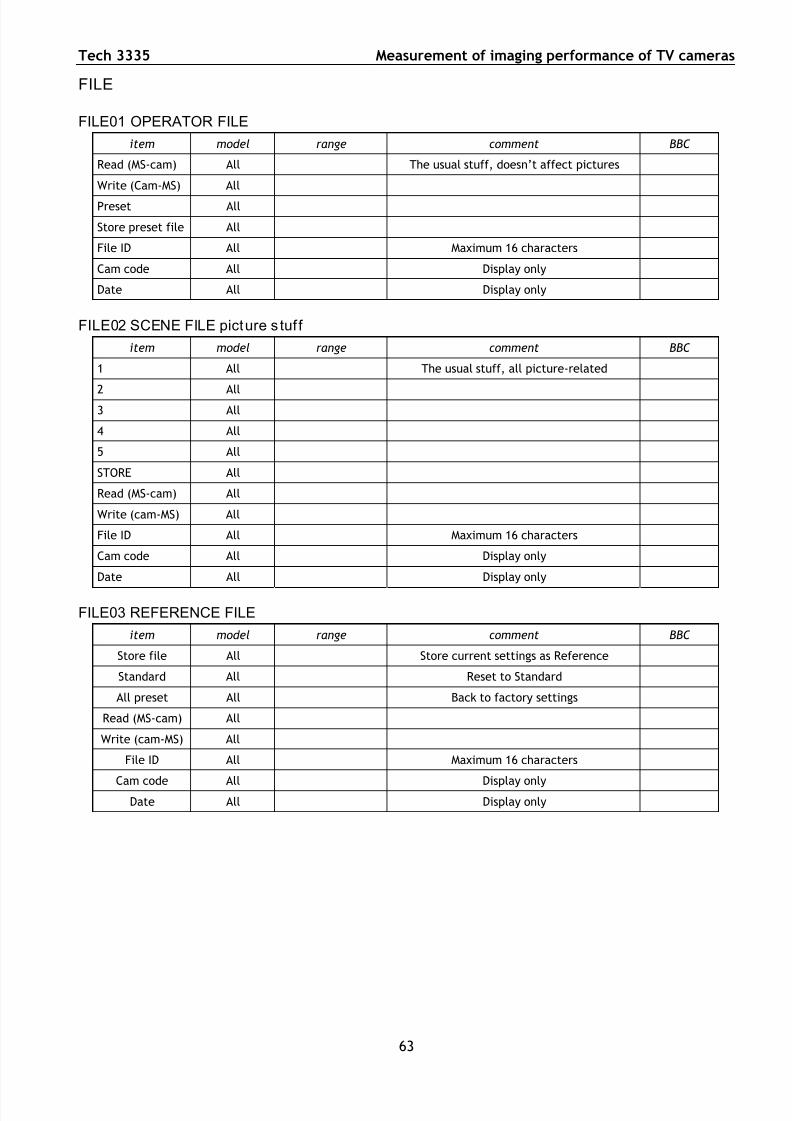
7/27/2019 tech3335 SETTAGGIO CAMERE
http://slidepdf.com/reader/full/tech3335-settaggio-camere 63/68
Tech 3335 Measurement of imaging performance of TV cameras
63
FILE
FILE01 OPERATOR FILE
item model range comment BBC
Read (MS-cam) All The usual stuff, doesn’t affect pictures
Write (Cam-MS) All
Preset All
Store preset file All
File ID All Maximum 16 characters
Cam code All Display only
Date All Display only
FILE02 SCENE FILE picture s tuf f
item model range comment BBC
1 All The usual stuff, all picture-related
2 All3 All
4 All
5 All
STORE All
Read (MS-cam) All
Write (cam-MS) All
File ID All Maximum 16 characters
Cam code All Display only
Date All Display only
FILE03 REFERENCE FILE
item model range comment BBC
Store file All Store current settings as Reference
Standard All Reset to Standard
All preset All Back to factory settings
Read (MS-cam) All
Write (cam-MS) All
File ID All Maximum 16 characters
Cam code All Display onlyDate All Display only
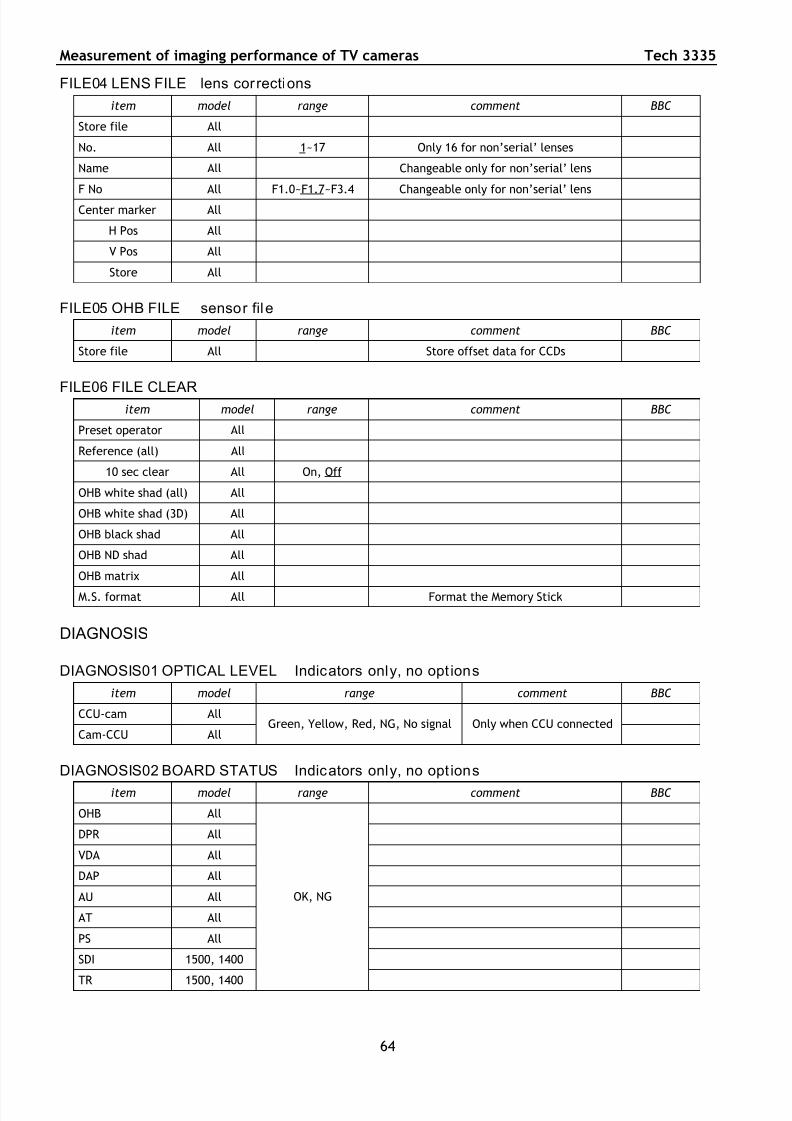
7/27/2019 tech3335 SETTAGGIO CAMERE
http://slidepdf.com/reader/full/tech3335-settaggio-camere 64/68
Measurement of imaging performance of TV cameras Tech 3335
64
FILE04 LENS FILE lens corrections
item model range comment BBC
Store file All
No. All 1~17 Only 16 for non’serial’ lenses
Name All Changeable only for non’serial’ lens
F No All F1.0~F1.7~F3.4 Changeable only for non’serial’ lens
Center marker All
H Pos All
V Pos All
Store All
FILE05 OHB FILE sensor fil e
item model range comment BBC
Store file All Store offset data for CCDs
FILE06 FILE CLEARitem model range comment BBC
Preset operator All
Reference (all) All
10 sec clear All On, Off
OHB white shad (all) All
OHB white shad (3D) All
OHB black shad All
OHB ND shad All
OHB matrix All
M.S. format All Format the Memory Stick
DIAGNOSIS
DIAGNOSIS01 OPTICAL LEVEL Indicators only, no opt ions
item model range comment BBC
CCU-cam All
Cam-CCU AllGreen, Yellow, Red, NG, No signal Only when CCU connected
DIAGNOSIS02 BOARD STATUS Indicators only, no opt ions
item model range comment BBC
OHB All
DPR All
VDA All
DAP All
AU All
AT All
PS All
SDI 1500, 1400
TR 1500, 1400
OK, NG
7/27/2019 tech3335 SETTAGGIO CAMERE
http://slidepdf.com/reader/full/tech3335-settaggio-camere 65/68
Tech 3335 Measurement of imaging performance of TV cameras
65
DIAGNOSIS03 PDL VERSION Indicators only, no opt ions
item model range comment BBC
TD All
VDA All
DAP All
AT All
SDI All
TR 1550, 1450
DPR All
HKCT All
Vx.xx
Only when HKC-T1500 installed
DIAGNOSIS04 ROM VERSION Indicators only, no opt ions
item model range comment BBC
AT All
Panel All Only with HDLA attached
HKCT All
Vx.xx
Only when HKC-T1500 installed
DIAGNOSIS05 SERIAL NO Ind icators only, no opt ions
item model range comment BBC
Model All HDCxxxxR
No All
Option All Shows what options are installed
A7.2. MeasurementsAll measurements were made at BBC R&D, using a Sony 32” CRT Grade 1 HDTV monitor and a digitalwaveform monitor. Frame files were grabbed via HDSDI for software analysis. Importing recordingsinto editing software is unreliable because the decoding and transcoding is not fully specified. Thelens was a Canon HJ22x7.6.
A7.2.1 Gamma and Headroom range
The camera has seven ‘standard’ gamma curves and four ‘hyper’ gammas. Colour performance,with the ITU.709 gamma curve, was good, although a little over-saturated.
The Hyper-gamma curves are those of the HDWF900R and other similar Sony cameras, providing forfilmlike transfer over either 325% or 460% headroom, delivered into either 100% or 109% videosignal range. They are known to perform well; there was no need to examine them in this camera.
The Standard curves, also, are those of other cameras, with a few additions. The most importantcurves are numbers 6 and 7 in the table, ITU.709 and BBC0.4. Since this is a HDTV camera, the 709curve should be regarded as the normal option, unless there is a specific need to change it toachieve specific picture performance. Since the Hyper-gammas handle headroom well, there islittle need to explore the knee function, using Standard curves. Knee curves should be able to copewith about 2 stops of over-exposure.
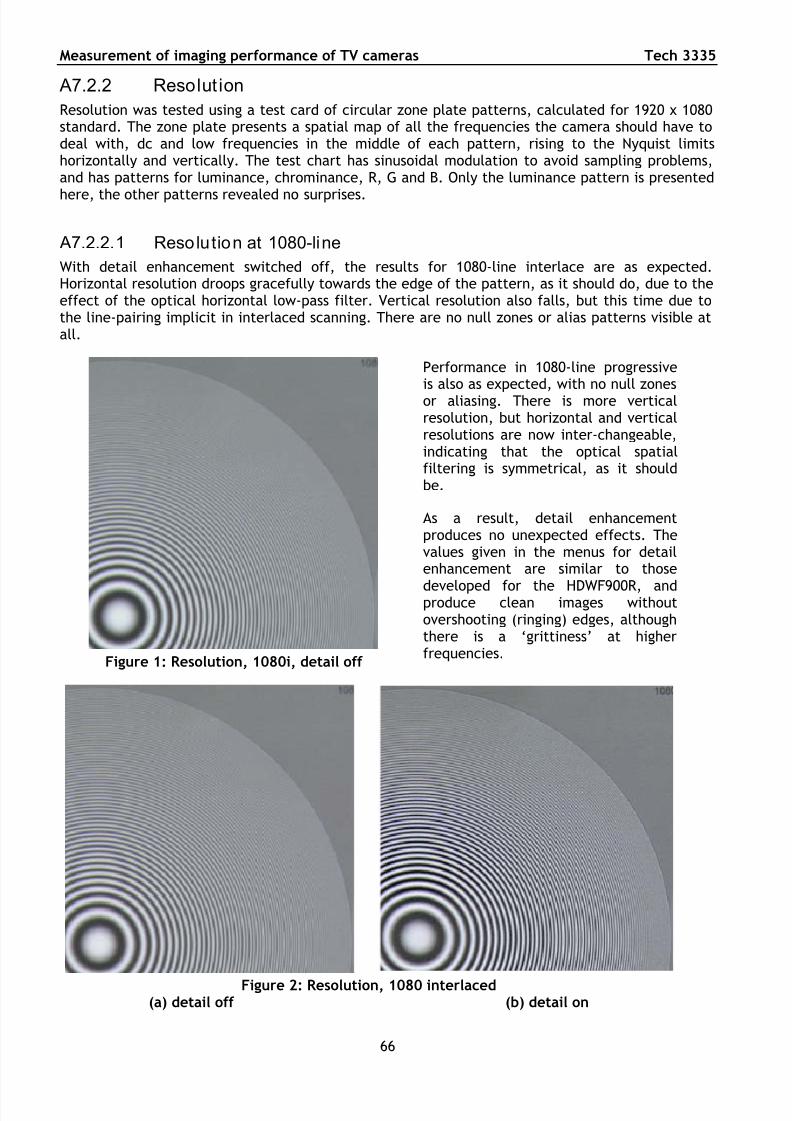
7/27/2019 tech3335 SETTAGGIO CAMERE
http://slidepdf.com/reader/full/tech3335-settaggio-camere 66/68
Measurement of imaging performance of TV cameras Tech 3335
A7.2.2 Resolut ion
Resolution was tested using a test card of circular zone plate patterns, calculated for 1920 x 1080standard. The zone plate presents a spatial map of all the frequencies the camera should have todeal with, dc and low frequencies in the middle of each pattern, rising to the Nyquist limitshorizontally and vertically. The test chart has sinusoidal modulation to avoid sampling problems,and has patterns for luminance, chrominance, R, G and B. Only the luminance pattern is presented
here, the other patterns revealed no surprises.
A7.2.2.1 Resolution at 1080-line
With detail enhancement switched off, the results for 1080-line interlace are as expected.Horizontal resolution droops gracefully towards the edge of the pattern, as it should do, due to theeffect of the optical horizontal low-pass filter. Vertical resolution also falls, but this time due tothe line-pairing implicit in interlaced scanning. There are no null zones or alias patterns visible atall.
Figure 1: Resolution, 1080i, detail off
Performance in 1080-line progressiveis also as expected, with no null zonesor aliasing. There is more verticalresolution, but horizontal and verticalresolutions are now inter-changeable,indicating that the optical spatialfiltering is symmetrical, as it shouldbe.
As a result, detail enhancementproduces no unexpected effects. Thevalues given in the menus for detailenhancement are similar to those
developed for the HDWF900R, andproduce clean images withoutovershooting (ringing) edges, althoughthere is a ‘grittiness’ at higherfrequencies.
Figure 2: Resolution, 1080 interlaced(a) detail off (b) detail on
66
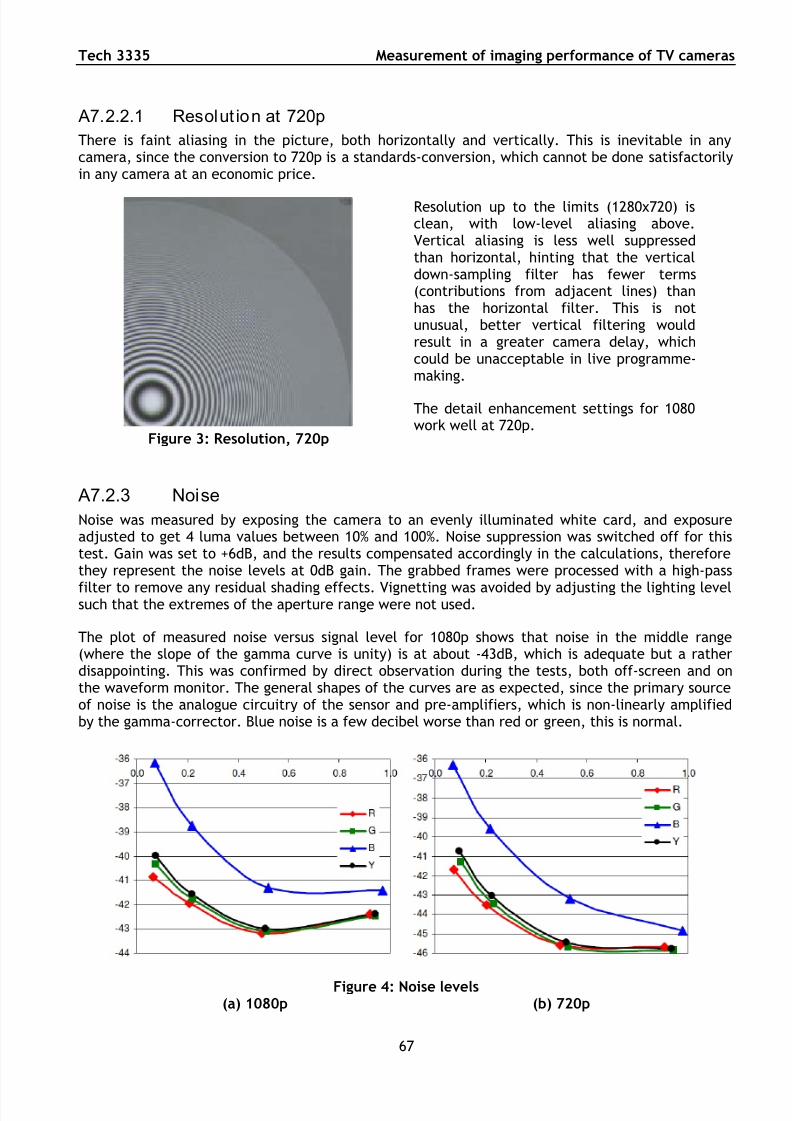
7/27/2019 tech3335 SETTAGGIO CAMERE
http://slidepdf.com/reader/full/tech3335-settaggio-camere 67/68
Tech 3335 Measurement of imaging performance of TV cameras
A7.2.2.1 Resolut ion at 720p
There is faint aliasing in the picture, both horizontally and vertically. This is inevitable in anycamera, since the conversion to 720p is a standards-conversion, which cannot be done satisfactorilyin any camera at an economic price.
Figure 3: Resolution, 720p
Resolution up to the limits (1280x720) isclean, with low-level aliasing above.Vertical aliasing is less well suppressedthan horizontal, hinting that the verticaldown-sampling filter has fewer terms(contributions from adjacent lines) thanhas the horizontal filter. This is notunusual, better vertical filtering wouldresult in a greater camera delay, whichcould be unacceptable in live programme-making.
The detail enhancement settings for 1080work well at 720p.
A7.2.3 Noise
Noise was measured by exposing the camera to an evenly illuminated white card, and exposureadjusted to get 4 luma values between 10% and 100%. Noise suppression was switched off for thistest. Gain was set to +6dB, and the results compensated accordingly in the calculations, thereforethey represent the noise levels at 0dB gain. The grabbed frames were processed with a high-pass
filter to remove any residual shading effects. Vignetting was avoided by adjusting the lighting levelsuch that the extremes of the aperture range were not used.
The plot of measured noise versus signal level for 1080p shows that noise in the middle range(where the slope of the gamma curve is unity) is at about -43dB, which is adequate but a ratherdisappointing. This was confirmed by direct observation during the tests, both off-screen and onthe waveform monitor. The general shapes of the curves are as expected, since the primary sourceof noise is the analogue circuitry of the sensor and pre-amplifiers, which is non-linearly amplifiedby the gamma-corrector. Blue noise is a few decibel worse than red or green, this is normal.
Figure 4: Noise levels(a) 1080p (b) 720p
67
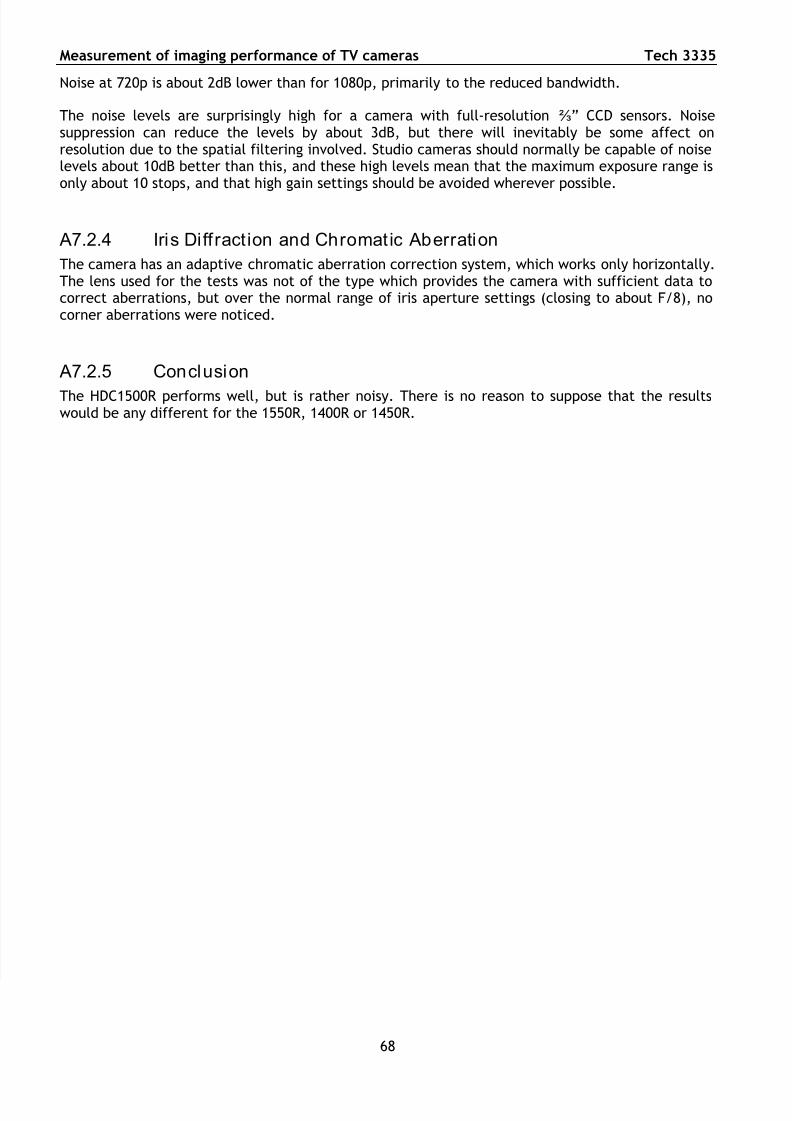
7/27/2019 tech3335 SETTAGGIO CAMERE
http://slidepdf.com/reader/full/tech3335-settaggio-camere 68/68
Measurement of imaging performance of TV cameras Tech 3335
Noise at 720p is about 2dB lower than for 1080p, primarily to the reduced bandwidth.
The noise levels are surprisingly high for a camera with full-resolution ⅔” CCD sensors. Noisesuppression can reduce the levels by about 3dB, but there will inevitably be some affect onresolution due to the spatial filtering involved. Studio cameras should normally be capable of noiselevels about 10dB better than this, and these high levels mean that the maximum exposure range isonly about 10 stops, and that high gain settings should be avoided wherever possible.
A7.2.4 Iris Diff ract ion and Chromat ic Aberration
The camera has an adaptive chromatic aberration correction system, which works only horizontally.The lens used for the tests was not of the type which provides the camera with sufficient data tocorrect aberrations, but over the normal range of iris aperture settings (closing to about F/8), nocorner aberrations were noticed.
A7.2.5 Conclusion
The HDC1500R performs well, but is rather noisy. There is no reason to suppose that the resultswould be any different for the 1550R, 1400R or 1450R.