Embed Size (px)
Citation preview
Gest. Prod., São Carlos, v. 23, n. 3, p. 638-648, 2016http://dx.doi.org/10.1590/0104-530X1655-14
Resumo: Este estudo tem por objetivo verificar a possibilidade de aproveitamento da água da chuva em uma indústria metalmecânica localizada no município de São José dos Pinhais, região metropolitana de Curitiba, considerando o volume de chuvas, necessidade da indústria, as características de qualidade da água de chuva da região, além de uma simulação da cobrança pelo uso da água e emissão dos seus efluentes lançados em um córrego próximo. Nesta avaliação, verificou-se que o aproveitamento da água de chuva pode ser viável devido ao comportamento hidrológico da região e a qualidade dessa água, verificada por ensaios de laboratório. Além disso, realizou-se uma simulação para estimar a provável economia ao se evitar o pagamento pela captação e emissão dos lançamentos nos corpos d’água da região, além do orçamento do reservatório proposto para o armazenamento da água de chuva.Palavras-chave: Aproveitamento de água de chuva; Reuso na indústria; Cobrança pelo uso da água.
Abstract: This study aims to verify the possibility of rainwater use in a metal-mechanic industry in the municipality of São José dos Pinhais, metropolitan region of Curitiba, considering the rainfall and the characteristics of rainwater quality in the region, as well as the needs of this industry. A simulation of the charging for water use and emission of effluents into a nearby stream was also conducted. Results of this evaluation showed that the exploitation of rainwater might be feasible due to the hydrological behavior of the region and the quality of such water, which was verified by laboratory testing. In addition, a simulation was conducted to estimate the possible economy with respect to payment for water collection and effluent emission, as well as to the investment in the proposed reservoir for rainwater storage.Keywords: Rainwater utilization; Reuse in industry; Charging for water use.
Technical and economic viability analysis of rain water use in a metal-mechanic industry in the metropolitan region of Curitiba, Parana state, Brazil
Análise de viabilidade técnica e econômica do uso de água de chuva em uma indústria metalmecânica na região metropolitana de Curitiba PR
Celimar Azambuja Teixeira1* Gleidiston Tadeu Zattoni1
André Nagalli1 Flávio Bentes Freira1
Sidnei Helder Cardoso Teixeira2
1 Universidade Tecnológica Federal do Paraná – UTFPR, CEP 81280-340, Curitiba, PR, Brazil, e-mail: [email protected]; [email protected]; [email protected]; [email protected]
2 Universidade Federal do Paraná – UFPR, CEP 81530-900, Curitiba, PR, Brazil, e-mail: [email protected] Aug. 8, 2014 - Accepted Feb. 18, 2016Financial support: None.
1 IntroductionThe use of Rainwater is becoming increasingly
important due to the current environmental scenario that the plane tis undergoing. This technique has been used for a long time in areas with water scarcity, is currently gaining strength in areas where there is greater availability of this resource. The industry has also felt the effects of water scarcity. Until recently, the need for water was supplied using abstraction from rivers and underground reservoirs, but facing laws that aim at the charging by abstracting of that
water companies have more cost being added to the production process.
The depletion of water resources is not only due to lack of water, but also to the loss of its quality about to face the dilemma of water intended for production or human consumption. It is noteworthy that CONAMA Resolution No. 357/2005 (Brasil, 2005) provides that in situations of water scarcity, the granting of right of use for the industrial sector may be temporarily suspended until they re-establish the reference flow
Technical and economic viability analysis… 639
condition. The purpose of this action is to preserve domestic supply.
The management plan of the Paraná Watershed aims to ensure the supply and quality of the water supplied to the population, in addition to managing the water by other sectors of the economy (industrial, agricultural, power generation, among others). One of the solutions to this impasse is the reuse of water and the use of sources previously considered unviable or alternative to the present time, as is the case of rainwater.
In some European countries, for example in Germany, it has been long encouraged the abstraction of rainwater, but in order to combat urban flooding. This stimulation caused the country to develop and improve its water use process, now being widely used in homes, businesses and industries (Machado & Cordeiro, 2004).
2 Literature reviewIn 1997 it was drafted the National Water Resources
Policy (Federal Law No. 9.433/97) (Brasil, 1997) that defines water as a public good with economic value. In Chapter IV of that law, it provides up instruments set for water management, such as granting the right to use the water and its corresponding collection.
The tax for the use of water aims to encourage conscious consumption, as it generates a cost to those who consume. Indirectly the search for alternative sources of water, such as rain and the treatment of wastewater from industrial and domestic processes, is also encouraged.
With the creation of the National Water Agency, ANA, from Law No. 9.984/00 (Brasil, 2000), began the implementation of the national system of water resources and water has become the subject of a management plan. Thus, the States have initiated the creation of the Watershed committees, providing technical support for installation of such policies.
In Paraná, the State Decree No. 5.361/02 (Paraná, 2007) regulates the charging for the right to use water resources, establishing the form of charging for water abstraction and effluent emissions, in addition to the method of calculating the same.
On April 31, 2009, the creation of the Waters Institute of Paraná was approved, defining the manager of water resources in the State. The creation of this organization was an important step for charging for water use. In order to find alternative sources of water and avoid charging for use, it was decided to study the possibility of using rainwater.
To assess the viability of rainwater use as an alternative in the industry is important to analyze data such as rainfall levels and frequency of rainfall.
The evaluation of water parameters in consumption points are very important, requiring an adjustment
of these characteristics according to the intended use (Oenning & Pawlowsky, 2007).
Furthermore, Campos et al. (2007) presents an information relevant to this work, the time required for rainwater to present good characteristics and can be used with minimal treatment.
NBR 5626 (ABNT, 1998) - Building installation of cold water gives a guideline for the installation of water reservoirs and provides procedures for the proper storage of water, indicating the constructive conditions, equipment and facilities to do so. NBR 15527 (ABNT, 2007) however brings the issues regarding the use of rainwater and the various methods to measure the volume of the reservoir.
3 MethodologyAt the beginning of the evaluation work was
identified the possibility of using all industry coverage area, since it is a metal-mechanic industry located in the metropolitan region of Curitiba-PR, and amounts to an area of about 25,000 m², and that much of the perimeter of this coverage has gutters to collect water.
Correlating the coverage of industrial facilities and the average rainfall in the region is possible to predict the availability of water to be abstracted.
Another important aspect discussed in this study is the question of charging for the use of water, i.e., how much would be paid for the extraction of water for industry and its use in the production system.
To simulate this value was used as basis the “CTCOB (Technical Committee for the Use of Water Resources) of the basins of the Upper Iguaçu and tributaries of the Upper Ribeira” in the generated document in August 2007 (Paraná, 2007). In it are simulations for some industries located in the Upper Iguaçu basin and it indicates values for the variables used in the calculation formulas of charging for abstraction and emission of water.
For the simulation of charging for the use of the water were used data from a simulation from Waters Institute of Paraná for the Hydrographic Basin of Iguaçu River.
In addition, scaled and budgeted the rainwater reservoir, considering the various methods of NBR 15527/2007 (ABNT, 2007).
3.1 PluviometryThe pluviometric indexes for this study were obtained
from the meteorological station of the Waters Institute of Paraná (Instituto das Águas do Paraná, 2007). Data were collected for the years 1982 to 2007 and refer to the Iguaçu River Basin, at the station called Prado Velho - PUC. Based on these data, were used the average monthly and annual historical average for the period 1982-2007. So, Pannual = 1487.50 mm (annual average) and respectively Pt (from January
Teixeira, C. A. et al.640 Gest. Prod., São Carlos, v. 23, n. 3, p. 638-648, 2016
to December, in mm): 225.80; 186.60; 69.20; 100.00; 106.20; 25.60; 41.60; 104.20; 179.20; 116.60; 170.40 and 162.10 (monthly averages).
To set the amount to accumulate was researched the water need of the industry.
The consumption points identified as possible use of the accumulated water are shown in Table 1.
The daily demand of the industry is 26.86 m³ per day, i.e., 805.8 m³ per month, as shown in Table 1.
3.2 Water qualityIn points of consumption, such as toilets and taps
intended for irrigation, the need for abstracted water correction is hardly necessary, since the characteristics of rainwater meet its requirements, as shown in Tables 2 and 3.
To evaluate the use of rainwater, it became necessary to verify the quality of this water.
The water for washing tools and replacement in the cooling column must meet certain quality parameters presented in Table 3.
The rainwater characteristics in the industry area, the quality of well water and values of literature, such as water quality recommendations in each consumption point, are shown in Table 2.
Table 3 shows the rainwater characteristics nearby the industry, through the roof and discarding the first 10 minutes of rain. The results of the parameters show that the characteristics of the rainwater meet the needs of demand points.
Campos et al. (2007) studied the rainwater quality variable in relation to the precipitation time. This variable is important because at the beginning of a pluviometric precipitation the water “washes” in a way particles and chemical elements present in the air, such as soot from cars and factories, CO2, SO2 and others. In addition, impurities which are deposited in the rainwater abstraction area also contaminate. These components acidify the water or confers on undesirable characteristics to their use, whether industrial or domestic. Were made a series of collections and experiments came to the conclusion that after 10 minutes of rainfall rainwater quality showed little change with time precipitation.
According to Gwenzi et al. (2015), two reasons are important for the improvement of rainwater quality after storage: they are the intensity of the precipitation associated with the size of the first disposal (First Flush) and the presence of contaminants in rainwater, from atmosphere and the roof itself.
Table 1. Consumption points and water demand by point of consumption, daily reference.
Consumption points
Consumption Units Frequency of use Daily demand(m³)
Toilets 6 L/ flush (1) 430 employees 3 times a day per employee (1)
10.8
Irrigation 2 L/ m² day (1) 1500 m² (2) Daily (1) 3Washing floors 2 L/ m² day 5000 m² Daily 10Washing tools 500 L/ Unit (3) 4 Units Monthly 0.06Replacement in Cooling Column
3 m³ day Daily 3
Total 26.86(1) Bezerra et al. (2010) apud Tomaz (2005); (2) Amount equivalent to a garden at the unit entrance and grassed area surrounding; (3) Estimated by the company.
Table 2. Minimum physicochemical and microbiological parameters required for use of water.
Parameters UnitPossible points for use of rainwater
Water for washing tools Cooling towers Washing floor
and irrigation Toilet flush
Temperature ºC Room Room Room RoompH - 6-8 6-9 6-9 6-9Turbidity NTU ≤ 2 ≤ 3 ≤ 2 ≤ 5COD mg/L ≤ 50 ≤ 75 ≤ 25 ≤ 75BOD5 mg/L ≤ 30 ≤ 30 ≤ 10 ≤ 30Hardness mg/L CaCo3 ≤ 30 50-180 ≤ 500 ≤ 500Conductivity µ.S/cm NE 800-1200 NE NETotal coliforms mg/L NE NE NE NETotal solids mg/L ≤ 1005 ≤ 530 NE NEFecal coliforms NMP/100 ml Absent ≤ 200 Absent ≤ 1000Source: Oenning & Pawlowsky (2007); NE: No Effect.
Technical and economic viability analysis… 641
Several studies have shown that first scaled disposal devices to collect 0.11 to 2.6 mm are sufficient to improve rainwater quality (Van Metre & Mahler, 2003; Mendez et al., 2011). However, Gikas & Tsihrintzis (2012) showed that the first discharges sized to collections from 0.11 to 0.13 mm are not sufficient to ensure adequate stored rainwater quality.
3.3 Charging for water useAccording to Scroccaro & Machado (2007), in the
State of Paraná and the basin of the Upper Iguaçu and the Ribeira Valley, where the industry in question is, the method used to calculate the charging for water use is defined in the State Decree no. 5.361/02 (Paraná, 2002) and is given by Equation 1:
* *( * * )C S R EX EX CN CNV K K Pu V Pu V= + (1)
Where: VC: Account Value; EXPu : Price per unit of extracted water; CNPu : Price per unit of consumed water; EXV : Volume of extracted water; CNV : Volume of consumed water.
Calculation for charging by the emission of effluents is given by Equation 2, shown below:
5 5* ** *
* *BOD BOD SS SS
C S RPA PA
Pu C Pu CV K K
Pu C Pu C∆ ∆
+ + = +
(2)
Where: VC: Account Value; 5BODPu : Price per BOD5 unit to degrade organic matter in R$/Kg; SSPu : Price per unit of suspended solids charge thrown in R$/Kg; Pu∆: Price per unit of charge corresponding to the difference between the COD and BOD5 thrown in R$/Kg; PAPu : Price per unit of other additional parameters incorporated to the formula thrown,
5BODC : BOD5 charge needed to degrade organic matter in Kg/time unity; SSC : Charge of solids in suspension thrown in Kg/time unity; C∆: Charge corresponding to the difference between the COD and the BOD5
thrown in Kg/time unity and PAC : Charge of other additional parameters incorporated into the formula and approved by the Basin Committee thrown in R$/time unity.
In addition, other factors have been adopted, such as Kr (Regional coefficient) is given by Equation 3, and Ks (Seasonal coefficient).
( * ) /Kr Pi Fi Pi= ∑ ∑ (3)
Fi and Pi factors were not defined by the competent body until the moment of preparing this study.FI Factor- Preponderant class of use in which it is framed the body of water.FII Factor – Regional priorities and social functions, economic and ecological water.FIII Factor - Availability and the degree of regulation of water supply.FIV Factor – Proportionalities of the granted flow and consumptive use in relation to the grantable flow.FV Factor - Other factors established at the discretion of the State Water Resources Council - CERH/PR;PI to Pv – Are the corresponding weights to each factor FI to Fv.Ks – Seasonal coefficient – Refers to the possibility of establishing separate charging values for different times of the year.
The charging value until the moment of preparing this study was in simulation character. The following is the table with those values. Ks and Kr are admitted as 1 for simulation effect by Sudersha as the actual values are not set.
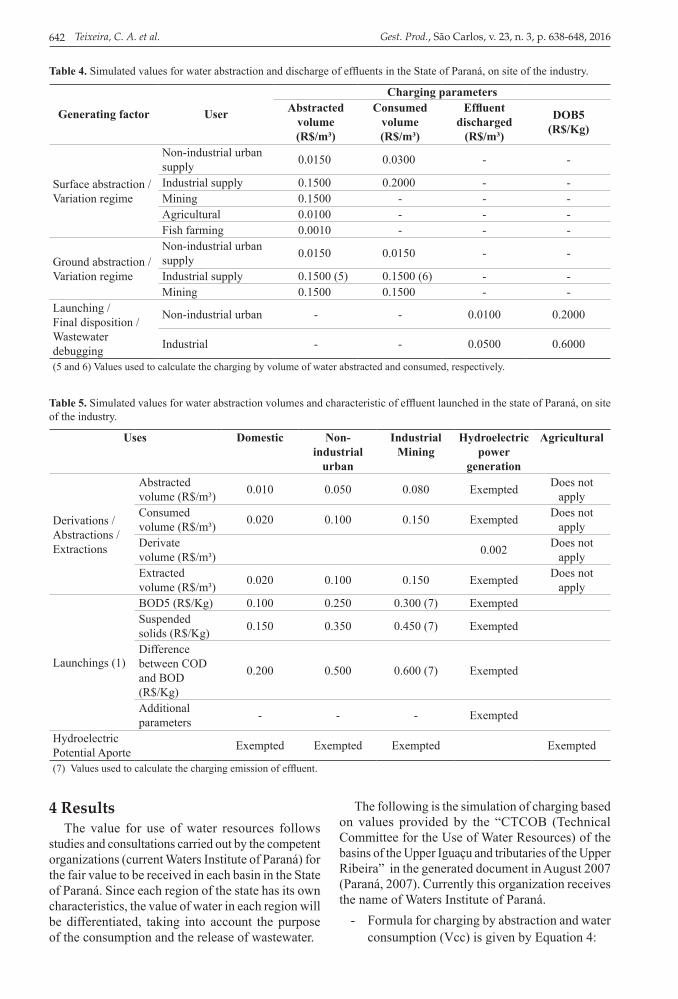
Table 4 presents values for charging calculation for water use for the abstraction of water resources.
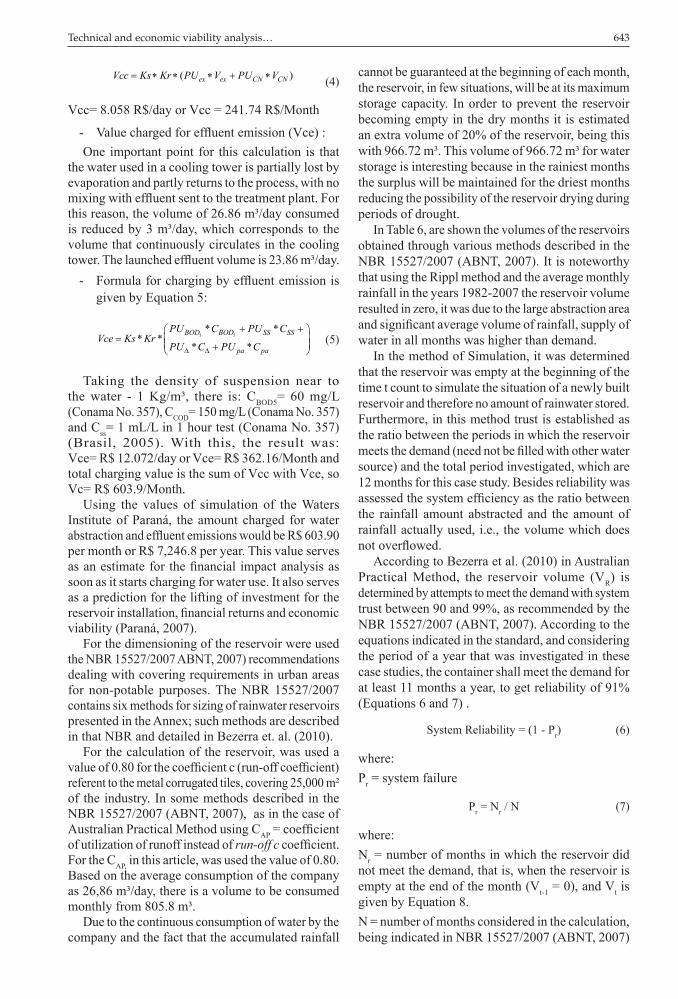
Table 5 shows the values for charging calculations for water use for launching effluents into the body of water.
Table 3. Rainwater characteristics.
Unit Water characteristicsRainwater (4)
Temperature ºC RoompH - 6.1Turbidity NTU 1.8COD mg/L 15BOD5 mg/L 1.3Hardness ppm CaCo3 6.9Conductivity µ.S/cm 100Total coliforms mg/L 570Total solids mg/L 27.8Fecal coliforms NMP/100 ml Absent(4) Rain from 02/05/2010. Collected near the Curitiba East Boundary - Region of São José dos Pinhais.
Teixeira, C. A. et al.642 Gest. Prod., São Carlos, v. 23, n. 3, p. 638-648, 2016
4 ResultsThe value for use of water resources follows
studies and consultations carried out by the competent organizations (current Waters Institute of Paraná) for the fair value to be received in each basin in the State of Paraná. Since each region of the state has its own characteristics, the value of water in each region will be differentiated, taking into account the purpose of the consumption and the release of wastewater.
The following is the simulation of charging based on values provided by the “CTCOB (Technical Committee for the Use of Water Resources) of the basins of the Upper Iguaçu and tributaries of the Upper Ribeira” in the generated document in August 2007 (Paraná, 2007). Currently this organization receives the name of Waters Institute of Paraná.
- Formula for charging by abstraction and water consumption (Vcc) is given by Equation 4:
Table 4. Simulated values for water abstraction and discharge of effluents in the State of Paraná, on site of the industry.
Generating factor User
Charging parametersAbstracted
volume (R$/m³)
Consumed volume (R$/m³)
Effluent discharged
(R$/m³)
DOB5(R$/Kg)
Surface abstraction / Variation regime
Non-industrial urban supply 0.0150 0.0300 - -
Industrial supply 0.1500 0.2000 - -Mining 0.1500 - - -Agricultural 0.0100 - - -Fish farming 0.0010 - - -
Ground abstraction / Variation regime
Non-industrial urban supply 0.0150 0.0150 - -
Industrial supply 0.1500 (5) 0.1500 (6) - -Mining 0.1500 0.1500 - -
Launching / Final disposition / Wastewater debugging
Non-industrial urban - - 0.0100 0.2000
Industrial - - 0.0500 0.6000
(5 and 6) Values used to calculate the charging by volume of water abstracted and consumed, respectively.
Table 5. Simulated values for water abstraction volumes and characteristic of effluent launched in the state of Paraná, on site of the industry.
Uses Domestic Non-industrial
urban
Industrial Mining
Hydroelectric power
generation
Agricultural
Derivations /Abstractions /Extractions
Abstracted volume (R$/m³) 0.010 0.050 0.080 Exempted Does not
applyConsumed volume (R$/m³) 0.020 0.100 0.150 Exempted Does not
applyDerivate volume (R$/m³) 0.002 Does not
applyExtracted volume (R$/m³) 0.020 0.100 0.150 Exempted Does not
apply
Launchings (1)
BOD5 (R$/Kg) 0.100 0.250 0.300 (7) ExemptedSuspended solids (R$/Kg) 0.150 0.350 0.450 (7) Exempted
Difference between COD and BOD (R$/Kg)
0.200 0.500 0.600 (7) Exempted
Additional parameters - - - Exempted
Hydroelectric Potential Aporte Exempted Exempted Exempted Exempted
(7) Values used to calculate the charging emission of effluent.
Technical and economic viability analysis… 643
( )ex ex CN CNVcc Ks Kr PU V PU V= ∗ ∗ ∗ + ∗ (4)
Vcc= 8.058 R$/day or Vcc = 241.74 R$/Month
- Value charged for effluent emission (Vce) :One important point for this calculation is that
the water used in a cooling tower is partially lost by evaporation and partly returns to the process, with no mixing with effluent sent to the treatment plant. For this reason, the volume of 26.86 m³/day consumed is reduced by 3 m³/day, which corresponds to the volume that continuously circulates in the cooling tower. The launched effluent volume is 23.86 m³/day.
- Formula for charging by effluent emission is given by Equation 5:
5 5* *
* ** *
BOD BOD SS SS
pa pa
PU C PU CVce Ks Kr
PU C PU C∆ ∆
+ + = +
(5)
Taking the density of suspension near to the water - 1 Kg/m³, there is: CBOD5= 60 mg/L (Conama No. 357), CCOD= 150 mg/L (Conama No. 357) and Css= 1 mL/L in 1 hour test (Conama No. 357) (Brasil, 2005). With this, the result was: Vce= R$ 12.072/day or Vce= R$ 362.16/Month and total charging value is the sum of Vcc with Vce, so Vc= R$ 603.9/Month.
Using the values of simulation of the Waters Institute of Paraná, the amount charged for water abstraction and effluent emissions would be R$ 603.90 per month or R$ 7,246.8 per year. This value serves as an estimate for the financial impact analysis as soon as it starts charging for water use. It also serves as a prediction for the lifting of investment for the reservoir installation, financial returns and economic viability (Paraná, 2007).
For the dimensioning of the reservoir were used the NBR 15527/2007 ABNT, 2007) recommendations dealing with covering requirements in urban areas for non-potable purposes. The NBR 15527/2007 contains six methods for sizing of rainwater reservoirs presented in the Annex; such methods are described in that NBR and detailed in Bezerra et. al. (2010).
For the calculation of the reservoir, was used a value of 0.80 for the coefficient c (run-off coefficient) referent to the metal corrugated tiles, covering 25,000 m² of the industry. In some methods described in the NBR 15527/2007 (ABNT, 2007), as in the case of Australian Practical Method using CAP = coefficient of utilization of runoff instead of run-off c coefficient. For the CAP, in this article, was used the value of 0.80. Based on the average consumption of the company as 26,86 m³/day, there is a volume to be consumed monthly from 805.8 m³.
Due to the continuous consumption of water by the company and the fact that the accumulated rainfall
cannot be guaranteed at the beginning of each month, the reservoir, in few situations, will be at its maximum storage capacity. In order to prevent the reservoir becoming empty in the dry months it is estimated an extra volume of 20% of the reservoir, being this with 966.72 m³. This volume of 966.72 m³ for water storage is interesting because in the rainiest months the surplus will be maintained for the driest months reducing the possibility of the reservoir drying during periods of drought.
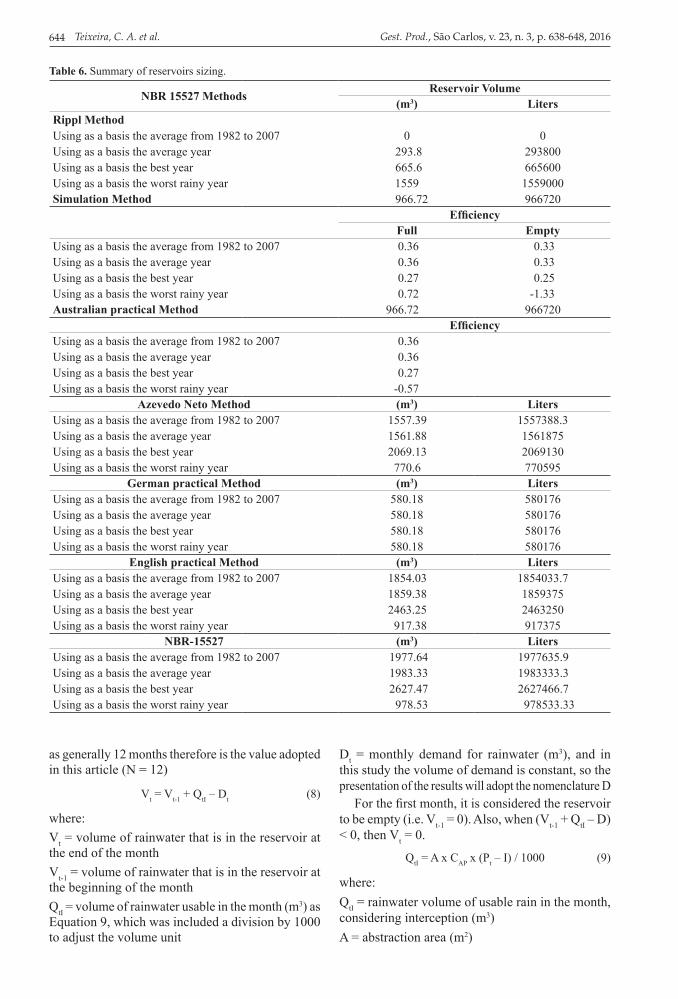
In Table 6, are shown the volumes of the reservoirs obtained through various methods described in the NBR 15527/2007 (ABNT, 2007). It is noteworthy that using the Rippl method and the average monthly rainfall in the years 1982-2007 the reservoir volume resulted in zero, it was due to the large abstraction area and significant average volume of rainfall, supply of water in all months was higher than demand.
In the method of Simulation, it was determined that the reservoir was empty at the beginning of the time t count to simulate the situation of a newly built reservoir and therefore no amount of rainwater stored. Furthermore, in this method trust is established as the ratio between the periods in which the reservoir meets the demand (need not be filled with other water source) and the total period investigated, which are 12 months for this case study. Besides reliability was assessed the system efficiency as the ratio between the rainfall amount abstracted and the amount of rainfall actually used, i.e., the volume which does not overflowed.
According to Bezerra et al. (2010) in Australian Practical Method, the reservoir volume (VR) is determined by attempts to meet the demand with system trust between 90 and 99%, as recommended by the NBR 15527/2007 (ABNT, 2007). According to the equations indicated in the standard, and considering the period of a year that was investigated in these case studies, the container shall meet the demand for at least 11 months a year, to get reliability of 91% (Equations 6 and 7) .
System Reliability = (1 - Pr) (6)
where:Pr = system failure
Pr = Nr / N (7)
where:Nr = number of months in which the reservoir did not meet the demand, that is, when the reservoir is empty at the end of the month (Vt-1 = 0), and Vt is given by Equation 8.N = number of months considered in the calculation, being indicated in NBR 15527/2007 (ABNT, 2007)
Teixeira, C. A. et al.644 Gest. Prod., São Carlos, v. 23, n. 3, p. 638-648, 2016
as generally 12 months therefore is the value adopted in this article (N = 12)
Vt = Vt-1 + QtI – Dt (8)
where:Vt = volume of rainwater that is in the reservoir at the end of the monthVt-1 = volume of rainwater that is in the reservoir at the beginning of the monthQtI = volume of rainwater usable in the month (m3) as Equation 9, which was included a division by 1000 to adjust the volume unit
Dt = monthly demand for rainwater (m3), and in this study the volume of demand is constant, so the presentation of the results will adopt the nomenclature D
For the first month, it is considered the reservoir to be empty (i.e. Vt-1 = 0). Also, when (Vt-1 + QtI – D) < 0, then Vt = 0.
QtI = A x CAP x (Pt – I) / 1000 (9)
where:QtI = rainwater volume of usable rain in the month, considering interception (m3)A = abstraction area (m2)
Table 6. Summary of reservoirs sizing.
NBR 15527 Methods Reservoir Volume(m3) Liters
Rippl MethodUsing as a basis the average from 1982 to 2007 0 0Using as a basis the average year 293.8 293800Using as a basis the best year 665.6 665600Using as a basis the worst rainy year 1559 1559000Simulation Method 966.72 966720
EfficiencyFull Empty
Using as a basis the average from 1982 to 2007 0.36 0.33Using as a basis the average year 0.36 0.33Using as a basis the best year 0.27 0.25Using as a basis the worst rainy year 0.72 -1.33Australian practical Method 966.72 966720
EfficiencyUsing as a basis the average from 1982 to 2007 0.36Using as a basis the average year 0.36Using as a basis the best year 0.27Using as a basis the worst rainy year -0.57
Azevedo Neto Method (m3) LitersUsing as a basis the average from 1982 to 2007 1557.39 1557388.3Using as a basis the average year 1561.88 1561875Using as a basis the best year 2069.13 2069130Using as a basis the worst rainy year 770.6 770595
German practical Method (m3) LitersUsing as a basis the average from 1982 to 2007 580.18 580176Using as a basis the average year 580.18 580176Using as a basis the best year 580.18 580176Using as a basis the worst rainy year 580.18 580176
English practical Method (m3) LitersUsing as a basis the average from 1982 to 2007 1854.03 1854033.7Using as a basis the average year 1859.38 1859375Using as a basis the best year 2463.25 2463250Using as a basis the worst rainy year 917.38 917375
NBR-15527 (m3) LitersUsing as a basis the average from 1982 to 2007 1977.64 1977635.9Using as a basis the average year 1983.33 1983333.3Using as a basis the best year 2627.47 2627466.7Using as a basis the worst rainy year 978.53 978533.33
Technical and economic viability analysis… 645
CAP = utilization coefficient of runoff (in this article was adopted 0.8)Pt = rainfall monthly average (mm)I = interception of the water that wets surfaces and evaporation losses, adopting 2 mm, as shown in NBR 15527/2007 (ABNT, 2007).
According to Campos et al. (2007) and Bezerra et al. (2010) the Rippl method is the most used, however, as it was initially developed for flow regularization, usually results in large reservoirs. In this case, other methods also resulted in large volumes for the rainwater storage reservoir.
Despite the NBR 15527/2007 (ABNT, 2007) recommends 6 methods for the sizing of rainwater utilization reservoir, this standard also makes mention of the fact that the designer can take another value for the size of the reservoir, as long as adopts technical and economic criteria.
Therefore, since the monthly demand of this industry is 805.80 m³ and it was decided to adopt the reservoir volume as the monthly demand increased by 20%, which resulted in the amount of 966.72 m³. Considering constructive practical criteria, it was admitted the volume of 1,000.00 m³ for the rainwater storage reservoir.
The installation of a rainwater reservoir is interesting from an economic and ecological aspect, but it is not recommended to use it as the sole source of water for the purposes covered in this study.
The authors recommend another source of water in order to guarantee supply to the industry’s needs at all times. This source can be the water supplied by the water company, or even coming from the reuse of water in the industry itself.
5 Reservoir costAccording to the results presented in the previous
section, reached to the conclusion that the appropriate volume for the industry in question reservoir is 966.72 m³. Evaluations were made for the reservoir
construction costs with the given volume, according to two alternatives, which would be: a) reservoir in reinforced concrete and b) semi-buried reservoir, coated with geomembrane.
The evaluations are presented below, and the amounts used referring to average market values for the period comprises between the years 2012 and 2013. Unit values are based in consultation with suppliers and construction companies in Brazil.
a) Concrete reservoir
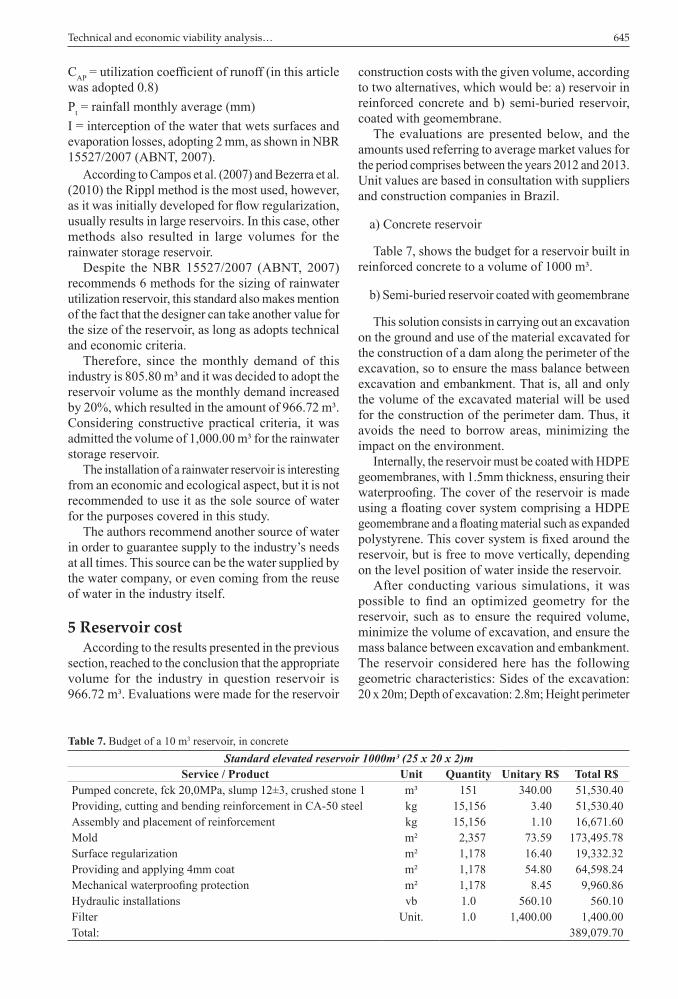
Table 7, shows the budget for a reservoir built in reinforced concrete to a volume of 1000 m³.
b) Semi-buried reservoir coated with geomembrane
This solution consists in carrying out an excavation on the ground and use of the material excavated for the construction of a dam along the perimeter of the excavation, so to ensure the mass balance between excavation and embankment. That is, all and only the volume of the excavated material will be used for the construction of the perimeter dam. Thus, it avoids the need to borrow areas, minimizing the impact on the environment.
Internally, the reservoir must be coated with HDPE geomembranes, with 1.5mm thickness, ensuring their waterproofing. The cover of the reservoir is made using a floating cover system comprising a HDPE geomembrane and a floating material such as expanded polystyrene. This cover system is fixed around the reservoir, but is free to move vertically, depending on the level position of water inside the reservoir.
After conducting various simulations, it was possible to find an optimized geometry for the reservoir, such as to ensure the required volume, minimize the volume of excavation, and ensure the mass balance between excavation and embankment. The reservoir considered here has the following geometric characteristics: Sides of the excavation: 20 x 20m; Depth of excavation: 2.8m; Height perimeter
Table 7. Budget of a 10 m3 reservoir, in concreteStandard elevated reservoir 1000m³ (25 x 20 x 2)m
Service / Product Unit Quantity Unitary R$ Total R$Pumped concrete, fck 20,0MPa, slump 12±3, crushed stone 1 m³ 151 340.00 51,530.40Providing, cutting and bending reinforcement in CA-50 steel kg 15,156 3.40 51,530.40Assembly and placement of reinforcement kg 15,156 1.10 16,671.60Mold m² 2,357 73.59 173,495.78Surface regularization m² 1,178 16.40 19,332.32Providing and applying 4mm coat m² 1,178 54.80 64,598.24Mechanical waterproofing protection m² 1,178 8.45 9,960.86Hydraulic installations vb 1.0 560.10 560.10Filter Unit. 1.0 1,400.00 1,400.00Total: 389,079.70
Teixeira, C. A. et al.646 Gest. Prod., São Carlos, v. 23, n. 3, p. 638-648, 2016
embankment: 1.15m; Free edge: 0.5m; Inclination of cutting slopes and embankment: 1V: 1.5H and Width of the embankment crest: 3.0m.
For this geometry, there was obtained: excavation volume equal to 715.5m³; embankment volume equal to 504.8m³, considering a soil swelling of 40% and free volume for storage equal to 1001.6m³. It was also considered the need for temporary storage of excavated material in a temporary storage 200 meters from the site.
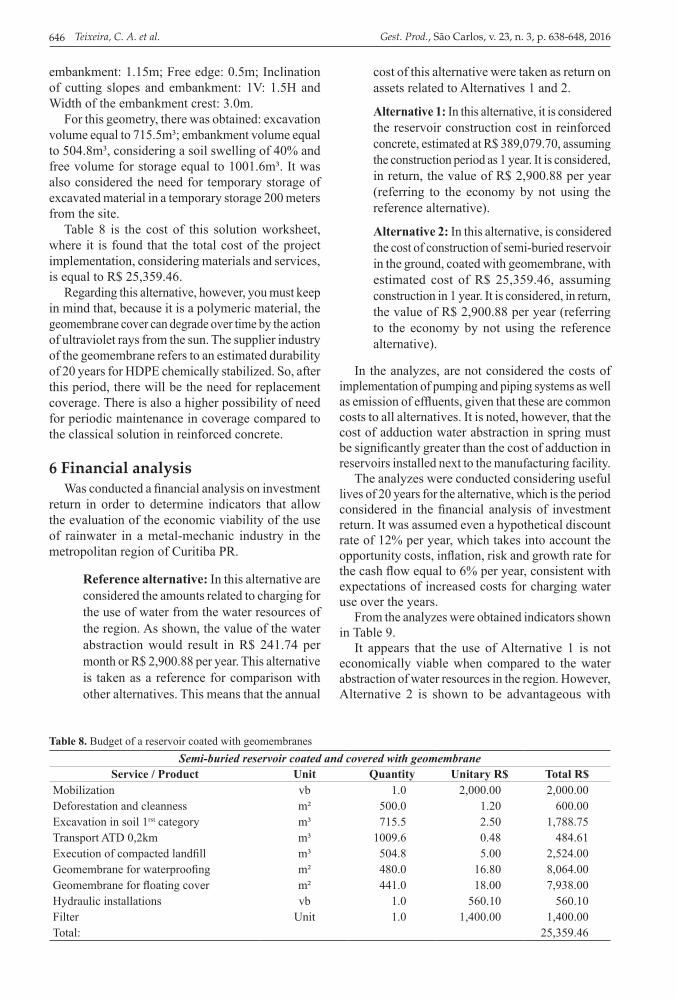
Table 8 is the cost of this solution worksheet, where it is found that the total cost of the project implementation, considering materials and services, is equal to R$ 25,359.46.
Regarding this alternative, however, you must keep in mind that, because it is a polymeric material, the geomembrane cover can degrade over time by the action of ultraviolet rays from the sun. The supplier industry of the geomembrane refers to an estimated durability of 20 years for HDPE chemically stabilized. So, after this period, there will be the need for replacement coverage. There is also a higher possibility of need for periodic maintenance in coverage compared to the classical solution in reinforced concrete.
6 Financial analysisWas conducted a financial analysis on investment
return in order to determine indicators that allow the evaluation of the economic viability of the use of rainwater in a metal-mechanic industry in the metropolitan region of Curitiba PR.
Reference alternative: In this alternative are considered the amounts related to charging for the use of water from the water resources of the region. As shown, the value of the water abstraction would result in R$ 241.74 per month or R$ 2,900.88 per year. This alternative is taken as a reference for comparison with other alternatives. This means that the annual
cost of this alternative were taken as return on assets related to Alternatives 1 and 2.
Alternative 1: In this alternative, it is considered the reservoir construction cost in reinforced concrete, estimated at R$ 389,079.70, assuming the construction period as 1 year. It is considered, in return, the value of R$ 2,900.88 per year (referring to the economy by not using the reference alternative).
Alternative 2: In this alternative, is considered the cost of construction of semi-buried reservoir in the ground, coated with geomembrane, with estimated cost of R$ 25,359.46, assuming construction in 1 year. It is considered, in return, the value of R$ 2,900.88 per year (referring to the economy by not using the reference alternative).
In the analyzes, are not considered the costs of implementation of pumping and piping systems as well as emission of effluents, given that these are common costs to all alternatives. It is noted, however, that the cost of adduction water abstraction in spring must be significantly greater than the cost of adduction in reservoirs installed next to the manufacturing facility.
The analyzes were conducted considering useful lives of 20 years for the alternative, which is the period considered in the financial analysis of investment return. It was assumed even a hypothetical discount rate of 12% per year, which takes into account the opportunity costs, inflation, risk and growth rate for the cash flow equal to 6% per year, consistent with expectations of increased costs for charging water use over the years.
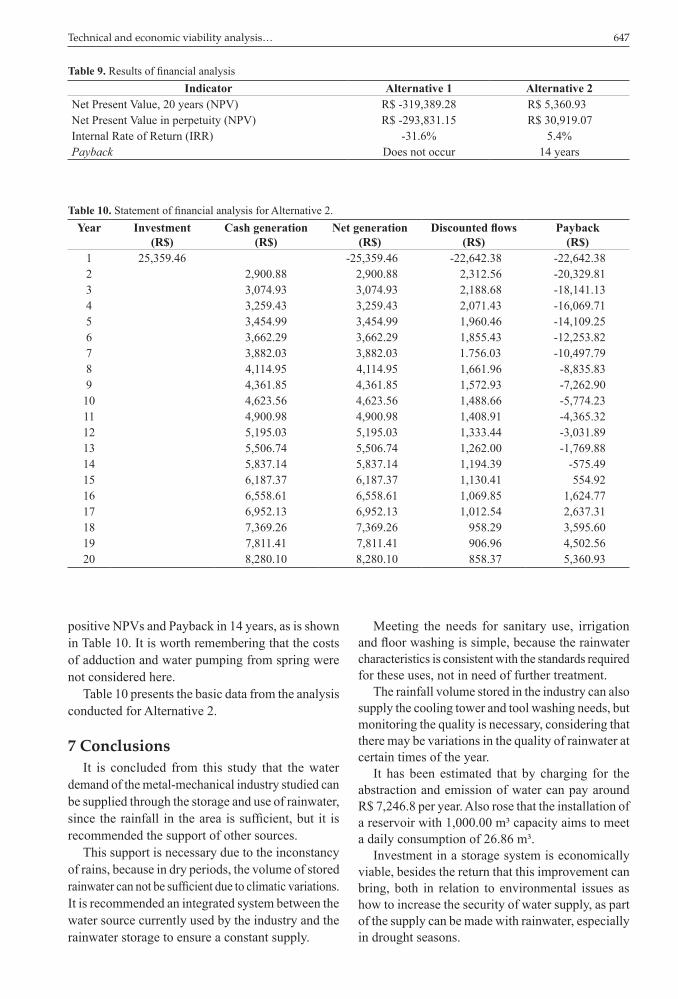
From the analyzes were obtained indicators shown in Table 9.
It appears that the use of Alternative 1 is not economically viable when compared to the water abstraction of water resources in the region. However, Alternative 2 is shown to be advantageous with
Table 8. Budget of a reservoir coated with geomembranesSemi-buried reservoir coated and covered with geomembrane
Service / Product Unit Quantity Unitary R$ Total R$Mobilization vb 1.0 2,000.00 2,000.00Deforestation and cleanness m² 500.0 1.20 600.00Excavation in soil 1rst category m³ 715.5 2.50 1,788.75Transport ATD 0,2km m³ 1009.6 0.48 484.61Execution of compacted landfill m³ 504.8 5.00 2,524.00Geomembrane for waterproofing m² 480.0 16.80 8,064.00Geomembrane for floating cover m² 441.0 18.00 7,938.00Hydraulic installations vb 1.0 560.10 560.10Filter Unit 1.0 1,400.00 1,400.00Total: 25,359.46
Technical and economic viability analysis… 647
positive NPVs and Payback in 14 years, as is shown in Table 10. It is worth remembering that the costs of adduction and water pumping from spring were not considered here.
Table 10 presents the basic data from the analysis conducted for Alternative 2.
7 ConclusionsIt is concluded from this study that the water
demand of the metal-mechanical industry studied can be supplied through the storage and use of rainwater, since the rainfall in the area is sufficient, but it is recommended the support of other sources.
This support is necessary due to the inconstancy of rains, because in dry periods, the volume of stored rainwater can not be sufficient due to climatic variations. It is recommended an integrated system between the water source currently used by the industry and the rainwater storage to ensure a constant supply.
Meeting the needs for sanitary use, irrigation and floor washing is simple, because the rainwater characteristics is consistent with the standards required for these uses, not in need of further treatment.
The rainfall volume stored in the industry can also supply the cooling tower and tool washing needs, but monitoring the quality is necessary, considering that there may be variations in the quality of rainwater at certain times of the year.
It has been estimated that by charging for the abstraction and emission of water can pay around R$ 7,246.8 per year. Also rose that the installation of a reservoir with 1,000.00 m³ capacity aims to meet a daily consumption of 26.86 m³.
Investment in a storage system is economically viable, besides the return that this improvement can bring, both in relation to environmental issues as how to increase the security of water supply, as part of the supply can be made with rainwater, especially in drought seasons.
Table 9. Results of financial analysisIndicator Alternative 1 Alternative 2
Net Present Value, 20 years (NPV) R$ -319,389.28 R$ 5,360.93Net Present Value in perpetuity (NPV) R$ -293,831.15 R$ 30,919.07Internal Rate of Return (IRR) -31.6% 5.4%Payback Does not occur 14 years
Table 10. Statement of financial analysis for Alternative 2.Year Investment
(R$)Cash generation
(R$)Net generation
(R$)Discounted flows
(R$)Payback
(R$)1 25,359.46 -25,359.46 -22,642.38 -22,642.382 2,900.88 2,900.88 2,312.56 -20,329.813 3,074.93 3,074.93 2,188.68 -18,141.134 3,259.43 3,259.43 2,071.43 -16,069.715 3,454.99 3,454.99 1,960.46 -14,109.256 3,662.29 3,662.29 1,855.43 -12,253.827 3,882.03 3,882.03 1.756.03 -10,497.798 4,114.95 4,114.95 1,661.96 -8,835.839 4,361.85 4,361.85 1,572.93 -7,262.9010 4,623.56 4,623.56 1,488.66 -5,774.2311 4,900.98 4,900.98 1,408.91 -4,365.3212 5,195.03 5,195.03 1,333.44 -3,031.8913 5,506.74 5,506.74 1,262.00 -1,769.8814 5,837.14 5,837.14 1,194.39 -575.4915 6,187.37 6,187.37 1,130.41 554.9216 6,558.61 6,558.61 1,069.85 1,624.7717 6,952.13 6,952.13 1,012.54 2,637.3118 7,369.26 7,369.26 958.29 3,595.6019 7,811.41 7,811.41 906.96 4,502.5620 8,280.10 8,280.10 858.37 5,360.93
Teixeira, C. A. et al.648 Gest. Prod., São Carlos, v. 23, n. 3, p. 638-648, 2016
associated with roof rainwater harvesting systems for potable supply: review and perspectives. Sustainability of Water Quality and Ecology, 6, 107-118. http://dx.doi.org/10.1016/j.swaqe.2015.01.006.
Instituto das Águas do Paraná. (2007). Sistema de Informações Hidrológicas. Recuperado em 8 de agosto de 2007, de http://www.sih-web.aguasparana.pr.gov.br/sih-web/gerarRelatorioDiasChuva.do?action=carregarInterfaceInicial
Machado, F. O., & Cordeiro, J. S. (2004). Aproveitamento das águas pluviais: uma proposta sustentável. In Anais do VII Simpósio de Recursos Hídricos do Nordeste. São Luís: ABRH.
Mendez, C. B., Klenzendorf, J. B., Afshar, B. R., Simmons, M. T., Barrett, M. E., Kinney, K. A., & Kirisits, M. J. (2011). The effect of roofing material on the quality of harvested rainwater. Water Research, 45(5), 2049-2059. http://dx.doi.org/10.1016/j.watres.2010.12.015. PMid:21232781.
Oenning, A. O. Jr, & Pawlowsky, U. (2007). Avaliação de tecnologias avançadas para o reúso de água em indústria metal-mecânica. Engenharia Sanitaria e Ambiental, 12(3), 305-316. http://dx.doi.org/10.1590/S1413-41522007000300010.
Paraná. (2002, 26 de fevereiro). Decreto Estadual nº. 5.361 de 26 de fevereiro de 2002. Regulamenta a cobrança pelo direito de so de recursos hídricos. Curitiba, PR: Diário Oficial do Estado.
Paraná. Câmara Técnica de Cobrança pelo Uso de Recursos Hídricos – CTCOB. (2007, agosto). Comitê das bacias do Alto Iguaçu e afluentes do Alto Ribeira – Sudersha. Curitiba: CTCOB.
Scroccaro, J. L., & Machado, E. S. (2007). Aspectos específicos e andamento no estado do paraná ks e kc unitário: Diretoria Operacional de Águas. Curitiba: SUDERHSA.
Tomaz, P. (2005). Aproveitamento de água de chuva: aproveitamento de água de chuva para áreas urbanas e fins não potáveis (2 ed., 180 p). São Paulo: Editora Navegar.
Van Metre, P. C., & Mahler, B. J. (2003). The contribution of particles washed from rooftops to contaminant loading to urban streams. Chemosphere, 52(10), 1727-1741. http://dx.doi.org/10.1016/S0045-6535(03)00454-5. PMid:12871740.
ReferencesAssociação Brasileira de Normas Técnicas – ABNT. (1998).
NBR 5626: Instalações Prediais de Água Fria. Rio de Janeiro: ABNT.
Associação Brasileira de Normas Técnicas – ABNT. (2007). NBR 15527: Água de Chuva – Aproveitamento em áreas urbanas para fins não-potáveis – Requisitos. Rio de Janeiro: ABNT.
Bezerra, S. M. C., Christan, P., Teixeira, C. A., & Farahbakhsh, K. (2010). Dimensionamento de reservatório para aproveitamento de água de chuva: comparação entre métodos da ABNT NBR 15527:2007 e Decreto Municipal 293/2006 de Curitiba, PR. Ambiente Construído, 10(4), 219-231. http://dx.doi.org/10.1590/S1678-86212010000400015.
Brasil. (1997, 9 de janeiro). Lei nº. 9.433, de 08 de janeiro de 1997. Institui a Política Nacional de Recursos Hídricos, cria o Sistema Nacional de Gerenciamento de Recursos Hídricos, regulamenta o inciso XIX do art. 21 da Constituição Federal, e altera o art. 1º da Lei nº 8.001, de 13 de março de 1990, que modificou a Lei nº 7.990, de 28 de dezembro de 1989. Brasília, DF: Diário Oficial da República Federativa do Brasil.
Brasil. (2000, 17 de julho). Lei nº. 9.984, de 17 de julho de 2000. Dispõe sobre a criação da Agência Nacional de Águas - ANA, entidade federal de implementação da Política Nacional de Recursos Hídricos e de coordenação do Sistema Nacional de Gerenciamento de Recursos Hídricos, e dá outras providências. Brasília, DF: Diário Oficial da República Federativa do Brasil.
Brasil. Conselho Nacional do Meio Ambiente – CONAMA. (2005). Resolução n° 357/05. Estabelece a classificação das águas doces, salobras e salinas do Território Nacional. Brasília: SEMA.
Campos, A. L., Primo, L. P., Correia, N. M., & Corrêa, S. M. (2007). Estudo para o aproveitamento da água da chuva em uma montadora de veículos. In Anais do XXIV Congresso Brasileiro de Engenharia Sanitária e Ambiental. Belo Horizonte: ABES.
Gikas, G. D, & Tsihrintzis, V. A. (2012). Assessment of water quality of first-flush roof runoff and harvested Rainwater. Journal of Hydrology, 466-467, 115-126. http://dx.doi.org/10.1016/j.jhydrol.2012.08.020.
Gwenzi, W., Dunjana, N., Pisa, C., Tauro, T., & Nyamadzawo, G. (2015). Water quality and public health risks


![INSTRUCTIONS FOR INSTALLATION AND MAINTENANCE ......Fountain water River or lake water Max. particle dimension [mm] Ø 1 Suitable o Not suitable 3. TECHNICAL DATA AND LIMITATIONS OF](https://img.pdfslide.tips/doc/110x75/6075c3f1b2c7190e2b34524d/instructions-for-installation-and-maintenance-fountain-water-river-or-lake.jpg)