Embed Size (px)
Citation preview
Technology Innovation for Energy Intensive Industry in the United Kingdom July 2011
Project Manager: Matthew Savage – Oxford Consulting Partners Project Advisor: Peter Wooders – Senior Economist, IISD, Geneva Authors: Harry Vallack – Stockholm Environment Institute, Environment Department, University of York. Andrew Timmis – University of Sheffield. Katherine Robinson – Program Manager, Centre for Low Carbon Futures. Misato Sato – Grantham Research Institute on Climate Change and the Environment, the London School of Economics and Political Science (LSE). Pieter Kroon and Arjan Plomp, translation by Marlies Kamp – Energy Research Centre of the Netherlands (ECN).
Acknowledgement The authors wish to thank the representatives of the following organisations for their participation in study: BOC, British Ceramic Confederation, British Glass, GrowHow, Ibstock Brick Ltd, Iggesund Paperboard, INEOS, Lucite, Mineral Products Association, Sheffield Forgemasters, Rio Tinto Alcan, Tata Steel, UK Steel. Publication date: July 2011 Report no. 601 Publisher: The Centre for Low Carbon Futures 2011 For citation and reprints, please contact the Centre for Low Carbon Futures.
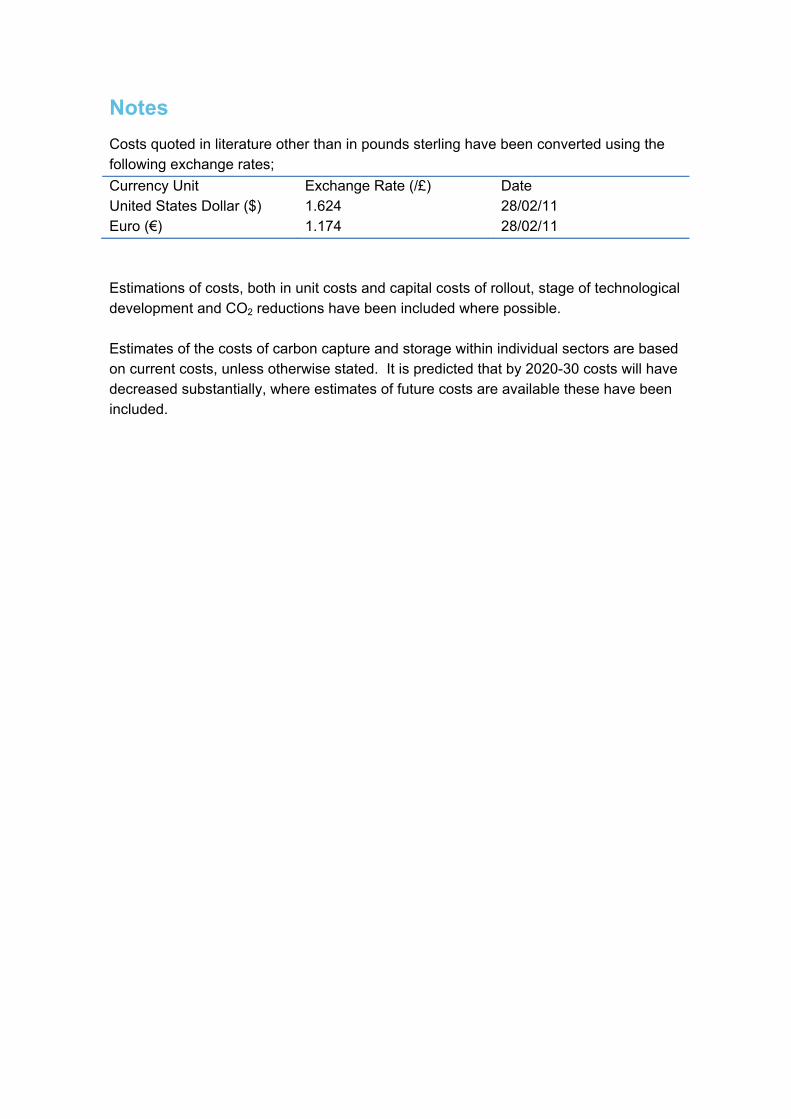
Notes Costs quoted in literature other than in pounds sterling have been converted using the following exchange rates; Currency Unit Exchange Rate (/£) Date United States Dollar ($) 1.624 28/02/11 Euro (€) 1.174 28/02/11 Estimations of costs, both in unit costs and capital costs of rollout, stage of technological development and CO2 reductions have been included where possible. Estimates of the costs of carbon capture and storage within individual sectors are based on current costs, unless otherwise stated. It is predicted that by 2020-30 costs will have decreased substantially, where estimates of future costs are available these have been included.
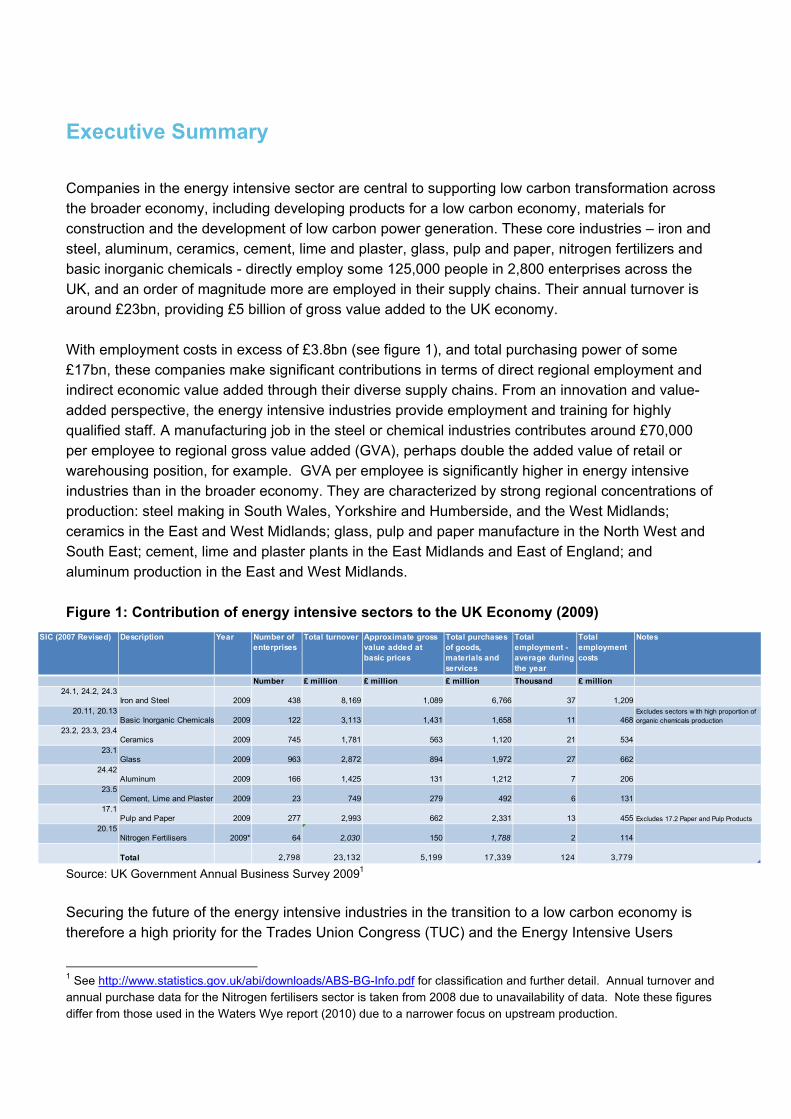
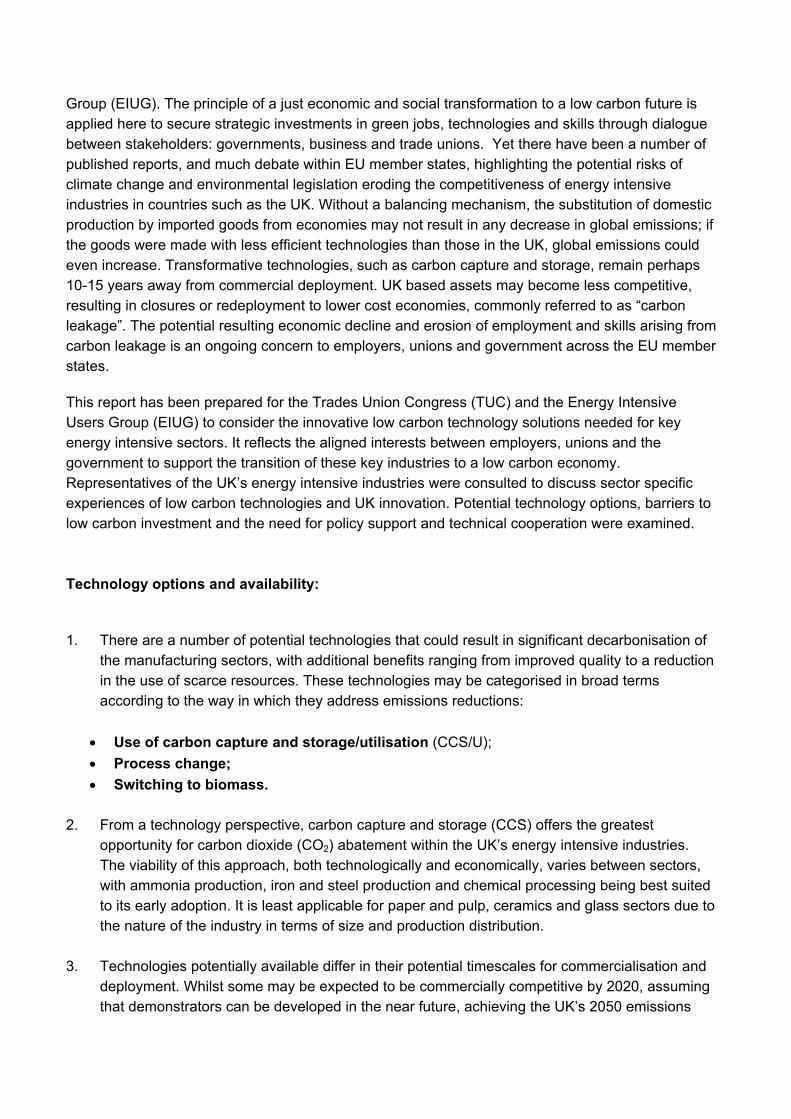
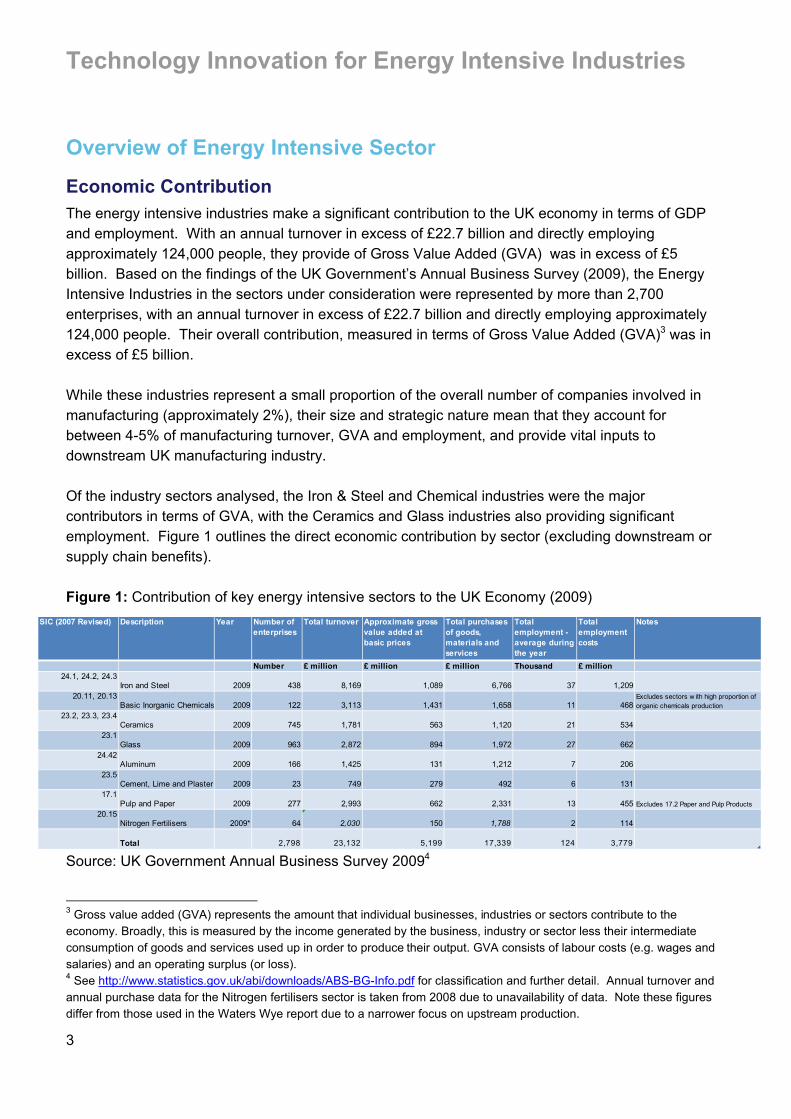
Executive Summary Companies in the energy intensive sector are central to supporting low carbon transformation across the broader economy, including developing products for a low carbon economy, materials for construction and the development of low carbon power generation. These core industries – iron and steel, aluminum, ceramics, cement, lime and plaster, glass, pulp and paper, nitrogen fertilizers and basic inorganic chemicals - directly employ some 125,000 people in 2,800 enterprises across the UK, and an order of magnitude more are employed in their supply chains. Their annual turnover is around £23bn, providing £5 billion of gross value added to the UK economy. With employment costs in excess of £3.8bn (see figure 1), and total purchasing power of some £17bn, these companies make significant contributions in terms of direct regional employment and indirect economic value added through their diverse supply chains. From an innovation and value-added perspective, the energy intensive industries provide employment and training for highly qualified staff. A manufacturing job in the steel or chemical industries contributes around £70,000 per employee to regional gross value added (GVA), perhaps double the added value of retail or warehousing position, for example. GVA per employee is significantly higher in energy intensive industries than in the broader economy. They are characterized by strong regional concentrations of production: steel making in South Wales, Yorkshire and Humberside, and the West Midlands; ceramics in the East and West Midlands; glass, pulp and paper manufacture in the North West and South East; cement, lime and plaster plants in the East Midlands and East of England; and aluminum production in the East and West Midlands. Figure 1: Contribution of energy intensive sectors to the UK Economy (2009)
SIC (2007 Revised) Description Year Number of enterprises
Total turnover Approximate gross value added at basic prices
Total purchases of goods, materials and services
Total employment - average during the year
Total employment costs
Notes
Number £ million £ million £ million Thousand £ million24.1, 24.2, 24.3
Iron and Steel 2009 438 8,169 1,089 6,766 37 1,20920.11, 20.13
Basic Inorganic Chemicals 2009 122 3,113 1,431 1,658 11 468Excludes sectors w ith high proportion of organic chemicals production
23.2, 23.3, 23.4Ceramics 2009 745 1,781 563 1,120 21 534
23.1Glass 2009 963 2,872 894 1,972 27 662
24.42Aluminum 2009 166 1,425 131 1,212 7 206
23.5Cement, Lime and Plaster 2009 23 749 279 492 6 131
17.1Pulp and Paper 2009 277 2,993 662 2,331 13 455 Excludes 17.2 Paper and Pulp Products
20.15Nitrogen Fertilisers 2009* 64 2,030 150 1,788 2 114
Total 2,798 23,132 5,199 17,339 124 3,779 Source: UK Government Annual Business Survey 20091 Securing the future of the energy intensive industries in the transition to a low carbon economy is therefore a high priority for the Trades Union Congress (TUC) and the Energy Intensive Users
1 See http://www.statistics.gov.uk/abi/downloads/ABS-BG-Info.pdf for classification and further detail. Annual turnover and annual purchase data for the Nitrogen fertilisers sector is taken from 2008 due to unavailability of data. Note these figures differ from those used in the Waters Wye report (2010) due to a narrower focus on upstream production.
Group (EIUG). The principle of a just economic and social transformation to a low carbon future is applied here to secure strategic investments in green jobs, technologies and skills through dialogue between stakeholders: governments, business and trade unions. Yet there have been a number of published reports, and much debate within EU member states, highlighting the potential risks of climate change and environmental legislation eroding the competitiveness of energy intensive industries in countries such as the UK. Without a balancing mechanism, the substitution of domestic production by imported goods from economies may not result in any decrease in global emissions; if the goods were made with less efficient technologies than those in the UK, global emissions could even increase. Transformative technologies, such as carbon capture and storage, remain perhaps 10-15 years away from commercial deployment. UK based assets may become less competitive, resulting in closures or redeployment to lower cost economies, commonly referred to as “carbon leakage”. The potential resulting economic decline and erosion of employment and skills arising from carbon leakage is an ongoing concern to employers, unions and government across the EU member states.
This report has been prepared for the Trades Union Congress (TUC) and the Energy Intensive Users Group (EIUG) to consider the innovative low carbon technology solutions needed for key energy intensive sectors. It reflects the aligned interests between employers, unions and the government to support the transition of these key industries to a low carbon economy. Representatives of the UK’s energy intensive industries were consulted to discuss sector specific experiences of low carbon technologies and UK innovation. Potential technology options, barriers to low carbon investment and the need for policy support and technical cooperation were examined. Technology options and availability:
1. There are a number of potential technologies that could result in significant decarbonisation of the manufacturing sectors, with additional benefits ranging from improved quality to a reduction in the use of scarce resources. These technologies may be categorised in broad terms according to the way in which they address emissions reductions:
! Use of carbon capture and storage/utilisation (CCS/U); ! Process change; ! Switching to biomass.
2. From a technology perspective, carbon capture and storage (CCS) offers the greatest
opportunity for carbon dioxide (CO2) abatement within the UK’s energy intensive industries. The viability of this approach, both technologically and economically, varies between sectors, with ammonia production, iron and steel production and chemical processing being best suited to its early adoption. It is least applicable for paper and pulp, ceramics and glass sectors due to the nature of the industry in terms of size and production distribution.
3. Technologies potentially available differ in their potential timescales for commercialisation and
deployment. Whilst some may be expected to be commercially competitive by 2020, assuming that demonstrators can be developed in the near future, achieving the UK’s 2050 emissions
targets will require a further set of technologies requiring more fundamental research and development. These might become available in 2030-2050, if proven, but are subject to a much higher degree of uncertainty both from a technology and economic perspective.
Top 8 barriers to low carbon investment: Price of energy: A number of representatives identified the high and rising costs of energy and energy taxes in the UK, as well as rising commodity prices, as a barrier to investment. Parent companies see relatively poor returns on investment in the UK compared with other countries. The representatives consulted referenced the TUC/EIUG report (2010) on the cumulative impacts of climate change policy on the energy intensive industries, with both electricity and gas costs expected to rise by up to 22% by 2020.
Availability of capital: A large proportion of UK companies operating in the energy intensive sector are subsidiaries of global organisations. They compete internally for capital investment. Higher costs make it more difficult to justify internal group investment in the UK. The Green Investment Bank was, however, seen as potential source of capital for energy efficiency projects.
Lack of financial support for R&D: Some respondents commented on the difficulty of accessing government support to promote industry R&D.
Regulatory uncertainty: Long term clarity was seen as vital to underpin high cost, long term technology investment.
Technology limitations: For many industries, much has already been done to improve the efficiency of the processes involved; there are efficiency limitations on current processes.
Cross industry infrastructure: Some respondents noted the need for investment in national level infrastructure, particularly in relation to carbon capture and storage, and electricity decarbonisation and recycling.
Industrial geography: Dispersed geographic location characterises large integrated industries, such as Iron and Steel, with different parts of the process located in a dispersed manner which can lead to large inefficiencies, and prevent heat capture and transfer opportunities. Some industrial regions may benefit from a concentration of production (e.g. Aire valley), for plants located outside identified regional CCS clusters may be prevented from accessing CCS transportation and storage networks due to high pipeline connection costs.
Supply chain geography: National policy and infrastructure need to be improved to generate greater CO2 savings, for example, in glass recycling policy and operations. Recommendations:
A number of recommendations for the energy intensive sectors in the UK, aiming to address these barriers and create the basis for the successful transition to a low carbon economy, are drawn from the reports conclusions.
A thorough assessment of the broader benefits of securing the energy intensive sectors is needed to further recognise the national level economic benefits of these sectors along with their emissions reduction potential.
To achieve these benefits a supportive policy framework is needed but will require ongoing dialogue between government, industry and the trade unions.
A policy focus on low carbon manufacturing, in addition to power sector decarbonisation, is needed for longer term clarity to encourage investment in technology innovation and to protect competitiveness of UK industry.
Government support is needed to create national level infrastructure to support industries, which are geographically dispersed, and cross sectoral cooperation has the potential to reduce costs and maximize efficiencies.
Many of the energy intensive sectors require transformative technologies to significantly reduce emissions and long term regulatory, reform, policy support and finance may be required to bridge the gap between research and development (R&D) and commercialisation of emerging technologies.
Where only marginal efficiency improvements are possible in the short to medium term energy and carbon costs need to be phased to match the emergence of cost effective abatement opportunities to reduce the risk of ‘leakage’ and encourage investment in transformative technologies.
An industrial mandate for the green investment bank (GIB) could potentially provide capital for energy efficiency projects and encourage other investment.
Jon Price, Director, Centre for Low Carbon Futures Philip Pearson, Senior Policy Officer, Trades Union Congress Jeremy Nicholson, Director, Energy Intensive Users Group
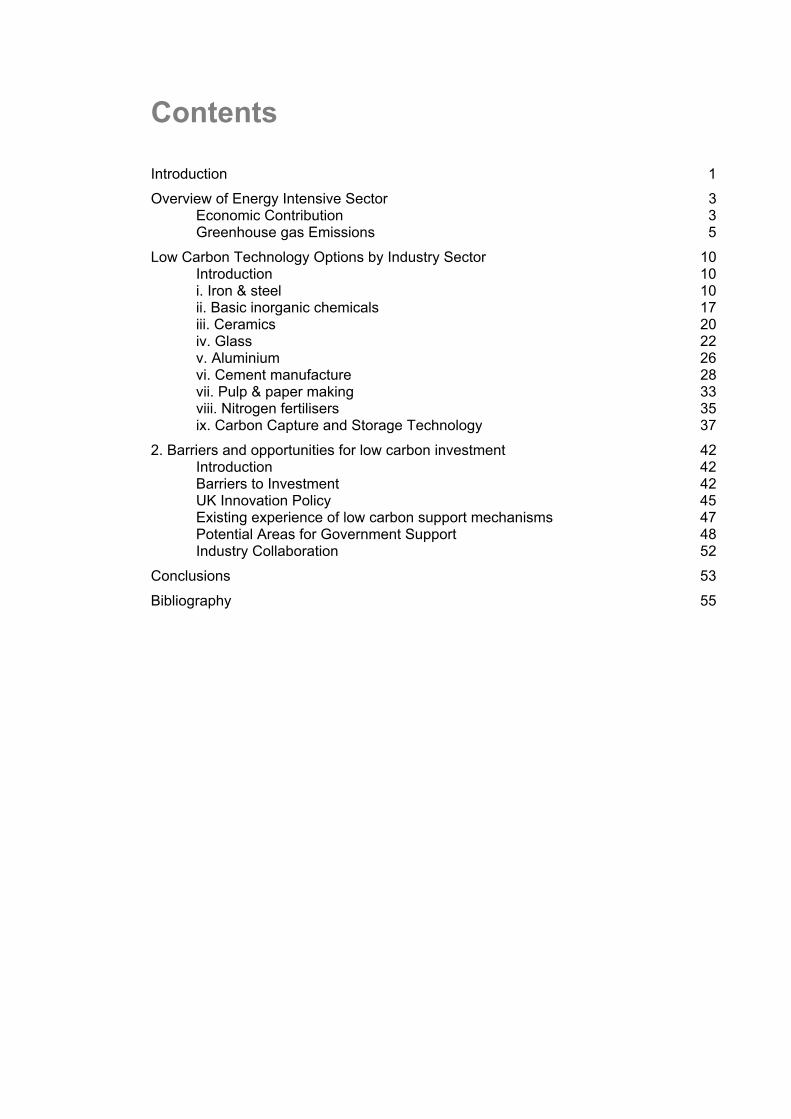
Contents !
Introduction 1!
Overview of Energy Intensive Sector 3!Economic Contribution 3!Greenhouse gas Emissions 5!
Low Carbon Technology Options by Industry Sector 10!Introduction 10!i. Iron & steel 10!ii. Basic inorganic chemicals 17!iii. Ceramics 20!iv. Glass 22!v. Aluminium 26!vi. Cement manufacture 28!vii. Pulp & paper making 33!viii. Nitrogen fertilisers 35!ix. Carbon Capture and Storage Technology 37!
2. Barriers and opportunities for low carbon investment 42!Introduction 42!Barriers to Investment 42!UK Innovation Policy 45!Existing experience of low carbon support mechanisms 47!Potential Areas for Government Support 48!Industry Collaboration 52!
Conclusions 53!
Bibliography 55!
!
Technology Innovation for Energy Intensive Industries
1
Introduction This report has been prepared for the Trades Union Congress (TUC) and the Energy Intensive Users Group (EIUG), based on consultation with representatives of the UK’s energy intensive industries (iron and steel, basic inorganic chemicals, ceramics, glass, aluminium, cement and lime manufacture, pulp and paper, and nitrogen based fertilizers). There is a unique alignment of interests between government, employers and unions in supporting the United Kingdom’s successful transition to a low carbon economy. There is a shared recognition of the role that the energy intensive sector must play, not only in meeting national greenhouse gas reduction targets, but also in supplying the low carbon goods and material inputs to the wider economy. At the same time, this sector provides significant value added in terms of employment, research and exports. Internationally the coalition government is actively supporting the very valuable role that UKPLC can play in a global low carbon transition; building on both UK-based R&D capabilities and industry expertise in emerging new technologies. The need for low carbon solutions is clear to industry, however there is less visibility surrounding the timing and economics of their potential development. A number of reports have already highlighted that the lack of certainty in carbon pricing and environmental regulations are limiting factors impacting on both new investment in clean technologies and the upgrading of existing sites. The case to encourage investment is clear, from both an international perspective and domestically for regional economic prosperity. However, the current economic outlook leaves a lot of uncertainty around the financial mechanisms required to achieve transition. The coalition government has made a commitment to support the growth of a more robust manufacturing sector and to make regulations, such as the CRC (carbon reduction commitment) less complicated. However, the policy challenge of how to support investments in production capacity, while managing the environmental impacts of doing so remains. Issues of competitiveness and “leakage” of industry are critical to mobilizing the investments required and are the most contentious as tighter policies necessitate more expensive technologies investments2. This report reviews the technologies likely to be available to key energy intensive sectors, with the potential to help meet national emissions targets by 2050 by direct emissions reductions. It does not seek to evaluate the additional contribution that these industries may provide to downstream industries through the supply of materials and components for a decarbonised power sector, and low carbon inputs for construction, nor does it review the potential for demand reduction or product substitution. It aims to support the debate on the direction of policy towards the specific issues of energy intensive industry sectors, and reflects the alignment of interests between employers and trade unions to ensure that these industries continue to make a significant contribution towards economic growth.
2 See Droege, S. Tackling Leakage in a Word of Uneven Carbon Prices, Climate Strategies 2009. http://www.climatestrategies.org/research/our-reports/category/32/153.html
Technology Innovation for Energy Intensive Industries
2
The report has been prepared in the context of rising energy prices, in part reflecting the additional costs of electricity network decarbonisation and meeting UK government greenhouse gas (GHG) emission targets. As identified in the recent report - The Cumulative Impact of Climate Change Policies on UK Energy Intensive Industries – Are Policies Effectively Focussed? - by Waters Wye Associates for the TUC and EIUG, current proposals for the introduction of a carbon floor price and other environmental legislation are expected to result in increasing electricity prices over the coming years, with the potential to reduce the competitiveness of the UK’s energy intensive industries against lower cost producer economies. Climate change legislation, as it exists, risks eroding the competitiveness of energy intensive industries in the UK. The dangers lie in the loss of jobs, investment and carbon controls to countries with weaker climate change policies, or none at all. “Carbon leakage” as it is known, is of immediate concern, as many companies already operate according to the best available technology (BAT) standards. Transformative technologies, such as carbon capture and storage (CCS), remain 10-15 years away from commercial application. As a result, there is the potential for UK assets to become unprofitable, resulting in either closure or relocation to lower cost economies, with the associated reduction in GDP, loss of regional employment and erosion of the skills base. The substitution of domestic production by imported goods from economies with lower standards of environmental regulation may also result in a net increase in global emissions. This report explores some of the technology options likely to be available to the energy intensive sector up to 2050. A number of these have been studied in some depth by policy makers and academics, and several industry level research programs are underway, for example within the Iron and Steel and Cement sectors. The report has been compiled on the basis of desk research, interviews with representatives of the leading companies in each sector, and in consultation with the TUC affiliates Unite, Community, GMB, Unity and Prospect. For many of the companies involved, their UK operations represent just a small part of their international manufacturing base. The respondents have discussed their experience of reducing emissions through technology upgrade, identified those emission reduction technologies with the greatest potential, and where possible, identified the costs and associated potential emissions benefits. However, for many of the technologies identified, these costs and environmental benefits remain unclear, reflecting the early stage of their development. The first section examines potential technology options by sector. The second section discusses experience of technology innovation and sets out options for supporting this process. The final section examines how policy support and industrial cooperation may work to support technological innovation, thereby enhancing the role of the energy intensive sector to support low carbon innovation. The report identifies potential barriers to achieving decarbonisation, and outlines the type of institutional support and financing mechanisms that would be required to achieve the development and full scale application of these technologies. There are a number of hurdles to overcome in supporting decarbonisation of the energy intensive sector, principally regarding the identification of emerging low carbon technologies by industry sector, and moreover determining who pays.
Technology Innovation for Energy Intensive Industries
3
Overview of Energy Intensive Sector
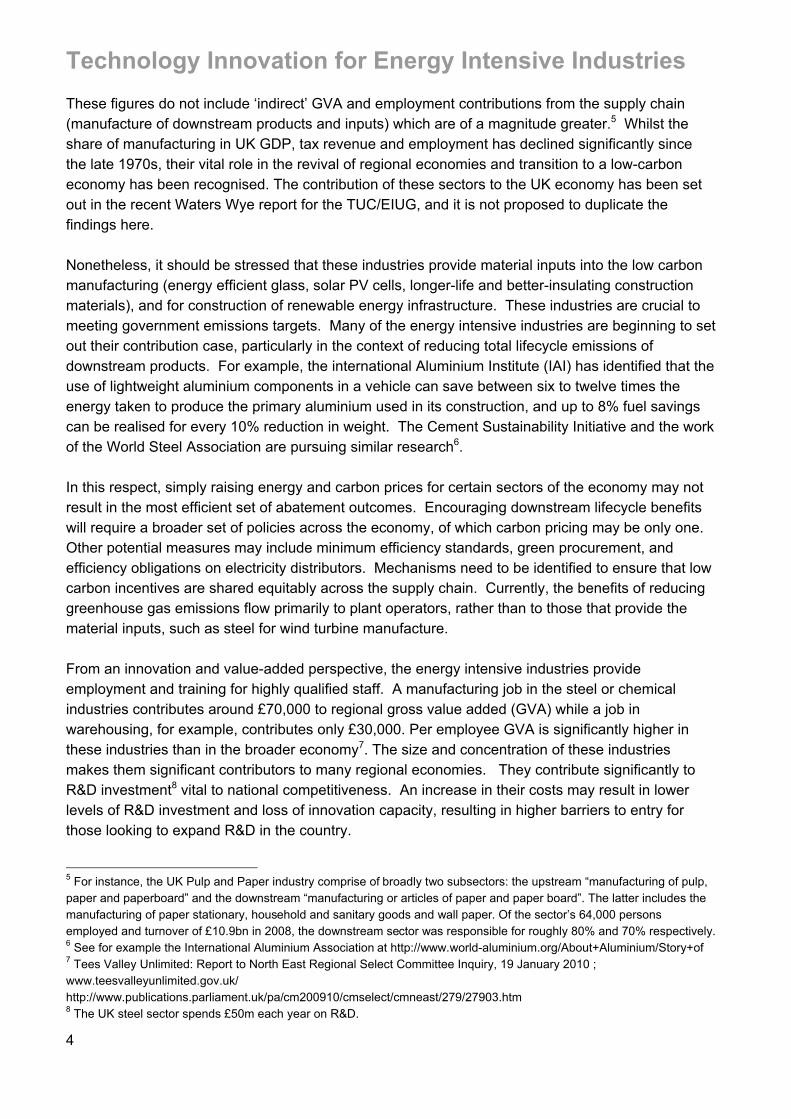
Economic Contribution The energy intensive industries make a significant contribution to the UK economy in terms of GDP and employment. With an annual turnover in excess of £22.7 billion and directly employing approximately 124,000 people, they provide of Gross Value Added (GVA) was in excess of £5 billion. Based on the findings of the UK Government’s Annual Business Survey (2009), the Energy Intensive Industries in the sectors under consideration were represented by more than 2,700 enterprises, with an annual turnover in excess of £22.7 billion and directly employing approximately 124,000 people. Their overall contribution, measured in terms of Gross Value Added (GVA)3 was in excess of £5 billion. While these industries represent a small proportion of the overall number of companies involved in manufacturing (approximately 2%), their size and strategic nature mean that they account for between 4-5% of manufacturing turnover, GVA and employment, and provide vital inputs to downstream UK manufacturing industry. Of the industry sectors analysed, the Iron & Steel and Chemical industries were the major contributors in terms of GVA, with the Ceramics and Glass industries also providing significant employment. Figure 1 outlines the direct economic contribution by sector (excluding downstream or supply chain benefits). Figure 1: Contribution of key energy intensive sectors to the UK Economy (2009)
SIC (2007 Revised) Description Year Number of enterprises
Total turnover Approximate gross value added at basic prices
Total purchases of goods, materials and services
Total employment - average during the year
Total employment costs
Notes
Number £ million £ million £ million Thousand £ million24.1, 24.2, 24.3
Iron and Steel 2009 438 8,169 1,089 6,766 37 1,20920.11, 20.13
Basic Inorganic Chemicals 2009 122 3,113 1,431 1,658 11 468Excludes sectors w ith high proportion of organic chemicals production
23.2, 23.3, 23.4Ceramics 2009 745 1,781 563 1,120 21 534
23.1Glass 2009 963 2,872 894 1,972 27 662
24.42Aluminum 2009 166 1,425 131 1,212 7 206
23.5Cement, Lime and Plaster 2009 23 749 279 492 6 131
17.1Pulp and Paper 2009 277 2,993 662 2,331 13 455 Excludes 17.2 Paper and Pulp Products
20.15Nitrogen Fertilisers 2009* 64 2,030 150 1,788 2 114
Total 2,798 23,132 5,199 17,339 124 3,779 Source: UK Government Annual Business Survey 20094 3 Gross value added (GVA) represents the amount that individual businesses, industries or sectors contribute to the economy. Broadly, this is measured by the income generated by the business, industry or sector less their intermediate consumption of goods and services used up in order to produce their output. GVA consists of labour costs (e.g. wages and salaries) and an operating surplus (or loss). 4 See http://www.statistics.gov.uk/abi/downloads/ABS-BG-Info.pdf for classification and further detail. Annual turnover and annual purchase data for the Nitrogen fertilisers sector is taken from 2008 due to unavailability of data. Note these figures differ from those used in the Waters Wye report due to a narrower focus on upstream production.
Technology Innovation for Energy Intensive Industries
4
These figures do not include ‘indirect’ GVA and employment contributions from the supply chain (manufacture of downstream products and inputs) which are of a magnitude greater.5 Whilst the share of manufacturing in UK GDP, tax revenue and employment has declined significantly since the late 1970s, their vital role in the revival of regional economies and transition to a low-carbon economy has been recognised. The contribution of these sectors to the UK economy has been set out in the recent Waters Wye report for the TUC/EIUG, and it is not proposed to duplicate the findings here. Nonetheless, it should be stressed that these industries provide material inputs into the low carbon manufacturing (energy efficient glass, solar PV cells, longer-life and better-insulating construction materials), and for construction of renewable energy infrastructure. These industries are crucial to meeting government emissions targets. Many of the energy intensive industries are beginning to set out their contribution case, particularly in the context of reducing total lifecycle emissions of downstream products. For example, the international Aluminium Institute (IAI) has identified that the use of lightweight aluminium components in a vehicle can save between six to twelve times the energy taken to produce the primary aluminium used in its construction, and up to 8% fuel savings can be realised for every 10% reduction in weight. The Cement Sustainability Initiative and the work of the World Steel Association are pursuing similar research6. In this respect, simply raising energy and carbon prices for certain sectors of the economy may not result in the most efficient set of abatement outcomes. Encouraging downstream lifecycle benefits will require a broader set of policies across the economy, of which carbon pricing may be only one. Other potential measures may include minimum efficiency standards, green procurement, and efficiency obligations on electricity distributors. Mechanisms need to be identified to ensure that low carbon incentives are shared equitably across the supply chain. Currently, the benefits of reducing greenhouse gas emissions flow primarily to plant operators, rather than to those that provide the material inputs, such as steel for wind turbine manufacture. From an innovation and value-added perspective, the energy intensive industries provide employment and training for highly qualified staff. A manufacturing job in the steel or chemical industries contributes around £70,000 to regional gross value added (GVA) while a job in warehousing, for example, contributes only £30,000. Per employee GVA is significantly higher in these industries than in the broader economy7. The size and concentration of these industries makes them significant contributors to many regional economies. They contribute significantly to R&D investment8 vital to national competitiveness. An increase in their costs may result in lower levels of R&D investment and loss of innovation capacity, resulting in higher barriers to entry for those looking to expand R&D in the country.
5 For instance, the UK Pulp and Paper industry comprise of broadly two subsectors: the upstream “manufacturing of pulp, paper and paperboard” and the downstream “manufacturing or articles of paper and paper board”. The latter includes the manufacturing of paper stationary, household and sanitary goods and wall paper. Of the sector’s 64,000 persons employed and turnover of £10.9bn in 2008, the downstream sector was responsible for roughly 80% and 70% respectively. 6 See for example the International Aluminium Association at http://www.world-aluminium.org/About+Aluminium/Story+of 7 Tees Valley Unlimited: Report to North East Regional Select Committee Inquiry, 19 January 2010 ; www.teesvalleyunlimited.gov.uk/ http://www.publications.parliament.uk/pa/cm200910/cmselect/cmneast/279/27903.htm 8 The UK steel sector spends £50m each year on R&D.
Technology Innovation for Energy Intensive Industries
5
Recent research has also demonstrated the positive international spill-over impacts, from technology innovation in manufacturing and energy industries in developed countries such as the UK, for global industrial emissions mitigation. The UK currently ranks 5th in terms of global share of patent holdings in “clean technologies” which include technologies in industrial production sectors such as cement. Whilst patent data give evidence to parallel technology developments occurring in emerging economies such as South Korea and China, these inventions are less likely to find markets beyond those borders. This suggests that technological developments in the UK and other industrialised countries are also likely to play a key role in achieving decarbonisation of these energy-intensive sectors from a global perspective9.
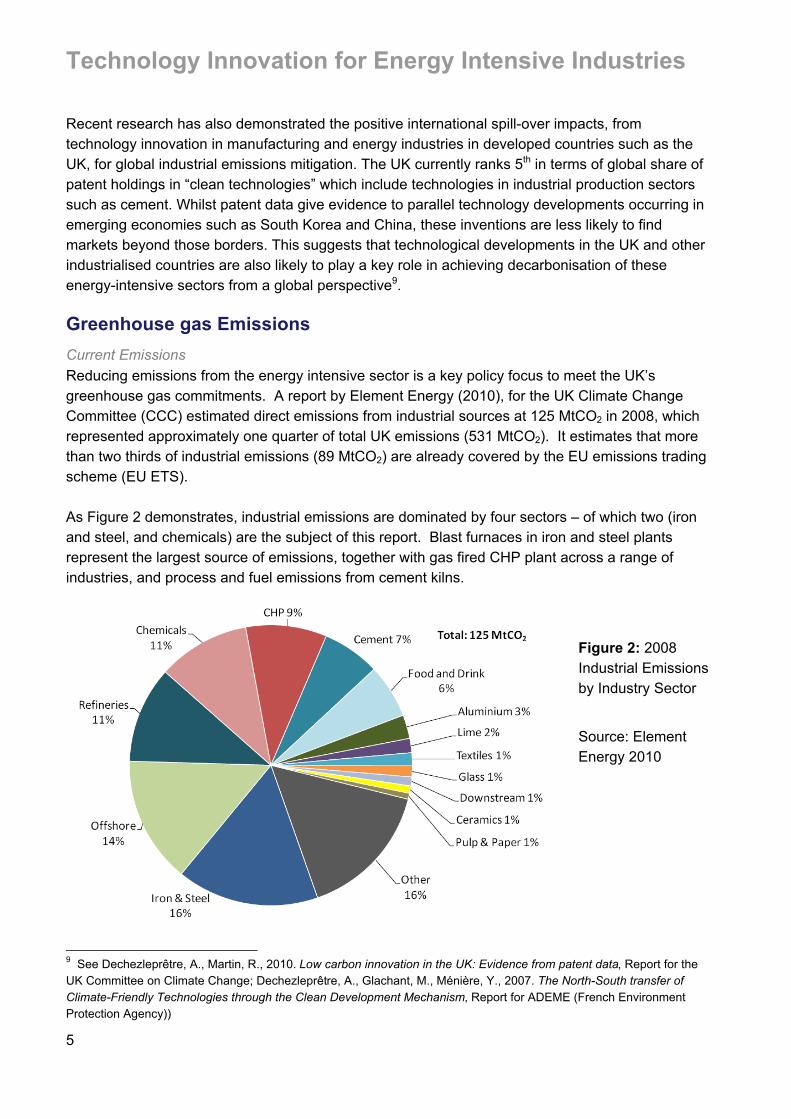
Greenhouse gas Emissions Current Emissions Reducing emissions from the energy intensive sector is a key policy focus to meet the UK’s greenhouse gas commitments. A report by Element Energy (2010), for the UK Climate Change Committee (CCC) estimated direct emissions from industrial sources at 125 MtCO2 in 2008, which represented approximately one quarter of total UK emissions (531 MtCO2). It estimates that more than two thirds of industrial emissions (89 MtCO2) are already covered by the EU emissions trading scheme (EU ETS). As Figure 2 demonstrates, industrial emissions are dominated by four sectors – of which two (iron and steel, and chemicals) are the subject of this report. Blast furnaces in iron and steel plants represent the largest source of emissions, together with gas fired CHP plant across a range of industries, and process and fuel emissions from cement kilns.
9 See Dechezleprêtre, A., Martin, R., 2010. Low carbon innovation in the UK: Evidence from patent data, Report for the UK Committee on Climate Change; Dechezleprêtre, A., Glachant, M., Ménière, Y., 2007. The North-South transfer of Climate-Friendly Technologies through the Clean Development Mechanism, Report for ADEME (French Environment Protection Agency))
Figure 2: 2008 Industrial Emissions by Industry Sector
Source: Element Energy 2010
Technology Innovation for Energy Intensive Industries
6
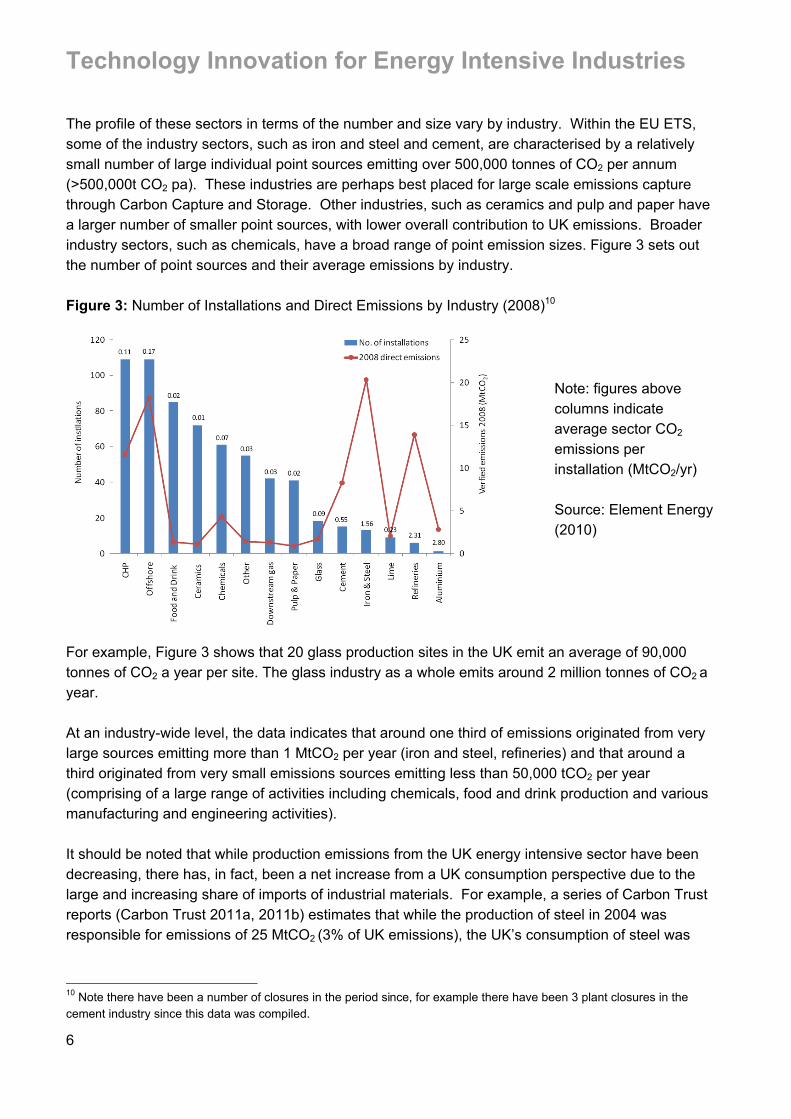
The profile of these sectors in terms of the number and size vary by industry. Within the EU ETS, some of the industry sectors, such as iron and steel and cement, are characterised by a relatively small number of large individual point sources emitting over 500,000 tonnes of CO2 per annum (>500,000t CO2 pa). These industries are perhaps best placed for large scale emissions capture through Carbon Capture and Storage. Other industries, such as ceramics and pulp and paper have a larger number of smaller point sources, with lower overall contribution to UK emissions. Broader industry sectors, such as chemicals, have a broad range of point emission sizes. Figure 3 sets out the number of point sources and their average emissions by industry. Figure 3: Number of Installations and Direct Emissions by Industry (2008)10
For example, Figure 3 shows that 20 glass production sites in the UK emit an average of 90,000 tonnes of CO2 a year per site. The glass industry as a whole emits around 2 million tonnes of CO2 a year. At an industry-wide level, the data indicates that around one third of emissions originated from very large sources emitting more than 1 MtCO2 per year (iron and steel, refineries) and that around a third originated from very small emissions sources emitting less than 50,000 tCO2 per year (comprising of a large range of activities including chemicals, food and drink production and various manufacturing and engineering activities). It should be noted that while production emissions from the UK energy intensive sector have been decreasing, there has, in fact, been a net increase from a UK consumption perspective due to the large and increasing share of imports of industrial materials. For example, a series of Carbon Trust reports (Carbon Trust 2011a, 2011b) estimates that while the production of steel in 2004 was responsible for emissions of 25 MtCO2 (3% of UK emissions), the UK’s consumption of steel was
10 Note there have been a number of closures in the period since, for example there have been 3 plant closures in the cement industry since this data was compiled.
Note: figures above columns indicate average sector CO2 emissions per installation (MtCO2/yr) Source: Element Energy (2010)
Technology Innovation for Energy Intensive Industries
7
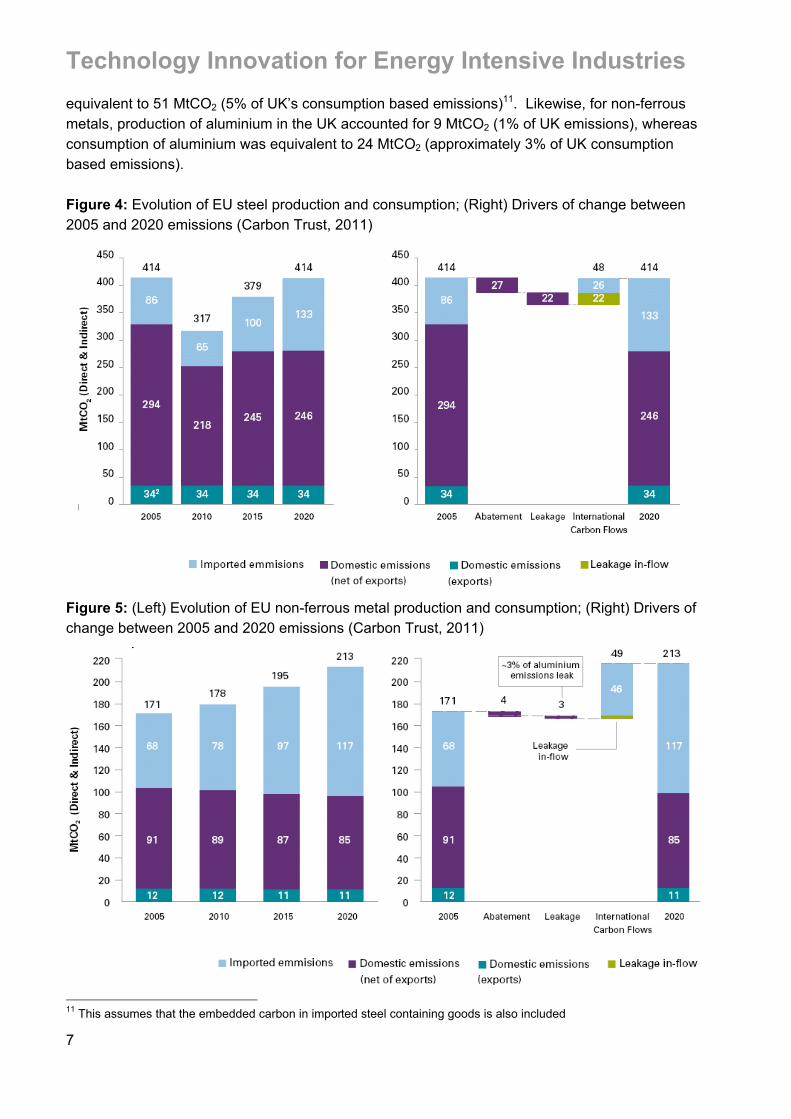
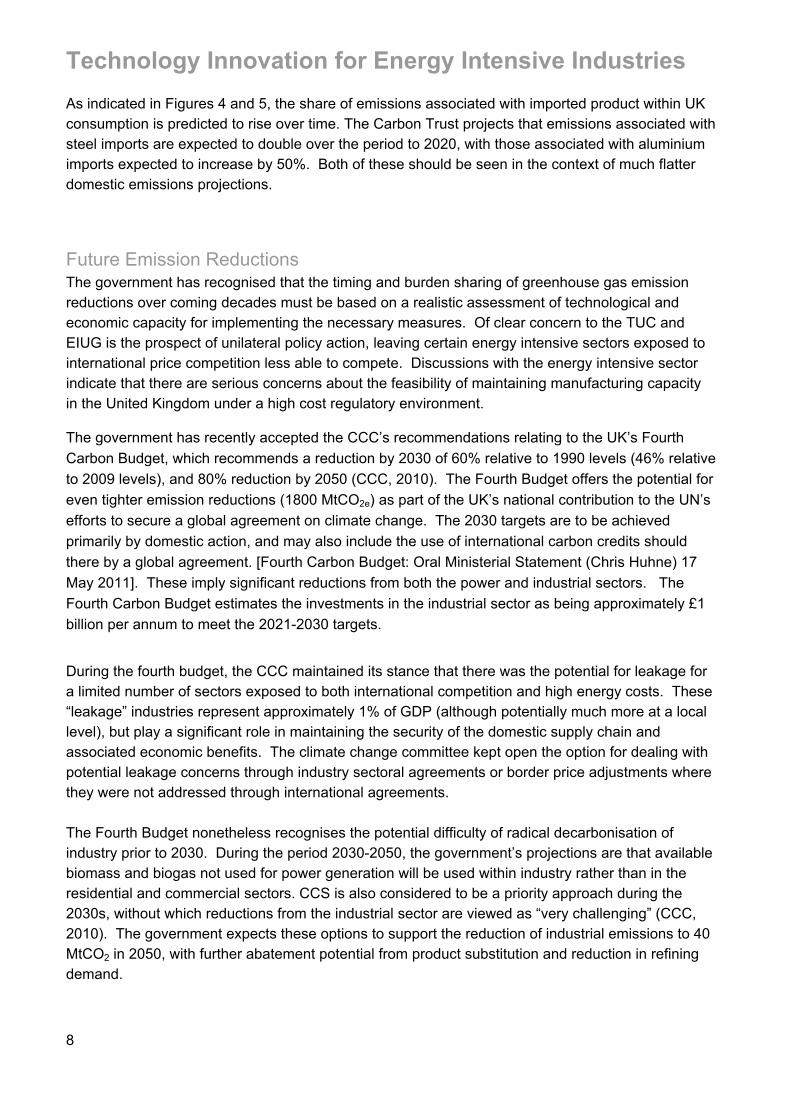
equivalent to 51 MtCO2 (5% of UK’s consumption based emissions)11. Likewise, for non-ferrous metals, production of aluminium in the UK accounted for 9 MtCO2 (1% of UK emissions), whereas consumption of aluminium was equivalent to 24 MtCO2 (approximately 3% of UK consumption based emissions). Figure 4: Evolution of EU steel production and consumption; (Right) Drivers of change between 2005 and 2020 emissions (Carbon Trust, 2011)
Figure 5: (Left) Evolution of EU non-ferrous metal production and consumption; (Right) Drivers of change between 2005 and 2020 emissions (Carbon Trust, 2011)
11 This assumes that the embedded carbon in imported steel containing goods is also included
Technology Innovation for Energy Intensive Industries
8
As indicated in Figures 4 and 5, the share of emissions associated with imported product within UK consumption is predicted to rise over time. The Carbon Trust projects that emissions associated with steel imports are expected to double over the period to 2020, with those associated with aluminium imports expected to increase by 50%. Both of these should be seen in the context of much flatter domestic emissions projections.
Future Emission Reductions The government has recognised that the timing and burden sharing of greenhouse gas emission reductions over coming decades must be based on a realistic assessment of technological and economic capacity for implementing the necessary measures. Of clear concern to the TUC and EIUG is the prospect of unilateral policy action, leaving certain energy intensive sectors exposed to international price competition less able to compete. Discussions with the energy intensive sector indicate that there are serious concerns about the feasibility of maintaining manufacturing capacity in the United Kingdom under a high cost regulatory environment.
The government has recently accepted the CCC’s recommendations relating to the UK’s Fourth Carbon Budget, which recommends a reduction by 2030 of 60% relative to 1990 levels (46% relative to 2009 levels), and 80% reduction by 2050 (CCC, 2010). The Fourth Budget offers the potential for even tighter emission reductions (1800 MtCO2e) as part of the UK’s national contribution to the UN’s efforts to secure a global agreement on climate change. The 2030 targets are to be achieved primarily by domestic action, and may also include the use of international carbon credits should there by a global agreement. [Fourth Carbon Budget: Oral Ministerial Statement (Chris Huhne) 17 May 2011]. These imply significant reductions from both the power and industrial sectors. The Fourth Carbon Budget estimates the investments in the industrial sector as being approximately £1 billion per annum to meet the 2021-2030 targets.
During the fourth budget, the CCC maintained its stance that there was the potential for leakage for a limited number of sectors exposed to both international competition and high energy costs. These “leakage” industries represent approximately 1% of GDP (although potentially much more at a local level), but play a significant role in maintaining the security of the domestic supply chain and associated economic benefits. The climate change committee kept open the option for dealing with potential leakage concerns through industry sectoral agreements or border price adjustments where they were not addressed through international agreements. The Fourth Budget nonetheless recognises the potential difficulty of radical decarbonisation of industry prior to 2030. During the period 2030-2050, the government’s projections are that available biomass and biogas not used for power generation will be used within industry rather than in the residential and commercial sectors. CCS is also considered to be a priority approach during the 2030s, without which reductions from the industrial sector are viewed as “very challenging” (CCC, 2010). The government expects these options to support the reduction of industrial emissions to 40 MtCO2 in 2050, with further abatement potential from product substitution and reduction in refining demand.
Technology Innovation for Energy Intensive Industries
9
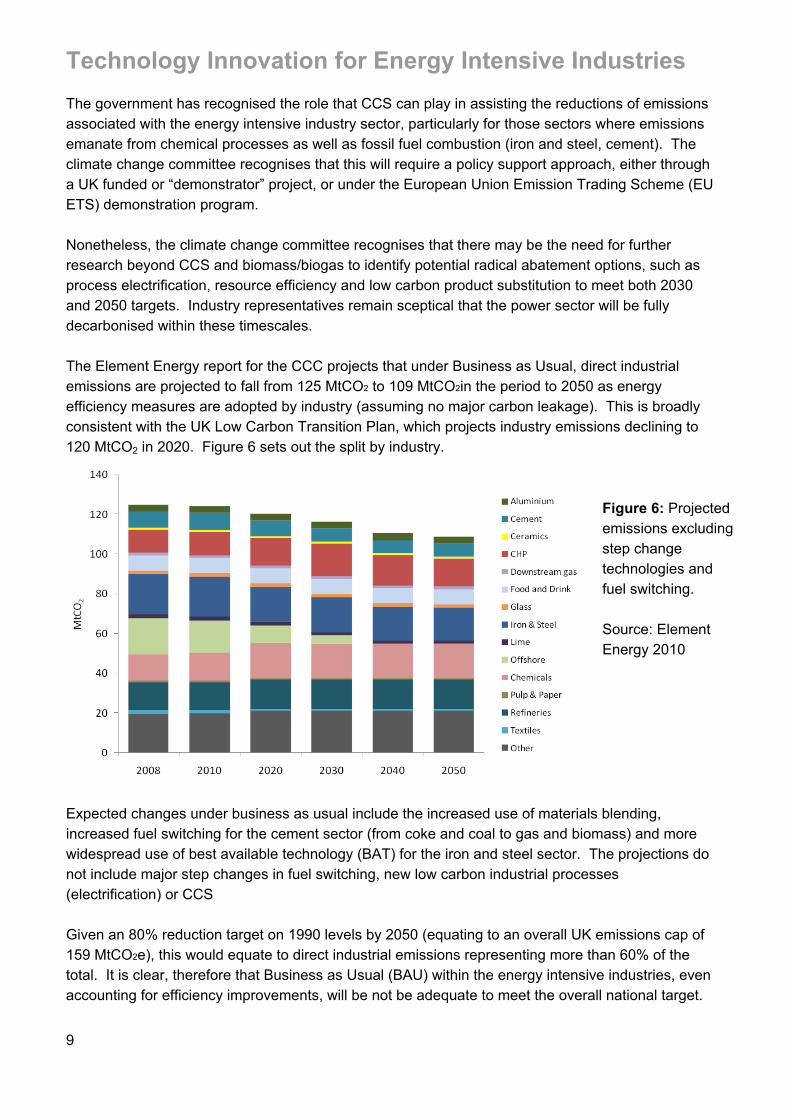
The government has recognised the role that CCS can play in assisting the reductions of emissions associated with the energy intensive industry sector, particularly for those sectors where emissions emanate from chemical processes as well as fossil fuel combustion (iron and steel, cement). The climate change committee recognises that this will require a policy support approach, either through a UK funded or “demonstrator” project, or under the European Union Emission Trading Scheme (EU ETS) demonstration program. Nonetheless, the climate change committee recognises that there may be the need for further research beyond CCS and biomass/biogas to identify potential radical abatement options, such as process electrification, resource efficiency and low carbon product substitution to meet both 2030 and 2050 targets. Industry representatives remain sceptical that the power sector will be fully decarbonised within these timescales. The Element Energy report for the CCC projects that under Business as Usual, direct industrial emissions are projected to fall from 125 MtCO2 to 109 MtCO2in the period to 2050 as energy efficiency measures are adopted by industry (assuming no major carbon leakage). This is broadly consistent with the UK Low Carbon Transition Plan, which projects industry emissions declining to 120 MtCO2 in 2020. Figure 6 sets out the split by industry.
Expected changes under business as usual include the increased use of materials blending, increased fuel switching for the cement sector (from coke and coal to gas and biomass) and more widespread use of best available technology (BAT) for the iron and steel sector. The projections do not include major step changes in fuel switching, new low carbon industrial processes (electrification) or CCS Given an 80% reduction target on 1990 levels by 2050 (equating to an overall UK emissions cap of 159 MtCO2e), this would equate to direct industrial emissions representing more than 60% of the total. It is clear, therefore that Business as Usual (BAU) within the energy intensive industries, even accounting for efficiency improvements, will be not be adequate to meet the overall national target.
Figure 6: Projected emissions excluding step change technologies and fuel switching. Source: Element Energy 2010
Technology Innovation for Energy Intensive Industries
10
Low Carbon Technology Options by Industry Sector
Introduction This section sets out the range of technology options identified in the research process and in consultation with industry representatives. While a total of eight industry sectors are analysed, the potential for technology innovation is not uniform across the energy intensive sector. Some industries have more potential for the application of new processes than others. For example, the steel and cement industries have the potential for breakthrough technologies and significant emission reductions, but that further RD&D is required before potential solutions become commercially feasible. CCS appears to be technologically achievable, but will require significant investment in shared transportation and storage infrastructure, both between industry users and with the energy supply sector. The paper industry also has significant potential for technological innovation. Aluminium has a number of potential transformative technologies at an early stage that have not yet been piloted. (CE Delft 2010). In the existing literature, technology innovation within the glass, ceramic, inorganic chemicals, ammonia/fertiliser and metals using electricity are assessed as having less potential for breakthrough in emissions abatement. This can be due to a lack of clear technology options, lower emissions intensity associated with production, or to the smaller and more dispersed nature of production sites. For example, there is limited publically funded research into ammonia production and metal ores, under either the European Commission’s Directorate-General for Research and Innovation (DG Research) or the US Department of the Environment (DOE) Industrial Technologies Programme (CE Delft 2010). While the range of technologies identified includes those that can be retrofitted to existing installations, the main focus of this report is upon those technologies that can be applied to plant replacement to deliver significant step change improvements in emissions intensity. It should be remembered however, that there is also a number of Best Available Technologies (BATs) delivering energy efficiency with relatively short payback periods. These can be applied by industry in the short run to help offset increased energy prices while other technologies are developed. However many BATs are only applicable when there is an opportunity to perform a complete rebuild. In the glass industry for example this opportunity may occur only every 15 to 20 years when the furnace is rebuilt.
i. Iron & steel The UK Iron and Steel industry is the largest of the energy intensive sectors under consideration, in terms of GVA, employment and GHG emissions. While the UK’s trade balance in steel products was broadly in balance in 2010, the industry exported approximately 6mt of product during the
Technology Innovation for Energy Intensive Industries
11
year12. It is a large investor in research and development. Emissions of the 13 iron and steel plants included in the EU ETS in the United Kingdom amounted to 20.4 Mt CO2 in 2008 (excluding CHP). Nearly all of these emissions were from three integrated plant operated by Tata Steel and SSI at Redcar, Scunthorpe and Port Talbot, using a blast furnace-basic oxygen furnace route (BF-BOF). These sites were the largest emitters of GHG in the United Kingdom excluding the power sector, and have achieved significant energy efficiencies through investment in the past decade. . The carbon intensity of iron and steel production varies considerably between the major process types, ranging from around 0.4 tonnes of CO2 emissions (0.4 tCO2) for every tonne of recycled steel produced for electric arc furnace (EAF) to 2.5 tCO2 per tonne of steel for the coal-fired direct reduced iron (DRI) process. Low carbon alternatives are limited by the availability and cost of natural gas (DRI) and the availability of sponge iron or scrap steel. In the UK, where steel is produced using the most commonly used blast furnace/basic oxygen furnace route, average carbon intensity is currently around 1.7-1.8 tCO2 per tonne of steel. While this is higher than in some countries, such as Brazil (1.25 tCO2) and Korea/Mexico ((1.6 tCO2), it is noticeably lower than in other economies such as India and China (3.1-3.8 tCO2) (IPCC 2007). The marginal costs of steel production may result in UK production becoming less competitive under a high unilateral carbon price scenario. However, given that UK and EU blast furnaces are operating very efficiently within the constraints of their existing technology, there is limited room for efficiency gains without a major step change in technology. For example, Industry representatives report a number of investments to date to improve efficiency and reduce emissions. For Tata Steel plants, these include:
! Basic oxygen steelmaking (BOS) gas recovery (reused for other processes) ! Increased use of coal injection to replace coke use in furnace ! Hot linking where possible (to reduce heat loss) ! Recuperation and regeneration (heat recovery from reheating furnaces) ! Variable speed drives for motors (20-30 % energy savings for motors) ! Studies have been undertaken for upgrading of on-site, blast furnace-gas fuelled power
stations at a cost (without CCS) of several hundred million pounds. Sheffield Forgemasters have also made substantial investments in energy use efficiency at their steel production plant resulting in a 36% reduction in total CO2 emissions since 1990. These include:
! Installing pulse-fired burners (reduced natural gas consumption in re-heat furnaces by 20-30%)
! Better planning – less ‘keep warms’ reduces heat loss ! Process re-engineering (reduce gas use e.g. making hollow ingots which need less
processing and so less energy) - reduced CO2 emissions from gas consumption by at least 25%.
! Phasing out old coal-fired power plants (all electricity is now supplied from the grid), meaning only small incremental increases are now feasible
12 See International Steel Statistics Bureau http://www.issb.co.uk/uk.html
Technology Innovation for Energy Intensive Industries
12
Element Energy estimates that a minimum price of €25/tCO2 would be required to make investments in new technologies cost-effective, and that only energy efficiency and CHP are cost effective based on the payback resulting from reduced energy costs. Consultations with the steel industry representatives indicate that the price may need to be significantly higher (up to €40/tCO2). It has been reported that CCS is the most expensive of the available emission reduction technologies for the Iron and Steel sector both retrofit and new build plant (Element Energy 2010).
Potential Technology Options Improved energy and materials consumption, and fuel and materials substitution, account for most of the abatement potential within the sector. For blast furnaces, a large range of technologies exist, both for new build or retrofit to existing plant. The technologies discussed in this report, likely to be implemented post 2020 are:
! Top-Gas Recycling Blast Furnace (TGR-BF) with CCS ! Gas-based Direct Reduced Iron (DRI) ! Coke-free steel-making (HIsarna) with CCS – based on cyclone converter furnace ! Fastmelt
There are in addition, a number of potential technologies that are under slower development, but which may become commercially available. These are not discussed here in detail. These include direct reduction processes using hydrogen and natural gas (with CCS) for blast furnace processes, the use of biomass as a reducing agent instead of fossil fuels, and the introduction of electrolysis as an alternative to traditional furnaces. If the electricity supply were decarbonised, the last of these would result in carbon neutral iron production without the need for on-site CCS. However, these are not discussed here as there is limited cost information available and the technologies are still at an early stage of development. The major technology options having the potential to significantly reduce GHG emissions from the Iron and Steel industry are described in more detail below: Top-Gas Recycling Blast Furnace (TGR-BF) The TGR-BF is currently in the demonstration phase of the ULCOS programme, a European wide cooperative research programme. The TGR-BF component is headed by Arcelor Mitttal, the technology is in small scale demonstration phase; the LKAB Experimental Blast Furnace in Luleå, Sweden. The furnace uses oxygen injection into the blast-furnace, rather than enriched air. The top gas is primarily CO and CO2, which are separated through a process known as Vacuum Swing Pressure Absorption (VSPA). The CO is injected back into the blast furnace as a reduction agent and the CO2
can be cleaned and compressed for transportation and sequestration. A benefit of TGR-BF is that it removes the majority of NOx production (ULCOS, 2011). It is estimated that the TGR process does not result in a net reduction in energy use, as increased electricity use for CO2 separation offset the reduction in use of coke. GHG reduction is dependent
Technology Innovation for Energy Intensive Industries
13
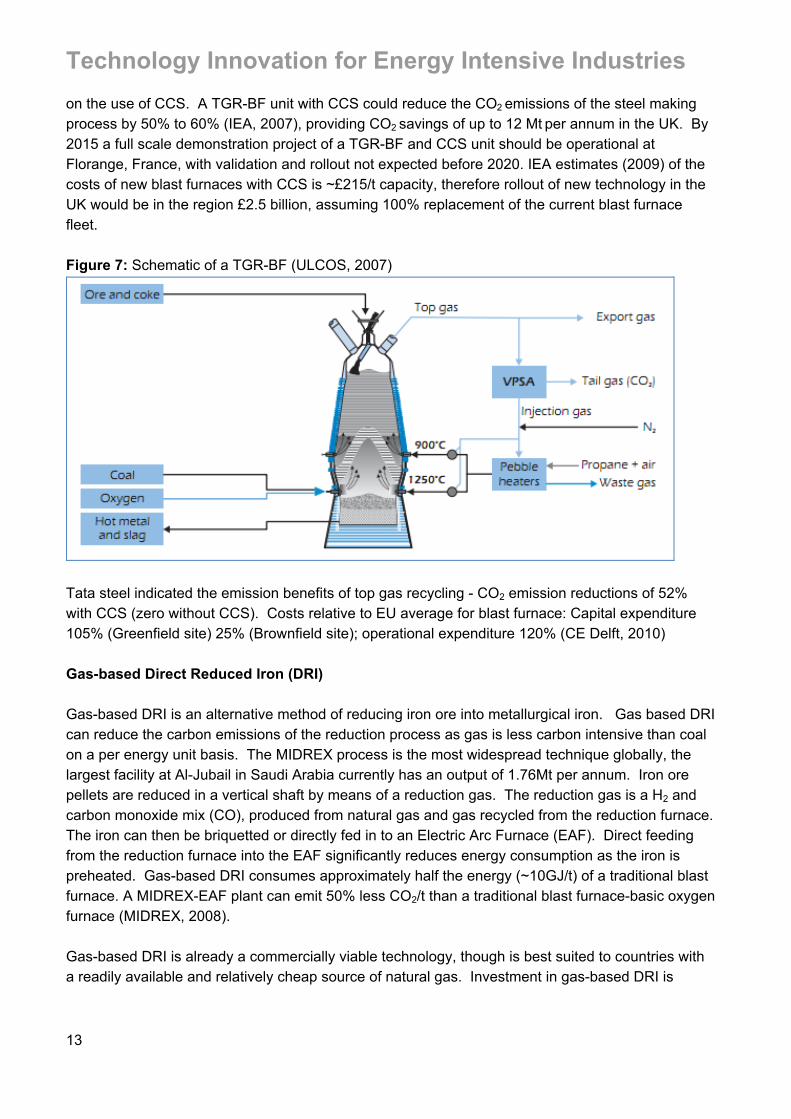
on the use of CCS. A TGR-BF unit with CCS could reduce the CO2 emissions of the steel making process by 50% to 60% (IEA, 2007), providing CO2 savings of up to 12 Mt per annum in the UK. By 2015 a full scale demonstration project of a TGR-BF and CCS unit should be operational at Florange, France, with validation and rollout not expected before 2020. IEA estimates (2009) of the costs of new blast furnaces with CCS is ~£215/t capacity, therefore rollout of new technology in the UK would be in the region £2.5 billion, assuming 100% replacement of the current blast furnace fleet. Figure 7: Schematic of a TGR-BF (ULCOS, 2007)
Tata steel indicated the emission benefits of top gas recycling - CO2 emission reductions of 52% with CCS (zero without CCS). Costs relative to EU average for blast furnace: Capital expenditure 105% (Greenfield site) 25% (Brownfield site); operational expenditure 120% (CE Delft, 2010) Gas-based Direct Reduced Iron (DRI) Gas-based DRI is an alternative method of reducing iron ore into metallurgical iron. Gas based DRI can reduce the carbon emissions of the reduction process as gas is less carbon intensive than coal on a per energy unit basis. The MIDREX process is the most widespread technique globally, the largest facility at Al-Jubail in Saudi Arabia currently has an output of 1.76Mt per annum. Iron ore pellets are reduced in a vertical shaft by means of a reduction gas. The reduction gas is a H2 and carbon monoxide mix (CO), produced from natural gas and gas recycled from the reduction furnace. The iron can then be briquetted or directly fed in to an Electric Arc Furnace (EAF). Direct feeding from the reduction furnace into the EAF significantly reduces energy consumption as the iron is preheated. Gas-based DRI consumes approximately half the energy (~10GJ/t) of a traditional blast furnace. A MIDREX-EAF plant can emit 50% less CO2/t than a traditional blast furnace-basic oxygen furnace (MIDREX, 2008). Gas-based DRI is already a commercially viable technology, though is best suited to countries with a readily available and relatively cheap source of natural gas. Investment in gas-based DRI is
Technology Innovation for Energy Intensive Industries
14
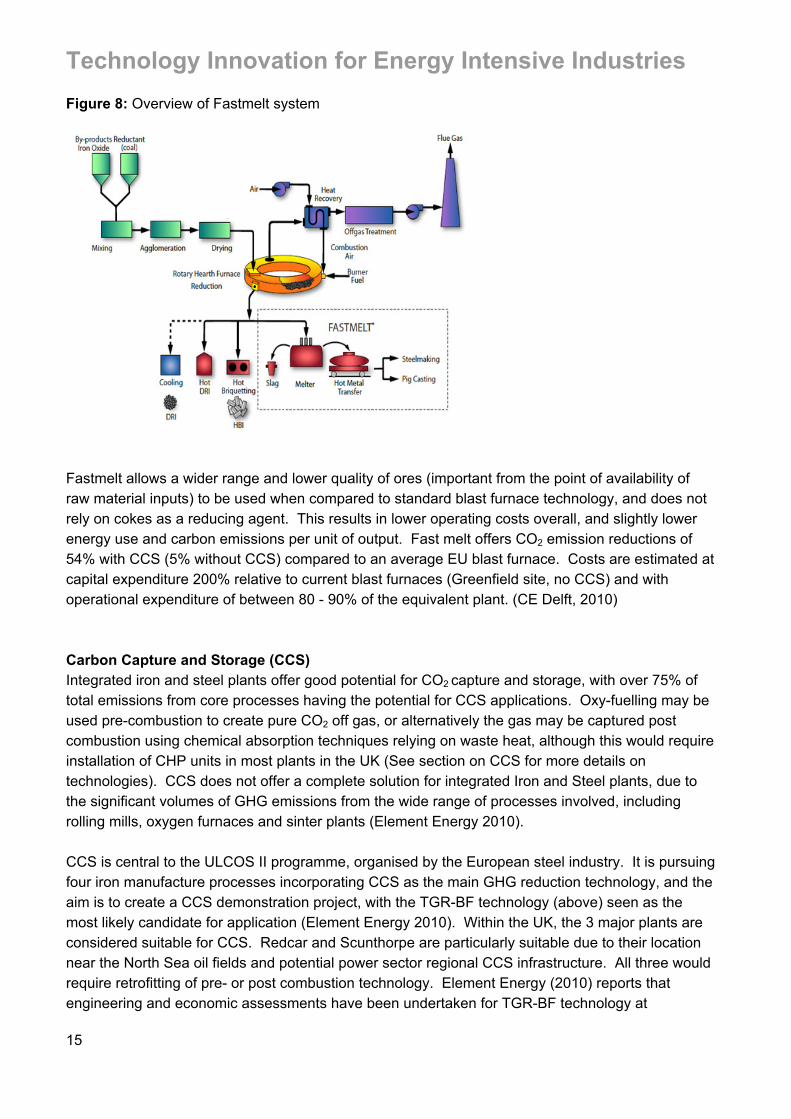
approximately £125/t capacity (IEA, 2009). A total roll out and conversion of the UK primary steel making industry would cost £1.5 billion and possible CO2 abatement of ~10 Mt. Hlsarna technology (Coke free steelmaking) HIsarna uses a bath-smelting technology to produce more energy efficient and less carbon intensive steel. It brings together a number of processes including the preheating of coal, partial pyrolysis in a reactor, an ore melting cyclone, and a vessel for ore reduction and iron production. All of these technologies have been proven at small scale, but Hlsarna brings them together in an integrated way. The emission benefits are achieved through the lower use of coal in the process, and by the fact that it removes the need for a separate process to create pig iron pellets. The process allows for partial replacement of coal by biomass, natural gas or Hydrogen. The first Hlsarna plant is currently under construction in the Netherlands by Tata Steel, and is expected to produce up to 60,000 tonnes of pig iron per annum. The potential for CCS and the use of biomass as a reducing agent continue to be explored as part of the process. Assuming the plants succeed, there are plans to extend capacity up to 700,000 tonnes per annum. Estimates of CO2 emission reductions from laboratory trials are as high as a 20% and of up to 80% with CCS. The costs relative to EU average for blast furnace indicate that both capital and operational expenditure would be lower. Capital costs are estimated at 75% (Greenfield site) and 65% (Brownfield site) with operational expenditure at 90% of current blast furnace costs. (CE Delft, 2010)13 Fast Melt The Fastmelt process is designed to be used primarily for processing steel mill by products. It uses a rotary hearth furnace to convert waste and iron oxide fines to a metallized DRI. Carbon is used as the reductant, either in the wastes or through the addition of coal or coke. The waste, reductant and binder are mixed and consolidated either by pelletising or briquetting. These are then heated by fuel gas and fed into the RHF. The heat is generated either by electricity or coal combustion. A melter is used to produce hot metal. Hot DRI is discharged from the RHF and melted in an electric furnace or coal-based melter. The technology is promoted by Midrex Technologies and Kobe Steel.
13 http://www.ulcos.org/en/research/isarna.php
Technology Innovation for Energy Intensive Industries
15
Figure 8: Overview of Fastmelt system
Fastmelt allows a wider range and lower quality of ores (important from the point of availability of raw material inputs) to be used when compared to standard blast furnace technology, and does not rely on cokes as a reducing agent. This results in lower operating costs overall, and slightly lower energy use and carbon emissions per unit of output. Fast melt offers CO2 emission reductions of 54% with CCS (5% without CCS) compared to an average EU blast furnace. Costs are estimated at capital expenditure 200% relative to current blast furnaces (Greenfield site, no CCS) and with operational expenditure of between 80 - 90% of the equivalent plant. (CE Delft, 2010) Carbon Capture and Storage (CCS) Integrated iron and steel plants offer good potential for CO2 capture and storage, with over 75% of total emissions from core processes having the potential for CCS applications. Oxy-fuelling may be used pre-combustion to create pure CO2 off gas, or alternatively the gas may be captured post combustion using chemical absorption techniques relying on waste heat, although this would require installation of CHP units in most plants in the UK (See section on CCS for more details on technologies). CCS does not offer a complete solution for integrated Iron and Steel plants, due to the significant volumes of GHG emissions from the wide range of processes involved, including rolling mills, oxygen furnaces and sinter plants (Element Energy 2010). CCS is central to the ULCOS II programme, organised by the European steel industry. It is pursuing four iron manufacture processes incorporating CCS as the main GHG reduction technology, and the aim is to create a CCS demonstration project, with the TGR-BF technology (above) seen as the most likely candidate for application (Element Energy 2010). Within the UK, the 3 major plants are considered suitable for CCS. Redcar and Scunthorpe are particularly suitable due to their location near the North Sea oil fields and potential power sector regional CCS infrastructure. All three would require retrofitting of pre- or post combustion technology. Element Energy (2010) reports that engineering and economic assessments have been undertaken for TGR-BF technology at
Technology Innovation for Energy Intensive Industries
16
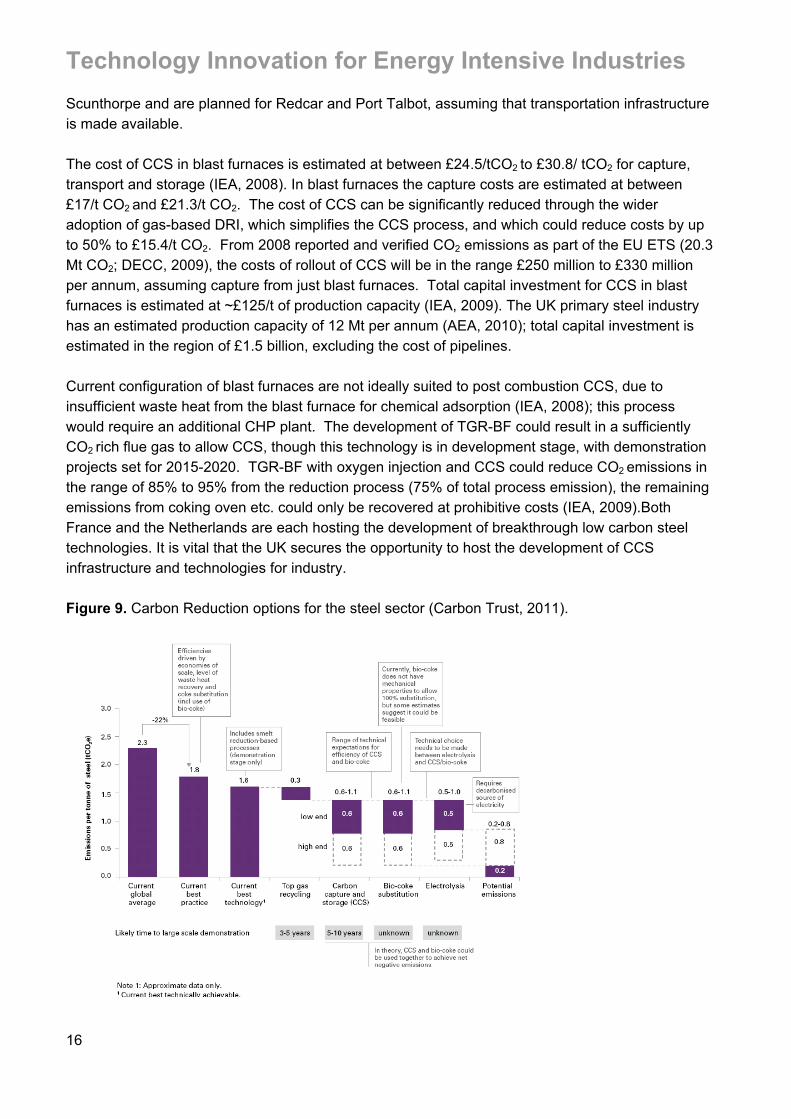
Scunthorpe and are planned for Redcar and Port Talbot, assuming that transportation infrastructure is made available. The cost of CCS in blast furnaces is estimated at between £24.5/tCO2 to £30.8/ tCO2 for capture, transport and storage (IEA, 2008). In blast furnaces the capture costs are estimated at between £17/t CO2 and £21.3/t CO2. The cost of CCS can be significantly reduced through the wider adoption of gas-based DRI, which simplifies the CCS process, and which could reduce costs by up to 50% to £15.4/t CO2. From 2008 reported and verified CO2 emissions as part of the EU ETS (20.3 Mt CO2; DECC, 2009), the costs of rollout of CCS will be in the range £250 million to £330 million per annum, assuming capture from just blast furnaces. Total capital investment for CCS in blast furnaces is estimated at ~£125/t of production capacity (IEA, 2009). The UK primary steel industry has an estimated production capacity of 12 Mt per annum (AEA, 2010); total capital investment is estimated in the region of £1.5 billion, excluding the cost of pipelines. Current configuration of blast furnaces are not ideally suited to post combustion CCS, due to insufficient waste heat from the blast furnace for chemical adsorption (IEA, 2008); this process would require an additional CHP plant. The development of TGR-BF could result in a sufficiently CO2 rich flue gas to allow CCS, though this technology is in development stage, with demonstration projects set for 2015-2020. TGR-BF with oxygen injection and CCS could reduce CO2 emissions in the range of 85% to 95% from the reduction process (75% of total process emission), the remaining emissions from coking oven etc. could only be recovered at prohibitive costs (IEA, 2009).Both France and the Netherlands are each hosting the development of breakthrough low carbon steel technologies. It is vital that the UK secures the opportunity to host the development of CCS infrastructure and technologies for industry. Figure 9. Carbon Reduction options for the steel sector (Carbon Trust, 2011).
Technology Innovation for Energy Intensive Industries
17
ii. Basic inorganic chemicals The basic inorganic chemicals sector covers a wide range of chemical production processes14. Nitrogen based fertilisers are included in a separate section. It is a highly profitable sector and a large employer within the UK. Given the breadth of the sector, it is not possible to cover the full range of technology processes within this section. This section however will present technologies that can be applied to stages and processes common to a number of different chemical production processes. Verified emissions for the chemicals sector with emissions in the EU ETS (excluding CHP) were 13.2 MtCO2 in 2008, covering a total of 78 installations. The source size of most production facilities is medium or small scale; of the total 78 sites, 70 emit less than 200,000 tCO2 per year and 58 less than 50,000 tCO2. Lucite and INEOS Chlor report investing in a wide range of energy efficiency measures over recent years. These include:
! Sale of excess steam to local industries for electricity production. ! New cell room technologies - conversion of 2/3rds of old mercury cells to state-of-the-art
membrane technology (primary electrical energy savings of 15%) ! An efficient combined-cycle gas turbine (CCTG) generator built on site in 1990s. INEOS use
half of its total electrical output. ! Metering utilities use and comprehensive monitoring systems ! New efficient boiler plant (£40 million) ! Centralised control room and distributed process automation system ! At the INEOS Chlor Runcorn site, an energy from waste combined heat and power (EfW-
CHP) plant is nearing completion. It will use 750,000 t/yr municipal waste from NW England and displace 25% of INEOS Chlor’s fossil fuel burn. The project will result in GHG emissions reduction of > 500,000 t CO2eq/yr.
As a result of the above investments, by 2010 INEOS had achieved a 17% energy efficiency improvement over 1998 benchmark. Their 2008 production mix emitted 253,000 fewer tonnes of CO2 than the same mix would have emitted in 1998. Further emission reduction will follow completion of the EfW-CHP plant. In 2009, as a result of these efforts, INEOS Chlor won the Low Carbon Award from the Chemical Industries Association.
Potential Technology Options Given the broad nature of the inorganic chemicals sector, the number of potential technology options is relatively diverse. The IEA has identified more than 50 energy best practices within the 14 Inorganic chemicals include aluminium sulphate, ammonia, ammonium nitrate, ammonium sulphate, carbon black, chlorine, hydrochloric acid, hydrogen, hydrogen peroxide, nitric acid, nitrogen, oxygen, phosphoric acid, sodium carbonate, sodium chlorate, sodium hydroxide, sodium silicate, sodium sulphate, sulphuric acid, and titanium dioxide.
Technology Innovation for Energy Intensive Industries
18
(petro-) chemical sector, covering waste heat recovery, CHP and fuel switching. Many of these are at negative or low cost per tonne CO2e. There are a number of higher cost options, including developments in ethylene cracking processes, and the decomposition of non-CO2 greenhouse gases, which although capital intensive, nonetheless may be lower cost than carbon capture and storage. Respondents reported the following potential technologies as routes to further decarbonisation:
! Carbon Capture and Storage potential is being looked at in collaboration with other NEPIC15 (North East Process Industry Cluster) companies in the Teesside area although the flue gases would require significant cleaning. Lucite would prefer carbon capture and conversion – e.g. to methanol which could then be reused;
! Use of alternatives to natural gas e.g. hydrogen (supply is available locally) or biomass fuels; ! Own on-site generation of electricity (gas engines, turbines, organic rankine cycle engines
being trialled locally to produce electricity from low-grade waste heat); ! Use of lasers to decompose by-product of acid stream rather than natural gas derived heat; ! Possible use of syngas produced locally from organic waste materials (NEPIC coordinated) ! Decarbonised electricity supply ! Alternative use for hydrogen by-product e.g. in H2 fuel cells (to avoid burning with natural gas
as at present) ! Better use of low grade heat (currently wasted)
Membrane Separation Selective membranes have a wide variety of applications across a number of different production processes within the basic inorganic chemicals sector in addressing the needs of separation, often one of the most energy intense stages of production. One of the most important could be in the separation of nitrogen from oxygen. Current separation of N2/O2 is by cryogenic air separation or pressure swing absorption. In the cryogenic air separation process, the compressor consumes 91% of the total energy requirement (Lako, 2009). The energy requirement of air separation is approximately 250 to 300 kWh/t of oxygen produced (Sundkvist, 2001). Membranes offer the potential to reduce energy consumption by 30-40% (Kauranen, 2008) in the long term; the technology is currently not available. The separation of N2/O2 could be potentially significant for the widespread roll of CCS and the significant role that oxyfuelling could play in reducing the CO2 separation costs from the flue gas. Carbon Capture and Storage The viability of CCS is highly dependent on the chemical process being considered, due to the composition of the flue gas and concentrations of CO2 within it. Where the concentration of CO2 is high, as in ammonia, hydrogen, ethanol, ethylene or ethylene oxide production (see section on Nitrogen Fertilisers), CCS will be a relatively cost effective CO2 abatement option for post-combustion capture. Where large volume concentrated sources exist (such as in ammonia and
15 The PICCSI (Process Industry Carbon Capture and Storage Initiative) is working to show that CCS is just as important to industrial producers of CO2 as it is to power generators and how it will be beneficial to link power generation CCS schemes to an industrial network, so that the cost of collection and disposal are shared. The potential of Enhanced Oil Recovery (EOR), for demonstrating aquifer storage and developing a North Sea Carbon Dioxide Sea Transport network, are part of what is on offer from this North East England based project. (see website http://www.piccsi.co.uk/)
Technology Innovation for Energy Intensive Industries
19
SMR hydrogen plant), the only equipment required would be relatively low cost compressors, drying equipment, pumps, coolers and separators. There would be no requirement for heat utilities to support amine regeneration or absorption units. With the exception of CHP units, there are 7 installations in the UK that may be suitable for CCS technology with combined direct emissions of 4.3 MtCO2 in 2008 (Element Energy 2010). These include
! 2 ammonia plant in Billingham and Ince, ! 4 ethylene plants in Grangemouth, Wilton, Fife and Fawley, ! 1 hydrogen plant (Teesside)
Cost estimates for CCS range from £10-20 /tCO2 (IPCC, 2005; IEA 2009). These costs would likely be higher for retrofit, than for an integrated design. Ethylene plants have much lower CO2 concentrations in the flue gas, which would result in higher costs. Cost information is limited for technology implementation. Lucite reported that their CCS costs would be £50 million to install CO2 purification equipment + £5 million/yr to use local CCS network. CCS has the potential to reduce Lucite’s CO2 emissions by ~ 90%
Technology Innovation for Energy Intensive Industries
20
iii. Ceramics The UK’s ceramic sector is responsible for the production of bricks, tiles, sanitary porcelain and china. It has turnover of £1.78bn employing 21,000 people and providing GVA of £563 million to the UK economy. The sector is an active exporter, particularly for industrial ceramics, refractories, table and giftware and clay drainage pipes. The ceramics industry represents less than 1% of total industry emissions (1.06 MtCO2, 2008; DECC, 2008) with the majority of process and production facilities (87%) with emissions of less than 0.05 MtCO2 (Element Energy, 2010). The ceramics industry has invested heavily in energy efficiency and emissions reduction technologies over recent years. While little can be done about reducing process emissions from clay use, much has been done in relation to energy-related emissions and improvement of energy-efficiency over the last decade. The British Ceramic Confederation estimates that the majority of investments with paybacks of between 1-4 years have already been undertaken, with a number of longer term investments over recent years (10 year paybacks). For example, just in one company, Ibstock Brick Ltd, a total of £55 million has been spent over last 10 years. Several factories in the wall / floor/ roof tile sectors and brick sectors have been completely rebuilt as state-of-the-art energy-efficient plants in recent years with investments of typically £20-50M in each larger site. Many small companies have continued to invest heavily too. The following are some of the activities undertaken by the industry to date:
! Move away from batch (intermittent) to continuous processes (e.g. tunnel kilns) ! Improved kiln insulation and ‘refractory’ kiln-ware ! New materials that require lower firing temperatures (e.g. Dudson ThermECO glaze). ! Pre-calcining/pre-treatment ! Use of recycled materials (ceramics – e.g. Johnson Tiles; and glass) ! Heat recovery (using heat from cooling cycle to dry unbaked clay bricks) ! Use of inverters on motors
Beyond this, there is little scope for more recovery except by complete rebuilds (in the brick industry, each rebuild costs £12 - 25 million). Heat recovery from the heating cycle has proved problematic (e.g. one overseas refractory ceramics company uses high-tech heat exchangers but corrosive, wet flue gases tend to shorten their life to 6 months). More than 85% of the energy consumed by the sector is now derived from natural gas, with lesser use of electricity (as worse energy efficiency than gas at the high temperatures required) and some limited use of diesel, LPG and coal only where mains gas is unavailable. The industry has been able to use some renewable energy (e.g. energy from waste in brick, roof tiles and clay pipe sites), but has encountered problems in planning for many of these installations (e.g. especially for wind turbines and some energy from waste).
Technology Innovation for Energy Intensive Industries
21
Technology Options Working with the Carbon Trust Industrial Energy Efficiency Accelerator, the British Ceramic Confederation identified a number of potential medium term options to further improve efficiency for the brick industry – some of which may be transferable to other ceramic sectors. However, the achievability of these savings needs to be further explored through demonstration projects before they can be more firmly established. The Carbon Trust has just agreed to explore an application to the Regional Growth Fund for the sector, and it is hoped that some of the following technologies identified may be progressed:
! Better use of heat recovery (potential site cost saving £100k/yr16). The estimate of sector wide CO2 saving is 25000 t/ CO2e
! Process modelling in kilns (potential site cost saving £50k/yr; new-build only). The estimate of sector wide CO2 saving is 13,000 t/ CO2e
! Reducing air flow in kilns (potential site cost saving £95k/yr). The estimate of sector wide CO2 saving is 40,000 t/ CO2e
! Redesign of kiln cars (potential site cost saving £20k/yr). The estimate of sector wide CO2
saving is 9,500 t/ CO2e ! Use of sustainable syngas from biomass. Gas needs to be pure, and avoid issues of
inconsistent calorific value. There is a potential site cost saving £140k/yr. The estimate of sector wide CO2 saving is 200,000 t/ CO2e per annum
Fuel Switching Fuel use within the ceramics industry is highly dependent on fossil fuels, primarily gas for the firing of kilns (BCC, 2009), alternative fuel sources e.g. biomass or renewable energy generation could displace a proportion of existing fuel use, though limited, though these developments are capital intensive, due to the makeup of the sector (a high proportion of SMEs) financial support may be needed (BCC, 2009). The carbon savings and capital costs will depend on the individual site. Carbon Capture and Storage CCS is not a viable technological solution for the abatement of emissions within the ceramics industry (Element Energy, 2010), primarily due to the distribution and size of production facilities. The exhaust stream is too CO2 dilute and contaminated for efficient, cost effective CCS.
16 From Clay Bricks IEEA Final report. See Carbon Trust (2011)
Technology Innovation for Energy Intensive Industries
22
iv. Glass The glass industry has a turnover of £2.9 billion, employing some 9,000 people directly but supporting up to 100 thousand people in total. It contributes GVA of £894 million to the UK economy. Much work has been done to improve efficiency in the UK glass industry. Several initiatives have been made to-date with varying levels of success. Some looked at alternative fuel sources – fossil and non-fossil, others at energy reduction per se. Cullet use is key whilst cullet preheating provides opportunity for further energy saving. Furnace design is continually being investigated but opportunities for implementation must be based around the comparatively long (15-twenty years) life span. It is impossible to reduce the base energy demand for the actual; mineralogical transformation but alternative fuel supplies are an option were sufficient renewable biomass to be available. Among those activities reported by British Glass are:
! At least two companies have investigated coal bed methane and one successfully augmented grid supply for a while until returns reduced;
! Landfill gas has also been investigated; ! Of two smaller manufacturers one looked at coppicing and another is still looking at moving
to a location that would provide hydro electric energy; ! Gas from biomass has been investigated but residual ash is a problem; having said that a
project is under way in France with the parent of one of the companies operating in the UK. This pilot study uses funding from several sources including public funding and looks to generate gas from pruning from vineyards in the Champagne region to supplement fossil fuel
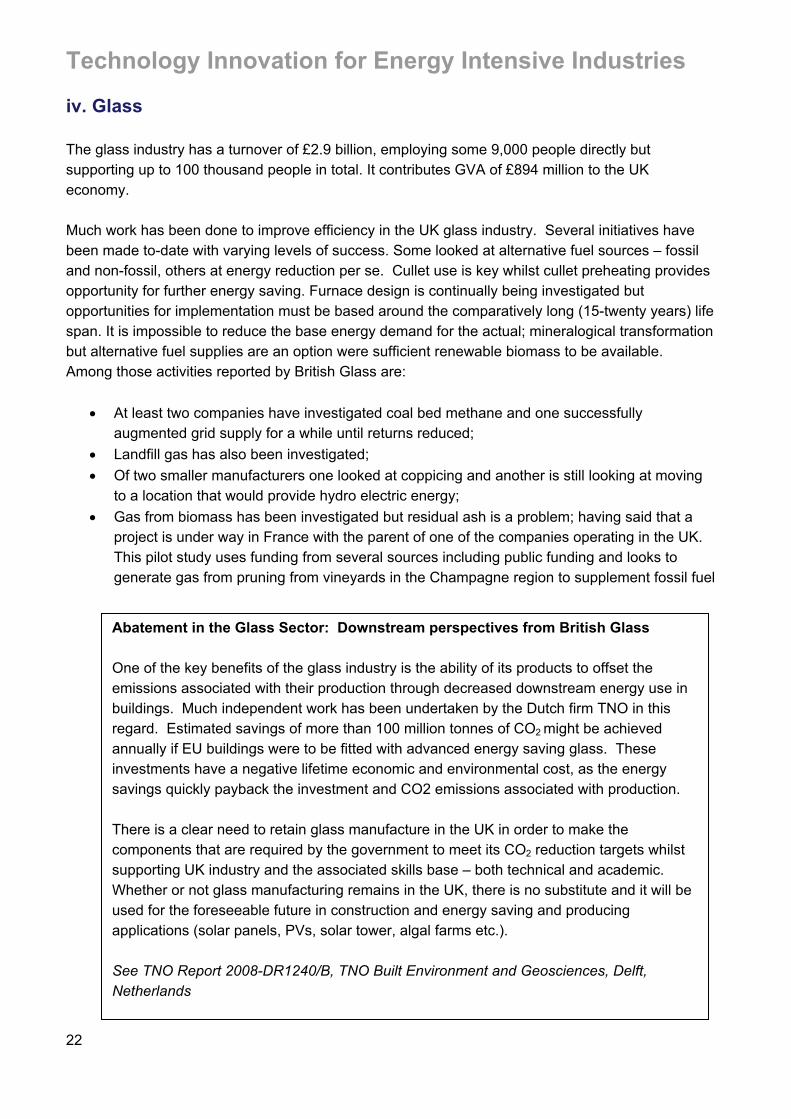
Abatement in the Glass Sector: Downstream perspectives from British Glass One of the key benefits of the glass industry is the ability of its products to offset the emissions associated with their production through decreased downstream energy use in buildings. Much independent work has been undertaken by the Dutch firm TNO in this regard. Estimated savings of more than 100 million tonnes of CO2 might be achieved annually if EU buildings were to be fitted with advanced energy saving glass. These investments have a negative lifetime economic and environmental cost, as the energy savings quickly payback the investment and CO2 emissions associated with production. There is a clear need to retain glass manufacture in the UK in order to make the components that are required by the government to meet its CO2 reduction targets whilst supporting UK industry and the associated skills base – both technical and academic. Whether or not glass manufacturing remains in the UK, there is no substitute and it will be used for the foreseeable future in construction and energy saving and producing applications (solar panels, PVs, solar tower, algal farms etc.). See TNO Report 2008-DR1240/B, TNO Built Environment and Geosciences, Delft, Netherlands
Technology Innovation for Energy Intensive Industries
23
consumption in glass bottle manufacturing; thus somewhat mitigating the carbon emissions in the life cycle of the product17.
! Companies also looked at a combined EP/cullet preheater scenario in 2008; funding and technology issues meant it did not go forward.
Technology Options There are a number of technology options available to the glass industry though it is important to recognise that some are only applicable to certain specific processes. As mentioned above the key avenues for development are through increased use of recycled glass (cullet) which involved factors outside the control of the glass manufacturer and the preheating of cullet and raw materials by exhaust gases. Some of these technologies are contained within the draft revised BREF guidance issued by the European Commission. These include:
! Advanced Cullet and Batch pre-heating systems ! New product formulations (This is limited to glass wool and continuous filament glass fibre
which represent a relatively small proportion of UK production.) ! Submerged combustion melting ! Segmented modular melting
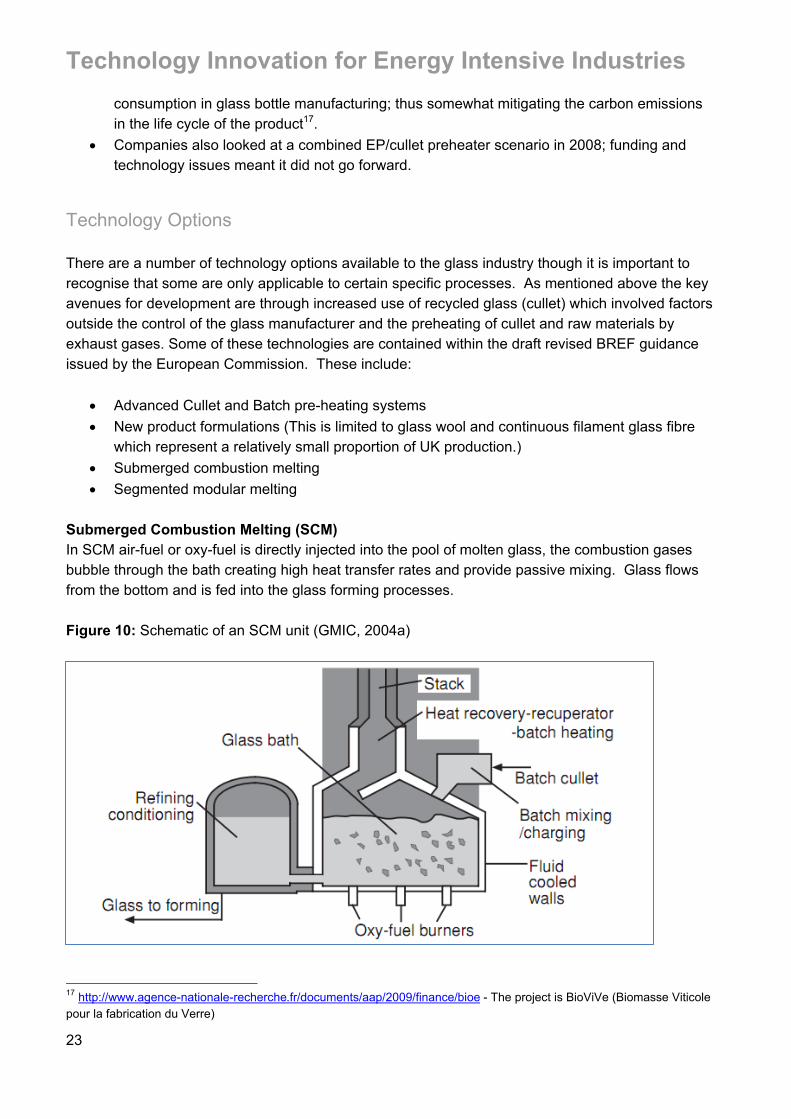
Submerged Combustion Melting (SCM) In SCM air-fuel or oxy-fuel is directly injected into the pool of molten glass, the combustion gases bubble through the bath creating high heat transfer rates and provide passive mixing. Glass flows from the bottom and is fed into the glass forming processes. Figure 10: Schematic of an SCM unit (GMIC, 2004a)
17 http://www.agence-nationale-recherche.fr/documents/aap/2009/finance/bioe - The project is BioViVe (Biomasse Viticole pour la fabrication du Verre)
Technology Innovation for Energy Intensive Industries
24
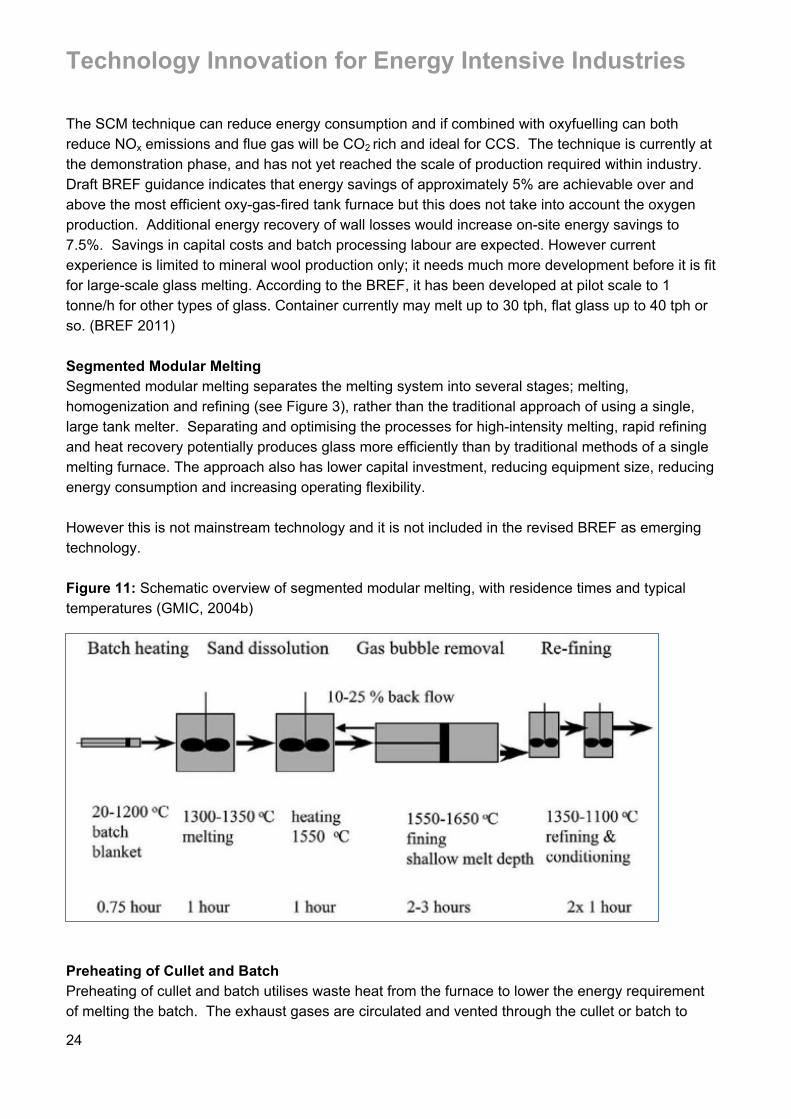
The SCM technique can reduce energy consumption and if combined with oxyfuelling can both reduce NOx emissions and flue gas will be CO2 rich and ideal for CCS. The technique is currently at the demonstration phase, and has not yet reached the scale of production required within industry. Draft BREF guidance indicates that energy savings of approximately 5% are achievable over and above the most efficient oxy-gas-fired tank furnace but this does not take into account the oxygen production. Additional energy recovery of wall losses would increase on-site energy savings to 7.5%. Savings in capital costs and batch processing labour are expected. However current experience is limited to mineral wool production only; it needs much more development before it is fit for large-scale glass melting. According to the BREF, it has been developed at pilot scale to 1 tonne/h for other types of glass. Container currently may melt up to 30 tph, flat glass up to 40 tph or so. (BREF 2011) Segmented Modular Melting Segmented modular melting separates the melting system into several stages; melting, homogenization and refining (see Figure 3), rather than the traditional approach of using a single, large tank melter. Separating and optimising the processes for high-intensity melting, rapid refining and heat recovery potentially produces glass more efficiently than by traditional methods of a single melting furnace. The approach also has lower capital investment, reducing equipment size, reducing energy consumption and increasing operating flexibility. However this is not mainstream technology and it is not included in the revised BREF as emerging technology. Figure 11: Schematic overview of segmented modular melting, with residence times and typical temperatures (GMIC, 2004b)
Preheating of Cullet and Batch Preheating of cullet and batch utilises waste heat from the furnace to lower the energy requirement of melting the batch. The exhaust gases are circulated and vented through the cullet or batch to
Technology Innovation for Energy Intensive Industries
25
raise its initial temperature, so that the feed into the furnace is not “cold”. Alternatively the cullet can be indirectly heated from the exhaust gas; the cullet is held in a “funnel” and the exhaust gas is passed through surrounding chambers and the heat is indirectly transferred through the chamber walls, the preheated cullet of removed from the bottom of the funnel. Preheating of cullet and batch is a pre-existing technology and could potentially be rolled out across the industry through industry capital investment in replacement of melting furnaces, typically a 10-15 year cycle (AEA, 2010). The addition of preheating of cullet and batch can reduce energy demand by approximately 30% (Kobayashi, 2006), also the temperature of the furnace is less variable and allows greater control of quality, the life of the furnace is increased reducing maintenance costs and also reduces NOx emissions (CWC, 1996). However, whilst cullet/batch preheating appears the most practicable of the technologies, it relies on a national cullet infrastructure to supply sufficient and good enough quality cullet to make investment worthwhile. Problems of implementation are currently hindered by the UK waste collection policy of co-mingled waste. Cullet preheating (Ireland) is known to have also produced odour and maintenance problems and was not a success. From an advanced technology perspective, there are developments underway to apply the pre-heating to oxy-fuel-fired furnaces, which would result in higher quality, productivity and lower furnace energy consumption. The production of oxygen is of course an energy intensive process in its own right (for example it is treated as electricity under Climate Change Agreements). Furthermore oxygen use increases the economic cost and it would be necessary to recover energy from the flue gases. There are currently two active projects under development. The PRECIOUS project in Germany expects energy efficiency improvements of up to 20%. The PRAXAIR BCP project estimates approximately 15-30% reduction compared to an oxyfuel fired furnace without pre-heater, with the reduction in energy consumption estimated at about 1GJ per tonne of melted glass. The application of the BCP technique is expected to result in potential energy savings of between 15 - 25 %, reduced oxygen consumption for the combustion and a potential increase in the production rate of between 10 - 20 %. The payback time for the equipment is estimated to be between 1 and 3 years (BREF 2011). Electric melting Electric furnaces do exist (Waterford ran one rated at a few tpd for several years) however the technology is not proven for larger standard sized furnaces of say 300 to 700tpd. Not only does the cost of electricity makes large electric furnaces prohibitively expensive but one must also consider that given the efficiency losses in electricity generation and transmission the primary energy use is considerably less efficient than burning gas onsite. Having said that there are advantages to be had from a “cold top” electric furnace because hot combustion gases do no need to be exhausted. Unfortunately given the current power generation mix in the UK a glass industry switch to electric melting, assuming it could technically be achieved, would likely lead to a significant increase in total CO2 emissions of up to perhaps 50%. Most importantly it should be remembered that furnaces are continuous operations and could not cope with intermittent supply. Considerable dialogue would be needed with government before moves were made in this direction. Carbon Capture and Storage CCS is not a viable technological solution to abate emissions of the glass industry (Element Energy, 2010), primarily due to the distribution and size of production facilities. The glass industry represents
Technology Innovation for Energy Intensive Industries
26
less than 1% of total industry emissions (1.68 MtCO2, 2008; DECC, 2008) with all process and production facilities having emissions of less than 0.2 MtCO2 (Element Energy, 2010). v. Aluminium The UK aluminium industry had a total annual turnover of £1.4 billion per year, with direct employment of 7,000 people, but with significant secondary downstream supply chain effects. Estimated Gross Value Added for the sector is £131 million. There are only two primary smelters remaining at Lynemouth and Lochaber, both operated by Rio Tinto. The Fort William Lochaber smelter uses hydropower, and therefore has relatively low emissions. The smelting of aluminium is by far the most energy intense stage of the production process (120 GJ/t), four times more than the refining stage of the bauxite, and the technological development and research of the industry has focused on this stage, alongside capture of PFCs associated with the smelting process. The smelting of the aluminium is conducted in Hall-Héroult cells. Currently the UK aluminium industry is outside of the EU ETS. However from 2013 the European aluminium industry will be included in Phase III, the cost of compliance with these new regulations is estimated at £50 million to £100 million for Lynemouth Primary Aluminium Smelter (ALFED, 2010).18 The Lynemouth plant has electricity supplied by its own on-site coal fired power station (420 MW). Over recent years, attempts to improve the efficiency have focussed on increasing the efficiency of the power plant (from 36% to 39%), and introducing co-firing of the power station with 2.5-3% biomass fuel (wood pellets and olive residue). These measures have saved an estimated 40,000 tCO2 per year. In terms of the smelting process itself, some small energy efficiency savings have been achieved by improvements to the electrolytic cell design (energy use down from 14.9 MW/t to 14.3 MW/t).
Technology Options A number of technology options have been identified in a Carbon Trust Report (Carbon Trust 2011). These are set out in figure 12 and described in more detail below:
18!While outside the EU ETS, given the electro-intensive nature of aluminium production, there has been some industry concern that the cost of EUAs has been passed through to industrial consumers by the power sector irrespective of whether the allowances have been issued for free. The EU has allowed national state aid as compensation from 2013 (Phase 3) for this effect!
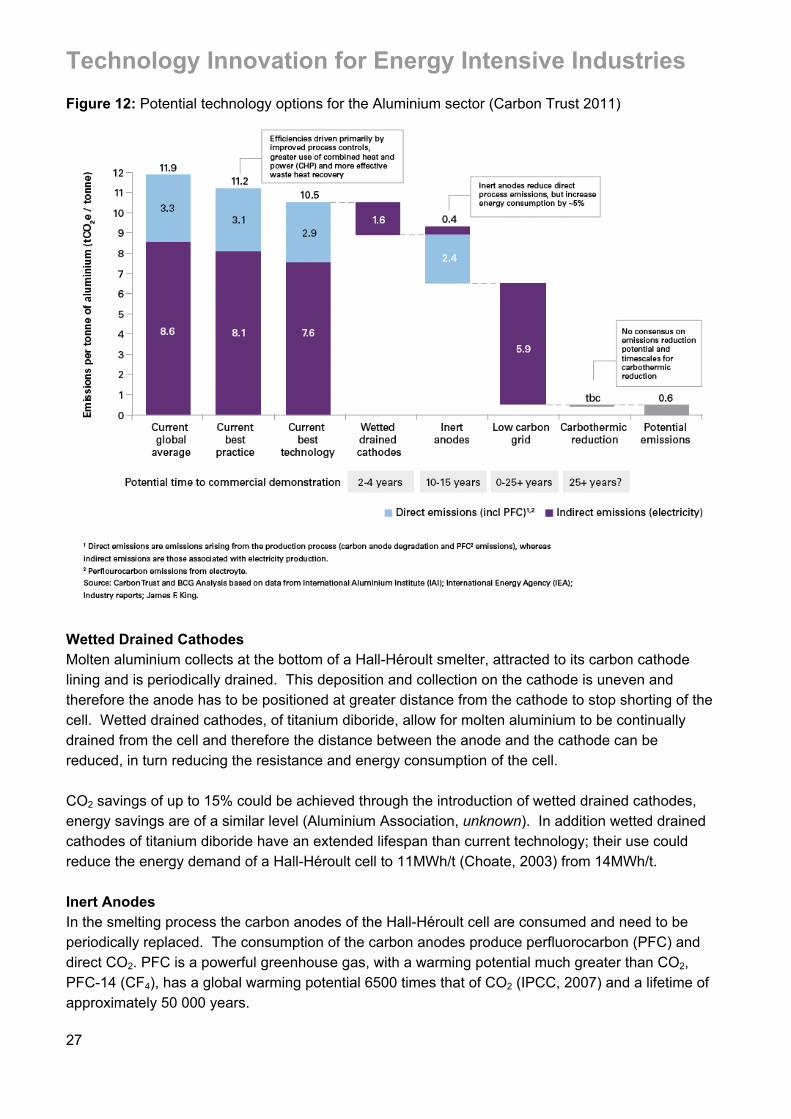
Technology Innovation for Energy Intensive Industries
27
Figure 12: Potential technology options for the Aluminium sector (Carbon Trust 2011)
Wetted Drained Cathodes Molten aluminium collects at the bottom of a Hall-Héroult smelter, attracted to its carbon cathode lining and is periodically drained. This deposition and collection on the cathode is uneven and therefore the anode has to be positioned at greater distance from the cathode to stop shorting of the cell. Wetted drained cathodes, of titanium diboride, allow for molten aluminium to be continually drained from the cell and therefore the distance between the anode and the cathode can be reduced, in turn reducing the resistance and energy consumption of the cell. CO2 savings of up to 15% could be achieved through the introduction of wetted drained cathodes, energy savings are of a similar level (Aluminium Association, unknown). In addition wetted drained cathodes of titanium diboride have an extended lifespan than current technology; their use could reduce the energy demand of a Hall-Héroult cell to 11MWh/t (Choate, 2003) from 14MWh/t. Inert Anodes In the smelting process the carbon anodes of the Hall-Héroult cell are consumed and need to be periodically replaced. The consumption of the carbon anodes produce perfluorocarbon (PFC) and direct CO2. PFC is a powerful greenhouse gas, with a warming potential much greater than CO2, PFC-14 (CF4), has a global warming potential 6500 times that of CO2 (IPCC, 2007) and a lifetime of approximately 50 000 years.
Technology Innovation for Energy Intensive Industries
28
Current Hall-Héroult cells produce aluminium through the release of CO2 (2Al2O3 + 3C ! 4 Al + 3 CO2), whereas inert anode produce aluminium directly (2Al2O3 ! 4 Al + 3 O2). Inert anodes increase energy consumption in the smelting process but reduce associated CO2 emissions by up to 40% (IEA, 2009). Currently the developed materials have not been completely inert (Aluminium Association, unknown) and are therefore unsuitable, but development work is ongoing. Fuel Switching The electricity consumption within the smelting process is the single largest contributor to the CO2
emissions of the aluminium production process, and also offers the single greatest abatement option (IEA, 2009). The source of the electricity will dictate the overall CO2 emissions of the aluminium production process, e.g. Lynemouth Primary Aluminium Smelter is supplied by the Lynemouth coal-fired power station (ALFED, 2010), both owned by Rio Tinto Alcan. It is possible to switch electricity generation to low or zero carbon, though at considerable expense and final costs depend on the source of generation chosen. In places such as North America hydropower accounts for nearly three-quarters of electricity production consumed by the aluminium industry; the average tonne of aluminium produced consumes 15,215 kWh (IAI, 2010), the potential CO2 savings are significant. Rio Tinto is planning to completely switch the Lynemouth power plant to biomass by 2013. The costs are estimated at about £ 50 million capital expenditure for conversion, with running costs of £170 million/annum. It is estimated that the entire current CO2 emissions from the coal-fired power station of 2.8 million tonnes CO2 will be avoided. CO2 abatement within the power generation sector is beyond the scope of this report, however the reader is directed to the resource CO2 Capture and Storage: A key carbon abatement option (IEA, 2008). Carbon Capture and Storage CCS of direct emissions currently is not viable within the aluminium production process (IEA, 2009) and significant challenges need to be overcome, primarily, how to economically capture CO2
emissions from the electrolysis cell. However CCS of indirect emissions, as a result of power generation used within the smelting process, could significantly reduce the CO2 emissions of the aluminium sector. The CO2 savings will depend on the source of electricity generation used within the smelting process. An example of the indirect carbon emissions of the aluminium industry is the Lynemouth Primary Aluminium Smelter and the coal fired power station that exclusively supplies the plant both owned and operated by Rio Tinto Alcan.
vi. Cement manufacture In 2009, the cement and lime manufacture sector employed approximately 6,000 people directly, and had an annual turnover of £749 million according to the UK government Annual Business Survey. The sector represented £279 million of GVA and provides enabling products for a large range of sectors and industries. The cement sector is a major contributor to global CO2 emissions, representing approximately 5% globally and just over 1% in the UK. Emissions are created both from fuel combustion and
Technology Innovation for Energy Intensive Industries
29
limestone calcination in kilns. Both of these offer the potential for carbon capture and storage or conversion. Within the UK, emissions from this sector falling within the EU ETS represented approximately 8 MtCO2 in 2008, representing approximately 7% of industrial emissions (Element Energy, 2010). There are currently only 12 UK Portland cement sites with >500kt clinker capacity per year plus one aluminate cement plant.
Technology Options ! Emissions from clinker and cement production can be reduced through a number of
established abatement measures. These may include ! Energy efficiency improvements, notably in kiln technology ! Combustion of waste and biomass fuels in the kiln ! Increased use of clinker substitutes in cement blending ! Low carbon cements based on new production processes
While it is recognised that many of these options may be implemented at negative or low cost, they may face barriers such as access to alternative fuels and materials, and technical specifications for cement. The current Best Available Technology is considered a six stage pre-heater with pre-calciner as outlined in the BREF (EC, 2010) guidance; this is assumed to be approaching the upper limits of energy efficiency (2.9 GJ/t clinker) with the current process, any further improvement on this would require a ‘step change’ in the cement production process.19 The current average energy consumption across the UK cement industry is 4010 MJ/t clinker (weighted average; CSI, 2008). New efficient kilns are estimated to use approximately 80% of the energy and electricity consumption compared to the current EU average and with 10% less emissions (CE Delft 2010). While CCS is recognised as providing the main route for major emissions improvements in the industry, the development of low or carbon negative cements (e.g. Novacem, Calera, Calix and geopolymer cements) may prove to be an option, although uncertainty remains about their deployment. Fuel Switching (Substitute Fuels) In the UK, petcoke and coal represent 60% of fuel use for the firing of the cement kiln and substitute fuels 38% of total energy input, considerably lower than some examples in Europe e.g. the Netherlands, where substitute rates are above 80%. Alternative fuels than can be used include: solid municipal and commercial waste, tyres, waste oils, sewage sludge and biomass. Any co-firing incorporating the combustion of waste has to meet the emission guidance as set out in the Waste Incineration Directive (WID). The CO2 savings will depend on the fuel that is being used and how the carbon emissions from the use of biomass or waste are credited, as industry representatives would argue that the alternative would be incineration or landfill. A study by CE Delft estimate that CO2 emissions reductions from new kilns incorporating biomass would be up to 35% compared to existing EU kiln averages. It should be noted that process emissions are not affected by the use of biomass for energy inputs. The report also notes that while capital expenditure (CAPEX) for a new
19 Note this represents an instantaneous figure, and is not representative of annualised production. It should not therefore
Technology Innovation for Energy Intensive Industries
30
biomass kiln in the EU will be the same as for a standard Kiln, the operating costs will be significantly higher (more than 40%) due to the higher cost of biomass (CE Delft 2010). Cement Replacing Materials The production of clinker for the use in cement is an energy intense process and produces large quantities of CO2, with large variations, but average UK emissions of 731.8 kgCO2/t (MPA, 2011), through the thermal decomposition of calcium carbonate in the kiln and the release of CO2 from the fuel used. Clinker can be substituted with waste products that possess similar hydraulic properties, e.g. pulverised fuel-ash (PFA) and ground-granulated blast furnace slag (GGBFS), waste by-products of coal fired power stations and iron blast furnaces respectively. Clinker substitution with cement replacing materials is already widespread, and within the Eurocodes there exist 26 specifications of blended cements (ICE, 2009) Substitutions rates of up to 40% can be made with no change in the materials long term mechanical properties (strength) and can lead to increased durability from corrosion (Neville, 1995). The implementation of higher rates of replacement can be achieved at negative real cost (AEA, 2010). However, the Mineral Products Association has stressed the challenge of moving towards higher replacement rates, due to the need for high early strength in many construction applications. The UK already has high levels of replacement of clinker with cementitious substitutes. Some replacement occurs at the cement plant, but most occurs at the concrete plant. In this respect, the UK differs somewhat from other cement and concrete market structures in Europe. CE Delft estimate that the potential for CO2 abatement is potentially limited and that the use of substitutes may only increase from 20% currently to 35%. As such, the potential for emission reductions is estimated at between 10-20%, unless better binding agents can be developed. Low Energy/Low Carbon Cements: There are a number of novel cements based on non traditional processes or raw materials. These emit less CO2 and embody less energy than traditional Portland cement. The following 5 cements are identified by the British Cement Association (BCA 2009)
! Geopolymeric Cements (Australia) ! Low energy CSA-belite cements (China) ! Magnesium Oxide Cements (Australia, UK) ! Ecocement (based on municipal solid waste incinerator ash (Japan) ! C-Fix Cement
None of these is a complete substitute currently to Portland cements, but may occupy niche positions in specialist roles in the future. The main concern is their cost effectiveness and their strength properties in relation to load bearing construction. Significant validation over time would be required before widespread acceptance. More details on the individual products are provided below (details taken from British Cement Association 2009). Geopolymeric cements
Technology Innovation for Energy Intensive Industries
31
Geopolymeric cements use an alkalai as activator and tend to have lower embodied energy and carbon footprints than Portland cement (up to 80-90%), dependent on the Pozzolan used. However, they have been characterised by short and erratic setting times. Recent improvements have led to commercial manufacture in Australia and China. UK manufacture is possible, using fly ash as an aluminia source. However pilot studies would be needed to ensure quality and integrity over time. CSA Belite cements CSA (calcium sulfo-aluminate) cements have been manufactured in China for more than 20 years, and are made by heating or sintering industrial wastes such as fly ash, gypsum and limestone in rotary kilns. Energy savings are up to 25% and CO2 reductions of 20% compared to Portland equivalents. UK manufacture is possible, but similar pilot studies would be required as for Geopolymeric cements to test strength. Magnesium Oxide Cements In the cement sector, the route of producing magnesium clinker based cement (particularly magnesium oxide based cements derived from mineral silicates) is identified as a promising future technology. In Europe, it is currently being explored by Novacem (UK). The technology offers lower energy consumption and a huge CO2 reduction, if not a carbon sink. Imperial college estimates that manufacturing would emit around 0.5 tonnes of CO2 per tonne of cement, while the cement has the potential to absorb up to 1.1 tonnes of CO2 in the service condition. Process emissions and carbonisation of product during production are avoided, so no CCS would be needed. At the same time cost figures are similar to the existing cement kilns. However, efforts need to be undertaken to make it ready for market introduction and for the products to (better) meet market standards. It is estimated that there is the potential for a radical decarbonisation (up to 100% compared with existing processes). CAPEX for magnesium oxide based cements costs are likely to be similar to those of comparable traditional plant (260 million Euro), with lower fuel costs (50%) and higher electricity costs (up to 120%). However, the UK lacks commercial deposits of silicates, and would have to import were production to be at a commercial scale. Eco cement Eco-cements use municipal solid waste incinerator ash (MSWIA) to replace tradition raw materials (up to 50%), and where waste oil, non-recyclable plastics and refuse derived fuels have replaced fossil fuels. They use less energy due to slightly lower kiln temperatures. They have the same properties as Portland cement. UK production would depend on access to MSWIA and proximity to existing cement plants, together with social acceptance of the process. C-Fix cements C-Fix (carbon fixation) is organic cement. The carbon footprint is estimated as up to 3.5 times less than for Portland cement, but this depends upon the energy/carbon footprint associated with the tar used as a binder (from fractionally distilled crude oil) being discounted. It is a thermoplastic material
Technology Innovation for Energy Intensive Industries
32
(its properties change with temperature), and as such can’t be used in structural work. UK production will depend upon applications being identified that can justify production. Carbon Capture and Storage (CCS) In general, the use of pre-combustion capture is not considered to be a suitable technology, due to the fact that limestone calcinations in the kiln typically represents up to 65% of UK plant emissions, and because the presence of hydrogen would require significant changes to the clinker process to prevent potential explosion. As a result, post-combustion technologies are considered to be most appropriate. Chemical (amine) absorption is the preferred technology, employing CHP or waste heat from neighbouring industrial facilities to provide the steam for regeneration. Chemical absorption has the potential to capture 95% of the CO2 in the flue gas (IEA, 2008); however it has significant energy demands (at least 1.5 GJ/t clinker), which would increase the fuel consumption by approximately 50%. Oxy-fuelling is also considered a potential technology for new build kilns, assuming that it can be demonstrated in the power sector. It is considered unlikely that CCS in the cement industry will be commercially available before 2020, with oxy-fuel technology unlikely to be deployed prior to 2025 and both will require significant R&D and demonstration (Element Energy, 2010). The technology may yield up to a 90% abatement potential when used with CCS, although investment and operational costs would double according to the Mineral Products Association. While all kilns are potentially CCS appropriate, in practice it is considered unlikely that kilns with less than 5000 t clinker per day will be candidates. It should be noted however, that many of the largest plants are situated inland away from potential storage sites, and are not within potential CCS clusters. This may result in extremely high transport costs (Element Energy, 2010). Estimations of the costs of CCS are between £46.2/t CO2 and £61.6/t CO2. CCS would increase the overall production cost of a tonne of clinker by 40% to 90% (CCS costs £30.8/t clinker and £46.2/t clinker) (IEA GHG, 2008). Using the stated production capacity of the UK Portland cement industry of 12.25 Mt (BGS, 2008) the total cost per annum of CCS would be in the range £380 million to £565 million. Investment costs using current technology is expensive (~£300/t CO2; IEA, 2008), with a projected capital investment £2.7 billion (using 2010 CO2 emissions per tonne of clinker of 731.8kg/t; MPA, 2011). The capital costs of installation are projected to fall as the technology leaves the R&D phase, falling to ~£90-£120/t CO2 in the period 2030-2050, and the resulting capital investment falling in the range of £800 million to £1 billion. Typically, all cement production facilities have CO2 emissions of 0.2 MtCO2 per annum or greater. The industry is showing increasing interest in the use of CCS technology, and is funding work through the European Cement Research Academy (ECRA).
Technology Innovation for Energy Intensive Industries
33
vii. Pulp & paper making The UK pulp and paper industry employed approximately 13,000 people in more than 250 enterprises in 2009. The industry had a turnover of approximately £3 billion, generating £662 million in GVA. Interviews were conducted with Kjell Bergström of Inggesund Paperboard. The production of paper is split into several distinct processes, the production of virgin pulp from wood, though other substitute materials can be used e.g. rice etc., the production of pulp from recovered fibres (e.g. post consumer waste) and paper and paperboard production. Energy costs represent ~20% of the production cost per ton of completed paper product (Ernest Orlando Lawrence Berkeley National Laboratory, 2009). GHG emissions in the pulp and paper industry are primarily due to the use of natural gas in the processing of pulp into board and paper. This requires large amounts of fuel to evaporate the water used in pulp slurry. The industry has made ongoing investments in improving efficiency, Inggesund paper board reports making investments of £4 million in process efficiency improvements (upgrading pulp refiners) in 2010, resulting in a 20% energy saving. CHP is being pursued as the most effective best available technology, and the company is investing £100-150 million in an on-site facility using biomass fuel (woodchips) at its Workington site. The facility will produce no net CO2 emissions (i.e. 200-250 kt CO2/yr savings for the facility). In addition, it is predicted that excess electricity will be supplied to the national grid thus off-setting CO2 emissions elsewhere. There are two remaining integrated mills in the UK (CPI, 2009a), exclusively supplied by UK grown softwood and sawmill waste. Pulp production totalled 0.3 Mt, a quarter of UK virgin pulp demand, all by mechanical pulping (CPI, 2009b; FAO, 2011). Considering the source and nature of the raw materials of UK pulp, softwood is more efficiently processed via chemical pulping. Chemical pulping has higher heat demands than mechanical pulping, 12.25 GJ/t and none respectively, but a third of the electricity demand, 2.08 GJ/t and 7.5 GJ/t respectively. Heat is much more efficiently generated through the combustion of waste products than electricity. Investment in integrated chemical pulp and paper mills is approximately £1250/t (IEA, 2009). Therefore, a total capital investment of £375 million is required to convert the UK integrated pulp and paper mills.
Technology Innovation for Energy Intensive Industries
34
Technology Options The primary technology is Black Liquor Gasification (BLG) with CCS. This is described further below. In addition, there may be potential for advanced drying technologies post 2030, but these are not described here. Black Liquor Gasification (BLG) Developed by Chemrec (Sweden), Black Liquor Gasification uses the by-product of the chemical pulping process. However, there are currently no chemical pulping plants, though black liquor has a CO2 reduction potential beyond the paper and pulping industry. Black liquor can be turned into syngas, a mixture of H2 and carbon monoxide through gasification this can be subsequently used as a feed stock for a black liquor integrated gasification combined cycle (BLIGCC) turbine. In addition the syngas could be used a feedstock for chemical production or to produce dimethyl ether, which can be used as a diesel substitute in road transport. Using CCS, the process could act as a carbon sink and could act as a potential carbon sink (<100% reduction). The process is estimated to require higher capital and operational costs than current processes (CE Delft). CAPEX costs are estimated at 345m Euro vs. 170m Euro for a standard pulp and paper plant while operating costs might be similar. In the UK, the quality of the product made by Ingesund Paperboard Workington requires virgin pulp and mechanical pulping, so switching to chemical pulping, using recycled paper as feedstock and adopting Black Liquor Gasification, is not an option. Carbon Capture and Storage (CCS) CCS is a viable technology when incorporated with Black Liquor Gasification at chemical pulping plants. BLIGCC technology, similar to coal based IGCC, can be used with CCS technology at the cost reduction in electricity generation efficiency (28% reduced to 25%). Capital costs are dependent on the rating of BLIGCC, estimates are £200/kW, operational costs of CCS are in the region £18/t CO2 to £30/t CO2, excluding transportation and storage. Due to the current industry structure within the UK, relatively small when compared to countries such as Sweden and Finland, the installation of CCS is not economically viable, all UK paper and pulp mills have emissions of less than 0.2 MtCO2 per annum, with the majority of sites having emissions of less than 0.05 MtCO2.
Technology Innovation for Energy Intensive Industries
35
viii. Nitrogen fertilisers The UK Nitrogen Fertiliser industry employed approximately 2,000 people in 64 enterprises in 2009. The industry had a turnover of approximately £2 billion in 2008 and contributed £150 million in GVA in 2009. The industry is regarded as a subset of the wider chemicals sector and the Chemicals Industry Association is the relevant trade body. Interviews were conducted with Mike Walton of GrowHow. Ammonia (NH3) is currently produced from natural gas (CH4) and mainly as feedstock for the nitrogen fertilizer industry. Natural gas constitutes the main fossil fuel feedstock used in the industry. The natural gas provides the required hydrogen for ammonia and the nitrogen is taken from the air. Part of the carbon in natural gas is used for subsequent reaction to produce urea; the rest is released as CO2 emission. To date, producers of nitrogen based fertilisers have invested in a number of technology and process improvements to reduce their emissions. These have included
! Better heat recovery ! Improved energy efficiency in ammonia plant ! Sale of CO2 as by-product to 3rd parties ! N2O emission abatement using catalytic decomposition on nitric acid plants ! On-site electricity generation from waste steam
For example GrowHow have just spent £9 million on N2O abatement at their Billingham site, reducing emissions of this potent GHG by 99%.
Technology Innovation Technological innovation is limited within the current process of ammonia production via the Harber-Bosch process. As a result, energy savings potential at present is limited primarily to the adoption of best available practice. In this regard, GrowHow plans to invest steadily in small energy efficiency schemes over the coming decade. Alternative Ammonia production from (renewable) electricity Ammonia production is generally based on the reformation of natural gas CH4 into CO2 and H2. Alternative methods of the production of H2 by selective ionic membranes, or through the use of low carbon energy could significantly reduce the CO2 emissions of the process. For example, instead of using the hydrogen from natural gas, it is possible to use hydrogen from electrolysis (Hydroworld, 2009). The required electricity could be supplied from renewable low carbon sources, for example hydropower or wind turbines. This way ‘sustainable’ ammonia can be produced without any CO2 emissions and without using fossil fuels. This process has already been deployed in the Vemork hydropower plant in Norway (Boersma, 2008). The cost of alternative hydrogen production is largely dependent on the capital and operational costs of the low carbon electricity supply. Igessund Paperboard indicated that this would only
Technology Innovation for Energy Intensive Industries
36
become economically feasible if natural gas prices were to rise significantly, and if the price of decarbonised electricity supply from the grid were to remain relatively low. Hydrogen electrolysis could result in up to 95% CO2 emission reduction if electricity supply was decarbonised (Ingerssund Paperboard). N2O emission abatement using catalytic decomposition on nitric acid plants The production of nitric acid (HNO3) for fertiliser production results in significant N2O emissions, a highly potent greenhouse gas. Nitric acid production is the largest source of N2O in the chemical industry. Emissions from nitric acid production in Europe range from <3 kg for the most efficient plant to over 9 kg N2O per tonne of nitric acid produced with an estimated average of 6kg N2O per tonne. The European emissions of N2O are estimated at 130k tonnes, equivalent to 40m tonnes of CO2e in terms of global warming potential (GWP). Yara, which operates a large number of nitric acid plants across Europe, has applied the extended chamber concept on one new build, and three other plants have been equipped with process-gas catalytic N2O decomposition for R&D testing purposes. Yara has developed a successful technology for high-temperature catalytic N2O decomposition beneath the Pt–Rh gauzes (process gas abatement) that can be applied to existing plants at an industrial scale. This catalyst is now commercially available, and should result in emission figures in the range of 1-3 kg N2O per tonne HNO3. BASF, Johnson Matthey and Yara have been also successful in developing and commercializing similar catalytic technology for process-gas N2O decomposition catalysts. For tail-gas abatement, Uhde is commercialising the EnviNOx process for the combined removal of N2O and NOx in a single reactor using iron-containing zeolites and intermediate ammonia injection (Pérez-Ramírez, 2007). Carbon Capture and Storage (CCS) The production of ammonia is particularly suited to the incorporation of CCS due to the high concentration of CO2 in the flue gas (typically 98-99%). This flow is more suitable for carbon capture and storage (CCS) (Van Horssen et al, 2009; Lako, 2004) than CO2 from combustion. The International Fertilisers Association has concluded that 1.5-3.1 tonnes of CO2 are emitted per tonne of ammonia produced, and that the sector is amongst those best suited to early adoption of CCS technology in the 2020s. It is estimated that up to 70% of total CO2 emissions could be abated through CCS (i.e. all process emissions captured). Due to the high concentration of CO2 in the flue gas, ammonia production has one of lowest abatement costs by CCS of all industry sectors (Element Energy, 2010). Estimates of the costs of CCS are approximately £15 – 30/tCO2, significantly lower than for other industry sectors due to the fact the flue gas can be directly compressed and dehydrated without using chemical absorption, via amines, to separate CO2 from the flue gas. In 2008, verified emissions for ammonia production were 1.43 Mt CO2, potential investment would be required with an upper bound of £42.9 million. Due to the small levels of output at national level, the fertiliser industry would have to cooperate with other industries to develop the necessary transport and storage infrastructure. This would be feasible for GrowHow at its Billingham site.
Technology Innovation for Energy Intensive Industries
37
!
ix. Carbon Capture and Storage Technology CCS is a technology that can be applied to the decarbonisation of both the power and energy intensive sectors. However, economies of scale mean that it is unlikely to occur without the government playing a strategic role in the planning and development of an integrated transportation and storage infrastructure. Efforts are underway to explore the possibility of regional CCS networks co-located in regions with industry and power installations. One example is the Aire Valley, where the CO2 Sense project has estimated that up to 60 MtCO2 could be captured on an annual basis from both electricity generation and industrial sources. The costs, applicability and technical challenges for the implementation of CCS for individual industry sectors are addressed in the relevant industry sector sections of this report. This section will address the overall CCS system required to support a widespread implementation of CCS across the economy. CCS can be conducted at various stages of industrial processes e.g. post or pre-combustion and by direct capture and transport of flue gases or via an intermediate state such as chemical adsorption of CO2 from the flue gas and then subsequent transportation and storage. The EU only considers geological storage to be environmentally acceptable in deep saline aquifers, depleted oil and gas fields or unmineable coal seams (EC, 2007). The potential for CCS applications in industrial abatement has been less prominent in policy discussions than its role for decarbonising the power supply sector. Nonetheless, there is growing awareness of industrial application, particularly in relation to large point sources, such as in the iron and steel, and cement sectors, and for those processes where relatively pure CO2 gases can be captured from process emissions (hydrogen, ammonia, ethylene oxide). It is likely that for smaller emitters, distant to potential transport networks, CCS is unlikely to be economic, and these companies are more likely to pursue alternatives, such as switching to low carbon electricity inputs. Alternatively, companies may be drawn to locations with good access to CCS facilities. Globally, the technology has already been proven at a number of industrial sites, almost exclusively within the oil and gas industry. Within the energy intensive industries, there are currently no CCS projects in the UK, although the iron and steel and cement industries are known to have undertaken economic and technical appraisal. The former regional development agencies were, and devolved administrations are also engaged in an assessment of CCS potential and transport and storage implications. Ongoing work on regional CCS networks is being undertaken by bodies such as CO2 Sense.
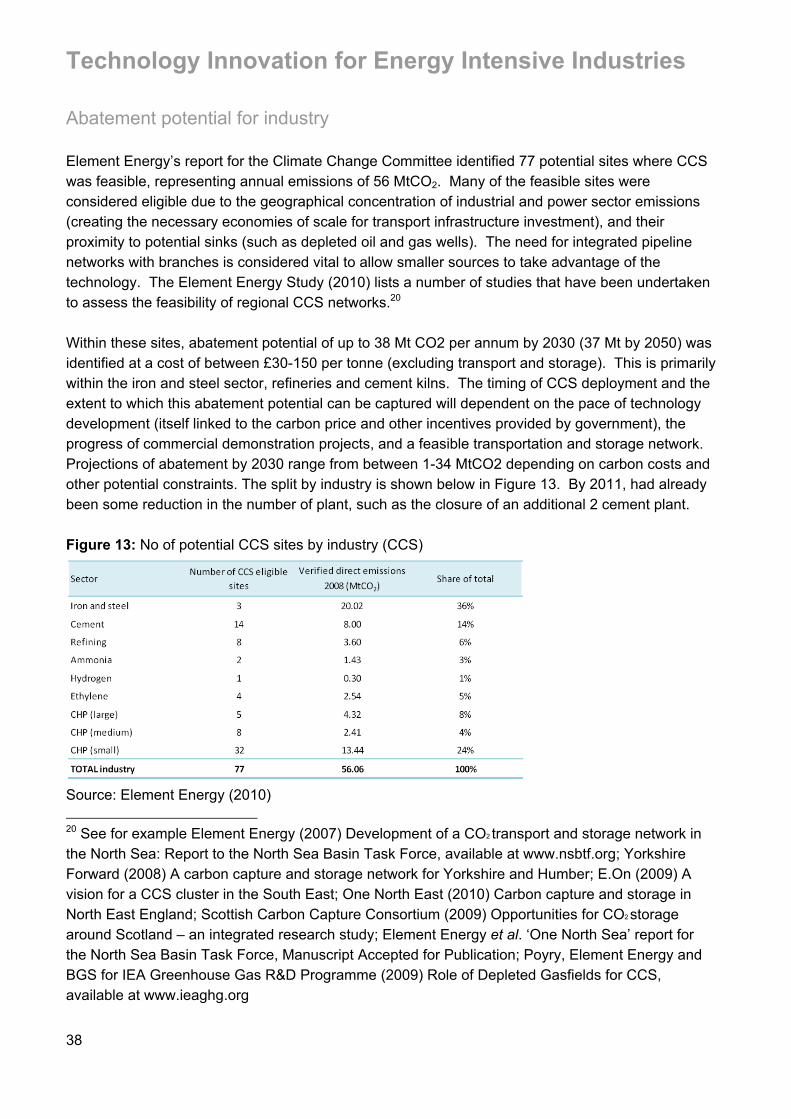
Technology Innovation for Energy Intensive Industries
38
Abatement potential for industry Element Energy’s report for the Climate Change Committee identified 77 potential sites where CCS was feasible, representing annual emissions of 56 MtCO2. Many of the feasible sites were considered eligible due to the geographical concentration of industrial and power sector emissions (creating the necessary economies of scale for transport infrastructure investment), and their proximity to potential sinks (such as depleted oil and gas wells). The need for integrated pipeline networks with branches is considered vital to allow smaller sources to take advantage of the technology. The Element Energy Study (2010) lists a number of studies that have been undertaken to assess the feasibility of regional CCS networks.20 Within these sites, abatement potential of up to 38 Mt CO2 per annum by 2030 (37 Mt by 2050) was identified at a cost of between £30-150 per tonne (excluding transport and storage). This is primarily within the iron and steel sector, refineries and cement kilns. The timing of CCS deployment and the extent to which this abatement potential can be captured will dependent on the pace of technology development (itself linked to the carbon price and other incentives provided by government), the progress of commercial demonstration projects, and a feasible transportation and storage network. Projections of abatement by 2030 range from between 1-34 MtCO2 depending on carbon costs and other potential constraints. The split by industry is shown below in Figure 13. By 2011, had already been some reduction in the number of plant, such as the closure of an additional 2 cement plant. Figure 13: No of potential CCS sites by industry (CCS)
Source: Element Energy (2010) 20 See for example Element Energy (2007) Development of a CO2 transport and storage network in the North Sea: Report to the North Sea Basin Task Force, available at www.nsbtf.org; Yorkshire Forward (2008) A carbon capture and storage network for Yorkshire and Humber; E.On (2009) A vision for a CCS cluster in the South East; One North East (2010) Carbon capture and storage in North East England; Scottish Carbon Capture Consortium (2009) Opportunities for CO2 storage around Scotland – an integrated research study; Element Energy et al. ‘One North Sea’ report for the North Sea Basin Task Force, Manuscript Accepted for Publication; Poyry, Element Energy and BGS for IEA Greenhouse Gas R&D Programme (2009) Role of Depleted Gasfields for CCS, available at www.ieaghg.org
Technology Innovation for Energy Intensive Industries
39
Technologies and applications There are 3 current approaches to CCS21. Within each, there are a number of different technologies that may be used, and which are at various stages of development:
! Post-combustion: Post combustion CCS separates CO2 from waste gas streams using chemical solvents. It is a relatively mature technology, although has not yet been demonstrated at commercial scale in the power sector. It requires significant heat to create a pure CO2 stream that can then either be stored or transported. While it can be used for most sources of CO2, in practice, its use may be restricted by the availability of a suitable heat source. In the medium term, there is the potential to improve the efficiency of post-combustion through the use of advanced solvents, and to apply membrane technology and static bed absorption.
! Pre-combustion: Pre-combustion technologies focus on the gasification of solid fuels (coal,
biomass) to create a syngas (hydrogen and CO) or steam methane reforming (SMR) for natural gas. This is followed by a conversion process to turn the CO into CO2, whereupon it is removed. As a result, combustion emissions are mostly steam and nitrogen.
! Oxyfuelling: Oxyfuelling a technique of combusting fuels as recycled flue gas enriched with
oxygen rather than air, resulting in CO2 and steam. The benefits of oxyfuelling are than the flue gas is CO2 rich simplifying the process of CCS, in some cases it can be the case that the flue gas can be directly compressed and transported for storage. In addition as the combustion happens in an environment of pure oxygen there is no production of NOx. There are a number of disadvantages. Firstly, when retrofitted, it requires the fitting of new turbines due to higher combustion temperatures in oxygen. Space is also needed for air separation units. Oxyfuelling also requires the production of large quantities of oxygen. The primary production process of oxygen globally is cryogenic air separation which is an established and well developed technology (IEA, 2009).
Captured CO2 can be used in oil fields for enhanced oil recovery (EOR), which can significantly enhance the quantity of recoverable oil in a field and in part offset the increased cost associated with CCS. The UK is particularly well placed to capitalise on this, considering the proximity of North Sea oil and gas fields. The technology and processes of EOR are already used throughout the globe, particularly in the USA, representing 94% of total global utilisation of CO2. CO2 based enhanced oil recovery in UK classified North Sea oil fields could boost oil recovery by ~5% (1781 M bbl) (Tzimas, 2005).
21 For example, European Technology Platform for Zero Emission Fossil Fuel Power Plants Task Force (2009) Recommendations for the to support the deployment of CCS in Europe beyond 2020; and IEA (2008) Technology CO2 capture and storage: A key abatement option (Energy Technology Analysis series).
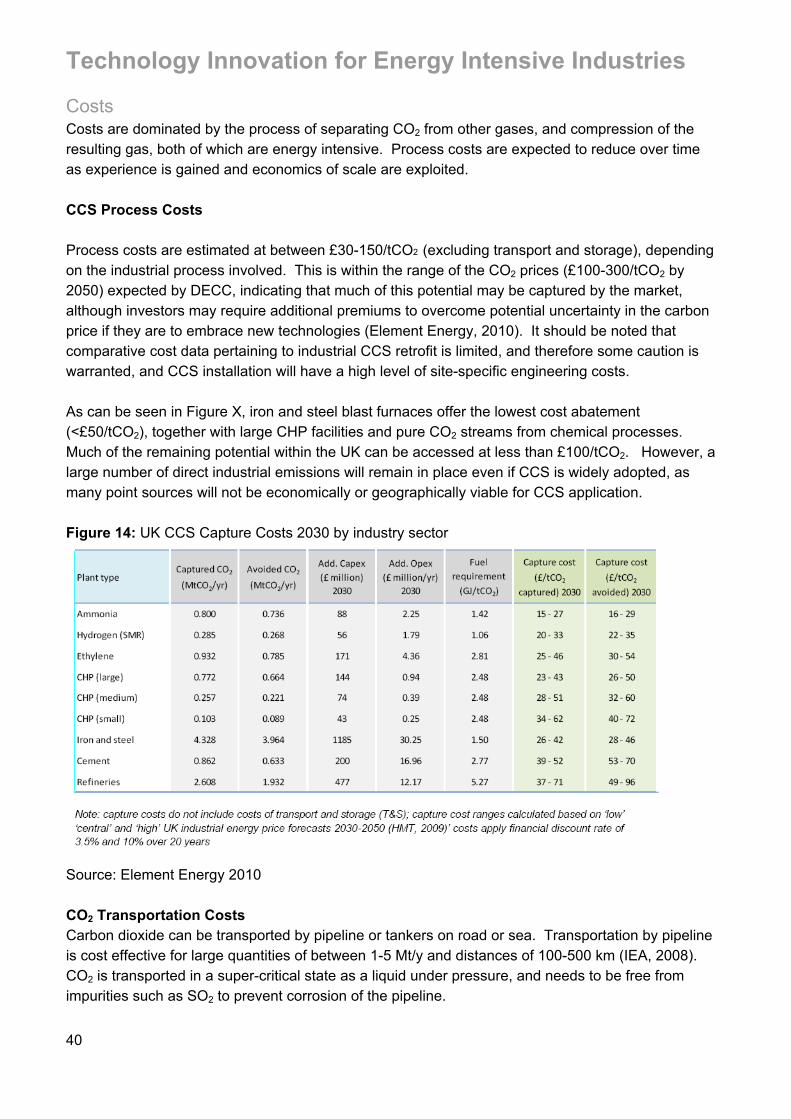
Technology Innovation for Energy Intensive Industries
40
Costs Costs are dominated by the process of separating CO2 from other gases, and compression of the resulting gas, both of which are energy intensive. Process costs are expected to reduce over time as experience is gained and economics of scale are exploited. CCS Process Costs Process costs are estimated at between £30-150/tCO2 (excluding transport and storage), depending on the industrial process involved. This is within the range of the CO2 prices (£100-300/tCO2 by 2050) expected by DECC, indicating that much of this potential may be captured by the market, although investors may require additional premiums to overcome potential uncertainty in the carbon price if they are to embrace new technologies (Element Energy, 2010). It should be noted that comparative cost data pertaining to industrial CCS retrofit is limited, and therefore some caution is warranted, and CCS installation will have a high level of site-specific engineering costs. As can be seen in Figure X, iron and steel blast furnaces offer the lowest cost abatement (<£50/tCO2), together with large CHP facilities and pure CO2 streams from chemical processes. Much of the remaining potential within the UK can be accessed at less than £100/tCO2. However, a large number of direct industrial emissions will remain in place even if CCS is widely adopted, as many point sources will not be economically or geographically viable for CCS application. Figure 14: UK CCS Capture Costs 2030 by industry sector
Source: Element Energy 2010 CO2 Transportation Costs Carbon dioxide can be transported by pipeline or tankers on road or sea. Transportation by pipeline is cost effective for large quantities of between 1-5 Mt/y and distances of 100-500 km (IEA, 2008). CO2 is transported in a super-critical state as a liquid under pressure, and needs to be free from impurities such as SO2 to prevent corrosion of the pipeline.
Technology Innovation for Energy Intensive Industries
41
The energy requirement of CO2 transportation is 0.2-0.5 GJ per 100-200 km of pipeline. The cost of CO2 transportation is highly variable and dependant on a number of factors; the quantity of CO2 conveyed, the distance transported, population density of route and the location of storage facility (whether on sea or land). Estimated capital costs of CO2 transportation pipeline network are £0.5-0.6 million/km. Operational costs of such a network are dependent on the quantity of CO2 conveyed £1.25-3.50/tCO2 (2 Mt/yr) or £0.60-1.80/tCO2 (5-10 Mt/yr). Costs may be lower if economies of scale can be reached (for example a Yorkshire Forward study calculated costs of £1/tCO2. Assuming a mid range value of £2/tCO2 and a total emission capture of 56 Mt CO2 (potential industry emissions (2008) deemed viable for CCS by Element Energy study (2010) for the CCC), operational costs are £112 million per annum. CO2 Storage Costs The costs of storage are largely dependent on the method of storage proposed. It is highly likely that the UK will utilise deposition and storage in the North Sea, in depleted oil and gas fields, due to a number of factors; public acceptance, existing expertise within the oil and gas industry and cost. The estimated storage capacities of CO2 in depleted oil and gas fields is 7.5 Gt and deep saline aquifers at up to 250 Gt (IEA, 2008). Estimations of the costs of CO2 storage are based on experience from the oil and gas industry, onshore storage costs of £6-12/tCO2 and £6-15/tCO2 in offshore depleted oil and gas fields (IEA GHG, 2005). Total storage costs for the projected captured emissions of 56 MtCO2, assuming storage in depleted oil and gas fields and costs at the upper end of the cost range due to the harsh operating conditions in the North Sea (IEA, 2010), are £840 million. The base case capture costs (£ per tCO2 captured) calculated for each of the nine project types are shown in Figure 14, ordered by cost and broken down into their separate key cost components. The cost of capture is seen to vary significantly across the selection of candidate project types, ranging from around £25-30 per tCO2 for those industrial sources involving high-CO2 concentration capture streams with relatively simple capture equipment requirements (ammonia, hydrogen) to costs of £50-60 per tCO2 where there are multiple lower CO2-concentration sources (refinery complex) and/or smaller volumes available for capture (small-scale CHP). In conclusion, it is clear that CCS is a technology for which the marginal transportation and storage costs fall as economies of scale are achieved. Investment in the costs of a regional network is significant. The onshore pipeline network, for example, in the Tees Valley, has been estimated in the £tens of millions, with an offshore pipeline requiring up to £200 million investment (Element Energy, 2011). These costs are too large for a single institution to finance on balance sheet, and the risk of under-utilisation is too great to attract private finance at acceptable rates. Given the above, there is a clear role for government as an enabling partner, working with the private sector to develop and build the necessary infrastructure. It will be particularly important for an integrated strategy for CCS across industry and power generation if the technology is to maximise its abatement potential. While current CO2 costs do not currently incentivise the necessary investment, the expectations of rising carbon prices (up to £100/tCO2 by 2030) suggest that early investment is required to ensure that solutions are ready once the technology is economically viable.
Technology Innovation for Energy Intensive Industries
42
2. Barriers and opportunities for low carbon investment
Introduction This section sets out some of the barriers and opportunities relating to potential investment in low carbon technology deployment and R&D. Firstly, the report reviews potential barriers to long term investment as identified by respondents to the consultation. Secondly, it reviews the current framework for technology investment in the UK and provides an industry perspective on the accessibility and usefulness of government innovation support. Finally, it outlines potential opportunities for government support and industry collaboration to facilitate a low carbon transition for the energy intensive sector.
Barriers to Investment Industry respondents identified a number of barriers preventing uptake of the identified technology options in the short and long term. These are identified below:
! Dispersed geographic location: For large integrated industries, such as Iron and Steel, different parts of the process are located in a dispersed manner which can lead to large inefficiencies, and prevent heat capture and transfer opportunities. In addition, while some industrial regions may benefit from a concentration of point sources (e.g. Aire valley), for those plants located outside identified regional CCS clusters may be prevented from accessing CCS transportation and storage networks due to high pipeline connection costs.
! Supply chain geographic location: in some cases such as glass recycling, which can contribute significantly to emission reduction at the glass manufacturing stage, the economics of returning good quality, glass to the manufacturer play an important role in the system’s viability. Thus national policy and infrastructure need to be improved to generate greater CO2 savings.
! Long term investment cycle: The capital stock for the energy intensive sector (such as blast
furnaces) tends to have long operational lifespan with large sunk costs. Large scale investments to replace or undertake major retrofits tend to happen only on a 20-30 year basis. This means that the pace of efficiency improvements will be relatively slow
! Different expectations of rates of return: Some industry representatives identified differing
view taken by Government and industry on rate of return for investments e.g. a Feed-In Tariff (FIT) scheme could be used by smaller industrial sites, but the rate of return is too low from a commercial perspective, and therefore only suitable for domestic application.
! Price of energy and other inputs: A number of representatives identified the high and rising
costs of energy and energy taxes in the UK, as well as rising commodity prices as a barrier to investment. Parent companies see very poor returns on investment in the UK compared with other countries. For example, the budget introduced a carbon price floor. Taken with other policies Treasury assessment believes this may almost double in real terms the cost of electricity by 2030. As this is a unilateral UK move, this damages profitability of UK manufacturers. They referenced the recent Waters Wye Associates report on the cumulative
Technology Innovation for Energy Intensive Industries
43
impacts of climate change policy on the energy intensive industries, with both electricity and gas costs expected to rise by up to 22% by 2020. Higher input prices, while in theory increasing incentives to invest in resource efficiency is in practice reducing available capital for investment as a result of increasing operating costs. Lucite identified the cumulative influence of green taxes (EU ETS, CCL), and indirect impacts through the electricity price as key threats to long term profitability. The Chemical Industry Association recognised that strong R&D investment flows tended to follow from strong profitability. Companies may choose to shift production to lower cost economies, than invest in new technologies. The British Ceramic Confederation also identified a period of declining future profitability due to UK carbon and energy taxes lessening the ceramics companies’ ability to invest in emission reduction technologies. Rio Tinto identified the UK as a high energy cost economy, and indicated that as a result, investment in new technologies (such as more efficient smelter cells) would tend to go to lower cost economies. This was a sentiment repeated by the fertiliser industry.
! Availability of capital: A large proportion of UK companies operating in the energy intensive
sector are subsidiaries of global organisations that compete internally for capital investment. International management boards allocate capital on the basis of potential returns, and higher costs make it more difficult to justify internal group investment in the UK. For example, Lucite identified that if the payback on an investment were more than 3 years, then it was likely that the parent company (Mitsubishi) would consider investing in projects elsewhere. The British Ceramic Confederation reported that the Green Investment Bank was potentially useful as a provider of capital for energy efficiency projects with proven technologies, but that its exact role and function remained unclear. The recession had run down cash in many companies compared with many European competitors (who were able to use temporary short time working compensation schemes). Many UK banks would also not lend to extend overdrafts even to expand production or help credit as firms pulled out of the recession – so the UK Government needed to recognise that conventional finance is often not available for this type of work.
! Regulatory uncertainty: A large number of respondents identified the uncertainty associated
with energy prices, and climate change and other environmental regulation. INEOS cited uncertainty about the impact of the EU ETS and UK Government policies on electricity price as a key driver in its decision not to invest in replacing its remaining mercury cells. Estimating pay back periods for new technologies is currently very difficult. Long term clarity was seen as vital to underpin long term technology investment, particularly given the high capital costs and long asset life of energy efficiency and emissions reduction equipment. Rio Tinto cited the carbon price floor proposals as an example of uncertainty reducing potential investment in low carbon supply options and R&D for new technologies. The British Ceramic Confederation indicated that it felt other European countries provided a more transparent, fair and stable regulatory framework in relation to energy taxes / prices – allowing businesses to have a more viable model.
! Technology limitations: For many industries, much has already been done to improve the
efficiency of the processes involved. There are efficiency limitations on current processes
Technology Innovation for Energy Intensive Industries
44
(e.g. the minimum amount of carbon inputs used in current blast furnaces, the minimum amount of energy need to transform sand into glass). With the exception of energy and heat recovery projects, efficiency improvements are dependent on new technologies that may not be fully ready for another 10 years (e.g. TGR, HIsarna, CCS etc.) In the ceramics and glass industry, demonstrators were required for some of the energy and heat recovery projects to prove technical viability.
! Economic Cycles: Energy intensive industries are highly exposed to local, regional and
global economic cycles – makes long term investment decisions difficult. This is particularly true for metals, ceramics and cement used in construction.
! Raw materials: The quality and cost of local input materials and fuels mean that the bulk is
now imported (e.g. iron ore and coal for steel). A change back to local sources would need major R&D programme.
! Lack of financial support for R&D: Some respondents commented on the difficulty of
accessing government support to promote industry R&D. The British Ceramic Confederation reported its difficulties in achieving funding support through the Carbon Trust Industry Efficiency Accelerator scheme for demonstrator projects, and that funds were eventually frozen. Other potential sources of support (e.g. Technology Strategy Board) are often difficult to access – especially for small companies.
! Lack of joined up policy: A number of respondents had found their ability to implement
emissions saving technologies thwarted by planning procedures. Application for wind turbines in the ceramics industry had been refused. In the glass industry, for example, recycling schemes based on tonnage rather than quality have collected mixed material streams. This has lead to material contamination reducing the quality of glass and making it unfit for return to the furnace thus wasting its embedded carbon. An application for local use of waste heat from a glass furnace returned little support from government.
! Cross industry infrastructure: Some respondents noted the need for investment in national level infrastructure, particularly in relation to carbon capture and storage, and electricity decarbonisation and recycling. While some industries may be large enough to play an active part in the design and development of this infrastructure (e.g. Iron and Steel), others such as Fertilisers recognised that they would always be too small to influence the roll out, but would be able to plug in if it was appropriately designed and located . However, there did not currently seem to be an adequate mechanism to engage with industry in terms of planning.

Technology Innovation for Energy Intensive Industries
45
UK Innovation Policy Successive UK governments have made commitments to support technology innovation in relation to reducing emissions and improving energy efficiency. There is a clear understanding that getting the low carbon transition right will deliver not only environmental benefits, but also deliver energy security, green jobs and economic growth. The markets for low carbon products and services are expected to grow rapidly over coming years, and the UK must be well placed to take advantage of these opportunities. This will involve not only reducing the embedded emissions in UK manufactured goods, but also focussing on production of those inputs necessary to transform the power, transport and buildings sectors, such as low carbon steel, or energy efficient glass. The UK has a number of competitive advantages in this regard, not least the number of companies already involved in low carbon innovation, its high research and academic standards and track record in innovative financing mechanisms. There is also an existing industrial basis for the manufacture of low carbon products, for which there will be an increasing demand. The government recognised the potential market failures in relation to technology innovation in the 2009 UK Low Carbon Industrial Strategy (low energy prices, volatility of carbon prices, technology uncertainty). The Hauser report (2010) identified that the UK struggled to translate top class R&D into commercial opportunities or new industries and supported the development of Technology and Innovation Centres. In 2010, the Committee on Climate Change (CCC) carried out a review on ‘the adequacy of the UK’s research and innovation arrangements for delivering technologies required to meet the UK’s climate change objectives’ (CCC.2010:01). This review included an assessment of the technology challenges facing the UK and the capacity for development needed to deliver climate objectives and technological innovation from research, development, and demonstration through to deployment (RDD&D). One of the key messages from the CCC’s analysis is that technologies in industry should be supported and that current R&D support for energy must not be reduced as the current levels in the UK are already comparably low by international standards. The UK’s energy strategy needs to look beyond 2020 in order to provide clarity for the long-term energy objectives; this includes identifying which technology portfolios will be developed and addressing challenges to the deployment of these technologies. It also recognized that the UK needs to secure international agreements for the energy intensive sectors, amongst other sectors, to encourage low carbon innovation. The CCC argues that market prices are considered to be a barrier to the development of low-carbon technologies as without policy intervention they do not provide incentives and that this is particularly prominent for low-carbon innovation. The key market failures that reduce private investment include the high cost of revolutionary technological change as opposed to an evolution of the designs based on fossil fuels. Uncertainty of innovation investments and long timescales for investment and deployment also increase the risk. In the energy sector often the investments require high capital costs and so increase the barrier due to risk aversion. Another barrier is in markets where there is
Technology Innovation for Energy Intensive Industries
46
little or no differentiation between products so businesses cannot get a return on investments in innovation that make no actual difference to the end product. These factors can combine and result in a ‘valley of death’ meaning that there is not enough funding for innovation to move new technology innovations through to deployment and so they won’t ever make it to market. Because of this uncertainty of individual technologies the CCC proposes that a portfolio of technologies will provide insurance against some of the technology options failing to make it to deployment. By supporting a portfolio of technologies this will allow targets to still be reached as long as resources are dedicated to a wide range of technology options with investment provided in stages. This will allow for periodical reviews of the technology performance in relation to the abatement targets required. From an innovation and technology commercialisation perspective, government resources for R&D and deployment are limited and must be well targeted. It is notoriously difficult to back ‘technology winners’, especially at the early stages of the innovation process. The Carbon Trust has recommended a portfolio approach beyond the necessary GHG reduction targets, recognising the potential failure of some approaches. Commercial investors remain cautious about bringing private finance until technology risks have been minimised through demonstration projects. Once technologies reach deployment phase, the level of funding support required is much greater than at the previous stages of innovation and so fewer technologies can be supported simultaneously. A prioritization framework is needed so that resources can be allocated according to the point in the development cycle which will be specific to individual technologies. The CCC recognises this, and identifies potential areas where UK industry can play a leading role with the support of government in both early stage R&D and deployment. Industry is recognized by the CCC as an area where there is a range of technologies at the early R&D stage that may be supported for commercialisation. The examples given by the CCC include the development of low-carbon cements and emission reductions for the steel industry. Much work has been done on developing an institutional and financing framework that can support this process, including through the work of the Technology Strategy Board (TSB), the Energy Technologies Institute (ETI) and the Carbon Trust. These organisations have been brought together in a collaborative network with BIS and DECC in the Low Carbon Innovation Group. The TSB has done much, working with the seven Research Councils, the devolved administrations and the Regional Development Agencies (now being replaced by Local Enterprise Partnerships (LEPs). Technology innovation is also supported by a range of fiscal mechanisms, such as tax relief on R&D expenditure. Recent budgets have made commitments to support R&D in the manufacturing sector. Funds have been allocated to the TSB for investment in low carbon commercialisation, such as through the CCS demonstration competition. The 2011 budget announced £200 million to be invested in new Technology and Innovation Centres, with the first to focus on high value manufacturing. Energy and resource efficiency is one of six of the initial categories under consideration for the first phase of applications for this long-term investment strategy. Additional funds are being directed to university based centres for innovative manufacturing.
Technology Innovation for Energy Intensive Industries
47
Going forward, there is a need to build upon the current research and innovation track record in clean technology, and for an integrated national policy covering infrastructure, facilities, skills and finance to be put in place. The current government has recognised the need for cross departmental coordination and support. In this regard, BIS, DECC and DEFRA are jointly developing the government’s Green Economy Roadmap (GER), which aims to set out an integrated cross sectoral strategy. It is expected that the GER will set out the case for the business opportunities and economic benefits associated with the low carbon transition. The government’s role in creating a long term and stable framework for investment, through energy, environment and innovation policy is likely to be put at the heart of the strategy. The aim is to provide the necessary certainty for long term investments (10 years+), and to articulate how infrastructure, skills, finance and innovation will be delivered. Crucial will be the strategy to minimise the short term impacts on vulnerable sections of the economy, and ensure that UK trade and competitiveness do not suffer by the UK adopting higher unilateral emissions standards and energy costs than other economies. Also crucial is the need for dedicated government industry champions who thoroughly understand not only the constraints under which each industry operates but also how that industry interacts with is supply chain stakeholders. The CCC has called for better monitoring and information on the scale and effectiveness of low carbon innovation funding. It is estimated that during 2009/10 approximately £550 million public funding was allocated to low carbon RD&D of which £90 million was dedicated to RD&D for industry technologies and buildings (CCC.2010:19). Additional funding was provided but not allocated to any particular low carbon category and investments in basic science will benefit low carbon technologies amongst others. Deployment mechanisms also amounted to £5 billion of support including approximately £1.8 billion for buildings and industry. A better understanding of the role of UK against collaborate EU or Industry financed initiatives is also required.
Existing experience of low carbon support mechanisms Most of the respondents had some experience of UK, EU and Industry support mechanisms, although it should be noted that some did not have any experience. Those areas of support that had been accessed and were identified as being useful included:
! Government grants for R&D and implementation: ETSU (the former UK Government Energy Technology Support Unit) and its successor organisations (AEA Technology, Carbon Trust) for a long time provided support for energy efficiency activities, including 50% grants for R&D, Good Practice Guides, and financial support for best practice implementation (30%).
! Carbon Trust support for surveys and energy efficiency equipment. This was qualified by the focus that the CT has tended to give to small and medium enterprises (SME), which has excluded large parts of the energy intensive industries from accessing support. For example, the British Ceramic Confederation noted that while the CT interest free loan scheme had helped some smaller companies, the maximum amount had fallen from £500k to £100k limiting what could be achieved.
Technology Innovation for Energy Intensive Industries
48
! Regional assistance: A number of the respondents had benefited from regional agency support. These included Regional Development Agency funds for R&D – e.g. Yorkshire Forward funds for Sheffield Forgemasters, and Regional Selective Assistance Grants to support job creation aspects of energy intensive investments (e.g. to support INEOS’ investment in new cell rooms). GrowHow reported a 10% capital grant from One North East for energy efficiency improvements. A concern was that the Government was perceived as “picking winners” and other sectors had not benefitted.
! Enhanced Capital Allowances since 2008-09 were identified as providing useful relief for qualifying energy saving schemes;
! Some respondents had made applications to the Technology Strategy Board, but with limited success.
! Regulatory mechanisms: Rio Tinto Alcan identified the use of Renewable Obligation Certificates (ROCs) for the use of biomass in power generation. GrowHow noted the ability to bank credits under the EU ETS Phase II to support N2O abatement at its Billingham site.
Much of the support was accessed at the EU level, whether from EC or industry initiatives. Examples included:
! European Coal and Steel Community (ECSC) grants (until 2002) ! European Research Fund for Coal and Steel (RFCS) ! Various EU Framework Conventions and Research Programmes ! European Commission Ultra Low CO2 steelmaking programme (ULCOS)
Potential Areas for Government Support The future of the energy intensive sector in the UK is under increasing pressure from a range of environmental policy legislation. These industries have already been particularly exposed to the pass through of CO2 costs by the power generation sector under EU ETS Phase II. The proposed introduction of mechanisms such as the Carbon Price Floor (CPF), Electricity Market Reform (EMR) and CFDs for feed-in tariffs in place of the Renewables Obligation may raise power costs and place UK manufacturing at a competitive disadvantage in the short term until cost effective low carbon technologies become available. These dangers have been clearly set out in the Waters Wye report (Waters Wye 2011). If the full technological potential to decarbonise the industrial sector is to be realised, it is clear that considerable effort will need to be directed towards both commercialisation and R&D efforts. To date, the main focus has been on improving the efficiency of fossil fuel based industrial processes, rather than on the application of alternative energy sources, primarily due to relatively low energy costs. Innovation support is necessary to prove promising technologies both in energy efficiency and also in process emissions reductions so that they are ready for market, and so that banks / parent companies / other finance sources can have confidence in their investments. Additional support to
Technology Innovation for Energy Intensive Industries
49
R&D associated with key technologies is vital, particularly for those technologies that are still very early stage, such as electrolysis. Government can play a key role in buying down the risks associated with establishing demonstration plants. Industry already contributes significant resources to government through EUAs, electricity prices and other environmental taxation, and might expect a measure of hypothecation or revenue recycling to support low carbon development. Some of this already happens at EU level (such as with the UCLOS programme for the steel sector), but at a national level, government may seek to help bring through technologies, particularly those that link into the successful deployment of CCS. Hypothecation for products whose post manufacturing life cycles save or generate carbon free energy should also be considered in order to encourage UK production. If government is keen to ensure that carbon and energy prices are applied across the industrial manufacturing sector in a uniform manner, it might consider lowering the costs of domestic compliance (e.g. through free allocation of permits to the EU ETS) to protect those industries potentially most exposed, in terms of their energy intensity, their potential for product substitutes and their exposure to international trade. Of the sectors under review, Iron and Steel, Cement, Chemicals, Pulp and Paper, Cement, and Aluminium are most trade exposed. Border carbon adjustments (BCAs) have also been raised as a potential remedy, but are viewed by policy makers as problematic from the perspective of wider trade negotiations. They seem to enjoy little support among international manufacturers, who identify that they would not protect sectors from a loss of export competitiveness and may simply push competitiveness issues downstream, particularly in industries such as chemicals and steel. The resources available to industry should not, however, be ignored. Analysis by Climate Strategies22 reviews the costs of RD&D of transformative abatement technologies relative to various financial indicators of the Japanese steel sector. In particular, the report compares the costs of the Japanese COURSE50 programme and the European ULCOS project relative to aspects of the balance sheet and profit and loss accounts. The report calculates that funding requirements for COURSE50 and the first phase of ULCOS equates to 0.3% of EBIT, 0.5% of Capex and 0.9% of Tax. Phase 2 of ULCOS, and the putative demonstration of four CCS units over a decade, would require approximately 2% of EBIT, 3% of Capex or 5% or Tax. The breakthrough technology demonstration plant, financed over 5 years, would require around 5% of annual EBIT or Capex and just over 10% of Tax. Respondents were asked to identify how they thought government could best support the process of decarbonisation within their industries. Their responses coalesced around the following issues:
! Greater focus on industrial low carbon policy: It is felt that too much focus has been given to decarbonising the energy supply sector. More effort is required by government, for example, through its Green Economy Roadmap, in understanding how to maintain the competitiveness of the UK energy intensive industrial sector, whilst ensuring that it contributes fairly to the low carbon economy. For example, Alcan indicated that government should recognise that the needs of industry are different to those of the power sector. The value of the Renewable
22 See Climate Strategies (2011) – A sectoral approach, agreement and mechanism (SAAM) for the mitigation of greenhouse gas emissions in Japan’s Iron and Steel Industry.
Technology Innovation for Energy Intensive Industries
50
Obligation Certificates (ROCs) supplied should recognise that Rio Tinto Alcan will not be able to compete with other external aluminium producers, or internally within Rio Tinto if costs exceed existing costs of coal. GrowHow expressed its worry that too much focus was being placed on power sector CCS to the exclusion of potential industrial applications;
! Long term commitment: The Government must be able to demonstrate long-term credibility
in the setting and enforcement of long term targets. Given the uncertainty associated with technology development and costs, setting long term targets at the beginning of a decarbonisation process is problematic, with the potential for targets to be tightened or weakened in line with new information. Government should consider giving direction on how a long term target may develop or evolve, with sets of potential fallback options should technology efficiency or cost benchmarks not be met.
! Communal infrastructure renewal /development: The role of government in acting as a developer of the necessary shared infrastructure for low carbon power supply and CCS were seen as crucial. Respondents indicated that individual companies were neither able to carry the balance sheet financing, nor to underwrite the risk of under-utilisation. Government was also encouraged to ensure that CO2 utilisation was incentivised, for example lobbying for CO2 Utilisation in EU ETS phase IV. In particular, government should seek to ensure that industry CCS applications are not crowded out by the power sector, particularly when there are perhaps more attractive abatement options for electricity generation than for some industrial processes;
! Larger low carbon R&D programme: There is a clear demand for increased investment in low
carbon technologies for industry, in particular for large ticket items. Lucite, for example, identified a desire to see continued investment in CCS and centralised energy from waste projects, potentially through regional development structures e.g. via Tees Valley Unlimited. This may be funded through hypothecation of carbon revenues from the energy intensive sector, or recycling of energy taxes;
! Broaden energy efficiency schemes to large industry: Drawing upon their limited capacity to
access schemes such as those under the Carbon Trust, and based on previous positive experience in engaging with the government’s industry energy advice unit (ETSU and its successors, such as the Carbon Trust), respondents indicated that larger energy intensive industries should expect to receive similar levels of support from the CT and other organisations, from which they are currently excluded. Respondents identified an ongoing role for Good Practice guides. There was a particular need for smaller companies to get support to apply for larger grants and access funds at an EU level where appropriate;
! Support for technology demonstrations: A number of respondents stressed the need for UK
demonstration projects for a range of industrial technologies (including CCS), similar to EU initiatives such as UCLOS for the Iron and Steel sector. Seed money for smaller scale demonstrations was identified by the ceramics industry as key – to ensure that technologies are viable and optimised. This is seen as a very sensible use of limited Government funding. Government should also look at the development of low carbon technologies from an
Technology Innovation for Energy Intensive Industries
51
international perspective, supporting collaborative development economies of scale, whether on a sectoral basis or through EU platforms.
! Greater clarity on future energy and carbon prices: Given the need for a stable regulatory
environment to underpin long term capital and R&D investments, respondents urged Government to ensure long term visibility for existing and planned energy market regulations, including for example, (Climate Change Agreements (CCAs) Feed In Tariffs (FITs), Renewable Obligation Certificates (ROCs), Carbon floor price etc. There is recognition that government understands this need and is engaged in processes to set long term regulatory frameworks.
! Level playing field on energy costs: Respondents made a plea for UK government not to act
unilaterally in raising energy costs and taxes to meet climate change targets, as this was likely to have perverse consequences in terms of relocation of production, resulting in loss of jobs and skills within the UK economy and the potential for net increases in global emissions.
! Commitment not to export emissions to less regulated economies: Respondents warned
against the government engaging in a tacit policy of offshoring emissions, by discouraging emissions intensive industries. For example, the Chemical Industry Association pointed out that if PVC production shifted to China, CO2 emissions would be 4-5 times higher per tonne than in the UK. The proportion of imported emissions embedded in domestic consumption is rising. While business will inevitably migrate to low cost geographies for reasons other than carbon costs, the UK government should acknowledge that energy intensive industries are subject to particular pressures.
! Regulation for biomass feedstock: A regulatory framework would need to be set up to
ensure that the use of biomass feedstock is not monopolised by the power generation sector. Currently the power sector is most incentivised to draw down biomass through the renewable obligation and feed in tariffs. This has the potential to bid up the cost of biomass beyond what is economically feasible for industrial users. While this effect may be temporary, government may consider how this can be monitored over the medium to long term to ensure that the cost/benefits are similar for both electricity generation and industrial users.
! Capital Investment: Even though some of the energy intensive industries in the UK tend to
be part of large and relatively prosperous multinational corporations, they are still constrained due to competition between country sites. Access to longer term concessional capital would support the roll out of low carbon technologies in the UK. Lucite indicated that if capital could be deployed to reduce the payback period to < 3 years, then this would make a significant difference. The Green Investment Bank (GIB) is seen as a potentially useful mechanism, but further detail is required in terms of its mandate and operations. Respondents called for a clear industrial mandate for the GIB to support low carbon innovation in the energy intensive sector. A number of sectors (such as ceramics) had many smaller companies that had to rely on conventional banks for finance – which were unwilling to provide finance with the necessary longer paybacks. For these cases, “pay as you save”
Technology Innovation for Energy Intensive Industries
52
schemes, such as the Carbon Trust interest free loans were seen as very helpful. Wider applicability (to larger companies and larger loans) would be very helpful indeed.
! Broader recognition of Life Cycle Analysis benefits: Government should recognise that a carbon price alone may not overcome the barriers to wider low carbon transformation. Many highly carbon intensive sectors are crucial for delivering larger downstream supply chain benefits (for example more efficient renewable power generation, lighter vehicles, more thermally efficient glazing). There is currently no mechanism to recognise the potential downstream carbon benefits of energy intensively manufactured products once in use.
Industry Collaboration Although there are many areas where industry representatives can identify an enhanced role for state support, not all industry expectations centre on government policy. Many are focused on the potential for energy intensive industries to cooperate in achieving common goals. Indeed, this is already happening. For example, Lucite identified the PICCSI (Process Industry Carbon Capture and Storage Initiative) collaboration, including BOC, GrowHow, Huntsman, Lucite, & px Limited, along with other companies. NEPIC are coordinating studies on centralised energy from waste plants (syngas) in the NE region. In relation to carbon capture, Tata Steel has recognised that the role and configuration of CCS will be different for industry compared with the power sector. There are many opportunities for carbon capture and utilisation (e.g. to grow algae, carbonation of industrial residues), and Tata is already leading discussions between the steel, cement and aluminium industries. This may lead to a number of technology development and transfer opportunities. Co-location and improved integration of the industrial supply chain are also key priorities. It is possible to use one industry’s waste as another industry’s feedstock. For example, the UK cement industry already uses approximately 2 million tonnes of iron blast furnace slag instead of virgin raw materials, saving approximately 1 million tonnes of CO2 emissions per annum. The glass container sector remelts some 650,000 tonnes of glass cullet and could increase this were the quality to improve. There are, however multiple opportunities for improved sharing of information between industries on process modelling, improved heat recovery and approaches to CCS etc. There is also a need for a more active participation in this process by the relevant industry organisations, such as the Energy Intensive Users Group, the Manufacturers Climate Change Group, sectoral trade organisations, the Major Energy Users Council, the TUC and the industrial unions. Rio Tinto recognised the on-going need for strong coordination between the different sectors to influence government decisions on carbon and energy market policy (ROC review, carbon floor price). Finally, a number of respondents highlighted the French Exeltium power project where a consortium of energy intensive companies is providing funds to EDF to support the development of new nuclear power stations in return for long-term guaranteed lower energy cost supply. Several respondents
Technology Innovation for Energy Intensive Industries
53
felt this offered a model for cost effective long term supply side decarbonisation for the energy intensive sector, and that there was a role for government in helping to create a suitable enabling framework for such a deal to occur.
Conclusions In order to ensure a sustainable and long term future for the energy intensive sector in the UK, the report identifies the following conclusions:
1. Need for policy focus on low carbon manufacturing: There is a compelling rationale for government to focus on industrial low carbon manufacturing policy, in particular for the energy intensive sector. To date, the low carbon debate has been primarily focused on supporting power sector decarbonisation, particularly with regard to carbon capture and storage and switch to alternative fuels. Government should support industry carbon capture and storage demonstration in key sectors, and include industry more comprehensively in the UK CCS roadmap.
2. The phasing of energy and carbon costs to match the emergence of cost effective abatement opportunities is key: Business-as-Usual emissions projections for the energy intensive sector indicate that it will struggle to reduce its emissions significantly without transformative technologies. The abatement potential identified by the Climate Change Committee using best available current technologies (BAT) is only 16Mt or approximately 13% of current emissions by 2050. The electricity market reform and other environmental legislation may further impact on competitiveness through additional marginal costs on energy intensive sectors in the short to medium term. Potential exists for significant decarbonisation using new technologies in the medium to long term, but many industries already operate at BAT efficiencies, and new technology solutions are at least 10-15 years away, which may delay industry investment in low carbon technologies. In the interim, it will be difficult for industry to compensate for rising costs through marginal efficiency improvements, and many companies may face pressure to rebalance production to lower cost economies.
3. Broader package of regulatory, reform, policy support and finance may be required:
Given the clear need for breakthrough technologies to enable large scale abatement for the sectors reviewed, a key area of weakness is the historically poor performance within the UK of bridging the R&D and commercialisation divide. These breakthrough technologies require a long term commitment and there are real additional costs associated with placing energy intensive industries on a less carbon intensive footing. It is not clear that the unilateral adoption of higher energy and carbon prices will in itself be enough to deliver the required innovation and reduction in carbon intensity.
4. Cross sectoral cooperation: There are significant benefits to industry from increased focus
and cross-sectoral cooperation on low carbon opportunities. Several examples already exist of cross sector initiatives to develop and exploit CCS and utilise materials diverted from the
Technology Innovation for Energy Intensive Industries
54
waste stream as production inputs (e.g. cement clinker substitutes) in order to reduce costs and maximize efficiencies. There are also significant opportunities to exploit best practice developed in the UK in emerging markets.
5. Supportive policy framework: The potential exists for a win-win situation if a credible and
supportive policy framework can be developed for investment into the research, development and deployment (RD&D) of low carbon technologies. Investment in energy intensive manufacturing not only has the potential to achieve environmental targets, it can also help maintain and grow the UK value-added skills base, generate employment, support regional growth and economic rebalancing. This will require an open and ongoing dialogue between government industry and the trade unions.
6. Industrial mandate for the green investment bank (GIB): While some research indicates
that the costs of technology development in larger and more consolidated sectors represents only a small proportion of corporate resources (such as the UCLOS program in the steel sector) access to longer term capital investment would accelerate the deployment of low carbon technologies in the UK. Smaller companies may struggle to fund technology development on a similar scale, having a specific impact on sectors that are dominated by smaller companies, such as ceramics. Respondents called for a clear industrial mandate for the GIB to support investment in the low carbon innovation in the energy intensive sector.
7. Recognition of broader benefits of securing the energy intensive sectors: The energy
intensive industries have an important role to play not only in reducing their emissions to meet national greenhouse gas (GHG) targets, but also in supplying advanced materials required for building the low carbon economy. More balance is required on the potential for national level economic benefits of these sectors (GDP, jobs, technology base, and export opportunities). There is a need for a thorough assessment of the economic, employment, skills and fiscal benefits of securing the energy intensive industries in the UK for the long term to overcome barriers to a wider low carbon transition.
Technology Innovation for Energy Intensive Industries
55
Bibliography AEA, AEA Technology plc (2010) Analysing the Opportunities for Abatement in Major Emitting Industrial Sectors, Available http://www.aeat.co.uk/cms/assets/Documents/Final-Report-CCC.pdf
ALFED, Aluminium Federation Ltd. (2010) Annual Report 2010, Available http://www.alfed.org.uk/downloads/documents/0SKZSMV2QQ_722_Alfed_2010_Annual_Report_prf4_web.pdf
Alsema, E.A. (2001): Icarus-4 Sector study for the paper and board industry and the graphical industry. Report nr. NWS-E-2001-02, Universiteit Utrecht, Utrecht centre for Energy research, (UCE), Utrecht, July 2001, http://copernicus.geog.uu.nl/uce-uu/downloads/Icarus/Paper.pdf
Aluminium Association (unknown) The Aluminium Association Climate VISION Work Plan, Available http://www.climatevision.gov/sectors/aluminum/pdfs/workplan.pdf
Bayer (2005): Reaktivrektifikation, Reaktivextraktion, Membranreaktoren. Datenblatt, Bayer Technology Services, Leverkusen, October 2005, Available: http://www.bayertechnology.com/uploads/media/0308_300dpi.pdf
BCC, British Ceramic Confederation (2009) Response to OFGEM Project Discovery Consultation, 20 November 2009, Available: http://www.ofgem.gov.uk/MARKETS/WHLMKTS/DISCOVERY/Documents1/British%20Ceramis%20Confederation.pdf
Boersma, G. (2008): Ammoniak maken met windenergie, Technisch weekblad, 25 October 2008.
British Cement Association (2009): Novel Cements: Low energy, low carbon cements. BCA Factsheet 12. Updated January 2009. Available: http://cement.mineralproducts.org/documents/fact%20sheet%2012%20%20novel%20cements%20-%20low%20energy%20low%20carbon%20cements.pdf Carbon Trust (2007): Accelerating innovation in low carbon technologies. Available, http://www.carbontrust.co.uk/Publications/pages/publicationdetail.aspx?id=CTC618&respos=0&q=accelerating+innovation+in+low+carbon+&o=Rank&od=asc&pn=0&ps=10 Carbon Trust (2009): Focus for success: A new approach to commercialising low carbon technologies. Available, http://www.carbontrust.co.uk/Publications/pages/publicationdetail.aspx?id=CTC752&respos=2&q=accelerating+innovation+in+low+carbon+&o=Rank&od=asc&pn=0&ps=10 Carbon Trust (2011): Industrial Energy Efficiency Accelerator - Guide to the brick sector (CTG043). Available: http://www.carbontrust.co.uk/publications/pages/publicationdetail.aspx?id=CTG043 Castricum, H.L (2008): Breakthrough in pervaporation membrane for dehydration of solvent streams. ECN-V--08-015, ECN, Petten, 2008 Jun 15.
Technology Innovation for Energy Intensive Industries
56
Choate, W., J. Green (2003) US Energy Requirements for Aluminium Production: Historical Perspective, Theoretical Limits and New Opportunities, Available http://www.secat.net/docs/resources/US_Energy_Requirements_for_Aluminum_Production.pdf
Climate Change Committee (2010): Building a low-carbon economy- the UK’s innovation challenge, Available, http://hmccc.s3.amazonaws.com/CCC_Low-Carbon_web_August%202010.pdf
Climate Change Committee (2010): Fourth Carbon Budget. Executive Summary, Available http://downloads.theccc.org.uk.s3.amazonaws.com/4th%20Budget/4th-Budget_Exec%20Summary.pdf
CPI, Confederation of Paper Industries (2009a) Paper and the Forest: Fact Sheet, Available http://www.paper.org.uk/information/factsheets/paper_and_the_forest.pdf
CPI, Confederation of Paper Industries (2009b) Statistics: CPI Industry Facts 2009, Available http://www.paper.org.uk/information/pages/statistics.html
Croezen, H., M. Korteland (2010). A long-term view of CO2 efficient manufacturing in the European region.CE Delft, June 2010
CSI, Cement Sustainability Initiative (2008) Getting the Numbers Right, World Business Council, Available [http://www.wbcsdcement.org/gnr-2008/index.html]
CWC, Clean Washington Centre (1996) Best Practice in Glass Recycling: Saving Energy with Cullet and Preheating, Available http://www.cwc.org/gl_bp/gbp3-0104.htm
Daniëls, B.W., (2002): Transition Paths towards CO2 Emission Reduction in the Steel Industry. Proefschrift, Rijksuniversiteit Groningen. 18 November 2002
Daniëls, B.W., J.C.M. Farla (coord.) (2006): Optiedocument energie en emissies 2010/2020. ECN-C--05-105/MNP 7730001038, ECN & MNP, Petten/Bilthoven, March 2006
DECC, Department of Energy and Climate Change (2009) EU Emissions Trading System (EU ETS): UK 2008 results, Available http://www.decc.gov.uk/assets/decc/what%20we%20do/global%20climate%20change%20and%20energy/tackling%20climate%20change/emissions%20trading/eu_ets/publications/1_20090924140932_e_@@_euetsukresults2008.pdf
DECC, Department of Energy and Climate Change (2009). Low Carbon Industrial Strategy: A vision. Available, http://www.decc.gov.uk/assets/decc/178_20090306140433_e_@@_file50373.pdf
Dimian, A.C. (2004): Entrainer-based reactive distillation for the synthesis of fatty acid esters (APC.6256). STW Project nummer: apc6256, Universiteit van Amsterdam, 2004, http://www.stw.nl/Projecten/A/apc/.
Dorgan R.J., et.al. (2003): Energy Saving Separations Technologies for the Petroleum Industry. Chemical Engineering and Petroleum Refining Dept., Colorado School of Mines, Golden, Colorado,
Technology Innovation for Energy Intensive Industries
57
March 27, 2003, http://www1.eere.energy.gov/industry/petroleum_refining/pdfs/separations_final_report.pdf
EA, Environment Agency (2005) Measuring Environmental Performance: Sector Report for the Cement Industry, Version 1, November 2005, Available http://publications.environment-agency.gov.uk/pdf/GEHO1105BJVK-e-e.pdf
EC, European Commission (2007) CO2 Capture and Storage Projects, Office for Publications of the European Communities, Luxembourg
EC, European Commission (2010) Reference Document on Best Available Techniques in the Cement, Lime and Magnesium Oxide Manufacturing Industries, Available http://eippcb.jrc.ec.europa.eu/reference/brefdownload/download_CLM.cfm
Element Energy (2010) Potential for the Application of CCS to UK Industry and Natural Gas Power Generation for Committee on Climate Change, Final Report Issue 3, Available http://www.ccsassociation.org.uk/docs/2010/Element%20Energy%20report%20on%20CCS%20in%20gas%20and%20industry%20June%202010.pdf
Ernest Orlando Lawrence Berkeley National Laboratory (2009) Energy Efficiency Improvement and Cost Saving Opportunities for the Pulp and Paper Industry, Available http://www.energystar.gov/ia/business/industry/downloads/Pulp_and_Paper_Energy_Guide.pdf
FAO, Food and Agriculture Organisation of the United Nations (2011) FAOStat: ForesSTAT, Available http://faostat.fao.org/site/626/DesktopDefault.aspx?PageID=626#ancor
GMIC, Glass Manufacturing Industry Council (2004a) Glass Facts: Oxy-gas Fired Submerged Combustion Melter, April 2004, Available http://www.gmic.org/Glass%20Facts/Oxy-Gas%20Fired%20Submerged%20Combustion%20Melter.pdf
GMIC, Glass Manufacturing Industry Council (2004b) Glass Melting Technology: A Technical and Economic Assessment, Available http://www.govforums.org/glass/documents/tea_doc.pdf
Hauser, H. (2010). The Current and Future Role of Technology and Innovation Centres in the UK. Crown Copyright. Available, http://www.bis.gov.uk/assets/biscore/innovation/docs/10-843-role-of-technology-innovation-centres-hauser-review
Horssen, A. van; Kuramochi, T.; Jozwicka, M.; Koornneef, J.; Harmelen, T. van; Ramirez Ramirez, A. (2009): The impacts of CO2 capture technologies in power generation and industry on greenhouse gases emissions and air pollutants in the Netherlands. TNO/UU rapport, 20 November 2009, BOLK II
Hydroworld (2009) Renewable Fuels: Manufacturing Ammonia from Hydropower, Available http://www.hydroworld.com/index/display/article-display/0927773395/articles/hydro-review/volume-28/issue-7/articles/renewable-fuels__manufacturing.html
IAI (2010) IAI Statistics, Available http://www.world-aluminium.org/Statistics/Current+statistics
Technology Innovation for Energy Intensive Industries
58
ICE, Institute of Civil Engineers (2009) ICE Manual of Construction Materials, Volume 1, Thomas Telford Ltd, London
IEA, International Energy Agency (2007) Low CO2 Steels: ULCOS Project, IEA Deployment Workshop, October 2007, Available http://www.iea.org/work/2007/demand_side/borlee.pdf
IEA, International Energy Agency (2008) CO2 Capture and Storage: A Key Carbon Abatement Option, Available http://www.iea.org/textbase/nppdf/free/2008/CCS_2008.pdf
IEA, International Energy Agency (2009) Energy Technology Transitions for Industry: Strategies for the Next Industrial Revolution, OECD/IEA, Paris, France
IEA, International Energy Agency (2010) Energy Technology Systems Analysis Programme: CO2 Capture & Storage, Technology Brief E14, October 2010, Available http://www.etsap.org/E-techDS/PDF/E14_%20CCS%20draft%20oct2010_%20GS-gc_OK.pdf
IPCC, Intergovernmental Panel on Climate Change (2005) Special Report on Carbon Dioxide Capture and Storage
IPCC, Intergovernmental Panel on Climate Change (2007) Climate Change 2007: Working Group I: The Physical Science Basis, 2.10.2 Direct Global Warming Potentials, Available http://www.ipcc.ch/publications_and_data/ar4/wg1/en/ch2s2-10-2.html
Kauranen, P. (2008) Oxygen Carriers for Power Efficiency, Tekes, Functional Materials Scientific Day, Helsinki, 10 September
Kobayashi, H., J. Visus, P. Zucca, A. D’Etrorre (2006) Progress in Reducing Energy and CO2 by Combining a Batch/Cullet Preheater with an Oxy-Fuel Fired Furnace, XXI A.T.I.V. Conference Parma Italy, September 2006, Available http://praxair.de/praxair.nsf/AllContent/BFE9394FFD088DBD8525723B006F5E0B/$File/P-9864%20%20-%20%20PROGRESS%20IN%20REDUCING%20ENERGY%20AND%20CO2%20BY%20COMBINING%20A%20BATCH-CULLET%20PREHEATER%20WITH%20AN%20OXY-FUEL%20FIRED%20FURNACE.PDF
Kop, L. (2007): Papier- en kartonindustrie halveert energiegebruik. Utilities, January 2007.
Kroon, P., P. Lako, J.A.Z. Pieterse (2009): Technologieverkenning – kansrijke nieuwe technieken voor minder emissies naar de lucht in 2030. August 2009, ECN-E--09-047
Kuramochi, T. (2010): Personal communication. Universiteit Utrecht, March 2010
Lako, P. (2004): Transport en opslag van CO2, ECN, Petten, ECN-I--06-006, February 2006
Lako, P. (2009) Energy Conservation Potential of the Nitrogen Fertiliser Industry, Energy Research Centre of the Netherlands, ECN-E-09-011, March 2009
Lee, K.H., et. al. (2007): Drying Performance Simulation for the Basic Design of a Heat Pump Dryer. Transactions of the Korean Society of Mechanical Engineers. B, Volume: 31, Issue: 10, 2007 Oct 15
Technology Innovation for Energy Intensive Industries
59
Manning, C.P., R.J. Fruehan: (2001): Emerging Technologies for Iron and Steel making. JOM, 53 (10) (2001), pp. 20-23, http://www.tms.org/pubs/journals/JOM/0110/Manning-0110.html
Mensink, M. (2007): Speaking the same language; The way forward in tracking industrial Energy efficiency and CO2 Emissions. Tracking Industrial Energy Efficiency and CO2 Emissions: The Way Forward. IEA, Paris, 1st and 2nd of October 2007
MIDREX (2008) Global Plant Supply: Green Steelmaking, Available [http://www.midrex.com/handler.cfm/cat_id/167/section/global]
MPA, Mineral Products Association (2011) Climate: Carbon Management, Available [http://www.mineralproducts.org/sustainability/carbon-management.html]
Neville, A.M. (1995) Properties of Concrete: Fourth Edition, Harlow, Longman Group Limited. 653-674
Pérez-Ramírez, J. (2007): Prospects of N2O emission regulations in the European fertilizer industry. Applied Catalysis B: Environmental, 2007, 70, p. 31-35
PI (2008): European Roadmap for Process Intensification. Action Group Process Intensification (PI) EnergieTransitie Platform Ketenefficiency, SenterNovem, 2008, http://www.senternovem.nl/innovatietrajectchemie/roadmap_procesintensificatie/index.asp
Sundkvist, S., T. Griffin, N. Thorshaug (2001) AZEP- Development of an Integrated Air Separation Membrane, Second Nordic Mini-symposium, on Carbon Dioxide Capture and Storage, Available http://www.entek.chalmers.se/~anly/symp/symp2001.html
TUC (2009), A Green and Fair Future: for a just transition to a low carbon economy. Touchstone Report: www.tuc.org.uk
TSB, Technology Strategy Board. (2011). Technology and innovation centres: a prospectus. Available, http://www.innovateuk.org/_assets/pdf/corporate-publications/prospectus%20v10final.pdf
Tzimas, E., A. Georgakaki, C. Garcia Cortes, S.D. Peteves (2005) Enhanced Oil Recovery Using Carbon Dioxide in the European Energy System, Institute for Energy, Petten, Netherlands, Available http://ie.jrc.ec.europa.eu/publications/scientific_publications/2005/EUR21895EN.pdf
ULCOS (2011) ULCOS Research: Top Gas Recycling, Available [http://www.ulcos.org/en/research/blast_furnace.php]
UNIDO, United Nations Industrial Development Organisation (2010) Global Industrial Energy Efficiency Benchmarking: An Energy Policy Tool, Available http://www.unido.org/fileadmin/user_media/Services/Energy_and_Climate_Change/Energy_Efficiency/Benchmarking_%20Energy_%20Policy_Tool.pdf
Viforr, S. (2008): Enzymatic pre-treatment of wood chips for energy reductions at mechanical pulp production - A review. (Deliverable 1.1.11 of the Ecotarget project). STFI-Packforsk AB Stockholm,

Technology Innovation for Energy Intensive Industries
60
Sweden, July 2008, http://www.ecotarget.com/news/ECOTARGET%20Technical%20deliverables%20D1.1.11.pdf
Waters Wye Associates (2010) The Cumulative Impact of Climate Change Policies on UK Energy Intensive Industries - Are Policies Effectively Focused? Available www.tuc.org.uk/extras/wwastudy.pdf
61
p
Contact Details
Director: Jon Price
Centre for Low Carbon Futures
IT Centre
York Science Park
York YO10 5DG
Telephone: +44 (0)1904 567714
www.lowcarbonfutures.org
Twitter: #clcfprojects
Whilst reasonable steps have been taken to ensure that the information contained within this publication is correct, the
authors, the Centre for Low Carbon Futures, its agents, contractors and sub-contractors give no warranty and make no
representation as to its accuracy and accept no liability for any errors or omissions. Nothing in this publication shall be
construed as granting any licence or right to use or reproduce any of the trademarks, service marks, logos, copyright or any
proprietary information in any way without the Centre for Low Carbon Futures’ prior written permission. The Centre for Low
Carbon Futures enforces infringements of its intellectual property rights to the full extent permitted by law. This report implied
or otherwise is not representative of the views of the Centre for Low Carbon Futures or any of our supporters.
About us
The Centre for Low Carbon Futures is a collaborative membership organisation that focuses on
sustainability for competitive advantage. Founded by the Universities of Hull, Leeds, Sheffield and
York, the Centre brings together multidisciplinary and evidence-based research to both inform policy
making and to demonstrate low carbon innovations. Our research themes are Smart Infrastructure,
Energy Systems and the Circular Economy. Our activities are focused on the needs of business in
both the demonstration of innovation and the associated skills development. Registered in the UK at
Companies House 29th September 2009 Company No: 7033134.
CLCF is grateful for funding and support from Accenture, the Beijing Institute of Technology, the
Energy Intensive Users Group, the Regional Development Agency, the Trades Union Congress, the
UK Department of Climate Change, the University of Hull, the University of Leeds, the University of
Sheffield and the University of York.