Embed Size (px)
Citation preview
TELAAH INDUKSI ACTH TERHADAP KONSENTRASI KORTIKOSTERON DALAM DARAH DAN FESES PADA
TIKUS JANTAN SPRAGUE-DAWLEY
HARRY SISWANTO
POGRAM STUDI BIOKIMIA
FAKULTAS MATEMATIKA DAN ILMU PENGETAHUAN ALAM INSTITUT PERTANIAN BOGOR
BOGOR 2007
TELAAH INDUKSI ACTH TERHADAP KONSENTRASI KORTIKOSTERON DALAM DARAH DAN FESES PADA
TIKUS JANTAN SPRAGUE-DAWLEY
HARRY SISWANTO
Skripsi sebagai salah satu syarat untuk memperoleh gelar
Sarjana Sains pada Program Studi Biokimia
POGRAM STUDI BIOKIMIA FAKULTAS MATEMATIKA DAN ILMU PENGETAHUAN ALAM
INSTITUT PERTANIAN BOGOR BOGOR
2007
TIME-PROFILE INVESTIGATION OF CORTICOSTERONE RELEASE IN BLOOD AND FAECES AFTER EXOGENUS ADMINISTRATION OF
ACTH IN MALE SPRAGUE-DAWLEY RATS
HARRY SISWANTO
Skripsi As a partial fullfillment of the requirement
for the degree of Bachelor Science in Study Program of Biochemistry
STUDY PROGRAM OF BIOCHEMISTRY FACULTY OF MATHEMATIC AND NATURAL SCIENCE
BOGOR AGRICULTURAL UNIVERSITY BOGOR
2007
ABSTRAK HARRY SISWANTO. Telaah Induksi ACTH Terhadap Konsentrasi Kortikosteron Dalam Darah dan Feses pada Tikus Jantan Sprague-Dawley. Dibimbing oleh SULISTIYANI dan IRMA SUPARTO.
Telaah kenaikan konsentrasi kortikosteron dalam darah dan feses per satuan waktu setelah induksi ACTH penting untuk mengembangkan penggunaan kortikosteron sebagai indikator stres. Dalam hal ini, pengambilan darah secara manual menjadi kendala karena mengakibatkan skresi kortikosteron sehingga menyulitkan penentuan kondisi normal kortikosteron. Penelitian ini bertujuan untuk menentukan konsentrasi kortikosteron dalam darah dan feses setelah induksi ACTH.
Tikus jantan Sprague-Dawley dibagi menjadi empat kelompok, yaitu satu kelompok kontrol (tanpa injeksi) dan tiga kelompok yang masing-masing diinjeksi secara intravena oleh BSA 5 mg/kg, ACTH 10 µg/kg, dan ACTH 100 µg/kg. Pengambilan darah dilakukan secara otomatis menggunakan Accusampler®, sehingga konsentrasi kortikosteron pada keadaan normal dapat diketahui.
Kenaikan konsentrasi kortikosteron dalam darah setelah diinduksi oleh ACTH 10 µg/kg dan ACTH 100 µg/kg terjadi hanya dalam waktu tiga menit. Induksi ACTH dengan konsentrasi berbeda tidak mempengaruhi konsentrasi maksimal kortikosteron, tetapi mempengaruhi durasi sekresi kortikosteron darah. Konsentrasi maksimal kortikosteron dalam darah berada pada interval 200-250 ng/ml. Ekskresi kortikosteron melalui feses terjadi dalam rentang waktu 4-12 jam. Hanya 20% dari jumlah kortikosteron darah yang diekskresikan melalui feses sehingga penggunaan feses sebagai indikator stres memiliki sensitifitas yang rendah.
ABSTRACT
HARRY SISWANTO. Time-Profile Investigation of Corticosterone Release in Blood and Faeces After Exogenus Administration of ACTH in Male Sprague-Dawley Rats. Under the direction of SULISTIYANI and IRMA SUPARTO.
The investigation of the time-profile from corticosterone levels increase in rats have not been reported so far, whereas it is essential in order to use corticosterone as a stress marker. Manual blood sampling however, results in corticosterone secretion which will effect normal corticosterone concentration determination. The aim of the present study is to investigate the time-profile of corticosterone level increases in serum and feces after exogenous administration of ACTH.
Male Sprague-Dawley rats were randomly divided into four treatment groups. One group was for control (no injection), three group were injected each with BSA 5 mg/kg, ACTH 10 µg/kg, and ACTH 100 µg/kg. The present study used Accusampler® as an automated blood sampler.
After exogenous administration of ACTH, there was a rapid corticosterone increase in serum within three minutes. After both 10 and 100 µg/kg ACTH injection, it was found that the maximum level of corticosterone increase in blood was almost similar, which about 200-250 ng/ml. The difference was shown in the duration. Only 20% blood corticosterone were excreted in feces. The fecal corticosterone increase induced by ACTH could be observed 4-12 hours.
Judul : Telaah Induksi ACTH Terhadap Konsentrasi Kortikosteron Dalam Darah dan Feses pada Tikus Jantan Sprague-Dawley
Nama : Harry Siswanto NIM : G44103054
Disetujui
drh. Sulistiyani, M.Sc, Ph.D Dr. dr. Irma Suparto, M.S. Ketua Anggota
Diketahui
Dr. drh. Hasim, DEA Dekan Fakultas Matematika dan Ilmu Pengetahuan Alam
Tanggal lulus:
PRAKATA
Puji dan syukur penulis panjatkan kepada Tuhan Yang Maha Pemurah, karena hanya oleh berkat kebaikan dan kemurahan-Nya penulis dapat menyelesaikan karya ilmiah ini. Tema yang dipilih dalam penelitian ini adalah Telaah Induksi ACTH Terhadap Konsentrasi Kortikosteron Dalam Darah dan Feses pada Tikus Jantan Sprague-Dawley. Karya ilmiah ini disusun berdasarkan hasil penelitian yang telah dilaksanakan sejak bulan April sampai Agustus 2007 di Laboratorium Division of Comparative Medicine, Department of Neuroscience, Uppsala University, Uppsala, Swedia.
Penulis mengucapkan terimakasih kepada drh. Sulistiyani, M.Sc., Ph.D, dan Dr. dr. Irma Suparto, M.S. selaku komisi pembimbing atas segala ilmu dan bimbingan yang diberikan kepada penulis, serta kepada Klas Abelson, Ph.D. selaku pengawas atas bantuan dan bimbingan yang telah diberikan selama penulis berada di laboratorium. Penulis juga menyampaikan terima kasih kepada keluarga di rumah serta seluruh teman Biokimia 40 atas perhatian dan dukungan yang telah diberikan.
Akhir kata penulis sangat menyadari bahwa karya ilmiah ini masih memiliki kekurangan, karena itu dengan rendah hati penulis mengharapkan kritik dan masukan agar hasil dari penelitian ini nantinya dapat berguna bagi siapa saja yang membutuhkan. Semoga karya ilmiah ini bermanfaat untuk kemajuan di bidang ilmu pengetahuan.
Bogor, November 2007
Harry Siswanto
RIWAYAT HIDUP
Penulis lahir dan dibesarkan di Jakarta pada tanggal 14 November 1984 dari pasangan Hariwanli Suparta dan Lindawati Simons. Tahun 2003 penulis lulus dari SMU Negeri 78, Jakarta. Pada tahun yang sama, penulis lulus seleksi masuk Institut Pertanian Bogor (IPB) melalui jalur Seleksi Penerimaan Mahasiswa Baru (SPMB) pada Program Studi Biokimia, yang pada waktu itu masih tergabung dengan Departemen Kimia, Fakultas Matematika dan Ilmu Pengetahuan Alam (FMIPA).
Selama mengikuti perkuliahan, penulis pernah menjadi asisten praktikum Fisika Dasar pada tahun akademik 2005/2006. Penulis juga pernah melaksanakan Praktik Kerja Lapangan (PKL) di Laboratorium Bioteknologi, Balai Besar Riset Pengolahan Produk dan Bioteknologi Kelautan dan Perikanan (BBRPPBKP), Jakarta selama periode Juli sampai Agustus 2006. Selain itu penulis pernah aktif di beberapa organisasi kemahasiswaan, antara lain Persekutuan Mahasiswa Kristen (PMK) dan Community of Research and Education in Biochemistry (CREB’s) pada periode kepengurusan 2005/2006. Selama periode April 2007, penulis menjadi peserta kuliah Federation of European Laboratory Animal Science Association (FELASA Course) kategori C di Biomedical Center (BMC), Uppsala University, Uppsala, Swedia.
DAFTAR ISI
Halaman
DAFTAR GAMBAR ....................................................................................... x
DAFTAR LAMPIRAN.................................................................................... x
PENDAHULUAN ........................................................................................... 1
TINJAUAN PUSTAKA Hormon Adrenokortikotropika (ACTH).............................................. 2 Kortikosteron ...................................................................................... 2 Enzyme Linked Immunosorbent Assay (ELISA).................................. 3 Accusampler®....................................................................................... 4
BAHAN DAN METODE Bahan dan Alat..................................................................................... 5 Metode ................................................................................................. 5
HASIL DAN PEMBAHASAN Sampel Darah....................................................................................... 7 Sampel Feses........................................................................................ 8
SIMPULAN ..................................................................................................... 8
DAFTAR PUSTAKA ...................................................................................... 8
LAMPIRAN..................................................................................................... 11
CONTENTS
Page
FIGURE LIST.................................................................................................. x
APPENDIX LIST ............................................................................................ x
INTRODUCTION ........................................................................................... 1
LITERATURE REVIEW Adrenocorticotropic Hormone (ACTH)............................................... 2 Corticosterone ................................................................................... 2 Enzyme Linked Immunosorbent Assay (ELISA) ................................ 3 Accusampler®....................................................................................... 4
MATERIAL AND METHOD Material and Instrument ....................................................................... 5 Research Design and Method .............................................................. 5
RESULT AND DISCUSSION Blood Samples ..................................................................................... 7 Faecal Samples..................................................................................... 8
CONCLUSSION.............................................................................................. 8
REFERENCES................................................................................................. 8
APPENDIXES ................................................................................................. 11
DAFTAR GAMBAR
Halaman
1 Mekanisme hormonal stres ........................................................................ 2
2 Struktur kimia kortikosteron ...................................................................... 3
3 Mikrotiter ELISA....................................................................................... 3
4 Contoh berbagai hasil ELISA .................................................................... 3
5 Instrumen Accusampler® ........................................................................... 4
6 Grafik hubungan antara konsentrasi koertikosteron terhadap waktu pada sampel darah............................................................................................... 7
7 Grafik hubungan antara konsentrasi koertikosteron terhadap waktu pada sampel feses ............................................................................................... 8
8 Grafik hubungan antara konsentrasi koertikosteron terhadap waktu pada sampel feses setelah merata-ratakan sampel feses pada jam ke 8 dan 12..
DAFTAR LAMPIRAN
Halaman
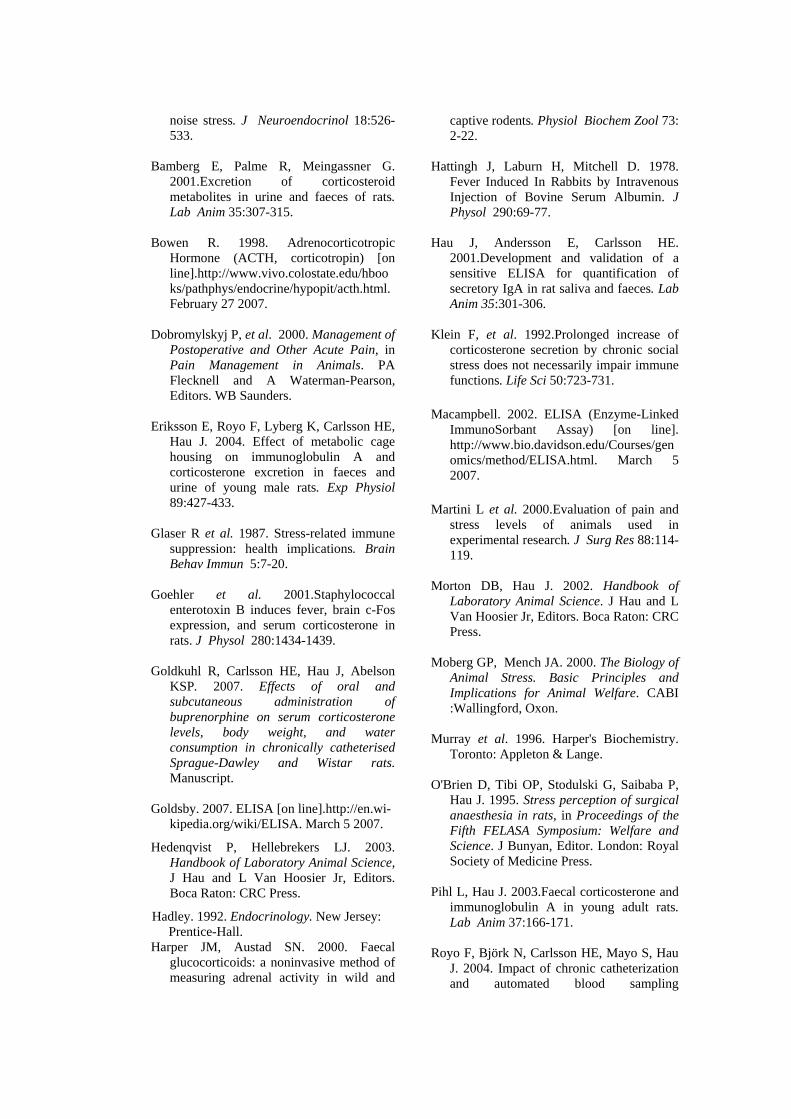
1 Diagram alir penelitian .............................................................................. 12
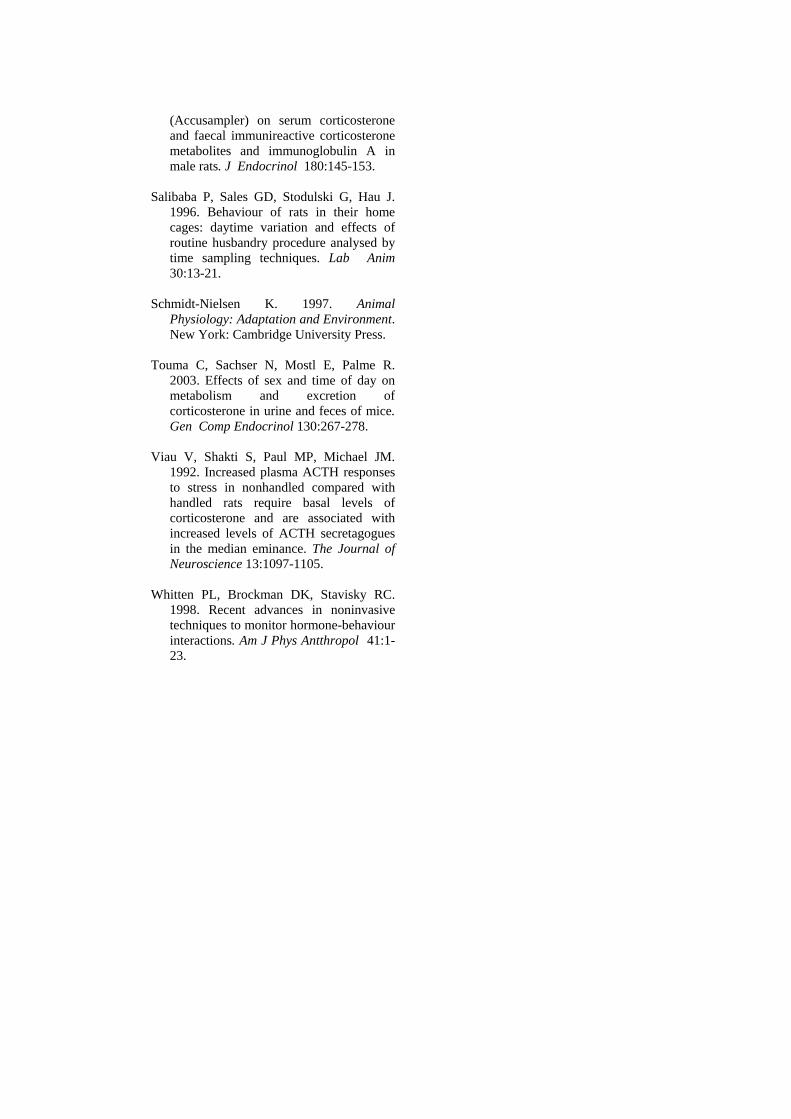
2 Diagram alir pembedahan ......................................................................... 13
3 Diagram alir analisis kortikosteron ............................................................ 14
4 Diagram alir ELISA ................................................................................... 15
5 Data sampel darah kelompok perlakuan 1 (tanpa injeksi) ....................... 16
6 Data sampel darah kelompok perlakuan 2 (injeksi BSA 5 mg/kg)............ 17
7 Data sampel darah kelompok perlakuan 3 (injeksi ACTH 10 µg/kg) ....... 18
8 Data sampel darah kelompok perlakuan 4 (injeksi ACTH 100 µg/kg) ..... 19
9 Data sampel feses kelompok perlakuan 1 (tanpa injeksi) .......................... 20
10 Data sampel feses kelompok perlakuan 2 (injeksi BSA 5 mg/kg) ............ 21
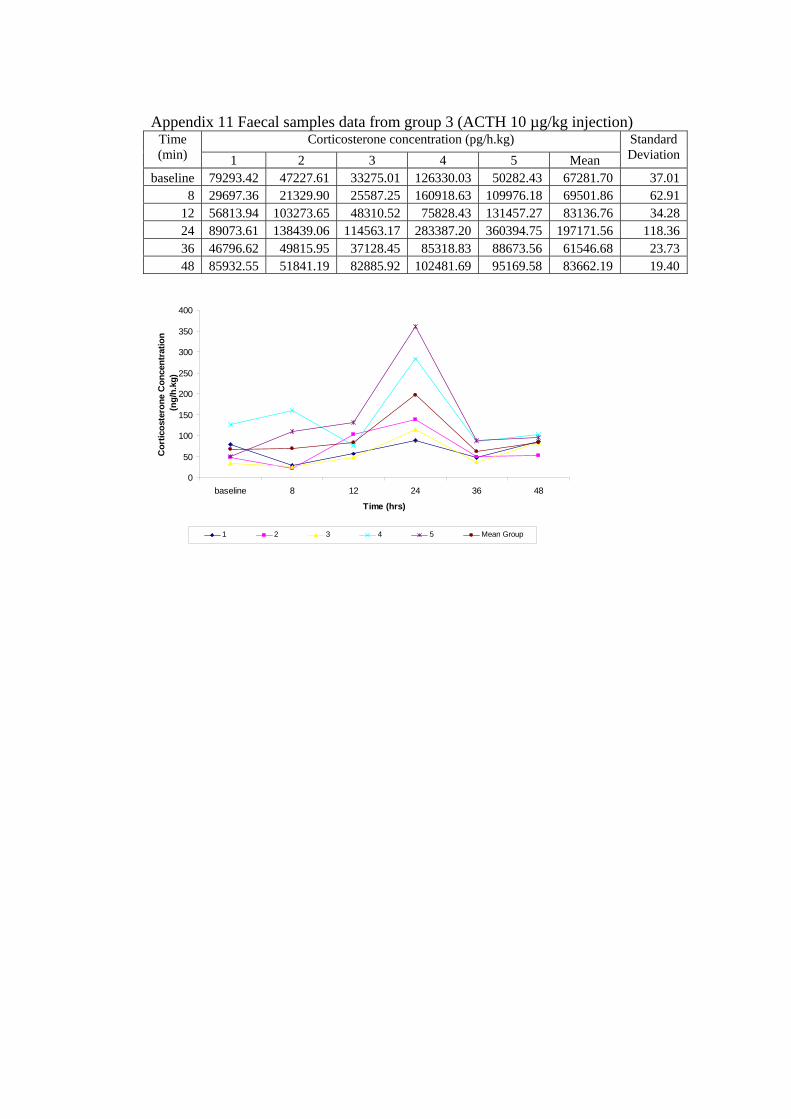
11 Data sampel feses kelompok perlakuan 3 (injeksi ACTH 10 µg/kg) ....... 22
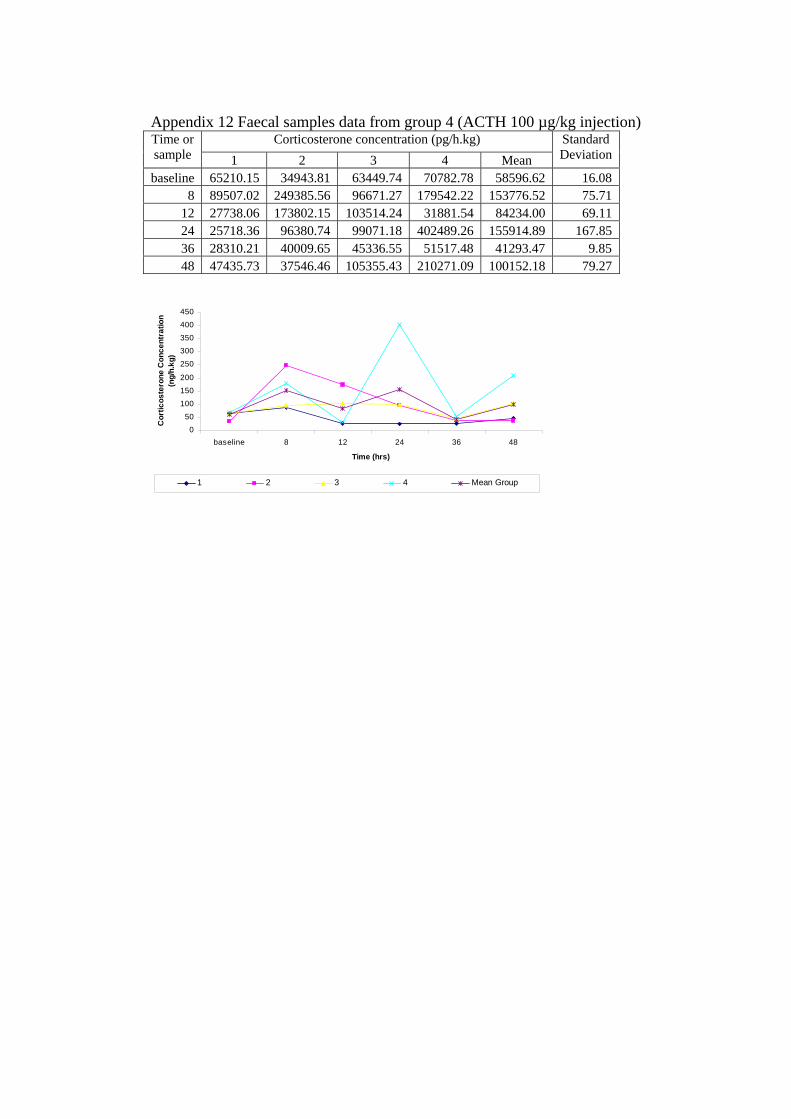
12 Data sampel feses kelompok perlakuan 4 (injeksi ACTH 100 µg/kg) ..... 23
13 Hasil statistik pada sampel darah ............................................................... 24
14 Hasil statistik pada sampel feses ................................................................ 25
8
FIGURE LIST
Page
1 HPA axis .................................................................................................... 2
2 Chemical structure of corticosterone ......................................................... 3
3 An ELISA plate.......................................................................................... 3
4 Example of ELISAs result in experiment .................................................. 3
5 An Accusampler® system........................................................................... 4
6 Corticosterone concentration in blood samples each group....................... 7
7 Corticosterone concentration in faecal sample each group........................ 8
8 Corticosterone concentration in faecal sample each group after determined the average of both time points 8 and 12 hours ......................
APPENDIX LIST
Page
1 Research diagram ...................................................................................... 12
2 Surgical diagram ....................................................................................... 13
3 Corticosterone analysis diagram ................................................................ 14
4 The manual of commercial Correlate-ELISA kit for corticosterone ......... 15
5 Blood samples data from group 1 (no injection) ....................................... 16
6 Blood samples data from group 2 (BSA 5 mg/kg injection)...................... 17
7 Blood samples data from group 3 (ACTH 10 µg/kg injection) ................ 18
8 Blood samples data from group 4 (ACTH 100 µg/kg injection) .............. 19
9 Faecal samples data from group 1 (no injection) ...................................... 20
10 Faecal samples data from group 2 (BSA 5 mg/kg injection) .................... 21
11 Faecal samples data from group 3 (ACTH 10 µg/kg injection) ................ 22
12 Faecal samples data from group 4 (ACTH 100 µg/kg injection) .............. 23
13 Statistic each time point compared to it baseline from blood sample......... 24
14 Statistic each time point compared to it baseline from faecal sample ........ 25
8
INTRODUCTION Stress in laboratory animals is an
obstructive circumstance in most experi-mental conditions, since stressors signi-fycantly alter the normal physiology and metabolism, thereby increase variation within and between individual animals. This makes stress a major source of experimental error (Hau et al 2001, Morton et al 2002). Persisting stress is accompanied by several adverse effects on most homeostatic mechanisms of the body, including the immune system, the endocrine system, and the reproductive system. This results in an increased susceptibility to infectious diseases, reduced growth rate and/or body weight loss, and reduced fecundity (Glaser et al 1987, Klein et al 1992, Moberg et al 2000). Stress must therefore be considered not only as a confounding variable in experimental results, but also as a major cause of suffering in laboratory animals, and to strive for reduction of stressful conditions is essential during normal husbandry as well as during and after experimental procedures.
In order to assess and recognise stress in laboratory animals, evaluation of various clinical signs and behavioural parameters can be undertaken, such as body weight gain, food and water consumption, urination, defecation, activity, posture, vocalisation etc. (Morton et al 2002, Martini et al 2000). To complement behavioural studies, stress can also be assessed by quantifying different endogenous stress markers, of which the most commonly investigated are corticosteroids. A stressful stimulus results in an activation of the hypothalamic pituitary adrenal (HPA) axis. This triggers a release of adrenocorticotrophic hormone (ACTH), which in turn results in a release of corticosteroids from the adrenal cortex (Morton et al 2002, O'Brien et al 1995, Whitten et al 1998). The biologically active corticosteroids are generally cortisol or corticosterone depending on species. In rats and mice, the predominant corticosteroid is corticosterone (Bamberg et al 2001).
The level of corticosteroids can be investigated in several ways. Non-invasive measures may be obtained by quantifying corticosteroid metabolites excreted in faeces. This method has been shown to be useful to assess preceding stress in numerous species including rats (Bamberg et al 2001, Pihl et al 2003) and mice (Harper et al 2000, Touma et al 2003). Corticosteroids can also be
quantified directly from blood samples, which can be obtained via either manual or automated sampling. Manual sampling requires no surgical procedure in order to obtain blood, but is associated with direct interaction with the animal and causes a stress response itself. In this context, automated blood sampling is preferable, since this method enables blood sampling without any interference with the animal during sampling. Abelson et al (2005) and Royo et al (2004) have evaluated the use of automated blood sampling for stress marker measurements, and it has been found to be a useful tool for this purpose.
Although the principle of the HPA-axis is well known and has been studied in numerous publications, time-profile from corticosterone levels increase in rats after exogenous administration of ACTH have not been reported so far. This may be explained by the difficulties that occur during blood corticosterone measurements. The corticoste-rone levels in blood follow both diurnal and ultradian rhythms (Atkinson et al 2006). Because of this, together with the fact that the blood sampling procedure may cause a stress response, it is very difficult to establish reliable baseline corticosterone levels to compare with induced corticosterone levels. Accusampler® system has established to take blood sampling from catheterised rats without any interference. Previous and recent studies have shown that the corticosterone levels in rats subjected to catheterisation and blood sampling in the Accusampler® system were elevated after surgery, but rapidly decline and return to normal levels after 18-20 hours (Royo et al 2004, Goldkuhl et al 2007).
The aim of the present study is to investigate the time-profile of corticosterone level increases in serum and faeces after exogenous administration of ACTH in male Sprague-Dawley rats. Hypothesis of the present study is corticosterone on stable basal level in blood can be achieved with automated blood sampling. Therefore, the time-profile from corticosterone levels increase in rats after exogenous administration of ACTH can be determined. Developing improved stress assessment methods in laboratory animals is essential for biomedical research, since minimization of stress may significantly increase the reliability of in vivo studies. Further development of stress assessment requires increased knowledge about the HPA-axis in the species of interest. The proposed study may contribute to give a new and
important information about this system. In addition, developing the proposed experimental setup enables future studies of ACTH-induced corticosterone release after stimulation and blockade of different central nervous receptor systems, such as the opioid system. This type of experiments may significantly add to our knowledge about the corticosteroid mechanisms in stress response.
LITERATURE REVIEW Adrenocorticotropic Hormone (ACTH)
Adrenocorticotropic hormone, as its name implies, is a polypeptide composed of 39 amino acids. More specifically, it stimulates secretion of glucocorticoids such as cortisol, corticosterone, and has little control over secretion of aldosterone, the major steroid hormone from the adrenal cortex (Schmidt-Nielsen 1997). These steroid hormones are important in carbohydrate metabolism. Excessive secretion of ACTH in human leads to Cushing’s disease, which is characterized by excessive plasma level cortisol and, therefore, pathological alterations in glucose metabolism. The absence or diminished secretion of ACTH results in Addison’s disease, a disorder characterized by deficits in cortisol production with severe consequences relative to altered cellular metabolism (Hadley 1992).
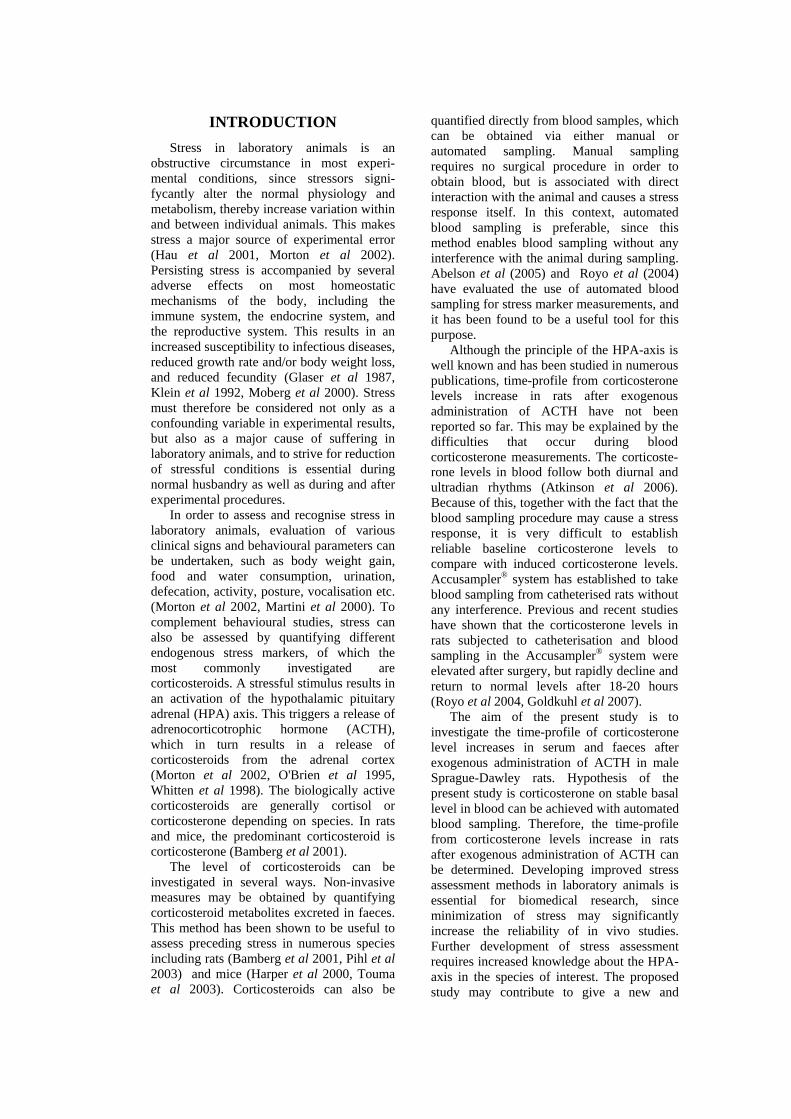
Adrenocorticotropic hormone is secreted from the anterior pituitary in response to corticotrophin releasing hormone (CRH) from the hypothalamus. Corticotropin releasing hormone is secreted in response to many types of stress, which makes sense in view of the “stress management” functions of glucocorticoids (Bowen 1998). Corticotropin releasing hormone itself is inhibited by glucocorticoids, making it part of a classical negative feedback loop (Figure 1).
Figure 1 HPA axis (Bowen 1998)
The action of ACTH on adrenal cortical cells, melanocytes, and adipose tissue cells is mediated through stimulation of adenylate cyclase and the subsequent formation of cAMP. Older methods of bioassay for ACTH measured the effect of the hormone on the weight of the adrenals or on depletion of ascorbic acid in adrenals of hypophy-sectomized rats. More modern methods involve measuring the effect of the peptide on steroid synthesis by adrenal slices or by isolated adrenocortical cells. Adrenocortico-tropic hormone is also localized to certain neurons within the brain, where it may function as a neuropeptide in processes related to memory and learning (Hadley 1992).
Corticosterone
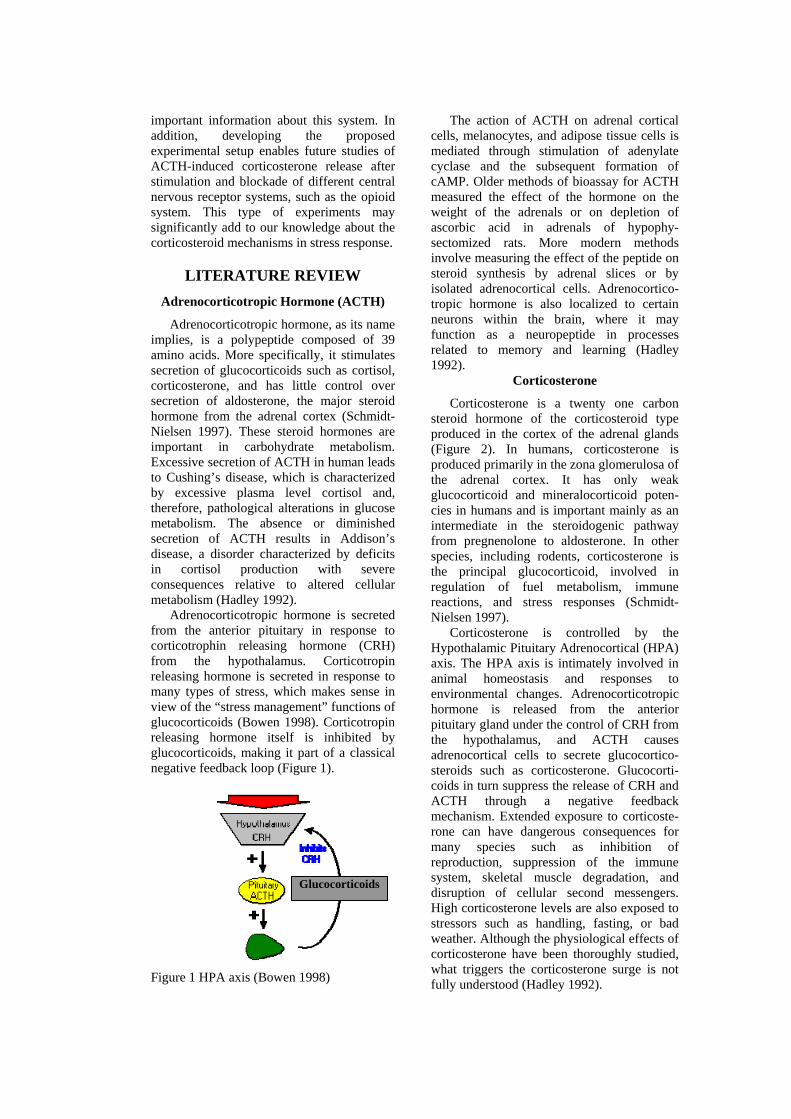
Corticosterone is a twenty one carbon steroid hormone of the corticosteroid type produced in the cortex of the adrenal glands (Figure 2). In humans, corticosterone is produced primarily in the zona glomerulosa of the adrenal cortex. It has only weak glucocorticoid and mineralocorticoid poten-cies in humans and is important mainly as an intermediate in the steroidogenic pathway from pregnenolone to aldosterone. In other species, including rodents, corticosterone is the principal glucocorticoid, involved in regulation of fuel metabolism, immune reactions, and stress responses (Schmidt-Nielsen 1997).
Corticosterone is controlled by the Hypothalamic Pituitary Adrenocortical (HPA) axis. The HPA axis is intimately involved in animal homeostasis and responses to environmental changes. Adrenocorticotropic hormone is released from the anterior pituitary gland under the control of CRH from the hypothalamus, and ACTH causes adrenocortical cells to secrete glucocortico-steroids such as corticosterone. Glucocorti-coids in turn suppress the release of CRH and ACTH through a negative feedback mechanism. Extended exposure to corticoste-rone can have dangerous consequences for many species such as inhibition of reproduction, suppression of the immune system, skeletal muscle degradation, and disruption of cellular second messengers. High corticosterone levels are also exposed to stressors such as handling, fasting, or bad weather. Although the physiological effects of corticosterone have been thoroughly studied, what triggers the corticosterone surge is not fully understood (Hadley 1992).
Glucocorticoids
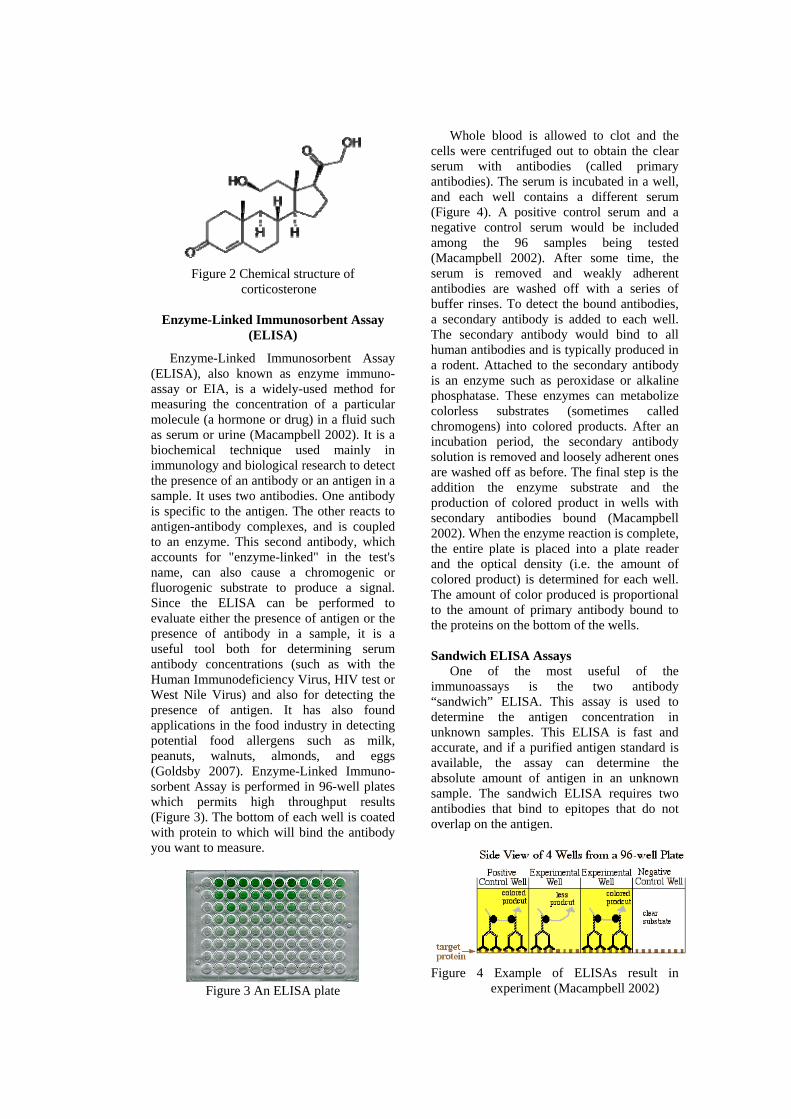
Figure 2 Chemical structure of
corticosterone
Enzyme-Linked Immunosorbent Assay (ELISA)
Enzyme-Linked Immunosorbent Assay (ELISA), also known as enzyme immuno-assay or EIA, is a widely-used method for measuring the concentration of a particular molecule (a hormone or drug) in a fluid such as serum or urine (Macampbell 2002). It is a biochemical technique used mainly in immunology and biological research to detect the presence of an antibody or an antigen in a sample. It uses two antibodies. One antibody is specific to the antigen. The other reacts to antigen-antibody complexes, and is coupled to an enzyme. This second antibody, which accounts for "enzyme-linked" in the test's name, can also cause a chromogenic or fluorogenic substrate to produce a signal. Since the ELISA can be performed to evaluate either the presence of antigen or the presence of antibody in a sample, it is a useful tool both for determining serum antibody concentrations (such as with the Human Immunodeficiency Virus, HIV test or West Nile Virus) and also for detecting the presence of antigen. It has also found applications in the food industry in detecting potential food allergens such as milk, peanuts, walnuts, almonds, and eggs (Goldsby 2007). Enzyme-Linked Immuno-sorbent Assay is performed in 96-well plates which permits high throughput results (Figure 3). The bottom of each well is coated with protein to which will bind the antibody you want to measure.
Figure 3 An ELISA plate
Whole blood is allowed to clot and the
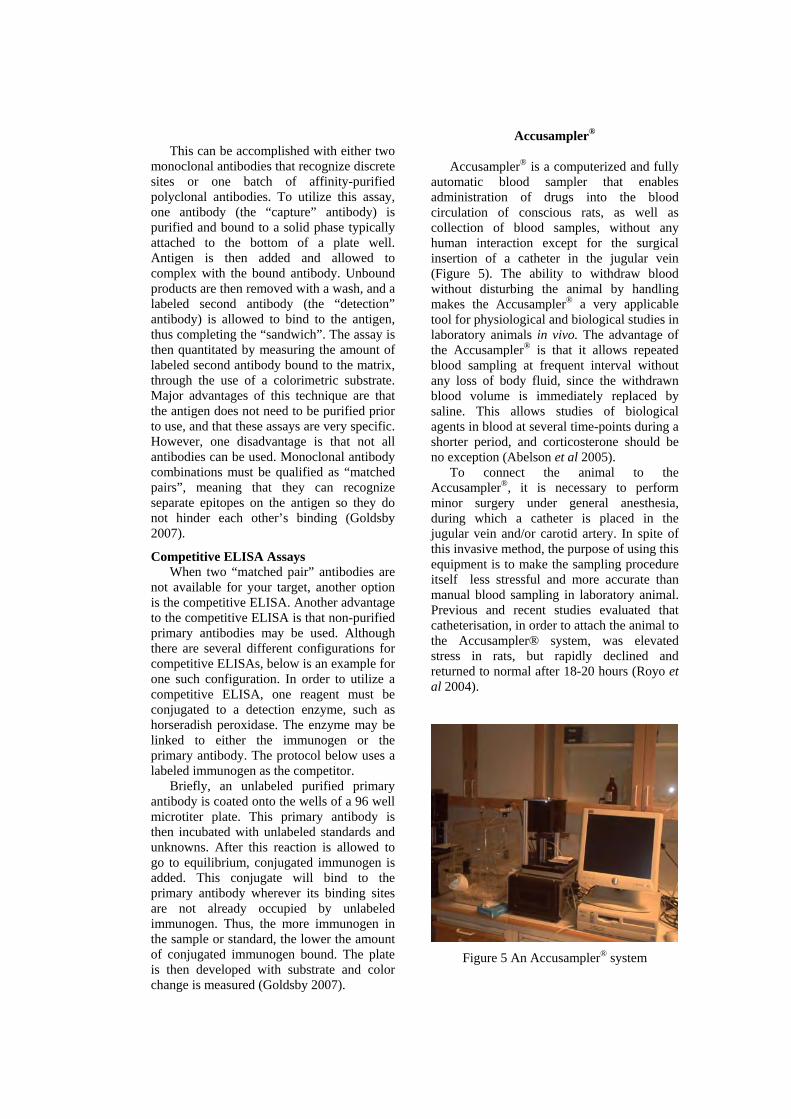
cells were centrifuged out to obtain the clear serum with antibodies (called primary antibodies). The serum is incubated in a well, and each well contains a different serum (Figure 4). A positive control serum and a negative control serum would be included among the 96 samples being tested (Macampbell 2002). After some time, the serum is removed and weakly adherent antibodies are washed off with a series of buffer rinses. To detect the bound antibodies, a secondary antibody is added to each well. The secondary antibody would bind to all human antibodies and is typically produced in a rodent. Attached to the secondary antibody is an enzyme such as peroxidase or alkaline phosphatase. These enzymes can metabolize colorless substrates (sometimes called chromogens) into colored products. After an incubation period, the secondary antibody solution is removed and loosely adherent ones are washed off as before. The final step is the addition the enzyme substrate and the production of colored product in wells with secondary antibodies bound (Macampbell 2002). When the enzyme reaction is complete, the entire plate is placed into a plate reader and the optical density (i.e. the amount of colored product) is determined for each well. The amount of color produced is proportional to the amount of primary antibody bound to the proteins on the bottom of the wells.
Sandwich ELISA Assays
One of the most useful of the immunoassays is the two antibody “sandwich” ELISA. This assay is used to determine the antigen concentration in unknown samples. This ELISA is fast and accurate, and if a purified antigen standard is available, the assay can determine the absolute amount of antigen in an unknown sample. The sandwich ELISA requires two antibodies that bind to epitopes that do not overlap on the antigen.
Figure 4 Example of ELISAs result in
experiment (Macampbell 2002)
This can be accomplished with either two
monoclonal antibodies that recognize discrete sites or one batch of affinity-purified polyclonal antibodies. To utilize this assay, one antibody (the “capture” antibody) is purified and bound to a solid phase typically attached to the bottom of a plate well. Antigen is then added and allowed to complex with the bound antibody. Unbound products are then removed with a wash, and a labeled second antibody (the “detection” antibody) is allowed to bind to the antigen, thus completing the “sandwich”. The assay is then quantitated by measuring the amount of labeled second antibody bound to the matrix, through the use of a colorimetric substrate. Major advantages of this technique are that the antigen does not need to be purified prior to use, and that these assays are very specific. However, one disadvantage is that not all antibodies can be used. Monoclonal antibody combinations must be qualified as “matched pairs”, meaning that they can recognize separate epitopes on the antigen so they do not hinder each other’s binding (Goldsby 2007).
Competitive ELISA Assays When two “matched pair” antibodies are
not available for your target, another option is the competitive ELISA. Another advantage to the competitive ELISA is that non-purified primary antibodies may be used. Although there are several different configurations for competitive ELISAs, below is an example for one such configuration. In order to utilize a competitive ELISA, one reagent must be conjugated to a detection enzyme, such as horseradish peroxidase. The enzyme may be linked to either the immunogen or the primary antibody. The protocol below uses a labeled immunogen as the competitor.
Briefly, an unlabeled purified primary antibody is coated onto the wells of a 96 well microtiter plate. This primary antibody is then incubated with unlabeled standards and unknowns. After this reaction is allowed to go to equilibrium, conjugated immunogen is added. This conjugate will bind to the primary antibody wherever its binding sites are not already occupied by unlabeled immunogen. Thus, the more immunogen in the sample or standard, the lower the amount of conjugated immunogen bound. The plate is then developed with substrate and color change is measured (Goldsby 2007).
Accusampler®
Accusampler® is a computerized and fully automatic blood sampler that enables administration of drugs into the blood circulation of conscious rats, as well as collection of blood samples, without any human interaction except for the surgical insertion of a catheter in the jugular vein (Figure 5). The ability to withdraw blood without disturbing the animal by handling makes the Accusampler® a very applicable tool for physiological and biological studies in laboratory animals in vivo. The advantage of the Accusampler® is that it allows repeated blood sampling at frequent interval without any loss of body fluid, since the withdrawn blood volume is immediately replaced by saline. This allows studies of biological agents in blood at several time-points during a shorter period, and corticosterone should be no exception (Abelson et al 2005).
To connect the animal to the Accusampler®, it is necessary to perform minor surgery under general anesthesia, during which a catheter is placed in the jugular vein and/or carotid artery. In spite of this invasive method, the purpose of using this equipment is to make the sampling procedure itself less stressful and more accurate than manual blood sampling in laboratory animal. Previous and recent studies evaluated that catheterisation, in order to attach the animal to the Accusampler® system, was elevated stress in rats, but rapidly declined and returned to normal after 18-20 hours (Royo et al 2004).
Figure 5 An Accusampler® system
MATERIAL AND METHODS
Material and Instrument
Laboratory animals used in the present study were eighteen male Sprague-Dawley rats from Scanbur B&K in Sollentuna. Materials used in the present study were aspen chips (Finn Tapvei, Kortteinen, Finland), food pellets (R36 Laktamin, Stockholm, Sweden), makrolon type III cages, Nutella® hazelnut and chocolate cream, buprenorphine (Temgesic®, Schering-Plough Europe, Brussels, Belgium), Isoflurane (Forene, Abbot Scandinavia AB, Stockholm Sweden), iodine (Jodopax vet®, Pharmaxin AB, Helsingborg, Sweden), vehicle (bovine serum albumin, BSA), and ACTH 1-24 (PolyPeptide Laboratories Inc., Torrance, CA, USA).
Instrument used in the present study were Correlate-ELISA kit (Assay Designs Inc., Ann Arbor, MI, USA), Accusampler® (DiLab AB, Lund, Sweden), centrifuge, Simtec anaesthetic mask, catheter (DiLab AB, Lund, Sweden), and other surgical instrument.
Research Design And Methods
Animals
Eighteen male Sprague-Dawley rats were used in the study. After arrival, the rats were kept for seven days acclimatisation in animal rooms under standardised conditions, such as: diurnal rhythm was regulated with a 12 hours light and12 hours dark cycle with lights on from 06.00 to 18.00, temperature was kept at 20 ± 2 oC, relative humidity 30-60%, air was changed approximately 15 times per hour, and cages were cleaned twice a week. Aspen chips were used as bedding material. The animals had free access to food pellets and tap water at all times. Food pellets were placed on the bedding to improve accessibility after surgery. Two days before surgery, the rats were transferred to single housing in Makrolon type III cages and moved to a designated laboratory with similar environmental conditions, where the experiment was conducted. After translocation, each rat was given Nutella® hazelnut and chocolate cream for habituation to the flavour, to facilitate future oral administration of pre-emptive analgesia. All
rats were handled regularly each day to habituate to the experimenter.
Surgery
All surgery were commenced and completed before noon. One hour before surgery, rats were treated for pre-emptive analgesia with buprenorphine 0.4 mg/kg dissolved in Nutella for oral ad libitum administration. The dose is based on that recommended in the literature (Flecknell et al 1999, Dobromylskyj et al 2000, Hedenqvist et al 2003). Rats were placed in an induction chamber and anaesthesia was induced with 5% isoflurane. Once the paw withdrawal reflex was absent, the rats were shaved at the incision sites and attached to a Simtec anaesthetic mask for spontaneous respiration. Isoflurane was maintained at an appropriate level to ensure adequate anaesthesia. The shaved parts were washed with iodine. An incision was made in the skin of the neck and a dual cannulation was performed by catheterisation of vein jugularis externa (for intravenous administration of ACTH) and artery carotis communis (for blood sampling). Catheters (DiLab, Lund, Sweden) were filled with heparinised saline to prevent blood clotting.
Postoperative Care
To ensure adequate recovery, the rats’ activity were observed regularly during the first hours after awakening, and daily water intake was recorded. The rats received an additional dose of buprenorphine 0.4 mg/kg in Nutella in the morning of day 1 and day 2.
Experimentation
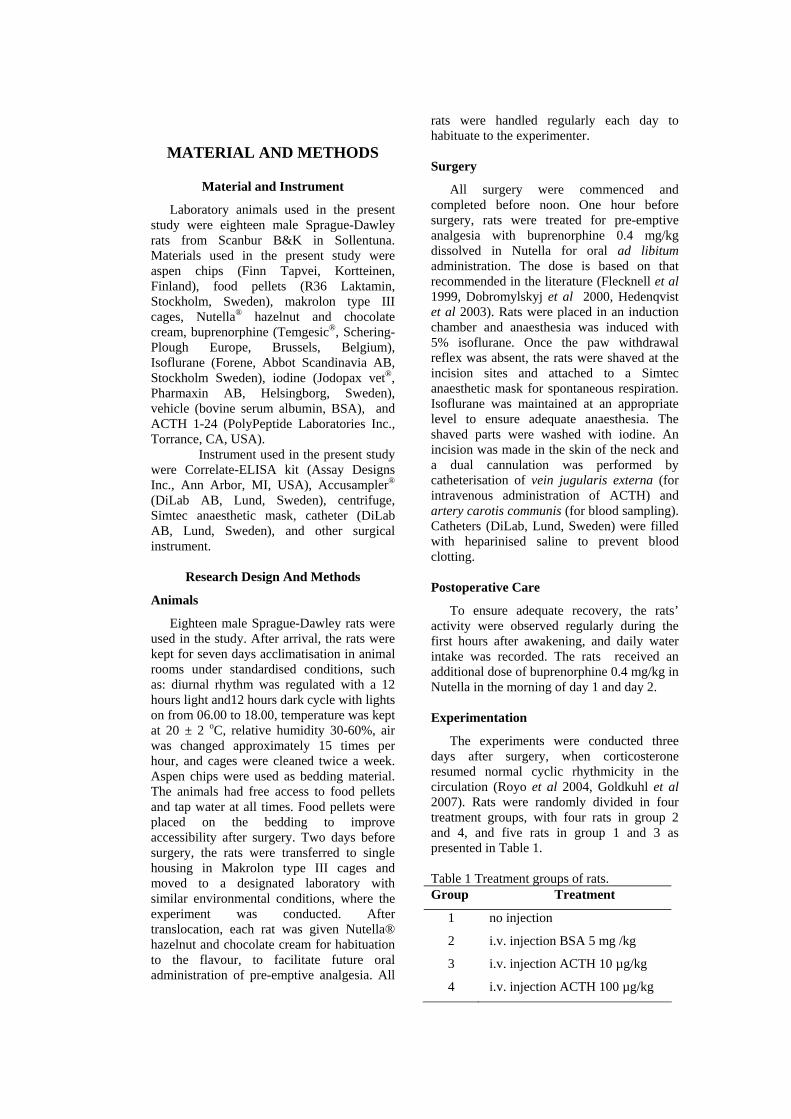
The experiments were conducted three days after surgery, when corticosterone resumed normal cyclic rhythmicity in the circulation (Royo et al 2004, Goldkuhl et al 2007). Rats were randomly divided in four treatment groups, with four rats in group 2 and 4, and five rats in group 1 and 3 as presented in Table 1.
Table 1 Treatment groups of rats. Group Treatment
1 no injection
2 i.v. injection BSA 5 mg /kg
3 i.v. injection ACTH 10 µg/kg
4 i.v. injection ACTH 100 µg/kg
ACTH Administration and Blood Sampling
Each experiment was started at 7.00 am in the morning, since the basal corticosterone levels normally are negligible at this time of day (Royo et al 2004, Goldkuhl et al 2007). Three blood samples (100 µl each) were collected every twenty minute to determine the pre-experimental basal levels. At 8.00, rats in groups 2-4 were injected with either vehicle or ACTH. After injection, blood was collected after 3, 10, 20, 40, 60, 90, 120, 180, 240, 720, 1440, 2160, and 2880 min. Blood was collected in the same intervals from rats in group 1, but this group was left undisturbed and untreated during the entire sampling period.
Faecal Sampling All rats were handled by the experimenter
daily after surgery, to habituate animals and thereby minimise stress response in connection to faecal sampling. At noon the day before ACTH administration, the rats were put in clean cage. The day of ACTH administration, after the first four hours of blood sampling, all faecal pellets were collected. Corticosteroid metabolites from these faecal samples were served as a basal excretion level to compare with levels induced by ACTH. After the first faecal collection (basal level) faeces were collected after 4, 8, 20, 32, and 44 hours, which corresponds to 8, 12, 24, 36 and 48 hours after injection.
After completion of faecal sampling on day 5, rats were euthanized with pentobar-bital i.v, where after brains were removed and stored for future mRNA analysis.
Corticosterone Extraction from Faeces (Eriksson et al 2004)
All faecal pellets from each sample were dried in 30 oC for two hours. After two hours, the samples were weighed and 4 g MilliQ water were added per 1 g sample. The samples were homogenised thoroughly using a mixer. After that, 1 g homogenates were weighed and placed in glass tubes and 5 ml dichloromethane were added to each tube and were votexed for 5 second, 6-7 times. The tubes were closed with parafilm and centrifuged at 1200 x g for 15 minutes. Then kept on ice during the rest of the extraction procedure. After 15 minutes centrifuged, all tubes were picked and the upper layer were removed with vacuum suction. A passage were made between air and organic phase. The organic phase was transferred by
pipetting it to a clean glass which is the same type with previous tube. One millilitre 0.1 M NaOH was added using an eppendorf-pipette. The tubes were vortexed 3 times, added parafilm, and centrifuged at 1200 xg for 15 minutes. After centrifuged, the upper layer were removed using vacuum suction and washed 2 times with 1 ml MilliQ water. After that, 1 ml from each sample was transferred to disposable glass tubes covered with aluminium foil and parafilm. All samples were stored in -200C until analysis.
Corticosterone Analysis Blood samples were collected in cooled
tubes at 4oC, after which they were centrifuged to remove blood cells and obtain serum. Serum was stored at -20oC until analysis. Faecal pellets were homogenised and corticosteroid metabolites were extracted as Eriksson et al 2004. Serum corticosterone and faecal corticosteroid metabolites were quantified with enzyme-linked immunosor-bent assay (ELISA), using a commercial Correlate-ELISA kit for corticosterone (Assay-Designs Inc., Ann Arbor, MI, USA) according to the manufacturer’s manual.
Statistics The means and variances of all groups
were compared using ANOVA analysis in order to detect significant differences between every time point with the baseline in each group according to treatment. P<0.05 were considered significant.
RESULTS AND DISCUSSION It is well known that stress was associated
with an increase of corticosterone level in blood. Commonly, this been an obstructive circumstance in most experimental setup since the level increase of corticosterone can affect the metabolism of the body. Therefore, stress can be one of the major source in the experimental error. General stress that exist in many experimental is animal handling. According Viau (1992), handled rats had a higher corticosterone level in blood compared with non-handled rats. Meanwhile, Abelson (2005) reported that high plasma corticosterone levels persist during frequent automatic blood sampling. From those fact, we can conclude that performing stress in laboratory animals always concomitant in an increase of corticosterone levels in blood.
Many experimental setup require blood sampling in order to obtain the experimental result. Manual blood sampling is associate
with direct interaction with the animal in order to obtain blood, which the most interaction should be performed is animal handling. It is mention before that animal handling can cause stress respond that confounding the experimental result. In the present study the Accusampler® has been used for automated blood sampling. This device allows blood sampling without any interference with the animals. This was important because in order to investigate the time-profile of corticosterone level increases in serum after exogenous administration of ACTH, it is essential to get a stable basal level of corticosterone in blood.
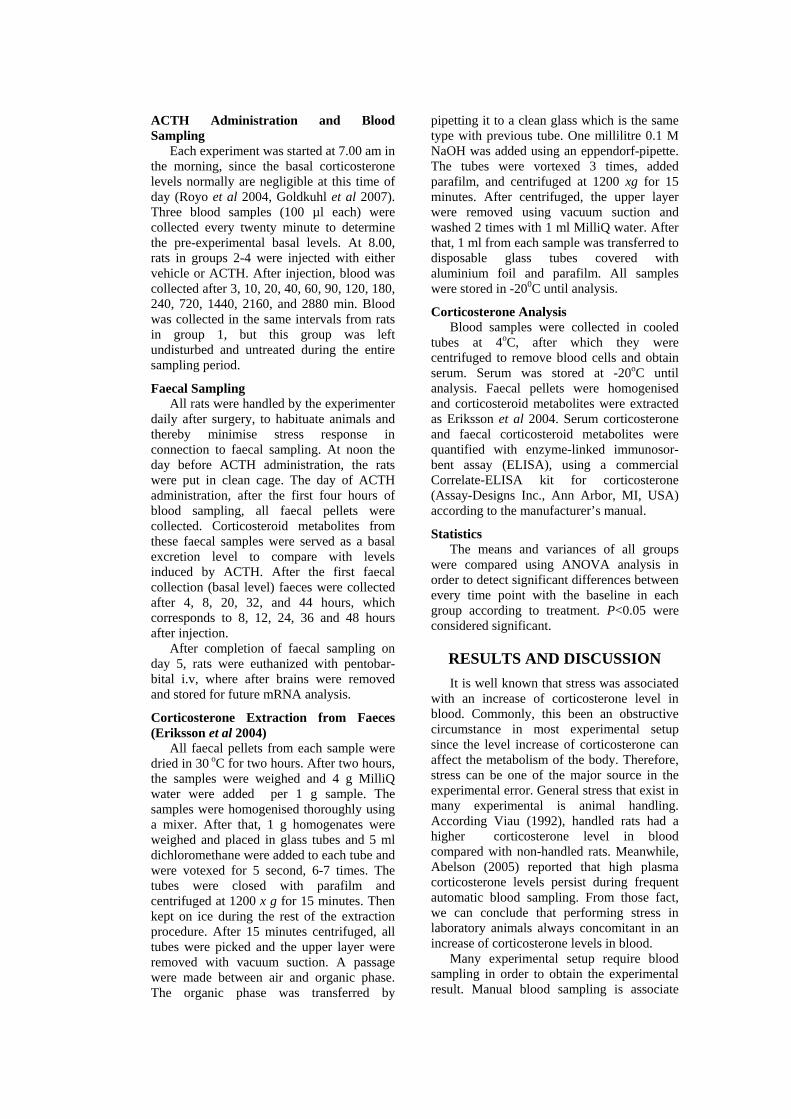
Blood samples The corticosterone levels in blood after
ACTH treatment are shown in Figure 6. In animals left undisturbed (group 1) the corticosterone levels were stable at low levels during four hours blood sampling as determine by ANOVA compared to the baseline. Animals in control group 2 did not display any increase in corticosterone in connection to the injection. However, a significant corticosterone levels increased after 60, 90, and 120 minutes as determined by ANOVA compared to baseline. More pronounced corticosterone increase was observed in groups 3 and 4. The corticosterone level increase in serum happened within 3 minutes. Both groups show similar maximum values of cortico-sterone in blood serum. In group 3, the maximum corticosterone level occurred within 60 minutes after injection and decrease drastically after 90 minutes. Meanwhile, maximum corticosterone level in group 4 occurred after 120 minutes injection and decrease slowly after that. Diurnal rhythm was shown in all groups from twelve hours after injection until the end of the experiment, which is high value of corticosterone in the evening and low value in the morning. This is important because we can conclude that the adrenal cortex from each rats still work normally after surgery.
As shown in the result, we have a significant increase of corticosterone level in blood after exogenous administration of ACTH. Meanwhile, the group which is left undisturbed displays a flat curve that indicates that corticosterone levels were stable in blood. Interestingly, we found a delayed responses in group 2 animals, who
0
50
100
150
200
250
-60 -40 -20 3 10 20 40 60 90 120 180 240 720 1440 2160 2880
Time (min)
cort
icos
tero
ne c
once
ntra
tion
(ng/
ml)
No InjectionBSAACTH 10ACTH 100
Figure 6 Mean corticosterone concentration
in blood each group
were injected 1ml/kg body weigh with BSA 5mg/kg in physiological saline. This could be explained by an immunological response to the BSA. Hattingh et al (1979) reported of fever induced in rabbits by intravenous injection of BSA, and found that the fever was actually due to the protein and not to contamination. Meanwhile, Goehler et al (2001) reported that fever in rats induced by staphylococcal enterotoxin B is concomitant to corticosterone increase in blood. From those fact, we can conclude that the corticosterone increase in blood sample from rats in group 2 is likely caused by immune reaction. Moreover, it is confirmed that corticosterone involves in immune and inflammatory reactions beside as an indicator of stress.
After exogenous administration of both ACTH concentrations, we saw a rapid corticosterone increase in serum. The increase occurred within 3 minutes and declined 4 hours after injection. This information is essential, as it suggests that blood samples taken manually from rats might be influenced rapidly by increased corticosterone levels, which much be taken into consideration during work with laboratory rodents. In both group 3 and 4 it was found that the maximum level of corticosterone increase in blood was almost similar. Thus, the magnitude of the ACTH concentration injected cannot affect the maximal corticosterone concentration released in blood. This shows that adrenal cortex have a limit to produce corticosterone. But, it will affect the duration of increased circulating corticosterone as shown in Figure 7. The ACTH 100 µg/kg injections have a longer duration of corticosterone released in blood compared with ACTH 10 µg/kg. High values of exogenous ACTH or even high disturbance, will produce the same level of corticosterone as well as low values. But, the remaining ACTH may be reabsorbed into the bloodstream after pass adrenal cortex. Consequently, the high level of ACTH may produce longer duration of corticosterone released in blood.
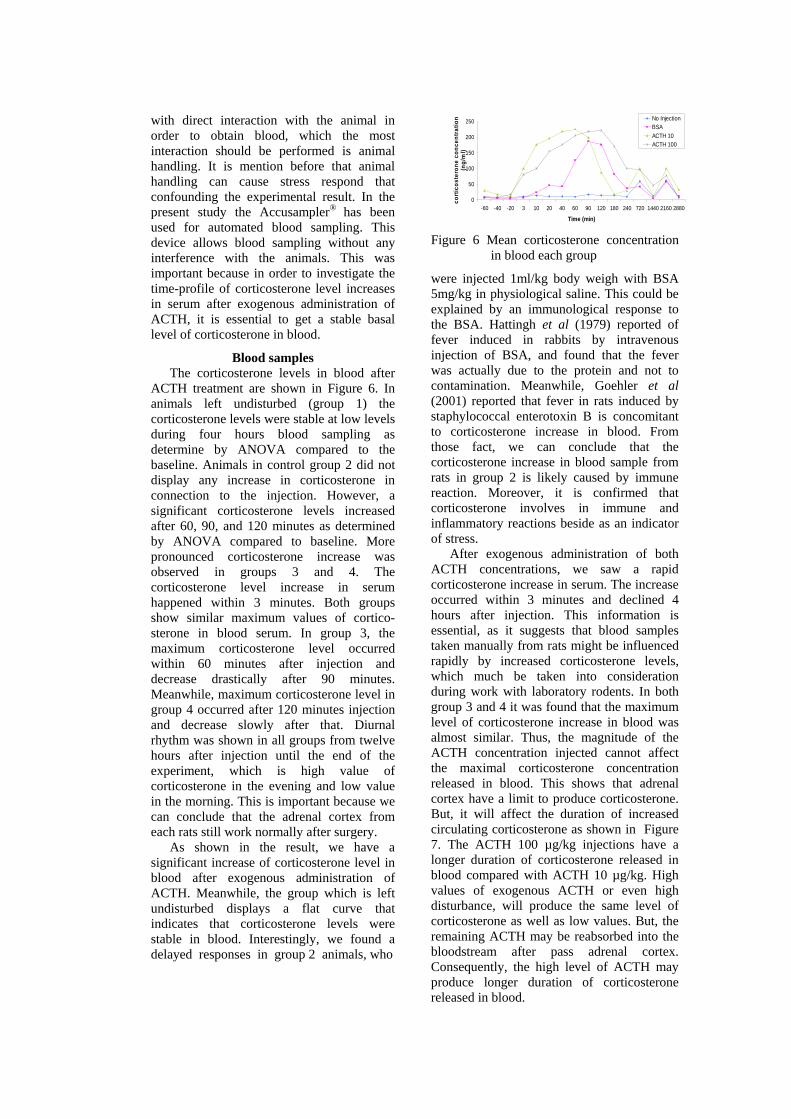
Faecal Samples Quantitative analysis of corticosterone in
faeces may have potential as future non-invasive measures of stress. The present study also aimed to compare the duration from corticosterone being released in blood to its excretion into faeces. The faecal corticosterone levels 8-48 hours are shown in Figure 7. As expected, there is no significant corticosterone increase in group 1 during eight hours after injection, compared to baseline. A significant increase during eight hours after injection just occurred in group 4 as determine by ANOVA compared with baseline. Meanwhile, corticosterone in group 2 and 3 have no significant increase with each baseline, whereas both of groups have a significant increase in blood sample. This can be explain by Murray et al (1996) that reported only 20% blood corticosterone were excreted in faeces, 70% in urine and the rest were excreted by skin.
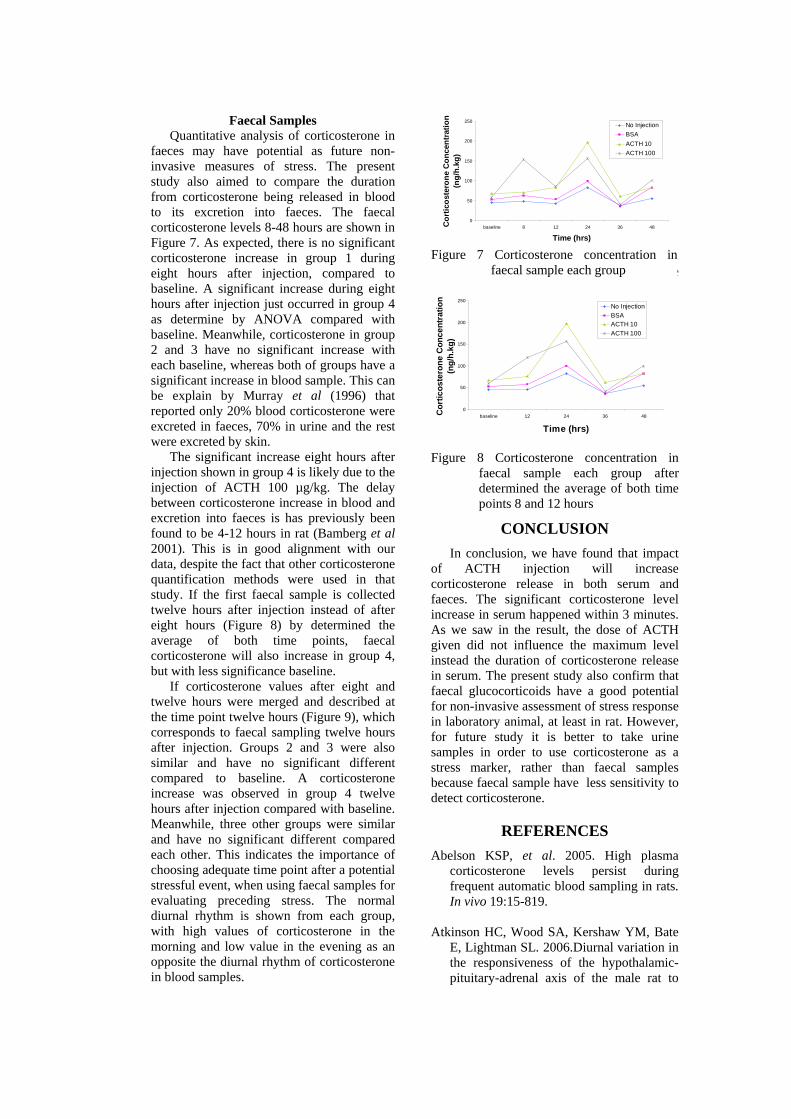
The significant increase eight hours after injection shown in group 4 is likely due to the injection of ACTH 100 µg/kg. The delay between corticosterone increase in blood and excretion into faeces is has previously been found to be 4-12 hours in rat (Bamberg et al 2001). This is in good alignment with our data, despite the fact that other corticosterone quantification methods were used in that study. If the first faecal sample is collected twelve hours after injection instead of after eight hours (Figure 8) by determined the average of both time points, faecal corticosterone will also increase in group 4, but with less significance baseline.
If corticosterone values after eight and twelve hours were merged and described at the time point twelve hours (Figure 9), which corresponds to faecal sampling twelve hours after injection. Groups 2 and 3 were also similar and have no significant different compared to baseline. A corticosterone increase was observed in group 4 twelve hours after injection compared with baseline. Meanwhile, three other groups were similar and have no significant different compared each other. This indicates the importance of choosing adequate time point after a potential stressful event, when using faecal samples for evaluating preceding stress. The normal diurnal rhythm is shown from each group, with high values of corticosterone in the morning and low value in the evening as an opposite the diurnal rhythm of corticosterone in blood samples.
0
50
100
150
200
250
baseline 8 12 24 36 48
Time (hrs)
Cor
ticos
tero
ne C
once
ntra
tion
(ng/
h.kg
)
No InjectionBSAACTH 10ACTH 100
Figure 7 Corticosterone concentration sample
each group
0
50
100
150
200
250
baseline 12 24 36 48
Time (hrs)C
ortic
oste
rone
Con
cent
ratio
n(n
g/h.
kg)
No InjectionBSAACTH 10ACTH 100
Figure 8 Corticosterone concentration in
faecal sample each group after determined the average of both time points 8 and 12 hours
CONCLUSION In conclusion, we have found that impact
of ACTH injection will increase corticosterone release in both serum and faeces. The significant corticosterone level increase in serum happened within 3 minutes. As we saw in the result, the dose of ACTH given did not influence the maximum level instead the duration of corticosterone release in serum. The present study also confirm that faecal glucocorticoids have a good potential for non-invasive assessment of stress response in laboratory animal, at least in rat. However, for future study it is better to take urine samples in order to use corticosterone as a stress marker, rather than faecal samples because faecal sample have less sensitivity to detect corticosterone.
REFERENCES Abelson KSP, et al. 2005. High plasma
corticosterone levels persist during frequent automatic blood sampling in rats. In vivo 19:15-819.
Atkinson HC, Wood SA, Kershaw YM, Bate
E, Lightman SL. 2006.Diurnal variation in the responsiveness of the hypothalamic-pituitary-adrenal axis of the male rat to
Figure 7 Corticosterone concentration in faecal sample each group
noise stress. J Neuroendocrinol 18:526-533.
Bamberg E, Palme R, Meingassner G.
2001.Excretion of corticosteroid metabolites in urine and faeces of rats. Lab Anim 35:307-315.
Bowen R. 1998. Adrenocorticotropic
Hormone (ACTH, corticotropin) [on line].http://www.vivo.colostate.edu/hbooks/pathphys/endocrine/hypopit/acth.html. February 27 2007.
Dobromylskyj P, et al. 2000. Management of
Postoperative and Other Acute Pain, in Pain Management in Animals. PA Flecknell and A Waterman-Pearson, Editors. WB Saunders.
Eriksson E, Royo F, Lyberg K, Carlsson HE,
Hau J. 2004. Effect of metabolic cage housing on immunoglobulin A and corticosterone excretion in faeces and urine of young male rats. Exp Physiol 89:427-433.
Glaser R et al. 1987. Stress-related immune
suppression: health implications. Brain Behav Immun 5:7-20.
Goehler et al. 2001.Staphylococcal
enterotoxin B induces fever, brain c-Fos expression, and serum corticosterone in rats. J Physol 280:1434-1439.
Goldkuhl R, Carlsson HE, Hau J, Abelson
KSP. 2007. Effects of oral and subcutaneous administration of buprenorphine on serum corticosterone levels, body weight, and water consumption in chronically catheterised Sprague-Dawley and Wistar rats. Manuscript.
Goldsby. 2007. ELISA [on line].http://en.wi-
kipedia.org/wiki/ELISA. March 5 2007.
Hedenqvist P, Hellebrekers LJ. 2003. Handbook of Laboratory Animal Science, J Hau and L Van Hoosier Jr, Editors. Boca Raton: CRC Press.
Hadley. 1992. Endocrinology. New Jersey: Prentice-Hall.
Harper JM, Austad SN. 2000. Faecal glucocorticoids: a noninvasive method of measuring adrenal activity in wild and
captive rodents. Physiol Biochem Zool 73: 2-22.
Hattingh J, Laburn H, Mitchell D. 1978.
Fever Induced In Rabbits by Intravenous Injection of Bovine Serum Albumin. J Physol 290:69-77.
Hau J, Andersson E, Carlsson HE.
2001.Development and validation of a sensitive ELISA for quantification of secretory IgA in rat saliva and faeces. Lab Anim 35:301-306.
Klein F, et al. 1992.Prolonged increase of
corticosterone secretion by chronic social stress does not necessarily impair immune functions. Life Sci 50:723-731.
Macampbell. 2002. ELISA (Enzyme-Linked ImmunoSorbant Assay) [on line]. http://www.bio.davidson.edu/Courses/genomics/method/ELISA.html. March 5 2007.
Martini L et al. 2000.Evaluation of pain and stress levels of animals used in experimental research. J Surg Res 88:114-119.
Morton DB, Hau J. 2002. Handbook of
Laboratory Animal Science. J Hau and L Van Hoosier Jr, Editors. Boca Raton: CRC Press.
Moberg GP, Mench JA. 2000. The Biology of
Animal Stress. Basic Principles and Implications for Animal Welfare. CABI :Wallingford, Oxon.
Murray et al. 1996. Harper's Biochemistry.
Toronto: Appleton & Lange.
O'Brien D, Tibi OP, Stodulski G, Saibaba P, Hau J. 1995. Stress perception of surgical anaesthesia in rats, in Proceedings of the Fifth FELASA Symposium: Welfare and Science. J Bunyan, Editor. London: Royal Society of Medicine Press.
Pihl L, Hau J. 2003.Faecal corticosterone and
immunoglobulin A in young adult rats. Lab Anim 37:166-171.
Royo F, Björk N, Carlsson HE, Mayo S, Hau
J. 2004. Impact of chronic catheterization and automated blood sampling
(Accusampler) on serum corticosterone and faecal immunireactive corticosterone metabolites and immunoglobulin A in male rats. J Endocrinol 180:145-153.
Salibaba P, Sales GD, Stodulski G, Hau J.
1996. Behaviour of rats in their home cages: daytime variation and effects of routine husbandry procedure analysed by time sampling techniques. Lab Anim 30:13-21.
Schmidt-Nielsen K. 1997. Animal
Physiology: Adaptation and Environment. New York: Cambridge University Press.
Touma C, Sachser N, Mostl E, Palme R.
2003. Effects of sex and time of day on metabolism and excretion of corticosterone in urine and feces of mice. Gen Comp Endocrinol 130:267-278.
Viau V, Shakti S, Paul MP, Michael JM.
1992. Increased plasma ACTH responses to stress in nonhandled compared with handled rats require basal levels of corticosterone and are associated with increased levels of ACTH secretagogues in the median eminance. The Journal of Neuroscience 13:1097-1105.
Whitten PL, Brockman DK, Stavisky RC.
1998. Recent advances in noninvasive techniques to monitor hormone-behaviour interactions. Am J Phys Antthropol 41:1-23.

APPENDIXES
Appendix 1 Research diagram
Surgery
Eighteen male Sprague-Dawley rats
Acclimatisation
Postoperative care
ACTH administration
Blood sampling Faecal sampling
Corticosterone analysis
Appendix 2 Surgical diagram
Rats
Pre-emptive analgesia
Anaesthesia
Catheterisation
Attached the rats to Accusampler®
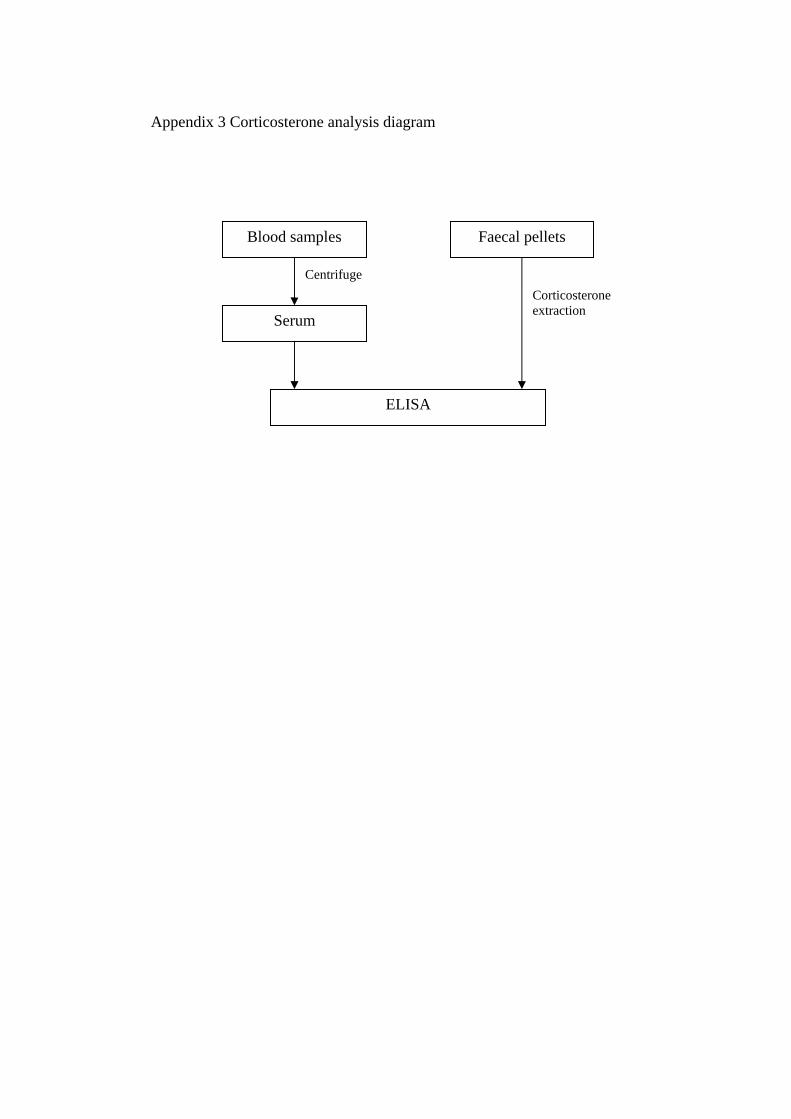
Appendix 3 Corticosterone analysis diagram
Blood samples Faecal pellets
Serum
Centrifuge Corticosterone extraction
ELISA
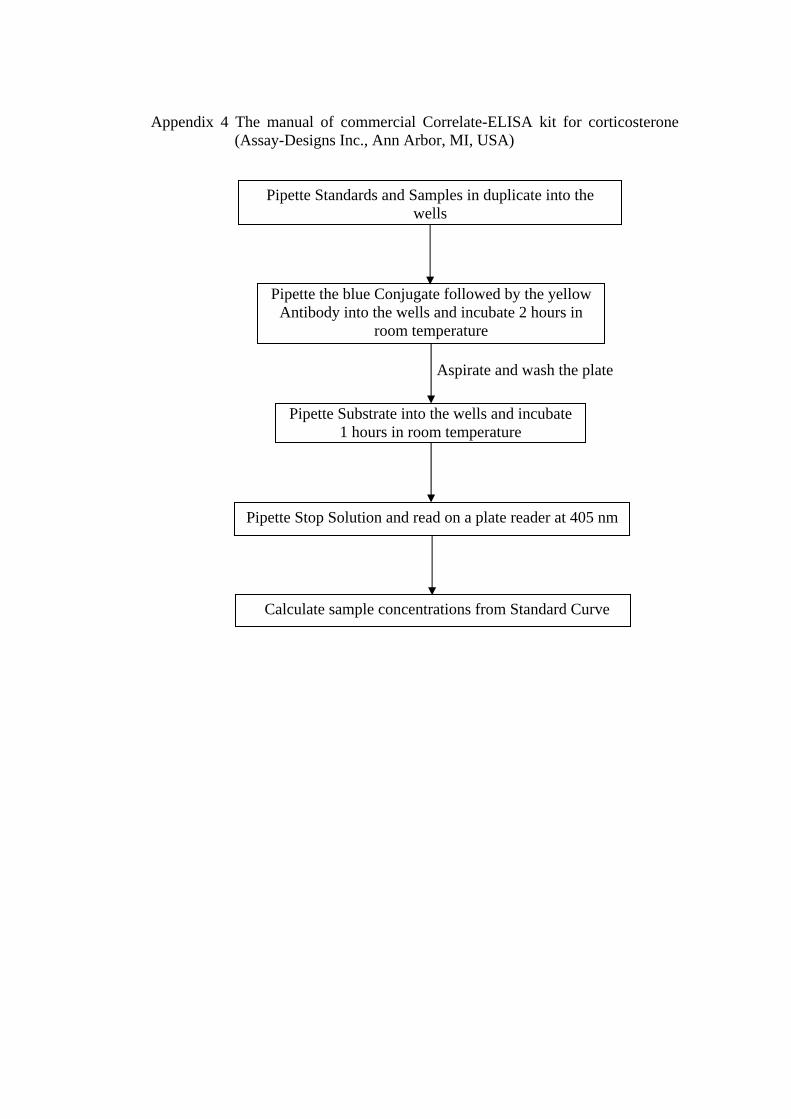
Appendix 4 The manual of commercial Correlate-ELISA kit for corticosterone (Assay-Designs Inc., Ann Arbor, MI, USA)
Pipette Standards and Samples in duplicate into the wells
Pipette the blue Conjugate followed by the yellow Antibody into the wells and incubate 2 hours in
room temperature
Aspirate and wash the plate
Pipette Substrate into the wells and incubate 1 hours in room temperature
Pipette Stop Solution and read on a plate reader at 405 nm
Calculate sample concentrations from Standard Curve
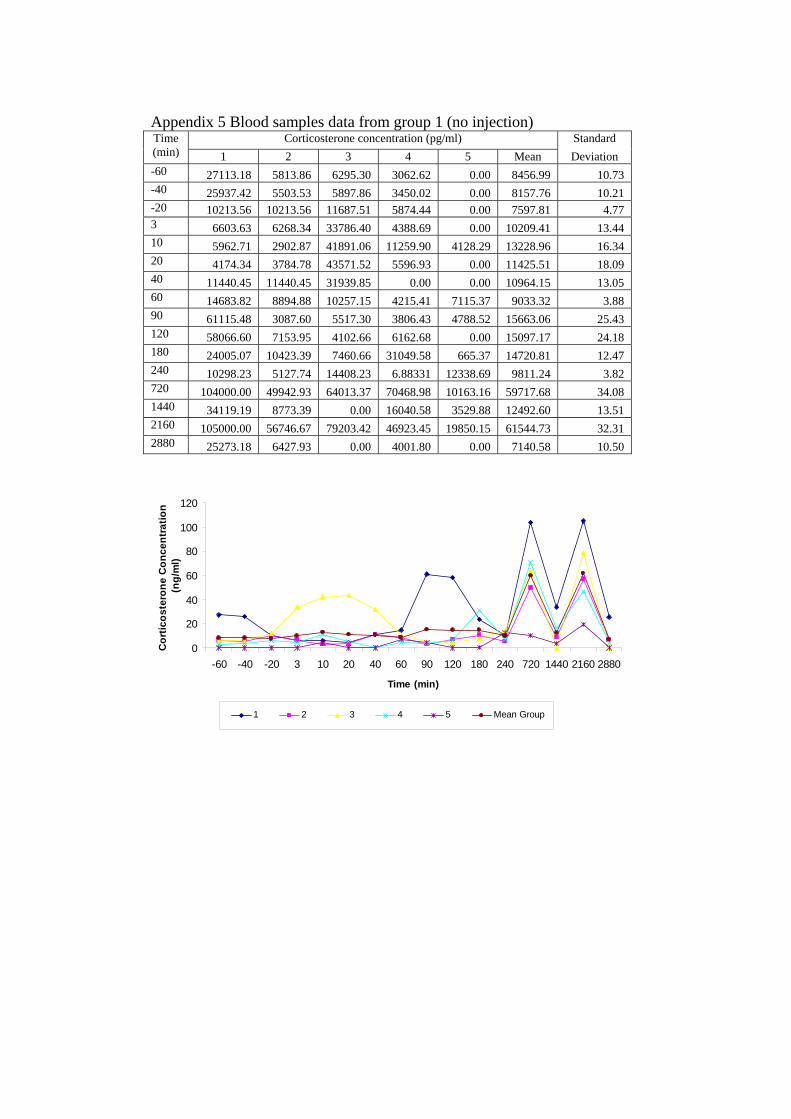
Appendix 5 Blood samples data from group 1 (no injection) Corticosterone concentration (pg/ml) Standard Time
(min) 1 2 3 4 5 Mean Deviation -60 27113.18 5813.86 6295.30 3062.62 0.00 8456.99 10.73 -40 25937.42 5503.53 5897.86 3450.02 0.00 8157.76 10.21 -20 10213.56 10213.56 11687.51 5874.44 0.00 7597.81 4.77 3 6603.63 6268.34 33786.40 4388.69 0.00 10209.41 13.44 10 5962.71 2902.87 41891.06 11259.90 4128.29 13228.96 16.34 20 4174.34 3784.78 43571.52 5596.93 0.00 11425.51 18.09 40 11440.45 11440.45 31939.85 0.00 0.00 10964.15 13.05 60 14683.82 8894.88 10257.15 4215.41 7115.37 9033.32 3.88 90 61115.48 3087.60 5517.30 3806.43 4788.52 15663.06 25.43 120 58066.60 7153.95 4102.66 6162.68 0.00 15097.17 24.18 180 24005.07 10423.39 7460.66 31049.58 665.37 14720.81 12.47 240 10298.23 5127.74 14408.23 6.88331 12338.69 9811.24 3.82 720 104000.00 49942.93 64013.37 70468.98 10163.16 59717.68 34.08 1440 34119.19 8773.39 0.00 16040.58 3529.88 12492.60 13.51 2160 105000.00 56746.67 79203.42 46923.45 19850.15 61544.73 32.31 2880 25273.18 6427.93 0.00 4001.80 0.00 7140.58 10.50
0
20
40
60
80
100
120
-60 -40 -20 3 10 20 40 60 90 120 180 240 720 1440 2160 2880
Time (min)
Cor
ticos
tero
ne C
once
ntra
tion
(ng/
ml)
1 2 3 4 5 Mean Group
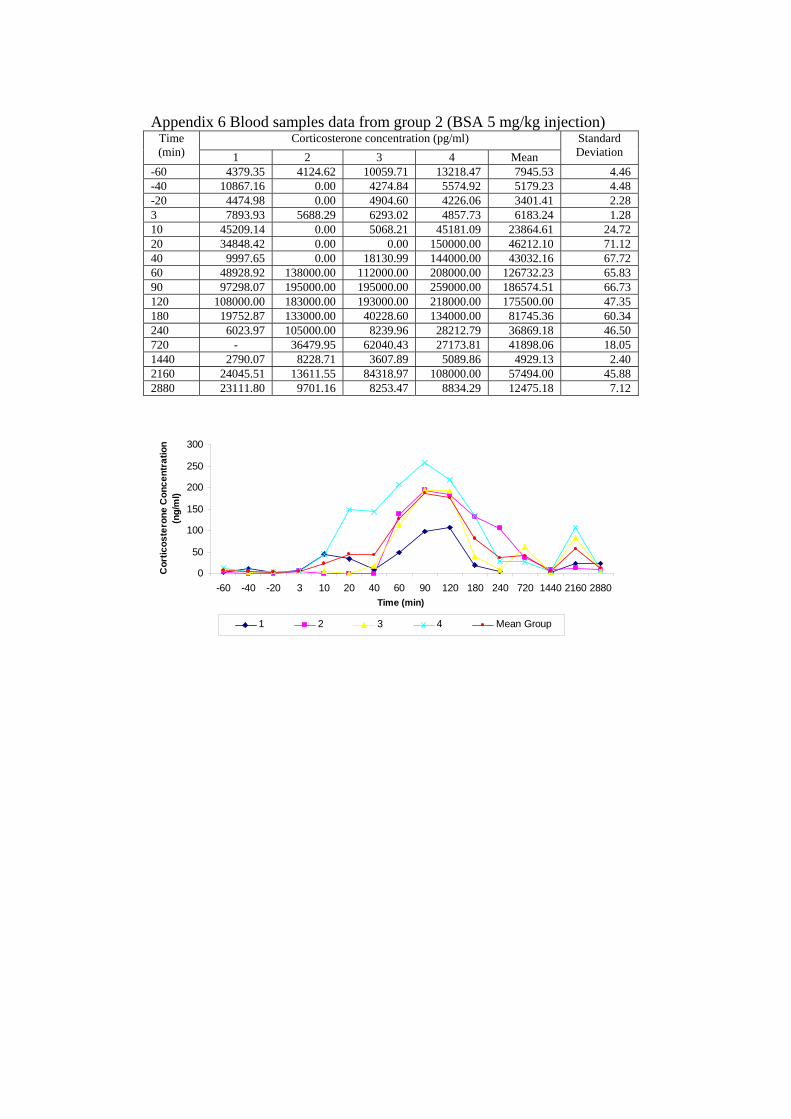
Appendix 6 Blood samples data from group 2 (BSA 5 mg/kg injection) Corticosterone concentration (pg/ml) Time
(min) 1 2 3 4 Mean Standard Deviation
-60 4379.35 4124.62 10059.71 13218.47 7945.53 4.46 -40 10867.16 0.00 4274.84 5574.92 5179.23 4.48 -20 4474.98 0.00 4904.60 4226.06 3401.41 2.28 3 7893.93 5688.29 6293.02 4857.73 6183.24 1.28 10 45209.14 0.00 5068.21 45181.09 23864.61 24.72 20 34848.42 0.00 0.00 150000.00 46212.10 71.12 40 9997.65 0.00 18130.99 144000.00 43032.16 67.72 60 48928.92 138000.00 112000.00 208000.00 126732.23 65.83 90 97298.07 195000.00 195000.00 259000.00 186574.51 66.73 120 108000.00 183000.00 193000.00 218000.00 175500.00 47.35 180 19752.87 133000.00 40228.60 134000.00 81745.36 60.34 240 6023.97 105000.00 8239.96 28212.79 36869.18 46.50 720 - 36479.95 62040.43 27173.81 41898.06 18.05 1440 2790.07 8228.71 3607.89 5089.86 4929.13 2.40 2160 24045.51 13611.55 84318.97 108000.00 57494.00 45.88 2880 23111.80 9701.16 8253.47 8834.29 12475.18 7.12
0
50
100
150
200
250
300
-60 -40 -20 3 10 20 40 60 90 120 180 240 720 1440 2160 2880Time (min)
Cor
ticos
tero
ne C
once
ntra
tion
(ng/
ml)
1 2 3 4 Mean Group
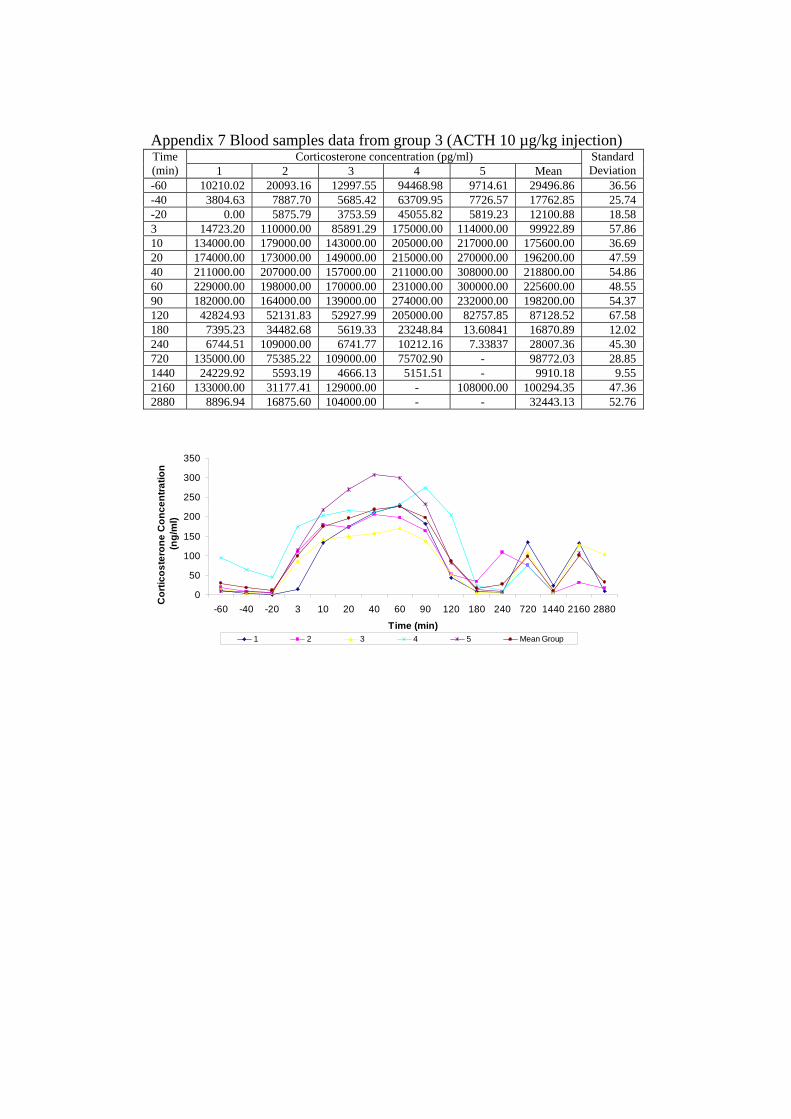
Appendix 7 Blood samples data from group 3 (ACTH 10 µg/kg injection)
Corticosterone concentration (pg/ml) Time (min) 1 2 3 4 5 Mean
Standard Deviation
-60 10210.02 20093.16 12997.55 94468.98 9714.61 29496.86 36.56 -40 3804.63 7887.70 5685.42 63709.95 7726.57 17762.85 25.74 -20 0.00 5875.79 3753.59 45055.82 5819.23 12100.88 18.58 3 14723.20 110000.00 85891.29 175000.00 114000.00 99922.89 57.86 10 134000.00 179000.00 143000.00 205000.00 217000.00 175600.00 36.69 20 174000.00 173000.00 149000.00 215000.00 270000.00 196200.00 47.59 40 211000.00 207000.00 157000.00 211000.00 308000.00 218800.00 54.86 60 229000.00 198000.00 170000.00 231000.00 300000.00 225600.00 48.55 90 182000.00 164000.00 139000.00 274000.00 232000.00 198200.00 54.37 120 42824.93 52131.83 52927.99 205000.00 82757.85 87128.52 67.58 180 7395.23 34482.68 5619.33 23248.84 13.60841 16870.89 12.02 240 6744.51 109000.00 6741.77 10212.16 7.33837 28007.36 45.30 720 135000.00 75385.22 109000.00 75702.90 - 98772.03 28.85 1440 24229.92 5593.19 4666.13 5151.51 - 9910.18 9.55 2160 133000.00 31177.41 129000.00 - 108000.00 100294.35 47.36 2880 8896.94 16875.60 104000.00 - - 32443.13 52.76
0
50
100
150
200
250
300
350
-60 -40 -20 3 10 20 40 60 90 120 180 240 720 1440 2160 2880
Time (min)
Cor
ticos
tero
ne C
once
ntra
tion
(ng/
ml)
1 2 3 4 5 Mean Group
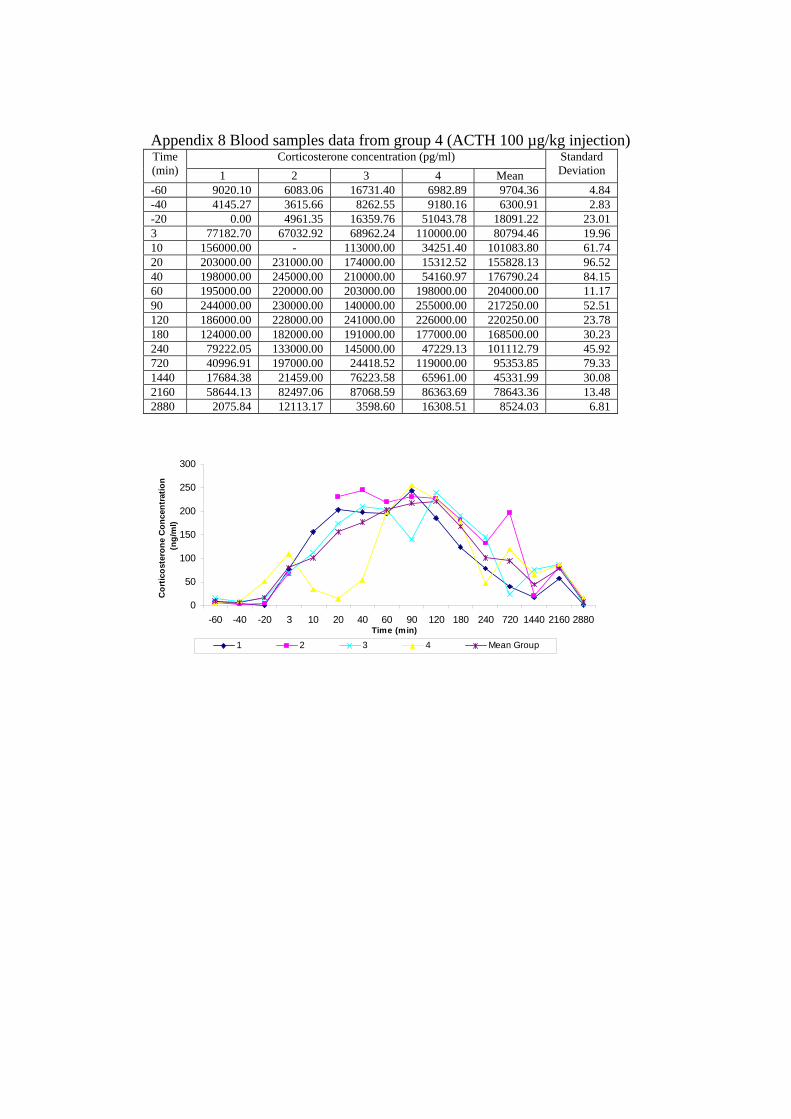
Appendix 8 Blood samples data from group 4 (ACTH 100 µg/kg injection)
Corticosterone concentration (pg/ml) Time (min) 1 2 3 4 Mean
Standard Deviation
-60 9020.10 6083.06 16731.40 6982.89 9704.36 4.84 -40 4145.27 3615.66 8262.55 9180.16 6300.91 2.83 -20 0.00 4961.35 16359.76 51043.78 18091.22 23.01 3 77182.70 67032.92 68962.24 110000.00 80794.46 19.96 10 156000.00 - 113000.00 34251.40 101083.80 61.74 20 203000.00 231000.00 174000.00 15312.52 155828.13 96.52 40 198000.00 245000.00 210000.00 54160.97 176790.24 84.15 60 195000.00 220000.00 203000.00 198000.00 204000.00 11.17 90 244000.00 230000.00 140000.00 255000.00 217250.00 52.51 120 186000.00 228000.00 241000.00 226000.00 220250.00 23.78 180 124000.00 182000.00 191000.00 177000.00 168500.00 30.23 240 79222.05 133000.00 145000.00 47229.13 101112.79 45.92 720 40996.91 197000.00 24418.52 119000.00 95353.85 79.33 1440 17684.38 21459.00 76223.58 65961.00 45331.99 30.08 2160 58644.13 82497.06 87068.59 86363.69 78643.36 13.48 2880 2075.84 12113.17 3598.60 16308.51 8524.03 6.81
0
50
100
150
200
250
300
-60 -40 -20 3 10 20 40 60 90 120 180 240 720 1440 2160 2880Time (min)
Cor
ticos
tero
ne C
once
ntra
tion
(ng/
ml)
1 2 3 4 Mean Group
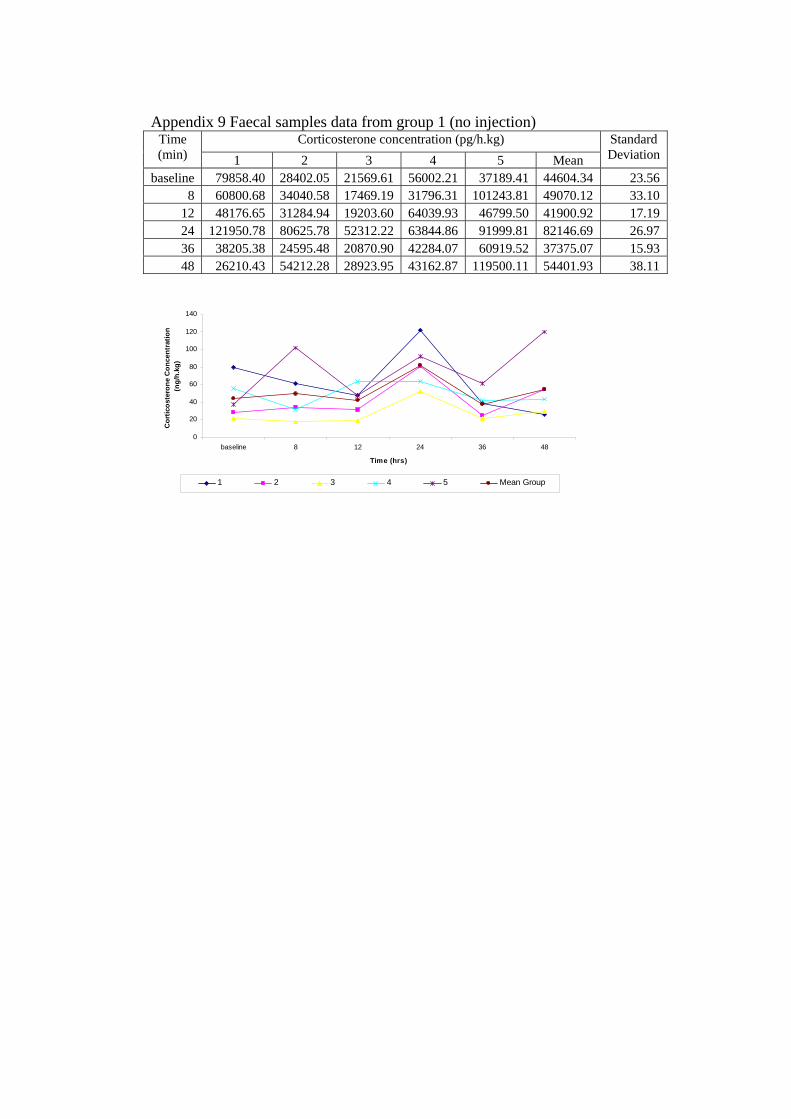
Appendix 9 Faecal samples data from group 1 (no injection) Corticosterone concentration (pg/h.kg) Time
(min) 1 2 3 4 5 Mean Standard Deviation
baseline 79858.40 28402.05 21569.61 56002.21 37189.41 44604.34 23.56 8 60800.68 34040.58 17469.19 31796.31 101243.81 49070.12 33.10
12 48176.65 31284.94 19203.60 64039.93 46799.50 41900.92 17.19 24 121950.78 80625.78 52312.22 63844.86 91999.81 82146.69 26.97 36 38205.38 24595.48 20870.90 42284.07 60919.52 37375.07 15.93 48 26210.43 54212.28 28923.95 43162.87 119500.11 54401.93 38.11
0
20
40
60
80
100
120
140
baseline 8 12 24 36 48
Time (hrs)
Cor
ticos
tero
ne C
once
ntra
tion
(ng/
h.kg
)
1 2 3 4 5 Mean Group
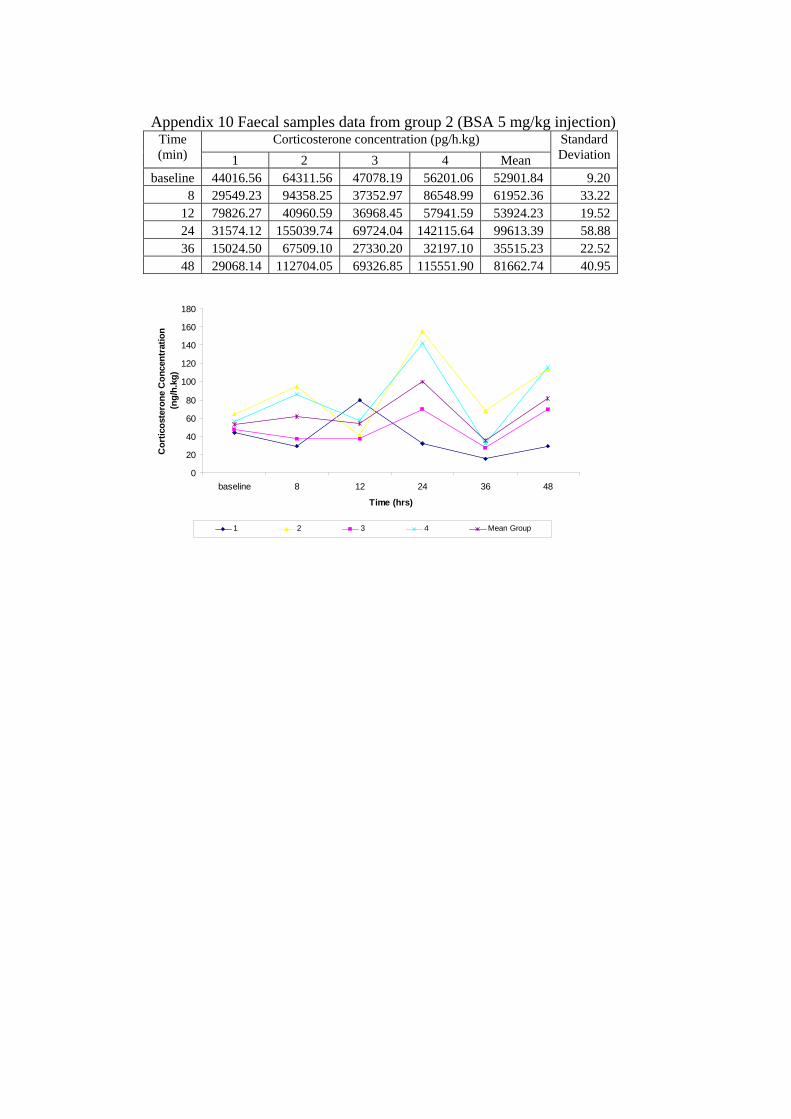
Appendix 10 Faecal samples data from group 2 (BSA 5 mg/kg injection) Corticosterone concentration (pg/h.kg) Time
(min) 1 2 3 4 Mean Standard Deviation
baseline 44016.56 64311.56 47078.19 56201.06 52901.84 9.20 8 29549.23 94358.25 37352.97 86548.99 61952.36 33.22
12 79826.27 40960.59 36968.45 57941.59 53924.23 19.52 24 31574.12 155039.74 69724.04 142115.64 99613.39 58.88 36 15024.50 67509.10 27330.20 32197.10 35515.23 22.52 48 29068.14 112704.05 69326.85 115551.90 81662.74 40.95
0
20
40
60
80
100
120
140
160
180
baseline 8 12 24 36 48
Time (hrs)
Cor
ticos
tero
ne C
once
ntra
tion
(ng/
h.kg
)
1 2 3 4 Mean Group
Appendix 11 Faecal samples data from group 3 (ACTH 10 µg/kg injection) Corticosterone concentration (pg/h.kg) Time
(min) 1 2 3 4 5 Mean Standard Deviation
baseline 79293.42 47227.61 33275.01 126330.03 50282.43 67281.70 37.01 8 29697.36 21329.90 25587.25 160918.63 109976.18 69501.86 62.91
12 56813.94 103273.65 48310.52 75828.43 131457.27 83136.76 34.28 24 89073.61 138439.06 114563.17 283387.20 360394.75 197171.56 118.36 36 46796.62 49815.95 37128.45 85318.83 88673.56 61546.68 23.73 48 85932.55 51841.19 82885.92 102481.69 95169.58 83662.19 19.40
0
50
100
150
200
250
300
350
400
baseline 8 12 24 36 48
Time (hrs)
Cor
ticos
tero
ne C
once
ntra
tion
(ng/
h.kg
)
1 2 3 4 5 Mean Group
Appendix 12 Faecal samples data from group 4 (ACTH 100 µg/kg injection) Corticosterone concentration (pg/h.kg) Time or
sample 1 2 3 4 Mean Standard Deviation
baseline 65210.15 34943.81 63449.74 70782.78 58596.62 16.08 8 89507.02 249385.56 96671.27 179542.22 153776.52 75.71
12 27738.06 173802.15 103514.24 31881.54 84234.00 69.11 24 25718.36 96380.74 99071.18 402489.26 155914.89 167.85 36 28310.21 40009.65 45336.55 51517.48 41293.47 9.85 48 47435.73 37546.46 105355.43 210271.09 100152.18 79.27
050
100150
200
250
300350
400450
baseline 8 12 24 36 48
Time (hrs)
Cor
ticos
tero
ne C
once
ntra
tion
(ng/
h.kg
)
1 2 3 4 Mean Group

Appendix 13 Statistic each time point compared to it baseline from blood sample Multiple Comparisons
Dependent Variable: corticosterone_concentrationDunnett t (2-sided) a
-.29922600 11.29315 1.000 -33.2256999 32.6272479-.85917800 11.29315 1.000 -33.7856519 32.06729591.75242000 11.29315 1.000 -31.1740539 34.67889394.77197400 11.29315 1.000 -28.1544999 37.69844792.96852200 11.29315 1.000 -29.9579519 35.89499592.50715800 11.29315 1.000 -30.4193159 35.4336319.57633400 11.29315 1.000 -32.3501399 33.5028079
7.20607400 11.29315 1.000 -25.7203999 40.13254796.64018600 11.29315 1.000 -26.2862879 39.56665996.26382200 11.29315 1.000 -26.6626519 39.19029591.35424800 11.29315 1.000 -31.5722259 34.280721951.260696* 11.29315 .000 18.3342221 84.1871699
4.03561600 11.29315 1.000 -28.8908579 36.962089953.087746* 11.29315 .000 20.1612721 86.0142199
-1.3164100 11.29315 1.000 -34.2428839 31.6100639-3.7488620 33.61465 1.000 -101.8678489 94.3701249-5.4878380 33.61465 1.000 -103.6068249 92.631148931.106708 33.61465 .984 -67.0122789 129.225694947.251802 33.61465 .776 -50.8671849 145.370788963.329798 33.61465 .427 -34.7891889 161.448784939.696432 33.61465 .909 -58.4225549 137.8154189132.14590* 33.61465 .003 34.0269111 230.2648849162.61973* 33.61465 .000 64.5007411 260.7387149136.67831* 33.61465 .002 38.5593251 234.797298957.960186 33.61465 .540 -40.1588009 156.079172922.745138 33.61465 .999 -75.3738489 120.864124932.015759 35.65372 .988 -72.0551425 136.0866605
-3.7192000 33.61465 1.000 -101.8381869 94.399786946.353062 33.61465 .795 -51.7659249 144.4720489
3.09595200 33.61465 1.000 -95.0230349 101.2149389-11.734010 29.96814 1.000 -99.6312553 76.1632353-17.395978 29.96814 1.000 -105.2932233 70.501267370.426034 29.96814 .189 -17.4712113 158.3232793146.10314* 29.96814 .000 58.2058907 234.0003813166.70314* 29.96814 .000 78.8058907 254.6003813189.30314* 29.96814 .000 101.4058907 277.2003813196.10314* 29.96814 .000 108.2058907 284.0003813146.32950* 29.96814 .000 58.4322567 234.226747380.005290 29.96814 .094 -7.8919553 167.9025353
-12.625966 29.96814 1.000 -100.5232113 75.2712793-1.4895020 29.96814 1.000 -89.3867473 86.407743369.275166 31.78601 .264 -23.9539413 162.5042733
-19.586677 31.78601 1.000 -112.8157838 73.642430870.797489 31.78601 .241 -22.4316188 164.026595813.760649 34.60422 1.000 -87.7343472 115.2556458
-3.4034525 32.84089 1.000 -100.3019566 93.49505168.38686000 32.84089 1.000 -88.5116441 105.285364171.090103 32.84089 .270 -25.8084016 167.988606691.379438 35.47222 .119 -13.2829091 196.0417841146.12377* 32.84089 .001 49.2252634 243.0222716167.08588* 32.84089 .000 70.1873759 263.9843841194.29564* 32.84089 .000 97.3971334 291.1941416207.54564* 32.84089 .000 110.6471334 304.4441416210.54564* 32.84089 .000 113.6471334 307.4441416158.79564* 32.84089 .000 61.8971334 255.694141691.408433 32.84089 .074 -5.4900716 188.306936685.649495 32.84089 .111 -11.2490091 182.547999135.627628 32.84089 .946 -61.2708766 132.526131668.939005 32.84089 .303 -27.9594991 165.8375091
-1.1803325 32.84089 1.000 -98.0788366 95.7181716
(J) time-60-60-60-60-60-60-60-60-60-60-60-60-60-60-60-60-60-60-60-60-60-60-60-60-60-60-60-60-60-60-60-60-60-60-60-60-60-60-60-60-60-60-60-60-60-60-60-60-60-60-60-60-60-60-60-60-60-60-60-60
(I) time-40-2031020406090120180240720144021602880-40-2031020406090120180240720144021602880-40-2031020406090120180240720144021602880-40-2031020406090120180240720144021602880
group1
2
3
4
MeanDifference
(I-J) Std. Error Sig. Lower Bound Upper Bound95% Confidence Interval
The mean difference is significant at the .05 level.*.
Dunnett t-tests treat one group as a control, and compare all other groups against it.a.
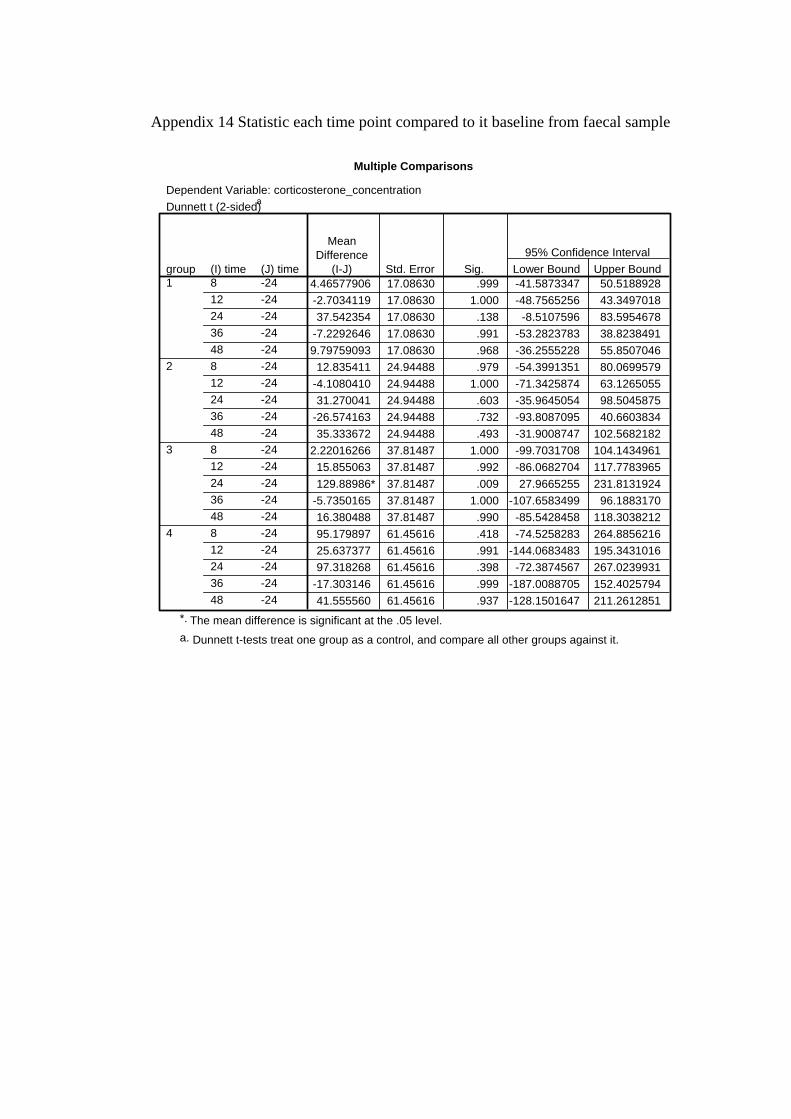
Appendix 14 Statistic each time point compared to it baseline from faecal sample
Multiple Comparisons
Dependent Variable: corticosterone_concentrationDunnett t (2-sided)a
4.46577906 17.08630 .999 -41.5873347 50.5188928-2.7034119 17.08630 1.000 -48.7565256 43.349701837.542354 17.08630 .138 -8.5107596 83.5954678
-7.2292646 17.08630 .991 -53.2823783 38.82384919.79759093 17.08630 .968 -36.2555228 55.8507046
12.835411 24.94488 .979 -54.3991351 80.0699579-4.1080410 24.94488 1.000 -71.3425874 63.126505531.270041 24.94488 .603 -35.9645054 98.5045875
-26.574163 24.94488 .732 -93.8087095 40.660383435.333672 24.94488 .493 -31.9008747 102.5682182
2.22016266 37.81487 1.000 -99.7031708 104.143496115.855063 37.81487 .992 -86.0682704 117.7783965129.88986* 37.81487 .009 27.9665255 231.8131924
-5.7350165 37.81487 1.000 -107.6583499 96.188317016.380488 37.81487 .990 -85.5428458 118.303821295.179897 61.45616 .418 -74.5258283 264.885621625.637377 61.45616 .991 -144.0683483 195.343101697.318268 61.45616 .398 -72.3874567 267.0239931
-17.303146 61.45616 .999 -187.0088705 152.402579441.555560 61.45616 .937 -128.1501647 211.2612851
(J) time-24-24-24-24-24-24-24-24-24-24-24-24-24-24-24-24-24-24-24-24
(I) time812243648812243648812243648812243648
group1
2
3
4
MeanDifference
(I-J) Std. Error Sig. Lower Bound Upper Bound95% Confidence Interval
The mean difference is significant at the .05 level.*.
Dunnett t-tests treat one group as a control, and compare all other groups against it.a.