Embed Size (px)
Citation preview

Temporal geochemical variations in lavas fromK�ılauea’s Pu‘u ‘ �O‘�o eruption (1983–2010): Cyclicvariations from melting of source heterogeneities
Andrew R. GreeneDepartment of Natural Sciences, Hawai‘i Pacific University, 45-045 Kamehameha Hwy, K�ane‘ohe, Hawaii,96744, USA ([email protected])
Michael O. GarciaDepartment of Geology and Geophysics, University of Hawai‘i, Honolulu, Hawaii, USA
Aaron J. PietruszkaDepartment of Geological Sciences, San Diego State University, San Diego, California, USA
Now at U. S. Geological Survey, Denver Federal Center, Denver, Colorado, USA
Dominique WeisPacific Centre for Isotopic and Geochemical Research, Department of Earth and Ocean Sciences, University ofBritish Columbia, Vancouver, British Columbia, Canada
Jared P. MarskeDepartment of Terrestrial Magnetism, Carnegie Institution, Washington, D.C., USA
Michael J. VollingerRonald B. Gilmore XRF Lab, Department of Geosciences, University of Massachusetts, Amherst, Massachusetts, USA
John EilerPlanetary and Geological Sciences Institute, California Institute of Technology, Pasadena, California, USA
[1] Geochemical time series analysis of lavas from K�ılauea’s ongoing Pu‘u ‘�O‘�o eruption chroniclemantle and crustal processes during a single, prolonged (1983 to present) magmatic event, which hasshown nearly two-fold variation in lava effusion rates. Here we present an update of our ongoingmonitoring of the geochemical variations of Pu‘u ‘�O‘�o lavas for the entire eruption through 2010. Oxygenisotope measurements on Pu‘u ‘�O‘�o lavas show a remarkable range (�18O values of 4.6–5.6%), which areinterpreted to reflect moderate levels of oxygen isotope exchange with or crustal contamination byhydrothermally altered K�ılauea lavas, probably in the shallow reservoir under the Pu‘u ‘�O‘�o vent. Thisprocess has not measurably affected ratios of radiogenic isotope or incompatible trace elements, whichare thought to vary due to mantle-derived changes in the composition of the parental magma delivered tothe volcano. High-precision Pb and Sr isotopic measurements were performed on lavas erupted at �6month intervals since 1983 to provide insights about melting dynamics and the compositional structure ofthe Hawaiian plume. The new results show systematic variations of Pb and Sr isotope ratios thatcontinued the long-term compositional trend for K�ılauea until �1990. Afterward, Pb isotope ratios showtwo cycles with �10 year periods, whereas the Sr isotope ratios continued to increase until �2003 andthen shifted toward slightly less radiogenic values. The short-term periodicity of Pb isotope ratios mayreflect melt extraction from mantle with a fine-scale pattern of repeating source heterogeneities or strands,which are about 1–3 km in diameter. Over the last 30 years, Pu‘u ‘�O‘�o lavas show 15% and 25% of the
© 2013. American Geophysical Union. All Rights Reserved. 4849
Article
Volume 14, Number 11
15 November 2013
doi: 10.1002/ggge.20285
ISSN: 1525-2027
known isotopic variation for K�ılauea and Mauna Kea, respectively. This observation illustrates that thedominant time scale of mantle-derived compositional variation for Hawaiian lavas is years to decades.
Components: 13,235 words, 12 figures, 2 tables.
Keywords: Hawaiian plume; tholeiitic volcanism; melt extraction; oceanic island.
Index Terms: 3619 Magma genesis and partial melting: Mineralogy and Petrology; 3621 Mantle processes: Mineralogyand Petrology; 1025 Composition of the mantle: Geochemistry; 1037 Magma genesis and partial melting: Geochemistry;1038 Mantle processes: Geochemistry.
Received 5 March 2013; Revised 9 September 2013; Accepted 7 October 2013; Published 15 November 2013.
Greene, A. R., M. O. Garcia, A. J. Pietruszka, D. Weis, J. P. Marske, M. J. Vollinger, and J. Eiler (2013), Temporal geo-chemical variations in lavas from K�ılauea’s Pu‘u ‘�O‘�o eruption (1983–2010): Cyclic variations from melting of source het-erogeneities, Geochem. Geophys. Geosyst., 14, 4849–4873, doi:10.1002/ggge.20285.
1. Introduction
[2] K�ılauea, on the Island of Hawai‘i (Figure 1), isone of the most active and best-monitored volca-noes in the world [Heliker and Mattox, 2003;Wolfe et al., 1987]. The ongoing Pu‘u ‘�O‘�o erup-tion on K�ılauea’s East Rift Zone (Figure 1) hasbeen active nearly continuously for 30 years and isHawai‘i’s longest and most voluminous (�4 km3)historical eruption [Poland et al., 2012]. The con-tinuous petrologic and geochemical monitoring ofthe Pu‘u ‘�O‘�o eruption [e.g., Garcia et al., 2000;Marske et al., 2008; Thornber, 2003] has allowedus to witness the dynamic changes in the meltingprocess and mantle source composition during asingle, long-lasting magmatic event. Extractionand transport of melt through open channels dur-ing the Pu‘u ‘�O‘�o eruption has efficiently transmit-ted variations of melting in the heterogeneoussource to lavas erupted at the surface without sig-nificant pooling and homogenization, preservingshort-term isotopic and geochemical variations[Pietruszka et al., 2006].
[3] The long-term geochemical variations (manythousands of years) of Hawaiian and other oceanisland basalts has been well documented due todetailed geochemical work on 3þ km deep drillcore [e.g., Albarede et al., 1997; Blichert-Toftet al., 2003; Bryce et al., 2005; Caroff et al.,1995; Rhodes et al., 2012]. These studieschronicle processes on millennium time scales butmiss potential short-term variations (<100 years),which may provide better insights into meltingand crustal processes. K�ılauea’s historical (1823–1982) and prehistoric (AD 900–1400) summitlavas reveal rapid and systematic changes in Pb,
Sr, Nd, O, and U-series isotope ratios on a timescale of decades to centuries [Garcia et al., 2003,2008; Marske et al., 2007; Pietruszka and Garcia,1999; Pietruszka et al., 2001]. The Pu‘u ‘�O‘�oeruption (sampled from hourly to monthly) showscompositional change over hours (in rare cases)for major elements to a few years for isotope ratios[Garcia et al., 2000; Marske et al., 2008]. Thelong duration and vigorous activity (�0.35 � 106
m3 of lava erupted daily) of Pu‘u ‘�O‘�o [e.g., Suttonet al., 2003] provides a rare opportunity to lookbeyond the shallow-level crustal processes associ-ated with the short eruptions (days to weeks) thattypify many active basaltic volcanoes (e.g., MaunaLoa, Etna, Piton de la Fournaise, Karthala,Grimsvötn) and into the mantle. In addition, Pu‘u‘�O‘�o magmas may partially bypass K�ılauea’s sum-mit reservoir (2–6 km depth beneath the summitcaldera) on their way to the East Rift Zone, andmostly avoid its buffering effects [Garcia et al.,2000]. Therefore the Pu‘u ‘�O‘�o eruption is one ofEarth’s best probes for sampling mantle-derivedmelts almost continuously over nearly threedecades.
[4] The study of isotopic and geochemical varia-tion in magmatic events over short time scales(months to years) in oceanic island lavas improvesour temporal and spatial resolution of meltingprocesses and the chemical structure of mantleplumes [Abouchami et al., 2000; Eisele et al.,2003; Hofmann et al., 1984; Vlast�elic et al.,2005]. Recent studies of Pb, Sr, and Nd isotoperatios for part of the Pu‘u ‘�O‘�o eruption [Marskeet al., 2008] and other active basaltic volcanoes[e.g., Piton de la Fournaise; Vlast�elic et al., 2005]detected rapid and systematic changes over short
GREENE ET AL. : K�ıLAUEA’S PU‘U ‘�o‘�o ERUPTION (1983–2010) 10.1002/ggge.20285
4850
time scales (years to decades) resulting fromsource heterogeneity, and variations in crustalprocesses. Here we present new high-precision Pb,
Sr, and O isotope ratios, and major- and trace-element abundances for Pu‘u ‘�O‘�o lavas eruptedbetween January 1983 and June 2010. These data
1974
1823
1919-20
1971
Mauna Ulu 1969-74
19771955
1955
19601840
1790
East Rift ZoneSummit
Makaopuhi1983-present
1790
1790
10 km
1868
1955
Pu‘u ‘O‘o
N
Crater
Crater
Ep. 54
Sout
hwes
t Rift
Zon
e
Mauna Loa1983-2010
Pu'u 'Ō'ō Kupaianaha
PA C I F I C O C E A N
North
Pu'u 'Ō'ōNāpauCrater
Kalapana
Ep. 56
February 17, 1992 - Feb. 11, 2010Episodes 50-58July 20, 1986 - February 17, 1992Episodes 48-49January 3, 1983 -July 20, 1986Episodes 1-48
episodicfountaining(mostly central
vent)
gentle effusion(lava shield and
tube-fed pahoehoe)
Kupaianaha Pu‘u ‘O‘oPu‘u ‘O‘o
Jan. July Feb.
Feb.
1983 1986 1992
1997
(3.5 years) (5.5 years) (18 years) perched channels,rootless shields,fissure eruption
2010
2007
Episode 56
(Magma supply ratedoubled)
June
(uprift)
flank vent eruptions(nearly continuous)(lava shield and tube-fed pahoehoe)
2003
Episode 54
(uprift)
010
km0
16mi
Kīlauea Caldera1790-1982
km
HalemaumauPu‘u ‘Ō‘ō
East Rift ZoneMauna Ulu1969-1974
Makaopuhi Nāpau
(a)
Kupaianaha
Ep. 54Ep. 56
(b)
123
stored
dikeJune, 2007
?
Jan.1997
Ep. 58
Ep. 58
Kīlauea Caldera
0
Kohala
Mauna Loa Kīlauea
Mauna Kea
Lō‘ihi
500
1000
1500
20002500
3000
200015
00
500
1000
1000
2000
3000
2500
5000
2500 5000 5500
155°156°19°
20°
Hilo Ridge
East rift zone
40 km20
Hawai‘i
Hualālai
(c)
(d)
Figure 1. Map of flow fields from the Pu‘u ‘�O‘�o-Kupaianaha eruption on the East Rift Zone of K�ılauea Vol-cano from 1983 to 2010 and historical flows, with a timeline summarizing the predominant style of eruptiveactivity. (a) A schematic cross section of summit and East Rift Zone shows the proposed magmatic plumbingsystem for K�ılauea Volcano, with locations for episodes 54 and 56 uprift of Pu‘u ‘�O‘�o. Mantle-derived magmafor this eruption is thought to partially bypass the summit reservoir based on the rapid changes in lava compo-sition [Garcia et al., 1996]. (b) Map of K�ılauea East Rift Zone with flow fields from intervals of the Pu‘u‘�O‘�o eruption. Legend shows episodes in each interval of eruptive activity. Map provided by USGS HawaiianVolcano Observatory. (c) Map of the island of Hawai‘i with area of map in Figure 1b indicated with box. (d)Timeline of the Pu‘u ‘�O‘�o eruption. Episode 54 was a fissure eruption in and downrift of N�apau Crater thatoccurred over 23 h in January 1997, following the collapse of the Pu‘u ‘�O‘�o cone. Episode 56 was a brief (<1day) fissure eruption northeast of Makaopuhi Crater (uprift of Pu‘u ‘�O‘�o) that occurred in June 2007, coincid-ing with an intrusion and collapse of Pu‘u ‘�O‘�o crater floor. Dashed lines between 2003 and 2007 indicate pe-riod when magma supply rate nearly doubled [Poland et al., 2012].
GREENE ET AL. : K�ıLAUEA’S PU‘U ‘�o‘�o ERUPTION (1983–2010) 10.1002/ggge.20285
4851

are combined with previously published high-precision isotope and trace-element data from1998 to 2005 Pu‘u ‘�O‘�o lavas [Marske et al.,2008]. The new Pb and Sr isotope and inductivelycoupled plasma mass spectrometry (ICP-MS) dataprovide a record of isotopic and geochemical vari-ation of Pu‘u ‘�O‘�o lavas at �6 month intervals,whereas X-Ray fluorescence (XRF) data was col-lected at �2 week intervals. This time series anal-ysis of Pu‘u ‘�O‘�o lavas allows us to distinguish thechanging roles of mantle and crustal processes ingreat detail. The new Pb and Sr isotope ratios areused to assess the short-term expression of mantlesource components throughout the course of theeruption and to evaluate the effects on lava com-position of recent doubling of the magma supply[2003–2007; Poland et al., 2012]. These resultsare compared to the longer-term variations forK�ılauea and other Hawaiian shield volcanoes.
2. Geologic Background of K�ılaueaVolcano and the Pu‘u ‘ �O‘�o Eruption(1983–2010)
[5] K�ılauea Volcano is currently in the middle ofits shield-building stage [DePaolo and Stolper,1996], erupting tholeiitic lava at a rate of �0.13km3/yr [Sutton et al., 2003], one of the highestrates of any volcano on Earth. K�ılauea rises 1240m above sea-level on the southern flank of itslarger neighbor, Mauna Loa (4168 m; Figure 1).Geochemical evidence favors a deep mantle plumeorigin for Hawaiian magmas [e.g., Kurz et al.,1982; Weis et al., 2011]. Shield stage magmas arethought to originate from partial melting at mantledepths of 70–120 km within the upper Hawaiianplume [Watson and McKenzie, 1991]. Magmas areextracted from the upwelling mantle within themelting region and transported through chemicallyisolated channels towards the surface [Pietruszkaet al., 2006]. These pooled melts ascend throughthe lithosphere via a primary conduit into a shal-low (2–6 km) magmatic complex within K�ılauea[Eaton and Murata, 1960; Ryan, 1987; Tillingand Dvorak, 1993; Wright, 1971]. K�ılauea erup-tions occur in and around its summit caldera andEast and Southwest Rift Zones. Approximately90% of the subaerial surface of K�ılauea Volcano iscovered with tholeiitic lava less than 1100 yearsold [Holcomb, 1987]. Prior to 1955, historical(post-1820) eruptions on K�ılauea occurred mostlyat or near the summit [Macdonald et al., 1983].Subsequently, rift zone eruptions became more
common, especially along the East Rift Zone,including the 1969–1974 Mauna Ulu eruption, themost voluminous historical eruption prior to Pu‘u‘�O‘�o [Macdonald et al., 1983].
[6] The Pu‘u ‘�O‘�o-Kupaianaha eruption (referredto as the Pu‘u ‘�O‘�o eruption throughout this paper)began on 2 January 1983 with the intrusion of adike within K�ılauea’s East Rift Zone, although itwas preceded by months of intrusions from thesummit into the rift zone [Wolfe et al., 1987]. Itwas followed 24 h later by eruptive activity alonga discontinuous 7 km long fissure, which localizedto a central vent, Pu‘u ‘�O‘�o (Figure 1 and Table 1).The eruption can be categorized into three broadphases based on eruptive style and location: (1)1983–1986: brief (mostly less than 24 h), episodiceruptions (24 day average repose between erup-tions) with fountaining up to 400 m, mainly fromthe Pu‘u ‘�O‘�o vent [Heliker and Mattox, 2003]; (2)1986–1992: nearly continuous effusion from theKupaianaha vent, which was considered to have ashallow (<100 m deep) conduit connection withPu‘u ‘�O‘�o, 3 km uprift [Garcia et al., 1996]; and(3) 1992–2010: nearly continuous effusion mostlyfrom vents within, and on the southwest and eastflanks of Pu‘u ‘�O‘�o, and from rootless shields �2km east of Pu‘u ‘�O‘�o [Poland et al., 2008]. Thispattern was interrupted on 29 January 1997 (epi-sode 54) by the �150 m collapse of the crater floorinside the Pu‘u ‘�O‘�o cone, and propagation oferuptive fissures 4 km uprift (west) of Pu‘u ‘�O‘�o,which were active for less than a day [Heliker andMattox, 2003]. This event was followed by a 6week hiatus in effusive activity, although glowreturned to the Pu‘u ‘�O‘�o vent on 24 February1997 (Table 1). Afterward, and until June 2007,lava erupted nearly continuously from flank ventson Pu‘u ‘�O‘�o (episode 55). On 19 June 2007, adike intrusion in the upper East Rift Zone resultedin a brief, small (1500 m3) eruption (episode 56)�6 km uprift from Pu‘u ‘�O‘�o [Montgomery-Brownet al., 2010], which was followed by a 2 week hia-tus in effusion [Poland et al., 2008]. Lava produc-tion resumed for 3 weeks in and around Pu‘u ‘�O‘�ocone (episode 57) until 21 July 2007, when a fis-sure opened on the east flank of Pu‘u ‘�O‘�o andpropagated eastward towards Kupaianaha (Figure1 and Table 1). This marked the beginning of epi-sode 58 [Poland et al., 2008], which continuedthrough the end of 2010 mostly as tube-fed flowsfrom a vent �2 km east of Pu‘u ‘�O‘�o. The othernotable K�ılauea eruptive activity during the Pu‘u‘�O‘�o eruption is an ongoing summit eruption thatstarted in March 2008 [Johnson et al., 2010].
GREENE ET AL. : K�ıLAUEA’S PU‘U ‘�o‘�o ERUPTION (1983–2010) 10.1002/ggge.20285
4852

Tab
le1.
Sum
mar
yof
the
Pu‘
u‘� O
‘� oE
rupt
iona
Pri
mar
yV
ent
Epi
sode
Epi
sode
Sta
rtD
ate
Rep
ose
Len
gth
(Day
s)E
piso
deL
engt
hV
olum
e(1
06x
m3)
Eru
ptio
nR
ate
(103
m3/d
ay)
Ven
t/L
ocat
ion
Bri
efD
escr
ipti
on
Pu‘
u‘� O
‘� o1
3Ja
n19
83S
tart
20da
ys14
—F
issu
re1
;ac
tivi
tylo
cali
zed
atP
u‘u
Hal
ulu
and
Pu‘
uK
ahau
lea
east
ofP
u‘u
‘� O‘� o
Init
ial
fiss
ure
open
edin
Nap
auC
rate
raf
ter
seis
mic
swar
mpr
opag
ated
dow
nE
RZ
;fi
ssur
esex
tend
ed8
km;
fiss
ures
loca
lize
dto
1km
near
Pu‘
uK
ahau
lea
;fo
unta
ins
from
Pu‘
uH
alul
ubu
ilt
a60
m-h
igh
cone
Pu‘
u‘� O
‘� o2–
4710
Feb
1983
8–65
(bet
wee
nep
isod
es)
~3.8
year
s37
1�
300
Mos
tly
Pu‘
u‘� O
‘� o;
Epi
sode
s2–
3lo
cali
zed
atP
u‘u
Hal
ulu
and
Pu‘
uK
ahau
lea
east
ofP
u‘u
‘� O‘� o
;E
pi-
sode
4–47
Puu
Oo
prim
ary
vent
Epi
sodi
cfi
refo
unta
inin
g;
epis
odes
mos
tly<
24h
long
sepa
-ra
ted
byan
repo
sele
ngth
aver
age
of24
days
;ef
fusi
onra
tes
incr
ease
dth
ough
epis
ode
39;
max
imum
lava
foun
-ta
inof
470
mhi
gh;
firs
tye
arch
ange
dfr
omlo
wfo
unta
ins
and
paho
ehoe
rive
rsto
high
foun
tain
san
d‘a
‘afa
ns;
foun
tain
-fed
‘a‘a
byep
isod
e20
;co
nebu
ilt
255
mhi
ghan
d1.
4km
indi
amet
er;
sum
mit
infl
ated
betw
een
foun
-ta
inin
gep
isod
esan
dde
flat
eddu
ring
epis
odes
Kup
aian
aha
4818
July
1986
24~5
.5ye
ars
�50
0�
400–
0.5
Kup
aian
aha
;fi
ssur
e3
kmea
stof
Pu‘
u‘� O
‘� oF
issu
res
firs
top
ened
atth
eba
seof
Pu‘
u‘� O
‘� oan
d22
hla
ter
open
ed3
kmdo
wnr
ift
ata
vent
tobe
nam
edK
upai
anah
a;
5.5
year
sof
near
lyco
ntin
uous
gent
leef
fusi
on;
larg
ela
vapo
ndfo
rmed
over
vent
(140
m�
300
m);
broa
dla
vash
ield
form
edan
dtu
be-f
edpa
hoeh
oew
asco
mm
onw
ayla
vasp
read
toco
ast;
hom
esde
stro
yed
into
wn
ofK
ala-
pana
;la
vatu
bes
tose
am
id-1
987
to19
89;
lava
ente
red
sea
duri
ng�
68%
ofep
isod
e;
lava
acti
vein
Pu‘
u‘� O
‘� ocr
ater
duri
ngm
ost
ofep
isod
eP
u‘u
‘� O‘� o
498
Nov
1991
Non
e18
days
110.
6F
issu
re2
betw
een
Pu‘
u‘� O
‘� oan
dK
upai
anah
aF
issu
res
open
edon
Pu‘
u‘� O
‘� oan
dpr
opag
ated
toK
upai
a-na
ha;
outp
utw
aned
duri
ngep
isod
e;
gent
leef
fusi
on,l
ava
shie
ldan
dtu
be-f
edpa
hoeh
oe;
fiss
ure
vent
s,pa
hoeh
oeP
u‘u
‘� O‘� o
5017
Feb
1992
1115
days
3–
Pu‘
u‘� O
‘� ofl
ank
;ra
dial
fiss
ure
onw
est
flan
kof
Pu‘
u‘� O
‘� oco
neE
rupt
ion
retu
rned
toP
u‘u
‘� O‘� o
;ra
dial
fiss
ures
onfl
ank
ofco
ne;
flan
kve
nter
upti
ons;
lava
shie
ldba
nked
upag
ains
tth
eso
uth
and
wes
tP
u‘u
‘� O‘� o
cone
;sp
atte
rco
nes
form
edov
erve
nts;
mos
tly
tube
-fed
paho
ehoe
;co
ntin
uous
quie
tef
fusi
onP
u‘u
‘� O‘� o
517
Mar
1992
416
1da
ys32
�30
0P
u‘u
‘� O‘� o
flan
kF
lank
vent
erup
tion
s;m
ostl
ytu
be-f
edpa
hoeh
oeto
the
sea
;co
ntin
uous
quie
tef
fusi
on;
lava
shie
ldba
nked
upag
ains
tth
eso
uth
and
wes
tP
u‘u
‘� O‘� o
cone
Pu‘
u‘� O
‘� o52
3O
ct19
92N
one
15da
ys2
�30
0P
u‘u
‘� O‘� o
flan
kF
lank
vent
erup
tion
s;m
ostl
ytu
be-f
edpa
hoeh
oeto
the
sea
;co
ntin
uous
quie
tef
fusi
on;
lava
shie
ldba
nked
upag
ains
tth
eso
uth
and
wes
tP
u‘u
‘� O‘� o
cone
Pu‘
u‘� O
‘� o53
20F
eb19
93N
one
~4ye
ars
�53
5�
300
Pu‘
u‘� O
‘� ofl
ank
Fla
nkve
nter
upti
ons;
mos
tly
tube
-fed
paho
ehoe
toth
ese
a;
cont
inuo
usqu
iet
effu
sion
;la
vash
ield
bank
edup
agai
nst
the
sout
han
dw
est
Pu‘
u‘� O
‘� oco
ne;
coll
apse
pits
form
edon
the
side
ofP
u‘u
‘� O‘� o
Pu‘
u‘� O
‘� o54
29Ja
n19
97N
one
�1
day
0.3
0.3
Fis
sure
3;
2–4
kmup
rift
ofP
u‘u
‘� O‘� o
(1)
Lav
ala
kein
side
the
Pu‘
u‘� O
‘� ove
ntdr
aine
dan
dcr
ater
floo
rdr
oppe
d15
0m
;(2
)P
u‘u
‘� O‘� o
wes
tfl
ank
coll
apse
d;
115
mga
pin
wes
tsi
deof
Pu‘
u‘� O
‘� o;
(3)
fiss
ure
4km
erup
ted
upri
ftfo
r1
day,
inan
ddo
wnr
ift
ofN
apau
Cra
ter,
foll
owed
bylo
nges
ter
upti
vehi
atus
sinc
e19
87(2
4da
ys);
dist
inct
lava
chem
istr
yin
volv
edm
agm
am
ixin
gw
ith
diff
eren
tiat
edm
agm
ast
ored
inri
ftzo
ne
GREENE ET AL. : K�ıLAUEA’S PU‘U ‘�o‘�o ERUPTION (1983–2010) 10.1002/ggge.20285
4853

Tab
le1.
(con
tinu
ed)
Pri
mar
yV
ent
Epi
sode
Epi
sode
Sta
rtD
ate
Rep
ose
Len
gth
(Day
s)E
piso
deL
engt
hV
olum
e(1
06x
m3)
Eru
ptio
nR
ate
(103
m3/d
ay)
Ven
t/L
ocat
ion
Bri
efD
escr
ipti
on
Pu‘
u‘� O
‘� o55
24F
eb19
9724
10ye
ars
�26
520
0–50
0P
u‘u
‘� O‘� o
and
its
flan
kL
ava
spil
led
from
crat
erto
form
new
pond
;la
vasp
ille
dfr
omcr
ater
am
onth
late
r;ne
wfl
ank
vent
erup
tion
sw
est
and
sout
hwes
tof
cone
;sp
atte
rco
nes
onfl
anks
crus
ted
over
topr
oduc
em
ostl
ytu
be-f
edpa
hoeh
oe;
byJu
ne19
97la
vaov
erto
pped
the
gap
inw
all
ofP
u‘u
‘� O‘� o
and
flow
edfr
omcr
ater
for
firs
tti
me
in11
year
s;fl
ank
vent
sun
der-
min
edP
u‘u
‘� O‘� o
cone
inD
ecem
ber,
1997
;P
uka
Nui
col-
laps
epi
tfo
rmed
onso
uthw
est
flan
kof
cone
;31
paus
esoc
curr
eddu
ring
epis
ode
55P
u‘u
‘� O‘� o
5619
June
2007
Non
e�
6h
0.00
145
0.00
036
250
mlo
ngfi
ssur
ein
the
fore
stno
rthe
ast
ofK
ane
Nui
oH
amo,
appr
oxim
atel
y6
kmw
est
ofP
u‘u
‘� O‘� o
Fat
her’
sD
ayer
upti
onne
arK
ane
Nui
oH
amo
nort
hof
Mak
aopu
hiC
rate
r;m
agm
asu
pply
toP
u‘u
‘� O‘� o
was
cut
off
on17
June
2007
;ea
rthq
uake
swar
ms
indi
cate
dm
agm
am
ovem
enti
nth
eup
per
ER
Z;
spat
ter
erup
ted
from
fiss
ure
info
rest
edar
ea;
smal
llav
afl
ow(2
00m�
50m
)ac
com
-pa
nied
intr
usio
nin
ER
Z;
crat
erfl
oor
inP
u‘u
‘� O‘� o
col-
laps
edan
der
upti
onsh
utof
fP
u‘u
‘� O‘� o
571
July
2007
19da
ysN
one
0.82
–1.2
3�
65P
u‘u
‘� O‘� o
crat
erA
fter
abou
ttw
o-w
eeks
ofqu
iet,
the
erup
tion
bega
nag
ain
on1
July
.Lav
abe
gan
tore
fill
the
crat
er.O
n8
July
,eff
u-si
onw
aned
asth
ecr
ater
bega
nto
upli
ftin
api
ston
-lik
efa
shio
n.T
hecr
ater
then
bega
nto
fill
and
reac
hed
tow
ithi
n30
mof
the
east
ern
rim
ofP
u‘u
‘� O‘� o
crat
erby
mid
-Jul
y.P
u‘u
‘� O‘� o
5821
July
2007
Non
e~4
year
sen
ded
7M
arch
2011
�32
0(a
sof
the
end
of20
09)
Fro
mfi
ssur
eea
stof
Pu‘
u‘� O
‘� ocr
ater
Per
ched
lava
chan
nel,
root
less
shie
lds;
for
the
firs
tti
me
sinc
e7
Feb
ruar
y19
92,l
ava
begi
nser
upti
ngea
stof
Pu‘
u‘� O
‘� ocr
ater
.Tha
nksg
ivin
gE
vebr
eako
ut,l
ava
bypa
sses
21Ju
ly20
07ch
anne
lan
der
upts
onch
anne
lfl
ank
;5
Mar
ch20
08oc
ean
entr
yac
tive
for
the
firs
tti
me
sinc
eJu
ne20
07;
expl
osio
nin
Hal
ema‘
uma‘
uC
rate
rat
sum
mit
on19
Mar
ch20
08;
June
2008
spat
teri
ngve
nts
and
asm
all
pond
ofla
vain
Pu‘
u‘� O
‘� o,l
ava
foun
tain
sgu
shfr
omth
eT
EB
tube
syst
em,c
hann
eliz
ed’a
’� afl
ows
inR
oyal
Gar
dens
,and
larg
eli
ttor
alex
plos
ions
atK
� ılau
ea’s
ocea
nen
try
near
Kal
apan
a;
Wai
kupa
naha
ocea
nen
try
acti
veth
roug
hm
uch
of20
09,a
ndoc
casi
onal
lyK
upap
a’u
ocea
nen
try
tow
est
a Rep
ose
leng
thre
fers
todu
rati
onof
paus
ebe
twee
ner
upti
veep
isod
es.
Epi
sode
iden
tifi
esoc
curr
ence
sof
foun
tain
ing
orla
vafl
owse
para
ted
byqu
iesc
ent
peri
ods.
Vol
ume
isde
nse
rock
equi
vale
nt(D
RE
)er
upte
ddu
ring
each
epis
ode.
Dat
aso
urce
s:G
arci
aet
al.[
2000
]an
dre
fere
nces
ther
ein,
Wol
feet
al.[
1998
],H
elik
eran
dM
atto
x[2
003]
.
GREENE ET AL. : K�ıLAUEA’S PU‘U ‘�o‘�o ERUPTION (1983–2010) 10.1002/ggge.20285
4854

3. Description of Samples andAnalyses Performed in This Study
[7] This study presents 52 new high-precision Pband Sr isotope analyses (from 1983 to 1997 and2006 to 2010), 11 new O isotope analyses (fromafter 1997; Table 2), and 13 new ICP-MS trace-element analyses of Pu‘u ‘�O‘�o lava samples(mostly after 2005; data and analytical methodsare presented in the supporting information).1 NewXRF major- and trace-element analyses for 52Pu‘u ‘�O‘�o lavas erupted from 2006 to 2010 arealso presented. In addition, new XRF trace-element analyses are given for samples eruptedprior to 1998, when a new, more precise XRFinstrument became available. Almost all of thesamples in this study were collected in a moltenstate and quenched with water to minimize poster-uption crystallization. The sample names are thedate that each lava sample was collected (e.g.,day-month-year), which is generally within a dayof its eruption when lava is flowing in open chan-nels on the surface or in lava tubes [e.g., Garciaet al., 2000] or up to a week or more when it isoozing within slowly advancing pahoehoe flows[K. Ho, personal communication, 2013]. Descrip-tions of the petrography of typical Pu‘u ‘�O‘�o lavascan be found in Garcia et al. [1989, 1992, 1996,2000] and Marske et al. [2008]. Fourteen high-precision Pb and Sr isotope ratios for Pu‘u ‘�O‘�olavas erupted from 1998 to 2005 from Marskeet al. [2008] and 15 O isotope analyses from Gar-cia et al. [1998] are listed in Table 2 and areincluded in plots for completeness.
4. Temporal Geochemical Variationsin Lavas From 1983 to 2010
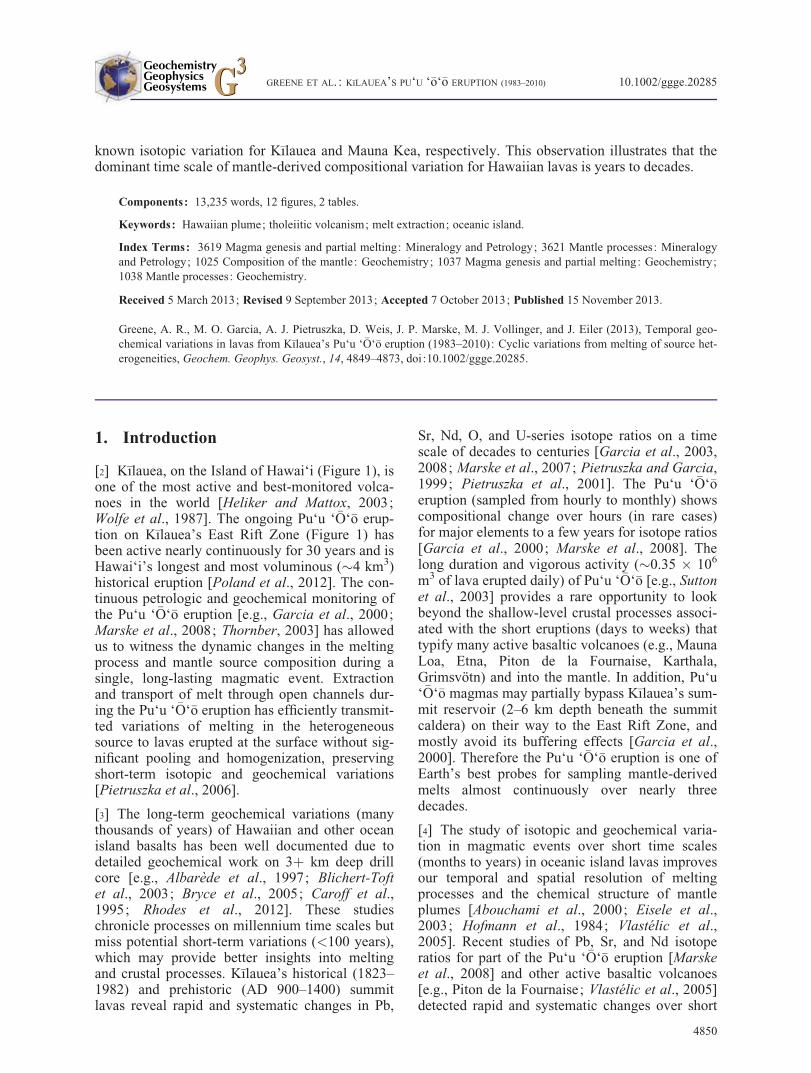
[9] Early Pu‘u ‘�O‘�o lavas (1983 to early 1985) re-cord rapid (hours to days) variations in major andcompatible trace-element abundances (Figure 2;Supporting information). These lavas show petro-graphic evidence for both crystal fractionation andmagma mixing [Wolfe et al., 1987; Garcia et al.,1992]. Crystal fractionation of olivine (with minorclinopyroxene and plagioclase, especially for 1983lavas) is the dominant process controlling short-term major-element variation in Pu‘u ‘�O‘�o lavas[Garcia et al., 1992]. To remove the effects ofcrystal fractionation on parental magma composi-
tions, major-element abundances of lavas contain-ing only olivine (MgO >7.0 wt %) werenormalized to 10 wt % MgO by the addition ofequilibrium composition olivine (98.5%) and spi-nel (1.5%) in 0.5 mol % steps, as described byGarcia et al. [2003]. The increases in MgO, CaO/Al2O3, and CaO/TiO2 and decreases in MgO-normalized incompatible element abundances(e.g., TiO2, K2O) between 1983 and early 1985(Figure 2) reflect mixing of new high-MgOmagma with decreasing amounts of a hybridmagma formed at the start of the eruption by mix-ing two differentiated, rift-zone stored magmas[Garcia et al., 1989, 1992]. Lavas erupted afterearly 1985 show no petrographic or geochemicalevidence for mixing [Shamberger and Garcia,2007] until the 1997 uprift eruption, which is dis-cussed below.
[10] From 1985 to 1994, Pu‘u ‘�O‘�o lavas show awide range in MgO reflecting the periodic hiatusesin eruptive activity [Garcia et al., 1992], and grad-ual changes in MgO-normalized concentrations ofmajor elements (TiO2 and K2O), and ratios ofmajor (e.g., CaO/Al2O3; Figure 2) and trace ele-ments (Nb/Y; Figure 3). In 1994, lavas began aperiod of increasing MgO-normalized SiO2 andoverall decreasing MgO-normalized TiO2 that per-sisted until 2001. Other geochemical parameterscontinued their long-term trends (e.g., decreasingCaO/Al2O3, MgO-normalized K2O, and Nb/Y,and increasing Zr/Nb; Figures 2 and 3). Starting inmid- to late 2003, there was an increase in lavaproduction with effusion rates doubling in 2005[Poland et al., 2012]. The lava MgO contentdecreased from 2003 to 2007 and was relativelylow (<7.5 wt %, mostly <7.2 wt %) with limitedvariation (Figure 2). This decrease continued theoverall trend of decreasing MgO that started in�1998, as noted by Poland et al. [2012]. There isalso a decrease in MgO-normalized SiO2 and anincrease in MgO-normalized TiO2 and K2O during2003–2007 (Figures 2 and 3). Lava MgO increasedfrom 2008 to 2009 as did CaO/TiO2 and values ofMgO-normalized SiO2, although MgO and SiO2
values dropped afterwards for the most recentlyerupted samples that were analyzed in this study(Figure 2). For more on major- and trace-elementvariations in 1983–2005 Pu‘u ‘�O‘�o lavas, see Gar-cia et al. [1989, 1992, 1996, 2000], Marske et al.[2008], and Thornber [2003].
[11] The brief eruptive outbreaks uprift of the Pu‘u‘�O‘�o vent in 1997 (�3 km uprift for episode 54)and 2007 (�6 km uprift for episode 56; Figure 1)
1Additional supporting information may be found in the onlineversion of this article.
GREENE ET AL. : K�ıLAUEA’S PU‘U ‘�o‘�o ERUPTION (1983–2010) 10.1002/ggge.20285
4855

Table 2. Pb, Sr and O Isotopic Geochemistry of Pu‘u ‘�O‘�o Lavas from 1983–2010a
Sample 206Pb/204Pb 2� 207Pb/204Pb 2� 208Pb/204Pb 2� 87Sr/86Sr 2� �18O 1�
23 Jan 1983 � 18.5247 0.0009 15.4800 0.0008 38.155 0.0020 0.703590 0.000009 4.56 0.029 Apr 1983 18.5309 0.0007 15.4893 0.0007 38.165 0.0017 0.703573 0.0000083 July 1983 � 18.4780 0.0007 15.4765 0.0008 38.117 0.0017 0.703573 0.000007 4.77 0.0331 Jan 1984 18.4595 0.0009 15.4765 0.0007 38.103 0.0020 0.703587 0.00000812 Sep 1984 18.4417 0.0008 15.4747 0.0007 38.091 0.0019 0.703555 0.0000098 Feb 1985 � 18.4342 0.0010 15.4743 0.0009 38.087 0.0024 0.703567 0.000008 4.76 0.05
21 Apr 1985 � 4.82 0.1030 Jul 1985 18.4306 0.0007 15.4756 0.0007 38.089 0.0020 0.703571 0.0000082 Jun 1986 � 18.4138 0.0009 15.4755 0.0008 38.079 0.0020 0.703580 0.000009 4.94 0.3026 Jun 1986 � 4.77 0.0213 Sep 1986 � 18.4138 0.0008 15.4726 0.0007 38.074 0.0020 0.703590 0.000008 5.17 0.0116 Mar 1987 � 18.4108 0.0006 15.4717 0.0005 38.069 0.0014 0.703589 0.000009 5.25 0.0218 Oct 1987 18.3992 0.0008 15.4746 0.0008 38.068 0.0022 0.703597 0.00000919 Jan 1988 18.3952 0.0006 15.4715 0.0006 38.061 0.0016 0.703577 0.00000818 Aug 1988 18.3871 0.0008 15.4703 0.0007 38.052 0.0017 0.703583 0.00000926 Mar 1989 � 18.3882 0.0007 15.4717 0.0007 38.055 0.0019 0.703584 0.000009 5.11 0.05
7 Jul 1989 18.3861 0.0010 15.4725 0.0009 38.054 0.0022 0.703581 0.0000097 Jul 1989 † 18.3851 0.0009 15.4710 0.0008 38.052 0.0021 0.703576 0.0000097 Jan 1990 � 18.3881 0.0009 15.4745 0.0008 38.056 0.0018 0.703584 0.000008 5.03 0.01
27 May 1990 18.3864 0.0008 15.4716 0.0007 38.054 0.0020 0.703603 0.00000721 Oct 1990 18.3856 0.0007 15.4693 0.0006 38.049 0.0017 0.703597 0.00000812 May 1991 � 18.3992 0.0009 15.4739 0.0007 38.063 0.0019 0.703581 0.000008 5.08 0.041 Aug 1991 � 5.11 0.046 Jun 1992 � 18.4048 0.0009 15.4721 0.0009 38.061 0.0019 0.703585 0.000008 5.04 0.10
13 Aug 1993 � 18.4112 0.0007 15.4752 0.0006 38.072 0.0015 0.703611 0.000008 4.98 0.074 Jan 1994 18.4098 0.0009 15.4736 0.0008 38.067 0.0020 0.703607 0.000008
25 Apr 1994 � 18.4100 0.0009 15.4737 0.0009 38.068 0.0027 0.703586 0.000008 5.01 0.029 Oct 1994 18.4059 0.0008 15.4718 0.0007 38.066 0.0019 0.703598 0.000007
27 Apr 1995 � 18.4059 0.0009 15.4721 0.0008 38.066 0.0023 0.703604 0.000009 5.25 0.0514 Oct 1995 18.4068 0.0008 15.4729 0.0008 38.071 0.0021 0.703602 0.00000919 Jan 1996 � 5.19 0.0715 Mar 1996 18.4064 0.0010 15.4738 0.0008 38.070 0.0023 0.703592 0.00000922 Aug 1996 18.4038 0.0009 15.4722 0.0008 38.065 0.0016 0.703612 0.00000710 Jan 1997 � 18.4010 0.0012 15.4728 0.0011 38.064 0.0019 0.703606 0.000009 5.2 0.0523 Jul 1997 18.3993 0.0010 15.4729 0.0010 38.068 0.0025 0.703601 0.00000710 Jan 1998 18.3958 0.0007 15.4728 0.0006 38.067 0.0014 0.703591 0.00000810 Jan 1998 † 18.3940 0.0007 15.4711 0.0006 38.063 0.0016 0.703593 0.00000711 May 1998 18.4005 0.0009 15.4740 0.0008 38.071 0.0020 0.703605 0.0000107 Sep 1998 18.4082 0.0008 15.4775 0.0006 38.083 0.0017 0.703601 0.000006 5.33 0.067 Sep 1998 �† 18.4107 0.0004 15.4727 0.0005 38.075 0.0012 5.29 0.0813 Feb 1999 18.4068 0.0010 15.4783 0.0008 38.085 0.0021 0.703607 0.00000613 Feb 1999 �† 18.4124 0.0004 15.4736 0.0004 38.076 0.001119 Jun 1999 18.3987 0.0010 15.4805 0.0007 38.085 0.0020 0.703620 0.00000927 Oct 1999 � 18.4018 0.0004 15.4726 0.0004 38.069 0.0011 0.703622 0.000009 5.36 0.0819 Feb 2000 � 18.4072 0.0004 15.4712 0.0004 38.072 0.0011 0.703624 0.00000721 Jun 2000 � 18.4067 0.0004 15.4704 0.0004 38.069 0.0011 0.703638 0.000007 5.28 0.088 Jan 2001 � 18.4116 0.0004 15.4721 0.0004 38.074 0.0011 0.703627 0.000012 5.31 0.087 Jul 2001 � 18.4137 0.0004 15.4719 0.0004 38.073 0.0013 0.703626 0.0000099 Feb 2002 � 18.4139 0.0004 15.4707 0.0004 38.069 0.0011 0.703637 0.000008
20 Aug 2002 � 18.4152 0.0004 15.4722 0.0004 38.072 0.0011 0.703639 0.00000512 Apr 2003 � 18.4161 0.0005 15.4726 0.0005 38.072 0.0013 0.703641 0.000005 5.31 0.0815 Jan 2004 � 18.4154 0.0005 15.4719 0.0005 38.069 0.0012 0.703632 0.000007 5.21 0.087 Jun 2004 � 18.4146 0.0003 15.4716 0.0004 38.068 0.0010 0.703624 0.00000731 Jan 2005 � 18.4170 0.0005 15.4735 0.0006 38.075 0.0012 0.703624 0.000005 4.96 0.138 Aug 2005 � 18.4119 0.0005 15.4727 0.0005 38.070 0.0013 0.703622 0.00001029 Jan 2006 � 18.4087 0.0004 15.4720 0.0004 38.065 0.0012 0.703623 0.00000924 Jun 2006 † 18.4062 0.0028 15.4724 0.0026 38.066 0.0059 0.703612 0.000008 5.23 0.0324 Jun 2006 � 18.4073 0.0016 15.4714 0.0018 38.063 0.0060 0.703617 0.000013 5.23 0.036 Apr 2007 � 18.4065 0.0003 15.4715 0.0003 38.063 0.0009 0.703617 0.000007 5.35 0.1317 Jun 2007 � 18.4019 0.0004 15.4709 0.0004 38.062 0.0012 0.703626 0.000006 5.63 0.1322 Mar 2008 � 18.4038 0.0003 15.4700 0.0003 38.061 0.0010 0.703607 0.000008 5.45 0.132 May 2008 � 18.4045 0.0003 15.4721 0.0004 38.066 0.0010 0.703609 0.00000915 Nov 2008 18.3972 0.0009 15.4704 0.0007 38.058 0.0024 0.703600 0.00000829 Jan 2009 � 18.4003 0.0005 15.4709 0.0006 38.061 0.0012 0.703628 0.0000087 May 2009 18.4005 0.0008 15.4736 0.0007 38.066 0.0020 0.703624 0.0000104 Jun 2009 � 18.4009 0.0003 15.4720 0.0004 38.064 0.0010 0.703610 0.000007
16 Oct 2009 � 18.3994 0.0005 15.4714 0.0006 38.062 0.0012 0.703622 0.00000722 Jan 2010 � 18.3987 0.0005 15.4708 0.0005 38.060 0.0013 0.703617 0.000007
a� indicates analysis at San Diego State University (SDSU), analyses from 7 Sep 1998 to 8 Aug 2005 are from Marske et al. [2008]. Sr isotopeanalyses from 1983–1997 and 2006–2010 were performed at PCIGR. † Chemistry duplicate. � Published �18O analyses from Garcia et al. [1998].Analytical methods are described in the supporting information. 24 Jun 2006 is an in-house glass standard called Menehune collected from a Pu‘u‘�O‘�o lava flow (errors are the external 62s of the replicate analyses; average of four analyses for Pb and Sr at PCIGR; 68 for Pb and 26 for Sr atSDSU). US Geological Survey sample numbers for lavas between up to16 Mar 87 are 23 Jan 1983: 1–054, 9 April 1983: 3–117, 3 Jul 1983: 5–139, 31 Jan 1984: 14–232, 12 Sep 1984: KE24–25 310S, 8 Feb 1985: 30–362, 30 Jul 1985: 35–419, 1 Jan 1986:40–484, 2 Jun 1986: 46–536, 13Sep 1986: 48–649, 16 Mar 1987: 48–714F.
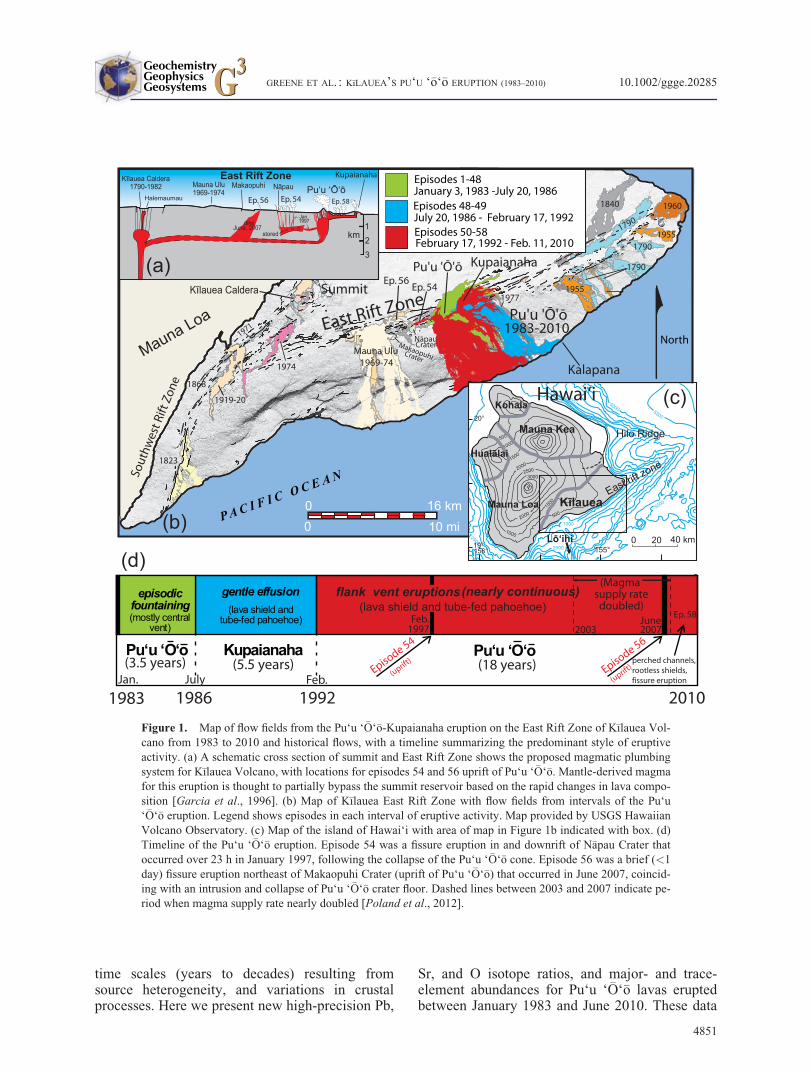
occurred after major collapses of the Pu‘u ‘�O‘�ocrater floor (Table 1). The lavas erupted from theseuprift vents were geochemically distinct. Com-pared to coeval Pu‘u ‘�O‘�o vent lavas, those from
episode 54 have lower MgO (5.6–6.4 versus 7.5–10.1 wt %), CaO/TiO2 (2.8–3.4 versus 4.4), Sr/Nband Zr/Nb ratios (Figure 3). These geochemicalsignatures and the petrographic evidence of
5
6
7
8
9
10
0.70
0.72
0.74
0.76
0.78
0.80
0.82
0.84
0.86
48.8
49.0
49.2
49.4
49.6
49.8
50.0
50.2
50.4
3.0
3.2
3.4
3.6
3.8
4.0
4.2
4.4
4.6
4.8
2.1
2.2
2.3
2.4
2.5
2.6
0.35
0.40
0.45
0.50
0.55
1983
1984
1985
1986
1987
1988
1989
199 0
1991
1992
1993
1994
1995
1996
1997
1998
1999
2000
2001
2 002
2003
2004
2005
2006
2007
2008
2009
2010
1983
1984
1985
1986
1987
1988
1989
1990
1991
1992
1993
1994
1995
1996
1997
199 8
1999
2000
2001
2002
2003
2004
2005
2006
2007
2008
2009
2010
84 86 88 90 92 94 96 98 00 02 04 06 08 1084 86 88 90 92 94 96 98 00 02 04 06 08 10
84 86 88 90 92 94 96 98 00 02 04 06 08 10 84 86 88 90 92 94 96 98 00 02 04 06 08 10
Ep. 54
TiO2 (wt%)normalized to 10 wt% MgO
(Magma supply
ratedoubled)
2003-07
1983-19861986-19921992-2010
MgO (wt%)
CaO/Al2O3 (wt%)
SiO2 (wt%)
CaO/TiO2 (wt%)
K2O (wt%)
(b)
(d)(c)
(a)
(f)(e)
normalized to 10 wt% MgO
normalized to 10 wt% MgO(Magma supply
ratedoubled)
2003-07
(Magma supply
ratedoubled)
2003-07
(Magma supply
ratedoubled)
2003-07
1983-19861986-19921992-2010
normalized to 10 wt% MgO
normalized to 10 wt% MgO
Ep. 56
Figure 2. Major-element variation diagrams for Pu‘u ‘�O‘�o lavas from 1983 to 2010. All major elements andratios except MgO were normalized to 10 wt % MgO [the most primitive lava erupted from Pu‘u ‘�O‘�o; Gar-cia et al., 2000] by addition of equilibrium composition olivine (98.5%) and spinel (1.5%) in 0.5 mol % steps[Garcia et al., 2003; Rhodes and Vollinger, 2004]. Pu‘u ‘�O‘�o lavas with <7.2 wt % MgO may have crystal-lized minerals other than olivine (e.g., clinopyroxene and plagioclase) and were not included in the olivinenormalization procedure and are not shown in all the plots, except MgO. Episode 54 (Ep. 54; 29–30 January1997) lavas involved mixing of evolved magmas stored in the rift zone and MgO-rich magma. Three intervalsof eruptive activity in legend and colors correspond with those shown in Figure 1. CaO/TiO2 and CaO/Al2O3
ratios also use normalized data although are virtually unaffected by olivine fractionation. Vertical lines indi-cate nearly double magma supply rate between 2003 and 2007 [Poland et al., 2012]. Data are presented in thesupporting information. Uncertainty for analyses is described in the supporting information.
GREENE ET AL. : K�ıLAUEA’S PU‘U ‘�o‘�o ERUPTION (1983–2010) 10.1002/ggge.20285
4857

disequilibrium in the episode 54 lavas are thoughtto result from mixing Pu‘u ‘�O‘�o magma withstored, differentiated rift zone magma [Garciaet al., 2000; Thornber et al., 2003]. In contrast,episode 56 lavas have higher MgO (8.5 versus 7.2wt %) and a relatively high �18O value (5.6 versus5.4%) but are otherwise geochemically indistin-guishable from contemporaneous Pu‘u ‘�O‘�o lavas.
[12] The 206Pb/204Pb ratios for Pu‘u ‘�O‘�o lavasdecreased rapidly through the episodic fountainingperiod (1983–1986) and reached a minimumbetween 1989 and 1991 during the Kupaianahaphase (Figure 4b and Table 2). The rapid decreasein 206Pb/204Pb continues the longer-term trend ofdecreasing Pb isotope ratios for K�ılauea lavaserupted following the 1924 collapse of the summitcaldera (Figure 4a). After 1991, the trend of
206Pb/204Pb ratios in Pu‘u ‘�O‘�o lavas shows cyclicvariations with two broad humps, each cycle span-ning approximately 10 years (except for a smalloffset from the overall trend between January1998 and June 1999; Figure 4b). The cyclic varia-tion in Pb isotope ratios is well shown by208Pb/206Pb ratios, which inversely mirror the206Pb/204Pb trend (Figures 4 and 5).
[13] The 87Sr/86Sr ratios of Pu‘u ‘�O‘�o lavas extendthe temporal trend of increasing Sr isotope ratiosfor K�ılauea lavas that started following the 1924caldera collapse (Figure 4c). Overall, Pu‘u ‘�O‘�olavas display an increase in 87Sr/86Sr from 1983 to�2003 and a slight decrease after 2004 (Figure4d). Prior to 1999, the 87Sr/86Sr and 206Pb/204Pbratios of the lavas are not well correlated, althoughthere is an overall inverse correlation between the
1983
1984
1985
1986
1987
1988
1989
1990
1991
1992
1993
1994
1995
1996
1997
1998
1999
2000
2001
2002
2003
2004
2005
2006
2007
2008
2009
2010
0.4
0.5
0.6
0.7
0.8
1983
1984
1985
1986
1987
1988
1989
1990
1991
1992
1993
1994
1995
1996
1997
1998
1999
2000
2001
2002
2003
2004
2005
2006
2007
2008
2009
2010
2.0
2.1
2.2
2.3
2.4
2.5
1.9
9
10
11
12
16
18
20
22
24
26 Sr/Nb
Nb/Y La/Sm
(c)
(a)
(d)
1983-19861986-19921992-2010
Ep. 54
Ep. 54
Ep. 54
84 86 88 90 92 94 96 98 00 02 04 06 08 10 84 86 88 90 92 94 96 98 00 02 04 06 08 10
(Magma supply
ratedoubled)
2003-07
Ep. 54
Zr/Nb
(b)
(Magma supply
ratedoubled)
2003-07
±2 SE ±2 SE
±2 SE ±2 SE
Kīlauea summit
(Sep.1982)
Kīlauea summit
(Sep.1982)
Kīlauea summit
(Sep.1982)
Kīlauea summit
(Sep.1982)
Figure 3. Trace-element ratios versus time for Pu‘u ‘�O‘�o lavas from 1983 to 2010. Overall exponential vari-ation in trace-element ratios indicates progressive depletion of the source. In the La/Sm versus time plot, asubset of samples analyzed at PCIGR (April 1983, January 1984, September 1984, and April 2007 to January2010) are normalized to reference material Kil-93 (La/Sm of 2.09, average value from Australia National Uni-versity where most ICP-MS analyses were performed). Vertical lines indicate nearly double magma supplyrate between 2003 and 2007 [Poland et al., 2012]. Trace-element abundances in ppm (data shown in support-ing information). Average 62� bars are shown in a corner of each panel. September 1982 K�ılauea summitlava composition from Pietruszka and Garcia [1999].
GREENE ET AL. : K�ıLAUEA’S PU‘U ‘�o‘�o ERUPTION (1983–2010) 10.1002/ggge.20285
4858
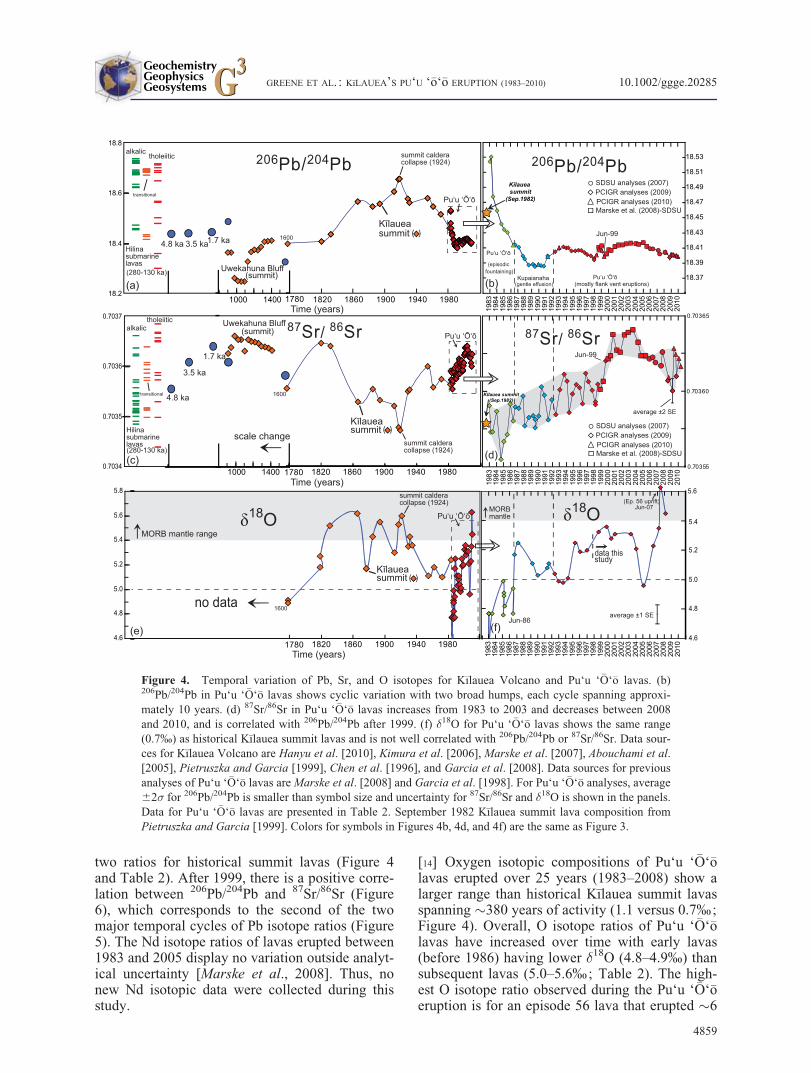
two ratios for historical summit lavas (Figure 4and Table 2). After 1999, there is a positive corre-lation between 206Pb/204Pb and 87Sr/86Sr (Figure6), which corresponds to the second of the twomajor temporal cycles of Pb isotope ratios (Figure5). The Nd isotope ratios of lavas erupted between1983 and 2005 display no variation outside analyt-ical uncertainty [Marske et al., 2008]. Thus, nonew Nd isotopic data were collected during thisstudy.
[14] Oxygen isotopic compositions of Pu‘u ‘�O‘�olavas erupted over 25 years (1983–2008) show alarger range than historical K�ılauea summit lavasspanning �380 years of activity (1.1 versus 0.7% ;Figure 4). Overall, O isotope ratios of Pu‘u ‘�O‘�olavas have increased over time with early lavas(before 1986) having lower �18O (4.8–4.9%) thansubsequent lavas (5.0–5.6% ; Table 2). The high-est O isotope ratio observed during the Pu‘u ‘�O‘�oeruption is for an episode 56 lava that erupted �6
Uwekahuna Bluff
Uwekahuna Bluff
Hilinasubmarinelavas
0.7034
0.7035
0.7036
0.7037
1983
1984
1985
1986
1987
1988
1989
1990
1991
1992
1993
1994
1995
1996
1997
1998
1999
2000
2001
2002
2003
2004
2005
2006
2007
2008
2009
2010
18.37
18.39
18.41
18.43
18.45
18.47
18.49
18.51
18.53
0.70355
0.70360
0.70365
1983
1984
1985
1986
1987
1988
1989
1990
1991
1992
1993
1994
1995
1996
1997
1998
1999
2000
2001
2002
2003
2004
2005
2006
2007
2008
2009
2010
Kīlaueasummit
Kīlaueasummit
PCIGR analyses (2009)
Marske et al. (2008)-SDSUPCIGR analyses (2010)
Time (years)
Time (years)
(summit)
(summit)
Time (years)
Kīlaueasummit
summit calderacollapse (1924)
summit calderacollapse (1924)
average ±2 SE
MORB mantle range
SDSU analyses (2007)
δ18O
18.2
18.4
18.6
18.8
1780 1820 1860 1900 1940 19801000 1400
1780 1820 1860 1900 1940 19801000 1400
1600
1780 1820 1860 1900 1940 1980
1600
1600
Jun-99
Jun-99
Jun-86
Jun-07(Ep. 56 uprift)
( )
( )
( )
4.8 ka 3.5 ka1.7 ka
4.8 ka
3.5 ka
1.7 ka
206Pb/204Pb
87Sr/ 86Sr
average ±1 SE
δ18O
87Sr/ 86Sr
206Pb/204Pb
(280-130 ka)
tholeiiticalkalic
transitional
Hilinasubmarinelavas(280-130 ka)
tholeiiticalkalic
transitional
(episodic fountaining)
Kupaianaha(gentle effusion)
Pu‘u ‘Ō‘ō
Pu‘u ‘Ō‘ō (mostly flank vent eruptions)(a)
(c)
(b)
(d)
Pu‘u ‘Ō‘ō
Pu‘u ‘Ō‘ō
Pu‘u ‘Ō‘ō
(e) (f)
data thisstudy
MORBmantle
summit calderacollapse (1924)
PCIGR analyses (2009)
Marske et al. (2008)-SDSUPCIGR analyses (2010)
SDSU analyses (2007)
4.6
4.8
5.0
5.2
5.4
5.6
5.8
4.6
4.8
5.0
5.2
5.4
5.619
8319
8419
8519
8619
8719
8819
8919
9019
9119
9219
9319
9419
9519
9619
9719
9819
9920
0020
0120
0220
0320
0420
0520
0620
0720
0820
0920
10
no data
scale change
Kīlauea summit
(Sep.1982)
Kīlauea summit(Sep.1982)
Figure 4. Temporal variation of Pb, Sr, and O isotopes for K�ılauea Volcano and Pu‘u ‘�O‘�o lavas. (b)206Pb/204Pb in Pu‘u ‘�O‘�o lavas shows cyclic variation with two broad humps, each cycle spanning approxi-mately 10 years. (d) 87Sr/86Sr in Pu‘u ‘�O‘�o lavas increases from 1983 to 2003 and decreases between 2008and 2010, and is correlated with 206Pb/204Pb after 1999. (f) �18O for Pu‘u ‘�O‘�o lavas shows the same range(0.7%) as historical K�ılauea summit lavas and is not well correlated with 206Pb/204Pb or 87Sr/86Sr. Data sour-ces for K�ılauea Volcano are Hanyu et al. [2010], Kimura et al. [2006], Marske et al. [2007], Abouchami et al.[2005], Pietruszka and Garcia [1999], Chen et al. [1996], and Garcia et al. [2008]. Data sources for previousanalyses of Pu‘u ‘�O‘�o lavas are Marske et al. [2008] and Garcia et al. [1998]. For Pu‘u ‘�O‘�o analyses, average62� for 206Pb/204Pb is smaller than symbol size and uncertainty for 87Sr/86Sr and �18O is shown in the panels.Data for Pu‘u ‘�O‘�o lavas are presented in Table 2. September 1982 K�ılauea summit lava composition fromPietruszka and Garcia [1999]. Colors for symbols in Figures 4b, 4d, and 4f) are the same as Figure 3.
GREENE ET AL. : K�ıLAUEA’S PU‘U ‘�o‘�o ERUPTION (1983–2010) 10.1002/ggge.20285
4859

km uprift from the Pu‘u ‘�O‘�o vent in mid-June2007. The episode 56 eruption is related to intru-sion of a dike from the upper East Rift Zone, sothis lava was probably not derived from the shal-low reservoir of magma beneath Pu‘u ‘�O‘�o [Mont-gomery-Brown et al., 2010]. Thus, its �18O valueis probably representative of the magma feedingthe Pu‘u ‘�O‘�o eruption. It is identical to the highestvalues observed among historical summit lavas(5.6% ; Figure 4). Variations of �18O in Pu‘u ‘�O‘�olavas do not correlate with Pb or Sr isotope ratios,or with other geochemical parameters, as wasnoted for previous O isotope work on lavas fromthis eruption [Garcia et al., 1998]. Therefore, Pu‘u‘�O‘�o lava Pb and Sr isotope ratios were apparentlynot affected by the processes causing variable Oisotope ratios.
5. Discussion
[15] The high eruption rate and continuous natureof the Pu‘u ‘�O‘�o eruption provide an exceptionalopportunity to use lava chemistry to evaluate thechanging roles that source, melting, and crustalprocesses play during this single prolonged erup-tion. Previous Pb isotope and trace-element studieson lavas from several multiple-year eruptions ofPiton de la Fournaise Volcano (R�eunion Island)have discerned contributions from multiple com-ponents within the R�eunion mantle plume and aperiodic role for shallow-level contamination [Pie-truszka et al., 2009; Vlast�elic et al., 2005, 2007].Similarly, extreme Pb isotope variability in meltinclusions from Iceland basaltic lavas indicate sig-nificant source heterogeneity, with binary mixingrelationships that may result from combining sol-ids in the mantle and two stages of melt mixing (inporous mantle melt-transport channels and lowercrustal magma chambers) [Maclennan, 2008].Similarly, the geochemistry and petrography ofPu‘u ‘�O‘�o lavas have been used to interpret theextent of crustal magmatic processes (olivine frac-tionation and accumulation, mixing of higher-MgO and stored rift-zone magmas, and crustalassimilation) and mantle processes (degree of par-tial melting, melt extraction and migration, andsource heterogeneity) during the Pu‘u ‘�O‘�o erup-tion until 2005 [e.g., Garcia et al., 1998, 2000;Marske et al., 2008]. Here we use new high-precision Pb, Sr, and O isotope ratios, and major-and trace-element data for the entire Pu‘u ‘�O‘�oeruption (1983–2010) to evaluate the causes ofcyclic and other short-term variability in the proc-esses that operate from the source to the surface
within K�ılauea Volcano. The effects of crustalprocesses (crystal fractionation, magma mixing,and crustal contamination) on modifying Pu‘u‘�O‘�o lava compositions are evaluated beforeexamining mantle source and melt transportprocesses.
5.1. Magma Mixing and CrystalFractionation During Early EpisodicActivity (1983–1985)
[16] The largest compositional changes in Pu‘u‘�O‘�o lavas occurred from 1983 to 1985. Thesechanges mostly involved two crustal processes:crystal fractionation and magma mixing. Duringsome single eruptive episodes (5–10, 30, and 31),there were relatively large changes in MgO, Ni,and Cr, which are related to minor (3–5%) olivinefractionation in the shallow Pu‘u ‘�O‘�o reservoirduring eruptive hiatuses [Garcia et al., 1992].These short-term (3–4 weeks) variations are super-imposed on longer term changes that have beenrelated to magma mixing [Garcia et al., 1992;Thornber, 2003]. The longer term variations areevident in plots of MgO-normalized major ele-ments, ratios of incompatible trace elements, andPb isotope ratios (Figures 2–4). Strontium and Oisotopes show less change during this period com-pared to their overall variation during the eruption(Figure 4). The overall progressive compositionalvariation in Pu‘u ‘�O‘�o lavas from 1983–1985 hasbeen attributed to the mixing of new, relativelyMgO-rich magma (>7.5 wt %) with a decreasingproportion of hybrid, rift-zone stored differen-tiated magma (from �30% of the higher MgOmagma in March 1983 to �100% in September1984) [Garcia et al., 1992; Shamberger andGarcia, 2007].
[17] The origin of the higher MgO magma compo-nent from the early phase of the Pu‘u ‘�O‘�o erup-tion may have been: (1) magma from the summitreservoir, as represented by lavas from the Sep-tember 1982 summit eruption; and/or (2) newmantle-derived magma [Garcia et al., 1992;Shamberger and Garcia, 2007]. Scenario 1involves no change in the composition of thehigher MgO magma from September 1982 to1985, whereas scenario 2 requires it. The 1983–1985 Pu‘u ‘�O‘�o lavas have both higher and lower206Pb/204Pb ratios than the September 1982 sum-mit lavas (Figures 4b and 7). Therefore, mixing ofa single 1982 summit magma with rift-zone storedmagma (scenario 1) cannot explain the isotopic
GREENE ET AL. : K�ıLAUEA’S PU‘U ‘�o‘�o ERUPTION (1983–2010) 10.1002/ggge.20285
4860

variation of Pu‘u ‘�O‘�o lavas after �1984, when206Pb/204Pb values are lower than 1982 summitmagma (Figure 7). Ratios of some incompatibletrace elements (Sr/Nb and Zr/Nb) for some lavaswith higher MgO (>7.5 wt %) erupted after mid-1984 also are higher than those for September1982 summit lavas (Figure 3). Thus, if magmafrom the summit reservoir was supplying the Pu‘u‘�O‘�o eruption, its composition must have changedafter the September 1982 eruption and prior toSeptember 1984 (Figures 4 and 7).
[18] The isotopic variations for early Pu‘u ‘�O‘�olavas are consistent with the eruption being sup-plied by new, compositionally variable, mantle-derived magma in addition to or instead of Sep-tember 1982 summit magma. The rate of206Pb/204Pb variation observed for the period afterthe end of early magma mixing is much faster thanduring the previous 30 years (1952–1982) ofK�ılauea summit eruptions (0.016 yr�1 versus0.004 yr�1). These rapid variations in Pb isotopicratios suggest that magmas supplying Pu‘u ‘�O‘�opartially bypassed or did not thoroughly mix withthe summit reservoir [Garcia et al., 1996]. Basedon these observations, the composition of the pa-rental magma delivered to Pu‘u ‘�O‘�o from the
mantle is interpreted to have continually changedfor the remainder of the eruption (i.e., after 1984).The details and cause of this variation are dis-cussed in section 5.3.
5.2. Oxygen Isotope Indications of CrustalContamination and Nature of MantleSource
[19] Lavas from oceanic island volcanoes showwide ranges in oxygen isotopic compositions (4.5–7.5%), which have been attributed to composition-ally variable mantle-derived magmas that weremodified by oxygen exchange and/or crustal con-tamination [Harmon and Hoefs, 1995]. Our previ-ous studies revealed that some Pu‘u ‘�O‘�o andK�ılauea summit magmas experienced significantoxygen isotope exchange with metamorphosedK�ılauea rocks [Garcia et al., 1998, 2008]. This isindicated by the disequilibrium between matrixand coexisting olivine �18O values, the relativelylow �18O values for these lavas (4.7–5.2%) andthe lack of correlation between �18O values andother geochemical parameters [Garcia et al.,1998, 2008].
[20] The highest �18O value observed for any lavaduring the Pu‘u ‘�O‘�o eruption is for the June 2007
208Pb/206Pb
PCIGR analyses (2009)
Marske et al. (2008)-SDSUPCIGR analyses (2010)
SDSU analyses (2007)
(Magma supply
ratedoubled)
2003-07
2.059
2.061
2.063
2.065
2.067
2.069
2.071
1983
1984
1985
1986
1987
1988
1989
1990
1991
1992
1993
1994
1995
1996
1997
1998
1999
2000
2001
2002
2003
2004
2005
2006
2007
2008
2009
2010
Jun-99
(episodic fountaining)
Kupaianaha
(gentle effusion)
Pu‘u ‘Ō‘ō Pu‘u ‘Ō‘ō (mostly flank vent eruptions)
Jun-86
1982summit
Rift-storedmagma
Figure 5. 208Pb/206Pb variation with time for Pu‘u ‘�O‘�o lavas from 1983 to 2010. Previous analyses of Pu‘u‘�O‘�o lavas indicated in legend are from Marske et al. [2008]. Average 62� for 208Pb/206Pb is smaller thansymbol size.
GREENE ET AL. : K�ıLAUEA’S PU‘U ‘�o‘�o ERUPTION (1983–2010) 10.1002/ggge.20285
4861
uprift lava (5.6% ; Figure 4). This value is identi-cal to the highest value reported for historicalK�ılauea summit lavas (1820–1982) [Garcia et al.,2008] and lies within the range of normal mid-ocean ridge basalt (MORB) basalt �18O values(5.4–5.8% ; Figure 4) [Eiler, 2001]. These summitlavas (1832, 1866, 1894, and 1917–1921) wereerupted during periods of sustained lava lake ac-tivity, and are thought to be representative of theprimary uncontaminated magma feeding K�ılauea[Garcia et al., 2008]. Thus, the 2007 uprift ventlava supports our previous interpretation [Garciaet al., 2008] that the �18O value for the mantlesource of K�ılauea’s magma is identical to thesource for MORB.
[21] The earliest Pu‘u ‘�O‘�o lavas (1983–1986)show the strongest signs of disequilibriumbetween coexisting matrix mineral and olivine,
and have the lowest O isotope values (<5.0%)[Garcia et al., 1998]. After the shift to continuouseffusion in July 1986, O isotope ratios are higher(5.2%) and the coexisting olivines were in equilib-rium with host matrix for about 1 year [Garciaet al., 1998]. Subsequently, the matrix O isotopevalues decreased somewhat (to �5.0% ; Figure 4)and those for olivine increased, indicating olivine-matrix disequilibrium. This O isotope disequili-brium continued for two more years, and was fol-lowed by a return to olivine-matrix equilibrium in1995–1997 [Garcia et al., 1998]. After 1997, ma-trix O isotope values are relatively low and nearlyconstant (5.3 6 0.1%) except for a 2005 lava(5.0% ; Figure 4), which was the most evolvedsample (analyzed for O isotopes) since 1984 (6.7wt % MgO). Thus, despite nearly 30 years of vig-orous eruptive activity (producing �4 km3 oflava), oxygen exchange with metamorphosedrocks has probably continued in the Pu‘u ‘�O‘�omagmatic plumbing system. The magnitude of ox-ygen isotope exchange can be estimated assumingbulk assimilation between a parental magma (asreflected by the 2007 uprift sample with a �18Ovalue of 5.6%) and a hydrothermally alteredK�ılauea rift zone lava (1.9%) [Garcia et al., 2008]as a contaminant. Pu‘u ‘�O‘�o lavas erupted justbefore and after the 2007 uprift event have averageO isotope values of 5.4% (Figure 4), indicating�5% bulk contamination, whereas earlier lavas(1986–2006) with average values of 5.2–5.3%,might have experienced 8–11% bulk contamina-tion. This contamination is likely to have occurredin the Pu‘u ‘�O‘�o reservoir and did not have anyobvious effect on other geochemical parameters[Garcia et al., 1998] (Table 2).
5.3. Cyclic Compositional VariationsFrom Mantle Processes (1985–2010)
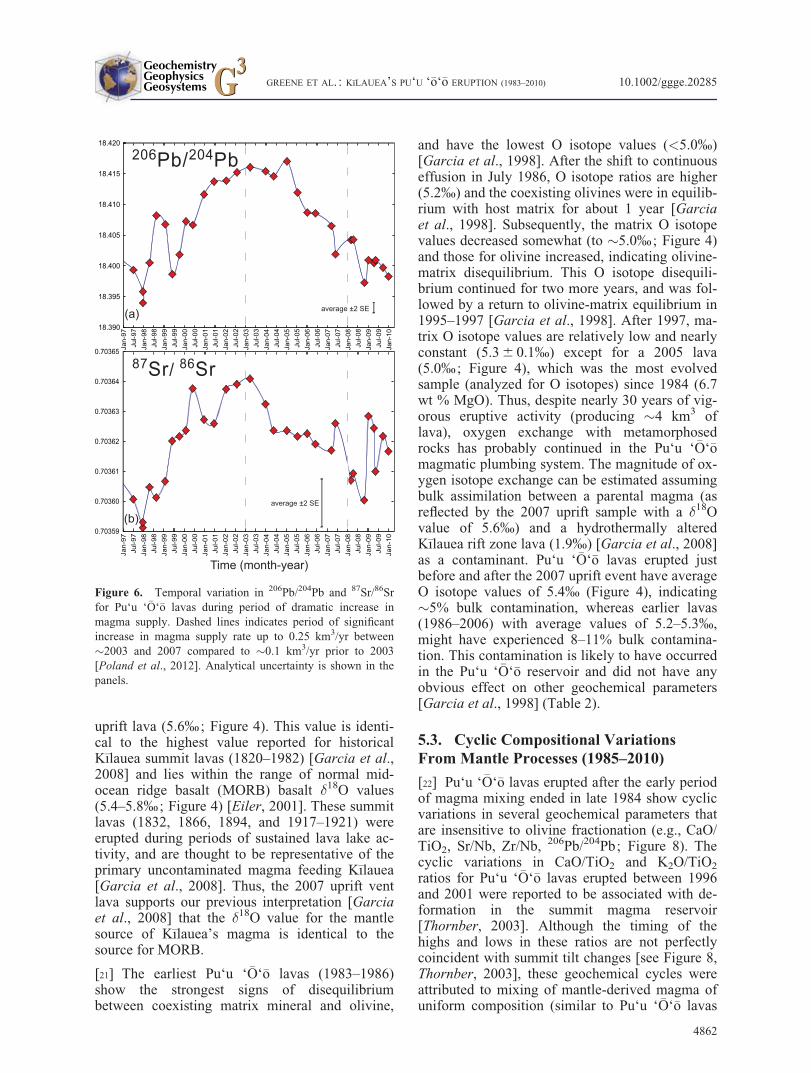
[22] Pu‘u ‘�O‘�o lavas erupted after the early periodof magma mixing ended in late 1984 show cyclicvariations in several geochemical parameters thatare insensitive to olivine fractionation (e.g., CaO/TiO2, Sr/Nb, Zr/Nb, 206Pb/204Pb; Figure 8). Thecyclic variations in CaO/TiO2 and K2O/TiO2
ratios for Pu‘u ‘�O‘�o lavas erupted between 1996and 2001 were reported to be associated with de-formation in the summit magma reservoir[Thornber, 2003]. Although the timing of thehighs and lows in these ratios are not perfectlycoincident with summit tilt changes [see Figure 8,Thornber, 2003], these geochemical cycles wereattributed to mixing of mantle-derived magma ofuniform composition (similar to Pu‘u ‘�O‘�o lavas
average ±2 SE
average ±2 SE
Time (month-year)
18.390
18.395
18.400
18.405
18.410
18.415
18.420
Jan-
97Ju
l-97
Jan-
98Ju
l-98
J an-
99Ju
l- 99
Jan-
00J u
l -00
Jan-
01Ju
l-01
Jan -
02Ju
l-02
Jan-
03Ju
l-03
J an-
0 4Ju
l-04
Jan-
05J u
l-05
Jan-
06Ju
l-06
J an-
07J u
l-07
Jan-
08Ju
l-08
Jan-
09Ju
l-09
J an-
10
0.70359
0.70360
0.70361
0.70362
0.70363
0.70364
0.70365
Jan-
97Ju
l-97
Jan-
98Ju
l-98
Jan-
99Ju
l-99
Jan -
00Ju
l-00
Jan-
01Ju
l-01
Jan -
02Ju
l-02
Jan-
03Ju
l-03
Jan -
04Ju
l-04
Jan-
05Ju
l-05
Jan-
06Ju
l-06
Jan-
07Ju
l-07
Jan-
08Ju
l-08
Jan -
09Ju
l-09
Jan -
10
206Pb/204Pb
87Sr/ 86Sr
(a)
(b)
Figure 6. Temporal variation in 206Pb/204Pb and 87Sr/86Srfor Pu‘u ‘�O‘�o lavas during period of dramatic increase inmagma supply. Dashed lines indicates period of significantincrease in magma supply rate up to 0.25 km3/yr between�2003 and 2007 compared to �0.1 km3/yr prior to 2003[Poland et al., 2012]. Analytical uncertainty is shown in thepanels.
GREENE ET AL. : K�ıLAUEA’S PU‘U ‘�o‘�o ERUPTION (1983–2010) 10.1002/ggge.20285
4862

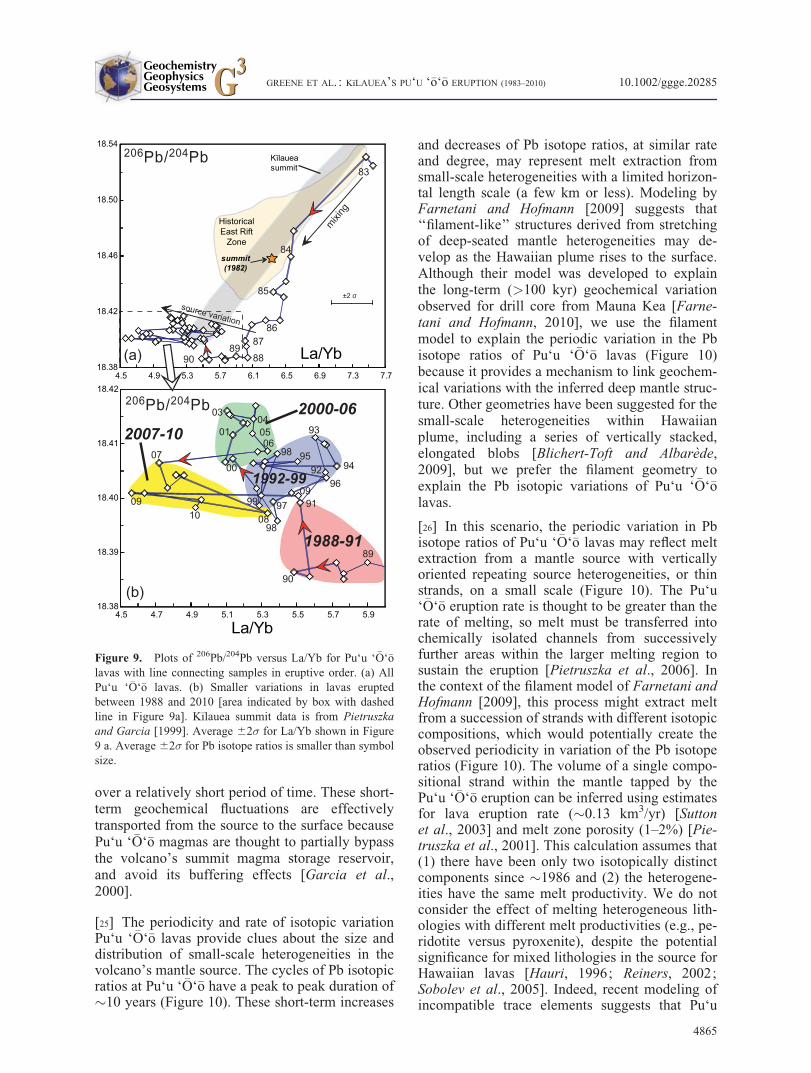
from 1999 to 2001) with 1982 summit magma[Thornber 2003]. However, Pu‘u ‘�O‘�o lavaserupted after �1999 have elevated 87Sr/86Sr ratios(at a given 206Pb/204Pb; Figure 7) compared toearlier lavas with low 206Pb/204Pb ratios, and thus,the 1999–2001 lavas cannot serve as a mixingend-members to explain the compositional trendof lavas erupted before 1999. Similar behavior isobserved on a plot of La/Yb versus 206Pb/204Pb(Figure 9), where a relative shift to lower La/Ybratios at a given 206Pb/204Pb occurred after �1999(compared to the trend of pre-1999 lavas). Theserelationships indicate that the temporal variationof Pu‘u ‘�O‘�o lavas erupted after 1999 cannot be
explained simply by mixing of 1982 summitmagma with a uniform mantle-derived magma(Figure 7) within K�ılauea’s shallow magmaticplumbing system. Instead, either a third magma ismixing with the other two or, as we advocatebelow, the composition of the Pu‘u ‘�O‘�o magmais continually changing due to the melting ofsmall-scale compositional heterogeneities in themantle source.
[23] Ratios of Pb isotopes in Pu‘u ‘�O‘�o lavas showcyclic variations (Figure 5). These variations prob-ably reflect the dynamic process of melt extraction(from a heterogeneous source) over a time scale of
0.70350
0.70355
0.70360
0.70365
0.70370
18.36 18.38 18.40 18.42 18.44 18.46 18.48 18.50 18.52 18.54
208Pb/204Pb
0.70357
0.70358
0.70359
0.70360
0.70361
0.70362
0.70363
0.70364
0.70365
18.38 18.39 18.40 18.41 18.42
208Pb/204Pb
38.045
38.055
38.065
38.075
18.38 18.39 18.40 18.41 18.4238.00
38.05
38.10
38.15
38.20
18.36 18.38 18.40 18.42 18.44 18.46 18.48 18.50 18.52 18.54
87Sr/ 86Sr
206Pb/204Pb
Sep-8687
87
88
89 90
91
90
98
08
09
07
0003
05
04
02
01
06
92
93
94
95
96
97 99
1988-911983-85
Jun-99
86
10
2000-07
1992-99
2008-10
9609
87
88
Oct-90
Jan-90
91
98
08
09
07
00 03
05
0402
01
06
92
93
9495
97
99
1988-91
1983-85Jun-99 86
10
9687
88
Mar-89Jul-89
May-90
9697
98
98
99
00
05
0808
08
Jan-09
0909
86
2000-07
1993-99
2008-10
87Sr/ 86Sr
206Pb/204Pb
1983
1985
19831985
1986-2010
1986-2010
East Rift Zone(1977)
East Rift Zone(1977)
Kīlauea summit(1982)
Kīlauea summit(1982)
East Rift Zone(1960-69)
East Rift Zone(1960-69)
1984Sep.
Jan.
2001 composition
1984Sep.
Jan.±2σ
(b)
(d)
(a)
(c)
(b)
(d)
Figure 7. Pb and Sr isotopic compositions for Pu‘u ‘�O‘�o lavas. Line connects samples in order of increasingeruption date in Figures 7b and 7d. Average 62� for Pb isotope ratios is smaller than symbol size. East RiftZone data is from J. Marske [personal communication, 2013]. September 1982 K�ılauea summit lava composi-tion (outline in Figure 7a; orange star in Figure 7c) from Pietruszka and Garcia [1999]. K�ılauea summit(1982) field in Figure 7a is new high-precision data from A. Pietruszka [personal communication, 2013]. Bluestar is 2001 composition proposed by Thornber [2003] as mixing end-member with 1982 K�ılauea summitcomposition. Pu‘u ‘�O‘�o lavas erupted after �1999 have elevated 87Sr/86Sr ratios (at a given 206Pb/204Pb). The1999–2001 lavas cannot serve as mixing end-members to explain the compositional trend of lavas eruptedbefore �1999.
GREENE ET AL. : K�ıLAUEA’S PU‘U ‘�o‘�o ERUPTION (1983–2010) 10.1002/ggge.20285
4863

years to decades rather than movement of small-scale mantle heterogeneities through the meltingzone. This interpretation is based on the hypothe-sis that buoyancy-driven upwelling through themelt-producing region beneath K�ılauea occurs onlonger timescales (hundreds to thousands ofyears) than melt extraction (years to decades)[Pietruszka et al., 2006]. The highest estimatesfor solid mantle upwelling in the center of theHawaiian plume are �10 m/yr [Hauri, 1996;Pietruszka and Garcia, 1999], which wouldresult in a maximum of only �270 m of upwell-ing during the first 27 years of the Pu‘u ‘�O‘�oeruption [cf. �5–10 km maximum thickness forthe zone of melting; Marske et al., 2007]. Forcomparison, estimates for solid mantle upwellingrates beneath Mauna Loa and L�o‘ihi based onU-series disequilibria range from �0.4 to 1 m/yr[Sims et al., 1999] and �5–6 cm/yr [Pietruszkaet al., 2011], respectively. Melt extraction rates(or source-to-surface melt velocity) are estimatedto be on the order of 5–17 km/yr [Reiners,2002], which is extremely rapid compared tosolid mantle upwelling rates. Thus, cyclic varia-tion in Pb isotope ratios over short timescales(years) are best explained by variations in theprocess of melting of a heterogeneous source(and the transport of the melt to the surface),rather than upwelling of small-scale mantle het-erogeneities through the melting region.
[24] The short-term Pb and Sr isotopic variationsin Pu‘u ‘�O‘�o lavas may be generated by one ormore processes including: periodic processes ofmelting, melt extraction, or melt aggregation [e.g.,Cordier et al., 2010], changes in melt transportpathways or tapping new source areas [Marskeet al., 2008; Pietruszka et al., 2006], changes inthe volume of the melting region [Pietruszkaet al., 2001], and progressive melt extraction froma source with fine-scale heterogeneities [Garciaet al., 2000]. In the presence of small-scale hetero-geneities, changes in melt pathways over years todecades may lead to tapping compositionally dis-tinct sources and short-term isotopic variation inlavas [Marske et al., 2007]. The scale of composi-tional heterogeneities must be small relative to thesize of the melting region beneath K�ılauea Vol-cano to allow for rapid (few years) variation inlava Pb isotope compositions [Pietruszka and Gar-cia, 1999]. Melt pathways within the source regionprobably migrate over years to decades [Pie-truszka et al., 2001, 2006]. Therefore, melt may besupplied from different areas of the melting region
(Magma supply
ratedoubled)
2003-07
Time (year)
4.0
4.2
4.4
4.6
4.8
CaO/TiO2
1986-19921992-2010
22
23
24
25
26
27 90 92 94 96 98 00 02 04 06 08 10
90 92 94 96 98 00 02 04 06 08 10
90 92 94 96 98 00 02 04 06 08 10
206Pb/204Pb
Sr/Nb
(a)
(d)
Zr/Nb
(b)
(c)
18.35
18.36
18.37
18.38
18.39
18.40
18.41
18.42
18.43
18.44
1990
1991
1992
1993
1994
1995
1996
1997
1998
1999
2000
2001
2002
2003
2004
2005
2006
2007
2008
2009
2010
10
11
12
Figure 8. Plots of CaO/TiO2, Sr/Nb, Zr/Nb and 206Pb/204Pbfor Pu‘u ‘�O‘�o lavas showing cyclic variation apparent from1990 to 2010. Trace-element abundances in ppm.
GREENE ET AL. : K�ıLAUEA’S PU‘U ‘�o‘�o ERUPTION (1983–2010) 10.1002/ggge.20285
4864
over a relatively short period of time. These short-term geochemical fluctuations are effectivelytransported from the source to the surface becausePu‘u ‘�O‘�o magmas are thought to partially bypassthe volcano’s summit magma storage reservoir,and avoid its buffering effects [Garcia et al.,2000].
[25] The periodicity and rate of isotopic variationPu‘u ‘�O‘�o lavas provide clues about the size anddistribution of small-scale heterogeneities in thevolcano’s mantle source. The cycles of Pb isotopicratios at Pu‘u ‘�O‘�o have a peak to peak duration of�10 years (Figure 10). These short-term increases
and decreases of Pb isotope ratios, at similar rateand degree, may represent melt extraction fromsmall-scale heterogeneities with a limited horizon-tal length scale (a few km or less). Modeling byFarnetani and Hofmann [2009] suggests that‘‘filament-like’’ structures derived from stretchingof deep-seated mantle heterogeneities may de-velop as the Hawaiian plume rises to the surface.Although their model was developed to explainthe long-term (>100 kyr) geochemical variationobserved for drill core from Mauna Kea [Farne-tani and Hofmann, 2010], we use the filamentmodel to explain the periodic variation in the Pbisotope ratios of Pu‘u ‘�O‘�o lavas (Figure 10)because it provides a mechanism to link geochem-ical variations with the inferred deep mantle struc-ture. Other geometries have been suggested for thesmall-scale heterogeneities within Hawaiianplume, including a series of vertically stacked,elongated blobs [Blichert-Toft and Albarede,2009], but we prefer the filament geometry toexplain the Pb isotopic variations of Pu‘u ‘�O‘�olavas.
[26] In this scenario, the periodic variation in Pbisotope ratios of Pu‘u ‘�O‘�o lavas may reflect meltextraction from a mantle source with verticallyoriented repeating source heterogeneities, or thinstrands, on a small scale (Figure 10). The Pu‘u‘�O‘�o eruption rate is thought to be greater than therate of melting, so melt must be transferred intochemically isolated channels from successivelyfurther areas within the larger melting region tosustain the eruption [Pietruszka et al., 2006]. Inthe context of the filament model of Farnetani andHofmann [2009], this process might extract meltfrom a succession of strands with different isotopiccompositions, which would potentially create theobserved periodicity in variation of the Pb isotoperatios (Figure 10). The volume of a single compo-sitional strand within the mantle tapped by thePu‘u ‘�O‘�o eruption can be inferred using estimatesfor lava eruption rate (�0.13 km3/yr) [Suttonet al., 2003] and melt zone porosity (1–2%) [Pie-truszka et al., 2001]. This calculation assumes that(1) there have been only two isotopically distinctcomponents since �1986 and (2) the heterogene-ities have the same melt productivity. We do notconsider the effect of melting heterogeneous lith-ologies with different melt productivities (e.g., pe-ridotite versus pyroxenite), despite the potentialsignificance for mixed lithologies in the source forHawaiian lavas [Hauri, 1996; Reiners, 2002;Sobolev et al., 2005]. Indeed, recent modeling ofincompatible trace elements suggests that Pu‘u
2007-10
18.38
18.42
18.46
18.50
18.54
4.5 4.9 5.3 5.7 6.1 6.5 6.9 7.3 7.7
18.38
18.39
18.40
18.41
18.42
4.5 4.7 4.9 5.1 5.3 5.5 5.7 5.9
HistoricalEast Rift
Zone
±2 σ
summit(1982)
La/Yb
206Pb/204Pb
206Pb/204Pb
(a)
(b)
83
1988-91
2000-06
1992-99
84
85
8687
8889
90
89
90
91
93
94
96
9598
98
9708
0999
00
01
03040506
07
0910
92
La/Yb
mixing
source variation
Kīlaueasummit
Figure 9. Plots of 206Pb/204Pb versus La/Yb for Pu‘u ‘�O‘�olavas with line connecting samples in eruptive order. (a) AllPu‘u ‘�O‘�o lavas. (b) Smaller variations in lavas eruptedbetween 1988 and 2010 [area indicated by box with dashedline in Figure 9a]. K�ılauea summit data is from Pietruszkaand Garcia [1999]. Average 62� for La/Yb shown in Figure9 a. Average 62� for Pb isotope ratios is smaller than symbolsize.
GREENE ET AL. : K�ıLAUEA’S PU‘U ‘�o‘�o ERUPTION (1983–2010) 10.1002/ggge.20285
4865
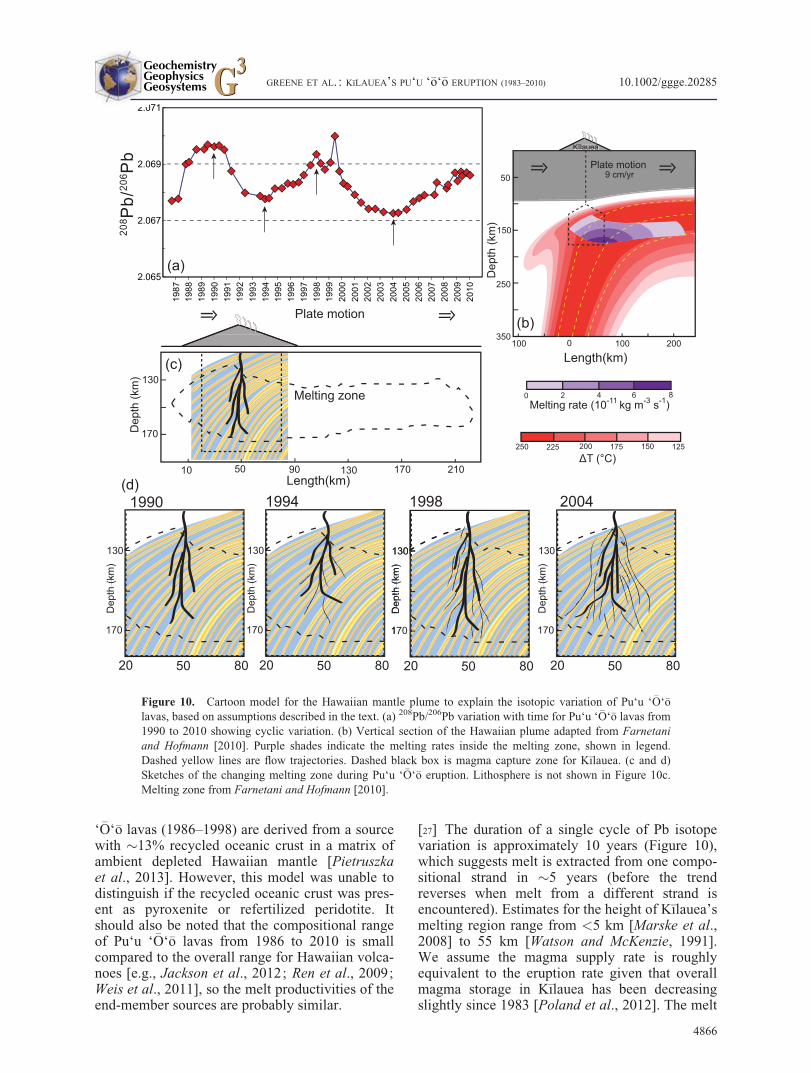
‘�O‘�o lavas (1986–1998) are derived from a sourcewith �13% recycled oceanic crust in a matrix ofambient depleted Hawaiian mantle [Pietruszkaet al., 2013]. However, this model was unable todistinguish if the recycled oceanic crust was pres-ent as pyroxenite or refertilized peridotite. Itshould also be noted that the compositional rangeof Pu‘u ‘�O‘�o lavas from 1986 to 2010 is smallcompared to the overall range for Hawaiian volca-noes [e.g., Jackson et al., 2012; Ren et al., 2009;Weis et al., 2011], so the melt productivities of theend-member sources are probably similar.
[27] The duration of a single cycle of Pb isotopevariation is approximately 10 years (Figure 10),which suggests melt is extracted from one compo-sitional strand in �5 years (before the trendreverses when melt from a different strand isencountered). Estimates for the height of K�ılauea’smelting region range from <5 km [Marske et al.,2008] to 55 km [Watson and McKenzie, 1991].We assume the magma supply rate is roughlyequivalent to the eruption rate given that overallmagma storage in K�ılauea has been decreasingslightly since 1983 [Poland et al., 2012]. The melt
Dep
th (k
m) 130
170
10 50 90 130 170 210Length(km)
Plate motion
Melting zone
Kīlauea Kīlauea Kīl
Plate motion9 cm/yr
100 0 100 200
Length(km)
Dep
th (k
m)
150
250
50
350
Melting rate (10-11 kg m-3 s-1)0 2 4 6 8
250 225 200 175 150 125ΔT (°C)
50
Dep
th (k
m)
130
170
20 80 50
Dep
th (k
m)
130
170
20 80 50
Dep
th (k
m)
130
170
20 8050
Dep
th (k
m)
130
170
20 80 50
Dep
th (k
m)
130
170
20 80
1990
2.065
2.067
2.069
2.07120
8 Pb/
206 P
b
1987
1988
1989
1990
1991
1992
1993
1994
1995
1996
1997
1998
1999
2000
2001
2002
2003
2004
2005
2006
2007
2008
2009
2010
1994 1998 2004
(a)
(b)
(c)
(d)
Figure 10. Cartoon model for the Hawaiian mantle plume to explain the isotopic variation of Pu‘u ‘�O‘�olavas, based on assumptions described in the text. (a) 208Pb/206Pb variation with time for Pu‘u ‘�O‘�o lavas from1990 to 2010 showing cyclic variation. (b) Vertical section of the Hawaiian plume adapted from Farnetaniand Hofmann [2010]. Purple shades indicate the melting rates inside the melting zone, shown in legend.Dashed yellow lines are flow trajectories. Dashed black box is magma capture zone for K�ılauea. (c and d)Sketches of the changing melting zone during Pu‘u ‘�O‘�o eruption. Lithosphere is not shown in Figure 10c.Melting zone from Farnetani and Hofmann [2010].
GREENE ET AL. : K�ıLAUEA’S PU‘U ‘�o‘�o ERUPTION (1983–2010) 10.1002/ggge.20285
4866
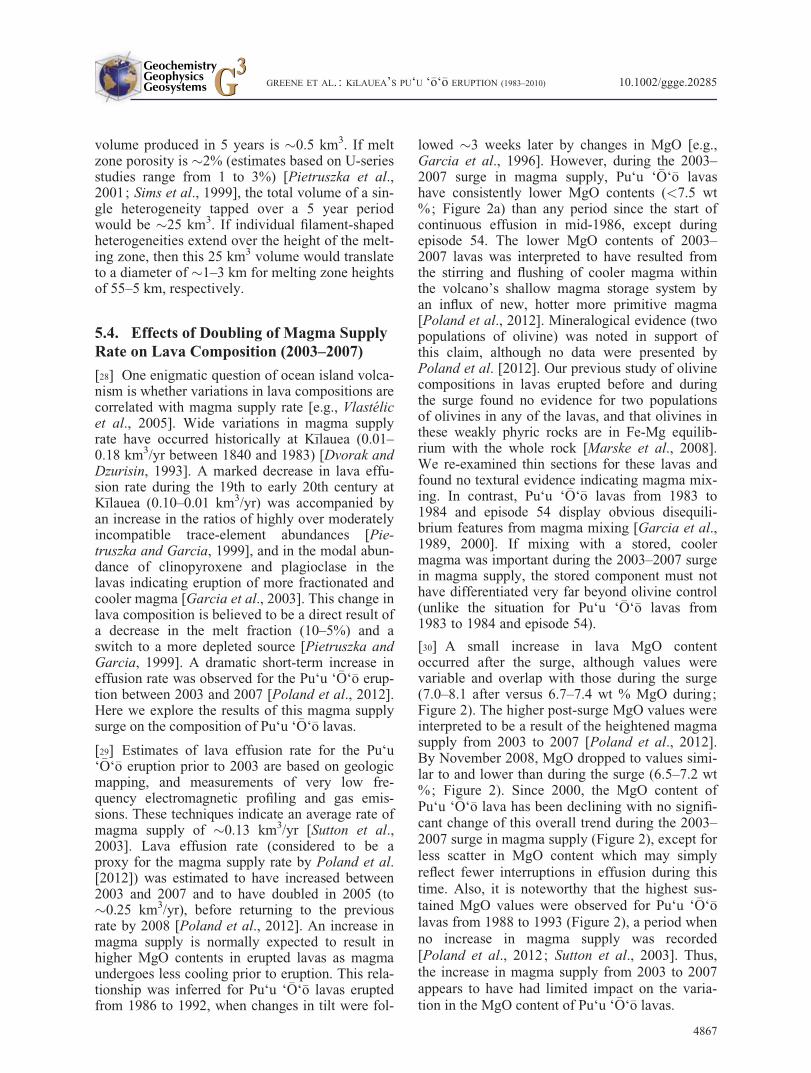
volume produced in 5 years is �0.5 km3. If meltzone porosity is �2% (estimates based on U-seriesstudies range from 1 to 3%) [Pietruszka et al.,2001; Sims et al., 1999], the total volume of a sin-gle heterogeneity tapped over a 5 year periodwould be �25 km3. If individual filament-shapedheterogeneities extend over the height of the melt-ing zone, then this 25 km3 volume would translateto a diameter of �1–3 km for melting zone heightsof 55–5 km, respectively.
5.4. Effects of Doubling of Magma SupplyRate on Lava Composition (2003–2007)
[28] One enigmatic question of ocean island volca-nism is whether variations in lava compositions arecorrelated with magma supply rate [e.g., Vlast�elicet al., 2005]. Wide variations in magma supplyrate have occurred historically at K�ılauea (0.01–0.18 km3/yr between 1840 and 1983) [Dvorak andDzurisin, 1993]. A marked decrease in lava effu-sion rate during the 19th to early 20th century atK�ılauea (0.10–0.01 km3/yr) was accompanied byan increase in the ratios of highly over moderatelyincompatible trace-element abundances [Pie-truszka and Garcia, 1999], and in the modal abun-dance of clinopyroxene and plagioclase in thelavas indicating eruption of more fractionated andcooler magma [Garcia et al., 2003]. This change inlava composition is believed to be a direct result ofa decrease in the melt fraction (10–5%) and aswitch to a more depleted source [Pietruszka andGarcia, 1999]. A dramatic short-term increase ineffusion rate was observed for the Pu‘u ‘�O‘�o erup-tion between 2003 and 2007 [Poland et al., 2012].Here we explore the results of this magma supplysurge on the composition of Pu‘u ‘�O‘�o lavas.
[29] Estimates of lava effusion rate for the Pu‘u‘�O‘�o eruption prior to 2003 are based on geologicmapping, and measurements of very low fre-quency electromagnetic profiling and gas emis-sions. These techniques indicate an average rate ofmagma supply of �0.13 km3/yr [Sutton et al.,2003]. Lava effusion rate (considered to be aproxy for the magma supply rate by Poland et al.[2012]) was estimated to have increased between2003 and 2007 and to have doubled in 2005 (to�0.25 km3/yr), before returning to the previousrate by 2008 [Poland et al., 2012]. An increase inmagma supply is normally expected to result inhigher MgO contents in erupted lavas as magmaundergoes less cooling prior to eruption. This rela-tionship was inferred for Pu‘u ‘�O‘�o lavas eruptedfrom 1986 to 1992, when changes in tilt were fol-
lowed �3 weeks later by changes in MgO [e.g.,Garcia et al., 1996]. However, during the 2003–2007 surge in magma supply, Pu‘u ‘�O‘�o lavashave consistently lower MgO contents (<7.5 wt%; Figure 2a) than any period since the start ofcontinuous effusion in mid-1986, except duringepisode 54. The lower MgO contents of 2003–2007 lavas was interpreted to have resulted fromthe stirring and flushing of cooler magma withinthe volcano’s shallow magma storage system byan influx of new, hotter more primitive magma[Poland et al., 2012]. Mineralogical evidence (twopopulations of olivine) was noted in support ofthis claim, although no data were presented byPoland et al. [2012]. Our previous study of olivinecompositions in lavas erupted before and duringthe surge found no evidence for two populationsof olivines in any of the lavas, and that olivines inthese weakly phyric rocks are in Fe-Mg equilib-rium with the whole rock [Marske et al., 2008].We re-examined thin sections for these lavas andfound no textural evidence indicating magma mix-ing. In contrast, Pu‘u ‘�O‘�o lavas from 1983 to1984 and episode 54 display obvious disequili-brium features from magma mixing [Garcia et al.,1989, 2000]. If mixing with a stored, coolermagma was important during the 2003–2007 surgein magma supply, the stored component must nothave differentiated very far beyond olivine control(unlike the situation for Pu‘u ‘�O‘�o lavas from1983 to 1984 and episode 54).
[30] A small increase in lava MgO contentoccurred after the surge, although values werevariable and overlap with those during the surge(7.0–8.1 after versus 6.7–7.4 wt % MgO during;Figure 2). The higher post-surge MgO values wereinterpreted to be a result of the heightened magmasupply from 2003 to 2007 [Poland et al., 2012].By November 2008, MgO dropped to values simi-lar to and lower than during the surge (6.5–7.2 wt%; Figure 2). Since 2000, the MgO content ofPu‘u ‘�O‘�o lava has been declining with no signifi-cant change of this overall trend during the 2003–2007 surge in magma supply (Figure 2), except forless scatter in MgO content which may simplyreflect fewer interruptions in effusion during thistime. Also, it is noteworthy that the highest sus-tained MgO values were observed for Pu‘u ‘�O‘�olavas from 1988 to 1993 (Figure 2), a period whenno increase in magma supply was recorded[Poland et al., 2012; Sutton et al., 2003]. Thus,the increase in magma supply from 2003 to 2007appears to have had limited impact on the varia-tion in the MgO content of Pu‘u ‘�O‘�o lavas.
GREENE ET AL. : K�ıLAUEA’S PU‘U ‘�o‘�o ERUPTION (1983–2010) 10.1002/ggge.20285
4867
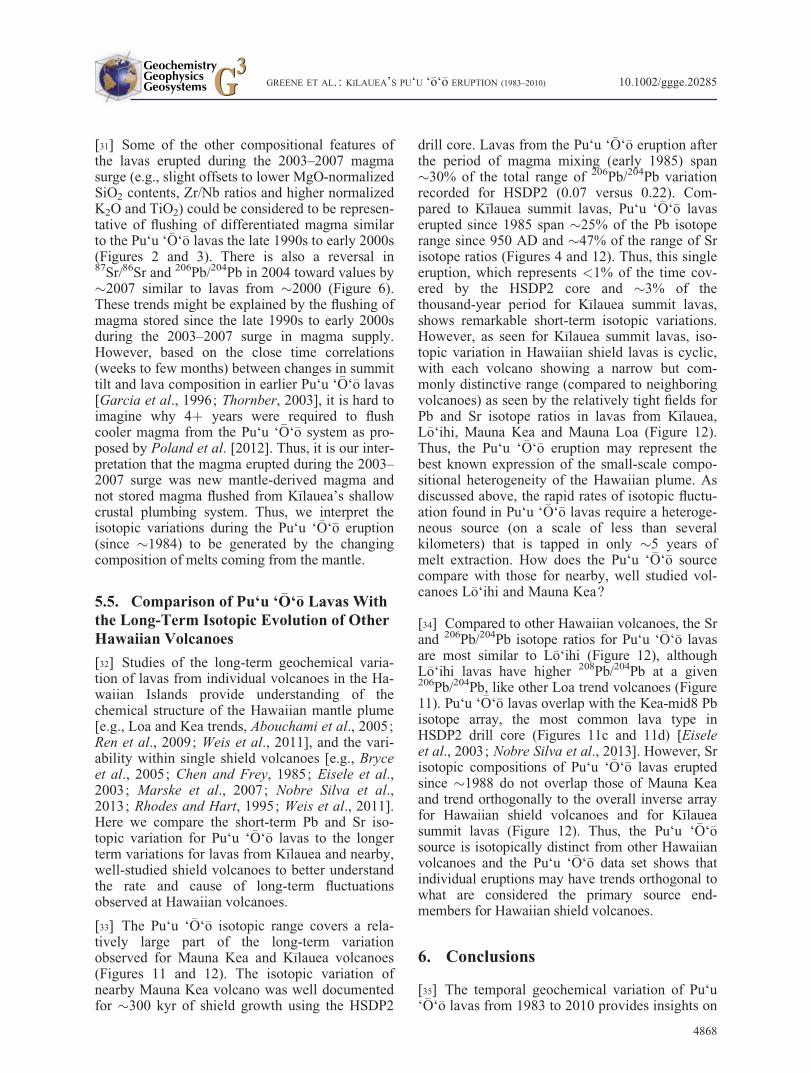
[31] Some of the other compositional features ofthe lavas erupted during the 2003–2007 magmasurge (e.g., slight offsets to lower MgO-normalizedSiO2 contents, Zr/Nb ratios and higher normalizedK2O and TiO2) could be considered to be represen-tative of flushing of differentiated magma similarto the Pu‘u ‘�O‘�o lavas the late 1990s to early 2000s(Figures 2 and 3). There is also a reversal in87Sr/86Sr and 206Pb/204Pb in 2004 toward values by�2007 similar to lavas from �2000 (Figure 6).These trends might be explained by the flushing ofmagma stored since the late 1990s to early 2000sduring the 2003–2007 surge in magma supply.However, based on the close time correlations(weeks to few months) between changes in summittilt and lava composition in earlier Pu‘u ‘�O‘�o lavas[Garcia et al., 1996; Thornber, 2003], it is hard toimagine why 4þ years were required to flushcooler magma from the Pu‘u ‘�O‘�o system as pro-posed by Poland et al. [2012]. Thus, it is our inter-pretation that the magma erupted during the 2003–2007 surge was new mantle-derived magma andnot stored magma flushed from K�ılauea’s shallowcrustal plumbing system. Thus, we interpret theisotopic variations during the Pu‘u ‘�O‘�o eruption(since �1984) to be generated by the changingcomposition of melts coming from the mantle.
5.5. Comparison of Pu‘u ‘ �O‘�o Lavas Withthe Long-Term Isotopic Evolution of OtherHawaiian Volcanoes
[32] Studies of the long-term geochemical varia-tion of lavas from individual volcanoes in the Ha-waiian Islands provide understanding of thechemical structure of the Hawaiian mantle plume[e.g., Loa and Kea trends, Abouchami et al., 2005;Ren et al., 2009; Weis et al., 2011], and the vari-ability within single shield volcanoes [e.g., Bryceet al., 2005; Chen and Frey, 1985; Eisele et al.,2003; Marske et al., 2007; Nobre Silva et al.,2013; Rhodes and Hart, 1995; Weis et al., 2011].Here we compare the short-term Pb and Sr iso-topic variation for Pu‘u ‘�O‘�o lavas to the longerterm variations for lavas from K�ılauea and nearby,well-studied shield volcanoes to better understandthe rate and cause of long-term fluctuationsobserved at Hawaiian volcanoes.
[33] The Pu‘u ‘�O‘�o isotopic range covers a rela-tively large part of the long-term variationobserved for Mauna Kea and K�ılauea volcanoes(Figures 11 and 12). The isotopic variation ofnearby Mauna Kea volcano was well documentedfor �300 kyr of shield growth using the HSDP2
drill core. Lavas from the Pu‘u ‘�O‘�o eruption afterthe period of magma mixing (early 1985) span�30% of the total range of 206Pb/204Pb variationrecorded for HSDP2 (0.07 versus 0.22). Com-pared to K�ılauea summit lavas, Pu‘u ‘�O‘�o lavaserupted since 1985 span �25% of the Pb isotoperange since 950 AD and �47% of the range of Srisotope ratios (Figures 4 and 12). Thus, this singleeruption, which represents <1% of the time cov-ered by the HSDP2 core and �3% of thethousand-year period for K�ılauea summit lavas,shows remarkable short-term isotopic variations.However, as seen for K�ılauea summit lavas, iso-topic variation in Hawaiian shield lavas is cyclic,with each volcano showing a narrow but com-monly distinctive range (compared to neighboringvolcanoes) as seen by the relatively tight fields forPb and Sr isotope ratios in lavas from K�ılauea,L�o‘ihi, Mauna Kea and Mauna Loa (Figure 12).Thus, the Pu‘u ‘�O‘�o eruption may represent thebest known expression of the small-scale compo-sitional heterogeneity of the Hawaiian plume. Asdiscussed above, the rapid rates of isotopic fluctu-ation found in Pu‘u ‘�O‘�o lavas require a heteroge-neous source (on a scale of less than severalkilometers) that is tapped in only �5 years ofmelt extraction. How does the Pu‘u ‘�O‘�o sourcecompare with those for nearby, well studied vol-canoes L�o‘ihi and Mauna Kea?
[34] Compared to other Hawaiian volcanoes, the Srand 206Pb/204Pb isotope ratios for Pu‘u ‘�O‘�o lavasare most similar to L�o‘ihi (Figure 12), althoughL�o‘ihi lavas have higher 208Pb/204Pb at a given206Pb/204Pb, like other Loa trend volcanoes (Figure11). Pu‘u ‘�O‘�o lavas overlap with the Kea-mid8 Pbisotope array, the most common lava type inHSDP2 drill core (Figures 11c and 11d) [Eiseleet al., 2003; Nobre Silva et al., 2013]. However, Srisotopic compositions of Pu‘u ‘�O‘�o lavas eruptedsince �1988 do not overlap those of Mauna Keaand trend orthogonally to the overall inverse arrayfor Hawaiian shield volcanoes and for K�ılaueasummit lavas (Figure 12). Thus, the Pu‘u ‘�O‘�osource is isotopically distinct from other Hawaiianvolcanoes and the Pu‘u ‘�O‘�o data set shows thatindividual eruptions may have trends orthogonal towhat are considered the primary source end-members for Hawaiian shield volcanoes.
6. Conclusions
[35] The temporal geochemical variation of Pu‘u‘�O‘�o lavas from 1983 to 2010 provides insights on
GREENE ET AL. : K�ıLAUEA’S PU‘U ‘�o‘�o ERUPTION (1983–2010) 10.1002/ggge.20285
4868
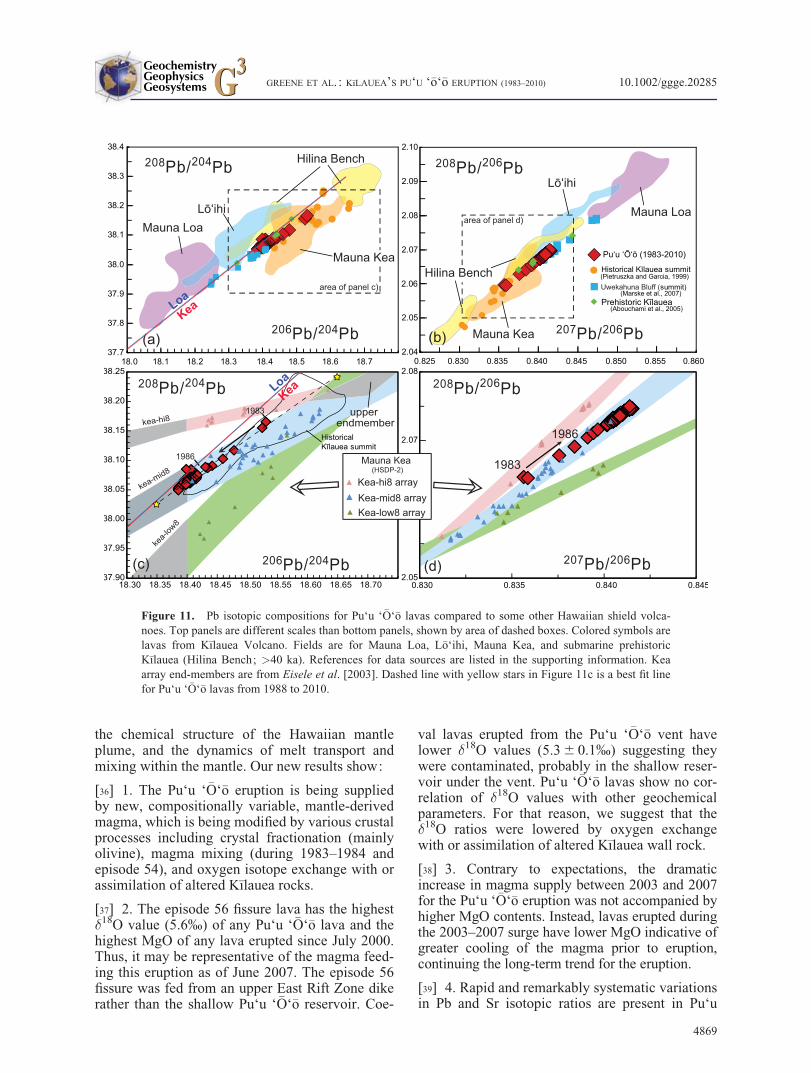
the chemical structure of the Hawaiian mantleplume, and the dynamics of melt transport andmixing within the mantle. Our new results show:
[36] 1. The Pu‘u ‘�O‘�o eruption is being suppliedby new, compositionally variable, mantle-derivedmagma, which is being modified by various crustalprocesses including crystal fractionation (mainlyolivine), magma mixing (during 1983–1984 andepisode 54), and oxygen isotope exchange with orassimilation of altered K�ılauea rocks.
[37] 2. The episode 56 fissure lava has the highest�18O value (5.6%) of any Pu‘u ‘�O‘�o lava and thehighest MgO of any lava erupted since July 2000.Thus, it may be representative of the magma feed-ing this eruption as of June 2007. The episode 56fissure was fed from an upper East Rift Zone dikerather than the shallow Pu‘u ‘�O‘�o reservoir. Coe-
val lavas erupted from the Pu‘u ‘�O‘�o vent havelower �18O values (5.3 6 0.1%) suggesting theywere contaminated, probably in the shallow reser-voir under the vent. Pu‘u ‘�O‘�o lavas show no cor-relation of �18O values with other geochemicalparameters. For that reason, we suggest that the�18O ratios were lowered by oxygen exchangewith or assimilation of altered K�ılauea wall rock.
[38] 3. Contrary to expectations, the dramaticincrease in magma supply between 2003 and 2007for the Pu‘u ‘�O‘�o eruption was not accompanied byhigher MgO contents. Instead, lavas erupted duringthe 2003–2007 surge have lower MgO indicative ofgreater cooling of the magma prior to eruption,continuing the long-term trend for the eruption.
[39] 4. Rapid and remarkably systematic variationsin Pb and Sr isotopic ratios are present in Pu‘u
37.7
37.8
37.9
38.0
38.1
38.2
38.3
38.4
18.0 18.1 18.2 18.3 18.4 18.5 18.6 18.72.04
2.05
2.07
2.08
2.09
2.10
0.825 0.830 0.835 0.840 0.845 0.850 0.855 0.860
Lō‘ihi
2.06
37.90
37.95
38.00
38.05
38.10
38.15
38.20
38.25
18.30 18.35 18.40 18.45 18.50 18.55 18.60 18.65 18.702.05
2.06
2.07
2.08
0.830 0.835 0.840 0.845
208Pb/204Pb
206Pb/204Pb
208Pb/206Pb
207Pb/206Pb
208Pb/204Pb
206Pb/204Pb
208Pb/206Pb
207Pb/206Pb
Mauna LoaMauna Loa
Mauna Kea
Historical Kīlauea summit
Pu‘u ‘Ō‘ō (1983-2010)
(b)
(d)(c)
(a)
1986
Uwekahuna Bluff (summit)(Pietruszka and Garcia, 1999)
Prehistoric Kīlauea(Abouchami et al., 2005)
Lō‘ihi
1983
1986
Hilina Bench
Hilina Bench(Marske et al., 2007)
upper endmemberkea-hi8
kea-mid8
kea-l
ow8
Mauna Kea
Mauna Kea (HSDP-2)
Kea-hi8 arrayKea-mid8 arrayKea-low8 array
area of panel c)
area of panel d)
Historical Kīlauea summit
LoaKea
LoaKea
1983
Figure 11. Pb isotopic compositions for Pu‘u ‘�O‘�o lavas compared to some other Hawaiian shield volca-noes. Top panels are different scales than bottom panels, shown by area of dashed boxes. Colored symbols arelavas from K�ılauea Volcano. Fields are for Mauna Loa, L�o‘ihi, Mauna Kea, and submarine prehistoricK�ılauea (Hilina Bench; >40 ka). References for data sources are listed in the supporting information. Keaarray end-members are from Eisele et al. [2003]. Dashed line with yellow stars in Figure 11c is a best fit linefor Pu‘u ‘�O‘�o lavas from 1988 to 2010.
GREENE ET AL. : K�ıLAUEA’S PU‘U ‘�o‘�o ERUPTION (1983–2010) 10.1002/ggge.20285
4869

‘�O‘�o lavas. Two cycles of Pb isotopic ratio varia-tion with �10 year periods were found. Thesecycles may be related to extraction of melt from asource with a pattern of vertically oriented sourceheterogeneities, or thin strands. These strands maybe �1–3 km in diameter to explain the scale ofisotopic variation for the Pu‘u ‘�O‘�o eruption.
[40] 5. The Pb isotopic variation of Pu‘u ‘�O‘�olavas spans 25% of the range observed for the last
1000 years of K�ılauea summit lavas and 30% for�300,000 years of shield volcanism for MaunaKea volcano. There is considerable Pb and Sr iso-topic overlap between Pu‘u ‘�O‘�o lavas and lavasfrom Mauna Kea and L�o‘ihi volcanoes. However,the Pb-Sr isotopic trend for the later Pu‘u ‘�O‘�olavas (1988–2010) is oblique to the array definedby Hawaiian shield lavas. Thus, each Hawaiianvolcano appears to have an isotopically distinctsource.
0.7032
0.7033
0.7034
0.7035
0.7036
0.7037
0.7038
0.7039
0.7040
18.0 18.1 18.2 18.3 18.4 18.5 18.6 18.7 18.8
0.70345
0.70350
0.70355
0.70360
0.70365
0.70370
18.2 18.3 18.4 18.5 18.6 18.7 18.8
Mauna Loa
Lō‘ihi
Mauna Kea
Mauna Loa
Mauna Kea
Lō‘ihi
Salt Lake Crater xenoliths
Pu‘u ‘Ō‘ō (1983-2010)
Mauna Kea (HSDP-2)
Kea-hi8 arrayKea-mid8 arrayKea-low8 array206Pb/204Pb
87Sr/ 86Sr
206Pb/204Pb
87Sr/ 86Sr
1983
1985
1986
Hilina Bench
Hilina Bench
Historical Kīlauea summit
Uwekahuna Bluff (summit)(Pietruszka and Garcia, 1999)
Prehistoric Kīlauea(Abouchami et al., 2005)
(Marske et al., 2007)
area of panel b)
Uwekahuna Bluff (summit)
2003
2010
0.4-5 ka
Historical and PrehistoricKīlauea summit not shown
Historical Kīlauea summit
(b)
(a)
Figure 12. Plots of 206Pb/204Pb and 87Sr/86Sr for Pu‘u ‘�O‘�o lavas compared to some other Hawaiian shieldvolcanoes. Figure 12b Expanded scale of dashed box in Figure 12a. Colored symbols are lavas from K�ılaueaVolcano. Fields are for Mauna Loa, L�o‘ihi, Mauna Kea and submarine K�ılauea (Hilina Bench; >40 ka).References for data sources are listed in the supporting information.
GREENE ET AL. : K�ıLAUEA’S PU‘U ‘�o‘�o ERUPTION (1983–2010) 10.1002/ggge.20285
4870
Acknowledgments
[41] We thank Jane Barling, Bruno Kieffer, and Vivian Laifor their assistance with analyses at PCIGR at UBC, KyleTanguichi and Adonara Murek for sample preparation andcuration at the University of Hawai‘i, and J. M. Rhodes forXRF analyses at University of Massachusetts. Claude Maer-schalk assisted with Pb and Sr column chemistry for a subsetof samples. Daniel Heaton provided assistance with severalisotope analyses at San Diego State University. We appreciatereviews by Julie Prytulak, Joel Baker, and Christoph Beier.This research was supported by grants from the National Sci-ence Foundation to M. Garcia (EAR11–18741) and A. Pie-truszka (EAR11–18738). This paper is SOEST ContributionNo. 8939.
References
Abouchami, W., S. J. G. Galer, and A. W. Hofmann (2000),High precision lead isotope systematics of lavas from theHawaiian Scientific Drilling Project, Chem. Geol., 169, 187–209, doi:10.1016/S0009–2541(00)00328-4.
Abouchami, W., A. W. Hofmann, S. J. G. Galer, F. A. Frey, J.Eisele, and M. Feigenson (2005), Lead isotopes reveal bilat-eral asymmetry and vertical continuity in the Hawaiian man-tle plume, Nature, 434, 851–856, doi:10.1038/nature03402.
Albarede, F., B. Luais, G. Fitton, M. Semet, E. Kaminski, B. G.J. Upton, P. Bachelery, and J.-L. Chemin�ee (1997), The geo-chemical regimes of Piton de la Fournaise Volcano (R�eunion)during the last 530,000 years, J. Petrol., 38, 171–201.
Blichert-Toft, J., and F. Albarede (2009), Mixing of isotopicheterogeneities in the Mauna Kea plume conduit, EarthPlanet. Sci. Lett., 282, 190–200, doi:10.1016/j.epsl.2009.03.015.
Blichert-Toft, J., D. Weis, C. Maerschalk, A. Agranier, and F.Albarede (2003), Hawaiian hot spot dynamics as inferredfrom the Hf and Pb isotope evolution of Mauna Kea volcano,Geochem. Geophys. Geosyst., 4(2), 8704, doi:10.1029/2002GC000340.
Bryce, J. G., D. J. DePaolo, and J. C. Lassiter (2005), Geo-chemical structure of the Hawaiian plume: Sr, Nd, and Osisotopes in the 2.8 km HSDP-2 section of Mauna Kea vol-cano, Geochem. Geophys. Geosyst., 6, Q09G18,doi:10.1029/2004GC000809.
Caroff, M., R. C. Maury, P. Vidal, G. Guille, C. Dupuy, J. Cot-ten, H. Guillou, and P.-Y. Gillot (1995), Rapid temporalchanges in ocean island basalt composition: Evidence froman 800 m deep drill hole in Eiao Shield (Marquesas), J. Pet-rol., 36(5), 1333–1365, doi:10.1093/petrology/36.5.1333.
Chen, C. Y., and F. A. Frey (1985), Trace element and isotopicgeochemistry of lavas from Haleakala Volcano, east Maui,Hawai’i : Implications for the origin of Hawaiian basalts, J.Geophys. Res., 90, 8743–8768.
Chen, C.-Y., F. A. Frey, J. M. Rhodes, and R. M. Easton(1996), Temporal geochemical evolution of K�ılauea Vol-cano: Comparison of Hilina and Puna basalt, in Earth Proc-esses, Reading the Isotopic Code, edited by A. Basu and S.R. Hart, pp. 161–181, AGU, Washington, D. C.
Cordier, C., M. Benoit, C. H�emond, J. Dyment, B. Le Gall, A.Briais, and M. Kitazawa (2010), Time scales of melt extrac-tion revealed by distribution of lava composition across aridge axis, Geochem. Geophys. Geosyst., 11, Q0AC06,doi:10.1029/2010gc003074.
DePaolo, D. J., and E. M. Stolper (1996), Models of Hawaiianvolcano growth and plume structure: Implications from theHawai’i Scientific Drilling Project, J. Geophys. Res., 101,11,643–11,655.
Dvorak, J. J., and D. Dzurisin (1993), Variations in magmasupply rate at K�ılauea Volcano, Hawai’i, J. Geophys. Res.,98, 22,255–22,268.
Eaton, J. P., and K. J. Murata (1960), How volcanoes grow[Hawai’i], Science, 132, 925–938.
Eiler, J. M. (2001), Oxygen isotope variations of basaltic lavasand upper mantle rocks, Rev. Mineral. Geochem., 43(1),319–364, doi:10.2138/gsrmg.43.1.319.
Eisele, J. R., W. Abouchami, S. J. G. Galer, and A. W. Hof-mann (2003), The 320 kyr Pb isotope evolution of MaunaKea lavas recorded in the HSDP-2 drill core, Geochem. Geo-phys. Geosyst., 4(5), 8710, doi:10.1029/2002GC000339.
Farnetani, C. G., and A. W. Hofmann (2009), Dynamics andinternal structure of a lower mantle plume conduit, EarthPlanet. Sci. Lett., 282(1–4), 314–322, doi:10.1016/j.epsl.2009.03.035.
Farnetani, C. G., and A. W. Hofmann (2010), Dynamics andinternal structure of the Hawaiian plume, Earth Planet. Sci.Lett., 295, 231–240, doi:10.1016/j.epsl.2010.04.005.
Garcia, M. O., R. A. Ho, J. M. Rhodes, and E. W. Wolfe(1989), Petrologic constraints on rift-zone processes:Results from episode 1 of the Pu‘u ‘�O‘�o eruption of K�ılaueavolcano, Hawai’i, Bull. Volcanol., 52, 81–96.
Garcia, M. O., J. M. Rhodes, E. W. Wolfe, G. E. Ulrich, and R.A. Ho (1992), Petrology of lavas from episodes 2–47 of thePu‘u ‘�O‘�o eruption of K�ılauea Volcano, Hawai’i : Evaluationof magmatic processes, Bull. Volcanol., 55(1), 1–16.
Garcia, M. O., J. M. Rhodes, F. A. Trusdell, and A. J. Pie-truszka (1996), Petrology of lavas from the Pu‘u ‘�O‘�o erup-tion of K�ılauea Volcano: III The Kupaianaha episode(1986–1992), Bull. Volcanol., 58, 359–379.
Garcia, M. O., E. Ito, J. M. Eiler, and A. J. Pietruszka (1998),Crustal contamination of K�ılauea Volcano magmas revealedby oxygen isotope analyses of glass and olivine from Pu‘u‘�O‘�o eruption lavas, J. Petrol., 39, 803–817.
Garcia, M. O., A. J. Pietruszka, J. M. Rhodes, and K. Swanson(2000), Magmatic processes during the prolonged Pu‘u ‘�O‘�oeruption of K�ılauea Volcano, Hawai’i, J. Petrol., 41(7),967–990.
Garcia, M. O., A. J. Pietruszka, and J. M. Rhodes (2003), Apetrologic perspective of K�ılauea Volcano’s summit magmareservoir, J. Petrol., 44(12), 2313–2339, doi:10.1093/petrol-ogy/egg079.
Garcia, M. O., E. Ito, and J. M. Eiler (2008), Oxygen isotopeevidence for chemical interaction of K�ılauea historical mag-mas with basement rocks, J. Petrol., 49(4), 757–769,doi :10.1093/petrology/egm034.
Hanyu, T., J.-I. Kimura, M. Katakuse, A. T. Calvert, T. W. Sis-son, and S. I. Nakai (2010), Source materials for inceptionstage Hawaiian magmas: Pb-He isotope variations for earlyK�ılauea, Geochem. Geophys. Geosyst., 11, Q0AC01,doi:10.1029/2009gc002760.
Harmon, R. S., and J. Hoefs (1995), Oxygen isotope heteroge-neity of the mantle deduced from global 18O systematics ofbasalts from different geotectonic settings, Contrib. Mineral.Petrol., 120(1), 95–114.
Hauri, E. H. (1996), Major-element variability in the Hawaiianmantle plume, Nature, 382, 415–419.
Heliker, C., and T. N. Mattox (2003), The first two decades ofthe Pu‘u ‘�O‘�o -Kupaianaha eruption; chronology andselected bibliography, in The Pu‘u ‘�O‘�o -Kupaianaha Erup-tion of K�ılauea Volcano, Hawai’i: The First 20 Years, edited
GREENE ET AL. : K�ıLAUEA’S PU‘U ‘�o‘�o ERUPTION (1983–2010) 10.1002/ggge.20285
4871

by C. Heliker et al., pp. 1–28, U.S. Geol. Surv. Prof. Pap.1676.
Hofmann, A. W., M. D. Feigenson, and I. Raczek (1984), Casestudies on the orgin of basalt : III Petrogenesis of the MaunaUlu eruption, K�ılauea, 1969–1971, Contrib. Mineral. Pet-rol., 88, 24–35.
Holcomb, R. T. (1987), Eruptive history and long-term behav-ior of K�ılauea Volcano, in Volcanism in Hawai’i, edited byR. W. Decker et al., pp. 261–350, U.S. Geol. Surv. Prof. Pap.1350.
Jackson, M. G., D. Weis, and S. Huang (2012), Major elementvariations in Hawaiian shield lavas: Source features and per-spectives from global ocean island basalt (OIB) systematics,Geochem. Geophys. Geosyst., 13, Q09009, doi:10.1029/2012GC004268.
Johnson, D. J., A. A. Eggers, and M. Bagnardi (2010), Shallowmagma accumulation at K�ılauea Volcano, Hawai’i, revealedby microgravity surveys, Geology 38(12), 1139–1142,doi:10.1130/G31323.1.
Kimura, J.-I., T. W. Sisson, N. Nakano, M. L. Coombs, and P.W. Lipman (2006), Isotope geochemistry of early K�ılaueamagmas from the submarine Hilina bench: The nature of theHilina mantle component, J. Volcanol. Geotherm. Res.,151(1–3), 51–72, doi :10.1016/j.jvolgeores.2005.07.024.
Kurz, M. D., W. J. Jenkins, and S. R. Hart (1982), Helium iso-topic systematics of oceanic islands and mantle heterogene-ity, Nature, 297, 43–47.
Macdonald, G. A., A. T. Abbott, and F. L. Peterson (1983),Volcanoes in the Sea: The Geology of Hawai’i, 517 pp.,Univ. of Hawaii Press, Honolulu, Hawaii.
Maclennan, J. (2008), Lead isotope variability in olivine-hosted melt inclusions from Iceland, Geochim. Cosmochim.Acta, 72(16), 4159–4176, doi:10.1016/j.gca.2008.05.034.
Marske, J. P., A. J. Pietruszka, D. Weis, M. O. Garcia, and J.M. Rhodes (2007), Rapid passage of a small-scale mantleheterogeneity through the melting regions of K�ılauea andMauna Loa volcanoes, Earth Planet. Sci. Lett., 259, 34–50,doi:10.1016/j.epsl.2007.04.026.
Marske, J. P., M. O. Garcia, A. J. Pietruszka, J. M. Rhodes,and M. D. Norman (2008), Geochemical variations duringK�ılauea’s Pu‘u ‘�O‘�o eruption reveal a fine-scale mixture ofmantle heterogeneities within the Hawaiian plume, J. Pet-rol., 49(7), 1297–1318, doi:10.1093/petrology/egn025.
Montgomery-Brown, E. K., D. K. Sinnett, P. S. M. Poland, T.Orr, H. Zebker, and A. Miklius (2010), Geodetic evidencefor en echelon dike emplacement and concurrent slow slipduring the June 2007 intrusion and eruption at K�ılauea vol-cano, Hawai’i, J. Geophys. Res., 115, B07405, doi:10.1029/2009JB006658.
Nobre Silva, I. G., D. Weis, and J. S. Scoates (2013), Isotopicsystematics of the early Mauna Kea shield phase and insightinto the deep mantle beneath the Pacific Ocean, Geochem.Geophys. Geosyst., 14(3), 659–676, doi:10.1029/2012GC004373.
Pietruszka, A. J., and M. O. Garcia (1999), A rapid fluctuationin the mantle source and melting history of K�ılauea Volcanoinferred from the geochemistry of its historical summit lavas(1790–1982), J. Petrol., 48(8), 1321–1342.
Pietruszka, A. J., K. H. Rubin, and M. O. Garcia (2001),226Ra-230Th-238U disequilibria of historical K�ılauea lavas(1790–1982) and the dynamics of mantle melting within theHawaiian plume, Earth Planet. Sci. Lett., 186, 15–31.
Pietruszka, A. J., E. H. Hauri, R. W. Carlson, and M. O. Garcia(2006), Remelting of recently depleted mantle within theHawaiian plume inferred from the 226Ra-230Th-238U disequi-
libria of Pu‘u ‘�O‘�o eruption lavas, Earth Planet. Sci. Lett.,244(1–2), 155–169, doi:10.1016/j.epsl.2006.01.039.
Pietruszka, A. J., E. H. Hauri, and J. Blichert-Toft (2009),Crustal contamination of mantle-derived magmas within Pi-ton de la Fournaise Volcano, Reunion Island, J. Petrol.,50(4), 661–684, doi :10.1093/petrology/egp016.
Pietruszka, A. J., M. D. Norman, M. O. Garcia, J. P. Marske,and D. H. Burns (2013), Chemical heterogeneity in the Ha-waiian mantle plume from the alteration and dehydration ofrecycled oceanic crust, Earth Planet. Sci. Lett., 361, 298–309, doi:10.1016/j.epsl.2012.10.030.
Poland, M., A. Miklius, T. Orr, A. J. Sutton, C. Thornber, andD. Wilson (2008), New episodes of volcanism at K�ılaueaVolcano, Hawai’i, Eos Trans. AGU, 89(5), 37–38,doi :10.1029/2008EO050001.
Poland, M. P., A. Miklius, A. J. Sutton, and C. R. Thornber(2012), A mantle-driven surge in magma supply to K�ılaueaVolcano during 2003–2007, Nat. Geosci., 5, 295–300,doi :10.1038/NGEO1426.
Reiners, P. W. (2002), Temporal-compositional trends inintraplate basalt eruptions: Implications for mantle hetero-geneity and melting processes, Geochem. Geophys. Geo-syst., 3(2), 1011, doi:10.1029/2001GC000250.
Ren, Z.-y., T. Hanyu, T. Miyazaki, Q. Chang, H. Kawabata, T.Takahashi, Y. Hirahara, A. R. L. Nichols, and Y. Tatsumi(2009), Geochemical differences of the Hawaiian shieldlavas: Implications for melting process in the heterogeneousHawaiian plume, J. Petrol., 50(8), 1553–573, doi:10.1093/petrology/egp041.
Rhodes, J. M., and S. R. Hart (1995), Episodic trace elementand isotopic variations in Mauna Loa lavas: Implications formagma and plume dynamics, in Mauna Loa Revealed:Structure, Composition, History and Hazards, edited by J.M. Rhodes and J. P. Lockwood, pp. 263–288, AGU, Wash-ington, D. C.
Rhodes, J. M., and M. J. Vollinger (2004), Composition of ba-saltic lavas sampled by phase-2 of the Hawai’i ScientificDrilling Project: Geochemical stratigraphy and magmatypes, Geochem. Geophys. Geosyst., 5, Q03G13,doi:10.1029/2002GC000434.
Rhodes, J. M., S. Huang, F. A. Frey, M. Pringle, and G. Xu(2012), Compositional diversity of Mauna Kea shield lavasrecovered by the Hawai’i Scientific Drilling Project: Infer-ences on source lithology, magma supply, and the role ofmultiple volcanoes, Geochem. Geophys. Geosyst., 13,Q03014, doi:10.1029/2011GC003812.
Ryan, M. P. (1987), Elasticity and contractancy of Hawaiianolivine tholeiite and its role in the stability and structuralevolution of subcaldera magma reservoirs and rift systems,in Volcanism in Hawai’i, edited by R. W. Decker et al., pp.1395–1448, U.S. Geol. Surv. Prof. Pap. 1350.
Shamberger, P. J., and M. O. Garcia (2007), Geochemicalmodeling of magma mixing and magma reservoir volumesduring early episodes of K�ılauea Volcano’s Pu‘u ‘�O‘�o erup-tion, Bull. Volcanol., 69, 345–352, doi:10.1007/s00445-006-0074-5.
Sims, K. W. W., M. T. Murrell, D. J. DePaolo, W. S. Bal-dridge, S. J. Goldstein, D. Clague, and M. Jull (1999), Poros-ity of the melting zone and variations in the solid mantleupwelling rate beneath Hawai’i : Inferences from238U-230Th-226Ra and 235U-231Pa disequilibria, Geochim.Cosmochim. Acta, 63(23), 4119–4138.
Sobolev, A. V., A. W. Hofmann, S. Sobolev, and I. K. Nikogo-sian (2005), An olivine-free mantle source of Hawaiianshield basalts, Nature, 434, 590–595.
GREENE ET AL. : K�ıLAUEA’S PU‘U ‘�o‘�o ERUPTION (1983–2010) 10.1002/ggge.20285
4872

Sutton, J. A., T. Elias, and J. Kauahikaua (2003), Lava-effu-sion rates for the Pu‘u ‘�O‘�o -Kupaianaha eruption derivedfrom SO2 emissions and very low frequency (VLF) meas-urements, in The Pu‘u ‘�O‘�o -Kupaianaha Eruption ofK�ılauea Volcano, Hawai’i: The First 20 Years, edited byC. Heliker et al., pp. 137–148, U.S. Geol. Surv. Prof. Pap.1676.
Thornber, C. R. (2003), Magma-reservoir processes revealedby geochemistry of the Pu‘u ‘�O‘�o-Kupaianaha eruption, inThe Pu‘u ‘�O‘�o -Kupaianaha Eruption of K�ılauea Volcano,Hawai’i: The First 20 Years, edited by C. Heliker et al., pp.121–136, U.S. Geol. Surv. Prof. Pap. 1676.
Thornber, C. R., C. Heliker, D. R. Sherrod, J. P. Kauahikaua,A. Miklius, P. G. Okubo, F. A. Trusdell, J. R. Budahn, W. I.Ridley, and G. P. Meeker (2003), K�ılauea East Rift Zonemagmatism: An episode 54 perspective, J. Petrol., 44(9),1525–1559, doi:10.1093/petrology/egg048.
Tilling, R. I., and J. J. Dvorak (1993), Anatomy of a basalticvolcano, Nature, 363, 125–133.
Vlast�elic, I., T. Staudacher, and M. Semet (2005), Rapidchange of lava composition from 1998 to 2002 at Piton de laFournaise (R�eunion) inferred from Pb isotopes and trace ele-
ments: Evidence for variable crustal contamination, J. Pet-rol., 46(1), 79–107, doi :10.1093/petrology/egh062.
Vlast�elic, I., A. Peltier, and T. Staudacher (2007), Short-term(1998–2006) fluctuations of Pb isotopes at Piton de la Four-naise volcano (R�eunion Island): Origins and constraints onthe size and shape of the magma reservoir, Chem. Geol.,244, 202–220, doi:10.1016/j.chemgeo.2007.06.015.
Watson, S., and D. McKenzie (1991), Melt generation byplumes: A study of Hawaiian volcanism, J. Petrol., 32(3),501–537.
Weis, D., M. O. Garcia, J. M. Rhodes, A. M. Jellinek, and J. S.Scoates (2011), Role of the deep mantle in generating thecompositional asymmetry of the Hawaiian mantle plume,Nat. Geosci., 4, 831–838, doi:10.1038/ngeo1328.
Wolfe, E. W., M. O. Garcia, D. B. Jackson, R. Y. Koyanagi, C.A. Neal, and A. T. Okamura (1987), The Pu‘u ‘�O‘�o eruptionof K�ılauea Volcano, episodes 1–20, January 3, 1983 to June8, 1984, in Volcanism in Hawai’i, edited by R. W. Deckeret al., pp. 471–508, U.S. Geol. Surv. Prof. Pap. 1350.
Wright, T. L. (1971), Chemistry of K�ılauea and Mauna Loalava in space and time, U.S. Geol. Surv. Prof. Pap., 735,1–45.
GREENE ET AL. : K�ıLAUEA’S PU‘U ‘�o‘�o ERUPTION (1983–2010) 10.1002/ggge.20285
4873