Embed Size (px)
Citation preview

Tendencias internacionales en la
evaluación de la sostenibilidad
J. Marcos Castro
Universidad de Málaga
CIECEM (Matalascañas) 17 de diciembre de 2010
2
Presentación
• Introducción. La evaluación de la
sostenibilidad.
• Una taxonomía de metodologías.
• Algunos ejemplos.
• Tendencias en evaluación de la sostenibilidad.

3
Introducción
• Cuestión clásica en las ciencias sociales. Adam Smith,
Ricardo, Malthus, Mill, Marx….
• Señales de alarma desde la escala local a la global:
• Ecologicas: cambio climático, escasez de agua, pérdidas de
biodiversidad y degradación ambiental.
• Socioeconomicas: pobreza, subdesarrollo, desigualdad,
baja inversión en I+D y pobre calidad de vida urbana.
• Señales no recogidas eficientemente por medidas
macroeconómicas (PIB, inflación, empleo) y otras regionales
y locales. NECESIDAD DE NUEVOS AGREGADOS
Medida del Desarrollo

4
Introducción
RESPUESTAS
Enfoque Indicadores Sociales
INDICADORES DE
SOSTENIBILIDAD
Enfoque Contable Enfoque Utilitarista
Satellite accounts
(NAMEA)
Ecological
FootprintMaterial Flow
Accounts
Green GNP
Contingent
Valuation
Cost-Benefit
Analysis
Travel-Cost
method
Energy
Accounts
Ecological &
Human needs
Ecological Services

5
Introducción
• ¿Existe una métrica de la sostenibilidad?.
– Concepto multidimensional y contexto
dependiente. Su evaluación vendrá influenciada
por efectos de la escala, características
territoriales, culturales, económicas, sociales, etc.
La sostenibilidad no se puede medir directa y
universalmente.
• ¿Está normalizado el método de evaluación?.
– Disparidad de metodologías para evaluar la
sostenibilidad. No hay un consenso en la
medida o evaluación de la misma.

6
Dimensiones centrales de la sostenibilidad
por agregados más relevantes
Ambiental Social Económico
Huella
Ecológica/EPI
ESI
Human
Welbeing
Index
HDI
GDP

7
Goal
Basic Framework
Non-environmentally adjusted measures
Environmentallyadjusted measures
AppropriateValuationMethods
___________
Marketed
value ofmarketed goods
and servicesproduced and
consumed in aneconomy
GNP(Gross National
P roduct)
GDP(Gross Domestic
Product)
NNP (Net National P roduct)
NNP’(Net National P roduct
including non-produced assetts)
Market values
EconomicIncome Weak
Sustainability
1 + non-marketed goods
and servicesconsumption
ENNP (Environmental NetNational P roduct)
SEEA (System of
EnvironmentalEconomic Accounts)
1 + Willingness to Pay Based Values (see
Table 2)
___________
StrongSustainability
2 + preserveessential natural
capital
SNI(Sustainable National
Income)
SEEA(System of
EnvironmentalEconomic Accounts)
2 + Replacement Costs,+
ProductionValues
Economic Welfare
value of the wefareeffects of income and
other factors(including
distribution,household work, loss
of natural capitaletc.)
MEW(Measure of Economic
Welfare)
ISEW(Index of SustainableEconomic Welfare)
3 +ConstructedPreferences
HumanWelfare
assessment ofthe degree towhich human
needs arefulfilled
HDI (Human
Development Index)
HNA(Human NeedsAssessment)
4 + ConsensusBuildingDialogue
A range of goals for national accounting and their corresponding frameworks,measures, and valuation methods
from: Costanza, R., S. Farber, B. Castaneda and M. Grasso. 2000. Green national accounting: goals and methods. Chapter in: Cleveland, C. J., D. I. Stern and R. Costanza (eds.) The nature of economics and the economics of nature. Edward Elgar Publishing, Cheltenham, England (in press)
From: Costanza, R., S. Farber, B. Castaneda and M. Grasso. 2001. Green national accounting: goals andmethods. Pp. 262-282 in: Cleveland, C. J., D. I. Stern and R. Costanza (eds.) The economics of nature and thenature of economics. Edward Elgar Publishing, Cheltenham, England

8
Introducción
• ¿Qué es sostenibilidad?
• Un sistema sostenible es aquel que sobrevive o
persiste. Hay tres condiciones adicionales:
– (1) ¿Qué características del sistema persisten o
queremos que persistan?
– (2) ¿Cuánto tiempo?
– (3) ¿Cómo evaluamos que el sistema o
características del mismo persiste?
Costanza, R. and B. C. Patten. 1995. Defining and predicting
sustainability. Ecological Economics 15:193-196

9
Introducción
• Sostenibilidad desde la teoría del capital:
– 2 tipos de capital:
• Hecho por el hombre y capital social (KM):
artificial, cultural, habilidades, tecnologías & capital
social.
• Capital Natural (KN): Biodiversidad, recursos
naturales y servicios ambientales.
– 2 tipos de sostenibilidad:
• Débil: Stock de capital total no decreciente.
Sustitución perfecta entre KM and KN.
• Fuerte o estricta: Stock de capital natural no
decreciente. No sustituibilidad.

Labor
Land
EconomicProcess
GoodsandServices
CulturalNorms andPolicy
IndividualUtility/welfare
Consumption(based on fixedpreferences)
Improvement
Education, Training,Research
Building
Investment(decisions about, taxesgovernment spending,education,science andtechnologypolicy, etc., basedon existing propertyrights regimes)
Property rights
Private Public
GNP
Manufacturedcapital
”Empty World" Model of the Economy

Human Capital EconomicProductionProcess
GoodsandServices
EvolvingCulturalNorms andPolicy
Well Being(Individual andCommunity)
Consumption(based on changing,adaptingpreferences)
Education, training,
research.
Building
Investment(decisions about, taxescommunity spending,education, science andtechnology policy, etc., basedon complex propertyrights regimes)
Individual Public
GNP
Wastes
Common
Ecologicalservices/amenities
having, being
- having,
- being
negative impacts on all forms of capital
being, doing, relating
Restoration,
ConservationNatural Capital
ManufacturedCapital
having
positive impacts on human capital capacity
doing, relatingComplex propertyrights regimes
SolarEnergy
SocialCapital
“Full World” Model of the Ecological Economic System
Waste heat
Institutional
rules, norms, etc.
Materially closed earth system
From: Costanza, R., J. C. Cumberland, H. E. Daly, R. Goodland, and R. Norgaard. 1997. An Introduction to Ecological Economics. St. Lucie Press, Boca Raton, 275 pp.

12
Introducción
• La sostenibilidad desde otras teorías:
– Ecología
– Termodinámica
– Desmaterialización
– Cambio social y gobernanza

13
Taxonomía
• Definiciones de Indicadores de Desarrollo Sostenible
(ISD): tantas como definiciones y enfoques de DS.
• Usados por todo el mundo desde la Agenda 21 (ONU,
1992).
• ISD como medida/evaluación de:
– El estado del medio ambiente (MEDIDA CUANTITATIVA Y
CUALITATIVA)
– La calidad de vida (MEDIDA DEL BIENESTAR)
– La durabilidad de la senda actual (MEDIDA DE
DURABILIDAD)
– El impacto de actividades/asentamientos/empresas sobre lo
anterior (A21, RSC, etc).

14
Taxonomía
• Tipos de indicadores de sostenibilidad (ejemplos):
– Simples/conjuntos/Sistemas de indicadores (señales AEMA/enfoque PER/Modelos servicios ambientales)
– Indicador agregado o índice (ISEW, GPI, ESI)
– Términos monetarios (PIB corregido, sistema NAMEA)
– Términos físicos/energéticos (HE/EXERGÍA)
– Adimensional (IDH)
– Stock (HE)
– Flujo (CFM)
– Unidimensionales (sólo la ecológica)
– Comprehensivo u holísticos (social/ecologica/economica)

15
Fuente: OCDE (1993)
MODELO PRESIÓN-ESTADO-RESPUESTA
PRESIÓN ESTADO RESPUESTA
Actividades
Humanas
EnergíaTransporte
Industria
Agricultura
Otros
Estado del MedioAmbiente y de los
Recursos Naturales
Aire
Agua
Tierra
Recursos Naturales
AgentesEconómicos y
Medioambientales
Administraciones
HogaresEmpresas
Internacional
Presiones
Recursos
Información
Respuestas Sociales
(Decisiones -
Acciones)
Respuestas Sociales
(Decisiones - Acciones)
Información
OCDE (1993)
Esquema PER de la OCDE

16
Ejemplos
• Conjuntos y sistemas de indicadores:
– Indicadores de desarrollo sostenible (UN).
– Los objetivos de desarrollo del milenio (UN).
– Indicadores centrales o de cabecera (EEA)
• Políticas Europeas.
• 11 temas. 1 nivel. 37 indicadores.
– Lista de indicadores de desarrollo sostenible.
(European Commission. EUROSTAT).
• Estrategia de DS Europea
• 10 temas. 3 niveles. 155 indicadores.
17
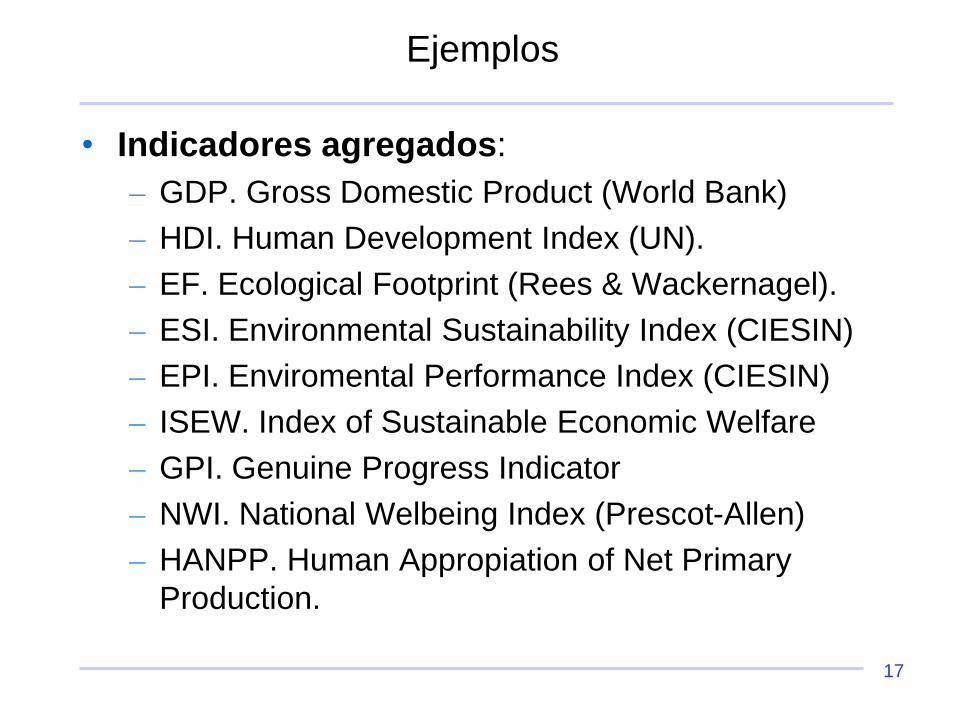
Ejemplos
• Indicadores agregados:
– GDP. Gross Domestic Product (World Bank)
– HDI. Human Development Index (UN).
– EF. Ecological Footprint (Rees & Wackernagel).
– ESI. Environmental Sustainability Index (CIESIN)
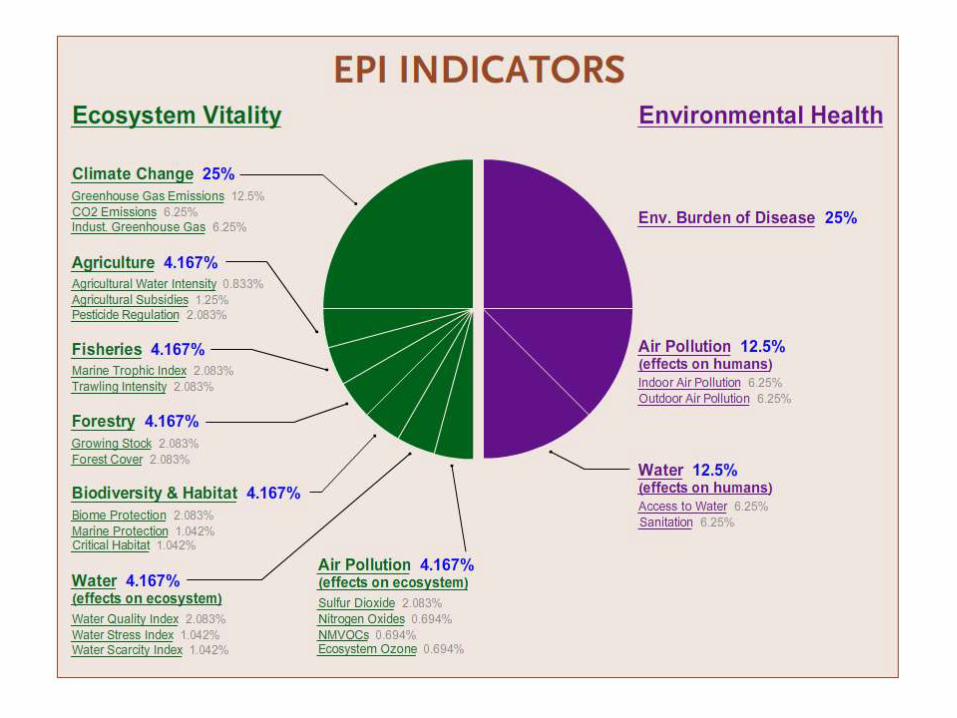
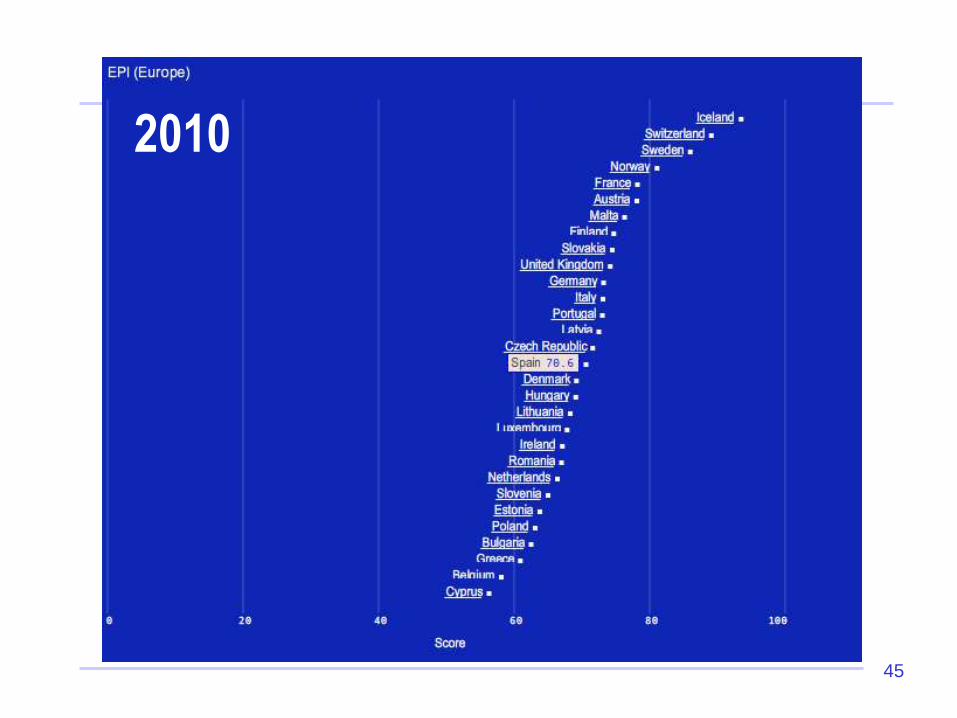
– EPI. Enviromental Performance Index (CIESIN)
– ISEW. Index of Sustainable Economic Welfare
– GPI. Genuine Progress Indicator
– NWI. National Welbeing Index (Prescot-Allen)
– HANPP. Human Appropiation of Net Primary
Production.

18
Examples

19

20

21

22
US
40
90
140
1940 1960 1980 2000
UK
40
90
140
1940 1960 1980 2000
Germany
40
90
140
1940 1960 1980 2000
Austri a
40
90
140
1940 1960 1980 2000
Netherland s
40
90
140
1940 1960 1980 2000
Sweden
40
90
140
1940 1960 1980 2000
Chile
40
90
140
190
240
1940 1960 1980 2000
Indices of ISEW (Index of SustainableEconomic Welfare)
and GDP (1970 = 100)

23
Column A: Personal Consumption Expenditures
Column B: Income Distribution
Column C: Personal Consumption Adjusted for Income Inequality
Column D: Value of Household Labor
Column E: Value of Volunteer Work
Column F: Services of Household Capital
Column G: Services Highways and Street
Column H: Cost of Crime
Column I: Cost of Family Breakdown
Column J: Loss of Leisure Time
Column K: Cost of Underemployment
Column L: Cost of Consumer Durables
Column M: Cost of Commuting
Column N: Cost of Household Pollution Abatement
Column O: Cost of Automobil e Accidents
Column P: Cost of Water Pollution
Column Q: Cost of Air Pollution
Column R: Cost of Noise Pollution
Column S: Loss of Wetlands
Column T: Loss of Farmland
Column U: Depletion of Nonrenewable Resources
Column V: Long-Term Environmental Damage
Column W: Cost of Ozone Depletion
Column X: Loss of Forest Cover
Column Y: Net Capital Investment
Column Z: Net Foreign Lending and Borrowing
ISEW (or GPI) by Column

25


28

29


31
2005

ECOSYSTEM SERVICES
Gas regulation
Climate regulation
Disturbance regulation
Water regulation
Water supply
Erosion control and sediment retention
Soil formation
Nutrient cycling
Waste treatment
Pollination
Biological control
Refugia
Food production
Raw materials
Genetic resources
Recreation
Cultural
ECOSYSTEM FUNCTIONS
Regulation of atmospheric chemical composition.
Regulation of global temperature, precipitation, and other biologically mediatedclimatic processes at global, regional, or local levels. Capacitance, damping and integrity of ecosystem response to environmental fluctuations. Regulation of hydrological flows.
Storage and retention of water.
Retention of soil within an ecosystem.
Soil formation processes.
Storage, internal cycling, processing, and acquisition of nutrients.
Recovery of mobile nutrients and removal or breakdown of excess or xenic nutrients and compounds. Movement of floral gametes.
Trophic-dynamic regulations of populations.
Habitat for resident and transient populations.
That portion of gross primary production extractable as food.
That portion of gross primary production extractable as raw materials.
Sources of unique biological materials and products.
Providing opportunities for recreational activities.
Providing opportunities for non-commercial uses.
From: Costanza, R. R. d'Arge, R. de Groot, S. Farber, M. Grasso, B. Hannon, S. Naeem, K. Limburg, J. Paruelo, R.V. O'Neill,R. Raskin, P. Sutton, and M. van den Belt. 1997. The value of the world's ecosystem services and natural capital. Nature387:253-260
Ecosystem services are the benefits humans derive from ecosystem functioning

33

35

36

37
38

39

40

42

43

44
45
2010

46

47

48

49

50

51

52
Ecological
footprint
Surplus
Biocapacity
ESI WI
GDPHDI

53

54
Tendencias
• (+) Heterogeneidad y dispersión de metodologias.
• (+) Uso de indicadores físicos y enfoque ecológico.
• (+) Indices y evaluaciones integradas.
• (+) indicadores georeferenciados (mapping sustainability).
• (+) predefinición de temas claves o áreas estratégicas.
• (+) enfoque comparativo o relativo de la sostenibilidad. Uso en planes de acción.
• (-) Enfoque PER (OCDE).

55
Tendencias
• La escala de la sostenibilidad
– Global/Nacional: Huella Ecológica y conjuntos de
indicadores claves (cambio climático).
– Nivel regional: Indicadores claves (UE) e
indicadores territoriales (SIG). MFA.
– Esfera Urbana: Indicadores de calidad y modos de
vida. Buenas prácticas como indicadores.
– Empresas: memorias de sostenibilidad,
verificadores RSC. DJSI (Dow Jones Sustainability
Indexes).