Embed Size (px)
Citation preview
Test Report of CQM Auto Ball Cleaning System
for Condenser Tubes
Sep. 30, 2000
Korea Institute of Science and Technology
SUBMISSION
This is to submit as a final test report of
CQM Auto Ball Cleaning System for the condenser tubes
Sep. 30, 2000
Principal Researcher : Dr. Yoon Pyo Lee(KIST)
Researcher : Sarng Woo Karng(KIST)
: Min-Cheol Shin(KIST)
Thermal Flow Control Research Center
Korea Institute of Science and Technology
2
Contents
Summary -----------------------------------------------------------------------------------------------------5
Chapter � : Introduction ----------------------------------------------------------------------------------1
Chapter � : The Installation of CQM Auto Ball Cleaning System --------------------------------3
Chapter � : The Basis of Fouling Factor calculation by Time --------------------------------------6
1. Mathematical Derivation of Fouling Factor ---------------------------------------6
2. Calculated fouling factor from Experimental Data -------------------------------10
3. Prediction of Fouling Factor by Time ---------------------------------------------15
Chapter � : Effect by Time of CQM Auto Ball Cleaning System --------------------------------19
1. Prediction of Condensing Temperature Rising ------------------------------------19
2. Economical Expectation of CQM Auto Ball Cleaning System ---------------21
Chapter � : Analysis of CQM Auto Ball Cleaning System ----------------------------------------25
1. Calculating of thermal resistance by Time -----------------------------------------25
2. Improving the Effects of Coefficient of Performance(COP) ------------------29
3. Mathematical Derivation of Power Reducing Rate by COP Improvement ----
32
4. Calculation of Electrical Power Saving Rate ---------------------------------------
34
Chapter � : Analysis of Economical Efficiency -------------------------------------------------------41
Chapter � : A Case Study on Korean Company "S" --------------------------------------------------42
1. Calculation of COP --------------------------------------------------------------------
42
2. Calculation of Electrical Power Saving ---------------------------------------------46
3. Expectation of Condensing Pressure on Compressor -----------------------------47
3

4. Calculation of Saving Amount of Money ------------------------------------------49
Chapter � : Conclusion -----------------------------------------------------------------------------------51
References ----------------------------------------------------------------------------------------------------53
Reference Informations ;
1. Saturation Graph Curve of R-134a --------------------------------------------------54
2. Properties of Saturated Liquid Water -----------------------------------------------55
Appendix A : Fouling of Heat Exchanger ---------------------------------------------------------------56
1. Introduction -----------------------------------------------------------------------------56
2. Fouling as thermal resistance ---------------------------------------------------------
56
3. A Common Type of Fouling ---------------------------------------------------------59
4. How to Control or Remove Fouling -------------------------------------------------60
Appendix B : Fouling in Refrigerator Caused by Cooling Water ------------------------------------62
1. Introduction -----------------------------------------------------------------------------62
2. Relations between Thickness of Scales, Suction Temperature,
Condensing Temperature and Horsepower -----------------------------------------63
3. Relations between Condensing Temperature and Refrigerative Effect ---------
68
4. How to remove Fouling Caused by Cooling Water -------------------------------71
4

Summary
We circulate cooling water to cool down the condenser of refrigerators, and "Shell &
Tube Type" is widely used. Usually cooling water goes through inside of the tubes. And in the
shell, the condensing of refrigerant occurred. Cooling water used to be cooled in cooling tower,
but lots of microbes, viruses and dust in the air go into the devices and may cause the formation
of fouling which is a kind of deposit inside of the tubes. Fouling can be the thermal resistance of
heat transfer of the condenser, so it bring about rising of refrigerant saturation temperature, for
inefficiency of the cooling ability caused by fouling.
The rising of refrigerant saturation temperature may cause the rising of refrigerant
saturation pressure, and compressor should do more work because of the raised saturation
pressure. Thus it needs more electrical power to do more work. The COP(Coefficient of
Performance) of the refrigerator could be determined by the works of compressor, eventually
fouling makes refrigerator more inefficient.
In this study, we would like to analyse the effectiveness of CQM (Cooling Quality
Management) Company 's Auto Ball Cleaning System measured for fixed period of time.
Also we are going to calculate all amount of saved electric power and money comparing
with before and after installing the “CQM Auto Ball Cleaning System”.
5

Chapter � : Introduction
There are many ways to restrain the fouling, but 'chemical method' and 'brush method' are
used ones. Both method has each demerits. While chemical cleaning should stop all systems to
clean the fouling, but system of Brush Cleaning is complicated and expensive to maintain the
Brush Cleaning System. Moreover the periodical chemical cleaning system which is usually used
in the Korea has the weak point that it used to be getting more fouling as time goes even though
it has good efficiency just after cleaned up - so the range of fluctuation of ability would be too
big. On the other hand, cleaning by circulation ball sponge which keep out formation of fouling
has a good point to keep a thermal resistance below the regulation but we should willingly
submit stopping all the machine and taking out and washing the sponge ball periodically.
But CQM (Cooling Quality Management) Auto Ball System distributed by Dasan
Industries Corp. has the merit that all of sponge balls wash by themselves while compressed air
keep circulate the balls periodically so that we need not stop the machine to wash them.
The aim of this study is to analyze the spot investigation of CQM Auto Ball Cleaning
System distributed by Dasan Industries Corp..
There were two difficult things in analyzing long-term investigation, one is it takes long
time to make experiment on, and another is difficulty that to carry through perfect experiment
not in laboratory but in the spot because this system should be installed on now-working
refrigerator(on factory, for example). Considering these, we predicted an annual average by
fouling formation theory based on 40-days experiment, and we compared the data actually
1
recorded for one year. Being comparing between these - the predict and actual data -,
we certificated the experiment.
2

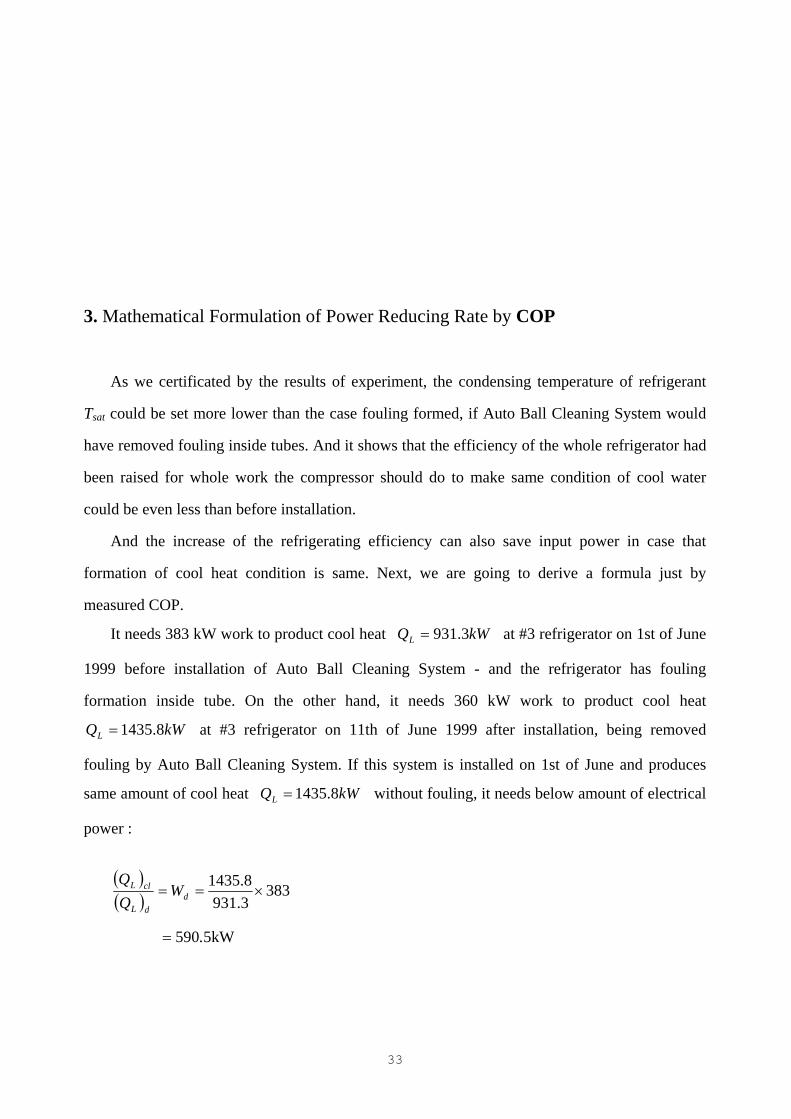
Chapter � : The Installation of CQM Auto Ball Cleaning System
The Fig. 2-1 is the conception of CQM Auto Ball Cleaning System installed for this study.
That is, it is designed that sponge balls are circulated inside of the condenser - heat exchanger -
of refrigerator. In this circulation, fouling which formulated inside the condenser tubes are
removed by the sponge balls, and then the balls are taken back to the entrance of cooling water
which connected to the entry of condenser tube. And in this process, sponge balls are refreshed
by themselves.
DrainAir com pressor
W aterpum p
Ballsrefreshing
To coolingtow er
Heat exchanger/condenser
Main pipe/Inlet
Ball trap
Collector
Check V.Check V.
Controller
Control V.Control V.
Injector
DrainAir com pressor
W aterpum p
Ballsrefreshing
To coolingtow er
Heat exchanger/condenser
Main pipe/Inlet
DrainAir com pressor
W aterpum p
Ballsrefreshing
To coolingtow er
Heat exchanger/condenser
Main pipe/Inlet
Ball trap
Collector
Check V.Check V.
Controller
Control V.Control V.
Injector
Fig. 2-1 : The conception of CQM Auto Ball Cleaning System
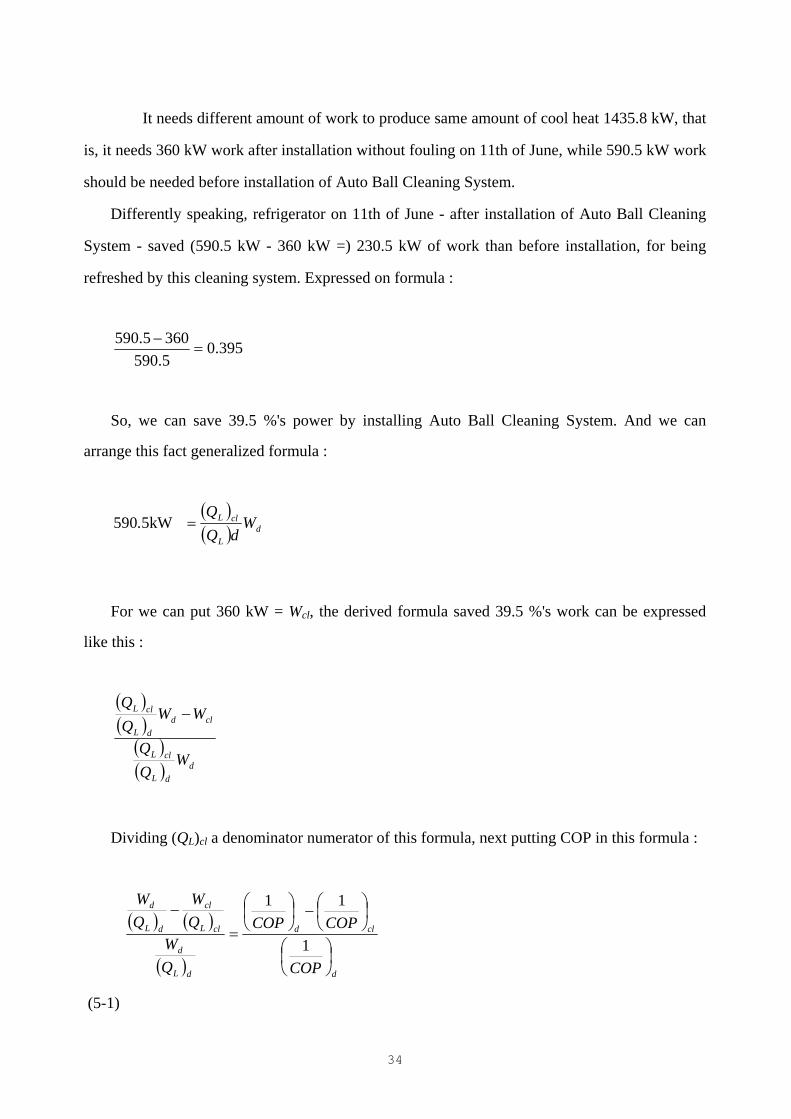
One of CQM Auto Ball Cleaning system was installed on the 550 RT class Turbo
refrigerator #3 running on the ORION Electric Co., Ltd factory located in Kumi City, Kyung-
buk Province. The date that all tubes were cleaned up was
3
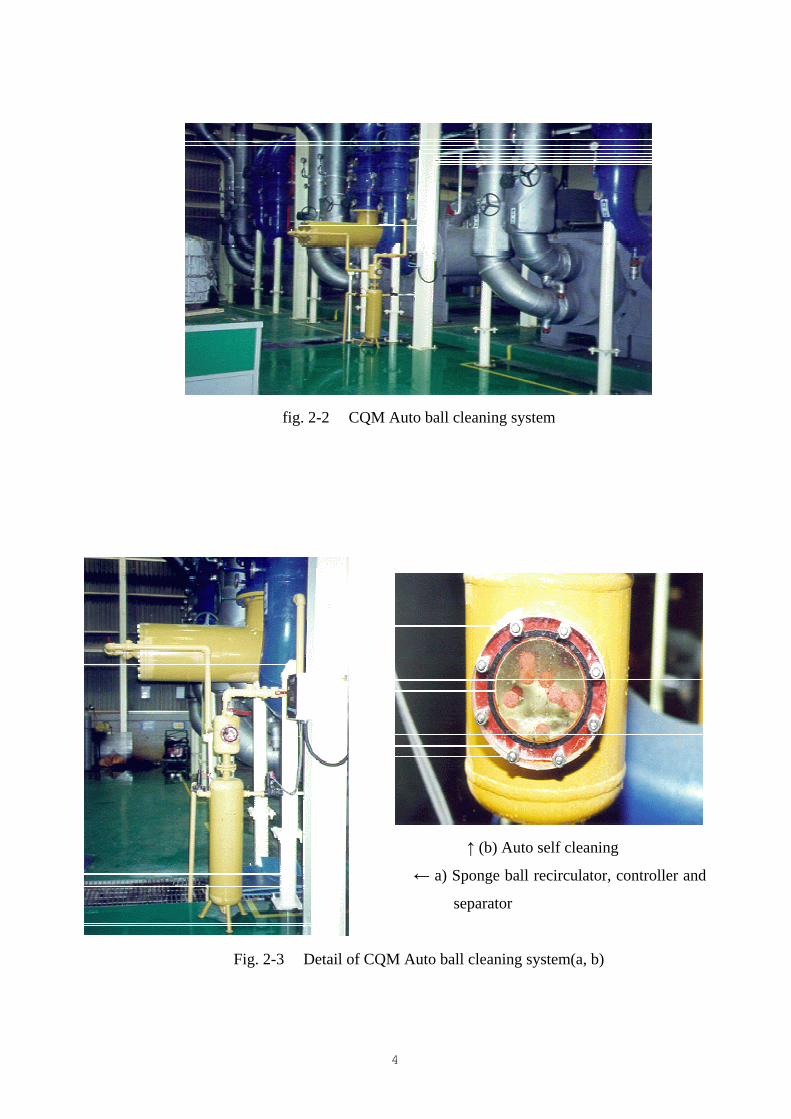
fig. 2-2 CQM Auto ball cleaning system
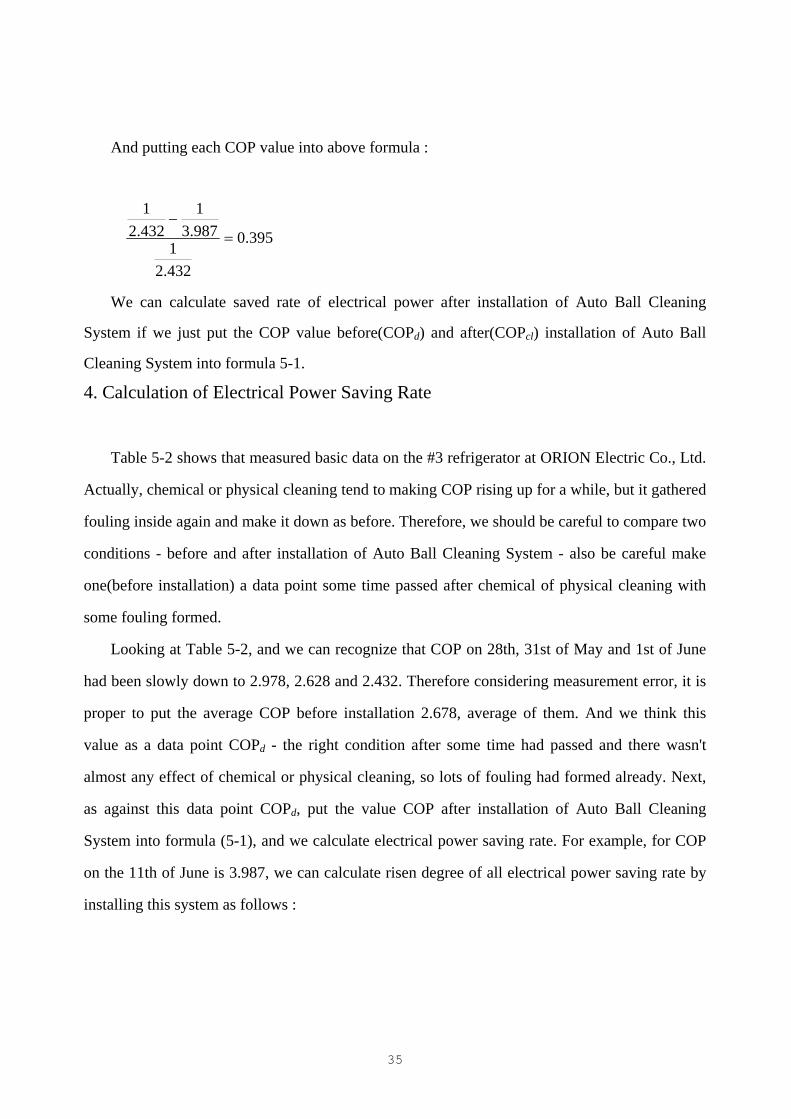
4
↑ (b) Auto self cleaning
← a) Sponge ball recirculator, controller and
separator
Fig. 2-3 Detail of CQM Auto ball cleaning system(a, b)

And of June, 1999. and this system was started on 9th of June, 1999. CQM Auto Ball
System is working up to now(September of 2000 at present). Fig. 2-2 is the whole picture of
CQM, and Fig. 2-3 is enlarged CQM picture. Fig. 2-3(a) is the picture of sponge ball collector,
controller and divider. And in Fig. 2-3(b), we took a photograph of the sponge balls refreshed by
compressed air and whirlpool of water.
The condition of refrigerator and condenser on which installed the CQM is as follows :
- refrigerator capacity : 550 RT
- type of heat exchanger : : shell & tube
- inside of shell : superheated vapor
- inside of tube : cooling water
- number of tube : 432
- arrangement : 8
- number of pass : 2
- length of tube : 3752
- material : copper
- inner diameter of tube : 15.7
- thickness of tube : 1.2
- refrigerant :R-134a
- volume of cooling water : 400 /h
5
Chapter � : The Basis of Fouling Factor calculation by time
Now we will calculate fouling factor from each case whether CQM system installed or not,
and will predict fouling factor by long-terms of time.
1. Formulation of Fouling Factor
We can write overall heat transfer U as follows ;
metalifitubecond
RAh
AAh
AhU
+++= 0011
(3.1)
m
metal kAxAR 0=
(3.2)
where is ;
hcond : heat-transfer constant on condensing
htube : heat-transfer constant on circulation of cooling water
A0 : area of tube outside
Ai : area of tube inside
Am : average area of tube [(A0+Ai)/2]
Rmeta : thermal resistant of tube wall
k : thermal conductivity of tube wall
χ : thickness of tube
Subscripts
cl : tubes without fouling
d : tubes with fouling
6
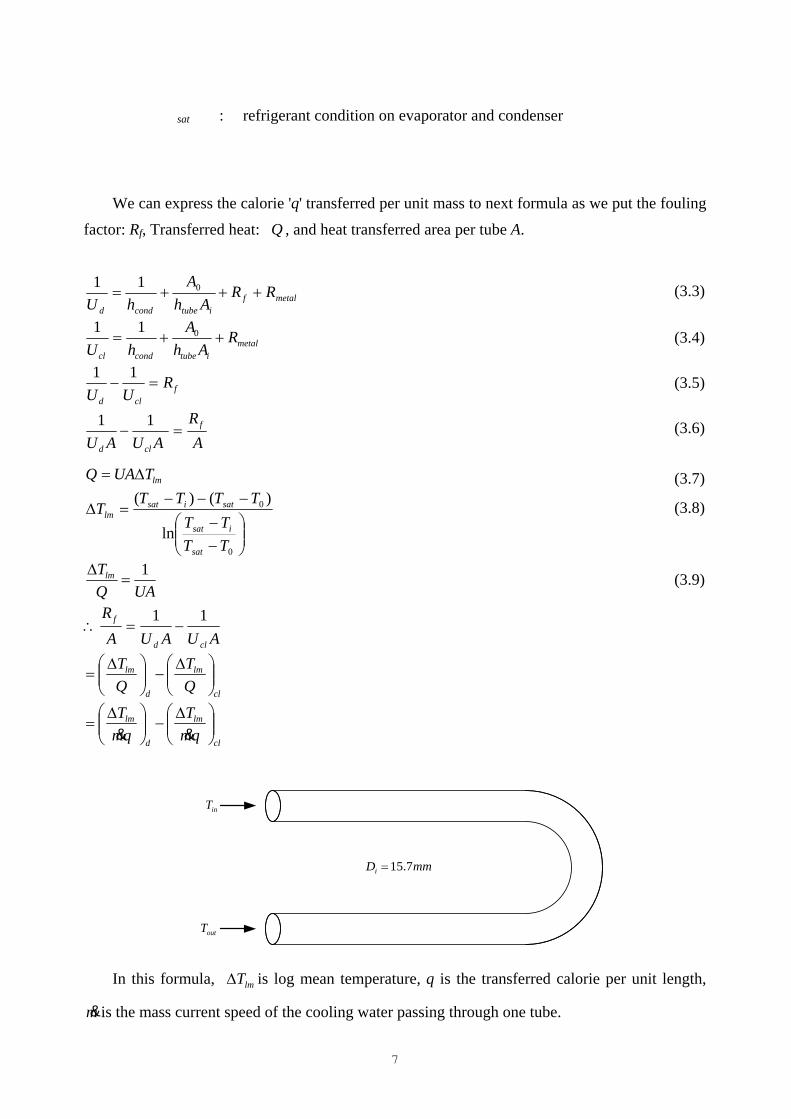
sat : refrigerant condition on evaporator and condenser
We can express the calorie 'q' transferred per unit mass to next formula as we put the fouling
factor: Rf, Transferred heat: , and heat transferred area per tube A. Q
metalfitubecondd
RRAh
AhU
+++= 011 (3.3)
metalitubecondcl
RAh
AhU
++= 011 (3.4)
fcld
RUU
=−11 (3.5)
AR
AUAUf
cld
=−11 (3.6)
lmTUAQ ∆= (3.7)
−−
−−−=∆
0
0
ln
)()(
TTTT
TTTTT
sat
isat
satisatlm (3.8)
UAQTlm 1
=∆ (3.9)
AUAUAR
cld
f 11−=∴
cl
lm
d
lm
QT
QT
∆−
∆=
cl
lm
d
lm
qmT
qmT
∆−
∆=
&&
inT
outT
mmDi 7.15=
In this formula, is log mean temperature, q is the transferred calorie per unit length, lmT∆
m&is the mass current speed of the cooling water passing through one tube.
7

Supposing that the flux of cooling water inside tubes are same with fouling or not,
we can lead one formula as follows :
mmm cld &&& == (3.10)
)( inletoutp TTCmQq −==&
& (3.11)
Qqm && = (3.12)
cl
lm
d
lmf q
TqT
RAm
∆−
∆=
&&&
(3.13)
Now we calculate the mass flux of cooling water per 1 tube.
nMm&
& =
N : number of tubes (432)
M : volume of cooling water 400 /hr � density of 30� water 995.6 /
So, we can calculate the mass current speed as follows :
=m&432
mkg6.995sec3600
hr1hrm400 33 ××
seckg256.0=
And now we are able to get the fouling factor 'Rf' by putting the heat transfer area and the
mass flux we got above into next formula.
∆−
∆=
cl
lm
d
lmf q
TqT
mAR&
(3.14)
8

And the unit of fouling factor 'Rf' is as follows :
[ ]kWmKkgkJK
kgm 22 ⋅⇒⋅⋅⋅
sec
And it will be arranged as follows :
lmTUAqmQ ∆== && (3.15)
( )iop TTCmqm −= && (3.16)
( ) ( )
−−
−−−=∆
osat
isat
osatisatlm
TTTT
TTTTT
ln (3.8)
Auto Ball Cleaning System was installed on the cooling water tube outside of the
refrigerator condenser #3. Supposing that there would not be any formation of fouling in this
tube, the fouling factor of condenser tube #1 can be calculated owing to the thermal resistant
difference between #1 and #3 refrigerator.
( )( ) ( ) ( ) ( )
−−
−−−−
−−
−−−−
=
31
lnln
1
osat
isat
osatisat
osat
isat
osatisat
iopf
TTTT
TTTT
TTTT
TTTTTTCm
AR&
(3.17
)
9
In the formula above, the 1st term of the braces [ ] is the #1 condenser tube's log
mean temperature in case that being polluted, and 2nd term is the #3 condenser tube's unpolluted
log mean temperature by circulating the sponge balls of CQM system.
2. Calculated Fouling Factor from Experimental Data
So now we would like to calculate fouling factor using above formulas by putting into the
measured data installed refrigerator in ORION Electric Co., Ltd.
CQM Auto Ball Cleaning System was installed just on the #3 Condenser Tube (after this
paragraph, #3 Tube) on 2nd of June 1999. We measured each parts' temperature and pressure of
the #1 Tube(Auto Ball System was not installed) and #3 Tube(Auto Ball System was installed)
during 40 days(1999.6.9 ~ 1999.7.19). And the data were arranged on the Table 3-1. For
example of calculation as follows :
1) 15:00, 15th of July
#3 Tube (Auto Ball System was installed)
( ) ( )
−−
−−−=∆
osat
isat
osatisatlm
TTTT
TTTTT
ln
( ) ( )
K
Tlm
49.34.375.391.345.39ln
4.375.391.345.39
=
−−
−−−=∆
=PC ),(. C40C30KkgkJ1794 °°⋅
Heat outgoing by cooling water, is bq
cooling water outlet temperature CTo °= 4.37
cooling water inlet temperature CTi °= 1.34
condensation temperature CTsat °= 5.39
10

=bq ( )i0p TTC −
=bq ( )K134437KkgkJ1794 ... −×⋅
kgkJ79.13=
2io
mTT
T+
=
C°=+
= 8.352
1.344.37
=∆
=b
lm
qT
UAm&
kgkJ7913K493
..
( )kgkJK2530.=
#1 (Auto Ball System was not installed) ( ) ( )
−−
−−−=∆
osat
isat
osatisatlm
TTTT
TTTTT
ln
cooling water outlet temperature CTo °= 4.36
cooling water inlet temperature CTi °= 4.34
condensation temperature CTsat °= 8.40
( ) ( )
−−
−−−=∆
436840434840
436840434840
..
..ln
....Tlm
kgkJ3588K434439KkgkJ1794q
TTCqC40C30KkgkJ1794C
K345
iop
P
.)..(.
)(),(.
.
=−×⋅=
−=°°⋅=
=
&
&
C
TTT io
m
°=+
=
+=
4.352
4.344.362
==qT
UAm lm∆&
kgkJ358.8K34.5
11

)kgkJ(K638.0=
where thermal resistance U1 is
=×=mA
qT
Ulm
&∆1
skg256.0m1992.0
kgkJ358.8C34.5 2
×°
kWCm496.0 2 °=
All of arranged information are shown on the Table 3-1.
On the Table 3-1, the curve of thermal resistant of the #1 (1/U) will be drawn like Fig. 3-1.
That is, thermal resistant used to be rising up as time goes on account of fouling factor in the
cooling water. Fig. 3-2 shows #3 Tube's thermal resistant graph refreshed by Auto Ball Cleaning
System. We can recognize that there was no rise of thermal resistant in #3 Tube as time goes by,
because tube was washed by sponge ball. For there is no fouling formation in #3 Tube by
refreshing, fouling factor can be calculated by taking thermal resistant of #3 from that of #1, as
we above-mentioned before, and let's put it to Rf1 - the fouling factor of #1 Tube. It is arranged
on the 2nd lane from bottom of Table 3-1, and a graph can be drawn like Fig. 3-3.
y = 6E-05x2 - 4.6718x + 84823
R2 = 0.6443
0
0.1
0.2
0.3
0.4
0.5
0.6
6/9 6/14 6/19 6/24 6/29 7/4 7/9 7/14 7/19
U1
#1
12
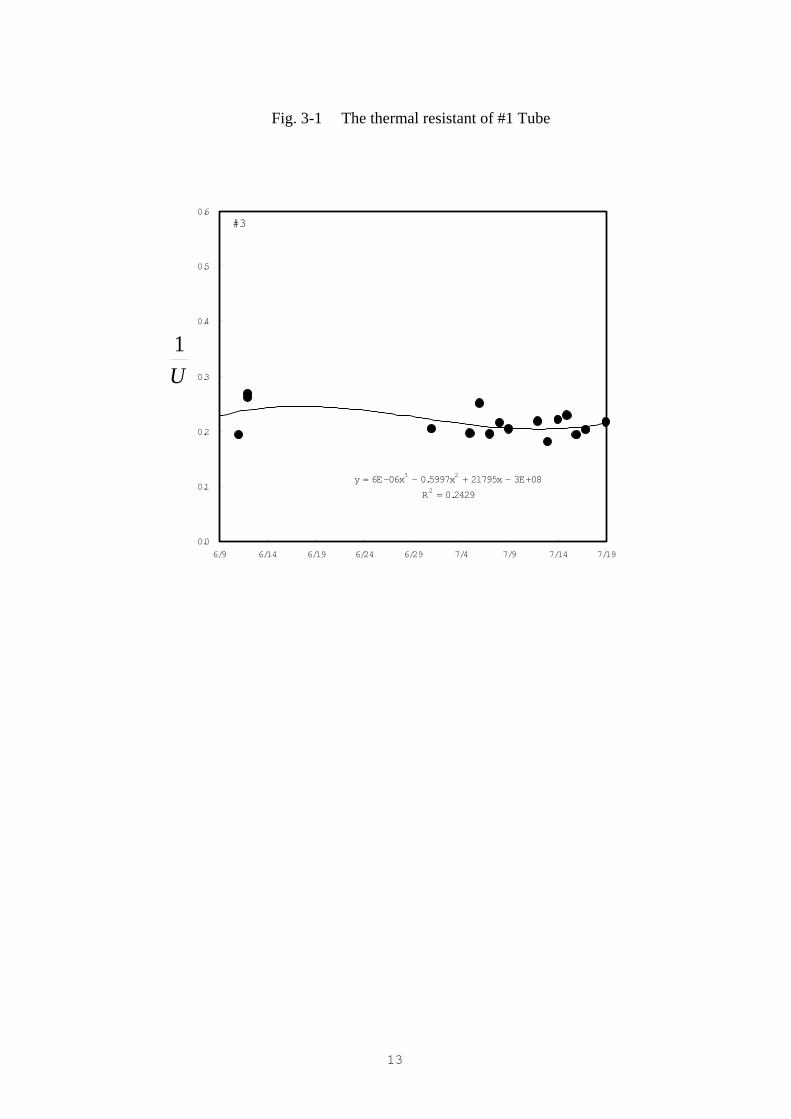
Fig. 3-1 The thermal resistant of #1 Tube
y = 6E-06x3 - 0.5997x2 + 21795x - 3E+08
R2 = 0.2429
0.0
0.1
0.2
0.3
0.4
0.5
0.6
6/9 6/14 6/19 6/24 6/29 7/4 7/9 7/14 7/19
U1
#3
13
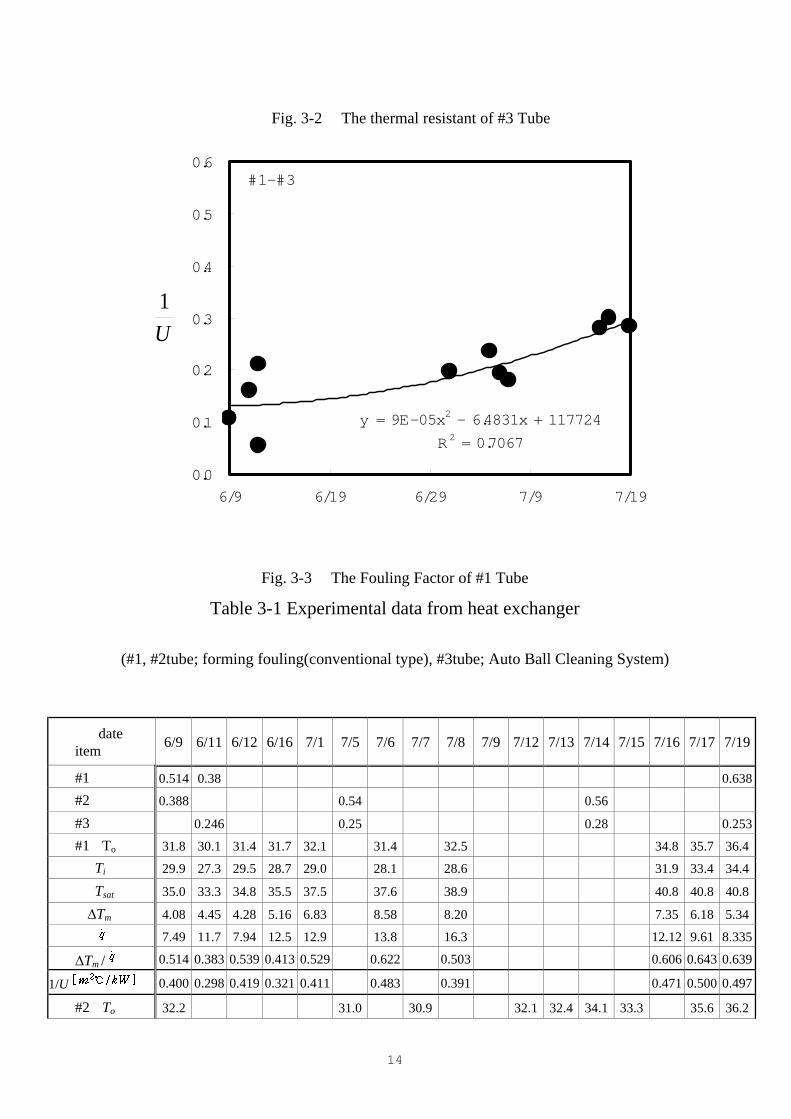
Fig. 3-2 The thermal resistant of #3 Tube
y = 9E-05x2 - 6.4831x + 117724
R2 = 0.7067
0.0
0.1
0.2
0.3
0.4
0.5
0.6
6/9 6/19 6/29 7/9 7/19
#1-#3
U1
Fig. 3-3 The Fouling Factor of #1 Tube
Table 3-1 Experimental data from heat exchanger
(#1, #2tube; forming fouling(conventional type), #3tube; Auto Ball Cleaning System)
date item 6/9 6/11 6/12 6/16 7/1 7/5 7/6 7/7 7/8 7/9 7/12 7/13 7/14 7/15 7/16 7/17 7/19
#1 0.514 0.38 0.638 #2 0.388 0.54 0.56 #3 0.246 0.25 0.28 0.253 #1 To 31.8 30.1 31.4 31.7 32.1 31.4 32.5 34.8 35.7 36.4 Ti 29.9 27.3 29.5 28.7 29.0 28.1 28.6 31.9 33.4 34.4 Tsat 35.0 33.3 34.8 35.5 37.5 37.6 38.9 40.8 40.8 40.8 ∆Tm 4.08 4.45 4.28 5.16 6.83 8.58 8.20 7.35 6.18 5.34
7.49 11.7 7.94 12.5 12.9 13.8 16.3 12.12 9.61 8.335
∆Tm / 0.514 0.383 0.539 0.413 0.529 0.622 0.503 0.606 0.643 0.639
1/U 0.400 0.298 0.419 0.321 0.411 0.483 0.391 0.471 0.500 0.497
#2 To 32.2 31.0 30.9 32.1 32.4 34.1 33.3 35.6 36.2
14

Ti 29.9 27.7 27.5 28.9 28.1 30.7 29.9 33.2 34.1 Tsat 34.9 36.9 37.4 38.1 38.6 40.8 39.7 40.5 40.8 ∆Tm 3.73 7.43 8.08 7.49 8.16 8.28 7.98 6.02 5.58
9.612 13.8 14.2 13.4 17.9 14.2 14.2 10.0 8.77
∆Tm / 0.388 0.538 0.569 0.559 0.456 0.583 0.562 0.602 0.636
1/U 0.302 0.419 0.443 0.435 0.355 0.454 0.437 0.468 0.495
#3 To 30.5 31.6 32.1 32.5 30.9 31.5 30.9 33.2 30.5 33.0 33.4 34.6 34.0 35.9 33.8 37.4 Ti 27.2 29.3 29.9 29.0 27.7 28.2 27.5 29.3 27.0 29.3 28.3 30.7 30.2 32.1 33.6 34.1 Tsat 32.5 33.8 34.3 34.8 32.9 33.8 33.0 36.0 32.8 35.7 36.2 37.5 37.0 38.2 38.9 39.5 ∆Tm 3.39 3.21 3.17 3.78 3.35 4.43 3.53 4.47 3.78 4.29 4.92 4.58 4.64 3.89 3.46 3.34
13.79 9.61 9.19 14.60 13.37 13.80 14.20 16.30 14.60 15.50 21.30 16.30 15.90 15.90 13.40 12.11
∆Tm / 0.246 0.334 0.334 0.259 0.251 0.321 0.249 0.274 0.259 0.277 0.231 0.281 0.292 0.245 0.258 0.276
1/U 0.191 0.260 0.267 0.202 0.195 0.249 0.193 0.213 0.202 0.216 0.179 0.219 0.227 0.191 0.201 0.215
#1- #3 (Rf1) 0.107 0.159 0.054 0.209 0.234 0.178 0.280 0.299 0.282
#2- #3 (Rf2) 0.224 0.250 0.219 0.176 0.235 0.210 0.267 0.280
3. Prediction of Fouling Factor by Time
Though we carried this experiment for 40 days, but we can predict the remote fouling factor
using Kern-Seaton formula.
)1(* cttff eRR −−=
(3.18) We need R*f and tc data (use the result on the Fig. 3-3) to draw Kern-Seaton graph, and the course can be arranged like this :
f*R
15

cf
f
tt
f
f
ttfff
ftt
ff
ttRR
eRR
eRRR
ReRR
c
c
c
−=
−
=−
=−
=−
−
−
−
*
*
**
**
1ln
1
f*R
In the above formula, there are two unknown quantity, R* and tc. So we need two formula to make them be known. That is :
−
−=
−
−=
−=
−
−=
−
f
fc
f
fc
cf
f
cf
RR
tt
RR
tt
tt
RR
tR
*2
2
*1
1
2*
2
1*
1ln
1ln
1ln
1ln f tR 1
If we put the two clause same ;
2
1
*2
*1
*2
*1
1ln
1ln
1ln1ln
tt
RRRR
RR
RR
f
f
f
f
f
f
f
f
=
−
−
−
=
−
21 tt
There are two unknown quantity as above(R*f and tc), so we should make two formula like in
the below, after reading two groups of data. Doing this, we can calculate R*f of 29th of June(20
after installation) and 19th of July(40 days after installation), by putting into each of 1/U, 0.182
and 0.309.
16

4020
309.01ln
182.01ln)(
1ln
1ln
*
**
2
1
*2
*1
=
−
−
=
=
−
−
f
ff
f
f
f
f
R
RRf
tt
RRRR
In the first place, we find R*f when f(R*f) became 0, using iteration techniques.
R*f R*f f(R*f)
0.65 0.000924 0.625 0.0046 0.62 0.0036 0.61 0.00164 0.605 0.000590 0.6025 0.000053
R*f R*f f(R*f)
0.4 -0.09 0.5 -0.0297 0.6 -0.00049 0.7 0.01703
When R*f is R*f=0.6021, f(R*f) become 0. Thus, we can get tc from R*f as follows :
days
t
RR
tt
c
f
fc
6.556021.0309.01ln
40
1ln *2
2
=
−
−=∴
−
−=
17
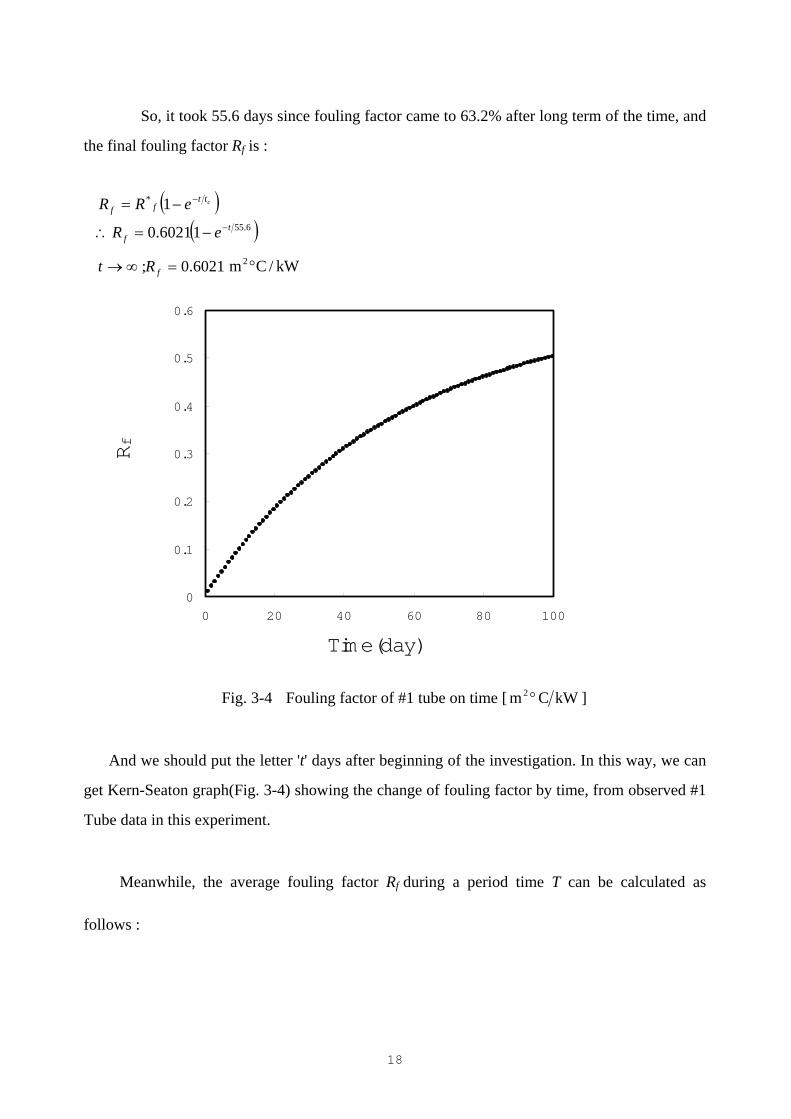
So, it took 55.6 days since fouling factor came to 63.2% after long term of the time, and
the final fouling factor Rf is :
( )( )6.55
*
16021.0
1t
f
ttff
eR
eRR c
−
−
−=∴
−=
6021.0; =∞→ fRt kW/Cm2 °
0
0.1
0.2
0.3
0.4
0.5
0.6
0 20 40 60 80 10
R
0
f
Time(day)
Fig. 3-4 Fouling factor of #1 tube on time [ kWCm2 ° ]
And we should put the letter 't' days after beginning of the investigation. In this way, we can
get Kern-Seaton graph(Fig. 3-4) showing the change of fouling factor by time, from observed #1
Tube data in this experiment.
Meanwhile, the average fouling factor Rf during a period time T can be calculated as
follows :
18
( )
( )[ ]
+−=
−−=
∫−∫=
−∫==
−
−
−
−
Te
TtR
etTR
R
dteTR
dtTR
dteTR
TR
R
c
c
c
c
tTc
f
tTc
ff
ttTfTf
ttTfff
1
1
1
*
**
0
*
0
*
0
*
So, we can predict annual mean thermal resistant like below :
3
3
6.553653
10510.010847.06021.0
3653656.551106021.0
−
−
−−
×=
××=
+−×=
eRf
Chapter � : Expectation for the Effect by Time of CQM Auto Ball Cleaning System
1. Prediction of Condensing Temperature Rising
19
It is known that the increasement of fouling factor by cooling water in the tubes could
cause the rise of saturation temperature in the condenser because heat transfer in the tube would
be interrupted by fouling factor. The condensing temperature of converged fouling factor Tsat can
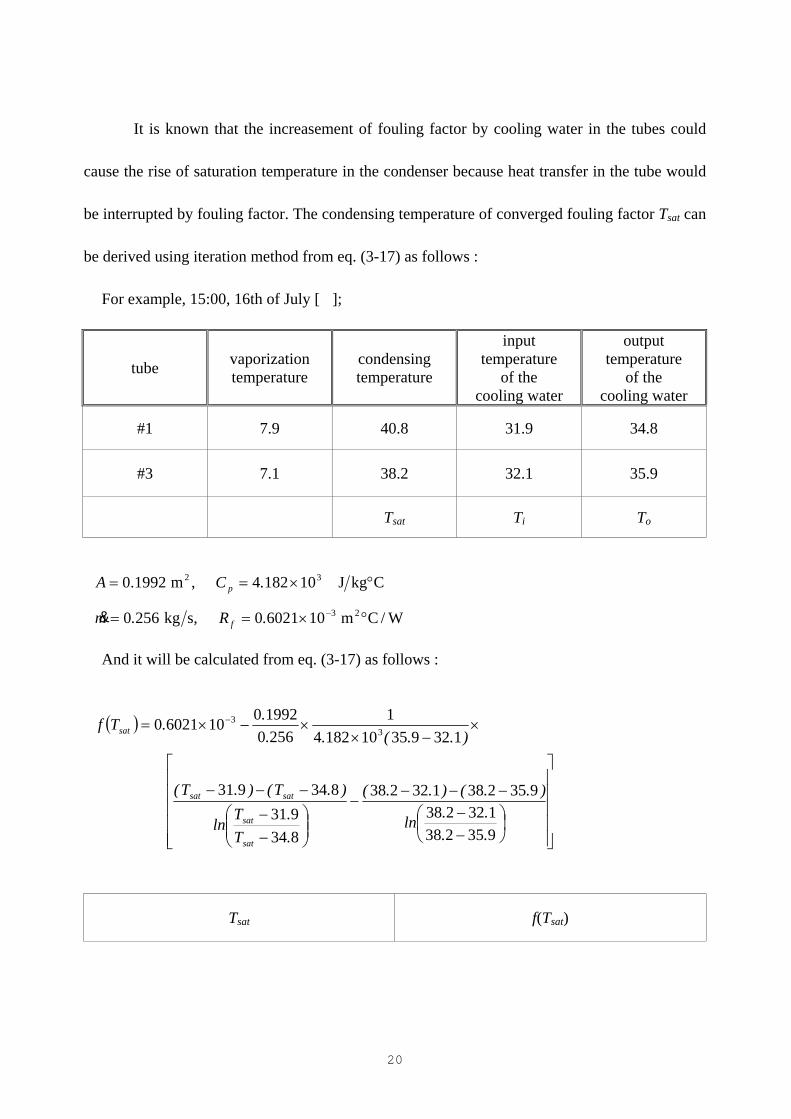
be derived using iteration method from eq. (3-17) as follows : For example, 15:00, 16th of July [�];
tube vaporization temperature
condensing temperature
input temperature
of the cooling water
output temperature
of the cooling water
#1 7.9 40.8 31.9 34.8
#3 7.1 38.2 32.1 35.9
Tsat Ti To
1992.0=A ,m2 3101824 ×= .C p CkgJ °
2560.m =& ,skg 31060210 −×= .R f W/Cm2 °
And it will be calculated from eq. (3-17) as follows :
( )
−−
−−−−
−−
−−−
×−×
×−×= −
935238132238
935238132238
834931
834931
1329351018241
2560199201060210 3
3
..
..ln
)..()..(
.T
.Tln
).T().T(
)..(....Tf
sat
sat
satsat
sat
Tsat f(Tsat)
20

40.0 45.0 47.0 49.0 49.5 50.0
0.000459 0.0002038 0.000102 0.00000456 -0.00002494 -0.0000503
249τ .)T( sat =∴ ∞→ C°
So we can predict that after long period of time refrigerant saturation temperature raised up
from 40.8� to 49.2� for there was no inefficient heat transfer between cooling water and
refrigerant due to tube fouling.
Meanwhile, the annual average saturation temperature of the condenser Tsat can be got with
same iteration method :
( )
−−
−−−−
−−
−−−
×−×
×−×= −
9.352.381.322.38ln
)9.352.38()1.322.38(
8.349.31ln
)8.34()9.31(
)1.329.35(10182.41
256.01992.010510.0 3
3
sat
sat
satsat
sat
TT
TT
Tf
Tsat f(Tsat)
47.0
47.5
47.7
47.8
0.035
0.0104
0.00063
-0.00407
CT averageyrsat °=∴ → 7.47)( .1
So, we can predict that refrigerant saturation temperature inside the condenser will rise up
from 40.8� to 47.7�
2. Economical Expectation for the Effect of CQM Auto Ball Cleaning
System
21
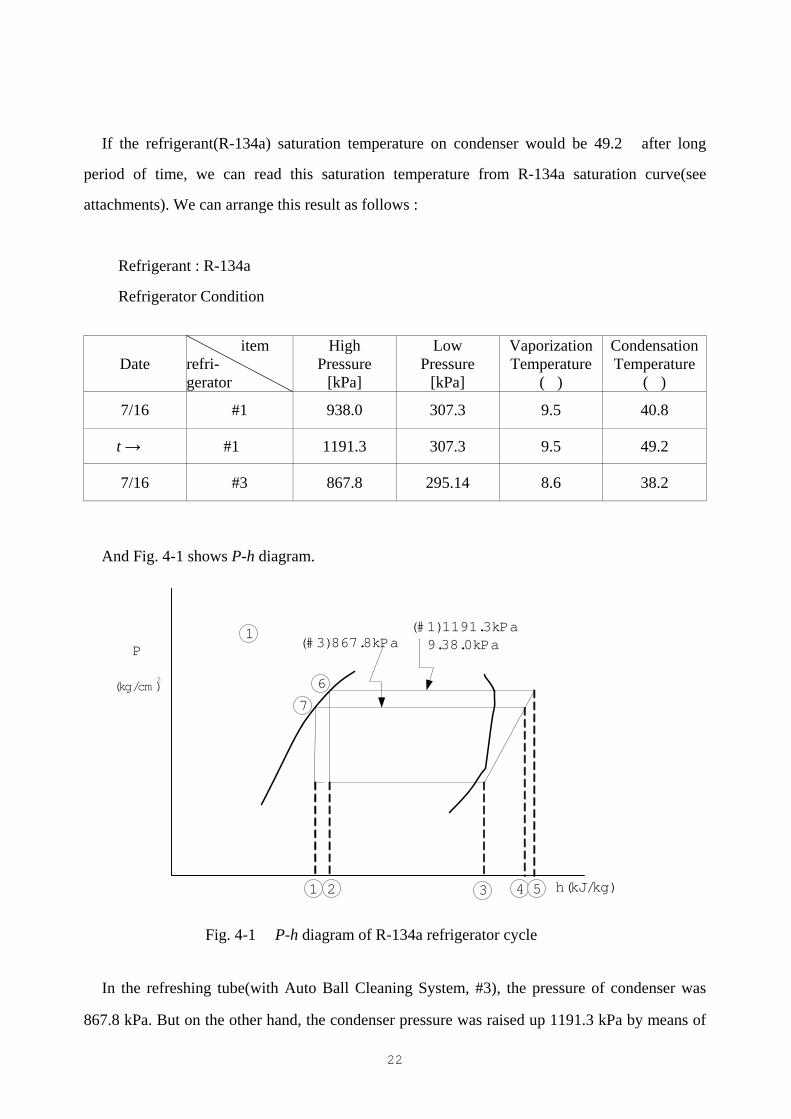
If the refrigerant(R-134a) saturation temperature on condenser would be 49.2� after long
period of time, we can read this saturation temperature from R-134a saturation curve(see
attachments). We can arrange this result as follows :
� Refrigerant : R-134a
� Refrigerator Condition
Date item refri- gerator
High Pressure
[kPa]
Low Pressure
[kPa]
Vaporization Temperature
(�)
Condensation Temperature
(�)
7/16 #1 938.0 307.3 9.5 40.8
t →� #1 � 1191.3 307.3 9.5 49.2
7/16 #3 867.8 295.14 8.6 38.2
And Fig. 4-1 shows P-h diagram.
(#3)867.8kPa(#1)1191.3kPa9.38.0kPa
1
7
6
1 2 43 5
P
(kg/cm )2
h(kJ/kg)
Fig. 4-1 P-h diagram of R-134a refrigerator cycle
In the refreshing tube(with Auto Ball Cleaning System, #3), the pressure of condenser was
867.8 kPa. But on the other hand, the condenser pressure was raised up 1191.3 kPa by means of
22
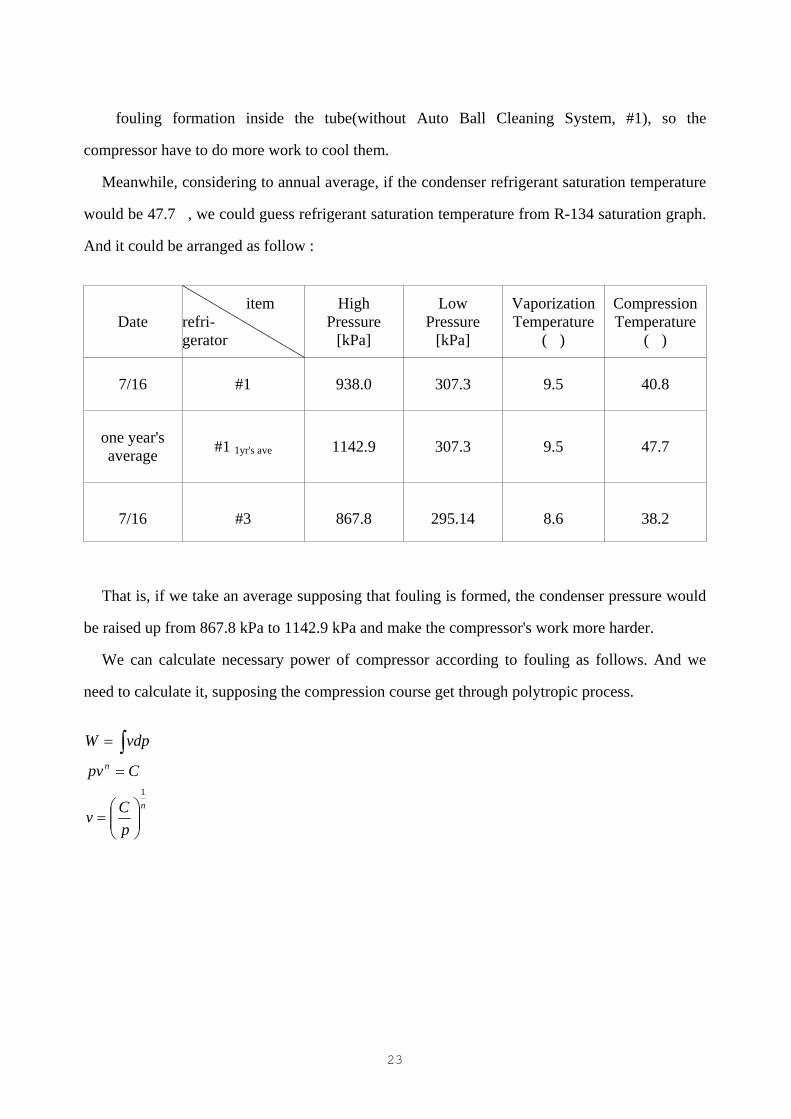
fouling formation inside the tube(without Auto Ball Cleaning System, #1), so the
compressor have to do more work to cool them.
Meanwhile, considering to annual average, if the condenser refrigerant saturation temperature
would be 47.7�, we could guess refrigerant saturation temperature from R-134 saturation graph.
And it could be arranged as follow :
Date item refri- gerator
High
]
Pressure
[kPa
LowPressure
[kPa]
Vaporization Temperature
(�)
Compression Temperature
(�)
7/16 #1 938.0 307.3 9.5 40.8
one year's average #1 1yr's ave 1142.9 307.3 9.5 47.7
7/16 #3 867.8 295.14 8.6 38.2
That is, if we take an average supposing that fouling is formed, the condenser pressure would
be raised up from 867.8 kPa to 1142.9 kPa and make the compressor's work more harder.
We can calculate necessary power of compressor according to fouling as follows. And we
need to calculate it, supposing the compression course get through polytropic process.
n
n
pCv
Cpv
vdpW
1
=
=
= ∫
23

−
−
=
−
−
=
−−
=
−
−=
−
−=
−=
=
−
−+−+
−−
−
−
∫
11
11
)(1
1
1)(
1
1
1
21
1
2
1
1
21
1122
1
111
12
111
2
1
1
1
2
1
2
1
11
11
nn
n
nnnn
nn
nn
nn
nn
n
nn
ppRT
nn
pp
pp
RTn
n
vpvpn
n
vpvpn
n
ppn
npv
pn
nC
dppCW
111
1
2
1
1
2
RTvppp
vv
Cpv
n
n
=
=
=
And, considering polytropic efficiency ηp, first we give the letter to the compression work
with fouling formation as Wcomp', with Auto Ball Cleaning System as Wcomp, and the ratio would
be :
−
−
−
−
==−
−
11
1'''
1
11
1
21
11
1
21
'
p
p
nn
nn
comp
comp
ppRT
nn
ppRT
nn
WW
ratioη
η
(4.1)
In this investigation, there is fouling formation inside #1 tube contrary to there is no fouling
formation inside #3, so the work ratio can be arranged by this formula :
3#
1#
comp
comp
WW
ratio =
In addition to this, we can get the specific heat ratio by putting into definite number. So to
speak, the specific heat ratio when vaporization temperature of R-134a is 5� would be :
24
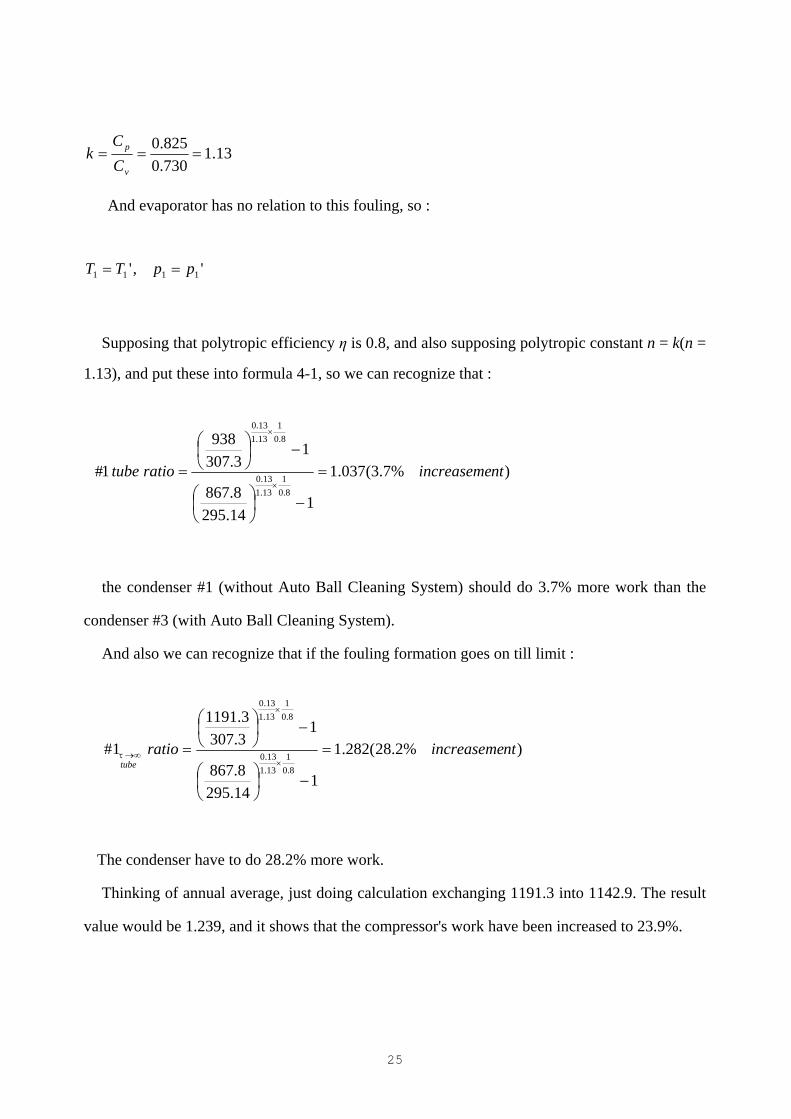
13.1730.0825.0
===v
p
CC
k
And evaporator has no relation to this fouling, so :
' ,' 1111 ppTT ==
Supposing that polytropic efficiency η is 0.8, and also supposing polytropic constant n = k(n =
1.13), and put these into formula 4-1, so we can recognize that :
)%7.3(037.1
114.2958.867
13.307
938
1#8.0
113.113.0
8.01
13.113.0
ntincreasemeratiotube =
−
−
=×
×
the condenser #1 (without Auto Ball Cleaning System) should do 3.7% more work than the
condenser #3 (with Auto Ball Cleaning System).
And also we can recognize that if the fouling formation goes on till limit :
)%2.28(282.1
114.2958.867
13.3073.1191
1#8.0
113.113.0
8.01
13.113.0
ntincreasemeratiotube
=
−
−
=×
×
∞→τ
The condenser have to do 28.2% more work.
Thinking of annual average, just doing calculation exchanging 1191.3 into 1142.9. The result
value would be 1.239, and it shows that the compressor's work have been increased to 23.9%.
25
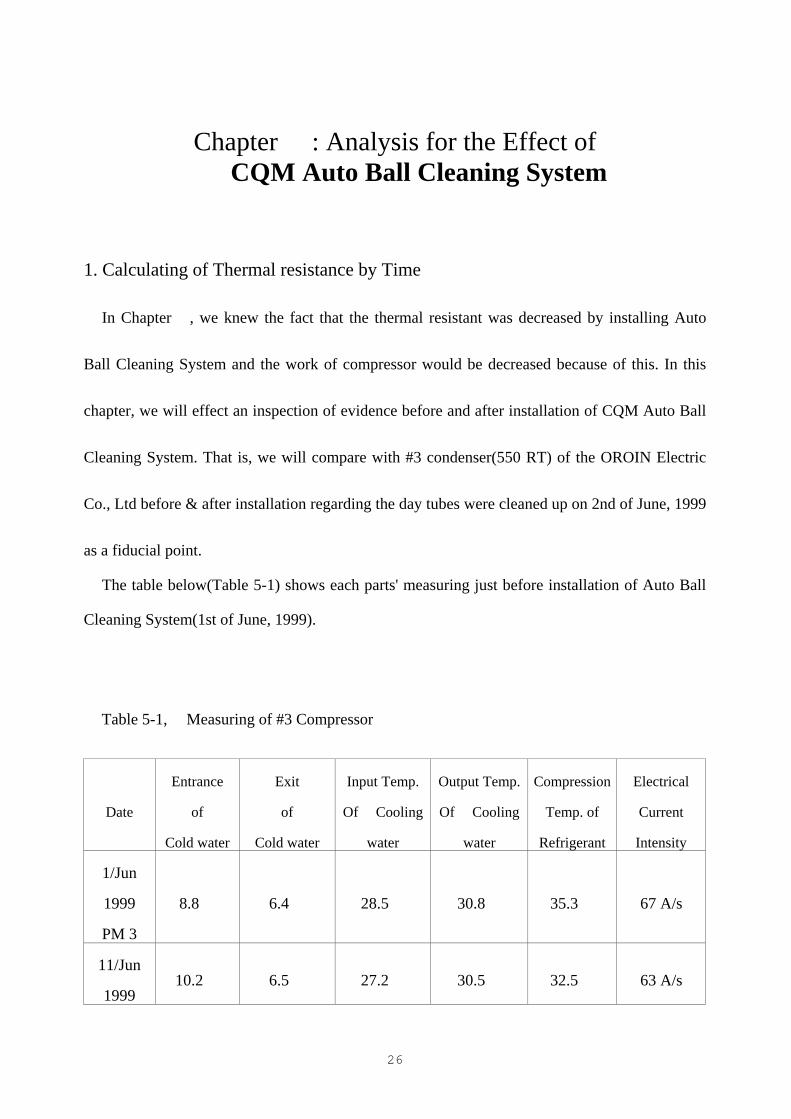
Chapter � : Analysis for the Effect of CQM Auto Ball Cleaning System
1. Calculating of Thermal resistance by Time
In Chapter �, we knew the fact that the thermal resistant was decreased by installing Auto
Ball Cleaning System and the work of compressor would be decreased because of this. In this
chapter, we will effect an inspection of evidence before and after installation of CQM Auto Ball
Cleaning System. That is, we will compare with #3 condenser(550 RT) of the OROIN Electric
Co., Ltd before & after installation regarding the day tubes were cleaned up on 2nd of June, 1999
as a fiducial point.
The table below(Table 5-1) shows each parts' measuring just before installation of Auto Ball
Cleaning System(1st of June, 1999).
Table 5-1, Measuring of #3 Compressor
Date
Entrance
of
Cold water
Exit
of
Cold water
Input Temp.
Of Cooling
water
Output Temp.
Of Cooling
water
Compression
Temp. of
Refrigerant
Electrical
Current
Intensity
1/Jun
1999
PM 3
8.8 � 6.4 � 28.5 � 30.8 � 35.3 � 67 A/s
11/Jun
1999 10.2 � 6.5 � 27.2 � 30.5 � 32.5 � 63 A/s
26
PM 3
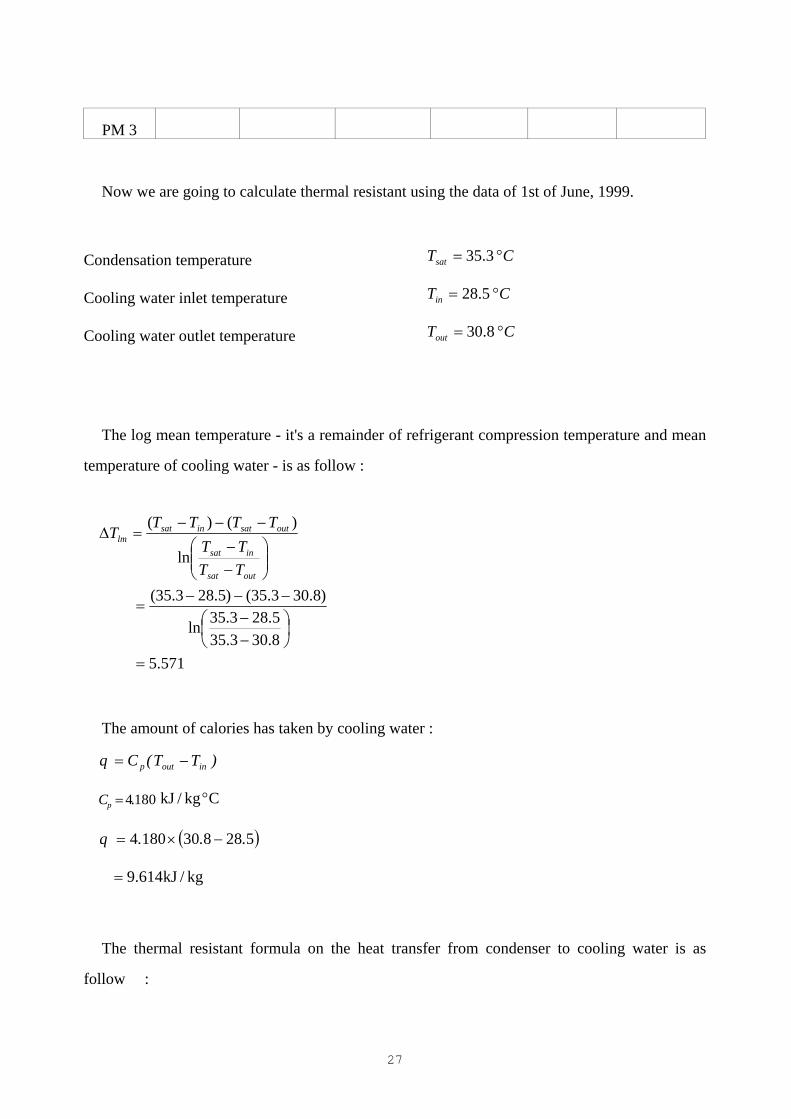
Now we are going to calculate thermal resistant using the data of 1st of June, 1999.
Condensation temperature CTsat °= 3.35
Cooling water inlet temperature CTin °= 5.28
Cooling water outlet temperature CTout °= 8.30
The log mean temperature - it's a remainder of refrigerant compression temperature and mean
temperature of cooling water - is as follow :
571.58.303.355.283.35ln
)8.303.35()5.283.35(
ln
)()(
=
−−
−−−=
−−
−−−=∆
outsat
insat
outsatinsatlm
TTTT
TTTTT
The amount of calories has taken by cooling water :
)TT(Cq inoutp −=
1804.Cp = Ckg/kJ °
( )5288301804 ...q −×=
kg/kJ614.9=
The thermal resistant formula on the heat transfer from condenser to cooling water is as
follow :
27

qT
UAm lm∆
=1&
kg/kJ/C579.0614.9571.5
°==
Next, we can calculate thermal resistant 1/U as follows :
==∆
=mA
qT
Ulm
&1
s/kg259.0m1992.0
kg/kJ614.9C571.5 2
×°
kW/Cm451.0 2 °=
Simply speaking, it needs 0.451� temperature difference of cooling water to deprive 1 kW
heat capacity of refrigerator.
But the other side, thermal resistant of on the same refrigerator will be changed after
installation of CQM Auto Ball Cleaning System. In case that 11th of June 1999 - after
installation :
Like same way :
condesation temperature CTsat °= 5.32
Cooling water inlet temperature CTin °= 2.27
Cooling water outlet temperature CTout °= 5.30
Log mean temperature can be calculated as follow :
)TT(Cq.
..
..ln
)..()..(TTTT
ln
)TT()TT(T
inoutp
outsat
insat
outsatinsatlm
−==
−−
−−−=
−−
−−−=∆
3863530532227532
530532227532
28
=pC Ckg/kJ18.4 °
)2.275.30(18.4 −×=q
kg/kJ794.13=
And we can calculate thermal resistant as follows :
=×∆
=mA
qT
Ulm
&1
s/kg256.0m1992.0
kg/kJ794.13C386.3 2
×°
kW/Cm191.0 2 °=
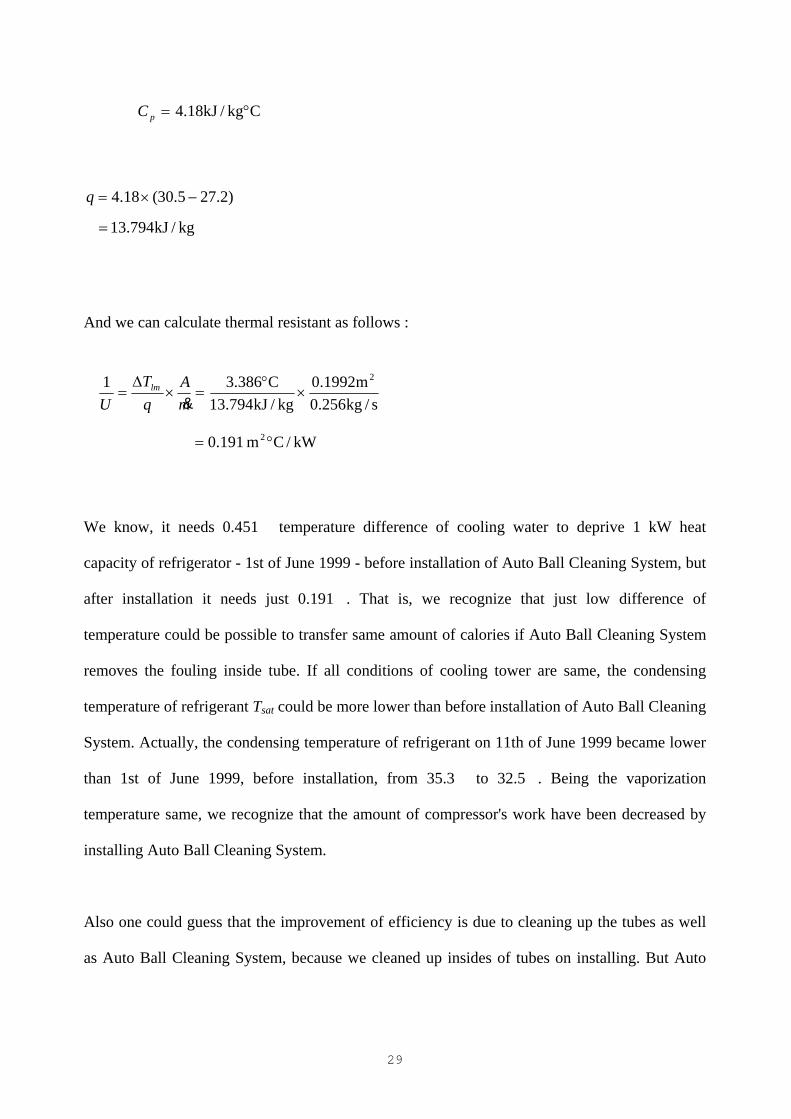
We know, it needs 0.451� temperature difference of cooling water to deprive 1 kW heat
capacity of refrigerator - 1st of June 1999 - before installation of Auto Ball Cleaning System, but
after installation it needs just 0.191�. That is, we recognize that just low difference of
temperature could be possible to transfer same amount of calories if Auto Ball Cleaning System
removes the fouling inside tube. If all conditions of cooling tower are same, the condensing
temperature of refrigerant Tsat could be more lower than before installation of Auto Ball Cleaning
System. Actually, the condensing temperature of refrigerant on 11th of June 1999 became lower
than 1st of June 1999, before installation, from 35.3� to 32.5�. Being the vaporization
temperature same, we recognize that the amount of compressor's work have been decreased by
installing Auto Ball Cleaning System.
Also one could guess that the improvement of efficiency is due to cleaning up the tubes as well
as Auto Ball Cleaning System, because we cleaned up insides of tubes on installing. But Auto
29
Ball Cleaning System keep up the state improved, and we can verify it from the measured
data after June at the Section 4 in this chapter.
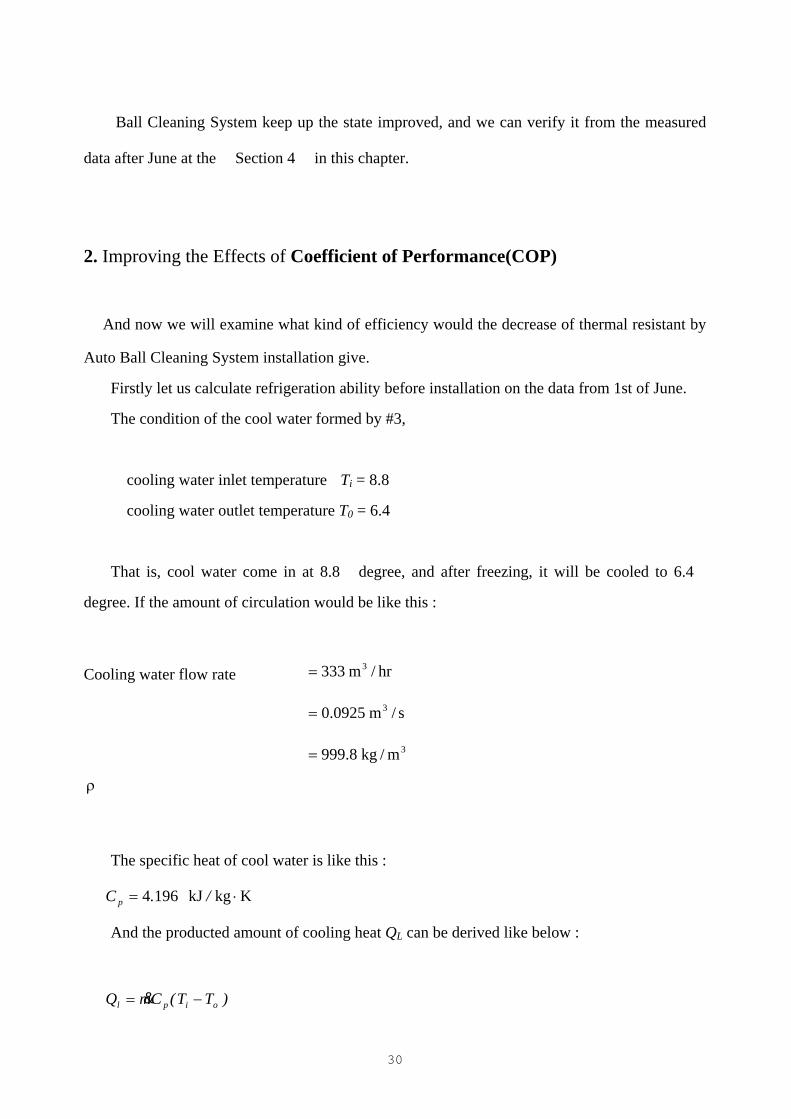
2. Improving the Effects of Coefficient of Performance(COP)
And now we will examine what kind of efficiency would the decrease of thermal resistant by
Auto Ball Cleaning System installation give.
Firstly let us calculate refrigeration ability before installation on the data from 1st of June.
The condition of the cool water formed by #3,
cooling water inlet temperature Ti = 8.8 �
cooling water outlet temperature T0 = 6.4 �
That is, cool water come in at 8.8� degree, and after freezing, it will be cooled to 6.4�
degree. If the amount of circulation would be like this :
Cooling water flow rate hr/m333 3=
s/m0925.0 3=
ρ
3m/kg8.999=
The specific heat of cool water is like this :
1964.C p = KkgkJ ⋅/
And the producted amount of cooling heat QL can be derived like below :
)TT(CmQ oipl −= &
30
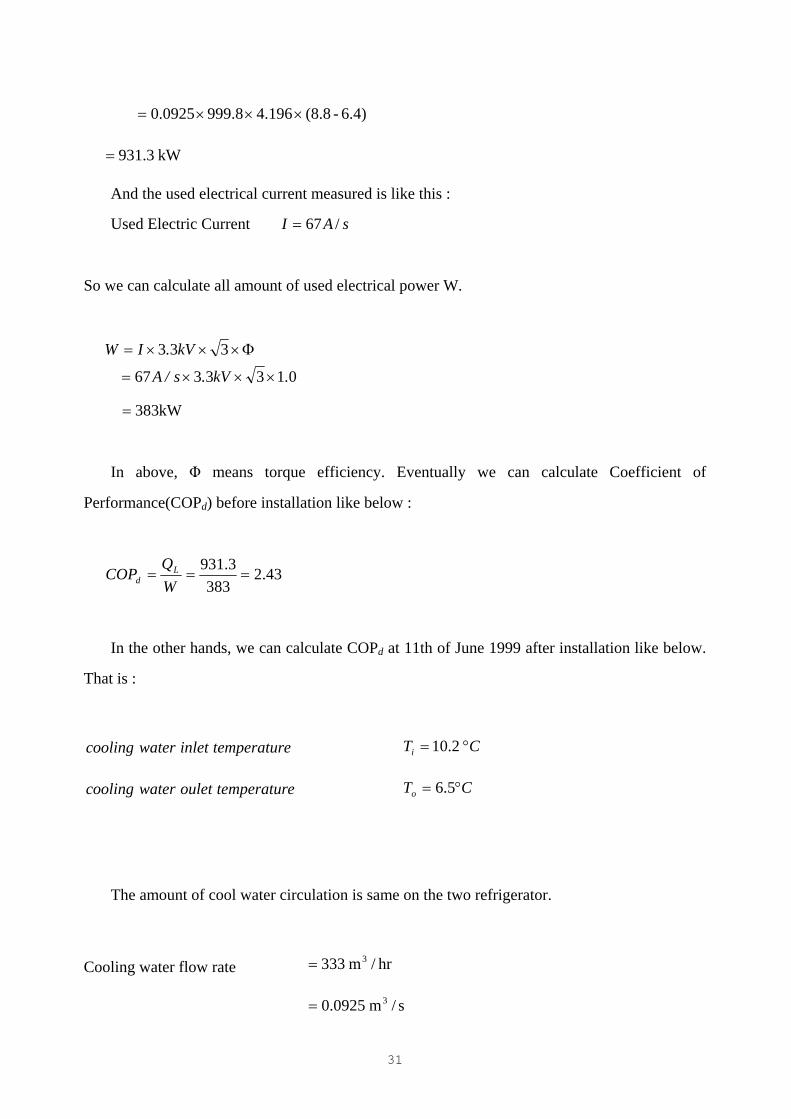
6.4)-(8.84.196999.89250.0 ×××=
kW3.931=
And the used electrical current measured is like this :
Used Electric Current sAI /67=
So we can calculate all amount of used electrical power W.
0133367
333
.kV.s/A
kV.IW
×××=
Φ×××=
kW383=
In above, Φ means torque efficiency. Eventually we can calculate Coefficient of
Performance(COPd) before installation like below :
43.2383
3.931===
WQ
COP Ld
In the other hands, we can calculate COPd at 11th of June 1999 after installation like below.
That is :
etemperaturinletwatercooling CTi °= 2.10
etemperaturouletwatercooling CTo °= 5.6
The amount of cool water circulation is same on the two refrigerator.
Cooling water flow rate hr/m333 3=
s/m0925.0 3=
31
ρ
3m/kg8.999=
=pC KkgkJ1964 ⋅/.
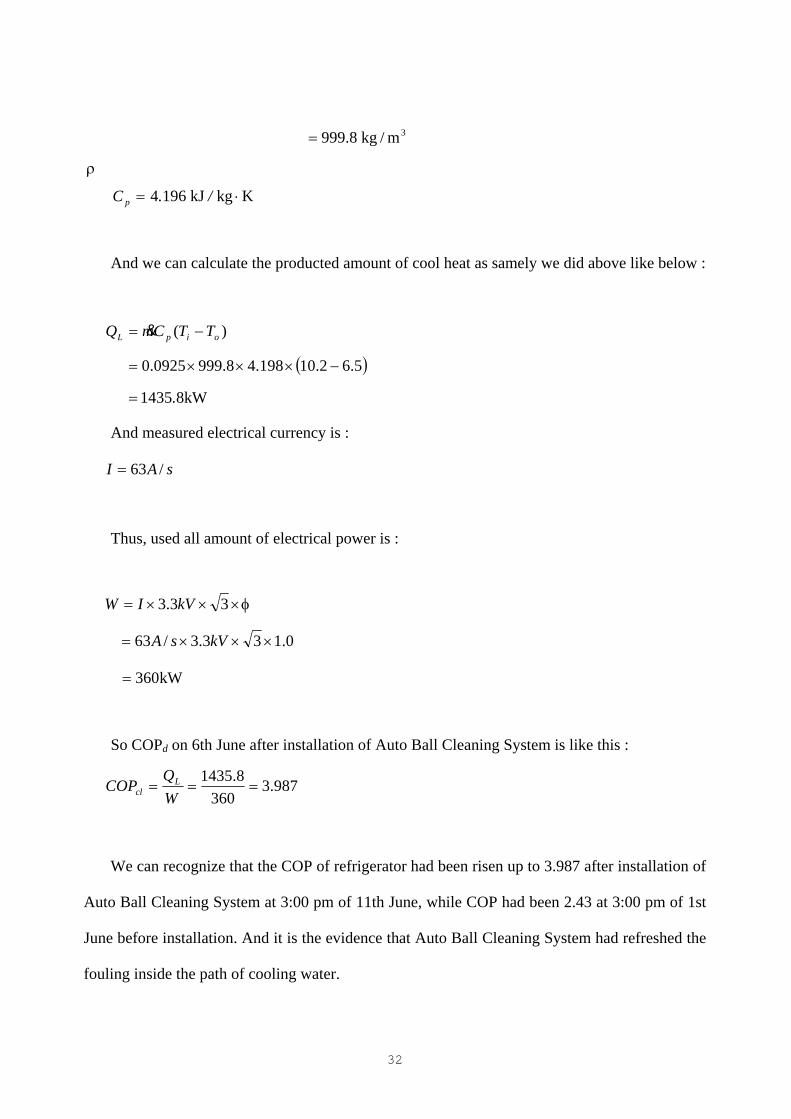
And we can calculate the producted amount of cool heat as samely we did above like below :
)( oipL TTCmQ −= &
( )5.62.10198.48.9990925.0 −×××=
kW81435.=
And measured electrical currency is :
sAI /63=
Thus, used all amount of electrical power is :
φ×××= 33.3 kVIW
0.133.3/63 ×××= kVsA
kW360=
So COPd on 6th June after installation of Auto Ball Cleaning System is like this :
987.3360
8.1435===
WQ
COP Lcl
We can recognize that the COP of refrigerator had been risen up to 3.987 after installation of
Auto Ball Cleaning System at 3:00 pm of 11th June, while COP had been 2.43 at 3:00 pm of 1st
June before installation. And it is the evidence that Auto Ball Cleaning System had refreshed the
fouling inside the path of cooling water.
32
3. Mathematical Formulation of Power Reducing Rate by COP
As we certificated by the results of experiment, the condensing temperature of refrigerant
Tsat could be set more lower than the case fouling formed, if Auto Ball Cleaning System would
have removed fouling inside tubes. And it shows that the efficiency of the whole refrigerator had
been raised for whole work the compressor should do to make same condition of cool water
could be even less than before installation.
And the increase of the refrigerating efficiency can also save input power in case that
formation of cool heat condition is same. Next, we are going to derive a formula just by
measured COP.
It needs 383 kW work to product cool heat at #3 refrigerator on 1st of June
1999 before installation of Auto Ball Cleaning System - and the refrigerator has fouling
formation inside tube. On the other hand, it needs 360 kW work to product cool heat
at #3 refrigerator on 11th of June 1999 after installation, being removed
fouling by Auto Ball Cleaning System. If this system is installed on 1st of June and produces
same amount of cool heat without fouling, it needs below amount of electrical
power :
kWQ 3.931=L
L
L
kWQ 8.1435=
kWQ 8.1435=
( )( ) 383
3.9318.1435×== d
dL
clL WQQ
kW5590.=
33
It needs different amount of work to produce same amount of cool heat 1435.8 kW, that
is, it needs 360 kW work after installation without fouling on 11th of June, while 590.5 kW work
should be needed before installation of Auto Ball Cleaning System.
Differently speaking, refrigerator on 11th of June - after installation of Auto Ball Cleaning
System - saved (590.5 kW - 360 kW =) 230.5 kW of work than before installation, for being
refreshed by this cleaning system. Expressed on formula :
395.05.5903605.590
=−
So, we can save 39.5 %'s power by installing Auto Ball Cleaning System. And we can
arrange this fact generalized formula :
kW5590.( )( ) d
L
clL WdQ
Q=
For we can put 360 kW = Wcl, the derived formula saved 39.5 %'s work can be expressed
like this :
( )( )
( )( ) d
dL
clL
clddL
clL
WQQ
WWQQ
−
Dividing (QL)cl a denominator numerator of this formula, next putting COP in this formula :
( ) ( )
( ) d
cld
dL
d
clL
cl
dL
d
COP
COPCOP
QW
QW
QW
−
=−
1
11
(5-1)
34
And putting each COP value into above formula :
395.0
432.21
987.31
432.21
=−
We can calculate saved rate of electrical power after installation of Auto Ball Cleaning
System if we just put the COP value before(COPd) and after(COPcl) installation of Auto Ball
Cleaning System into formula 5-1.
4. Calculation of Electrical Power Saving Rate
Table 5-2 shows that measured basic data on the #3 refrigerator at ORION Electric Co., Ltd.
Actually, chemical or physical cleaning tend to making COP rising up for a while, but it gathered
fouling inside again and make it down as before. Therefore, we should be careful to compare two
conditions - before and after installation of Auto Ball Cleaning System - also be careful make
one(before installation) a data point some time passed after chemical of physical cleaning with
some fouling formed.
Looking at Table 5-2, and we can recognize that COP on 28th, 31st of May and 1st of June
had been slowly down to 2.978, 2.628 and 2.432. Therefore considering measurement error, it is
proper to put the average COP before installation 2.678, average of them. And we think this
value as a data point COPd - the right condition after some time had passed and there wasn't
almost any effect of chemical or physical cleaning, so lots of fouling had formed already. Next,
as against this data point COPd, put the value COP after installation of Auto Ball Cleaning
System into formula (5-1), and we calculate electrical power saving rate. For example, for COP
on the 11th of June is 3.987, we can calculate risen degree of all electrical power saving rate by
installing this system as follows :
35
81.32100
678.21
987.31
678.21
1001
11
=×−
×
−
f
clf
COP
COPCOP
Fig. 5-1 shows the thermal resistant graph based on the Table 5-2. Before 1st of June 1999,
the thermal resistant value was high - maximum 0.774 on 6th of February 1999, for instance.
What is noticeable is that the thermal resistant is changeable very rapidly according to cleaning,
just comparing just before and after cleaning. For example, on 6th of March 1999, - just before
cleaning - the thermal resistant was a high value 0.663, but it went rapidly down just after
cleaning to 0.269 just after cleaning on 8th of March 1999.
But thermal resistant has been constant between 0.2 0.3 after installing Auto Ball Cleaning
System 2nd of June 1999. Fig. 5-2 shows the monthly average of thermal resistant value. Before
2nd of June 1999 - installation day - thermal resistant according to cleaning or not, was rapidly
variable from 0.34 to 0.64 and its value was very large. But after installation in June, we can
recognize that the monthly average thermal resistant value is constant around 0.22. Fig. 5-3
shows standard deviation of thermal resistant. Before installation of Auto Ball Cleaning System
on 2nd of June 1999, the range of fluctuation - the standard deviation - went up to a high value,
but after cleaning in March, we can catch that the thermal resistant range of fluctuation went
down rapidly. However, after installation of Auto Ball Cleaning System in June, the range of
fluctuation - the standard deviation - became constantly around 0.03.
Fig. 5-4 shows the amount of cold heat producted per unit electrical power - ability
coefficient COP - as time goes by. As we predicted above paragraph, the COP went up very
rapidly to 4.074 just after cleaning on 9th of March than 2.809 on 6th of March just before
36
cleaning. But after installation of Auto Ball Cleaning System on 2nd of June, COP went up
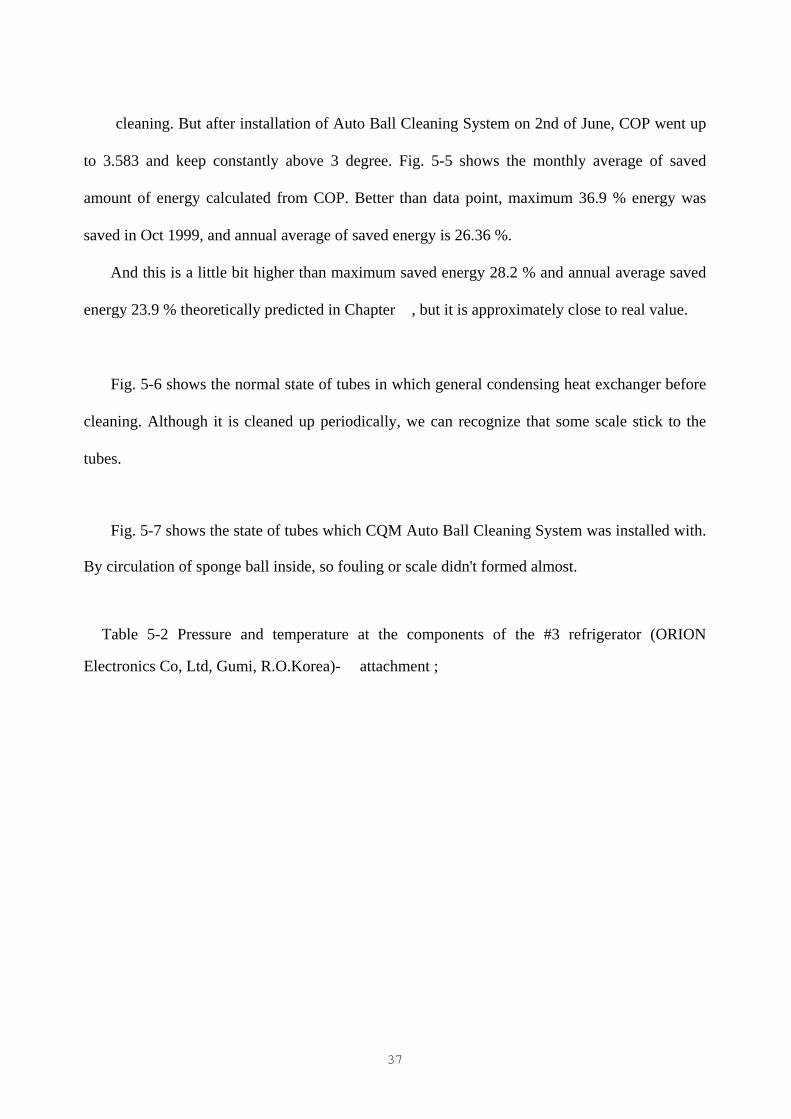
to 3.583 and keep constantly above 3 degree. Fig. 5-5 shows the monthly average of saved
amount of energy calculated from COP. Better than data point, maximum 36.9 % energy was
saved in Oct 1999, and annual average of saved energy is 26.36 %.
And this is a little bit higher than maximum saved energy 28.2 % and annual average saved
energy 23.9 % theoretically predicted in Chapter �, but it is approximately close to real value.
Fig. 5-6 shows the normal state of tubes in which general condensing heat exchanger before
cleaning. Although it is cleaned up periodically, we can recognize that some scale stick to the
tubes.
Fig. 5-7 shows the state of tubes which CQM Auto Ball Cleaning System was installed with.
By circulation of sponge ball inside, so fouling or scale didn't formed almost.
Table 5-2 Pressure and temperature at the components of the #3 refrigerator (ORION
Electronics Co, Ltd, Gumi, R.O.Korea)- attachment ;
37
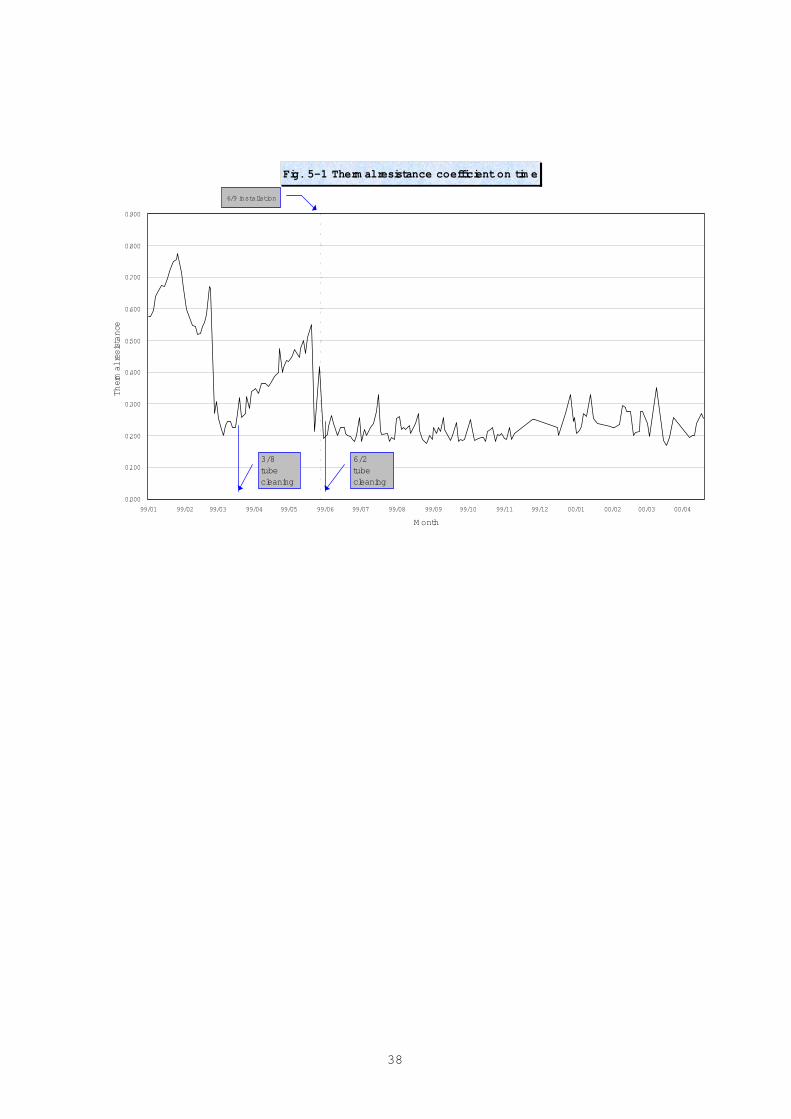
Fig. 5-1 Therm al resistance coefficient on tim e
0.000
0.100
0.200
0.300
0.400
0.500
0.600
0.700
0.800
0.900
99/01 99/02 99/03 99/04 99/05 99/06 99/07 99/08 99/09 99/10 99/11 99/12 00/01 00/02 00/03 00/04
M onth
Thermal resistance
6/9 installation
3/8tubecleaning
6/2tubecleaning
38
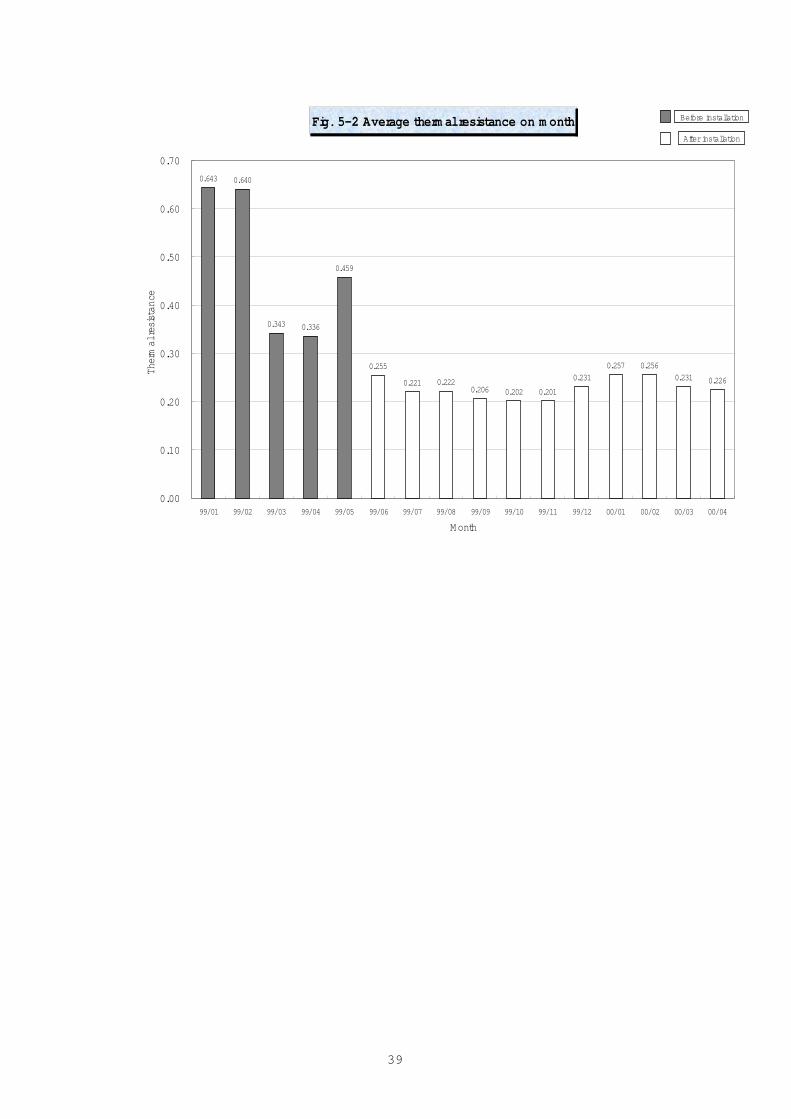
Fig. 5-2 Average therm al resistance on m onth
0.643 0.640
0.343 0.336
0.459
0.255
0.221 0.2220.206 0.202 0.201
0.231
0.257 0.256
0.231 0.226
0.00
0.10
0.20
0.30
0.40
0.50
0.60
0.70
99/01 99/02 99/03 99/04 99/05 99/06 99/07 99/08 99/09 99/10 99/11 99/12 00/01 00/02 00/03 00/04
M onth
Thermal resistance
Before installation
After installation
39

Fig. 5-3 Average of Standard deviation for therm al resistance on m onth
0.0516
0.1027
0.1686
0.0393 0.0410
0.0864
0.0395
0.02700.0219 0.0230
0.0153
0.0231
0.0374
0.0304
0.0556
0.0316
0.00
0.02
0.04
0.06
0.08
0.10
0.12
0.14
0.16
0.18
99/01 99/02 99/03 99/04 99/05 99/06 99/07 99/08 99/09 99/10 99/11 99/12 00/01 00/02 00/03 00/04
M onth
Standard deviation
Before installation
After installation
Fig 5-4 COP on tim e
1.00
2.00
3.00
4.00
5.00
6.00
7.00
99/01 99/02 99/03 99/04 99/05 99/06 99/07 99/08 99/09 99/10 99/11 99/12 00/01 00/02 00/03 00/04
M onth
COP
installation
40

Fig. 5-5 Average of energy saving am ount on m onth
30.3%
22.6%
25.6%
27.3%
36.9%
33.2%
21.0%
14.9%
19.7%
29.1%
24.2%
0%
5%
10%
15%
20%
25%
30%
35%
40%
99/06 99/07 99/08 99/09 99/10 99/11 99/12 00/01 00/02 00/03 00/04
M onth
Improvement extent
Total average26.36%
Fig. 5-6 Tube before cleaning
41
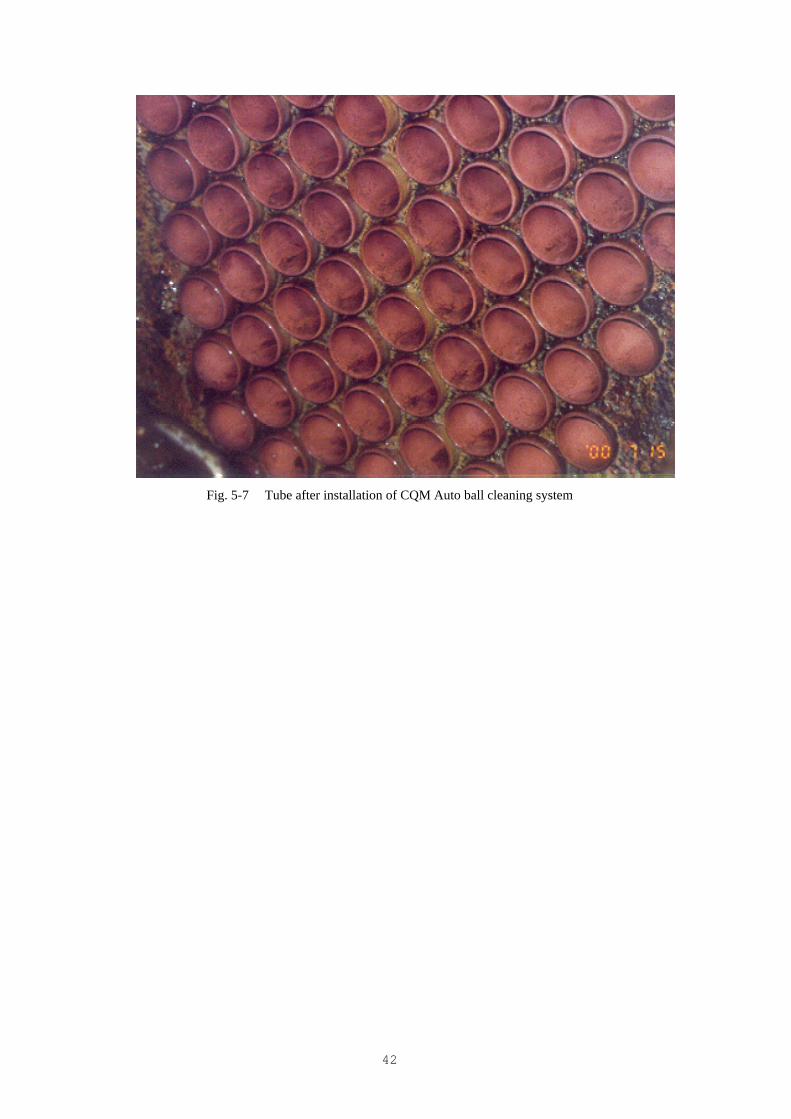
Fig. 5-7 Tube after installation of CQM Auto ball cleaning system
42
Chapter � : Analysis of
Economical Efficiency
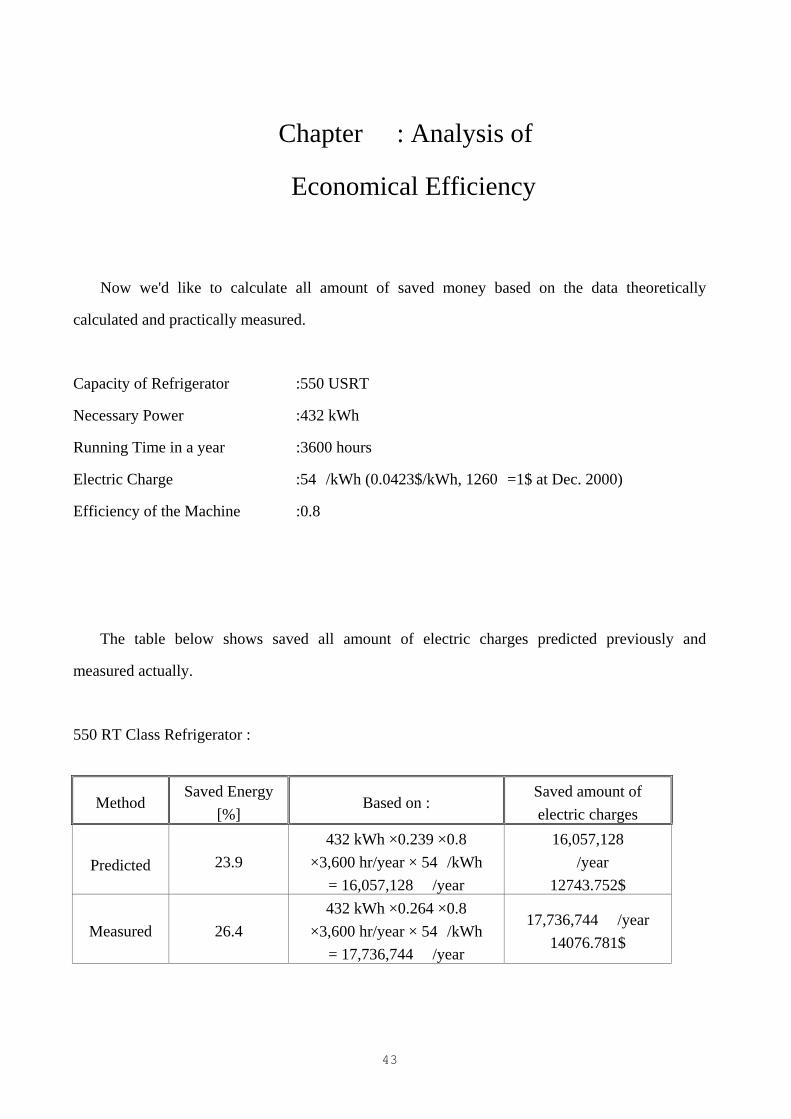
Now we'd like to calculate all amount of saved money based on the data theoretically
calculated and practically measured.
Capacity of Refrigerator :550 USRT
Necessary Power :432 kWh
Running Time in a year :3600 hours
Electric Charge :54 /kWh (0.0423$/kWh, 1260 =1$ at Dec. 2000)
Efficiency of the Machine :0.8
The table below shows saved all amount of electric charges predicted previously and
measured actually.
550 RT Class Refrigerator :
Method Saved Energy
[%] Based on :
Saved amount of electric charges
Predicted 23.9 432 kWh ×0.239 ×0.8
×3,600 hr/year × 54 /kWh = 16,057,128 /year
16,057,128 /year
12743.752$
Measured 26.4 432 kWh ×0.264 ×0.8
×3,600 hr/year × 54 /kWh = 17,736,744 /year
17,736,744 /year 14076.781$
43
Chapter � : A Case Study on
Korean Company "S"
The same kind of Auto Ball Cleaning System as ORION Electric Co., Ltd has were installed
on the Korean "S" Company on 19th of June 2000. It was installed on the TRAIN 1200 RT class
refrigerator and functioning refrigerant was R-123. To certify the Auto Ball Cleaning System's
fouling removing effect, we measured each 1 month's data before installation(at 15:00) on 19th of
June in 1999 and after installation(at 15:00) on 19th of June in 2000. Comparing with two months'
data before and after installation, we analyzed the Auto Ball Cleaning System effect. Concrete
informations are arranged on the Table 7-1.
1. Calculation of COP
Auto Ball Cleaning System may repress fouling or scale formation inside the cooling water
path, located outside of the condenser. Therefore, we can expect that COP - Coefficient of
Performance, producted cool heat per unit electrical power - will rise up because thermal resistant
of the condenser will be restricted to the minimum in the cooling tubes. So we will verify this
effects by comparing before and after installation based on measured data at 15:00 in 1999 and
2000.
To show an example of freezing ability calculation, firstly let us calculate this on 19th of July,
1999, at 15:00 from arranged data on Table 7-1.
1. Increase formula of electric power : (On Table 7-1)
2. ( ) 979.03kV3.3s/AcurrenteledtricW ×××=
44
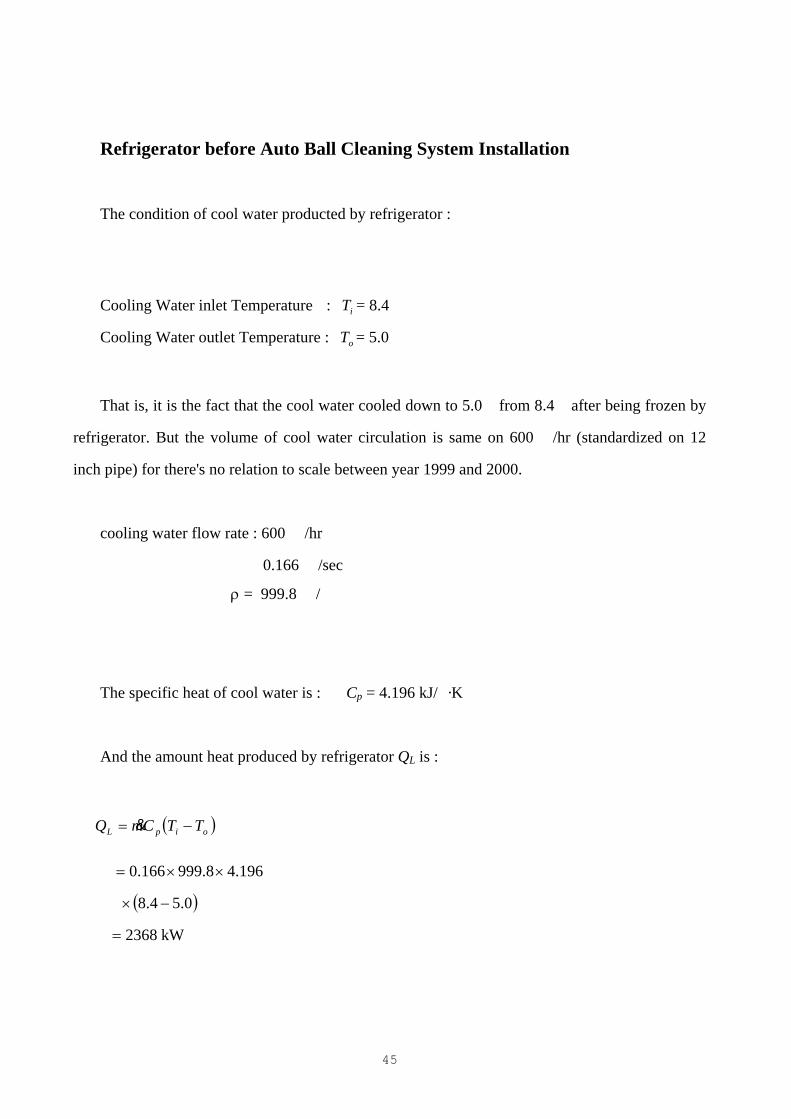
Refrigerator before Auto Ball Cleaning System Installation
The condition of cool water producted by refrigerator :
Cooling Water inlet Temperature : i = 8.4� T
Cooling Water outlet Temperature : = 5.0� oT
That is, it is the fact that the cool water cooled down to 5.0� from 8.4� after being frozen by
refrigerator. But the volume of cool water circulation is same on 600 /hr (standardized on 12
inch pipe) for there's no relation to scale between year 1999 and 2000.
cooling water flow rate : 600 /hr
0.166 /sec
= 999.8 / ρ
The specific heat of cool water is : Cp = 4.196 kJ/ ·K
And the amount heat produced by refrigerator QL is :
( )oipL TTCmQ −= &
196.48.999166.0 ××=
( )0.54.8 −×
kW2368=
45
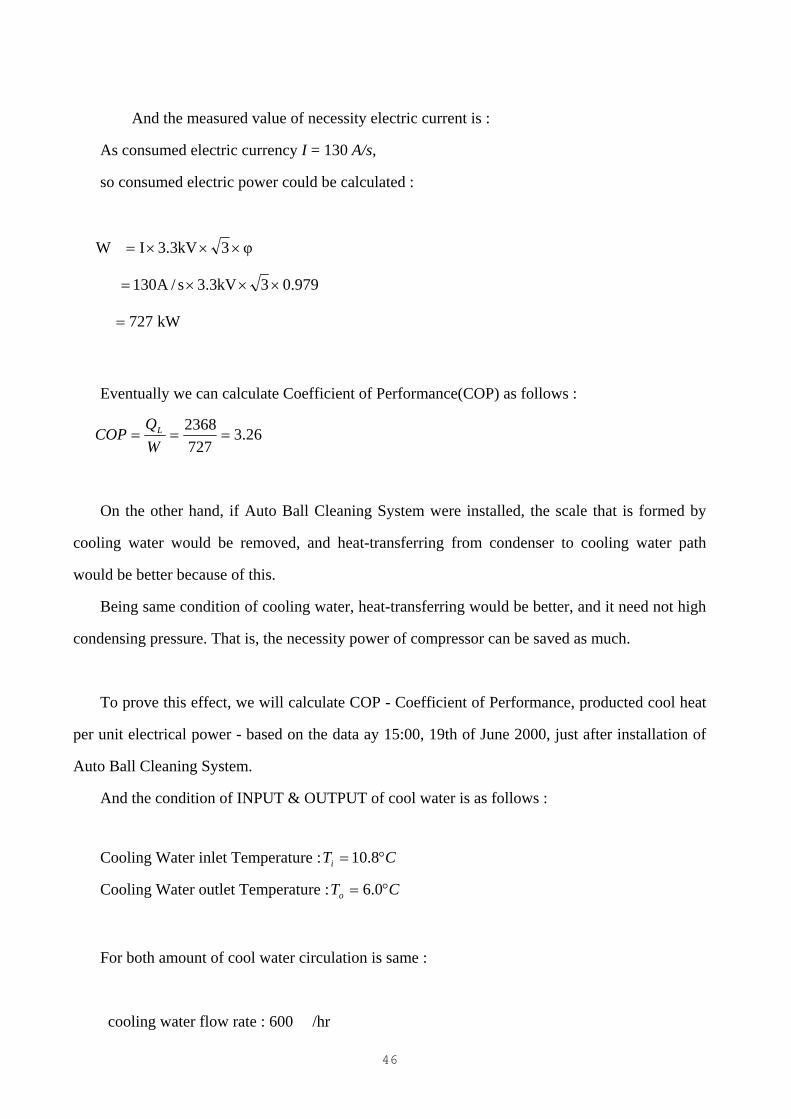
And the measured value of necessity electric current is :
As consumed electric currency I = 130 A/s,
so consumed electric power could be calculated :
φ3kV3.3IW ×××=
979.03kV3.3s/A130 ×××=
kW727=
Eventually we can calculate Coefficient of Performance(COP) as follows :
26.37272368
===WQ
COP L
On the other hand, if Auto Ball Cleaning System were installed, the scale that is formed by
cooling water would be removed, and heat-transferring from condenser to cooling water path
would be better because of this.
Being same condition of cooling water, heat-transferring would be better, and it need not high
condensing pressure. That is, the necessity power of compressor can be saved as much.
To prove this effect, we will calculate COP - Coefficient of Performance, producted cool heat
per unit electrical power - based on the data ay 15:00, 19th of June 2000, just after installation of
Auto Ball Cleaning System.
And the condition of INPUT & OUTPUT of cool water is as follows :
Cooling Water inlet Temperature : CTi °= 8.10
Cooling Water outlet Temperature : CTo °= 0.6
For both amount of cool water circulation is same :
cooling water flow rate : 60 /hr0
46

0.166 /sec
= 999.8 / ρ
=pC CkgkJ1964 °/.
And the amount heat produced by refrigerator QL is as above :
( )oipL TTCmQ −= &
( )0.68.10196.48.999166.0 −×××=
kW3343=
And the measured value of necessity electric current is :
Consumed electric currency I = 158 A/s
So consumed electric power is :
×××= 333 kV.IW
97903kV33sA158 ../ ×××=
kW884=
The COP in the year 2000 when the Auto Ball Cleaning System was installed is as follows :
80.38843343
2 ===WQ
COP L
And we can recognize that the COP was risen after Auto Ball Cleaning System restricted the
formation of fouling or scale inside the cooling water tubes, the COP was up to 3.8 on the 19th
47

of June 2000(at 15:00), while COP was 3.26 just one year before - without Auto Ball
Cleaning System.
Generally the lower input temperature of cooling water from cooling tower into refrigerator is,
the higher the COP value will be. But, for the annual air temperature of June & July 2000 was
higher than 1999, the input temperature of cooling water in 2000 was also higher than 1999(19th
of June 1999, 15:00, input Temperature was 26.2� ; 19th of June 2000, 15:00, input Temperature
was 29.9�). So if the condition was same, the COP in year 2000 can be estimated lower than 1999.
But in year 2000, there were no scales and fouling inside of the tubes being removed by Auto Ball
Cleaning System, so COP went up more even though the input temperature in year 2000 was
higher than that of 1999.
2. Calculation of Electrical Power Saving
Next, let us do calculation of all amount of saved electrical power considering that same basic
cool heat was producted owing to rise of COP.
The average of COP, June & July in 1999, at 15:00 : 14.3=NCOP
The average of COP, June & July in 1999, at 15:00 : 15.4=COP
So, we can calculate saved electrical power rate as follows :
243.0
14.31
15.41
14.31
1
11
=−
=−
N
N
COP
COPCOP
Therefore, we can save 24.3 % of electrical power.
48
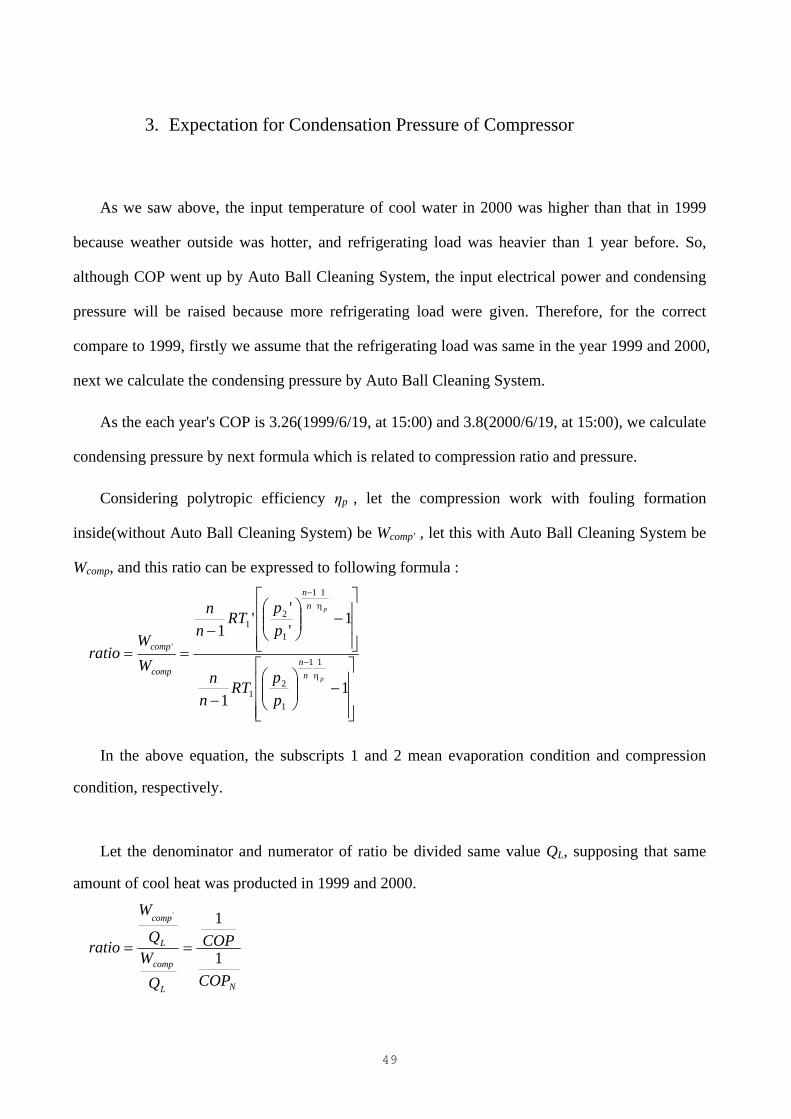
3. Expectation for Condensation Pressure of Compressor
As we saw above, the input temperature of cool water in 2000 was higher than that in 1999
because weather outside was hotter, and refrigerating load was heavier than 1 year before. So,
although COP went up by Auto Ball Cleaning System, the input electrical power and condensing
pressure will be raised because more refrigerating load were given. Therefore, for the correct
compare to 1999, firstly we assume that the refrigerating load was same in the year 1999 and 2000,
next we calculate the condensing pressure by Auto Ball Cleaning System.
As the each year's COP is 3.26(1999/6/19, at 15:00) and 3.8(2000/6/19, at 15:00), we calculate
condensing pressure by next formula which is related to compression ratio and pressure.
Considering polytropic efficiency ηp , let the compression work with fouling formation
inside(without Auto Ball Cleaning System) be Wcomp' , let this with Auto Ball Cleaning System be
Wcomp, and this ratio can be expressed to following formula :
−
−
−
−
==−
−
11
1''
'1
11
1
21
11
1
21
'
p
p
nn
nn
comp
comp
ppRT
nn
pp
RTn
n
WW
ratioη
η
In the above equation, the subscripts 1 and 2 mean evaporation condition and compression
condition, respectively.
Let the denominator and numerator of ratio be divided same value QL, supposing that same
amount of cool heat was producted in 1999 and 2000.
NL
comp
L
comp
COP
COP
QW
Q
W
ratio1
1'
==
49
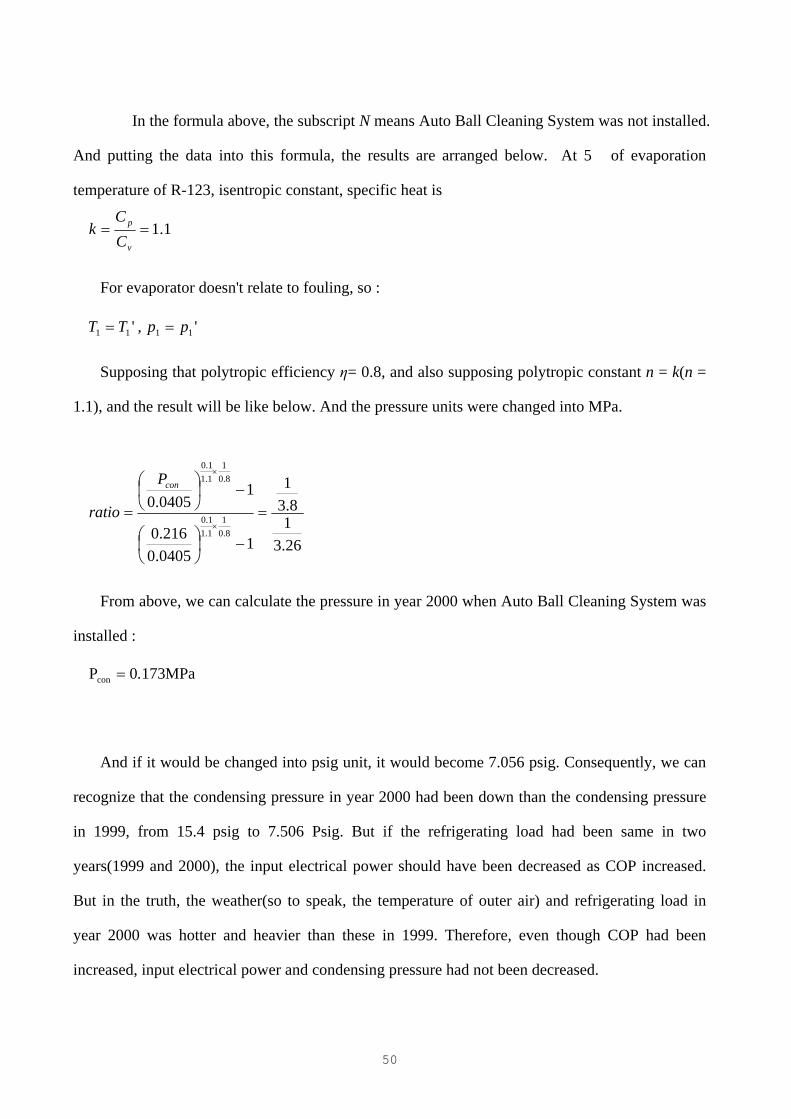
In the formula above, the subscript N means Auto Ball Cleaning System was not installed.
And putting the data into this formula, the results are arranged below. At 5� of evaporation
temperature of R-123, isentropic constant, specific heat is
1.1==v
p
CC
k
For evaporator doesn't relate to fouling, so :
' ,' ppTT == 1111
Supposing that polytropic efficiency η= 0.8, and also supposing polytropic constant n = k(n =
1.1), and the result will be like below. And the pressure units were changed into MPa.
26.318.3
1
10405.0216.0
10405.0
8.01
1.11.0
8.01
1.11.0
=
−
−
=×
×conP
ratio
From above, we can calculate the pressure in year 2000 when Auto Ball Cleaning System was
installed :
conP MPa1730.=
And if it would be changed into psig unit, it would become 7.056 psig. Consequently, we can
recognize that the condensing pressure in year 2000 had been down than the condensing pressure
in 1999, from 15.4 psig to 7.506 Psig. But if the refrigerating load had been same in two
years(1999 and 2000), the input electrical power should have been decreased as COP increased.
But in the truth, the weather(so to speak, the temperature of outer air) and refrigerating load in
year 2000 was hotter and heavier than these in 1999. Therefore, even though COP had been
increased, input electrical power and condensing pressure had not been decreased.
50
4. Calculation of Saving Amount of Money
Necessary Power of 1200 R/T refrigerator : 755 kWh (on 133 A/s)
Total Running Time : 4160 hours
Efficiency of the Machine : 0.8
Electric Charges : 50 /kWh (The charge presented by Korean "S" Company)
From the data above, supposing that 24.3 % of electrical power can be saved for one year in
average, the saved amount of money is :
Necessary Power ×Saved rate ×Running Time in a year × Charge per kWh
= Saved amount of money
� 755 kWh×0.243×0.8×4160 hour/year×50 /kWh = 30,528,576 /year
So 30,528,576($ 24,229.03, $ 1= 1,260) can be saved in one year.
Now let us summarize above :
Auto Ball Cleaning System make the efficiency of refrigerator more better by restricting
fouling/scale formation.
It was natural that the COP in 2000 should had been lower than COP in 1999 for the weather
in June & July of 2000 was hotter than this of 1999. But in case of Auto Ball Cleaning System, the
COP in year 2000 rather increased because this system refreshed scale/fouling inside the
condenser's tube as follows :
Average COP in June & July, 1999, at 15:00
14.3=NCOP
51
Average COP in June & July, 2000, at 15:00
15.4=COP
From this, it is clear that Auto Ball Cleaning System can save 24.3% electrical power, and all
amount saved money would be 30,528,576( $ 24,229.03, $ 1 = 1,260).
52
Chapter � : Conclusion
In general refrigerating equipments, cooling water used to be cooled in cooling tower, but lots
of microbes, viruses and dust in the air go into the devices and may cause the fouling which is a
kind of piled deposit inside of the tubes. Condenser might not be cooled enough because of fouling.
And this cause the refrigerant saturation temperature being raised.
The rising of refrigerant saturation temperature may cause the rising of refrigerant saturation
pressure, and compressor should do more work because of the raised saturation pressure. Thus it
needs more electrical power to do more work.
On the other hands, after installation of Auto Ball Cleaning System, it does not need more
rising pressure because this system removed fouling inside. That is, it means that the compressor
may work less than before. As we saw in Chapter �, this system can save 23.9 % energy
theoretically. But actually measured saved energy was 26.4 % for one year.
This value is somewhat higher than the value theoretically predicted, but approximately close
to each other. And this result means that objective prove had been assured by comparing
theoretically predicted to practically analyzed.
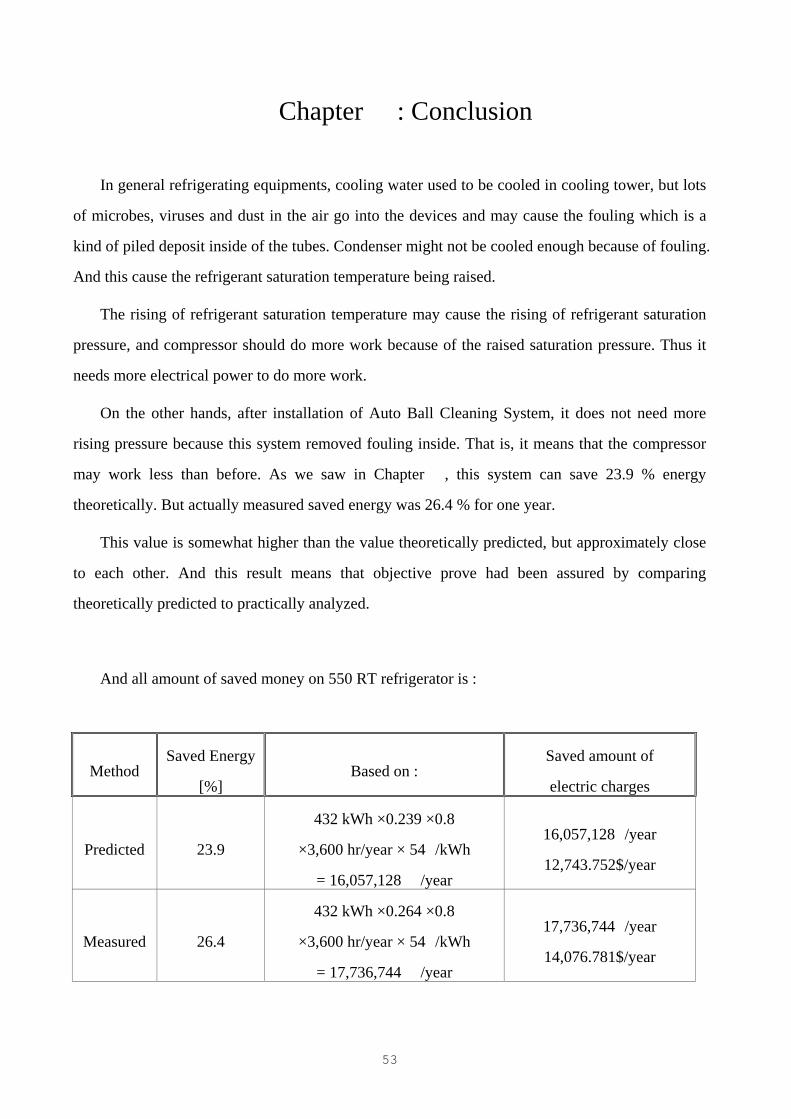
And all amount of saved money on 550 RT refrigerator is :
Method Saved Energy
[%] Based on :
Saved amount of
electric charges
Predicted 23.9
432 kWh ×0.239 ×0.8
×3,600 hr/year × 54 /kWh
= 16,057,128 /year
16,057,128 /year
12,743.752$/year
Measured 26.4
432 kWh ×0.264 ×0.8
×3,600 hr/year × 54 /kWh
= 17,736,744 /year
17,736,744 /year
14,076.781$/year
53

And we can save the chemical charge to restrict erosion and scale, and saved tube
cleaning cost that should pay periodically.
And the prediction of saving cost about another refrigerators or another companies could be
calculated by just putting measured values(total running hours, electric charges, etc.) into above
formula.
54
References
1. Klaren, D.G., "Fluid Bed Heat Exchangers, “Resources and Conservation”, Vol. 7, pp. 301-314,
1981.
2. Rautenbach, R., Erdmann, C. and Kolbach, J. St., “The Fluidized Bed Technique in the
Evaporation of Wastewaters with Severe fouling/Scaling Potential - Latest Developments,
Applications, Limitations”, Desalination, Vol. 81, pp. 285-298, 1991.
3. Darby, R., “Hydrodynamics of Slurries and Suspensions”, Encyclopedia of Fluid Mechanics, by
N. P. Cheremisinoff, Gulf Publishing Co., Vol. 5-1, pp. 49-91, 1986.
4. Barnea, E. and Mizrahi, J., Chem. Eng. J., Vol. 5, pp. 171, 1973.
5. Durand, R., Proceed. Minn. Hydraulic Conv., 1953.
6. Mc. Adams, Heat Transmission.
7. J. Feng, H.H. Hu and D.D. Joseph, 1994, Direction simulation of initial value problems for the
motion of solid bodies in a Newtonian fluid Part 1. Sedimentation. J. Fluid Mech. vol. 261,
pp.95-134.
8. Andrew J. Hogg, 1994, The initial migration of non-neutrally buoyant spherical particles in two-
dimensional flows. J. Fluid Mech. vol. 272, pp.285-318.
9. R.C. Jeffrey and J.R.A. Pearson,1965, Particle motion in laminar vertical tube flow. J. Fluid
Mech. vol. 22, pp.721-735.
10. T.R. Bott, “Design and operation of heat exchange equipment for fouling conditions”.
11. S.G. Yiantsios, N. Andritsos and A.J. Karabelas, 1995, “Modeling Heat Exchanger fouling:
Current status, Problems and Prospects”.
55
56

57

Appendix A : Fouling of Heat Exchanger
1. Introduction
"Fouling" is undesirable piled deposit formed inside heat exchanger, and also means a kind of
thermal resistant on the heat path in the heat exchanger. On the way the heat goes inside the heat
exchanger, the thermal resistant proportionates to the thickness of the deposit, and is in inverse
proportion to the thermal conduction of this deposit. At first we can ignore fouling resistant for
this thermal conductivity of the thin deposit is very low actually, but as time goes on, the deposit is
getting more thicker, it would become the most high thermal resistant of the heat path, so it could
make the whole system inefficient rapidly.
In many cases, mechanical designer used to make the area of heat exchanger more larger than
theoretically planned. But fouling formation is very changeable and rapid according to temperature
increase. The enlargement of area of heat exchanger cause temperature rise, so it may cause more
excessive fouling finally.
The study about fouling had been tried since long time ago, but it is very surprising that there
had not been big progress on this field. At the latest opinion, fouling is peculiar and unavoidable
one on given condition, and there is no particular way to design technique to remove or restrict
fouling.
2. Fouling as a Thermal resistance
Fig. A-1 shows the heat transferring course from warm to cold materials. Fig. A-1(a) is clean
heat exchanger, and Fig. A-1(b) means fouling have been formed on the surface of the heat
exchanger. Total transferred heat constant can be derived as follows :
58

211 RRR
U wcl
++= (A.1)
22111 RRRRR
U fwfd
++++= (A.2)
W ALL
T
T
T
T
1
2
S1
S2qA
T1
TS1
TS2
W ALL
T2
Tw 1
Tw 2
R1 Rw R1R1R1R1R1R1R2 RRRRRF1 RF2 R2w
DEPO SITA-CLEAN
B-FO ULD
qA
Fig. A-1 : The heat transferring course from warm to cold materials
SteamCondensation 22%
Tube W all 3%
Fouling 40%
H eat Transfer ofCooling W ater 35%
35 C
25 C
Fig. A-2 : Decrease of temperature inside the heat exchanger tubes
So, we can calculate fouling resistant as follows :
59
cldfff UU
RRR 1121 −=+= (A.
3)
The unit of fouling constant on this surface is [ �/W].
Fig. A-2 shows that decrease of temperature by thermal resistant rate in the multi-stage flash
heat exchanger tubes. As we see above, about 40% of thermal resistant is due to fouling. It means
that the thermal resistant constant on fouling condition Uf have been decreased to 30~65% degree
than the constant on the clean condition Ucl.
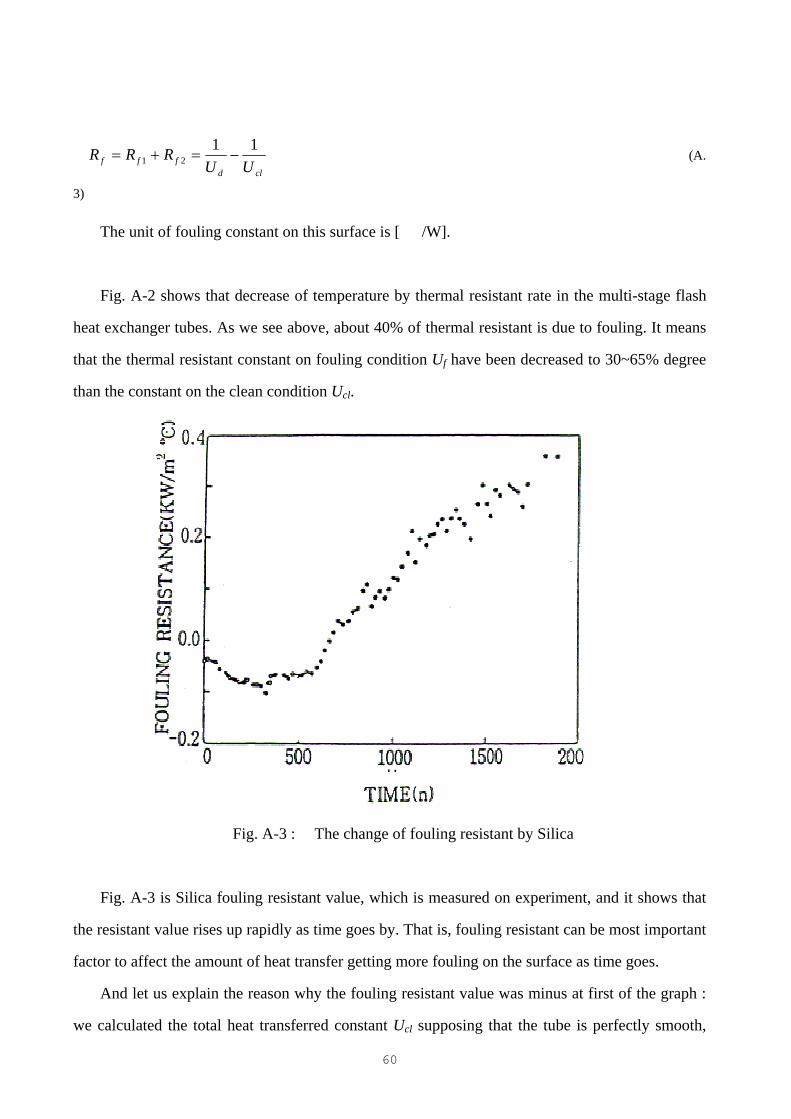
Fig. A-3 : The change of fouling resistant by Silica
Fig. A-3 is Silica fouling resistant value, which is measured on experiment, and it shows that
the resistant value rises up rapidly as time goes by. That is, fouling resistant can be most important
factor to affect the amount of heat transfer getting more fouling on the surface as time goes.
And let us explain the reason why the fouling resistant value was minus at first of the graph :
we calculated the total heat transferred constant Ucl supposing that the tube is perfectly smooth,
60
but it is not perfectly smooth actually, so it rather increase. Therefore, the surface area of Uf
which is measured value is an tolerance because it was risen up than smooth tube.
3. A Common Type of Fouling
Fouling formed in driving of the refrigerator, so fouling formation subordinate to driven time.
Fig. A-4 is fouling curve measured on experiment, and we can recognize that the fouling resistant
close to regular value after passing some period of time. And the model being curve-fitting to this
curve from the experiment is Kern-Seaton equation :
c
d
tm
dtdm
dtdm
−=
(A.4)
In this equation, md is the mass of deposit, and m/tc means the mass which sticked to or took
away for unit time. And dm can be expressed multiple of pf (Density of the fouling) and
x(Thickness of the fouling) like below :
ffff dRkdxdm ⋅⋅=⋅= ρρ
And let us do integral calculate to above formula :
ffff Rkxm ⋅⋅=⋅= ρρ
In this formula, each letter x, pf, kf, Rf means the thickness of deposit, the density of deposit,
thermal conductivity, and thermal resistant. Supposing that density and thermal conductivity is a
61

constant, next let us put these into above formula, and we can derive famous formula, Kern-
Seaton formula.
<Kern, D.Q. and Seaton, R.E. 1959, A Theoretical Analysis of Thermal Surface fouling,
Brit. Chem. Eng. 4(5): 258~262>
( ) [ ]cttff eRtR /* 1 −−=
(A.5)
R*f means a gradual approach of fouling resistant, and tc is time constant.
Fig. A-4 : The relation between model formula and experimental data
4. How to Control or Remove the Fouling
The most effective way to prevent fouling formation is to analyze the fact of fouling and so to
design heat-exchange machine. But it is very difficult to remove fouling thoroughly by design.
62
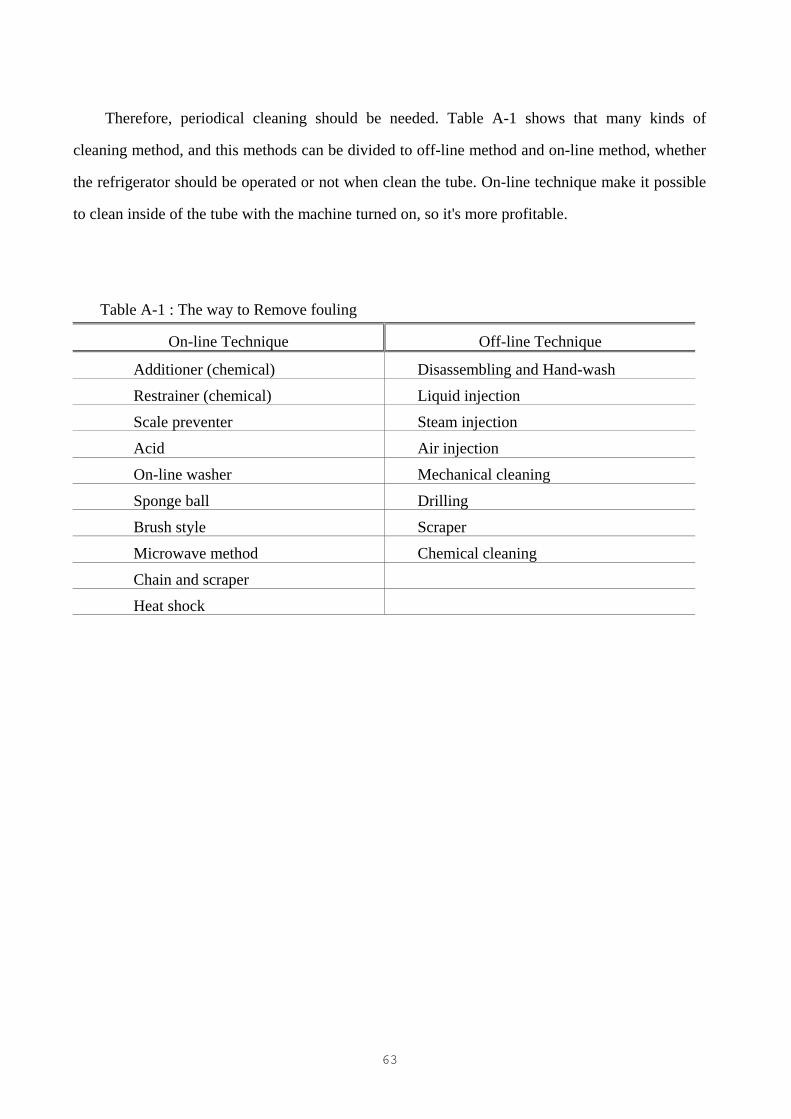
Therefore, periodical cleaning should be needed. Table A-1 shows that many kinds of
cleaning method, and this methods can be divided to off-line method and on-line method, whether
the refrigerator should be operated or not when clean the tube. On-line technique make it possible
to clean inside of the tube with the machine turned on, so it's more profitable.
Table A-1 : The way to Remove fouling
On-line Technique Off-line Technique
Additioner (chemical) Disassembling and Hand-wash
Restrainer (chemical) Liquid injection
Scale preventer Steam injection
Acid Air injection
On-line washer Mechanical cleaning
Sponge ball Drilling
Brush style Scraper
Microwave method Chemical cleaning
Chain and scraper
Heat shock
63

Appendix B : Fouling in Refrigerator
Caused by Cooling Water
1. Introduction
Fig. B-1 shows the general diagram of refrigerating equipments, and Fig. B-2 shows the cycle
graph of refrigerating. Refrigerating course is the cycle that goes round from the evaporation of
refrigerant to compressing, to condensation, and to expansion of the pressure through throttle
valve and to evaporate again. Compressed refrigerant goes through condensing course, when the
heat-transferring to outside is occurred. In case that this refrigerator is cooled down by water-
cooling system, the cooling water is cooled at cooling tower and takes heat away from condenser
on this transferring.
Condenser
Evaporator
Com pressor
14
3 2
Expansionvalve
Fig. B-1 : The general evaporating refrigerator equipments
Pressure, kPa
Enthalpy, kJ/kg
14
3 2Condensation
compression
Expansion
Evaporation
Fig. B-2 : The refrigerating cycle of evaporating refrigerator
64
The Shell & Tube condenser type is generally used one, and it is designed to flow cooling
water inside the tube to make it more easier to clean fouling.
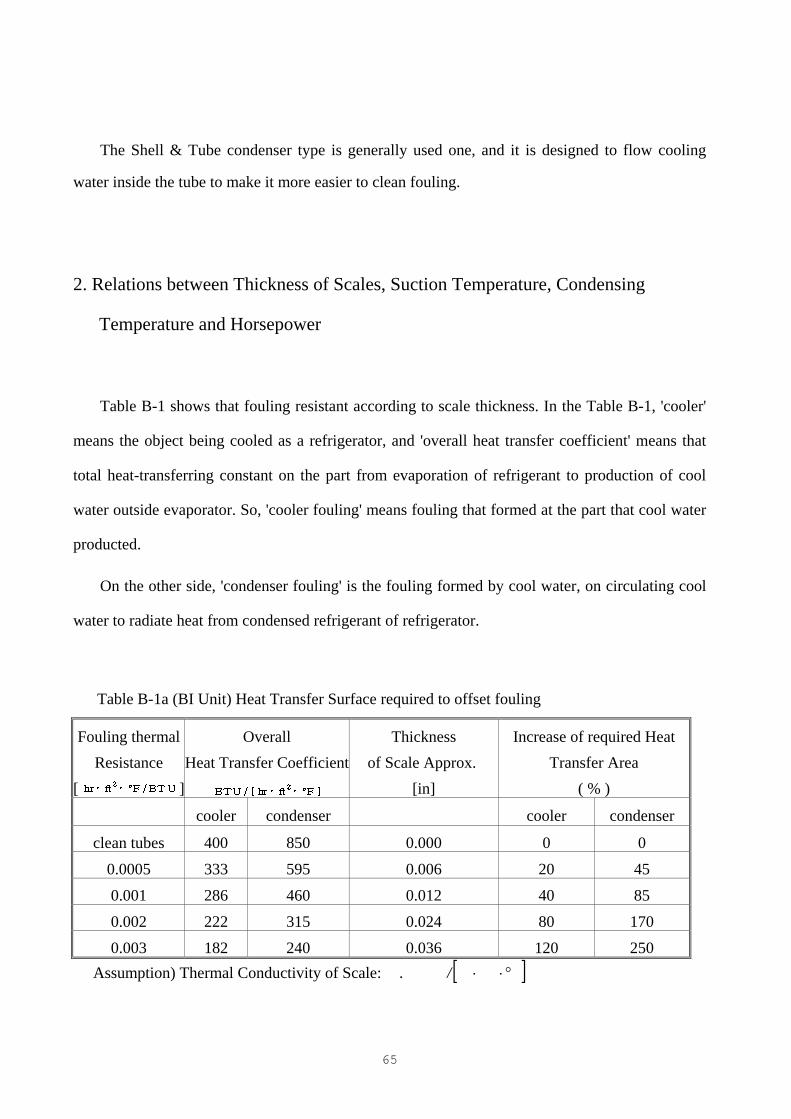
2. Relations between Thickness of Scales, Suction Temperature, Condensing
Temperature and Horsepower
Table B-1 shows that fouling resistant according to scale thickness. In the Table B-1, 'cooler'
means the object being cooled as a refrigerator, and 'overall heat transfer coefficient' means that
total heat-transferring constant on the part from evaporation of refrigerant to production of cool
water outside evaporator. So, 'cooler fouling' means fouling that formed at the part that cool water
producted.
On the other side, 'condenser fouling' is the fouling formed by cool water, on circulating cool
water to radiate heat from condensed refrigerant of refrigerator.
Table B-1a (BI Unit) Heat Transfer Surface required to offset fouling
Assumption) Thermal Conductivity of Scale: [ ]°⋅⋅/.
Fouling thermal Resistance
[ ]
Overall Heat Transfer Coefficient
Thickness of Scale Approx.
[in]
Increase of required Heat Transfer Area
( % )
cooler condenser cooler condenser
clean tubes 400 850 0.000 0 0
0.0005 333 595 0.006 20 45
0.001 286 460 0.012 40 85
0.002 222 315 0.024 80 170
0.003 182 240 0.036 120 250
65

Table B-1b (SI Unit) Heat Transfer Surface required to offset fouling
Fouling thermal Resistance
Overall Heat Transfer Coefficient
Thickness of Scale Approx.
[mm]
Increase of required Heat Transfer Area
( % )
cooler condenser cooler condenser
clean tubes 2271 4827 0.00 0 0
0.08805 ×10⁻³ 1891 3379 0.15 20 45
0.176 ×10⁻³ 1624 2612 0.31 40 85
0.352 ×10⁻³ 1260 1789 0.61 80 170
0.528 ×10⁻³ 1034 1363 0.91 120 250
Assumption) Thermal Conductivity of Scale: [ ]°/.
On seeing Table B-1b, we can recognize that the thermal resistant is linearly proportionate to
the scale thickness.
Fig. B-3 The effect of various thickness of scale (expressed as fouling factors) on the suction temperature of a typical flooded cooler
COOLER FOULING FACTOR [hr ft2F / BTU]
0.000 0.001 0.002 0.003 0.004
COOLER FOULING FACTOR [ m2C / W]
SU
CTI
ON
TE
MP
ER
ATU
RE
[ F
]
SU
CTI
ON
TE
MP
ER
ATU
RE
[ C
]
-1.11
-3.9
-6.7
1.6
4.44
0.352E-30.176E-3 0.704E-30.528E-3020
25
30
35
40
66
Fig. 3-3 shows the change of compressor entrance condition according to fouling factor
of cooler. For the compressor entrance comes under the evaporator in the cooling cycle, so suction
temperature - as an evaporation temperature of refrigerant - decreases proportionally according to
increase of fouling factor.
And it can be explained as follows :
Let the all amount of calorie which evaporator should take from inflow water Q, and this
formula can be made :
( )( )evapwconv
evapm
RRRTT
Q++
−= 1& (B.1)
But on the other side, the all amount of calorie which evaporator should take from inflow
water if fouling would have been formed :
( )( )evapwfconv
evapm
RRRRTT
Q+++
−= 2& (B.2)
On this formula, Tm means the average temperature of cool water which goes through outside
of the evaporator, and Tevap means the evaporation temperature of refrigerant inside of the
evaporator. And the letter R means resistant - each Rconv, Rf, Rw, Revap comes under the thermal
resistant by compulsion convection current(Rconv), fouling resistant(Rf), the thermal resistant by
conduction on surface of the cooler's wall(Rw), the thermal resistant related to evaporation in the
evaporator(Revap).
We have to rotate same amount of calorie Q to get the same temperature of cool water Tm, if
fouling was formed, the denominator of (B.2) could be bigger than that of (B.1) because of the
increase of thermal resistant. Also the Tevap2 of (B.2) should be smaller than Tevap1 of (B.1) because
the numerator of (B.2) must be bigger than that of (B.1) to make same amount of calories.
67

Arranging these, we can get the fact that the more fouling factor is, the lower the suction
temperature - the input condition of compressor - should be, when we want to make same amount
of cool water : Because of the increase of fouling resistant. Therefore, the value(the suction
temperature) will decrease linearly according to increase of fouling factor like Fig. B-3.
Fig. B-4 Effect of scale on the condensing temperature of a typical water-cooled condenser
CONDENSER FOULING FACTOR [ hr ft2 F / BTU ]
0.000 0.001 0.002 0.003 0.004
CONDENSER FOULING FACTOR [ m2 C / W ]
CO
ND
EN
SIN
G T
EM
PE
RA
TUR
E [
F ]
95
100
105
110
115
120
CO
ND
EN
SIN
G T
EM
PE
RA
TUR
E [
C ]
0 0.176E-3 0.352E-3 0.528E-3 0.704E-3
35
37.78
43.3
48.8
40.56
46.11
Fig. B-4 shows that how the condensing temperature changes according to increase of fouling
factor on the outsurface of the condenser, and we can recognize that condensing temperature
increase linearly according to decrease of fouling factor.
And it can be explained like cooler's case above :
Let the calories that should be radiated from condenser is Q, and we can derive one formula as
follows :
( )( )cwcondens
ccondens
RRRTT
Q++
−= 1& (B.3)
68
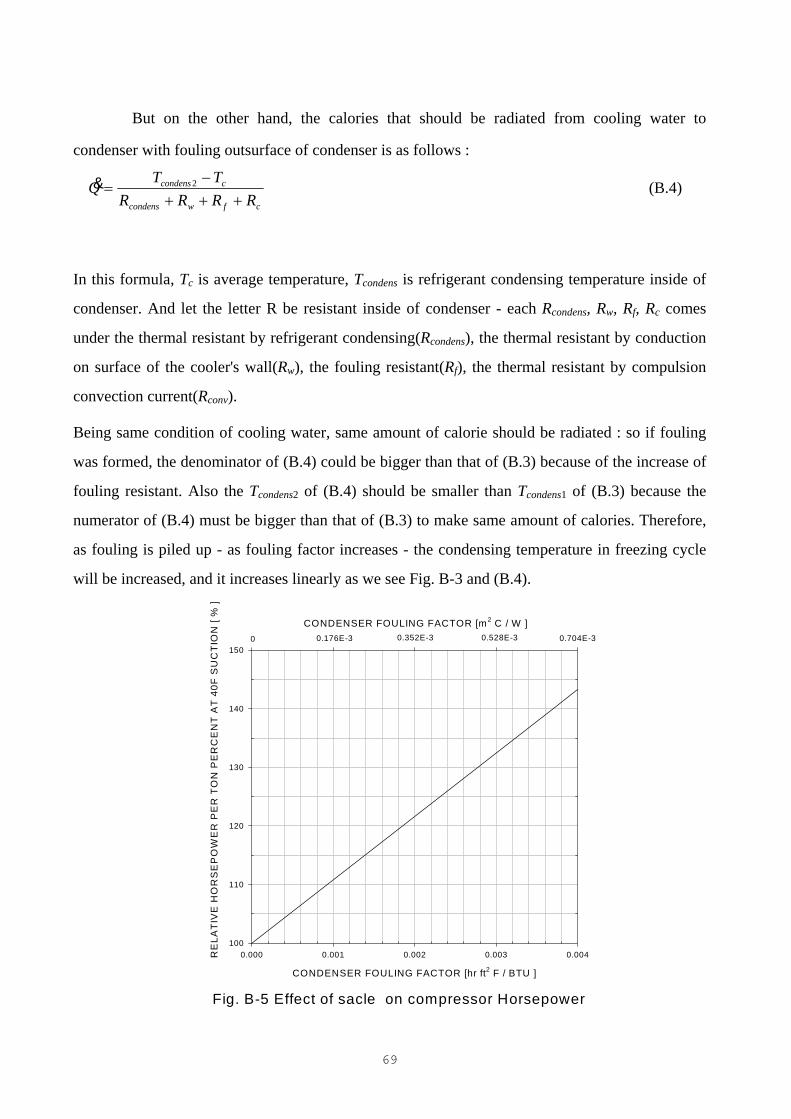
But on the other hand, the calories that should be radiated from cooling water to
condenser with fouling outsurface of condenser is as follows :
cfwcondens
ccondens
RRRRTT
Q+++
−= 2& (B.4)
In this formula, Tc is average temperature, Tcondens is refrigerant condensing temperature inside of
condenser. And let the letter R be resistant inside of condenser - each Rcondens, Rw, Rf, Rc comes
under the thermal resistant by refrigerant condensing(Rcondens), the thermal resistant by conduction
on surface of the cooler's wall(Rw), the fouling resistant(Rf), the thermal resistant by compulsion
convection current(Rconv).
Being same condition of cooling water, same amount of calorie should be radiated : so if fouling
was formed, the denominator of (B.4) could be bigger than that of (B.3) because of the increase of
fouling resistant. Also the Tcondens2 of (B.4) should be smaller than Tcondens1 of (B.3) because the
numerator of (B.4) must be bigger than that of (B.3) to make same amount of calories. Therefore,
as fouling is piled up - as fouling factor increases - the condensing temperature in freezing cycle
will be increased, and it increases linearly as we see Fig. B-3 and (B.4).
Fig. B-5 Effect of sacle on compressor Horsepower
CONDENSER FOULING FACTOR [hr ft2 F / BTU ]
0.000 0.001 0.002 0.003 0.004
CONDENSER FOULING FACTOR [m2 C / W ]
RE
LATI
VE
HO
RS
EP
OW
ER
PE
R T
ON
PE
RC
EN
T A
T 4
0F S
UC
TIO
N [
% ]
100
110
120
130
140
1500 0.176E-3 0.352E-3 0.528E-3 0.704E-3
69

Fig. B-5 shows the effect of scale on compressor horsepower being fixed condensing
fouling factor(outsurface fouling) and suction temperature(input condition) at 40F. As fouling
factor increase, refrigerant condensing temperature will also increase linearly as we saw on Fig. B-
3. And finally compressor horsepower will increase linearly because refrigerant condensing
pressure increased linearly as refrigerant condensing temperature increased. That is, if fouling
factor become 0.002 [hr ft2 F / BTU ], we can recognize that the compressor horsepower will
increase up to 122%.
Arranging this : the increase of fouling resistant on the outsurface of evaporator will cause the
decrease of suction temperature - the input condition of compressor - and the fouling inside of the
cooling water path can cause the increase of condensing temperature. Because of these, the all
amount of work(horsepower) that the compressor should do will be increased more than without
fouling inside.
Also we can recognize that fouling increase, suction temperature, condensing temperature and
horse power is linearly related to each other.
3. Relations between Condensing Temperature and Refrigerative Effect
On the above, we explained that the scale which formed by cooling water can cause the
increase of fouling factor and refrigerant condensing temperature. But in the previous paragraph,
we assumed that same amount of calorie was transferred - so the freezing efficiency is same. Yet,
in actually, the increase of fouling factor can make the freezing more inefficient in itself. From
now, we will explain what kinds of effect would scale formation cause to freezing efficiency.
70
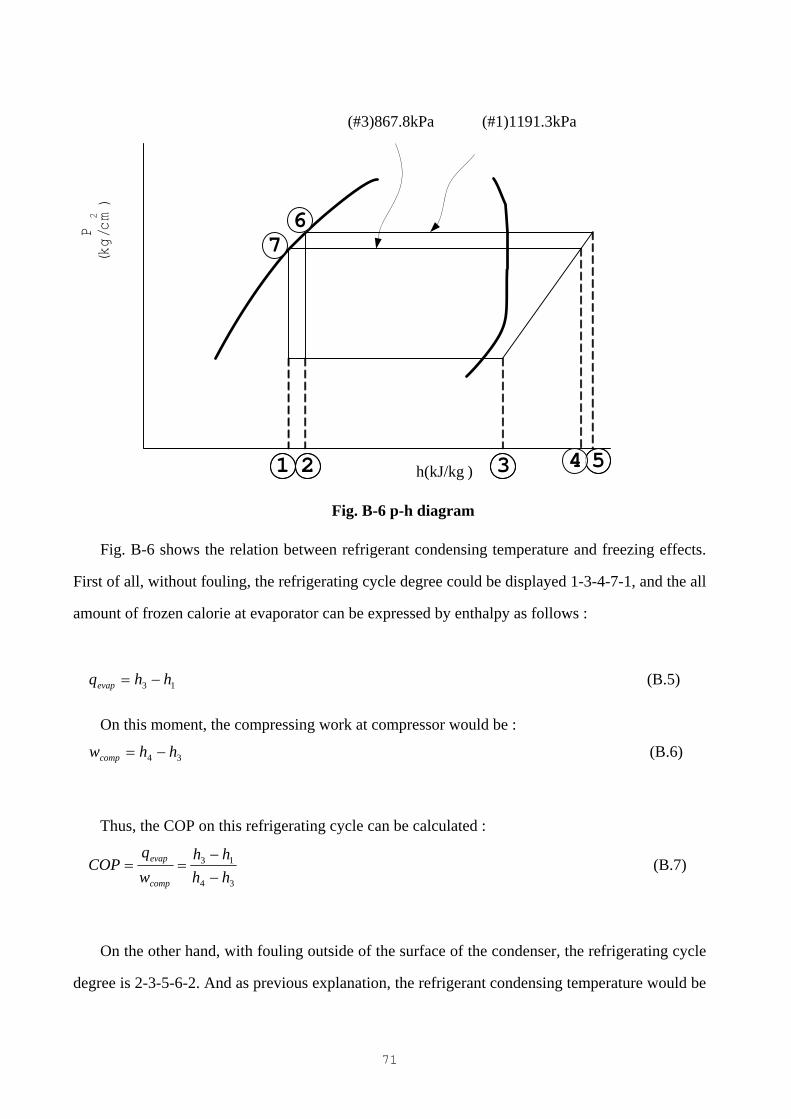
(#3)867.8kPa (#1)1191.3kPa
1
76
5432
P(kg/cm)
2
h(kJ/kg )
Fig. B-6 p-h diagram
Fig. B-6 shows the relation between refrigerant condensing temperature and freezing effects.
First of all, without fouling, the refrigerating cycle degree could be displayed 1-3-4-7-1, and the all
amount of frozen calorie at evaporator can be expressed by enthalpy as follows :
13 hhqevap −= (B.5)
On this moment, the compressing work at compressor would be :
34 hhwcomp −= (B.6)
Thus, the COP on this refrigerating cycle can be calculated :
34
13
hhhh
wq
COPcomp
evap
−−
== (B.7)
On the other hand, with fouling outside of the surface of the condenser, the refrigerating cycle
degree is 2-3-5-6-2. And as previous explanation, the refrigerant condensing temperature would be
71
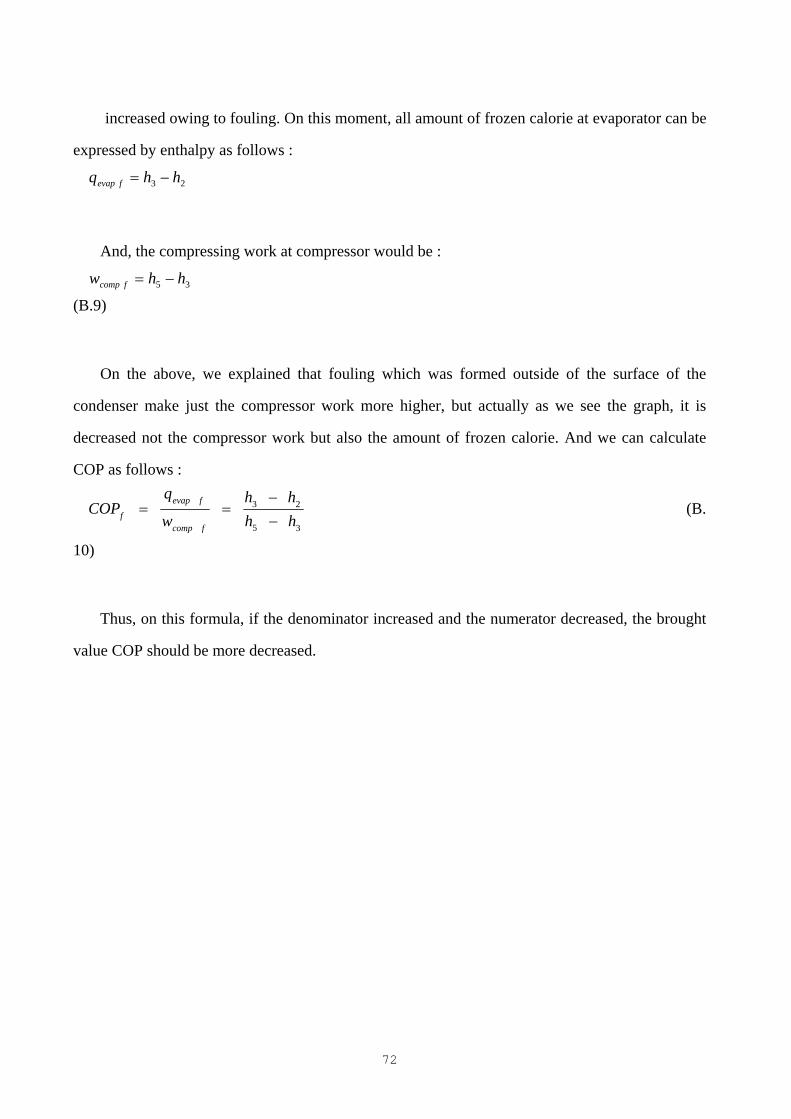
increased owing to fouling. On this moment, all amount of frozen calorie at evaporator can be
expressed by enthalpy as follows :
23 hhq fevap −=
And, the compressing work at compressor would be :
35 hhw fcomp −=
(B.9)
On the above, we explained that fouling which was formed outside of the surface of the
condenser make just the compressor work more higher, but actually as we see the graph, it is
decreased not the compressor work but also the amount of frozen calorie. And we can calculate
COP as follows :
35
23
hhhh
w
qCOP
fcomp
fevap
f −−
== (B.
10)
Thus, on this formula, if the denominator increased and the numerator decreased, the brought
value COP should be more decreased.
72
4. How to Remove the Fouling Caused by Cooling Water
As above explanation, we must clean refrigerator periodically because fouling formation may
make the ability of refrigerator more inefficient.
And there are many methods to remove obstacles of the refrigerator as follows :
Table B-3 : Fouling Remove Methods by Cooling Water
Methods Problems
1. Periodical Cleaning using Acid or Brush (Hand cleaning)
- Simple cleaning method that cleaning several times per year manually.
2. Hard water softner injection
- Generally used methods by lots of salt injecting : it may occur pollution by drain water.
- It needs manual hand cleaning once a year.
3. Magnetic handling equipment
- Scale handling method using magnet, but it needs a lot of engineering information : a quality, flow, temperature of water, pH etc.
- And the scales made by silica cannot be removed
4. Chemical treatment - Periodical softening chemical injecting method : it is cheaper
than 'Hard water softner injection method', but it needs manual hand cleaning once a year.
5. Brush System - Inserting brushes into condenser tubes, but it interrupt the flow
of the cooling water moving into inverse, and it costs high when inserting or changing brushes.
6. Sponge Ball Circulation - Circulate sponge ball a little bit bigger than the tube size, and it
is most clear methods but it needs separate sponge circulating machine.
73

Table B-4 : Comparison of Cleaning Methods
Features of the Clean Methods Sponge Balls
Chemical Cleaning
Nozzle Brushes
Clean pipes for a long time positive negative negative positive Prevents pipe wear in the cleaning process positive negative negative positive
Simple and reliable positive positive positive negative Increases the life of span of the exchanger positive negative negative positive Preserves the performance coefficient of the exchanger
positive negative negative positive
Preserves environmental quality positive negative positive positive
Table B-3 and B-4 shows that the most proper way to remove fouling by cooling water is
'Sponge ball circulation method'. But this method need separate equipments to circulate sponge
ball, and also needs cleaning equipments to wash sponge balls themselves, so the considering
problems about this method is :
1. How much reliable and simple this method is?
2. How much simple the self-cleaning sponge ball equipments?
3. Are there any damages on the sponge balls circulating sponge ball by pump or something?
4. What is most proper period to circulate sponge balls?
5. Is the cost not expensive to run and is it convenient to install?
74