Embed Size (px)
Citation preview

ISOLATED CAPITAL CITIES AND MISGOVERNANCE: THEORY AND EVIDENCE
FILIPE R. CAMPANTE QUOC-ANH DO BERNARDO GUIMARAES
Agosto de 2013
TTeexxttooss ppaarraa DDiissccuussssããoo
323

TEXTO PARA DISCUSSÃO 323 • AGOSTO DE 2013 • 1
Os artigos dos Textos para Discussão da Escola de Economia de São Paulo da Fundação Getulio Vargas são de inteira responsabilidade dos autores e não refletem necessariamente a opinião da FGV-EESP. É permitida a reprodução total ou parcial dos artigos, desde que creditada a fonte.
Escola de Economia de São Paulo da Fundação Getulio Vargas FGV-EESP
www.eesp.fgv.br

Isolated Capital Cities and Misgovernance: Theory and Evidence∗
Filipe R. Campante† Quoc-Anh Do‡ Bernardo Guimaraes§
This version: February 2013
Abstract
Motivated by a novel stylized fact – countries with isolated capital cities display worse quality ofgovernance – we provide a framework of endogenous institutional choice based on the idea that elitesare constrained by the threat of rebellion, and that this threat is rendered less effective by distancefrom the seat of political power. In established democracies, the threat of insurgencies is not a bindingconstraint, and the model predicts no correlation between isolated capitals and misgovernance. Incontrast, a correlation emerges in equilibrium in the case of autocracies. Causality runs both ways:broader power sharing (associated with better governance) means that any rents have to be sharedmore broadly, hence the elite has less of an incentive to protect its position by isolating the capital city;conversely, a more isolated capital city allows the elite to appropriate a larger share of output, so thecosts of better governance for the elite, in terms of rents that would have to be shared, are larger. Weshow evidence that this pattern holds true robustly in the data. We also show that isolated capitalsare associated with less power sharing, a larger income premium enjoyed by capital city inhabitants,and lower levels of military spending by ruling elites, as predicted by the theory.
Keywords: Governance; Institutions; Capital Cities; Population Concentration; Revolutions; Insurgencies;Democracy; Power Sharing; Inefficient Institutions.
JEL Classification: D02, D74, R12
∗We thank Daron Acemoglu, Davin Chor, Ernesto Dal Bo, John Friedman, Ed Glaeser, Josh Goodman, Rema Hanna,Ethan Ilzetzki, and Andrei Shleifer, as well as seminar participants at the Center for International Development at HKS,EPGE-FGV, the Annual Meeting of Lacea (Lima 2012) and the Annual Meeting of SBE (2012), for helpful comments andconversations, and the Taubman Center for State and Local Government at the Harvard Kennedy School for generous financialsupport (Campante). All remaining errors are our own.†Harvard Kennedy School, Harvard University. Address: 79 JFK Street, Cambridge, MA 02138, USA. Email: fil-
ipe [email protected]‡Department of Economics and LIEPP, Sciences Po. Address: 28 Rue des Saints-Peres, 75007 Paris, France. Email:
[email protected].§Sao Paulo School of Economics - FGV. Address: R Itapeva 474, Sao Paulo, SP 01332-000, Brazil. Email:

1 Introduction
Governance goes hand-in-hand with development. It is well-established that the quality of governance
is positively correlated with income per capita and a number of variables associated with development,
both across countries (e.g. Kaufman, Kraay and Zoido-Lobaton 1999) and within countries (e.g. Putnam
1993, Ferraz and Finan 2008) – whether this represents causality in one way or the other, or perhaps both
(e.g. Kaufman and Kraay 2002, Sachs et al. 2004). If we interpret governance broadly as concerning the
institutional environment and the ability to implement collective choices (Baland, Moene and Robinson
2009), it has been often argued that it is central in understanding different paths of development (e.g.
Acemoglu, Johnson and Robinson 2005). In any event, there can be little doubt that the quality of
governance directly affects the provision of public goods, and thus matters greatly for welfare and efficiency.
But governance is clearly endogenous, emerging as part of a collective choice by a society. Since
good governance imposes limits on the extent to which rulers and elites can appropriate the apparatus
of government to their own benefit, understanding it requires understanding the constraints under which
these rulers and elites operate. This is particularly elusive in contexts where there are relatively few
explicit, formally established constraints, such as those imposed by a well-functioning democratic process
through which incumbents might be held accountable.
We explore one specific source of informal constraints on rulers: the spatial distribution of a country’s
population. We start off motivated by a basic – and as far as we can tell, novel – stylized fact: countries
with isolated capital cities display worse quality of governance. Pairing this stylized fact with the historical
evidence that capital cities have often played a pivotal role in determining the outcome of insurgencies
and revolutionary standoffs, and that incumbents seem to react to the incentives posed by this role, we
posit that the link between isolated capitals and misgovernance is far from coincidental.
We develop a theoretical framework to shed light on these questions. In our model of endogenous
institutional choice, rules for allocating political power and economic resources are chosen by a ruling elite.
In particular, they decide whether to share power more broadly, which allows for greater productivity to
the extent that the existence of checks and balances enables the use of more productive technologies that
require public goods such as the rule of law or the enforcement of contracts. This “good governance”,
however, imposes costs on the elite, because it requires that any rents that they extract from citizens be
shared more broadly with those with whom power is shared.
Our key assumption is that the elite’s choice is subject to the threat of rebellions from dissatisfied
citizens, and most crucially that such rebellions are more effective when they take place closer to the
capital city. This embodies the principle that “spatial proximity to power increases political influence”
(Ades and Glaeser 1995, p.198), and especially so when that influence is mediated by the threat of violence.
In this context, one way to protect against these threats is to locate the seat of political power (the capital
city) in an isolated place, even though doing so might be economically inefficient.1
1We take the choice of location of the capital city as a short-hand description for all the policy levers that affect the spatial
1
We consider two alternative scenarios underlying the institutional choices. Under “democracy”, we
assume that elites are constrained to maximizing the welfare of the average individual. Under “autocracy”,
in contrast, the elite is free to maximize the welfare of its own members, subject only to the constraint of
possible violent removal. While explicitly modeling the underpinnings of democracies and autocracies (or
of transitions between them) is beyond the scope of our model, we use this stark contrast to capture the
idea that in established democracies an incumbent regime will likely be removed through regular means
in case it fails to respond to the preferences of citizens.
Our central result is that a positive correlation between the isolation of the capital city and misgov-
ernance emerges in equilibrium, but only in the non-democratic context. In a democracy, the constraint
imposed by the threat of rebellion does not matter, because any new elite will be strictly limited in their
ability to obtain rents by the average citizen. As a result, there is no link between the degree of isolation
of the capital city and the quality of governance. In the autocratic case, on the other hand, the correlation
emerges as a result of causality running both ways. A more isolated capital city implies a larger income
gap between the elite and the average citizen, since a more protected elite can extract more rents. This
means that the ruling elite has more to gain by forsaking the sharing of power and rents and choosing bad
governance: the ability to take a greater slice makes the elite worry less about having an inefficiently small
cake. By the same token, misgovernance also encourages the choice of a more isolated capital city: good
governance means that rents have to be shared more broadly anyway, so the elite has less of an incentive
to protect its position by isolating the capital city.
Informed by the theoretical framework, we then go to the data to further probe the link between
isolated capitals and governance, and to test whether our suggested mechanism is supported by the
evidence. We establish that our motivating correlation is indeed robust – to controlling for a number of
variables that are reckoned to correlate with quality of governance and isolation of the capital, and to
different ways of measuring these concepts. Most importantly, we show that the central prediction of the
model is supported by the evidence: the correlation is present only for relatively non-democratic countries.
The model also suggests ways of unpacking the definition of governance in the data. Our logic would
not lead us to expect that isolated capital cities would be correlated with greater political instability,
since isolation is a way of protecting against the threat of removal. Looking at the component measures
of the World Bank’s World Governance Indicators, we see that in fact autocracies where the capital city
is in an isolated location have governments that are less effective, less accountable, more corrupt, and less
able or willing to sustain the rule of law, but that are not more unstable. We also show that there is no
correlation between isolated capitals and dimensions of government performance that are unrelated to the
kind of institutional incentives our framework highlights, as illustrated by the measure of average number
of days to return a letter sent to a non-existent address (from Chong et al 2012). This suggests that our
distribution of individuals relative to the capital city, of which actually relocating the capital is just a relatively extremeexample – though, as we will see, not that infrequently used or contemplated – alongside migration policies, specific economicincentives to populate certain areas, and so forth.
2
stylized fact is unlikely to be driven by some unrelated correlation between isolated capitals and lack of
state capacity. In addition, it seems to be indeed about the role of the capital city: controlling for the
isolation of the country’s largest city other than the capital leaves results unaffected.
We also look at direct evidence on our proposed mechanism, by looking at measures of power sharing.
We use data from the Polity IV project to show that isolated capital cities are indeed associated with less
power sharing, as captured by constraints on executive power and by the extent of political competition.
Interestingly, we find no significant connection (and a point estimate of the opposite sign) between the
concentration of population around the capital and another Polity IV measure that arguably does not
relate as closely to the degree of power sharing, namely whether regular succession in the executive is
hereditary or not.
Last but not least, the model yields ancillary testable predictions, and the evidence is again supportive.
We predict a positive correlation between the isolation of the capital and income per capita in the capital
city (relative to that of the country as a whole), and that military spending is higher in countries were the
capital city is less isolated, inasmuch as such spending can be used as an alternative source of protection.
We find evidence for both predictions, and consistent with the model, only for the sample of relatively
non-democratic countries.
Our paper is closely related to Campante and Do (2012), which looks at how the spatial distribution
of population and the isolation of capital cities affect government performance across US states, by con-
ditioning the degree of accountability provided by the news media and the electoral process. We look
here at a very different mechanism, which we show to be in force in a very different, non-democratic
context. While their results seem in tension with our finding of an absence of a link between the degree
of isolation and governance in established democracies, they can be reconciled quite naturally: as much
as there is a real difference between the extent of corruption in, say, Minnesota and Louisiana, this is
evidently swamped by the variation across countries. It is not surprising that the cross-country evidence
is painted with strokes that are too broad to detect the effect of the subtler mechanisms that are in play
in established democracies, and which our theory leaves aside.
Another crucial distinction is that the mechanism highlighted in that paper points at a direction of
causality running from the isolation of the capital to governance. Here, in contrast, we argue that the
reverse direction is just as important in the case of weakly institutionalized polities, as incumbents have
considerably more influence in affecting the spatial distribution of population relative to the capital. This
two-way feedback underscores the difficulty of empirically disentangling causality running one way or the
other.2 It is thus especially important that our framework makes specific predictions regarding the context
2In particular, it is hard to think of sources of exogenous variation, at the cross-country level, that affect the latterwithout affecting the former. (For instance, Pierskalla (2012) provides evidence that a long history of statehood increases theconcentration of population around the capital, but it stands to reason that such history would also directly affect governancein other ways (Chanda and Putterman 2005).) The source of exogenous variation used by Campante and Do (2012) – thelocation of a state’s centroid – is unfortunately not relevant in the context of the countries we focus on: the equanimous,republican logic of locating the capital at a relatively central position, which underlies the first-stage relationship accross USstates, was bound to be much less influential to the decisions of autocrats and/or colonial powers concerning the designation
3

and nature of that link. Along with the direct evidence on power sharing and on the model’s ancillary
predictions, this adds confidence that the stylized fact we detect is far from mere coincidence, and is in
fact driven by the forces we highlight.
Our paper also contributes, more broadly, to a literature that stresses the political implications of
spatial distributions, both in economics (e.g. Ades and Glaeser 1995, Davis and Henderson 2003) and
in political science (e.g. Rodden 2010). In fact, the importance of the spatial distribution of population
and its connection with the threat of rebellion facing rulers has long been recognized by an important
group: rulers themselves. As we discuss in detail later in this paper, the history of decisions on where
to locate capital cities makes it remarkably clear that protection against perceived instability threat is
a pervasive concern behind capital relocations, either planned or actually implemented – and they have
indeed happened fairly often (just about one every six years over the last century).
A related literature has studied how the isolation of countries or their geographical size affects insti-
tutions and development – such as Nunn and Puga (2012), on the effects of rugged terrain in Africa, and
Ashraf, Galor and Ozak (2010). In different ways, both papers argue that isolation may have a positive
effect on development by reducing the risk of external conflict, even if it may have other negative effects
such as through reduced trade. Neither paper deals with the specific institutional role of the capital
city, and its isolation with respect to the country’s population. On a different vein, Stasavage (2010)
emphasizes how geographical distances from European capital cities might have hindered the historical
development of representative institutions, by hindering the accountability of representatives, though his
historical data do not allow for consideration of the spatial distribution of population.
We also build on the literature on the endogenous emergence of institutions, and their implications for
development. Closest to our paper is Guimaraes and Sheedy (2012), who look at equilibrium institutions
in a context where rebellion threats constrain institutional choices. We add the crucial assumption that
those threats are related to the spatial distribution of population relative to the capital city, to study the
role of the latter. Similarly, we relate to the literature that studies the emergence of institutions as a result
of latent social conflict and (the threat of) violence, e.g. Besley and Persson (2009), Bueno de Mesquita
and Smith (2009), or Acemoglu and Robinson (2005). In particular, we address the broad question of
the persistence of inefficient institutions (e.g. Acemoglu 2006). We identify the spatial distribution of
individuals as a novel source of variation in the constraints that underpin institutional choices, which
may leave agents who stand to benefit from those inefficient institutions better able to get away with
their preferences. Last but not least, we are close to the recent strand of that literature that has tried
to unpack the evolution of political institutions along different dimensions, such as checks and balances,
power sharing, and political stability (e.g. Besley, Persson, and Reynal-Querol 2012). We provide further
support for the view that these can interact in subtle ways, and move in separate directions as a result.
of the capital. As noted by Herbst (2000, p. 16), with respect to Africa, “[most] colonial capitals were located on the coast,demonstrating the low priority of extending power inland compared to the need for easy communication and transport linkswith Europe.” These capitals by and large persisted as such after independence. Unsurprisingly, there is no correlationbetween the isolation of the capital city and the isolation of the centroid within our sample of autocracies.
4

The remainder of the paper is organized as follows: Section 2 presents the motivating stylized fact and
historical evidence on revolutions and capital cities; Section 3 analyzes the model and its implications;
Section 4 discusses the empirical evidence; and Section 5 concludes.
2 Isolated Capital Cities and Misgovernance: Some Motivation
Our basic premise is the idea that the spatial distribution of people in a given country or polity of interest
matters for political outcomes, and that the capital city, as the seat of political power, is an especially
important location in that configuration. Whether incumbent governments are relatively isolated or not
from the bulk of their citizens will affect the incentives they face in a number of dimensions, and this will
shape the institutional context from which better or worse governance will emerge. We thus start off by
looking at whether there is any evidence of an association between the quality of governance in a given
country and the degree of isolation of its capital city. (This section will briefly look at the raw data, for
the sake of motivation, while leaving the assessment of robustness to Section 4.)
2.1 Data
In order to measure quality of governance across countries, we resort to the well-known and widely
used Worldwide Governance Indicators (WGI), from the World Bank (Kaufman, Kraay and Mastruzzi,
2010). They aggregate information, from a number of different sources ranging from surveys of households
and firms to assessments from NGOs, commercial providers and public organizations, into six different
measures: Rule of Law, Voice and Accountability, Government Effectiveness, Regulatory Quality, Control
of Corruption, and Political Stability. (Sources for all variables are detailed in the Data Appendix.) Since
the year-to-year variation in the quality of governance measures is not very meaningful, we will average
them over time for a ten-year window starting when the WGI become available (1996-2006). To make
things as simple as possible, and making use of the fact that these individual measures are very highly
correlated, we will summarize them in a single number, using the first principal component of the six
measures taken together.3
When it comes to measuring how isolated a capital city is, we build on the axiomatically grounded
family of measures proposed in Campante and Do (2010).4 Specifically, they show that a very simple
and easily interpretable measure of isolation has a number of desirable properties (and uniquely so): the
average log distance of the country’s population to the capital city – which for shorthand we will describe
as AvgLogDistance.5 To fix ideas, consider an intuitive measure of isolation of a country’s capital, namely
3The correlation between the different average measures, in our sample of 178 countries, is never below 0.73, and typicallyfar above 0.8. The Kaiser-Meyer-Olkin overall measure of sampling adequacy is 0.896, indicating that a principal componentsanalysis is warranted.
4The following discussion draws from Campante and Do (2012).5This measure corresponds to one minus what Campante and Do (2010) call the “Gravity-based” Centered Index of Spatial
Concentration (G-CISC). More formally, let Ω ⊂ R2 be a convex set that can contain (the representation of) all countries, pxdenote the distribution of individuals in a given country, defined over Ω, and zφx be the distance between a point x ∈ Ω and
5
the distance between the capital and that country’s largest city. AvgLogDistance takes this intuition and
applies it in a more comprehensive and systematic fashion. First, instead of looking at the largest city
only, it takes into account the entire country: say, instead of looking at the distance between Washington,
DC and New York City, it takes into account the existence of Los Angeles, Chicago, and every other place
in the United States. Second, it does so by weighing each place according to its population; it can be
shown that this averaging uniquely guarantees key desirable properties.6 Finally, the log transformation
turns out to be the only way to obtain a property of unbiasedness with respect to approximations that
have to be performed in computing the measure with actual data.7 We focus on a measure of distance
that adjusts for the geographical size of the country, to allow for the possibility that a given distance could
mean different things in countries that are geographically small or large: 100 miles could be seen as a long
distance in Belgium, but not so much in Canada.8 That said, we will later look at other possibilities that
do not adjust for geographical size, for the sake of robustness.
We use the database Gridded Population of the World (GPW), Version 3 from the Socio-Economic
Data Center (SEDC) at Columbia University. This dataset, published in 2005, contains the information
for the years 1990, 1995 and 2000, and is arguably the most detailed world population map available. Over
the course of more than 10 years, these data are gathered from national censuses and transformed into a
global grid of 2.5 arc-minute side cells (approximately 5km, or 3 miles), with data on population for each
of the cells in this grid.9 As it turns out, the autocorrelation in the measure of population concentration is
very high across the ten-year period in question. For this reason, we choose to focus on AvgLogDistance
the capital, which we fix at a point φ ∈ Ω. We then have: GCISC =∫
Ω(1 − α log zφx)dpx, where α > 0 is a normalization
parameter. A description of the index as we actually compute it in practice, given the data we have, can be found in theOnline Data Appendix.
6Campante and Do (2010) show that averaging (over the distribution of population) iso-elastic transformations of distanceto the capital uniquely guarantees the following properties: First, that if a subset of a population becomes more concentratedaround the capital, so does the overall distribution (subgroup consistency); second, that moving people closer to the capitalimplies a more concentrated distribution (monotonicity); and third, that the measure is independent of the units in whichdistance is measured (rank invariance). In addition, it also satisfies a property of convexity that seems reasonable in ourcontext, namely that a given movement of a person towards the capital has a greater impact on concentration if it happensclose to the capital.
7Specifically, we compute the levels of concentration of country population around the capital city by using a global gridwith population data for each cell in the grid, as described below. We thus have to attribute the location of each cell’spopulation to the geographical position of its centroid. The G-CISC is uniquely unbiased to that type of measurement error,in that (uniformly) “random” deviations do not change the rankings of distributions as measured by it: technically, it isinvariant under mean-preserving spreads of the distribution around points other than the capital.
8Specifically, we set the normalization parameter α so that a measure of one represents a situation of maximum concentra-tion, in which all individuals live arbitrarily close to the point designated as the center of the capital, while zero represents asituation where the capital is maximally isolated, with all individuals living as far from it as possible in each specific country.This corresponds to what Campante and Do (2010) denote GCISC2.
9We limit our analysis to countries with more than one million inhabitants, since most of the examples with extremelyhigh levels of concentration come from small countries and islands. The results with the full sample are very much similarand are available upon request.
6

as computed for the one year, 1990, that is judged by the SEDC as having the highest data quality.10 11
2.2 Isolated Capital Cities are Associated with Misgovernance
A crude look at the data immediately suggests that countries with relatively isolated capital cities score
worse in governance, as measured by the WGI. Figure 1 makes this point in simple fashion, by splitting the
sample between countries with “less isolated capitals” (below the median in our AvgLogDistance sample,
which corresponds to France) and “more isolated capitals” (above the median). The figure contrasts the
average quality of governance in the two sets of countries, as captured by the first principal component
of the WGI measures. What we see is that the countries with less isolated capitals score distinctly better
than their more isolated counterparts. In fact, the difference in governance scores across groups is far from
trivial: it corresponds to about 40% of a standard deviation in that distribution, and is roughly akin to
the difference between the quality of governance in Bolivia (on the lower end) and in Bulgaria.
[FIGURE 1 HERE]
The same message is conveyed in Figure 2, which plots the measure of governance against our bench-
mark index of isolation, for all countries in the sample. What we see is a negative correlation, indicating
that countries with more isolated capitals are reckoned to display worse governance. This correlation is
statistically significant (with a t-statistic of 3.58), and quantitatively important: a one-standard-deviation
change in the degree of isolation is associated with a change of almost 0.3 standard deviation in the quality
of governance. For the sake of comparison, this corresponds to about one-half of the change associated
with education (as measured by total years of schooling in 2000, from the Barro-Lee data set), which is
well-known to be very strongly associated with governance patterns across countries.
[FIGURE 2 HERE]
We will argue that this association between isolated capital cities and misgovernance, far from be-
ing coincidental, reflects the relationship between that isolation and the constraints faced by incumbent
regimes, especially in a context in which these constraints are mediated by the threat of insurrection.
2.3 Revolutions and Capital Cities
Our theory will argue that this is so because the capital city plays a key role in revolutionary situations,
and as such individuals who are closer to the capital will, other things equal, constitute a greater threat
10An important issue refers to how we deal with countries that have multiple capitals, or that changed capitals withinthe time period we focus on. Our general rule is to consider the de facto capital as being the site of the executive and thelegislature. For instance, this means that we take the capital of the Netherlands to be The Hague (instead of Amsterdam)and the capital of Bolivia to be La Paz (and not Sucre). We leave South Africa out of the sample, since the executive andlegislature have always been in different cities, while keeping Chile because the legislative moved more recently (1990). Asfar as changes in capital cities during our sample period, we have the cases of Myanmar (2005) and Kazakhstan (1997). Wedrop both from the sample. The results are unaffected by any of these choices.
11All of our analysis will exclude Mauritius, because it is an outlier in terms of the concentration of population. As it turnsout, our results are made stronger by its inclusion, so we want to make sure that nothing is driven by this specific case.
7

to those incumbent regimes and elites. This idea embodies the principle that “spatial proximity to power
increases political influence” (Ades and Glaeser 1995, p. 198), and particularly so when that influence is
associated with the threat of violence.
A brief look at revolutionary episodes in the past two centuries shows just how important the population
around the capital city is in these contexts. Physical proximity to the stronghold of the government matters
critically, inasmuch as a revolution from remote lands, all else equal, needs to pay larger costs to lay siege
to the government. A relatively small mob in the capital city thus has as much political influence as a
much larger group of rebels elsewhere, and a capital city that is home to or is surrounded by dissidents
entails a greater risk of insurgency against an autocratic incumbent, and as such those who live in the
capital constitute a much greater threat.
A classic example is the transition century from the Ancien Regime to the Third Republic, in France.
On the Eve of the Ancien Regime, the 550 thousand people living in Paris certainly did not represent the
average or median opinion of some 29 million Frenchmen, among which many royalists willing to defend
the monarchy at all costs.12 While turmoil in the countryside was certainly important leading up and in
the aftermath of the Revolution (Markoff 1996), it is rather clear that the Parisian crowd packed a far
heavier revolutionary punch than those anywhere else. As described by Tilly (2003 p.162-167), the dense
population of Paris made it inevitable that in times of trouble large brawls occurred regularly; it did not
take much time to see the rise of sizeable mobs such as the crowd that stormed the Bastille on July 14,
1789, or the one that assaulted the Tuileries and arrested Louis XVI and his family on August 10, 1792.
In a similar vein, Mark Traugott’s (1995) detailed analysis of Parisian and French insurrections during
the following century emphasizes the idea that “in general, the rural population proved acquiescent, but
the will of the capital initially held sway even when the numerical majority living in the countryside
seemed resistant to the change.” While not every Parisian insurrection managed to change the status
quo like those in 1830 and 1848 did, they indeed occurred in a remarkably recurrent pattern: 1827,
1830, 1832, 1834, 1839, 1848, 1849, 1851, 1869, and 1871. Interestingly, insurrections of considerable size
originating elsewhere in the country, including the 1831 and 1834 revolts of the canuts (silk workers) in
Lyon, the second largest city, “systematically failed to produce comparable repercussions at the national
level unless they coincide with unrest in the capital” (see Bezucha, 1974 and Montagne, 1966). Even when
the workers-insurgents of Lyon managed to capture the whole city both times, it was certainly of minor
concern to the freshly instituted monarch Louis-Philippe, who later subdued them with ease by using his
large, professional army. In comparison, in 1848 the very same King, then much more entrenched in his
throne, succumbed to the Parisian crowd and abdicated after less than three days of rebellion, failing to
mobilize even the troops at his immediate disposal to confront the populace. As Traugott summarizes,
during this period the change of regime in France is best described as “as Paris goes, so goes the nation”.
12National and city population figures come from estimates of McEvedy and Jones (1978), and from Braudel (1986), whoobserved that France at the end of the Ancien Regime was still very much a rural country. Later on, royalist counter-revolutionaries rioted in Brittany, La Vandee and Dauphine, regions too far from Paris to make any difference.
8

The logic linking revolutions and capital cities is by no means limited to nineteenth century France, of
course. As put by The Economist, in the context of the 2006 “Orange Revolution” in the Ukraine, “during
a [revolutionary] stand-off, the capital city is crucial.”(March 18th 2006, p. 28) The lingering political
turmoil in Thailand, in recent years, is a striking example of how a government could be overthrown
relatively effortlessly if it lacks support from the population of the capital city, even when such government
was largely popular in the countryside (The Economist, Sep. 22nd, 2006).
The importance of these considerations is underscored by the many incumbent rulers who have tried
to manipulate the concentration of population around the capital by moving the latter – more often than
not with alleviating revolutionary pressure as one of the explicit, or barely concealed, goals. It is not hard
to come up with examples from history. In the 17th century, Louis XIV moved away from the Parisian
masses into the tranquility of Versailles, a move that is thought to have been influenced by his dislike of
Paris, stemming from having witnessed and suffered the rebellions against the Crown that became known
as the Frondes (1648-53), as argued by the contemporary account of the Duc de Saint-Simon. Modern
examples are also easy to come by, as we will see shortly, and many other countries have fiddled with the
idea, even if falling short of carrying it through. In just about every case, a chief concern was to have
the new capitals to be “quiet, orderly places where civil servants could get on with their jobs without
distraction.”(The Economist, Dec. 18th 1997)
Looking closely at a couple of these examples helps illuminate that logic. For instance, Brazil had
the capital moved in 1960 from Rio de Janeiro to Brasılia – many hundreds of kilometers away from the
main population centers of Rio de Janeiro and Sao Paulo, and far from the coast, where most of the
country’s population was and still is. The debate over moving the capital is much older, though, and
from the start the advantages of moving away from the crowds were acknowledged by those in favor of
the idea: as early as 1810, while Brazil was still under Portuguese rule, an advisor to the king made the
point that “the capital should be in a healthy, agreeable location free from the clamorous multitudes of
people indiscriminately thrown together.” (The Economist, Dec. 18th 1997) As Couto (2001) remarks,
the president who finally decided to build the new capital, Juscelino Kubitschek, was also guided by a
desire to escape from the atmosphere of political agitation in Rio, where the president was more exposed
to political crises and student demonstrations. As he himself put it, rather colorfully: “A tramway strike
in Rio de Janeiro may bring down the President of the Republic.” (Couto, 2001, p. 199, our translation)
The recent move in Myanmar (Burma), in 2005, from the major population center of Yangon (Rangoon)
to the fortified “secret mountain compound” of Naypyidaw is another illuminating, if somewhat extreme
example. (International Herald Tribune, Nov 11th 2005) As put by Varadarajan (2007):
“Vast and empty, Burma’s new capital will not fall to an urban upheaval easily. It has
no city centre, no confined public space where even a crowd of several thousand people could
make a visual – let alone political – impression. Naypyitaw (sic), then, is the ultimate insur-
ance against regime change, a masterpiece of urban planning designed to defeat any putative
9

“colour revolution” – not by tanks and water cannons, but by geometry and cartography. 320
kilometres to the south, Rangoon, with five million people, is home to one-tenth the country’s
population. But even if that city were brought to a standstill by public protests and demon-
strations, Burma’s military government – situated happily in the middle of paddy fields in the
middle of nowhere – would remain unaffected.”
As if to emphasize this design, the city was deliberately planned without mobile phone coverage, and
civil servants were not allowed to take their spouses or children along when they originally moved (Htay
2007). These are measures that are hard to justify under the oft-mentioned rationales of developing an
underpopulated part of the country or protecting against foreign invasion.
This pattern can be seen more systematically with the help of Table 1. This table lists all instances
in which capital cities were moved, on a permanent basis, by formally independent countries since World
War I, with the corresponding distances and population numbers (for as close to the event as could be
found).13 The first thing to note from this table is that these are not rare episodes: on average, capital
moves happen once every six years – the 1930s were the only decade that did not see one – and there
are examples from every continent. Most importantly from our standpoint, the table also shows that the
moves are overwhelmingly in the direction of greater isolation, at least under the rough measure of capital
primacy (population in the capital city). This pattern might have been expected, since the capital is more
often than not the largest city in the country, but what is striking is that the typical new capitals is a lot
smaller than the old one – quite a few times, a new city built from scratch. In short, rulers and regimes
that have chosen to move their capital cities have most often picked a more isolated location.
[TABLE 1 HERE]
In sum, the population concentrated in and around the capital city matters much more than those
located elsewhere, from a political standpoint, particularly when it comes to extra-institutional channels
such as revolutions and riots (as opposed to competitive, democratic elections). Just as importantly, rulers
recognize that and react. This might involve the relatively extreme policy lever of picking or influencing
the location of the capital city, which we have used to illustrate the point, but we should also stress
that many others are available. For instance, they can try to placate discontent arising in the capital,
or otherwise influence the distribution of population around the capital – say, with special incentives
or coercion towards populating certain areas of the country, or with restrictions on domestic migration.
Stark examples of such policies are not hard to come by either: from relatively benign registration systems
that discourage internal migration (especially to cities) – such as the Chinese hukou or the Vietnamese
ho khau – to more extreme cases such as the mass deportation of ethnic groups and the confinement of
dissidents to remote areas in the Soviet Union, or the forced depopulation of cities during the reign of
13Sources are listed in the Data Appendix. Exceptions involving temporary moves, or moves within a 10km radius arelisted in the notes below the table.
10

the Khmer Rouge in Cambodia. As with capital city moves, these are all policies that are not motivated
solely by a desire to isolate the capital, but it is telling that one can hardly find examples of such regimes
encouraging their populations to move closer to it. It is just as telling that they often specifically target
groups considered particularly dangerous in terms of kindling insurgencies.
3 Isolated Capital Cities and Misgovernance: A Theory
Motivated by the previous evidence, we propose a theory of the joint determination of the quality of
institutions and the degree of isolation of the capital city. Following Guimaraes and Sheedy (2012), we
study the endogenous determination of institutions – understood as the set of rules that allocate political
power and economic resources – as the equilibrium outcomes of a process in which any given set of rules
can be challenged by rebellions. We add two crucial and related assumptions: first, that any individual’s
fighting strength in a rebellion is conditioned by spatial location. In particular, individuals who are closer
to the capital city – the seat of political power – will (coeteris paribus) pose a greater threat to any set
of established institutions. Second, that incumbent rulers and elites take that into account when deciding
where to locate the seat of political power. We will see that those assumptions not only predict a link
between the quality of institutions and the isolation of the capital city that is in line with the stylized
fact, but also yield additional testable predictions that we can take to the data.
3.1 The Model
We study an environment in which an incumbent elite can extract rents from its citizens, but is constrained
by the threat of insurrection. Besides setting transfers from citizens, the elite gets to choose the quality
of governance and the degree of isolation of the capital city, both of which affect the productivity of the
economy but also have distributional effects that feed back into that threat.
3.1.1 Individuals, Technology and Location
Consider a country containing a measure-one population of ex-ante identical individuals. They receive
utility from their own consumption C of a homogeneous good, and disutility if they exert fighting effort
F , which can be used to rebel against an existing institutional arrangement. (We will describe rebellions
and institutional arrangements in detail later.) Individual utility can thus be summarized by:
U = log(C)− F. (1)
Ex-post, individuals will be in one of the following categories:
• Members of the incumbent army ;
• Civil authorities;
11
• Citizens living in the capital city;
• Citizens living in a “faraway” location.
An incumbent army has measure a (a positive constant), and is in charge of protecting the existing regime.
They might choose to share power with a set of measure ξ (a positive constant) of individuals, who would
then become the civil authorities. As we will describe, this power-sharing arrangement is tantamount
to good governance. The elite comprises the incumbent army and the civil authorities, so whether the
measure of individuals in the elite will be p = a or p = a + ξ will be determined in equilibrium. The
remaining 1− p individuals are ordinary citizens, or citizens for short.
In order to capture the special role of the capital city in as simple a fashion as possible, we posit that
there are two places where citizens can locate: the capital, denoted by C , and elsewhere, which we denote
by F (for “faraway”). There will be (1− p)` citizens in F and (1− p)(1− `) citizens in C , and we will
thus think of ` as capturing the degree of isolation of the capital city, also to be endogenously determined.
Output in the economy is described by an aggregate production function:
Y = Ay(`)
where A denotes productivity and the function y is strictly concave in `. That output depends on ` is meant
to capture that different locations can have different endowments of characteristics affecting production,
and hence that the spatial distribution of population affects output. In particular, this implies that the
degree of isolation of the capital city affects output.14 The strict concavity in turn embodies the presence
of congestion effects in both locations, so that it is very costly, in terms of output, to concentrate everyone
in one of them. The importance of this set of assumptions is thus as a convenient way of modeling the
existence of a cost in the absence of which the elite’s problem would be trivially solved by totally isolating
the capital, which would be both uninteresting and unrealistic.
The assumptions also imply that there exists `∗ that maximizes output in the economy.15 We can then
write
Y = A(y∗ − φ(∆`)), (2)
where y∗ is the maximum level of output, ∆` ≡ `− `∗, and φ(∆`) is the output loss owing to a choice of
` different from `∗. Since y is strictly concave, φ is a convex function satisfying φ(0) = 0 (∆` = 0 is the
optimal choice), φ′(0) = 0 (optimality condition) and φ′′ > 0.
The spatial distribution of population also has implications for the effectiveness of fighting. Those
citizens who live in F incur extra costs if they want to join a rebellion to fight the incumbent regime.
14Note that output does not depend on p, which implicitly assumes that there is no difference between citizens and membersof the elite when it comes to production, but this assumption is immaterial to the implications of the model.
15To fix ideas, we can think of a country where resources are geographically concentrated (say, Egypt) as one where theoptimal arrangement from a production standpoint involves a low degree of isolation `∗; a country where they are spreadover the country’s territory (say, the United States) would exemplify a case of high `∗. Then again, the crucial point is thatthere is a cost to completely isolating the capital, and that this cost might vary across different contexts.
12

More specifically, for those in C , F units of fighting effort yield F units of fighting strength; in contrast,
for those in F , F units of fighting effort translate into F − T units of fighting strength, where T is a
positive constant. This provides us with a simple shortcut for capturing the special role played by the
capital city in rebellions against existing institutions.
Having laid out the role of the degree of isolation of the capital, we now turn to the role of governance.
We assume that the parameter A can take two values, depending on which of two technologies is used:
a home technology (A = 1) or a market technology (A = β > 1). The key distinction is that the market
technology is only feasible if checks and balances are being provided by a set of civil authorities. The
idea behind this assumption is that the more productive market technology requires public goods such
as protection of property rights and enforcement of contracts. To capture that in stark fashion, we can
assume that, in the absence of those checks and balances, the market technology is simply unavailable, or
equivalently, that any output obtained through the market technology is subject to expropriation. This
is what underlies our description of the power-sharing arrangement, in which checks and balances exist,
as constituting good governance.16
3.1.2 The Choice of Institutions
The incumbent army makes the key institutional decisions in the model. The choice variables are:
• Governance: the degree of power sharing;
• Degree of isolation of the capital: the location of citizens, meant to capture all policies that affect
the distribution of population relative to the capital;
• Allocation of resources: transfers between citizens and elite (which can be individual specific).
The choice of governance is about extending political power beyond the members of the incumbent
army. The upside of sharing power, as we have described, is that it allows for the use of the more
productive market technology. There is a downside, however, in that good governance requires sharing
rents with the civil authorities: all members of the elite must receive the same payoff. We take this as an
assumption, for simplicity, but Guimaraes and Sheedy (2012) show that this is a condition for the stability
of elite coalitions under the threat of rebellions. It follows that the choice of governance embeds a crucial
trade-off: sharing power entails better governance and a more productive economy, but also dilutes the
rents available to each member of the elite – in short, it entails a choice between a larger pie and taking
a larger slice of a smaller one.
An incumbent army that chooses good governance is free to choose any set of measure ξ of individuals
(outside the incumbent army) to comprise the set of civil authorities. However, since individuals are ex-
ante identical, identities are irrelevant. Therefore, the decision about governance boils down to a discrete
16The assumption that sharing power entails higher productivity is derived as a result in Guimaraes and Sheedy (2012).Intuitively, sharing power allows for the commitment to rules that would otherwise be time-inconsistent, and thus expandsthe set of feasible output levels.
13

choice. Good governance (s = G) means the incumbent army shares power with a measure ξ of individuals
(p = a+ ξ), which leads to higher productivity by enabling the use of the market technology (A = β). In
contrast, bad governance (s = B) implies the incumbent army refrains from sharing power (p = a), which
leads to lower productivity since individuals use the home technology (A = 1). Since all elite members get
the same reward, we can denote the consumption of an elite member under governance regime s by Cp,s.
The location of each citizen is also chosen by the incumbent army, implying that the equilibrium degree
of isolation of the capital city emerges as part of the equilibrium set of institutions. Needless to say, in
practice incumbent governments can seldom if ever simply choose where their citizens will live. This
stark assumption is rather meant to capture the idea that the institutional environment affects the spatial
distribution of individuals relative to the capital city through a number of policy levers: from internal
migration policies and specific economic incentives to populate certain areas to, most directly, the very
location of the capital city – changes of which, as we have seen, have been fairly often considered and
implemented. One should think of the isolation of the capital city emerging as part of a spatial equilibrium
where choices are made by individuals, but which is affected by institutional choices; our assumption is a
shortcut to focus on those choices.
Again, since identities are irrelevant, the decision about the location of each citizen boils down to the
choice of ∆`. Output is maximized for ∆` = 0, but the reduction in the fighting strength of individuals in
F means that the incumbent army might want to set a wedge between the actual degree of isolation and
what would maximize production. There is thus a trade-off between maximizing output and protecting
against the threat of insurgency.
Last, the incumbent army chooses transfers. There are no constraints on taxes and transfers other
than those imposed by the threat of rebellions, which ensures results are driven by the constraints on
the incumbent army imposed by the struggle for power and not by exogenous constraints on the set of
transfers. Let the consumption of citizen ı, facing a potentially individual-specific tax, be denoted by
Cw(ı), and Cp denote the consumption of a member of the elite. The overall budget constraint is thus:∫P
Cpdı+
∫W
Cw(ı)dı = Y. (3)
where P and W are the set of elite members and citizens, respectively. Any system of transfers between
individuals is feasible subject only to this budget constraint.
In sum, institutions stipulate the distribution of political power, the spatial distribution of individuals
and the distribution of economic resources, that is: the set of citizens (ı ∈W) in C and in F , and the set
of individuals who are in power (ı ∈ P), i.e. the elite; and the transfers of the homogeneous good that are
made between individuals.
3.1.3 Rebellions
Any choice of institutions will be potentially subject to challenges by rebellions, to which all citizens have
access in the same terms. Citizens can set up a rebel army, which is defined as a subset of citizens with size
14

a (a positive constant) and denoted as R ⊂ W. A successful rebellion destroys the existing institutional
setting, and the individuals in the rebel army become the incumbent army. They are then subject to the
emergence of other rebel armies that could challenge their power.
A rebellion is successful if the fighting strength of its rebel army is sufficiently large so as to overcome
the counterrevolutionary force interposed by the incumbent army. Each member of the incumbent army
has fighting strength δ, a parameter that represents the advantage held by the incumbent regime in
fighting a rebellion, and we assume for the moment that it implies no cost, in terms of effort or resources.
Naturally, the elite could also make choices that affect its power, and we will look at this possibility in
Section 3.3.4. We can summarize the condition for the success of a rebellion as:∫R
S(ı)dı > δa (4)
where
S(ı) =
F (ı) if ı ∈ CF (ı)− T if ı ∈ F
and
F (ı) = U′p − U(ı).
The LHS and RHS of (4) are the fighting strength of the rebel army, R, and of the incumbent counter-
revolutionary forces, respectively, given by the integral of the individual strength of its members. (We
assume that a “tie” is resolved in favor of the incumbent army.) In the case of the incumbent army,
each individual has fighting strength δ. As for the rebel army, S(ı) denotes the fighting strength of each
individual ı, which is given by his fighting effort, minus the cost T in the case of citizens located in F .
The fighting effort a rebel is willing to make is given by the difference between his utility in case the
rebellion succeeds and he gets to join the new elite (U′p) and his utility under current institutions, U(ı).17
A given set of institutions can only be sustained in equilibrium if it can resist any challengers: it must
leave no profitable opportunity for any group to rebel against it. Equation (4) therefore constitutes the
flipside of a no-rebellion constraint that has to be satisfied by any equilibrium choice of institutions by an
incumbent elite.
3.1.4 Democracy and Autocracy
The final element in describing the model is to define the objective function to be maximized by the elite
in their choice of institutions. In that regard, we assume that the elite operate either in a democratic or
autocratic regime, each of which constitutes a “superinstitutional” environment that constrains in different
ways what they are able to achieve. Specifically, we have:
17Throughout the paper, we use ′ to denote the value of a variable if current institutions are destroyed and replaced bynew institutions. Similarly, ′′ denotes the value of a variable after two rebellions have occurred and new institutions havebeen set up, and so on.
15

• Democracy: there exist “super institutions” that restrict those in power to maximizing the average
utility of everyone in the country.18
• Autocracy: there are no “super institutions” above those in power, so institutions are set up to
maximize the payoff Up of an elite member.
The existence and operation of these “super institutions” are assumed – we simply impose that under
democracy the incumbent army cannot “tear the constitution” and set up an autocratic regime more to
their liking – and hence transitions between the two types of regime are left beyond the scope of the
model. This stark distinction is thus a shorthand to capture the idea that incumbent elites face very
different constraints under a stable democratic regime, in which the well-being of average citizens looms
much larger than in autocracies, since their opinions can be expressed in competitive elections that can
lead to the regular removal of incumbents.
3.1.5 In Sum: Sequence of Events
We can thus summarize the workings of the model according to the following sequence of events:
1. A random set with measure a is drawn and becomes the incumbent army.
2. Institutions are chosen by the incumbent army. In the case of democracy, they maximize average
utility in the economy; in the case of autocracy, they maximize the utility of an elite member.
3. There are opportunities for rebellions: any other set of measure a can form a “rebel army”.
4. If a rebellion occurs, the winning army becomes the incumbent army and we are back to stage 2.
5. If no rebellions occur, production takes place (using either home technology or market technology).
6. In case of bad governance, agents who used the market technology have their production confiscated
by others. Then taxes and transfers are implemented according to the prevailing institutions, and
payoffs are received.
We now turn to the characterization of equilibrium.
3.2 Results: The Case of Democracy
We start off by considering the case of democracy. The key element to recognize is that in this case the
no-rebellion constraint is not relevant, because it never binds: belonging to the incumbent army entails
no benefit, because the new elite will be constrained to maximizing the welfare of the average citizen. In
light of that fact, the solution is very simple. Since utility is concave, average utility is maximized when
consumption across all individuals in the economy is equalized – which is feasible and imposes no further
18This assumption can be justified as arising from a probabilistic voting model, which typically entails a “mean voter”result.
16

restrictions on the problem of choosing institutions because consumption of elite members is equalized by
assumption and there are no constraints on taxes that can be imposed on citizens. Hence the problem of
the incumbent elite is simply to maximize output in the economy.
This extremely simple point follows immediately from our stark definition of a democracy, and it
underscores that the purpose of that definition is to describe contexts in which the possibility of forced
removal of incumbents by rebellions is essentially inoperative. In short, it is meant to capture what we
may call “established democracies” – places such as the United States or Sweden, where the threat of
rebellions is simply irrelevant for the behavior of incumbents.
In order to maximize output, the location of citizens is chosen so that ` = `∗. Moreover, good
governance is also chosen, as long as β > 1. Changes in `∗ affect the isolation of the capital city but
have no impact on governance, while T has no impact whatsoever because the threat of rebellion is not a
relevant constraint. The model thus predicts no relationship between governance and the isolation of the
capital city in established democracies.
3.3 Results: The Case of Autocracy
We now turn to the characterization of equilibrium institutions in the case of autocracy. Since there is
no uncertainty, maximization of utility by the elite is equivalent to maximization of consumption. Hence,
equilibrium institutions are the result of:
maxCw(·),∆`,sCp (5)
s.t.∫PCpdı+
∫WCw(ı)dı = Y,
and∫RS(ı)dı ≤ δa for all R ⊂W such that P(R) = a.
The first restriction is the overall budget constraint and the second is the set of no-rebellion constraints.
The maximization problem (5) depends on the utility of elite members U′p in case a rebellion succeeds.
Determining U′p then requires solving the maximization problem of the post-rebellion elite. Since this
elite is also subject to threats of rebellion, its constrained maximization problem is of an identical form
to that in (5), with U′p now being determined as a function of U′′p. This shifts the original problem to one
of determining the post-post-rebellion beliefs, and so on recursively, ad infinitum.
At all stages of this sequence of (hypothetical) events, elites solve a maximization problem of exactly
the same form, the only potential difference being beliefs about the actions of subsequent elites were they
to come to power through rebellions. In other words, there are no relevant state variables in the problem.
Given that individuals are ex ante identical, there is no fundamental reason for elites to make different
choices regarding institutions. Therefore it is natural to focus upon equilibria where outcomes (and hence
beliefs) are functions only of the fundamentals – that is to say, Markovian equilibria.
A Markovian equilibrium Cw(·),∆`, s can be found in two steps. First, the solution to (5) is ob-
tained taking as given C ′p – namely, the payoff that would be obtained by the elite that emerges from a
17

successful revolution. Second, we impose the condition of an identical elite consumption at each stage of
the maximization process (C ′p = C∗p), since the fundamentals remain unchanged across those stages.
The following proposition substantially simplifies the analysis:
Proposition 1 Any Markovian equilibrium must have the following properties:
(i) All citizens in C receive payoff
Uw,C = U′p − δ ⇒ Cw,C = C ′pe−δ.
(ii) All citizens in F receive payoff
Uw,F = U′p − δ − T ⇒ Cw,F = C ′pe−δ−T .
Proof 1 See Appendix A.1.
First of all, this proposition conveys the point that, in equilibrium, payoffs of citizens in each group are
equalized. To see why this is the case, note that the elites are constrained by the rebellion with the
strongest incentives for fighting – namely, the one comprised by the most disgruntled individuals. If there
were identical individuals who were getting paid more than the most disgruntled, it would be possible to
shuffle resources from the former to the latter, which would reduce their fighting effort and allow the elite
to extract more from citizens. As a result, equalization of payoffs in each group minimizes the amount of
fighting effort that could be put forth by the binding rebellion, or equivalently, yields the cheapest way to
buy off any rebellion.
Second, the proposition establishes that the difference in payoffs across groups is given by the differences
in the threat they represent. The extra cost of fighting (T ) is translated into lower utility for those in
F . Moreover, rebelling citizens have to overcome the elite’s defenses, given by δa, so a group of size a
of citizens in C will only rebel if rewards for launching a successful rebellion exceed δa. This yields the
payoff difference between elite members and citizens in C . The argument is similar for citizens in F , and
does not require a minimum size of the measure of citizens in any location, since citizens in C and in F
can always join forces in a rebellion.19
We can now derive closed-form expressions for the consumption levels of each group of citizens and
of the elite as a function of p, A and ∆`, which will be determined later. Note that aggregate output
A(y∗−φ(∆`)) has to be divided between p elite members, (1−p)(1− `) citizens in C and (1−p)` citizens
in F . The budget constraint (3) and Proposition 1 thus yield:
Cp =1
p
(A(y∗ − φ(∆`))− (1− p)(1− [`∗ + ∆`])C ′pe
−δ − (1− p)[`∗ + ∆`]C ′pe−δ−T
), (6)
19The assumption of log utility implies that the fighting effort an agent is willing to make depends on relative gains inconsumption. In consequence, the ratio of consumption of individuals in each group depends only on δ and T .
18

which is an expression of Cp as a function of ∆`, A and p. We have used Proposition 1 to replace the
consumption of each group of citizens with functions of C ′p.
In a Markovian equilibrium, it has to be the case that C ′p = Cp. Hence:
Cp =A[y∗ − φ(∆`)]
p+ (1− p)e−δ (1− [`∗ + ∆`](1− e−T ), (7)
Ccw = e−δA[y∗ − φ(∆`)]
p+ (1− p)e−δ (1− [`∗ + ∆`](1− e−T )), (8)
Cfw = e−δ−TA[y∗ − φ(∆`)]
p+ (1− p)e−δ (1− [`∗ + ∆`](1− e−T )). (9)
The numerator of the equations corresponds to aggregate output, which is divided among the agents in
the economy. In this division, each of the citizens in C receives exp(−δ)Cp and each of the citizens in F
receives exp(−δ − T )Cp, in accordance with the relative threat that they pose to the incumbent elite.
We now need to solve for the equilibrium choices of isolation of the capital city (`) and governance (s,
which determines p and A). The incumbent army chooses ` and s in order to maximize Cp as defined in
(6), taking C ′p as given. We then impose the equilibrium condition C ′p = Cp (equation (7)) to characterize
those equilibrium choices.
3.3.1 The isolation of the capital city
We start with the equilibrium choice of ∆`, which we can think of as representing the elite’s incentives
for locating the capital city in an isolated place. In order to simplify exposition, we will focus on interior
equilibria, where ` ∈ (0, 1).20 Taking the first-order condition of (6) with respect to ∆` yields:
Aφ′(∆`) = (1− p)C ′pe−δ(1− e−T ). (10)
The LHS of (10) shows the marginal efficiency cost of further isolating the capital. The RHS displays
the marginal benefit of the extra protection bought by that isolation: a more isolated capital makes it
cheaper to stave off rebellion, as citizens who are farther away represent a lesser threat and can thus
receive a lower level of consumption. The marginal benefit, quite intuitively, is greater when the decrease
in rebellion threat entailed by distance from the capital is steeper (T is large). It is also greater when
potential rebels have more to gain from a revolution (C ′p is large), because in this case the cost of buying
them off is higher, and hence reductions in this cost are more valuable.
Imposing the equilibrium condition C ′p = Cp on (10) yields
φ′(∆`) =[y∗ − φ(∆`)]e−δ(1− e−T )
p1−p + e−δ (1− (`∗ + ∆`)(1− e−T ))
. (11)
Because of the convexity of φ, the marginal efficiency cost of isolation is increasing in ∆`. The marginal
benefit, due to the impact of the protection offered by further isolating the capital on the elite’s ability
20Section A.5 in the appendix discusses conditions for a corner solution ` = 1, and shows that the implications of the modelare essentially unchanged.
19

to extract rents, is initially increasing: starting from the social optimum any increase in isolation has a
second-order effect on productivity, while the effect on rent extraction is first-order. The effect is concave
(and can be decreasing) because the convexity of the efficiency cost means that a smaller output will erase
the gains from the elite’s ability to obtain a bigger share.
The equilibrium yields the comparative statics that we summarize as follows:
Proposition 2 Comparative statics for the choice of ∆`:
(i) For a given s, ∆` is increasing in T ;
(ii) For a given s, ∆` is increasing in `∗;
(iii) For given parameters, ∆` is smaller when s = G.
Proof 2 The LHS of (10) is increasing in ∆`, equal to zero at ∆` = 0 and does not depend on `∗ and T .
It is shown in Appendix A.2 that C ′p is increasing in `∗ and T (Equations (15) and (16)). Moreover, the
term (1− e−T ) is also increasing in T . Hence increases in `∗ and T shift up the RHS of (10), leading to
a larger ∆`. That proves the first and second statements.
Keeping constant all parameters, the denominator of the RHS in (11) is increasing in p, so it is larger
if s = G. Hence good institutions shift down the RHS of (11) and lead to a smaller ∆`.
This proposition establishes two important points. First, parts (i) and (ii) identify two parameters
that are monotonically related to the equilibrium isolation of the capital city: an increase in T or `∗
(the optimal isolation of the capital city) will increase ∆`. The effect works through direct and indirect
channels. First, T affects the marginal benefit of increasing isolation: a higher impact of distance on the
cost of rebellion directly increases the effectiveness of isolating the capital city as a protection device. By
the same token, an increase in the optimal isolation of the capital city (`∗) obviously reduces its marginal
cost, one for one. In addition to the direct effects, increases in either T or `∗ also increase C ′p, which
again shifts up the marginal benefit. This effect is more subtle: greater T or `∗ increase the reward for
a successful rebellion, and hence the incentive to rebel. After all, better protection for the elite lets it
appropriate a larger fraction of output, but that also increases the value of becoming the new elite.21 A
stronger incentive to rebel in turn makes protection more important for the current elite. In short, a
greater T or `∗ makes isolating the capital city a more effective or cheaper tool of protection, and also
makes protection more valuable. All of these lead the elite to choose more isolation, i.e. a higher ∆`.
The second crucial point made by Proposition 2 is established by part (iii): better governance leads the
elite to choose a less isolated capital city. Intuitively, a society in which elites choose good governance is
one with more power sharing, hence the marginal rents from increasing rent extraction are diluted among
21This is akin to the logic of so-called “spoils politics” (e.g. Dal Bo and Powell 2009), whereby political power is used toappropriate the economic spoils associated with control of the state, and an increase in the ability to appropriate the spoilsinduces a greater incentive for outsiders to fight for that control.
20

more people – and moreover, there are fewer citizens to exploit. This means the elite has, on the margin,
less of an incentive to further isolate the capital in order to increase rent extraction.
Of course, this result is not enough to establish a negative correlation between the isolation of the
capital city and the quality of governance, because the latter is also determined endogenously. We thus
turn our attention to the equilibrium choice of governance.
3.3.2 Governance
How is the decision on governance influenced by the determinants of the isolation of the capital city?
We know from Proposition 2 that the latter is monotonically increasing in the socially optimal degree of
isolation (`∗) and in the additional cost of rebellion faced by the citizens who are away from the capital
(T ). We will thus study how `∗ and T affect the choice of governance. Keeping in mind that the elite will
choose good governance (s = G) if Up,G > Up,B, we can state the following:
Proposition 3 For given parameters ξ, a, δ, β, y∗ and function φ:
(i) Fix T . Let ¯∗ be such that Up,G = Up,B when `∗ = ¯∗. Then s = G if and only if `∗ < ¯∗.
(ii) Fix `∗. Let T be such that Up,G = Up,B when T = T . Then s = G if and only if T < T .
Proof 3 See appendix A.3
Good governance is chosen if `∗ or T are small enough: if it is efficient to have many people in the
capital, or if those who are far from the capital cannot be so heavily taxed because they can easily rebel,
the elite chooses to share power. The proof shows that Up is always increasing in T and `∗, but that the
derivative is larger in case of bad governance, implying that a more isolated capital benefits the elite, but
especially so in case power sharing is kept to a minimum.
The intuition for this result stems from key fact that sharing power allows for larger productivity but
requires sharing rents. When the capital city is more isolated, the average citizen poses a smaller threat
to the incumbent regime and can thus be more exploited. Hence the elite will grab a larger fraction of
output. This ability to extract a bigger slice means that the elite are less concerned with making the pie
as a whole bigger, and as a result they are less inclined to share rents and power.
Combining Propositions 2 and 3, our central result becomes clear: There is a negative correlation
between the quality of governance and the degree of isolation of the capital city. Excessively isolated
capitals benefit the ruling elite, but through bad governance and lower productivity they harm society as
a whole.
3.3.3 Capital city premium
In addition to generating our basic stylized fact, our framework also yields additional testable predictions.
The first of them concerns the relationship between the income premium earned by those who live in
21

the capital city and the degree of isolation of the capital. Citizens who live in the capital city earn a
premium because they pose a greater threat to the incumbent elite, and equations (8) and (9) imply that
this premium is given by:
ρc,f = eT
The intuition is clear: the premium is increasing in the disadvantage faced by citizens who are away from
the capital in threatening the elite with a rebellion, as those citizens can then be further exploited.
Since Proposition 2 implies that the isolation of the capital city is monotonically increasing in T , it
follows that greater isolation will be correlated with a larger premium enjoyed by those who live in the
capital. A lower threat of rebellion by outsiders increases the relative exploitation of those outsiders and
also leads the elite to choose a more isolated capital city.
3.3.4 Military spending
Since the institutional environment is calibrated by the elite specifically so as to avoid rebellions, there
are no actual rebellions in equilibrium. That said, the correlation between isolation of the capital city and
the quality of governance is driven by the threat of rebellion. It is thus interesting to ask whether there is
evidence of any link between the concentration of population around the capital and the level of concern
displayed by elites regarding that possibility.
In order to think more systematically about that, we can extend the basic model by assuming that the
elite can spend resources to increase its military power, in order to make rebellions more costly. Suppose
the elite can buy guns, denoted by g, which affect the power of the incumbent army: power is now δ(g),
with δ′ > 0 and δ′′ ≤ 0. For the sake of simplicity, we assume that guns are imported.
The elite now chooses not only transfers, the degree of isolation of the capital city (∆`) and governance
(s), but also g. Subsequent elites will also face similar decision problems and, in a Markovian equilibrium,
g = g′ (as well as ∆` = ∆`′, s = s′ and Cp = C ′p). The results in Proposition 1 remain unchanged (except
that δ(g) replaces δ), but the budget constraint (3) changes, so the expression in (6) is replaced by
Cp =1
p
(A(y∗ − φ(∆`))− g − (1− p)(1− [`∗ + ∆`])C ′pe
−δ(g) − (1− p)[`∗ + ∆`]C ′pe−δ(g)−T
)The first order condition with respect to g now yields
(1− p)(1− [`∗ + ∆`][1− e−T ]
) (C ′pe
−δ(g)δ′(g))
= 1, (12)
and the expression in (7) becomes
Cp =A[y∗ − φ(∆`)]− g
p+ (1− p)e−δ(g) (1− [`∗ + ∆`](1− e−T ))(13)
Substituting C ′p = Cp from (13) into (12), we get(1− [`∗ + ∆`][1− e−T ]
)(A(y∗ − φ(∆`))− g) δ′(g)
p1−pe
δ(g) + (1− [`∗ + ∆`][1− e−T ])= 1, (14)
and from this we obtain:
22

Proposition 4 Military spending g is decreasing in `∗ and in T .
Proof 4 See appendix A.4
This proposition, in tandem with Proposition 2, implies a negative correlation between ` and g. In
other words, a more isolated capital city will be associated with lower levels of military spending, insofar
as the latter is driven by the elite’s desire to protect against domestic rebellion. Military spending and
isolated capitals are substitutes in protecting the elite: when it is cheap to obtain protection by isolating
the capital – such as when there is relatively little inefficiency in doing so (high `∗), or when it is effective
in staving off rebellion (high T ) – the elite chooses to do so, and there is less need to invest in military
protection. Quite simply, there is little additional gain from buying expensive guns to further exploit
those who are already poor. Hence increases in T and `∗ reduce the marginal benefit of increasing power
(δ) (the LHS of (12) and (14)), leading to a lower g.22
3.4 In Sum
Our framework, relying on the connection between the spatial distribution of population and the threat of
rebellion, predicts that isolated capital cities will be associated with misgovernance. The link emerges as
an equilibrium outcome in which causality runs both ways. Isolated capital cities lead to misgovernance,
because they provide incentives for the elite to forsake power sharing, which is the key behind better
governance. However, it is also true that misgovernance increases the incentives to isolate the capital city,
as the ability to limit the sharing of resources makes it more appealing to further exploit citizens – and
reducing the rebellion threat they pose, by isolating the capital city, facilitates that exploitation.
The framework also yields a number of additional testable predictions. Chief among them is that the
link between isolated capital cities and misgovernance is a feature of non-democratic contexts only. The
link vanishes to the extent that, in an established democracy, rebellion threats are not a relevant source
of checks on incumbent regimes. Second, our framework pinpoints a specific mechanism linking isolated
capitals and misgovernance – namely, their impact on the incentives to share power.
Last but not least, the theory also yields ancillary testable predictions, which are not as central to
the logic of the model but can nonetheless be used to further check its explanatory power. The model
predicts that individuals living in the capital city will enjoy an income premium over what is left to the
population that is far from the capital, because of the greater political threat that they represent, and
this will be positively correlated with the isolation of the capital city. It also predicts that the isolation
of the capital city will be negatively correlated with direct measures that the elite may resort to in order
to defend against the rebellion threat. We interpret this as a negative correlation with military spending,
insofar as the latter is often driven, to a substantial extent, by a concern with domestic rebellions.
22Note that there is again an indirect effect through C′p: high values of ` also imply that the benefits from rebellions arelarge, as they increase the value of becoming the new elite. This operates in the opposite direction, increasing the incentivesof the current elite towards buying guns. However, from (14) it is clear that the direct effect dominates: the effect of T and`∗ on the numerator of the LHS is more important than the effect on the denominator.
23

4 Isolated Capital Cities and Misgovernance: Empirical Evidence
We can now go to the data in order to check whether there is support for our model’s predictions. Table 2
contains our benchmark results, with the first principal component of the six WGI measures as our main
dependent variable of interest. (All tables report coefficients estimated for the standardized variables, so
that they should be interpreted in terms of standard deviations, as computed for the full sample.)
[TABLE 2 HERE]
The first two columns confirm the basic message from Figures 1 and 2, showing a negative correlation
between the degree of isolation of a country’s capital city and the quality of governance. This correlation
is statistically significant, and robust to a wide range of control variables that are often associated with
governance – ranging from GDP per capita, urbanization, and population, to ethnic fractionalization and
characteristics of the political system (such as the presence of majoritarian elections or of a presidential
system), as well as regional and legal origin dummies.23 (All control variables in our analysis are averaged
over the same period for which the governance measure is calculated, 1996-2006, unless noted otherwise.)
This reassures us that what we are picking up is indeed related to the role of the capital city and its
interaction with governance, as opposed to confounding factors.
The first crucial prediction of our model is that the link between isolated capitals and misgovernance,
but only in non-democracies. To assess it without imposing much structure on the data, we start off with
a semi-parametric approach. Specifically, we model the potentially heterogeneous effect of the isolation of
the capital on the quality of governance as a non-parametric function of the well-known Polity measure
of democracy-autocracy (denoted as p) as follows: WGIi = α(pi) + β(pi) ∗AvgLogDistancei +XiΓ + εi,
where Xi stands for the basic control variables as in Column (1) of Table 1. For each value of p along
a 50-point grid over the [−10, 10] range, we run a local linear regression of WGIi on AvgLogDistancei,
using the Epanechnikov kernel with a bandwidth of 10, to obtain an estimate of β(p).24
The resulting function is plotted in Figure 3. We can see a patern in which a significant negative
coefficient is found for relatively autocratic countries, at the lower end of the range, while for the more
democratic countries the coefficients are much smaller in absolute value, and statistically indistinguishable
from zero. This is clearly consistent with our prediction, and suggests a threshold around a Polity score
of zero. This threshold roughly translates into the bottom tercile of our sample, which is delimited by a
Polity score of 0.4.
23Our results are also robust to including educational achievement as a control variable, as measured by total years ofschooling in 1995 (from the Barro-Lee dataset). We choose not to include it in our main specifications because it is veryhighly correlated with income per capita (around 0.75 in the full sample), and ends up being statistically insignificant in allspecifications. The results are also unaltered if we control directly for population density, which we do not do in the mainspecifications because we already include a control for population and the adjustment for country size implicit in our measureof concentration. Last but not least, the results are robust to including a comprehensive set of geographical and historicalcontrol variables, including an island dummy, length of coastline, date of independence, and presence of natural resources.All of these are immediately available upon request.
24The observed pattern is much similar across a wide range of cross-validated bandwidths (see Li and Racine 2006, ch. 2).
24

[FIGURE 3 HERE]
In fact, we can use this threshold to revisit the raw data as depicted in Figures 1 and 2. Figures 4 and
5 contrast the subsample of relatively autocratic countries (henceforth “autocracies”), as defined by the
bottom tercile of our distribution, with another of countries we can deem to be full-fledged, established
democracies, as defined by a Polity score above 9. Figure 4 shows that the difference in governance scores
between countries with more isolated capitals and those with less isolated capitals is apparent only for
the subsample of autocracies. Figure 5 in turn shows the scatterplots for the two subsamples: there is
essentially no correlation in the group of established democracies, whereas a strong positive association
emerges in the sample of autocracies.25 In other words, the picture uncovered in Figures 1 and 2 actually
masks very distinct patterns across autocracies and democracies, as suggested by the theory.
[FIGURES 4 AND 5 HERE]
This central message is underscored by the systematic evidence in the remainder of Table 2. Columns
(3)-(4) show that the negative correlation between isolated capitals and the quality of governance is indeed
particularly pronounced in the autocratic countries, in spite of the relatively small sample size. This is in
stark contrast with Columns (5)-(6), which show that the correlation is essentially non-existent in those
countries with established democracies. In fact, in spite of the relatively high standard errors, especially
in the sample of democracies, we can specifically reject (p-value = 0.0054) the hypothesis of equality of
coefficients on the concentration of population around the capital across the two subsamples. Last but
not least, Columns (7)-(8) show that the same message is conveyed by the full sample, if we include an
interaction term between the isolation measure and an autocracy dummy. Put simply, our model’s central
prediction is borne out by the data.
Based on these results, we can also assess the quantitative importance of the correlation. Since we
report standardized results, it is easy to interpret the coefficients: a one-standard-deviation increase in
the isolation of the capital (computed over the distribution for the entire sample) is associated with a
decrease in the measured quality of governance of just over 0.3 standard deviation, in the context of the
full specification for the subsample of autocracies (Column (4)). To make this more concrete, consider
the thought experiment of increasing the isolation of the capital from about average among autocracies
(approximately that of Nairobi in Kenya) to one standard deviation above it (roughly that of Sudan’s
Khartoum). As it turns out, the quality of governance in Kenya is also measured as about average for
our sample of autocracies, whereas Sudan’s is among the very worst in the world – better only than
Iraq, Afghanistan, and Liberia. The estimated coefficient suggests that the increase in isolation would
be associated with a decrease in the quality of governance that corresponds to about 40% of the actual
difference between the two countries.
25The correlation, as well as all the regression results that follow, are robust to the exclusion of Singapore, which seems tobe an outlier in terms of governance among the countries in this subsample.
25

We can also use the data to unpack the different dimensions of governance, based on the mechanism
highlighted by the theory, in order to further assess its plausibility. Consider first the different component
measures of the WGI. As we have noted, the six measures are highly correlated with one another, and
in light of that one might expect that they would display a similar relationship with the isolation of the
capital if considered separately. As it turns out, this is true of five of the six measures – results which we
do not show, for the sake of brevity, but are readily available upon request. It is not the case, however, for
Political Stability. Panel A in Figure 6 shows that the coefficients obtained from local linear regressions
are statistically indistinguishable from zero, and with no apparent difference with respect to autocracies
versus democracies. This suggests that isolated capital cities are associated with worse governance across
all dimensions, except that they are not linked to the political system being less stable.
[FIGURE 6 HERE]
This is not surprising when looked at through the lens of our framework: while it has no rebellions
in equilibrium, the fact is that isolating the capital city is a rebellion-preventing measure. As such, we
would not expect from our framework that incumbent regimes would necessarily be less stable when the
capital is more isolated.26 In contrast, this is quite unlike what one would expect from alternative stories
that one might concoct to explain the connection between isolated capitals and poor governance.27
Another way to unpack the meaning of governance is to look at a measure of government performance
that is unrelated, at least directly, to the political incentives of rulers and elites as it pertains to power
sharing or political survival. One such measure has been proposed by Chong et al (2012), to isolate the
government’s ability to perform a simple task effectively: the average number of days it takes a country’s
post office to return letters sent to non-existent addresses in the countries’ five largest cities. Of course,
this measure ought to be correlated with broader measures of governance, not the least since one might
imagine that less accountable governments could be more likely to pursue actions that would result in
ineffective provision of services – say, by packing the post office with incompetent political appointees.
(In fact, the raw correlation with the WGI principal component in our sample is substantial, at −0.72.)
Still, we would not expect it to respond directly to the incentives highlighted by our theory.
Indeed, Panel B in Figure 6 shows that, in spite of that high correlation with governance, we find
no correlation between that measure of government performance and the isolation of the capital city –
and again with essentially no distinction between democracies and autocracies. This provides compelling
26It is possible to extend our framework to consider the possibility of equilibrium rebellions by introducing stochastic shocksto the conflict technology (say, δ). In such a model, an exogenous increase in the isolation of the capital would tend to makethe elite choose more, and not less, stability – this is so because staying in power is worth more due to the high rents affordedby an isolated capital. While the model would be overall much less transparent in its workings and predictions, because ofinteraction effects linking the choice of stability to those of governance (power sharing) and isolation, it would not imply thata more isolated capital would be associated with more political instability. (More on this is available upon request.)
27For the sake of an example, consider a story where, if the capital is somehow located in an isolated place, the state has aharder time taxing its citizens and developing its fiscal capacity, the lack of which leads to bad governance. Besides beggingthe question of why an incumbent regime would refrain from moving its capital to a more favorable location, such a storyabout a relative lack of control over the population would lead us to expect that this would be a more fragile, unstable regime– as suggested by Herbst (2000), in a different context, with respect to low population densities in Africa.
26

evidence that the stylized fact we detect is not an artifact of some correlation between isolated capitals
and generally low state capacity that is unrelated to the kind of forces our theory underscores.
The strong association between isolated capital cities and poor governance, as well as the fact that
it is present only in relatively non-democratic contexts, is not only robust to the many control variables
that are considered in Table 2, but also holds under different ways of measuring the degree of isolation
of the capital and the quality of governance. We consider three alternative measures of isolation: (i) an
“unadjusted” version of the AvgLogDistance measure that does not adjust for the geographical size of the
country and thus weighs distances in the same way no matter if a country’s territory is large or small;28
(ii) the (log of the) distance between the actual capital and the least isolated place in the country;29; and
(iii) capital primacy, namely the share of the country’s population living in the capital city as officially
delimited, which is an inverse measure of isolation. The pairwise correlations between these variables and
(adjusted) AvgLogDistance in our sample – 0.62, 0.59, and -0.37, respectively – clearly show that the
measures are related, as expected, but substantially different nonetheless. In particular, capital primacy
is a rather unsatisfactory measure, as it relies on arbitrary definitions of what counts as the capital city
and discards all the information on the spatial distribution outside of that arbitrarily delimited city, and
the lower correlation underscores that it is indeed noisier. It is nevertheless sufficiently common so as
to warrant checking. As for the quality of governance, we use another measure, the Rule of Law index
compiled by Freedom House, which also gives us a sufficiently wide coverage in terms of the number of
countries – and particularly of non-democratic ones. (We rescale the index so that higher scores correspond
to better governance.)
[TABLE 3 HERE]
The results are shown in Table 3. Columns (1)-(4) reproduce the specifications for autocracies and
established democracies, respectively from Columns (4) and (6) in Table 2, but looking at unadjusted
AvgLogDistance and the distance to the least isolated place, respectively, as key independent variables.
In both cases we see a similar negative, statistically significant correlation between isolated capital cities
and quality of governance, for the autocracy subsample only. Note that the results are not too far,
quantitatively speaking, from what we found in our baseline.
Columns (5)-(6) then consider the coarser measure, capital primacy. Unfortunately, our data on
capital city populations is considerably more sparse, so in order to obtain reasonable sample sizes we
consider an “autocracy” threshold at the median Polity score in our distribution (equal to 6). We see
28Specifically, instead of setting the normalization parameter α so that a measure of zero corresponds to the entire populationof a country being as far away from the capital as would be possible in that specific country, it sets that benchmark as havingthat population be as far away from the capital as would be possible in any country. (In this case, only the country thatcontains that largest possible distance, the United States, could conceivably be assigned a measure of zero: if all its populationwere on the Midway Islands, in the Hawaiian archipelago.)
29Notably, for most countries the least isolated location is the country’s largest city, which often turns out to be the capitalcity itself. The exceptions are illustrative: in China, it is close to Zhengzhou, the largest city in that country’s most populousprovince (Henan); and similarly for India, where it is also in the most populous state (Uttar Pradesh). In the US, it isColumbus, OH, right in the middle of the large population concentrations of the East Coast and the Midwest.
27

evidence of a positive correlation between less isolation and better governance, only for the subsample
of autocracies (Column (3)). Note also that the estimated coefficients are considerably smaller and less
precisely estimated, consistent with substantial measurement error being introduced by the coarseness of
the measure.
In addition, Columns (7)-(8) repeat the same exercise with the Freedom House measure of governance
– reverting back to using our standard tercile threshold for autocracies, and AvgLogDistance as our key
independent variable. The results are very much consistent, which is unsurprising given that the measures
of governance are very highly correlated (in excess of 0.80). Still, and particularly with our small samples,
it is reassuring to learn that the results are not very sensitive to that choice of measures.
The last column in Table 3 then addresses a different robustness exercise: whether the results are
indeed driven by the role of the capital city itself, as opposed to other correlated features of the spatial
distribution of population. Specifically, it could be that relatively isolated capital cities often correspond to
the existence of a major economic center away from the capital, like Istanbul or Sao Paulo or Lagos. This
could be associated with another elite based in that other city, which might be conducive to misgovernance
in different ways – say, through their own predatory behavior, or through disputes with the political elites
situated in the capital. In order to check that our results are not driven by this type of mechanism, we
compute our measure of isolation AvgLogDistance with respect to the largest city in each country, other
than the capital itself (as of 2000).30 This is either the country’s largest city or, more often, its second
largest, since the capital is also the largest city in about five out of six countries. Column (9) shows,
using a specification akin to that of Column (8) in Table 2, that our results are essentially unaffected,
qualitatively or quantitatively, when we control for the degree of isolation of the other largest city.31 This
suggests that what we find indeed relates to the special role of the capital city.
We now turn to the question of whether we can shed direct light on the power sharing mechanism
highlighted by the theory: is there any empirical connection between the isolation of capital cities and
the degree of power sharing? We tackle this question by looking at the Polity IV data set. We have
used the so-called Polity measure to parse the sample between democracies and autocracies, but the data
contain more information that can be used to shed light on more subtle distinctions. In particular, the
Polity measure aggregates the content of several other measures – and the extent to which they can be
interpreted as relating to the degree of power sharing varies considerably.
Out of the four variables aggregated into the Polity IV index of Democracy, two are described as
pertaining to either the realm of “independence of executive authority” (ExecutiveConstraints) or to
that of “political competition and opposition” (ParticipationCompetitiveness). The former refers to
“the extent of institutionalized constraints on the decisionmaking powers of chief executives” (Marshall,
Jaggers, and Gurr 2011, p. 24), ranging from “unlimited authority” to “executive parity or subordination”.
30The correlation between this measure and the isolation of the capital city is around 0.53 – substantial but far fromoverwhelming.
31The results are the same if we split the sample between autocracies and established democracies. The coefficient on theisolation of the other largest city is small and statistically insignificant (available upon request).
28

The latter in turn captures “the extent to which alternative preferences for policy and leadership can be
pursued in the political arena” (p. 26), and ranges from “repressed” to “competitive”. These are clearly
related to the degree of power sharing that exists within a political system: an unchecked executive and
a limited scope for political competition are clear signals of concentration of power.
A first look at how these measures relate to the isolation of the capital city can be had by revisiting the
instances of capital city moves that were listed in Table 1. Table 4 reproduces that list, excuding the cases
of partial capital moves, but also adding two columns describing the changes in ExecutiveConstraints and
ParticipationCompetitiveness from ten years before to ten years after the date of the move (or closest
date available). We see that on average there is a substantial drop in the two measures, which is indeed
statistically distinguishable from zero in the case of ParticipationCompetitiveness, in spite of the very
small sample. This indicates that the capital city moves are typically accompanied by more concentrated
power, consistent with the idea that increasing the isolation of the capital allows incumbent regimes to
get away with less power sharing.
[TABLE 4 HERE]
We can then ask whether the pattern linking the isolation of capital cities with less power sharing holds
more systematically. Table 5 starts off, in Column (1), by looking at the aggregate Polity measure and
how it relates to the degree of isolation in autocracies. Here we again define autocracies using the median
threshold, since there is naturally considerably less variation in the Polity components in the bottom
tercile. We see a significant negative correlation, indeed showing that countries with isolated capital
cities tend to display institutions that are farther from the democratic ideal. This connection is brought
into sharper focus, however, when we look at the power sharing measures of ExecutiveConstraints and
ParticipationCompetitiveness, in Columns (2) and (3) respectively. The quantitative implications are
in fact very similar to what we found for our measures of governance. In sum, countries with isolated
capitals seem to display particularly low marks when it comes to the degree of power sharing in their
political systems.32
[TABLE 5 HERE]
Interestingly, the relationship with isolated capital cities is much weaker, and statistically insignificant,
for the other two component measures (RecruitmentCompetitiveness and RecruitmentOpenness), as
shown in Columns (4)-(5).33 These latter measures have to do with “executive recruitment”: roughly
put, competitiveness has to do with whether competitive elections exist, and openness is about whether
there is hope for citizens to achieve executive positions through a regularized process. Note also that the
32The results are once again very different when we consider the sample of democratic countries. While there is much lessvariation within that group of countries in terms of the dependent variables of interest, it is still the case that no connectionwith the isolation of the capital is detected.
33In spite of the small samples, the equality of coefficients between combinations of Columns (2)-(3) and Columns (4)-(5)can be decisively rejected at standard levels of confidence, with the exception of that between Columns (2) and (4).
29

coefficient on the openness variable, while very imprecisely estimated, is of a similar size to the “power
sharing” coefficients, in absolute value, but of the opposite sign.
This measure of openness in particular, while clearly related to democracy, does not speak directly to
how power is shared between different groups in society. For instance, countries receive a maximum score
in the openness measure essentially as long as succession is not hereditary – which allows, for instance,
the post-Stalin Soviet Union, no one’s idea of a regime with widespread power sharing, to achieve that
maximum score. Naturally, all four measures tend to be correlated, so that countries with high degrees of
power sharing will typically score high in the recruitment measures as well. It is nevertheless interesting
that RecruitmentOpenness is the least correlated with the other three, and particularly so with the power
sharing measures: 0.59 and 0.47, when the pairwise correlations between the other three is never below
0.83. This suggests that it should indeed be interpreted as addressing other aspects of the institutional
setting.
Beyond this direct evidence, we can also check our model’s ancillary predictions, as established in
the previous section. In order to measure the capital city premium, we look at data from the McKinsey
Global Institute (Dobs et al. 2011), which estimate city-level income per capita, in 2007, for 600 cities
around the world. Out of these, 77 are country capitals, and for all these countries we compute the capital
city premium as the ratio between the capital’s income per capita and the countrywide GDP per capita
that we have used in the previous analysis. By the same token, we proxy investment in military strength
by the amount of military expenditures pursued by a country’s central government, as a percentage of
total central government expenditures, averaged between 1990 and 2006 (from the World Development
Indicators).
Because the sample size is now smaller, in light of the limited number of countries for which we have
data on income per capita for the capital city (particularly among non-democracies), we will now split
the sample between autocracies and democracies according to median of the average of the Polity score
between 1975 and 2000, which is at around 3.1. (We stop at 1975 in order to restrict ourselves to the
post-decolonization period.) This helps us obtain a reasonable sample size of autocracies, in contrast with
the more recent time period used in Tables 1-5.34 On the other hand, going back to this less democratic
period greatly restricts the sample of countries with a Polity score above 9. For this reason, we contrast
the autocracy sample with the set of countries with scores above the median threshold. All in all, we are
still left with a small sample, and for that reason we have to be especially parsimonious when it comes to
the set of control variables.
Table 6 displays the results of a simple regression analysis along the lines of Table 2. The aforemen-
tioned data caveats aside, we see a positive correlation between the capital city premium and the isolation
of the capital in autocracies. This correlation is quantitatively considerable, being actually larger in size
34The median Polity score if we were to use the more recent period, for the subsample over which we have data on incomeper capital in the capital, would be 7.5. This seems way too high to identify non-democracies: it would include as such, forinstance, countries like South Korea (in the 1990s-2000s), which seems unreasonable.
30
than what we found in the case of governance. In other words, the inhabitants of isolated capital cities of
autocratic countries earn a substantially larger premium over the rest of the population. This correlation
is exactly what was predicted by our model. It could certainly be the case that omitted factors are also
influencing this correlation, but it is telling that once again, as shown by Columns (2)-(3), this connection
does not extend to those countries that are more democratic, just as we would expect from our framework.
[TABLE 6 HERE]
Table 6 also shows that autocratic regimes facing a population that is more concentrated around its
capital city will spend significantly more with the military than regimes with isolated capitals. This is
exactly in line with the model’s prediction: isolated capital cities work as protection against rebellion
threats, and hence obviate the need for further protection. The same is not at all true of relatively
democratic regimes, which again reaffirms the model’s logic.35
Of course, the use of military spending as our proxy for anti-rebellion investment is obviously predicated
on the assumption that this kind of spending is driven to a substantial extent by this sort of domestic
concern. In that regard, note that we include as a control variable a dummy for whether the country
has been involved in an interstate conflict between 1975 and 2007, as coded by the Correlates of War
dataset. Quite strikingly, the number of wars falls short of statistical significance in autocracies – though
the coefficient is not exactly small – which seems to underscore that the domestic threat seems to be a
key driver of the military spending decision. This is again unlike what happens in relatively democratic
contexts, as illustrated by Column (5).
In sum, the evidence seems to lend additional support to the mechanism highlighted by our theory to
explain the connection between isolated capital cities and misgovernance. An isolated capital serves as
bulwark against the threat posed by rebellions; this means that regimes that are thus protected are better
able to extract rents from those who are far from the capital, and less inclined to spend resources on the
additional protection provided by military strength.
5 Concluding Remarks
Motivated by a simple, novel stylized fact – that countries with relatively isolated capital cities display
worse governance – this paper has developed a model of endogenous institutions where an autocratic
elite’s choices are constrained by the threat of rebellion, and where the threat posed by any individual
as a potential rebel decreases with her distance to the seat of power. In this model, isolated capital
cities allow the elite to extract more rents from citizens without triggering a rebellion, leading to a large
income gap and hence decreasing incentives for power sharing and the better governance associated with
it. Conversely, broader power sharing discourages the choice of an isolated capital city, since it leaves the
35Results are similar if we use arms imports (averaged between 1990 and 2006) as our dependent variable. (Results availableupon request.)
31
elite with relatively lower rents to protect. The evidence shows that the stylized fact holds robustly and,
as predicted by the model, only for relatively non-democratic countries. It also shows that there is no
correlation between the isolation of the capital city and dimensions of government performance unrelated
to the incentives our model highlights. Last but not least, we also find direct evidence that isolated capital
cities are linked with less power sharing, and for the model’s additional predictions, on the premium earned
by those who live in the capital and on the elite’s willingness to invest in military protection.
This underscores the importance of the spatial distribution of the population as a source of informal
checks and balances over autocratic regimes. As long as we care about the quality of governance – either
as an end in itself or as a means of fostering development – the lesson is that one should be especially
attentive to those countries where the spatial distribution is particularly inimical to accountability, e.g.
those regimes that are able to ensconce themselves in an isolated capital. Isolated capitals in weakly
institutionalized contexts should thus be seen as both a symptom and an enabler of misgovernance.
Our results also let us unpack the meaning of misgovernance: the constraints on the behavior of
incumbents are ultimately imposed by the threat of violent removal from office. This lies beyond the
scope of our model but, assuming that the implied political instability is costly (e.g. Alesina et al 1996),
it highlights that such informal checks and balances may well come at a price (e.g. Campante and Glaeser
(2009), on the case of Argentina).
As a final note, we should point out that the framework we have developed can presumably be used to
understand other phenomena related to the threat of revolutions and the response of incumbent regimes to
such threat. In this paper, the variable that affects the extent to which an individual or group represents
danger to an incumbent elite is their distance to the seat of political power, but we can think of other
factors that may act in similar ways – for instance, Glaeser, Ponzetto, and Shleifer (2007) emphasize the
role of education in facilitating coordination among potential rebels. Applying our framework to these
other contexts, we can sketch a theory of incumbent regimes that may choose to pair less power sharing
and worse governance with, say, less human capital. We leave these applications as promising avenues for
future research.
6 References
Acemoglu, Daron (2006). “Modeling Inefficient Institutions.” In: Richard Blundell, Whitney K. Newey,and Torsten Persson (eds.) Advances in Economics and Econometrics, Volume 1: Theory and Ap-plications, Ninth World Congress (Econometric Society Monographs). Cambridge, UK: CambridgeUniversity Press.
Acemoglu, Daron, Simon Johnson, and James A. Robinson (2005). “Institutions as a Fundamental Causeof Long-Run Growth .” In: Philippe Aghion and Steven N. Durlauf (eds.), Handbook of EconomicGrowth, Vol. 1A, Elsevier, p. 385-472.
Acemoglu, Daron and James A. Robinson (2005). Economic Origins of Dictatorship and Democracy.Cambridge, UK: Cambridge University Press.
Ades, Alberto F. and Edward L. Glaeser (1995). “Trade and Circus: Explaining Urban Giants.” Quar-terly Journal of Economics 110(1): 195-227.
32

Alesina, Alberto, Arnaud Devleeschauwer, William Easterly, Sergio Kurlat, and Romain Wacziarg (2003).“Fractionalization,” Journal of Economic Growth 8: 155-194.
Alesina, Alberto, Sule Ozler, Nouriel Roubini, and Phillip Swagel (1996). “Political Instability andEconomic Growth.” Journal of Economic Growth 1(2): 189-211.
Ashraf, Quamrul, Oded Galor and Omer Ozak (2010). “Isolation and Development”. Journal of theEuropean Economic Association 8(2-3): 401-412.
Baland, Jean-Marie, Karl Ove Moene, and James A. Robinson (2009). “Governance and Development.”In: Dani Rodrik and Mark Rosenzweig (eds.), Handbook of Development Economics, vol. 5, Elsevier,p. 4597-4656.
Besley, Timothy and Torsten Persson (2009). “The Origins of State Capacity: Property Rights, Taxation,and Politics”. American Economic Review 99 (4) :1218-1244.
Besley, Timothy, Torsten Persson, and Marta Reynal-Querol (2012). “Political Instability and Institu-tional Reform: Theory and Evidence.” London School of Economics (unpublished).
Bezucha, Robert J. (1974). The Lyon Uprising of 1834: Social and Political Conflict in the Early JulyMonarchy. Cambridge, MA: Harvard University Press.
Braudel, Fernand (1986). L’Identite De La France, 2 vols. Vol. 1: Espace Et Histoire, Vol. 2:Les Hommes Et Les Choses. Paris: Arthaud-Flammarion, 1986.
Bueno de Mesquita, Bruce and Alastair Smith (2009). “Political Survival and Endogenous InstitutionalChange.” Comparative Political Studies 42(2): 167-197.
Campante, Filipe R. and Quoc-Anh Do (2010). “A Centered Index of Spatial Concentration: ExpectedInfluence Approach and Application to Population and Capital Cities.” Harvard Kennedy School(unpublished).
Campante, Filipe R. and Quoc-Anh Do (2012). “Isolated Capital Cities, Accountability and Corruption:Evidence from US States.” Harvard Kennedy School (unpublished).
Campante, Filipe R. and Edward L. Glaeser (2009). “Yet Another Tale of Two Cities: Buenos Aires andChicago.” NBER WP 15104.
Center for International Earth Science Information Network (CIESIN), Columbia University; and CentroInternacional de Agricultura Tropical (CIAT), (2004). “Gridded Population of the World (GPW),Version 3”, Columbia University. Available at http://beta.sedac.ciesin.columbia.edu/gpw.
Chanda, Areendam and Louis Putterman (2005). “State Effectiveness, Economic Growth, and the Age ofStates.” In: Matthew Lange and Dietrich Rueschemeyer (eds.), States and Development: HistoricalAntecedents of Stagnation and Advance, New York: Macmillan.
Chong, Alberto, Rafael La Porta, Florencio Lopez-de-Silanes, and Andrei Shleifer (2012). “Letter Grad-ing Government Efficiency.” Harvard University (unpublished).
Couto, Ronaldo Costa (2001), Brasılia Kubitschek de Oliveira. Sao Paulo: Record.
Dal Bo, Ernesto and Robert Powell (2009). “A Model of Spoils Politics.” American Journal of PoliticalScience 53(1): 207-222.
Davis, James C. and J. Vernon Henderson (2003). “Evidence on the Political Economy of the Urbaniza-tion Process.” Journal of Urban Economics 53(1): 98-125.
Dobbs, Richard, Sven Smit, Jaana Remes, James Manyika, Charles Roxburgh, and Alejandra Restrepo(2011). Urban World: Mapping the Economic Power of Cities. McKinsey Global Institute.
Ferraz, Claudio and Frederico Finan (2008). “Exposing Corrupt Politicians: The Effect of Brazil’sPublicly Released Audits on Electoral Outcomes.” Quarterly Journal of Economics 123(2): 703-745.
33

Glaeser, Edward, Giacomo Ponzetto, and Andrei Shleifer (2007). “Why Does Democracy Need Educa-tion?” Journal of Economic Growth 12(2):77-99.
Guimaraes, Bernardo and Kevin D. Sheedy (2012). “A Model of Equilibrium Institutions.” LondonSchool of Economics (unpublished).
Herbst, Jeffrey (2000). States and Power in Africa: Comparative Lessons in Authority and Control.Princeton, NJ: Princeton University Press.
Htay, Hla Hla (2007). “Myanmar’s new capital offers small luxuries in total isolation.” Agence FrancePresse, 23 Feb.
International Herald Tribune (2005). “A Government on a Move to a Half-Built Capital.” November11th issue.
Kaufman, Daniel and Aart Kraay (2002). “Growth Without Governance.” Economıa, 3: 169-229.
Kaufman, Daniel, Aart Kraay, and Massimo Mastruzzi (2010). “The Worldwide Governance Indicators:Methodology and Analytical Issues.” World Bank Policy Research Working Paper No. 5430.
Kaufman, Daniel, Aart Kraay, and Pablo Zoido-Lobaton (1999). “Governance Matters,” World BankPolicy Research Working Paper No. 2196.
La Porta, Rafael, Florencio Lopez-de-Silanes, Andrei Shleifer, and Robert Vishny (1998). “Law andFinance.” Journal of Political Economy 106(6): 1113-1155.
Li, Qi and Jeffrey Scott Racine (2006). Nonparametric Econometrics: Theory and Practice. Princeton,NJ: Princeton University Press.
Markoff, John (1996). Abolition of Feudalism: Peasants, Lords, and Legislators in the French Revolution.University Park, PA: Pennsylvannia State University Press.
Marshall, Monty G., Keith Jaggers, and Ted Robert Gurr (2011). “Polity IV Project: Dataset Users’Manual.” Center for Systemic Peace, available at www.systemicpeace.org/polity/polity4.htm.
McEvedy, C., and Jones, R., (1978). Atlas of World Population History. New York: Penguin.
Montagne, Pierre (1966). Le Comportement politique de l’Armee a Lyon sous la Monarchie de Juillet etla Seconde Republique. Paris: Pichon et Durand-Auzias.
Nunn, Nathan and Diego Puga (2012). “Ruggedness: The Blessing of Bad Geography in Africa”. Reviewof Economics and Statistics 94 (1): 20-36.
Pierskalla, Jan H. (2012). “State Antiquity and Population Concentration around the Capital.” DukeUniversity (unpublished).
Putnam, Robert (with Roberto Leonardi and Raffaella Y. Nanetti) (1993). Making Democracy Work:Civic Traditions in Modern Italy. Princeton: Princeton University Press.
Rodden, Jonathan (2010). “The Geographic Distribution of Political Preferences.” Annual Review ofPolitical Science13: 321-340.
Sachs, Jerey, John W. McArthur, Guido Schmidt-Traub, Margaret Kruk, Chandrika Bahadur, MichaelFaye, and Gordon McCord (2004). “Ending Africas Poverty Trap.” Brookings Papers on EconomicActivity 2004(1): 117-240.
Stasavage, David (2010). “When Distance Mattered: Geographic Scale and the Development of EuropeanRepresentative Assemblies.” American Political Science Review 104(4): 625-643.
The Economist (1997). “Capital Punishments,” December 17th issue.
The Economist (2006). “Waving the Denim”, March 18th issue.
34

The Economist (2006). “Old Soldiers, Old Habits”, September 21st issue.
Tilly, Charles (2003). The Politics of Collective Violence, Cambridge: Cambridge University Press.
Traugott, Mark (1995). “Capital Cities and Revolution,” Social Science History, 19: 147-169.
Varadarajan, Siddharth (2007). “Dictatorship by Cartography, Geometry.” Himal South Asian, Februaryissue.
A Proofs
A.1 Proof of Proposition 1
The no-rebellion constraint in (5) can be written as following:∫R
X(ı)dı ≥ (U′ep − δ)a
where X(ı) = U(ı) for those in C and X(ı) = U(ı) + T for those in F .Denote the average X by X. We have to show that the distribution of X is degenerate, X(ı) = X for all ı.
Suppose it is not. Then (i) the elites can achieve X(ı) = X for all ı and still respect the budget constraint; (ii) Ifthe distribution of taxes is not degenerate then there exists a set R with measure a such that∫
R
X(ı)dı < Xa
but since ∫R
X(ı)dı ≥ (U′ep − δ)a
we getXa > (U′ep − δ)a.
But that means that a reshuffling of taxes leading to X(ı) = X for all ı makes the no-rebellion constraint slack forall sets R of citizens with measure a. In that case the elite can raise taxes and increase Cp. Hence a non-degeneratedistribution of X cannot be optimal.
Thus in equilibrium, using U′p = Up,
X = Up − δ
which yields the claim.
A.2 The effect of the determinants of isolation on the elite’s income
Here we keep fixed the choice of governance and show how Up,S varies with changes in `∗ and T , where S ∈ B,Gdenotes the choice of governance.
First, note thatdUp,S
d`∗=∂Up,S
∂∆`
∂∆`
∂`∗+∂Up,S
∂`∗=∂Up,S
∂`∗,
where the second equality comes from the derivative of Up,S with respect to ∆` being zero (optimality condition).Since `∗ also affects Up,S through its direct effect on U′p,S , we need to consider the equilibrium value of Up,S , whichis given by the log of consumption as given in (7). Taking logs and differentiating it with respect to `∗ yields:
dUp,S
d`∗=
e−δ(1− e−T )p
1−p + e−δ (1− (`∗ + ∆`)(1− e−T )). (15)
This expression is positive, hence Up,S is increasing in `∗.
35

Likewise, the derivative of Up,S with respect to T is given by:
∂Up,S
∂T=
e−δe−T (`∗ + ∆`)p
1−p + e−δ (1− (`∗ + ∆`)(1− e−T )), (16)
which is also positive.
A.3 Proof of Proposition 3
Inspection of the expression in (15) shows that, for given parameters,
dUp,G
d`∗<dUp,B
d`∗
That is because the differences between both expressions are the term p/(1 − p) in the denominator of dUp,S/d`∗,
which is larger if s = G (since p is larger in case of good governance), and the value of ∆` that is smaller if s = G(as given by Proposition 2). The denominator is increasing in the term p/(1− p) and decreasing in ∆`.
Hence if functions Up,G and Up,B cross each other at `∗ = ¯∗, then Up,G > Up,B if and only if `∗ < ¯∗.The expressions for Up,G and Up,B assume certain beliefs about the choice of governance of subsequent elites.
We now show that the comparison between Up,G and Up,B is indeed what determines the equilibrium choice ofgovernance. Suppose an elite expects the following elites to choose good governance. In case Up,G > Up,B , thepayoff of an elite that deviates and chooses bad governance cannot be larger than Up,B – so the elite does notdeviate. That is because the payoff of an elite is smaller if it expects other elites to get higher consumption (andthat is the only way future decisions affect the current elite). Since Up,B has been calculated assuming C ′p = Cp,B ,which is smaller than Cp,G, the payoff from deviating can only be smaller than Up,B . Analogously, an elite thatexpects the following elites to choose bad governance has no incentives to deviate if Up,G < Up,B .
An analogous argument proves the result for T .
A.4 Proof of Proposition 4
The expression in (14) can be written as:
1 +p
1− peδ(g)
1− [`∗ + ∆`][1− e−T ]− [A(y∗ − φ(∆`))− g]δ′(g) = 0
Taking derivatives of this function (call if H) shows that:
∂H
∂g> 0 ,
∂H
∂`∗> 0 ,
∂H
∂T> 0
Hence, for a given s, the implicit function theorem yields:
∂g
∂`∗< 0 ,
∂g
∂T< 0
The result at the discontinuity point when we switch from s = G to s = B goes in the same direction. At thediscontinuity point ¯∗, it has to be that C ′p = Cp,G = Cp,L. But when s = G, ∆` is smaller, which implies a larger gas well since (12) has to hold. Hence there is a negative correlation between ` and g and hence a positive correlationbetween concentration around the capital and military spending.
A.5 Corner solution: ` = 1
Since ∆` is always positive, ` will never be zero. However, there is nothing in the model that ensures ` < 1. Themain text assumes an interior solution for ∆`. Here we consider the case of a corner solution yielding ` = 1.
Proposition 2 in the paper states that ∆` is increasing in T and `∗, and decreases when governance is good. Acorollary of Proposition 2 is that (i) ` = 1 for high enough values of T (coeteris paribus); (ii) ` = 1 for high enoughvalues of `∗ (coeteris paribus); and (iii) if ` = 1 for s = G then ` = 1 for s = B but the reverse is not necessarilytrue.
36

When ` = 1, changes in T and `∗ do not affect the isolation of the capital city (since all citizens are in F ).Consumption of an elite member Cp is given by:
Cp =1
p
(A(y∗ − φ(1− `∗))− (1− p)C ′pe−δ−T
)and in equilibrium:
Cp =A(y∗ − φ(1− `∗)p+ (1− p)e−δ−T
)
Proposition 3 refers to the effect of `∗ and T on governance and states that good governance is chosen if `∗
and T are small enough. The possibility of a corner solution for ∆` has essentially no impact on this result. Thederivative of Up with respect to T is:
∂Up
∂T=
e−δ−T
p1−p + e−δ−T
which is positive and larger in case p is small (bad governance). Hence the result in proposition 3 is unchanged.The derivatives of Up with respect to `∗ is
∂Up
∂`∗=
φ′(1− `∗)y∗ − φ(1− `∗)
which is positive and independent of the choice of governance. Hence the result in proposition 3 is unchanged exceptin the (measure-zero) case where Up,G = Up,B exactly at the point where the first order condition for ∆` yields` = 1. In that particular case, s = G if `∗ < ¯∗ (as in Proposition 3), but if `∗ > ¯∗ the elite will be indifferentbetween good and bad governance. But since in that case increases in `∗ do not affect the isolation of the capital,that has no impact on the relation between s and `.
Proposition 4 refers to the effect of `∗ and T on military spending. The proposition states that isolation of thecapital city and military spending are substitutes, hence more isolated capitals lead to less military spending. When` = 1, larger values of `∗ and T do not increase the isolation of capital, hence this effect is not there anymore. Largervalues of T imply citizens are poorer, reducing incentives for buying guns (there is less to tax). Larger values of `∗
imply less efficiency losses (output y is closer to y∗) hence there is more to tax and larger incentives to buy guns.But none of that tells us anything about the relation between isolation of capital and military spending since thathappens only when ` = 1.
B Data Appendix
Avg Log Distance We compute the index using original gridded population maps from the database GriddedPopulation of the World (GPW), Version 3 from the Socio-Economic Data Center (SEDC), Columbia Univer-sity (2005), containing maps in 1990, 1995 and 2000 of a global grid of 2.5 arc-minute side cells (approximately5km). The adjusted and unadjusted measures are defined respectively as 1−GCISC2 and 1−GCISC1, asdefined in Campante and Do (2010). Specifically, we have the formula GCISC1 =
∑i s1i (α1 log(di) + β1),
where s1i is the share of the country’s population living in cell i and di is the distance between cell i’s cen-
troid and the point of interest (e.g. capital city). The parameters (α1, β1) are(− 1
log(d1), 1)
, where d1 is the
maximum distance, across all countries, between a country’s capital (or other point of interest) and anotherpoint in that country. By the same token, GCISC2 =
∑i s2i (α2 log(di) + β2), where s2i is the share of
the country’s population living in cell i, normalized by log(d2), where d2 is the maximum distance, for eachcountry, between the country’s capital (or other point of interest) and another point in that country. Theparameters (α2, β2) are (−1, 1). In this way, GCISC2 controls for the country’s size, while GCISC1 doesnot.
Capital Primacy Share of the capital city population over the total population, from the SEDC. Most of thedata refer to the period 2000-2002, although many countries have earlier dates.
Distance from Maximum Concentration: This variable is calculated for each country by measuring thedistance between the actual site of the capital city, and the site of the capital that would maximize theGCISC. The maximization is done with Matlab’s large scale search method (with analytical gradient matrix),from a grid of 50 initial guesses evenly distributed on the country’s map for large countries.
37

World Governance Indicators (WGI): From Kaufman, Kraay, and Mastruzzi (2010), including Voice andAccountability, Control of Corruption, Rule of Law, Government Effectiveness, Political Stability, and Regu-lation Quality, themselves a composite of different agency ratings aggregated by an unobserved componentsmethodology. On a scale of −2.5 to 2.5. Data are available for 1996-2002 at two-year intervals, and thereafteron an annual basis. We average the data, for each country, for the period 1996-2006. The data are availableat: http://info.worldbank.org/governance/wgi/index.asp
Freedom House: Political Rights index (Freedom House). The original data are on a scale of 1 (best) to 7(worst), which we re-scale, by subtracting from 8, so that higher scores indicate better governance. Averagebetween 1990 and 1999.
Real GDP per capita: From the World Bank World Development Indicators (WDI). Real PPP-adjusted GDPper capita (in constant 2000 international dollars).
Population: From WDI.
Polity: Polity IV composite score as Democracy minus Autocracy, on a scale of -10 to 10, from Polity IV project.
Ethno-Linguistic Fractionalization: From Alesina et al. (2003).
Legal Origin: From La Porta et al. (1999). Dummy variables for British, French, Scandinavian, German, andsocialist legal origin.
Region dummies: Following the World Bank’s classifications, dummy variables for: East Asia and the Pacific;East Europe and Central Asia; Middle East and North America; South Asia; West Europe; North America;Sub-Saharan Africa; Latin America and the Caribbean.
Executive Constraints: Variable XCONST (Executive Constraints), from Polity IV project, averaged between1975-2010, with transition years coded as missing values. Refers to “the extent of institutionalized constraintson the decisionmaking powers of chief executives, whether individuals or collectivities,” i.e. “the checks andbalances between the various parts of the decision-making process”: 1- Unlimited Authority, 3- Slight toModerate Limitation, 5- Substantial Limitations, 7- Executive Parity or Subordination. (Even-numberedscores are “Intermediate” categories.)
Participation Competitiveness: Variable PARCOMP (Competitiveness of Participation), from Polity IVproject, averaged between 1975-2010, with transition years coded as missing values. Refers to “the extent towhich alternative preferences for policy and leadership can be pursued in the political arena”: 0- Unregulated,1- Repressed, 2- Suppressed, 3- Factional, 4- Transitional, 5- Competitive.
Recruitment Openness: Variable XROPEN (Openness of Executive Recruitment), from Polity IV project,averaged between 1975-2010, with transition years coded as missing values. Refers to “the extent that allthe politically active population has an opportunity, in principle, to attain the position through a regularizedprocess”: 0- Lack of regulation, 1- Closed, 2- Dual Executive-Designation, 3- Dual Executive- Election, 3-Open.
Recruitment Competitiveness: Variable XRCOMP (Competitiveness of Executive Recruitment), from PolityIV project, averaged between 1975-2010, with transition years coded as missing values. Refers to “extent thatprevailing modes of advancement give subordinates equal opportunities to become superordinates”: 0 - Lackof regulation, 1- Selection, 2- Dual/Transitional, 3- Election.
GDP per capita in capital city: From Dobbs et al (2011), estimates for 2007. We extract the data from theinteractive map available at http://www.mckinsey.com/Insights/MGI/Research/Urbanization/Urban world.
Military Budget: Average (1990-2006) military expenditure as a share of central government expenditures, fromWDI.
Interstate War: Dummy for presence of an instance of interstate war between 1975-2007, from Correlates of War(COW) project.
Capital city population (Tables 1 and 4): See Online Appendix.
38

FIGURE 1. Governance and Isolation of the Capital City
-‐5
-‐4
-‐3
-‐2
-‐1
0
1
1 2
Less Isolated Capitals (below median
Avg Log Distance)
More Isolated Capitals (above median Avg Log Distance)
Notes: Average of the first principal component of six World Governance Indicators measures (Rule of Law, Voice and Accountability, Government Effectiveness, Regulatory Quality, Control of Corruption, Political Stability) in subsamples of countries with Avg Log Distance below and above median for the full sample of countries (median = 0.7466).

FIGURE 2. Governance and Isolation of the Capital City
AFG
AFG
AFGAGO
AGO
AGOALB
ALB
ALBARE
ARE
AREARG
ARG
ARGARM
ARM
ARMAUS
AUS
AUSAUT
AUT
AUTAZE
AZE
AZEBDI
BDI
BDIBEL
BEL
BELBEN
BEN
BENBFA
BFA
BFABGD
BGD
BGDBGR
BGR
BGRBIH
BIH
BIHBLR
BLR
BLRBOL
BOL
BOLBRA
BRA
BRABTN
BTN
BTNBWA
BWA
BWACAF
CAF
CAFCAN
CAN
CANCHE
CHE
CHECHL
CHL
CHLCHN
CHN
CHNCIV
CIV
CIVCMR
CMR
CMRCOG
COG
COGCOL
COL
COLCRI
CRI
CRICUB
CUB
CUBCZE
CZE
CZEDEU
DEU
DEUDNK
DNK
DNKDOM
DOM
DOMECU
ECU
ECUEGY
EGY
EGYERI
ERI
ERIESP
ESP
ESPEST
EST
ESTETH
ETH
ETHFIN
FIN
FINFRA
FRA
FRAGBR
GBR
GBRGEO
GEO
GEOGHA
GHA
GHAGIN
GIN
GINGRC
GRC
GRCGTM
GTM
GTMHND
HND
HNDHRV
HRV
HRVHTI
HTI
HTIHUN
HUN
HUNIDN
IDN
IDNIND
IND
INDIRL
IRL
IRLIRN
IRN
IRNIRQ
IRQ
IRQISR
ISR
ISRITA
ITA
ITAJAM
JAM
JAMJOR
JOR
JORJPN
JPN
JPNKEN
KEN
KENKGZ
KGZ
KGZKHM
KHM
KHMKOR
KOR
KORKWT
KWT
KWTLAO
LAO
LAOLBN
LBN
LBNLBR
LBR
LBRLBY
LBY
LBYLKA
LKA
LKALSO
LSO
LSOLTU
LTU
LTULVA
LVA
LVAMAR
MAR
MARMDA
MDA
MDAMDG
MDG
MDGMEX
MEX
MEXMKD
MKD
MKDMLI
MLI
MLIMNG
MNG
MNGMOZ
MOZ
MOZMRT
MRT
MRTMWI
MWI
MWIMYS
MYS
MYSNAM
NAM
NAMNER
NER
NERNGA
NGA
NGANIC
NIC
NICNLD
NLD
NLDNOR
NOR
NORNPL
NPL
NPLNZL
NZL
NZLOMN
OMN
OMNPAK
PAK
PAKPAN
PAN
PANPER
PER
PERPHL
PHL
PHLPNG
PNG
PNGPOL
POL
POLPRI
PRI
PRIPRK
PRK
PRKPRT
PRT
PRTPRY
PRY
PRYPSE
PSE
PSEROM
ROM
ROMRUS
RUS
RUSRWA
RWA
RWASAU
SAU
SAUSDN
SDN
SDNSEN
SEN
SENSGP
SGP
SGPSLE
SLE
SLESLV
SLV
SLVSOM
SOM
SOMSVK
SVK
SVKSVN
SVN
SVNSWE
SWE
SWESYR
SYR
SYRTCD
TCD
TCDTGO
TGO
TGOTHA
THA
THATJK
TJK
TJKTJK
TJK
TJKTKM
TKM
TKMTTO
TTO
TTOTUN
TUN
TUNTUR
TUR
TURTWN
TWN
TWNTZA
TZA
TZAUGA
UGA
UGAUKR
UKR
UKRURY
URY
URYUSA
USA
USAUZB
UZB
UZBVEN
VEN
VENVNM
VNM
VNMYEM
YEM
YEMYUG
YUG
YUGZAR
ZAR
ZARZMB
ZMB
ZMBZWE
ZWE
ZWE-5
-5
-50
0
05
5
5.5
.5
.5.6
.6
.6.7
.7
.7.8
.8
.8.9
.9
.9Avg Log Distance
Avg Log Distance
Avg Log DistanceWGI First PC
WGI First PC
WGI First PCFitted values
Fitted values
Fitted valuesFull SampleFull Sample
Full Sample
Notes: WGI First PC: first principal component of six World Governance Indicators measures (Rule of Law, Voice and Accountability, Government Effectiveness, Regulatory Quality, Control of Corruption, Political Stability).

FIGURE 3. Governance and Isolation of the Capital City, by Polity Score
-0.80-0
.80
-0.80-0.60-0
.60
-0.60-0.40-0
.40
-0.40-0.20-0
.20
-0.200.000.
000.000.20
0.20
0.20Effect of Avg.Log.Distance on WGI PCIEf
fect
of A
vg.L
og.D
istan
ce o
n W
GI P
CIEffect of Avg.Log.Distance on WGI PCI-10
-10
-10-5
-5
-50
0
05
5
510
10
10Polity
Polity
PolityEpanechnikov kernel, bandwidth = 10.
Epanechnikov kernel, bandwidth = 10.
Epanechnikov kernel, bandwidth = 10.Local linear regression results and 95% confidence intervals
Local linear regression results and 95% confidence intervals
Local linear regression results and 95% confidence intervalsEffect of Avg.Log.Distance on WGI PCI, plotted by PolityEffect of Avg.Log.Distance on WGI PCI, plotted by Polity
Effect of Avg.Log.Distance on WGI PCI, plotted by Polity
Notes: WGI First PC: first principal component of six World Governance Indicators measures (Rule of Law, Voice and Accountability, Government Effectiveness, Regulatory Quality, Control of Corruption, Political Stability). The figure plots the coefficients on Avg Log Distance from local linear regressions with WGI PCI as dependent variable, and XXX as control variables. The size of the grid is 50, with a bandwidth of 10, and we use the Epanechnikov kernel.

FIGURE 4. Governance in Countries with More and Less Isolated Capitals: Autocracies vs Established Democracies
-‐5
-‐4
-‐3
-‐2
-‐1
0
1
2
3
4
1 2
Notes: Average of the first principal component of six World Governance Indicators measures (Rule of Law, Voice and Accountability, Government Effectiveness, Regulatory Quality, Control of Corruption, Political Stability) in subsamples of countries with Avg Log Distance below (blue) and above (red) median for the full sample of countries (median = 0.2534), computed separately for “autocracies” (average Polity score in the bottom tercile of the full sample, i.e. less or equal to 0.4) and “established democracies” (average Polity score greater than 9).
Autocracies
Established Democracies

FIGURE 5. Governance and Isolation of the Capital City: Autocracies vs Established Democracies
AFG
AFG
AFGAGO
AGO
AGOARE
ARE
AREAZE
AZE
AZEBDI
BDI
BDIBFA
BFA
BFABLR
BLR
BLRBTN
BTN
BTNCHN
CHN
CHNCIV
CIV
CIVCMR
CMR
CMRCOG
COG
COGCUB
CUB
CUBEGY
EGY
EGYERI
ERI
ERIGIN
GIN
GINIRN
IRN
IRNIRQ
IRQ
IRQJOR
JOR
JORKEN
KEN
KENKGZ
KGZ
KGZKWT
KWT
KWTLAO
LAO
LAOLBR
LBR
LBRLBY
LBY
LBYMAR
MAR
MARMRT
MRT
MRTOMN
OMN
OMNPAK
PAK
PAKPRK
PRK
PRKRWA
RWA
RWASAU
SAU
SAUSDN
SDN
SDNSGP
SGP
SGPSYR
SYR
SYRTCD
TCD
TCDTGO
TGO
TGOTJK
TJK
TJKTJK
TJK
TJKTKM
TKM
TKMTUN
TUN
TUNUGA
UGA
UGAUZB
UZB
UZBVNM
VNM
VNMYEM
YEM
YEMYUG
YUG
YUGZWE
ZWE
ZWE-5
-5
-50
0
05
5
5.5
.5
.5.6
.6
.6.7
.7
.7.8
.8
.8.9
.9
.9Avg Log Distance
Avg Log Distance
Avg Log DistanceWGI First PC
WGI First PC
WGI First PCFitted values
Fitted values
Fitted valuesA. Autocracies (Polity bottom tercile)A. Autocracies (Polity bottom tercile)
A. Autocracies (Polity bottom tercile)
AUS
AUS
AUSAUT
AUT
AUTBEL
BEL
BELCAN
CAN
CANCHE
CHE
CHECRI
CRI
CRICZE
CZE
CZEDEU
DEU
DEUDNK
DNK
DNKESP
ESP
ESPFIN
FIN
FINGBR
GBR
GBRGRC
GRC
GRCHUN
HUN
HUNIRL
IRL
IRLISR
ISR
ISRITA
ITA
ITAJPN
JPN
JPNLTU
LTU
LTUMNG
MNG
MNGNLD
NLD
NLDNOR
NOR
NORNZL
NZL
NZLPNG
PNG
PNGPOL
POL
POLPRT
PRT
PRTSVN
SVN
SVNSWE
SWE
SWETTO
TTO
TTOURY
URY
URYUSA
USA
USA-5
-5
-50
0
05
5
5.6
.6
.6.7
.7
.7.8
.8
.8.9
.9
.9Avg Log Distance
Avg Log Distance
Avg Log DistanceWGI First PC
WGI First PC
WGI First PCFitted values
Fitted values
Fitted valuesB. Established Democracies (Polity>9)B. Established Democracies (Polity>9)
B. Established Democracies (Polity>9)
Notes: WGI First PC: first principal component of six World Governance Indicators measures (Rule of Law, Voice and Accountability, Government Effectiveness, Regulatory Quality, Control of Corruption, Political Stability).

FIGURE 6. Political Stability, Log Avg Days, and Isolation of the Capital City, by Polity Score
Panel A
Panel B
-0.2
0-0
.10
0.00
0.10
0.20
Effe
ct o
f Avg
.Log
.Dis
tanc
e on
Pol
it. S
tabi
lity
-10 -5 0 5 10Polity
Epanechnikov kernel, bandwidth = .5 range.
Local linear regression results and 95% confidence intervalsEffect of Avg.Log.Distance on Polit. Stability, plotted by Polity
-0.4
0-0
.20
0.00
0.20
0.40
Effe
ct o
f Avg
.Log
.Dis
tanc
e on
Log
.Avg
.Day
s
-10 -5 0 5 10Polity
Epanechnikov kernel, bandwidth = .5 range.
Local linear regression results and 95% confidence intervalsEffect of Avg.Log.Distance on Log.Avg.Days, plotted by Polity
Notes: The figure plots the coefficients on Avg Log Distance from local linear regressions with Political Stability and Log Avg Days to return a letter as dependent variables, respectively, and XXX as control variables. The size of the grid is 50, with a bandwidth of 10, and we use the Epanechnikov kernel.
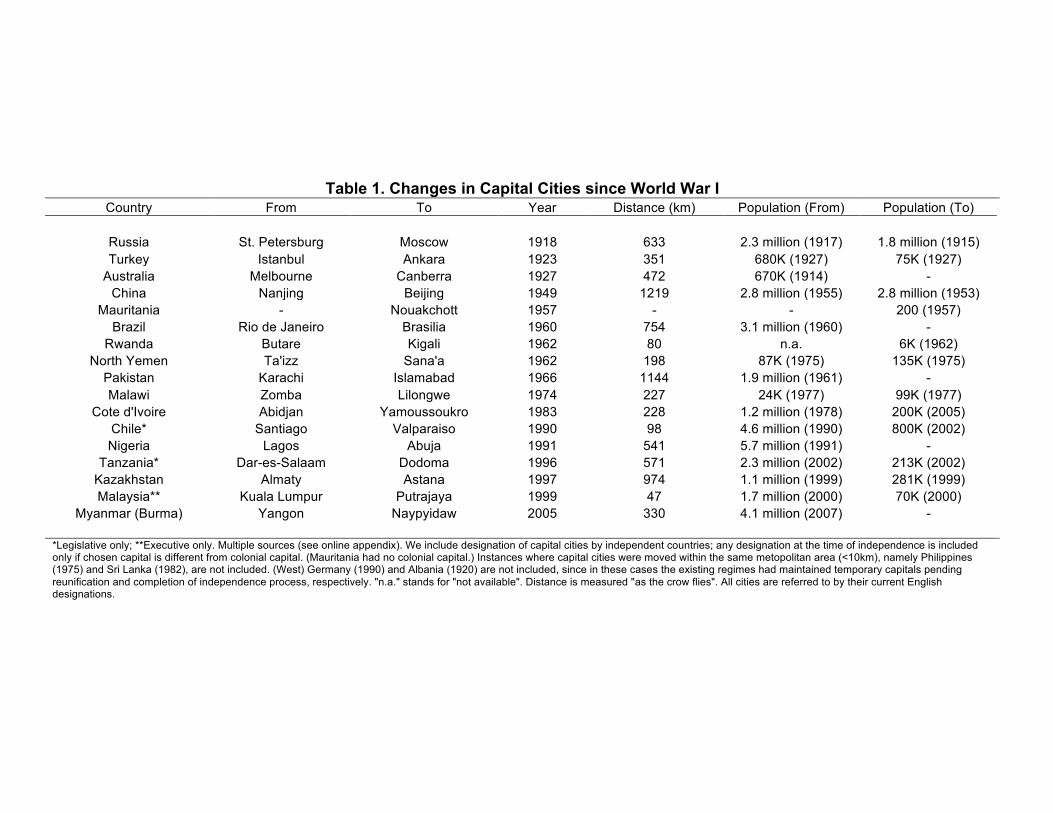
Table 1. Changes in Capital Cities since World War I Country From To Year Distance (km) Population (From) Population (To)
Russia St. Petersburg Moscow 1918 633 2.3 million (1917) 1.8 million (1915) Turkey Istanbul Ankara 1923 351 680K (1927) 75K (1927)
Australia Melbourne Canberra 1927 472 670K (1914) - China Nanjing Beijing 1949 1219 2.8 million (1955) 2.8 million (1953)
Mauritania - Nouakchott 1957 - - 200 (1957) Brazil Rio de Janeiro Brasilia 1960 754 3.1 million (1960) -
Rwanda Butare Kigali 1962 80 n.a. 6K (1962) North Yemen Ta'izz Sana'a 1962 198 87K (1975) 135K (1975)
Pakistan Karachi Islamabad 1966 1144 1.9 million (1961) - Malawi Zomba Lilongwe 1974 227 24K (1977) 99K (1977)
Cote d'Ivoire Abidjan Yamoussoukro 1983 228 1.2 million (1978) 200K (2005) Chile* Santiago Valparaiso 1990 98 4.6 million (1990) 800K (2002) Nigeria Lagos Abuja 1991 541 5.7 million (1991) -
Tanzania* Dar-es-Salaam Dodoma 1996 571 2.3 million (2002) 213K (2002) Kazakhstan Almaty Astana 1997 974 1.1 million (1999) 281K (1999) Malaysia** Kuala Lumpur Putrajaya 1999 47 1.7 million (2000) 70K (2000)
Myanmar (Burma) Yangon Naypyidaw 2005 330 4.1 million (2007) -
*Legislative only; **Executive only. Multiple sources (see online appendix). We include designation of capital cities by independent countries; any designation at the time of independence is included only if chosen capital is different from colonial capital. (Mauritania had no colonial capital.) Instances where capital cities were moved within the same metopolitan area (<10km), namely Philippines (1975) and Sri Lanka (1982), are not included. (West) Germany (1990) and Albania (1920) are not included, since in these cases the existing regimes had maintained temporary capitals pending reunification and completion of independence process, respectively. "n.a." stands for "not available". Distance is measured "as the crow flies". All cities are referred to by their current English designations.

Table 2. Isolated Capital Cities and Misgovernance (1) (2) (3) (4) (5) (6) (7) (8) Dep. Var.: WGI PC
Full Sample Autocracies Establ. Democracies Full Sample
Avg Log Distance -0.1513*** -0.1335** -0.2605*** -0.3056*** -0.0646 -0.0249 -0.0500 -0.0504
[0.054] [0.054] [0.075] [0.075] [0.089] [0.097] [0.056] [0.057]
Avg Log Distance X Autocracy -0.2335*** -0.2380*** [0.086] [0.088] Basic Set of Controls X
X
X
X
Full Set of Controls
X
X
X
X
Observations 127 127 36 36 31 31 127 127 R-squared 0.830 0.838 0.848 0.883 0.881 0.896 0.873 0.874
Robust standard errors in brackets. Z-scores (normalized variables) reported. WGI PC: First Principal Component of Worldwide Governance Indicators measures (Rule of Law, Voice and Accountability, Government Effectiveness, Regulatory Quality,
Control of Corruption, Political Stability).
Autocracies: Bottom tercile of Polity (<=0.4); Established Democracies: Polity > 9. Basic Control variables: Log GDP per capita, Log Population, Urbanization, and Region and Legal Origin dummies. Full Set of Controls adds Majoritarian and Presidential system dummies, and Ethnic Fractionalization. Columns (7)-(8) also include Autocracy dummy as control variable. *** p<0.01, ** p<0.05, * p<0.1

Table 3. Isolated Capital Cities and Misgovernance: Robustness (1) (2) (3) (4) (5) (6) (7) (8) (9) Dep. Var.: WGI PC WGI PC WGI PC WGI PC WGI PC WGI PC FH FH Autocracies Democracies Autocracies Democracies Autocracies Democracies Autocracies Democracies Full Sample
Avg Log Distance (unadj.) -0.2160*** 0.0885
[0.100] [0.138]
Distance Min. Isolation -0.2145*** 0.0220 [0.073] [0.070] Capital Primacy 0.1323* -0.2012*
[0.075] [0.113]
Avg Log Distance -0.2009** 0.0066 0.0030
[0.084] [0.031] [0.060] Avg Log Distance X Autocracy -0.2728***
[0.101] Avg Log Distance (Other Largest) -0.1471** [0.063] Avg Log Distance (Other Largest) X Autocracy 0.0750 [0.112] Observations 36 31 36 31 32 31 35 29 126 R-squared 0.830 0.898 0.852 0.896 0.863 0.915 0.611 0.891 0.881 Robust standard errors in brackets. Z-scores (normalized variables) reported. WGI PC (Columns (1)-(6) and (9)): First Principal Component of Worldwide Governance Indicators measures (Rule of Law, Voice and Accountability, Government Effectiveness, Regulatory Quality, Control of Corruption, Political Stability). FH (Columns (7)-(8)): Freedom House Rule of Law Index. Autocracies: Bottom tercile of Polity (<=0.4), except for Column (5) where the threshold is the median (<=6); Established Democracies: Polity > 9. Control variables: Log GDP per capita, Log Population, Urbanization, and Region and Legal Origin dummies, Majoritarian and Presidential system dummies, and Ethnic Fractionalization; and Log Land Area, for Columns (1)-(2) only; and Maximum Distance in the Country (Log of maximum distance (in km) between capital city and any point in the country), for Columns (3)-(4) only. Column (9) also includes Autocracy dummy as control variable. *** p<0.01, ** p<0.05, * p<0.1

Table 4. Changes in Capital Cities and Power Sharing Country From To Year Δ Exec. Constr. Δ Part. Comp.
Russia St. Petersburg Moscow 1918 1 -2 Turkey Istanbul Ankara 1923 -2 -1
Australia Melbourne Canberra 1927 0 0 China Nanjing Beijing 1949 1 -2
Mauritania - Nouakchott 1957 -2 0 Brazil Rio de Janeiro Brasilia 1960 -4 -2
Rwanda Butare Kigali 1962 0 0 North Yemen Ta'izz Sana'a 1962 2 -1
Pakistan Karachi Islamabad 1966 0 0 Malawi Zomba Lilongwe 1974 0 0
Cote d'Ivoire Abidjan Yamoussoukro 1983 1 1 Nigeria Lagos Abuja 1991 -2 -3
Kazakhstan Almaty Astana 1997 -1 -1 Myanmar (Burma) Yangon Naypyidaw 2005 -1 0
Average
-0.50 -0.79 p-value 0.266 0.021
Excluding partial changes. For sources and notes, see Table 1. Changes in Polity IV variables ("Executive Constraints" and "Participation Competitiveness") are between 10 years after and 10 years before change of capital, with the exception of Mauritania, Rwanda, and Kazakhstan ("pre" measure for first year of independence) and Myanmar (Burma) ("post" measure for 2010, latest available). P-values for two-sided t-test of null hypothesis of Average equal to zero, with 13 degrees of freedom.
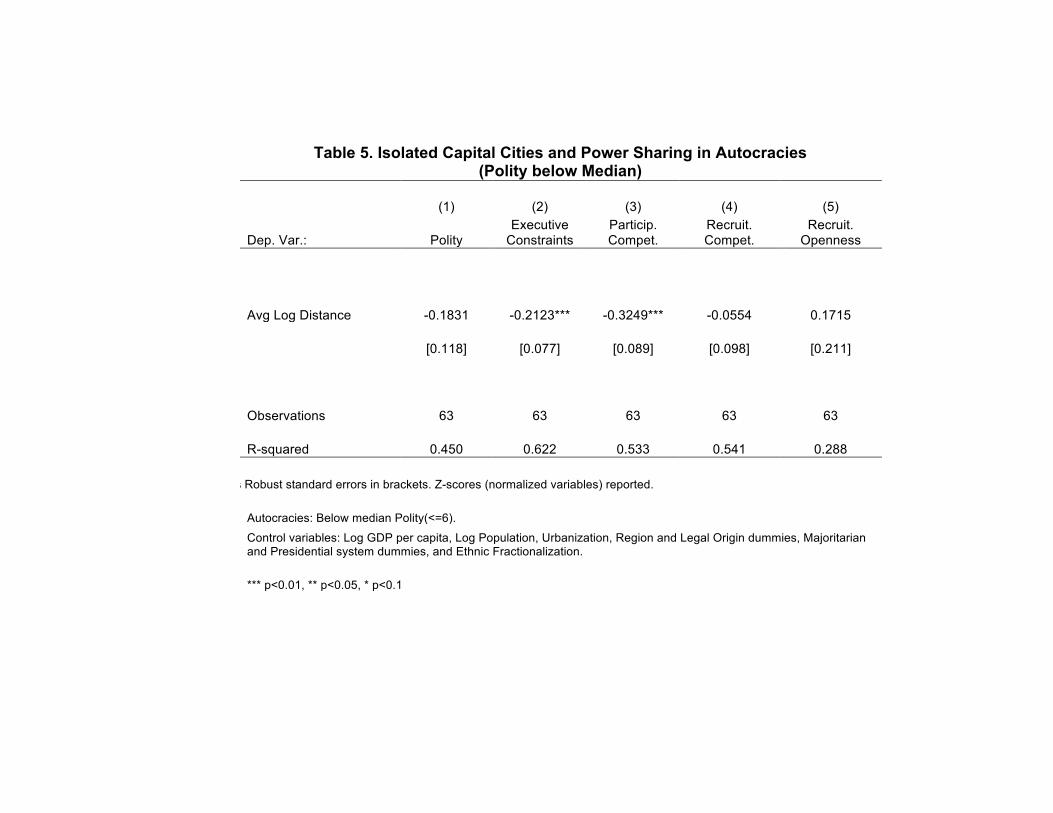
Table 5. Isolated Capital Cities and Power Sharing in Autocracies (Polity below Median)
(1) (2) (3) (4) (5)
Dep. Var.: Polity Executive
Constraints Particip. Compet.
Recruit. Compet.
Recruit. Openness
Avg Log Distance -0.1831 -0.2123*** -0.3249*** -0.0554 0.1715
[0.118] [0.077] [0.089] [0.098] [0.211]
Observations 63 63 63 63 63
R-squared 0.450 0.622 0.533 0.541 0.288
Robust s Robust standard errors in brackets. Z-scores (normalized variables) reported.
Autocracies: Below median Polity(<=6). Control variables: Log GDP per capita, Log Population, Urbanization, Region and Legal Origin dummies, Majoritarian and Presidential system dummies, and Ethnic Fractionalization.
*** p<0.01, ** p<0.05, * p<0.1

Table 6. Isolated Capital Cities, Capital Premium, and Military Expenditures (1) (2) (3)
(4) (5) (6)
Dep. Var.: Capital Premium Capital Premium Capital Premium
Military Budget Military Budget Military Budget
Autocracies Democracies Full Sample
Autocracies Democracies Full Sample
Avg Log Distance 0.4158** -0.1040 -0.0287
-0.3393** -0.0150 0.0986
[0.193] [0.207] [0.180]
[0.158] [0.137] [0.137]
Avg Log Distance X Autocracy 0.4096* -0.3912** [0.236] [0.192] Interstate War
0.4441 0.6072** 0.5975***
[0.273] [0.271] [0.197]
Observations 32 32 64
55 51 106
R-squared 0.398 0.436 0.409 0.382 0.477 0.418 Robust standard errors in brackets. Z-scores (normalized variables) reported. Dependent variables: GDP per capita in capital city / GDP per capita and Military Budget (Log of Share of Central Government Budget, avg. 1990-2006, WDI). Interstate War: dummy for involvement in interstate war between 1975 and 2007 (Correlates of War).
Autocracies: Polity (1975-2000) below median (<=3.1); Democracies: Polity (1975-2000) above median (> 3.1). Control variables: Log GDP per capita, Log Population, Urbanization, Majoritarian and Presidential system dummies, and Ethnic Fractionalization. *** p<0.01, ** p<0.05, * p<0.1