Embed Size (px)
Citation preview


Established 1949 Number of Employees 1,928 (As of March 31, 2016)
Subsidiaries
Nagoya Lease Co., Ltd. Nagoya Business Service Co., Ltd. Nagoya Card, Ltd. Nagoya MC Card Co., Ltd.
THE BANK OF NAGOYA, LTD. 19-17 Nishiki 3-chome, Naka-ku,
Nagoya City, Aichi 460-0003 Japan Tel: +81 52 962 9520 Fax: +81 52 961 6605 http://www.meigin.com/

Domestic Branches Number of Branches: 112 (As of March 31, 2016)
Overseas
Nantong Branch
2nd Floor, Business Service Outsourcing Center, Building C, 188 Tongsheng Road, Economic and Technological Development Area, Nantong, Jiangsu, China Tel +86 513 89192280 Fax +86 513 89192281
Shanghai Representative Office
Room 1809, Shanghai International Trade Center, 2201 Yan-an Road (West), Shanghai, China Tel +86 21 62754207 Fax +86 21 62759461
2 branches in Shizuoka
1 branch in Osaka
1 branch in Tokyo
106 branches in Aichi (56 branches in Nagoya City)
2 branches in Gifu
2 branches in Shizuoka

Contents
Message from the Management 1
Operating Environment 2
Operating Results (Nonconsolidated basis) 4
Medium- and Long-term Management Strategies 10
Issues to Address 11
Breakdown of Loans (Nonconsolidated basis) 13 Balance of problem loans under the Banking Act (risk monitored loans) 13 Balance of problem loans under the Financial Revitalization Act 14
Unrealized Gains on Securities (Nonconsolidated basis) 15
Capital Adequacy Ratio 15
Rating 15
Organization of the Bank 16
Board of Directors and Audit and Supervisory Board 17
Principal Shareholders 17
Independent Auditor’s Report 18
Consolidated Balance Sheets 19
Consolidated Statements of Income 21
Consolidated Statements of Changes in Net Assets 23
Consolidated Statements of Cash Flows 25
Notes to Consolidated Financial Statements 26

1
Message from the Management
We would first like to extend our sincere gratitude to all our stakeholders for their patronage to the Bank of Nagoya.
We are currently implementing its 19th management plan “Change! Making Changes! A Fresh Start!”—Becoming a Bank Overflowing with Satisfaction, which we started in April, 2014, and will respond to customers’ needs by promoting the shared vision of all executive officers and employees “to become a bank that treats customers with more sincerity than any other bank, cares about its customers more than any other bank, and is liked by everyone.”
We seek to fulfill our mission as a regional financial institution, to be trusted by the local community, and to increase our presence. To this end, we will put into practice our guiding precept of “fostering regional prosperity,” and we ask you to give us your even stronger support and patronage in the future.
June 2016
Kazumaro Kato Chairman
Masahiro Nakamura President

2
Operating Environment
The Bank works to provide “financial services” that satisfy the local community. We continued to undertake several initiatives in the fiscal year ended March 31, 2016.
First, we launched a new IC cash card issuing service in December 2015. The service offers users a choice of 34 designs for their cards, which are issued immediately. As we are the first financial institution in Japan to offer this kind of service, customers have been very pleased with both the service and the way that the original IC cash cards become a treasured personalized item. In the four months since the service was launched until March, we have issued approximately 40,000 cards, and the services have contributed significantly to the opening of new accounts, which was the main point of its introduction.
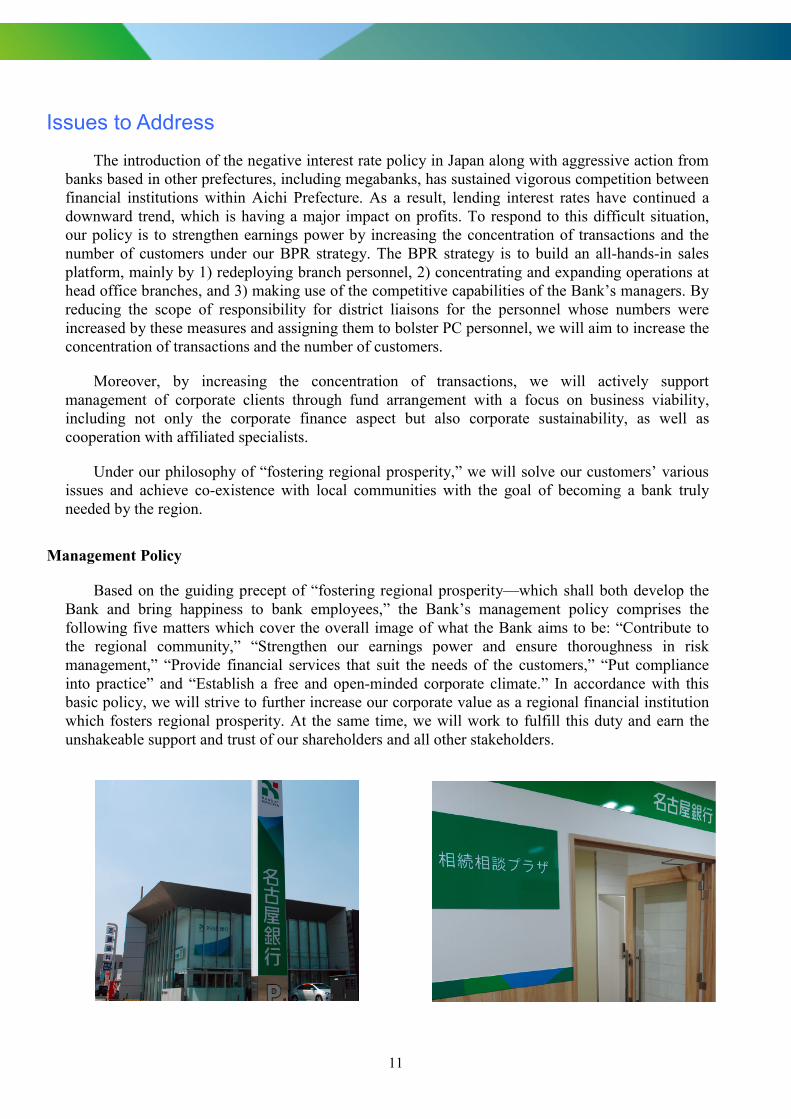
Furthermore, in July 2015, we established the “Inheritance Consultation Plaza,” a specialist customer consulting and administration process service for inheritance. As Japan’s society continues to age rapidly, customer needs regarding inheritance are increasing and becoming more diverse. With the “Inheritance Consultation Plaza,” we will respond to these trends and strive to provide high quality services. We also launched “The Bank of Nagoya Heartful Plaza,” at which we seek to provide customers with information relevant to their life stages and conduct sales that enhance the brand value of the Bank of Nagoya. This plaza was opened in March, 2016 on the 16th floor of the Dai Nagoya Building adjoining Nagoya Station. In order for many people to make use of the plaza, careful thought will be put into the business days and business hours, seminars and events will be held, and consultation will be provided in regard to asset building, home loans, and more.
In addition, in an initiative to support the growing sector of agriculture, forestry, and fisheries, we held the “1st Aichi-Jimoto Agriculture, Forestry and Fisheries Growth Support ‘Food’ and ‘Agriculture’ Trade Fair” together with seven local credit unions and others in March 2016. The event was a great success, with 126 exhibiting companies and 73 buyer companies conducting 443 individual trade discussions on the day. Through the event, we helped producers, processors, and sellers to expand their sales channels and create markets, in an effort to develop the agriculture, forestry, and fisheries even further. We expect this initiative to lead to further transactions with our customers.
Moreover, in our initiatives for regional vitalization, we have been cooperating with local governments and chambers of commerce and industry under the national government’s “Comprehensive Strategy of the Vitalization of Towns, People, and Jobs,” and taking proactive measures. By March, 2016 we had concluded cooperation agreements with 13 organizations in 7 municipalities. We will continue to perform our role as a regional financial institution proactively, with the goal of regional vitalization and stimulation of regional economies.

3
Under our guiding precept of “fostering regional prosperity,” we will strive to achieve co-existence with local communities, become a bank truly needed by the region, and carry out work in a trustworthy manner. Each individual employee will work to put this in to practice, striving to realize our corporate philosophy in order to build a positive reputation for the Bank of Nagoya among the local community.

4
Operating Results (Nonconsolidated basis)
The Bank’s guiding precept is “fostering regional prosperity.” The Bank has strived to provide financial services in order to develop the regional economy, and going forward we will continue to conduct business strongly rooted in the region in order to help our customers grow and prosper.
Basic Policies Behind the Bank’s Initiatives–––––––––––––––––
1. Basic Policies for Demonstrating Customer Consulting Capabilities
(1) Evaluate business viability (identify and analyze business content and growth potential, as well as business goals and issues) through day-to-day and ongoing relationship strengthening.
(2) Propose optimal solutions through business viability evaluation.
(3) Work with customers to resolve management issues and, if necessary, propose revisions to solutions.
2. Proactive Participation in improving revitalization of “Towns, People, and Jobs” in Local Communities
(1) Coordinate with local governments, working together with them to proactively participate in initiatives for revitalization of the entire region.
(2) Provide support for developing growth fields and creating higher added value through industrial agglomeration.
3. Proactive Dissemination of Information to the Region and Customers
Proactively provide information to the region and customers with respect to specific goals and achievements of financing initiatives closely tied to the region.
Support for Overseas Expansion We support customers' overseas expansion in China and Asia.
[Support for Expansion Administration] We have a business alliance with PRONEXUS INC., through this we provide practical support for companies expanding overseas in dealing with the local area, as well as aspects such as general administration, human resources, and accounting.
[Fund Procurement Support] We offer diverse support for fund procurement that meets the needs of customers, including loans to parent and subsidiary, issuing stand-by letters of credit to smooth the way for fund procurement from local financial institutions, and cross-border loans for directly financing overseas subsidiaries.
We also engage in syndicated loans with the Japan Bank for International Cooperation (JBIC).

5
Initiative on Business Manager Guarantee Guidelines The Bank has always taken care to perform a thorough check of the intention with regard to
guarantees when concluding agreements in the case of obtaining individual guarantees when providing finance. Now, the Bank will observe the “Guideline on Business Manager Guarantees” announced by the Business Manager Guarantee Guideline Working Group (Secretariat: Japanese Bankers Association and The Japan Chamber of Commerce and Industry) and has upgraded its systems to comply with the Guideline. In future, we will strive to respond sincerely in accordance with the Guideline when concluding guarantee agreements with customers, or when receiving a request from a customer acting as a guarantor to clear the guaranteed debt in line with the Guideline.
[Achievements]
Results for Fiscal 2015
Number of new unsecured loans 2,123
Number of loans with guarantee contracts cancelled 147
Number of guaranteed debt clearances based on the Guideline 8
Ratio of new loans that do not depend on business manager guarantees
7.8%
Status of Measures on Business Viability Evaluation Established Business Viability Evaluation Sheet
Since April 2015, we have been creating Business Viability Evaluation Sheets to accurately evaluate the content and growth potential of a business (business viability evaluation) and provide financing and advice appropriate to the customer life stage. The Bank will work together with its customers to tackle their management challenges and strive to provide support for businesses over the medium and long terms as a regional financial institution.
[Achievements] Number of Business Viability Evaluation Sheets created in the fiscal year ended March 31, 2016: 717

6
Further Significant Progress During the Growth Phase Support for Overseas Expansion Using our advantage of having a branch in Nantong, China, we support our customers’
overseas expansion into China and Southeast Asia with a focus on regional mid-sized companies and SMEs. In particular, we help them to diversify the fund procurement methods used by their local subsidiaries overseas by providing actively providing cross-border loans and syndicated loans with the JBIC.
[Achievements]
Results for Fiscal 2015
Transfers of capital 28
Transfer of loans to parent and subsidiary 31
Standby letters of credit 7
Consulting contracts 1
Cross-border loans 5
Total 72
In addition to our branch in China, we also dispatch Bank employees to local affiliated financial institutions and the Japan External Trade Organization (JETRO) to provide information aligned to actual local situations.
[Bank Employee Dispatch Destinations] Bangkok Bank Public Company Limited (Thailand), PT. Bank Negara Indonesia (Persero) Tbk. (Indonesia), Sumitomo Mitsui Banking Corporation (China), Jetro Ho Chi Minh (Vietnam)
We have also set up an environment for providing information on local areas by forming alliances with financial institutions to which we have dispatched Bank employees, in addition to financial institutions and local government organizations.
[Alliance Partners] KASIKORNBANK Public Company Limited (Thailand), Metropolitan Bank and Trust Company (Philippines), Joint Stock Commercial Bank for Foreign Trade of Vietnam (Vietnam), State Bank of India (India), State of Aguascalientes and State of Jalisco, Mexico (Mexico), Bank of Communications Co., Ltd. (China), Bank of China (China)
The International Business Promotion Department within the Corporate Banking Division provides support for overseas expansion and trade.
[Achievements] Number of accompanied visits with branch Bank employees: 493 Number of new foreign currency transaction counterparties: 342
7
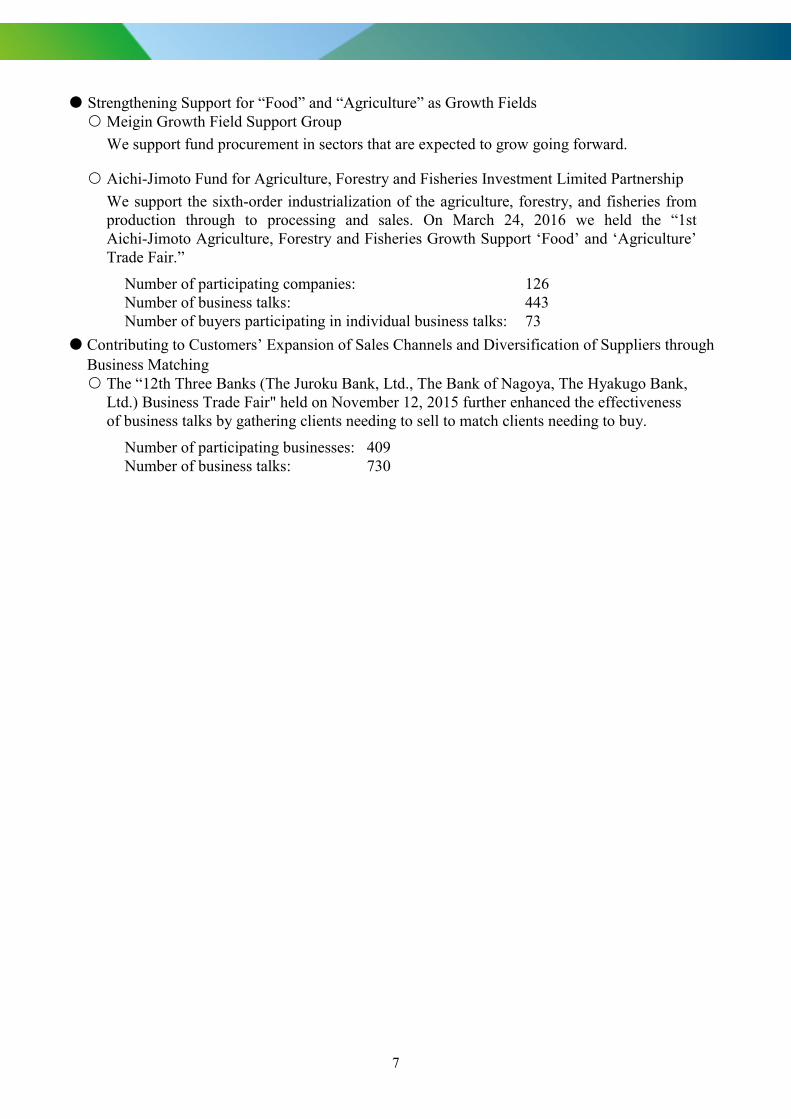
Strengthening Support for “Food” and “Agriculture” as Growth Fields Meigin Growth Field Support Group
We support fund procurement in sectors that are expected to grow going forward.
Aichi-Jimoto Fund for Agriculture, Forestry and Fisheries Investment Limited Partnership
We support the sixth-order industrialization of the agriculture, forestry, and fisheries from production through to processing and sales. On March 24, 2016 we held the “1st Aichi-Jimoto Agriculture, Forestry and Fisheries Growth Support ‘Food’ and ‘Agriculture’ Trade Fair.”
Number of participating companies: 126 Number of business talks: 443 Number of buyers participating in individual business talks: 73
Contributing to Customers’ Expansion of Sales Channels and Diversification of Suppliers through Business Matching The “12th Three Banks (The Juroku Bank, Ltd., The Bank of Nagoya, The Hyakugo Bank,
Ltd.) Business Trade Fair" held on November 12, 2015 further enhanced the effectiveness of business talks by gathering clients needing to sell to match clients needing to buy.
Number of participating businesses: 409 Number of business talks: 730

8
Management Improvement We aggressively promote efforts to support identification and resolution of customers’
management issues by introducing them to our affiliated consulting companies and enhancing our links with external organizations.
[Initiatives with Affiliated Organizations and External Organizations] Introducing affiliated consulting companies Strengthened cooperation with the Aichi Prefecture Small and Medium-Sized Enterprise
Revitalization Support Council Utilization of the Aichi Prefecture Management Improvement Support Center Utilization of the Aichi SME Revitalization No. 2 Fund
[Achievements for April 2015 – March 2016] Number of management consultation implementation cases: 109 Number of new contracts with the Aichi Prefecture Small and Medium-Sized Enterprise
Revitalization Support Council and the Aichi Prefecture Management Improvement Support Center: 28
(Total number of cases in the process of negotiations as of March 31, 2016: 102) Management analysis by the Credit Guarantee Corporations : 49
Business Succession For owner-operated companies who face the absence of a successor or concerns over the
problem of transferring treasury shares to a successor, we provide funding support and consultation regarding M&As.
[Achievements]
Details Achievements
Business Succession
Suggestion of issues arising in proposals for business succession 236
Of which, introductions to affiliated consulting company in conjunction with business succession
6
Of which, funding support provided in conjunction with business succession
8
M&A
Consultation on M&A regarding corporate acquisition and corporate divestment
318
Of which, successful M&As 8
Human Resource Development and Expertise Building, Etc. We conduct the various types of training to improve the following capabilities required for
demonstrating consulting capabilities.
(1) Capability of identifying customers’ issues through information exchange with business managers and providing solutions
(2) Capability of providing accurate advice and proposals to customers based on financial analysis
(3) Capability of accurately evaluating qualitative information such as a company’s future potential and technical capabilities
[Achievements]
Number of participants in negotiation training related to judgment capability : 584

9
Head office branch
Business Planning Division
Customers that are small and medium sized enterprises
Founding stage Maturity stageGrowth stage
Regional vitalization
Preparedness regarding management support for small and medium sized enterprises
Routine visits ・Creating a relationship of trust ・Understanding and analyzing
management issues ・Continuous monitoring
Providing varied solutions for each stage
Venture capital referrals Business matching Support for business plan announcement conferences M&A Referrals for public aid systems Management consultation Management improvement, business recovery Business succession Support for the overseas expansion
Varied solutions
Business Promotion Division
Business Planning Division
Head office branch
Credit Supervision Division
Other Divisions
Collaboration
Specialist division in charge of management improvement support and business recovery, etc.
Branches
THE BANK OF NAGOYA
Collaboration
Collaboration
External specialists and external support
organizations
Japan Finance Corporation, Universities Small and Medium-Sized Enterprise Revitalization Support Council Regional Economy Vitalization Corporation of Japan Business Recovery Fund Organization for Small & Medium Enterprises and Regional Innovation, JAPAN
and more
Certified public tax accountants, Attorneys Certified public accountants Small and medium enterprise management consultants
and more

10
Medium- and Long-term Management Strategies
We have established a shared vision as a part of the three-year 19th management plan “Change! Making Changes! A Fresh Start!”—Becoming a Bank Overflowing with Satisfaction” started in April 2014. In order to become a bank that treats customers with more sincerity than any other bank, cares about its customers more than any other bank, and is liked by everyone, all of the Bank’s executive officers and employees will make concentrated efforts to foster regional prosperity. Our main initiatives are as follows:
Building an All-Hands-In Sales Platform Through BPR
(1) Strengthen financial services functions (a) Strategy closely tied to the region (b) Non-face-to-face channel strategy (c) Branch strategy
(2) Enhance sales and consulting capabilities (a) CS strategy (b) Personnel development / ES strategy (c) Securities investment strategy
11
Issues to Address
The introduction of the negative interest rate policy in Japan along with aggressive action from banks based in other prefectures, including megabanks, has sustained vigorous competition between financial institutions within Aichi Prefecture. As a result, lending interest rates have continued a downward trend, which is having a major impact on profits. To respond to this difficult situation, our policy is to strengthen earnings power by increasing the concentration of transactions and the number of customers under our BPR strategy. The BPR strategy is to build an all-hands-in sales platform, mainly by 1) redeploying branch personnel, 2) concentrating and expanding operations at head office branches, and 3) making use of the competitive capabilities of the Bank’s managers. By reducing the scope of responsibility for district liaisons for the personnel whose numbers were increased by these measures and assigning them to bolster PC personnel, we will aim to increase the concentration of transactions and the number of customers.
Moreover, by increasing the concentration of transactions, we will actively support management of corporate clients through fund arrangement with a focus on business viability, including not only the corporate finance aspect but also corporate sustainability, as well as cooperation with affiliated specialists.
Under our philosophy of “fostering regional prosperity,” we will solve our customers’ various issues and achieve co-existence with local communities with the goal of becoming a bank truly needed by the region.
Management Policy
Based on the guiding precept of “fostering regional prosperity—which shall both develop the Bank and bring happiness to bank employees,” the Bank’s management policy comprises the following five matters which cover the overall image of what the Bank aims to be: “Contribute to the regional community,” “Strengthen our earnings power and ensure thoroughness in risk management,” “Provide financial services that suit the needs of the customers,” “Put compliance into practice” and “Establish a free and open-minded corporate climate.” In accordance with this basic policy, we will strive to further increase our corporate value as a regional financial institution which fosters regional prosperity. At the same time, we will work to fulfill this duty and earn the unshakeable support and trust of our shareholders and all other stakeholders.

12
The Bank’s Corporate Governance
At the Bank of Nagoya, we consider enhancing corporate governance to be one of the most important management challenges. While striving to further enhance our corporate value as a regional financial institution that fosters regional prosperity, we shall fulfill our responsibilities as a corporate citizen and work to establish unshakeable support and trust from all stakeholders, particularly the shareholders.
Based on this principle, the Bank’s guiding precept is to “foster regional prosperity—which shall both develop the Bank and bring happiness to bank employees” through (1) good service—a sincere, considerate and speedy service; (2) good people—lift people, broaden people and create a cheery workplace; and (3) good management—sound and richly innovative management that seeks full participation from employees. To this end, we shall strive to share the basic sense of values and ethics of directors and employees of the Bank, and to ensure that these are reflected in the Bank’s operations. We have formulated a “Code of Ethics for Bank of Nagoya Directors and Employees” and “Regulations for Complying with Laws and Regulations etc.” and through this we are striving to raise corporate value.
Risk Management System
The Bank has enhanced its risk management system by establishing the Asset Liability Management (ALM) Committee to oversee credit risk, liquidity risk, and market risk, and the Operational Risk Management Committee to oversee risks related to internal operations, such as system risk and administrative risk. The Bank also considers compliance as a top priority and aims to establish a system of checks and balances and tighten internal controls by, for example, establishing a Compliance Committee that includes members from outside the Bank, such as attorneys at law. Status of all risks the Bank should address is covered by monthly meetings of these three committees, which will be then reported to the Board of Directors. This consolidated reporting system is designed in the way to enhance the Board of Directors’ ability to monitor the Bank’s risk control functions.

13
Breakdown of Loans (Nonconsolidated basis) Balance of problem loans under the Banking Act (risk monitored loans)
(As of March 31)
2016 (Millions of yen)
2015 (Millions of yen)
Rate of change (%)
Total loans and bills discounted
2,240,959 2,141,242 4.65
Claims to borrowers in bankruptcy *1
1,523 2,275 -33.05
Past due loans *2 47,615 51,794 -8.06
Accruing loans past due three months or more *3
27 30 -10.00
Restructured loans *4 12,087 17,062 -29.15
Ratio of risk monitored loans to total loans and bills discounted
2.73% 3.32% -0.59%
*1 Claims to borrowers in bankruptcy
Of non-accrual loans for which there is no prospect of payment or collection of principal and/or interest, for reasons such as the delay in payment of interest or principal having continued for a considerable period of time, those are subject to the following grounds set forth in the Order for Enforcement of the Corporation Tax Act of Japan: (a) Petition for commencement of reorganization proceedings pursuant to the provisions of the Corporate Reorganization
Act or Act on Special Treatment of Corporate Reorganization Proceedings and Other Insolvency Proceedings of Financial Institutions.
(b) Petition for commencement of rehabilitation proceedings pursuant to the provisions of the Civil Rehabilitation Act. (c) Petition for commencement of bankruptcy proceedings pursuant to the provisions of the Bankruptcy Act. (d) Petition for commencement of special liquidation proceedings pursuant to the provisions of the Companies Act. (e) Suspension of transactions through a clearing house (including bank syndicates that undertake clearing in the relevant
regions when there is no clearing house) (f) Should there be a significant decrease in the economic value of monetary claims against foreign governments, central
banks, and local governments, due to long-term delays in the performance of obligations, and should the receipt of payment be recognized as being extremely difficult.
*2 Past due loans These are non-accrual loans other than claims to borrowers in bankruptcy and loans for which interest payments are deferred in order to assist the financial recovery of borrowers in financial difficulties.
*3 Accruing loans past due three months or more These are loans for which the payment of the principal and/or interest is past due three months or more from the day following contractual payment date, excluding claims to borrowers in bankruptcy and past due loans.
*4 Restructured loans These are loans for which the Bank has relaxed the lending conditions for borrowers in financial difficulties—such as by a reduction of the original rate, forbearance of interest and/or principal payment, granting a maturity date extension—in order to support their financial recovery or restructuring. These exclude claims to borrowers in bankruptcy, past due loans and accruing loans past due three months or more.

14
Balance of problem loans under the Financial Revitalization Act
(As of March 31)
2016 (Millions of yen)
2015 (Millions of yen)
Rate of change (%)
Bankrupt and quasi-bankrupt *5
6,734 7,513 -10.36
Doubtful *6 42,528 46,687 -8.90
Need of special attention *7 12,115 17,092 -29.11
Normal *8 2,204,854 2,096,491 5.16
*5 Bankrupt and quasi-bankrupt These are loans to borrowers who are currently in legal bankruptcy procedures, including bankruptcy, liquidation, corporate reorganization, and rearrangement, and borrowers who are not currently in legal bankruptcy, but in quasi-bankruptcy.
*6 Doubtful These are loans to borrowers who are not currently in bankruptcy, but in difficult financial situations and with a possibility of higher default risk.
*7 Need of special attention These are accruing loans past due 3 months or more (excluding those under *5 and *6), and restructured loans (excluding those under *5 and *6 and accruing loans past due three months or more).
*8 Normal These are loans to borrowers not having particular problems regarding their financial situations and operating conditions, and excluding loans classified as “Bankrupt and quasi-bankrupt,” “Doubtful” and “Need of special attention.”
At March 31, 2016, the ratio of problem loans under the Financial Reconstruction Law was 2.71%.

15
Unrealized Gains on Securities (Nonconsolidated basis)
(As of March 31)
2016 (Billions of yen)
2015 (Billions of yen)
Equity securities 61.2 83.6
Bonds and others 12.8 10.1
Total 74.1 93.7
(Billions of yen)
Capital Adequacy Ratio
A credit rating is a symbol provided by a credit rating agency indicating the degree of certainty that the principle and interest on an individual bond issued by a company will be paid. It is strongly related to the evaluation of a company’s creditworthiness, and in a broad sense expresses the level of confidence in a bank.
The Bank has obtained a credit rating of “A+” from Japan Credit Rating Agency, Ltd. (JCR) with respect to the Bank’s long-term issuer rating. This rating indicates that the debt is investment grade, and is a high rating among Japanese financial institutions.
Rating
Japan Credit Rating Agency, Ltd. (JCR) A+ A high level of capacity to honor the financial commitment on the obligation.

16
Organization of the Bank (As of July 1, 2016)
General Meeting of Shareholders
Business Planning Division
Bu
sin
ess
Pla
nnin
g &
Pro
mot
ion
Hea
dq
uar
ters
Audit and Supervisory
Board
Business Promotion Division
Shanghai Representative Office
Audit and Supervisory Board’s Office
Personal Banking Division
Channel Marketing Division
Board of Directors
Capital Markets & Treasury Division
Board of Executive Directors
Head Office
Credit Supervision Division
Toyota Business
Division
Systems & Operations Division
Corporate Planning Division
Branches
Internal Control Division
Nantong Branch
Tokyo Representative Office
Internal Audit Division

17
Board of Directors and Audit and Supervisory Board (As of June 27, 2016)
Chairman Kazumaro Kato
President Masahiro Nakamura
Deputy President Ichiro Fujiwara
Senior Managing Director Yasuhisa Yamamoto
Managing Directors Shinichi Yokota Hideharu Ishii
Directors Koji Kurachi Shougo Ukai Itaru Iyoda Naoto Sugita Shunji Asami Kiyoshi Imaoka Toshi Saeki*1 Takehisa Matsubara*1 *1 Outside director
Audit and Supervisory Board MembersTetsundo Nakamura*2 *2 Full-time Haruhiko Asano Toshiro Goto Nobuyoshi Hasegawa Takao Kondo
Executive Officers Takayuki Yogo Satoru Hattori Kenji Suzuki Isao Takami
Principal Shareholders (As of March 31, 2016)
Sumitomo Mitsui Banking Corporation 5.03% Mizuho Bank, Ltd. 4.11% Japan Trustee Services Bank, Ltd. (Trust Account) 3.87% Nippon Life Insurance Company 3.54% The Bank of Nagoya Employees’ Shareholding Association (Meigin Minori-kai) 3.54% Meiji Yasuda Life Insurance Company 3.54% The Master Trust Bank of Japan, Ltd. (Toyota Motor Corporation Account) 2.84% SUMITOMO LIFE INSURANCE COMPANY 2.51% Mitsui Sumitomo Insurance Company, Limited 1.99% The Juroku Bank, Ltd. 1.98%
Notes: 1. Shares held by Japan Trustee Services Bank, Ltd. (Trust Account) and The Master Trust Bank of Japan, Ltd. (Toyota Motor Corporation Account) are shares in association with their trust business.
2. In addition to the above, the Bank holds 7,974,000 treasury shares.


19
The Bank of Nagoya, Ltd. and Consolidated Subsidiaries Consolidated Balance Sheets March 31, 2016 and 2015
Thousands of U.S. dollars Millions of yen
2016 2015 2016
Assets:
Cash and due from banks (Note 3) ¥ 242,670 ¥ 269,659 $ 2,153,626
Call loans and bills purchased (Note 3) 2,871 647 25,481
Trading account securities (Notes 3 and 4) – 93 –
Securities (Notes 3, 4, 7, 12 and 21) 969,731 996,619 8,606,067
Loans and bills discounted (Notes 3, 5, 15 and 21) 2,241,953 2,141,885 19,896,641
Foreign exchanges 2,845 7,262 25,252
Lease receivables and investments in leased assets
(Note 15) 26,444 22,881 234,686
Other assets (Note 7) 16,827 15,074 149,342
Tangible fixed assets (Note 6) 36,235 36,499 321,583
Intangible fixed assets 2,022 2,103 17,946
Employee retirement benefit assets (Note 11) 14,618 19,127 129,736
Deferred tax assets (Note 17) 811 953 7,201
Customers’ liabilities for acceptances and
guarantees (Note 12) 10,230 11,406 90,795
Reserve for possible loan losses (12,951) (16,580) (114,943)
Total assets ¥ 3,554,311 ¥ 3,507,632 $ 31,543,413
(Continued) See accompanying Notes to Consolidated Financial Statements.

20
The Bank of Nagoya, Ltd. and Consolidated Subsidiaries Consolidated Balance Sheets March 31, 2016 and 2015
Millions of yen
Thousands of U.S. dollars
2016 2015 2016
Liabilities:
Deposits (Notes 3, 7 and 8) ¥ 3,199,702 ¥ 3,144,113 $ 28,396,370
Call money and bills sold (Notes 3) 10,141 10,214 90,000
Payables under securities lending transactions
(Notes 3 and 7) 18,488 10,392 164,084
Borrowed money (Notes 3, 7 and 9) 26,526 22,148 235,413 Foreign exchanges 44 73 398
Bonds with stock acquisition rights (Notes 3 and 10) 11,268 12,017 100,000
Other liabilities (Notes 17) 19,826 20,620 175,951
Reserve for employee bonuses 1,100 1,087 9,769
Reserve for executive bonuses 51 60 461
Employee retirement benefit liability (Note 11) 4,937 3,824 43,817
Reserve for executive retirement benefits 23 24 212
Reserve for losses on repayments of dormant bank
accounts 369 393 3,275
Reserve for contingent losses 1,834 2,445 16,278
Reserve for loss on interest repayments 199 217 1,766
Deferred tax liabilities (Note 17) 16,908 24,176 150,062
Deferred tax liabilities for revaluation (Note 6) 3,223 3,433 28,606
Acceptances and guarantees (Note 12) 10,230 11,406 90,795
Total liabilities 3,324,877 3,266,650 29,507,257
Net assets (Notes 13, 14 and 19):
Common stock 25,090 25,090 222,674
Capital surplus 18,810 18,645 166,936
Retained earnings 127,458 121,757 1,131,150
Less treasury stock, at cost (3,592) (3,587) (31,886)
Total shareholders’ equity 167,766 161,907 1,488,874
Accumulated other comprehensive income 57,430 74,748 509,677
Stock acquisition rights 76 38 676
Noncontrolling interests 4,161 4,288 36,929
Total net assets 229,434 240,982 2,036,156
Total liabilities and net assets ¥ 3,554,311 ¥ 3,507,632 $ 31,543,413

21
The Bank of Nagoya, Ltd. and Consolidated Subsidiaries Consolidated Statements of Income For the Years Ended March 31, 2016 and 2015
Thousands of U.S. dollars Millions of yen
2016 2015 2016
Income:
Interest income:
Interest on loans and discounts ¥ 25,345 ¥ 26,701 $ 224,938
Interest and dividends on securities 9,263 8,731 82,207
Other interest income 277 218 2,460
Total interest income 34,886 35,652 309,605
Fees and commissions 8,015 7,707 71,133
Other operating income 16,850 15,209 149,544
Reversal of provision for possible loan losses 2,241 2,591 19,890
Gain on sales of stocks and other securities 677 135 6,016
Other income 1,191 1,498 10,571
Total income (Note 23) 63,862 62,795 566,759
Expenses:
Interest expense:
Interest on deposits 1,782 1,641 15,821
Interest on borrowings and rediscounts 205 175 1,819
Other interest expense 551 224 4,898
Total interest expense 2,539 2,041 22,538
Fees and commissions 2,486 2,686 22,065
Other operating expenses 12,895 11,179 114,443
General and administrative expenses (Notes 14 and 18) 32,653 33,996 289,787
Loss on devaluation of stocks and other securities 4 4 38
Impairment loss on fixed assets 250 46 2,227
Other expenses 1,760 1,410 15,623
Total expenses 52,590 51,366 466,721
Profit before income taxes (Note 23) 11,272 11,428 100,038
Income taxes (Note 17) 3,984 4,432 35,362
Profit 7,287 6,995 64,676
Profit attributable to noncontrolling
interests 316 287 2,807
Profit attributable to owners of the
parent ¥ 6,971 ¥ 6,707 $ 61,869
Yen U.S. dollars
Earnings per share:
Basic ¥ 35.37 ¥ 32.83 $ 0.31
Diluted 28.86 32.82 0.26
Cash dividends 7.00 6.50 0.06 See accompanying Notes to Consolidated Financial Statements.

22
The Bank of Nagoya, Ltd. and Consolidated Subsidiaries Consolidated Statements of Comprehensive Income For the Years Ended March 31, 2016 and 2015
Thousands of U.S. dollars Millions of yen
2016 2015 2016
Profit ¥ 7,287 ¥ 6,995 $ 64,676
Other comprehensive income (Note 19):
Net change in unrealized gains (losses) on
available-for-sale securities (12,444) 27,165 (110,443)
Net change in deferred losses on hedging instruments 0 0 1
Net change in land revaluation excess 158 354 1,407
Retirement benefit adjustments (4,926) 3,578 (43,720)
Total other comprehensive income (17,212) 31,097 (152,755)
Comprehensive income ¥ (9,924) ¥ 38,093 $ (88,079)
Comprehensive income attributable to: Owners of the parent ¥ (10,237) ¥ 37,796 $ (90,854)
Noncontrolling interests 312 297 2,775
Total comprehensive income ¥ (9,924) ¥ 38,093 $ (88,079) See accompanying Notes to Consolidated Financial Statements.

23
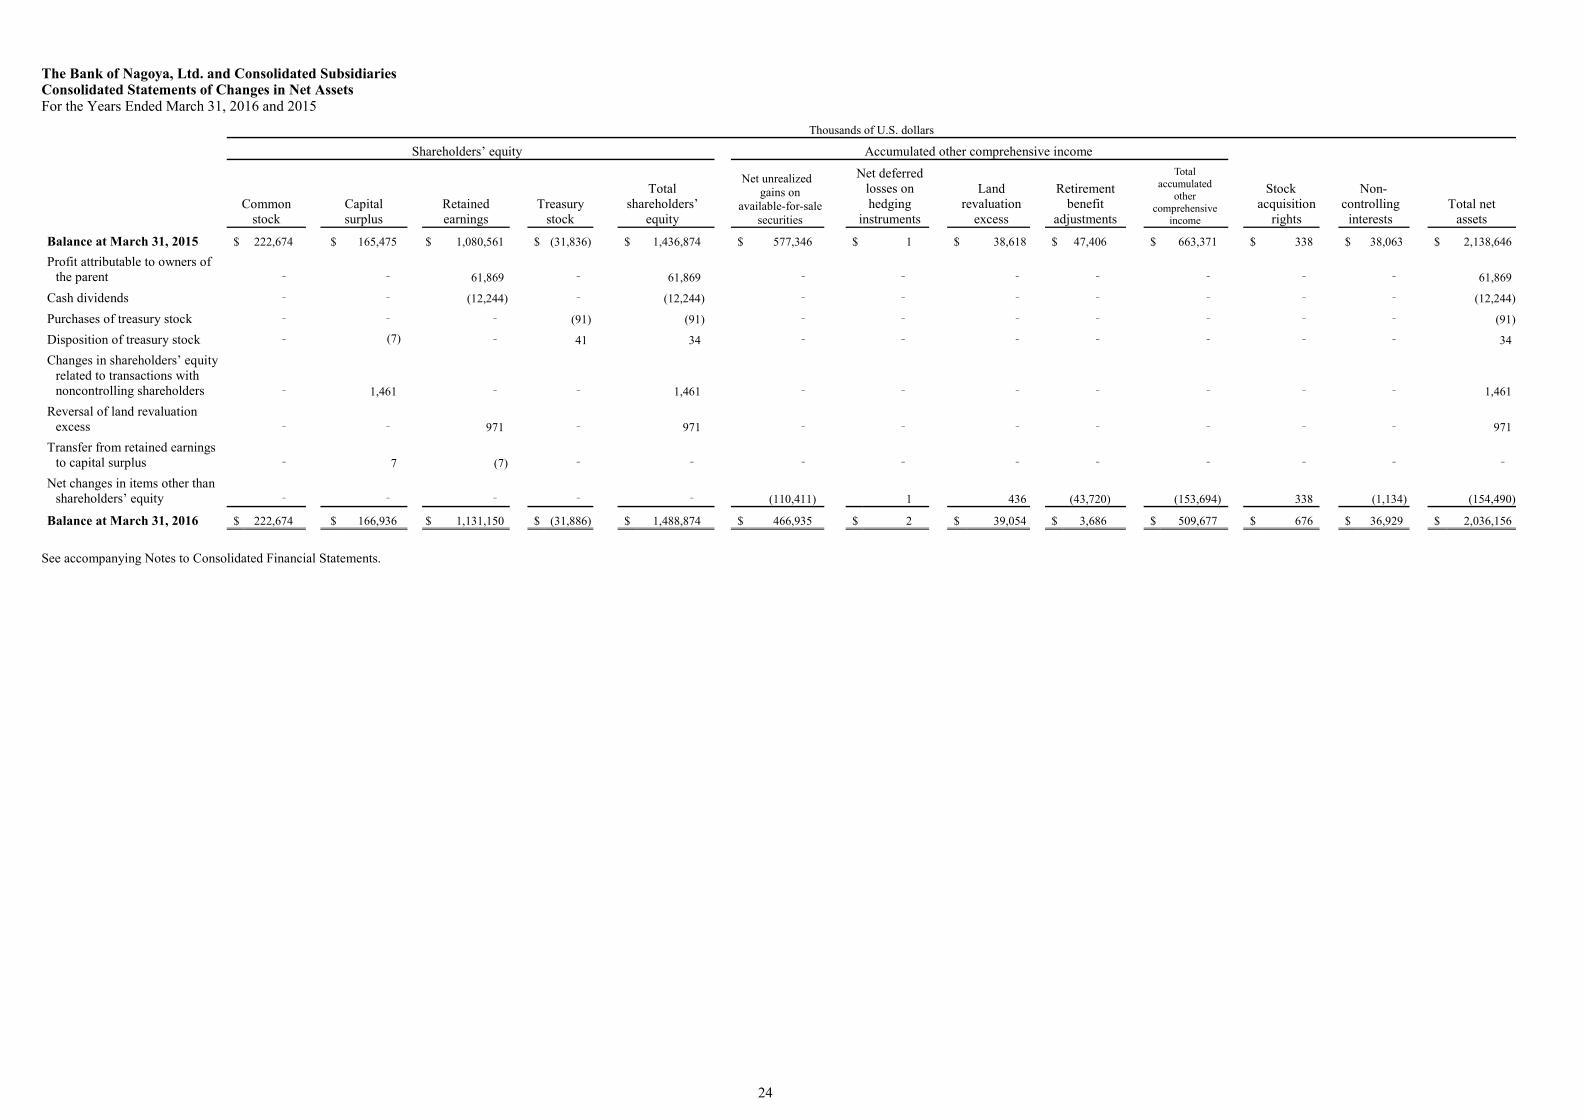
The Bank of Nagoya, Ltd. and Consolidated Subsidiaries Consolidated Statements of Changes in Net Assets For the Years Ended March 31, 2016 and 2015
Millions of yen Shareholders’ equity Accumulated other comprehensive income
Common stock
Capital surplus
Retained earnings
Treasury stock
Total shareholders’
equity
Net unrealized gains on
available-for-sale securities
Net deferred losses on hedging
instruments
Land revaluation
excess
Retirement benefit
adjustments
Total
accumulated other
comprehensive income
Stock acquisition
rights
Non- controlling
interestsTotal net
assets
Balance at March 31, 2014 ¥ 25,090
¥ 18,645
¥ 115,725
¥ (239)
¥ 159,223 ¥ 37,899 ¥ (0) ¥ 4,009 ¥ 1,763 ¥ 43,671
¥ – ¥ 3,994 ¥ 206,889
Cumulative effects of changes in accounting policies – – 642 – 642 – – – – – – – 642
Restated balance at March 31, 2014 25,090 18,645 116,368 (239) 159,865 37,899 (0) 4,009 1,763 43,671 – 3,994 207,531
Profit attributable to owners of the parent – – 6,707 – 6,707 – – – – – – – 6,707
Cash dividends – – (1,329) – (1,329) – – – – – – – (1,329)
Purchases of treasury stock – – – (3,348) (3,348) – – – – – – – (3,348)
Disposition of treasury stock – (0) – 0 0 – – – – – – – 0
Reversal of land revaluation excess – – 11 – 11 – – – – – – – 11
Transfer from retained earnings to capital surplus – 0 (0) – – – – – – – – – –
Net changes in items other than shareholders’ equity – – – – – 27,156 0 342 3,578 31,076 38 294 31,409
Balance at March 31, 2015 25,090 18,645 121,757 (3,587) 161,907 65,055 0 4,351 5,341 74,748 38 4,288 240,982
Profit attributable to owners of the parent – – 6,971 – 6,971 – – – – – – – 6,971
Cash dividends – – (1,379) – (1,379) – – – – – – – (1,379)
Purchases of treasury stock – – – (10) (10) – – – – – – – (10)
Disposition of treasury stock – (0) – 4 3 – – – – – – – 3
Changes in shareholders’ equity related to transactions with noncontrolling shareholders – 164 – – 164 – – – – – – – 164
Reversal of land revaluation excess – – 109 – 109 – – – – – – – 109
Transfer from retained earnings to capital surplus – 0 (0) – – – – – – – – – –
Net changes in items other than shareholders’ equity – – – – – (12,441) 0 49 (4,926) (17,318) 38 (127) (17,407)
Balance at March 31, 2016 ¥ 25,090 ¥ 18,810 ¥ 127,458 ¥ (3,592) ¥ 167,766 ¥ 52,614 ¥ 0 ¥ 4,400 ¥ 415 ¥ 57,430 ¥ 76 ¥ 4,161 ¥ 229,434
24
The Bank of Nagoya, Ltd. and Consolidated Subsidiaries Consolidated Statements of Changes in Net Assets For the Years Ended March 31, 2016 and 2015
Thousands of U.S. dollars
Shareholders’ equity Accumulated other comprehensive income
Common
stock Capital surplus
Retained earnings
Treasury stock
Total shareholders’
equity
Net unrealized gains on
available-for-sale securities
Net deferred losses on hedging
instruments
Land revaluation
excess
Retirement benefit
adjustments
Total accumulated
other comprehensive
income
Stock acquisition
rights
Non- controlling
interests Total net
assets
Balance at March 31, 2015 $ 222,674 $ 165,475 $ 1,080,561 $ (31,836) $ 1,436,874 $ 577,346 $ 1 $ 38,618 $ 47,406 $ 663,371 $ 338 $ 38,063 $ 2,138,646
Profit attributable to owners of the parent – – 61,869 – 61,869 – – – – – – – 61,869
Cash dividends – – (12,244) – (12,244) – – – – – – – (12,244)
Purchases of treasury stock – – – (91) (91) – – – – – – – (91)
Disposition of treasury stock – (7) – 41 34 – – – – – – – 34
Changes in shareholders’ equity related to transactions with noncontrolling shareholders – 1,461 – – 1,461 – – – – – – – 1,461
Reversal of land revaluation excess – – 971 – 971 – – – –
– – – 971
Transfer from retained earnings to capital surplus – 7 (7) – – – – – –
– – – –
Net changes in items other than shareholders’ equity – – – – – (110,411) 1 436 (43,720)
(153,694) 338 (1,134) (154,490)
Balance at March 31, 2016 $ 222,674 $ 166,936 $ 1,131,150 $ (31,886) $ 1,488,874 $ 466,935 $ 2 $ 39,054 $ 3,686 $ 509,677 $ 676 $ 36,929 $ 2,036,156
See accompanying Notes to Consolidated Financial Statements.

25
The Bank of Nagoya, Ltd. and Consolidated Subsidiaries Consolidated Statements of Cash Flows For the Years Ended March 31, 2016 and 2015
Millions of yen Thousands of U.S. dollars
2016 2015 2016 Cash flows from operating activities:
Profit before income taxes ¥ 11,272 ¥ 11,428 $ 100,038Adjustments for:
Depreciation and amortization 2,497 2,604 22,167 Impairment loss on fixed assets 250 46 2,227 Stock option expenses 40 38 361 Decrease in reserve for possible loan losses (3,629) (4,667) (32,208) Decrease (increase) in employee retirement benefit assets 4,509 (5,208) 40,018 Increase (decrease) in employee retirement benefit liability 1,112 (1,900) 9,876 Decrease in reserve for executive retirement benefits (0) (590) (6) Decrease in reserve for contingent losses (611) (988) (5,427) Interest income recognized on statement of income (34,886) (35,652) (309,605) Interest expense recognized on statement of income 2,539 2,041 22,538 Net gains on securities (1,162) (847) (10,314) Foreign exchange losses (gains), net 5,263 (12,475) 46,712 Net (increase ) decrease in call loans and bills purchased and others (2,223) 159 (19,737) Net increase in loans and bills discounted (100,068) (32,110) (888,075) Net increase in lease receivables and investments in leased assets (3,563) (296) (31,623) Net increase in deposits 55,589 142,298 493,341 Net (decrease) increase in call money and bills sold (73) 3,010 (650) Net increase in payables under securities lending transactions 8,096 6,305 71,856 Net increase in borrowed money (excluding subordinated borrowings) 4,377 2,085 38,851 Interest income received 35,322 36,000 313,480 Interest expense paid (2,164) (1,728) (19,211) Others, net (4,736) 3,252 (42,030) Subtotal (22,245) 112,806 (197,421)
Income taxes paid (1,684) (3,329) (14,949) Net cash (used in) provided by operating activities (23,929) 109,477 (212,370)Cash flows from investing activities: Purchases of securities (313,906) (311,733) (2,785,825) Proceeds from sales and maturities of securities 315,714 313,258 2,801,867 Purchases of tangible fixed assets (2,570) (2,329) (22,808) Proceeds from sales of tangible fixed assets 657 2 5,836 Purchases of intangible fixed assets (627) (458) (5,569) Net cash used in investing activities (732) (1,260) (6,499)Cash flows from financing activities:
Proceeds from issuance of bonds with stock acquisition rights – 11,917
Dividends paid to shareholders (1,380) (1,329) (12,252)
Dividends paid to noncontrolling shareholders (2) (2) (26) (Purchase) disposition of treasury stock, net (8) (3,348) (80)
Purchases of stocks of subsidiaries not resulting in change in scope of
consolidation (272) – (2,422) Net cash (used in) provided by financing activities (1,665) 7,237 (14,780) Effect of exchange rate changes on cash and cash equivalents (1) 28 (10) Net (decrease) increase in cash and cash equivalents (26,328) 115,481 (233,659) Cash and cash equivalents at beginning of year 267,205 151,723 2,371,363 Cash and cash equivalents at end of year (Note 2(b)) ¥ 240,876 ¥ 267,205 $ 2,137,704
See accompanying Notes to Consolidated Financial Statements.

26
The Bank of Nagoya, Ltd. and Consolidated Subsidiaries Notes to Consolidated Financial Statements 1. Basis of Consolidated Financial Statements
The accompanying consolidated financial statements of The Bank of Nagoya, Ltd. (the “Bank”) and its consolidated subsidiaries (together with the Bank, the “Group”) have been prepared in conformity with accounting principles generally accepted in Japan (“Japanese GAAP”), which are different in certain respects as to application and disclosure requirements from the International Financial Reporting Standards. The accompanying consolidated financial statements have been restructured and translated into English from the consolidated financial statements of the Bank prepared in accordance with Japanese GAAP and filed with the appropriate Local Finance Bureau of the Ministry of Finance as required by the Financial Instruments and Exchange Act of Japan. Certain supplementary information included in the statutory Japanese language consolidated financial statements, but not required for fair presentation, has not been presented in the accompanying consolidated financial statements. The amounts in Japanese yen are presented in millions of yen and are rounded down to the nearest million. Accordingly, the totals shown in the accompanying consolidated financial statements and the notes thereto may not equal the sum of the individual amounts. The translation of the Japanese yen amounts into U.S. dollar amounts is included solely for the convenience of readers outside Japan, using the prevailing exchange rate at March 31, 2016, which was ¥112.68 to US$1.00. The translation should not be construed as a representation that the Japanese yen amounts have been, could have been or could in the future be converted into U.S. dollars at such or any other rate of exchange. Certain comparative figures have been reclassified to conform to the current year’s presentation.
2. Summary of Significant Accounting Policies (a) Principles of consolidation
The accompanying consolidated financial statements include the accounts of the Bank and its significant subsidiaries. At March 31, 2016 and at March 31, 2015, the Bank had four and five consolidated subsidiaries, respectively, primarily engaged in the business of providing a wide range of financial services to customers. As of January 1, 2016, Meigin Real Property Research Co., Ltd., a former consolidated subsidiary of the Bank, was merged with the Bank, and accordingly, the number of consolidated subsidiaries decreased from five to four for the year ended March 31, 2016. A subsidiary, Aichi-Jimoto Fund for Agriculture, Forestry and Fisheries Investment Limited Partnership, is excluded from the scope of consolidation and the scope of application of the equity method because its profit, retained earnings, accumulated other comprehensive income (each in proportion to the Bank’s interests) and assets are immaterial to the Group’s consolidated financial statements. The carrying amount of the investment in the subsidiary, which is included in “Securities” on the consolidated balance sheets, was ¥0 million ($2 thousand) and ¥0 at March 31, 2016 and 2015, respectively. The Bank had no affiliates at March 31, 2016 or 2015. The difference between the cost of investments in subsidiaries and the underlying equity in their net assets adjusted based on fair value at the time of acquisition is deferred as goodwill and amortized over five years using the straight-line method. Negative goodwill resulting from the acquisition, measured as the excess of the underlying equity in the net assets over the acquisition cost, is charged to income. In consolidation, all intercompany transactions and accounts have been eliminated. In addition, all significant unrealized profits included in assets resulting from transactions within the Group have been eliminated.

27
(b) Cash and cash equivalents
For the purpose of the consolidated statements of cash flows, cash and cash equivalents consisted of cash and due from banks with original maturity of three months or less at March 31, 2016 and 2015 as follows.
Thousands of
Millions of yen U.S. dollars
2016 2015 2016
Cash and due from banks ¥ 242,670 ¥ 269,659 $ 2,153,626 Less due from banks whose
period exceeds three months
(1,794) (2,454) (15,922)
Cash and cash equivalents ¥ 240,876 ¥ 267,205 $ 2,137,704
(c) Trading account securities
Trading account securities are stated at fair value at the fiscal year-end. Related gains and losses, both realized and unrealized, are included in current earnings. Accrued interest on trading account securities is included in “other assets.”
(d) Securities
Debt securities for which the Group has both the intent and the ability to hold to maturity are classified as held-to-maturity debt securities and are stated at amortized cost. In principle, available-for-sale securities other than those classified as trading or held-to-maturity debt securities are carried at fair value based on their market prices at the applicable fiscal year-end, with net unrealized gains and losses reported as component of accumulated other comprehensive income in net assets, net of applicable income taxes. Available-for-sale securities whose fair values are extremely difficult to determine are stated at moving average cost. The carrying values of individual securities are reduced, if necessary, through write-downs to reflect other-than-temporary declines in value. Gains and losses on disposal of securities are principally computed based on the moving average method. Accrued interest on securities is included in “other assets.”
(e) Derivatives and hedge accounting
The Bank uses various derivative instruments. Derivatives are recorded at fair value, with changes in fair values included in the consolidated statements of income for the period in which they arise, except for derivatives that are designated as hedging instruments and qualify for hedge accounting. The Bank applies the deferral method of hedge accounting for hedging foreign exchange risks associated with various foreign currency denominated monetary assets and liabilities in accordance with the Industry Audit Committee Report No. 25 (July 29, 2002), entitled the “Treatment of Accounting and Auditing concerning Accounting for Foreign Currency Transactions in Banking Industry,” issued by the Japanese Institute of Certified Public Accountants (“JICPA”). The effectiveness of the currency swap transactions, foreign exchange swap transactions and similar transactions that hedge foreign exchange risks of monetary receivables and payables denominated in foreign currencies as described above is assessed based on the comparison of the hedged monetary receivables and payables denominated in foreign currencies and the foreign currency positions of the corresponding hedging instruments.
(f) Loans and bills discounted and reserve for possible loan losses
The reserve for possible loan losses is established based on the Bank’s management’s judgment and assessment of future losses. The Bank implements a self-assessment system for its asset quality. The quality of all loans is assessed by each of the Bank’s branches and business units and is

28
subsequently examined by the Bank’s Credit Supervision Division in accordance with the Bank’s policies and rules for self-assessment of asset quality. The Bank has established a credit rating system under which customers are classified into five categories. All loans are classified for self-assessment purposes into the following categories: “legal bankruptcy,” “de facto bankruptcy,” “bankruptcy risk,” “under observation” and “normal.” The Bank provides a reserve for possible loan losses at an amount deemed necessary to cover possible future losses. For claims against borrowers in legal bankruptcy and de facto bankruptcy, a reserve is provided based on the amounts of such claims, net of the amounts expected to be collected through disposal of collateral or from guarantees. For claims against borrowers who have bankruptcy risk, a reserve is provided in the amounts considered necessary based on the overall solvency assessment performed for the amounts of such claims, net of the amounts expected to be collected through disposal of collateral or from guarantees. For claims against borrowers in the “under observation” and “normal” category, a reserve is provided based on the historical loss experience of the Bank for a certain past period. The reserve amounts recorded by consolidated subsidiaries are provided at the aggregate amount of estimated credit losses based on the individual financial review approach for doubtful or troubled claims. For other claims, an amount deemed necessary is provided as reserve taking into consideration the historical loss experience.
(g) Tangible fixed assets and depreciation (except for leases)
Tangible fixed assets are principally stated at cost less accumulated depreciation. Depreciation is computed by the declining balance method over the estimated useful life of the asset, except for buildings (excluding facilities attached thereto) acquired on or after April 1, 1998, which are depreciated using the straight-line method. For the years ended March 31, 2016 and 2015, the useful life of buildings ranged from 15 to 50 years, and the useful life of equipment and other ranged from 4 to 20 years. Tangible fixed assets of the consolidated subsidiaries are mainly depreciated using the straight-line method over the estimated useful lives of such assets.
(h) Intangible fixed assets and amortization
Intangible fixed assets are amortized using the straight-line method. Costs of computer software developed or obtained for internal use are capitalized and amortized principally using the straight-line method over the estimated useful life of five years.
(i) Leases
(Accounting for leases as lessee) The Group, as lessee, capitalizes the assets used under finance leases that do not transfer ownership and whose commencement falls on or after April 1, 2008, except for certain immaterial or short-term finance leases accounted for as operating leases. Depreciation of leased assets capitalized in finance lease transactions is computed by the straight-line method over the lease term, as useful life, with the assumption of having no residual value unless residual value is guaranteed by the lease contract.

29
(Accounting for leases as lessor) A certain consolidated subsidiary engaged in leasing operations, as lessor, recognizes as “investments in leased assets” finance leases that do not transfer ownership of the leased assets to the lessee and recognizes as “lease receivables” finance leases that transfer ownership in a manner similar to the accounting treatment for ordinary sale transactions. The total amount equivalent to interest is allocated over the lease term using the interest method, and the subsidiary recognizes as income lease payments received from customers at the time of receipt and related costs, net of imputed interest, as permitted by the accounting standard. With respect to finance leases commenced prior to April 1, 2008, the appropriate book values of fixed assets, net of accumulated depreciation, as of March 31, 2008 are recognized as the value of the investments in such leased assets at April 1, 2008, and the total amount equivalent to interest is allocated over the lease term using the straight-line method. Although the revised accounting standard generally requires the use of the interest method as the principal method of calculation, it permits the use of the straight-line method during the transitional period. As a result, revenues from interests for the years ended March 31, 2016 and 2015 were ¥8 million ($78 thousand) and ¥53 million more, respectively, than the amount that would have been calculated using the interest method.
(j) Impairment of fixed assets A fixed asset is reviewed for impairment whenever events or changes in circumstances indicate that the carrying amount of such asset may not be recoverable. An impairment loss is recognized in the income statement by reducing the carrying amount of the impaired asset or a group of assets to the recoverable amount, measured at the higher of the asset’s net selling price or value in use. Fixed assets include land, buildings and other forms of property, including intangible assets, and are grouped at the lowest level at which there are identifiable cash flows separate from other groups of assets. For the purpose of recognition and measurement of an impairment loss, fixed assets of the Bank, other than idle or unused property, are grouped into cash generating units, such as operating branches and the like, and fixed assets of the consolidated subsidiaries are grouped into respective units which manage and determine income and expenses relating to such assets. The Group recognized impairment loss on fixed assets amounting to ¥250 million ($2,227 thousand) and ¥46 million for unprofitable operating branches for the years ended March 31, 2016 and 2015, respectively. Recoverable amounts of the assets were measured based on their net selling prices, which were based on appraisal values or expected selling amounts less estimated costs of disposal. Accumulated impairment loss is deducted from the net book value of each asset.
(k) Foreign currency translation
The Group’s assets and liabilities denominated in foreign currencies, including the accounts of its foreign branches, are translated into Japanese yen at the exchange rate prevailing at the fiscal year-end. Revenues and expenses are translated at the exchange rate prevailing on the applicable transaction dates. Gains and losses resulting from transactions are included in the determination of profit (loss).
(l) Reserve for employee bonuses A reserve for employee bonuses is provided based on the estimated amount of future payments attributable to the respective year.
(m) Reserve for executive bonuses
A reserve for executive bonuses is provided for the payment of bonuses to directors and audit and supervisory board members based on the estimated amount of the payments attributable to the respective year.
(n) Reserve for employee retirement benefits Employees who terminate their services with the Group are entitled to retirement benefits which are generally determined based on the current basic rate of pay, length of service and conditions under which the termination has occurred.

30
The Group has principally recognized retirement benefits based on the actuarial present value of the retirement benefit obligation using the actuarial appraisal approach and the fair value of pension plan assets available for benefits at the respective fiscal year-end. Effective from the year ended March 31, 2015, the Group has applied Article 35 of the “Accounting Standard for Retirement Benefits” (Accounting Standards Boards of Japan (“ASBJ”) Statement No. 26, revised on May 17, 2012 (hereinafter, “Statement No. 26”)) and Article 67 of the “Guidance on Accounting Standard for Retirement Benefits” (ASBJ Guidance No. 25, revised on March 26, 2015, (hereinafter, “Guidance No. 25”)), and, accordingly, the methods used to calculate retirement benefit obligation and current service cost have been revised. The method used to attribute expected retirement benefits to periods of service has been revised from the straight-line method to the benefit formula method, and the method used to determine the discount rate has been changed from a method that used the period which approximated the expected average remaining service period of employees to one that uses a single weighted average discount rate reflecting the estimated periods and the amount of retirement benefit payment in each period. In accordance with the transitional treatment prescribed in Article 37 of Statement No. 26, the effect of changing the methods used to calculate retirement benefit obligation and current service cost have been added to or reduced from retained earnings as of April 1, 2014. As a result, as of April 1, 2014, “employee retirement benefit assets” and “employee retirement benefit liability” decreased by ¥171 million and ¥1,164 million, respectively, and “deferred tax liabilities” and “retained earnings” increased by ¥350 million and ¥642 million, respectively. Also, “profit before income taxes” increased by ¥81 million for the year ended March 31, 2015. In the calculation of retirement benefit obligation, the expected retirement benefits are attributed to periods up to the end of the respective fiscal year using the benefit formula method. Past service cost is amortized by the straight-line method over a certain period within the average remaining years of service of employees. Actuarial differences arising from changes in the retirement benefit obligation or value of plan assets not anticipated by previous assumptions or from changes in the assumptions themselves are amortized on a straight-line basis over a certain period within the average remaining years of service of employees, measured from the year following the year in which such differences arise. For the amortization of past service cost and actuarial differences, the Bank recognizes an amortization period of 13 years as the period within the average remaining years of services of employees. The consolidated subsidiaries use the simplified method in calculating employee retirement benefit liability and retirement benefit expenses. Under this method, the amount for severance payments required at the year-end for voluntary termination is deemed retirement benefit obligations.
(o) Reserve for executive retirement benefits
A reserve for executive retirement benefits of the consolidated subsidiaries is provided based on the Group’s internal rules in the amount that would be payable assuming the directors and audit and supervisory board members of the consolidated subsidiaries terminated their services at the balance sheet date. At the Annual General Meeting of the Shareholders held on June 27, 2014, the Bank resolved the lump-sum payments in connection with abolishment of the executive retirement benefit scheme of the Bank. As a result, as of April 1, 2014, the entire balance of reserve for executive retirement benefit was reversed, and the amount to be paid due to the abolishment of ¥545 million was included in “other liabilities.”
(p) Reserve for losses on repayments of dormant bank accounts
In order to cover possible losses on claims from customers for repayment of dormant bank accounts which were previously recognized as income, the Bank provides a reserve to the extent of estimated losses based on historical loss experience and taking into consideration the repayment conditions for a certain past period. A reserve for losses on repayments of dormant bank accounts was included in “other expenses” and amounted to ¥69 million ($613 thousand) and ¥121 million for the years ended March 31, 2016 and 2015, respectively.

31
(q) Reserve for contingent losses
A reserve for contingent losses is provided at an amount deemed necessary to cover possible future losses from default of loans under the responsibility-sharing system on guarantees of loans with the Credit Guarantee Corporation based on historical default loss experience. For the years ended March 31, 2016 and 2015, a reversal of reserve for contingent losses of ¥611 million ($5,427 thousand) and ¥988 million, respectively, was included in “other income.”
(r) Reserve for loss on interest repayments In order to cover possible losses on the repayment of interest to be received from customers that exceeds the upper limit of interest rates prescribed under the Interest Rate Restriction Act, two consolidated subsidiaries provide a reserve for loss on interest repayments to the extent of the estimated losses that may be incurred from repayment claims against customers for whom court settlements have not been reached. Such estimated losses are based on the historical loss experience taking into consideration the repayment conditions for a certain past period.
(s) Income taxes Income taxes are accounted for by the asset-liability method. Deferred tax assets and liabilities are recognized as future tax consequences attributable to differences between the financial statement carrying amounts of existing assets and liabilities and their respective tax bases and operating loss carryforwards. Deferred tax assets and liabilities are measured using the enacted tax rates expected to apply to taxable income in the years in which those temporary differences are expected to be recovered or settled. The effect of a change in tax rates on deferred tax assets and liabilities is recognized in the period that includes the promulgation date.
(t) Appropriation of retained earnings Cash dividends are recorded in the fiscal year when a proposed appropriation of retained earnings is approved by the Bank’s Board of Directors and/or shareholders.
(u) Per share data Basic earnings per share is computed by dividing profit attributable to common shareholders of the parent by the weighted average number of shares of common stock outstanding during the respective year. Diluted earnings per share is computed by reflecting the potential dilution that could occur if securities were exercised or converted into common stock. Diluted earnings per share for the year ended March 31, 2016 was computed by taking into account 26,969 thousand potential shares of common stock in relation to bonds with stock acquisition rights of 26,809 thousand shares and stock acquisition rights of 160 thousand shares. In addition, Diluted earnings per share for the year ended March 31, 2016 was computed by adjusting profit attributable to owners of the parent by ¥(503) million ($(4,467) thousand), which was adjustment to other operating income after tax effected. Diluted earnings per share for the year ended March 31, 2015 was computed by taking into account 69 thousand potential shares of common stock in relation to stock acquisition rights. U.S. dollar denominated zero-coupon convertible bond-type bonds with stock acquisition rights (due in 2020) with a total face value of $100,000 were not taken into account for computation of diluted earnings per share for the year ended March 31, 2015 as they have no dilutive effects. Descriptions of such bonds are provided in Note 10, “Bonds with stock acquisition rights.”
Cash dividends per share shown in the accompanying consolidated statements of income represent dividends declared applicable to the respective years shown.
32
(v) Changes in accounting policies
Accounting Standard for Business Combinations, etc. Effective from the year ended March 31, 2016, the Group has applied the “Accounting Standard for Business Combinations” (Accounting Standard Board of Japan (“ASBJ”) Statement No. 21, September 13, 2013 (hereinafter the “Statement No. 21”)), the “Accounting Standard for Consolidated Financial Statements” (ASBJ Statement No. 22, September 13, 2013 (hereinafter, the “Statement No. 22”)) and the “Accounting Standard for Business Divestitures” (ASBJ Statement No. 7, September 13, 2013 (hereinafter “Statement No. 7”)). Accordingly, the Group has changed the accounting treatment to record differences associated with changes in the Bank’s ownership interest in subsidiaries over which the Bank retains control as capital surplus and to record acquisition related costs as expenses in the fiscal year in which the costs are incurred. In addition, for business combinations carried out on or after the beginning of the year ended March 31, 2016, the Group has changed the accounting treatment to reflect reallocation of acquisition costs resulting from finalization of the provisional accounting treatment in the consolidated financial statements for the fiscal year in which the date of business combination belongs. The Group also changed the presentation of net income and the term from “minority interests” to “noncontrolling interests.” The Group has reclassified the consolidated financial statements for the year ended March 31, 2015 to conform to these changes in presentation. In the consolidated statement of cash flows for the year ended March 31, 2016, the cash flows related to acquisition or sale of subsidiaries’ shares not resulting in a change in the scope of consolidation are classified as “Cash flows from financing activities,” and cash flows related to acquisition-related costs for subsidiaries’ shares resulting in a change in the scope of consolidation or expenses arising from acquisition or sale of subsidiaries’ shares not resulting in a change in the scope of consolidation are classified as “Cash flows from operating activities.” The Group has applied the Statement No. 21 and other accounting standards in accordance with transitional treatments stipulated in Article 58-2 (4) of the Statement No. 21, Article 44-5 (4) of the Statement No. 22, and Article 57-4 (4) of Statement No. 7. These standards are prospectively applied from the beginning of the year ended March 31, 2016. As a result, profit before income taxes decreased by ¥164 million ($1,461 thousand) for the year ended March 31, 2016, and capital surplus in the consolidated statement of changes in net assets as of March 31, 2016 increased by ¥164 million ($1,461 thousand). Basic earnings per share and diluted earnings per share for the year ended March 31, 2016 decreased by ¥0.83 ($0.01) and ¥0.74 ($0.01), respectively. There was no effect on net assets per share.
(w) New accounting standards not yet applied by the Group Implementation Guidance on Recoverability of Deferred Tax Assets (ASBJ Guidance No. 26, March 28, 2016 (hereinafter the “Guidance No 26”)) (1) Outline
Guidance No 26 basically follows the guidance for recoverability of deferred tax assets prescribed in Japanese Institute of Certified Public Accountants Auditing Committee Report No. 66, “Audit Treatment regarding Judgement of Recoverability of Deferred Tax Assets” and has made partial revision.
(2) Date of application
The Group expects to apply Guidance No 26 effective from the beginning of the year beginning on or after April 1, 2016.
(3) Effect of application
The Group is currently assessing the effect of applying Guidance No 26.

33
3. Financial Instruments and Related Disclosures (a) Qualitative information on financial instruments
(1) Group policy for financial instruments
The Group undertakes deposit, loan and investment operations. Since the Group has financial assets and liabilities which mainly involve interest rate risk, the Bank has adopted the Asset Liability Management (“ALM”) system to avoid unfavorable effects of interest rate fluctuations. Derivative transactions are used as part of ALM.
(2) Nature of financial instruments and related risks Financial assets held by the Group comprise mainly loans to domestic corporate entities and individuals and securities. Loans are subject to customer credit risk arising from default by borrowers. There is a possibility that the borrowers will not perform their obligations in accordance with the applicable contract terms due to economic circumstances or other reasons. Securities, which primarily comprise equity securities, bonds and investment trusts, are held for investment and business promotion purposes. These securities are exposed to the credit risk of issuers, interest rate fluctuation risk and/or market price fluctuation risk. For securities denominated in foreign currencies, bonds denominated in foreign currencies are basically purchased at an amount up to the corresponding amount of deposits and fund procurement from the market in foreign currencies to avoid foreign exchange fluctuation risk. Financial liabilities include mainly deposits from customers and are subject to liquidity risk. There is an interest or maturity mismatch between assets such as loans and bills discounted and liabilities such as deposits that exposes these assets and liabilities to interest rate fluctuation risk. Derivative transactions include interest rate swaps and forward foreign exchange contracts. The Group uses derivative transactions in line with ALM in order to avoid interest rate fluctuation risk in relation to deposits and loans and to fulfill the customers’ hedging requirements for foreign exchange fluctuation risk. Hedge accounting is applied to certain transactions which offset market fluctuations or fix cash flows and fulfill preliminary and subsequent requirements. Derivative transactions which do not meet the hedge accounting criteria are exposed to foreign exchange fluctuation risk and interest rate fluctuation risk.
(3) Risk management for financial instruments (i) Credit risk management
The Group manages its credit risk by maintaining a credit exposure management system in relation to loans in accordance with its “Credit Policy,” which stipulates the basic concepts in relation to its credit exposure management and administrative rules regarding credit risk. The system includes the credit administration of loans, credit lines, credit records and internal ratings and the establishment of guarantees and/or collateral and handling of doubtful loans. These credit exposure management procedures are performed by each of the Group’s sales branches and loan departments and are reported to the Board of Executive Directors and/or Board of Directors on a regular basis.
The credit risk of issuers of securities and the counterparty risk of derivative transactions are managed by the Bank’s Capital Markets and Treasury Division which monitors credit information and fair values on a regular basis.
(ii) Market risk management (a) Interest risk management
The Group has established the ALM committee for the purpose of recognizing and managing interest rate fluctuation risk comprehensively and implementing appropriate ALM. Risk control methods and procedures are stipulated in the ALM committee codes, and the ALM committee

34
operates in accordance with the management policy of ALM determined at the Board of Directors’ meeting. The status of implementation is monitored and actions to be taken in the future are discussed at the Board of Directors’ meeting. On a daily basis, the Bank’s Risk Control Division checks interest rates and periods of financial assets and liabilities, monitors risks using gap analysis and interest rate sensitivity analysis and reports to the ALM committee and Board of Directors monthly. Interest rate swap transactions are also used under the ALM system to avoid interest rate fluctuation risk.
(b) Foreign exchange risk management
The Group manages foreign exchange fluctuation risk by transaction and enters into forward foreign exchange contracts to avoid foreign exchange fluctuation risk on transactions with customers.
(c) Market price fluctuation risk management The Group holds investment products including securities based on marketable securities investment planning determined by the Board of Executive Directors in accordance with basic market fluctuation risk management rules of the Board of Directors. Since the Bank’s Capital Markets and Treasury Division purchases investment products from outside, market price fluctuation risk is reduced through effective monitoring after preliminary review and the establishment of investment limits. Most of the equity securities managed by the Bank’s Planning Division are for business promotion purposes, and market conditions and the financial status of customers are monitored and reported to the Board of Executive Directors on a regular basis.
(d) Derivative transactions
For derivative transactions, an internal checking system has been established through segregating the operation, custody and evaluation of hedge effectiveness.
(e) Quantitative information on market risk
i) Financial instruments for trading purposes The Group uses the historical simulation method (based on the assumptions of a holding period of 120 business days, 99% confidence level and observation period of 1,200 business days) for the calculation of interest-related Value at Risk (VaR) of trading account securities. As of March 31, 2016 and 2015, the market risk exposures (the expected maximum loss) of the Group’s trading operation amounted to none and ¥2 million, respectively.
ii) Financial instruments other than for trading purposes
Market risk is the primary risk to the Group. The major financial instruments subject to market risk are “loans and bills discounted,” debt and equity securities and investment trusts included in “securities” and “deposits” and interest rate swaps included in “derivatives.” The historical simulation method (based on the assumptions of a holding period of 120 business days, 99% confidence level and observation period of 1,200 business days) is used for the calculation of VaR of these financial assets and liabilities. As of March 31, 2016 and 2015, the market risk exposures (the expected maximum loss) of the Bank’s banking operations were as follows.

35
Value at Risk
Millions of yen
Thousands of U.S. dollars
2016 2015 2016
Securities for investment purposes (*1) ¥ 10,640 ¥ 11,094 $ 94,428Strategically held equity securities 18,914 24,418 167,858Loans and deposits (*2) 5,624 5,798 49,915Notes: (*1) Securities for investment purposes: yen bonds, foreign bonds, equity securities for
investment purposes, investment trusts and OTC options (*2) Loans and deposits: deposits, negotiable certificates of deposit, loans and bills discounted,
interest rate swaps for ALM hedging purposes, call loans, due from banks, bonds with stock acquisition rights and others
iii) Supplementary explanation about quantitative information on market risk
The Group evaluates the effectiveness of its measurement model by performing back-testing procedures to compare VaR calculated by the measurement system with actual gain or loss. VaR provides information regarding market risk exposure, which is statistically calculated under certain probability based on historical market fluctuations; therefore, it may not be able to measure risks under situations in which the market environment changes extraordinarily.
(iii) Management of liquidity risk associated with fund raising
The Group regards stable funding of its operations as its top priority and conducts effective fund management. In addition, the Group manages liquidity risk by diversifying the means of raising funds and adjusting the balance of long-term and short-term accounts taking into consideration market conditions.
(4) Supplementary explanation on fair values
The fair value of financial instruments is based on market price. If a market price is not available, another rational valuation technique is used. Since certain assumptions are used when calculating fair values, different assumptions may lead to different fair values.

36
(a) Fair values of financial instruments
The carrying values and fair values of financial instruments at March 31, 2016 and 2015 were as follows.
Millions of yen
2016
Carrying
valueFair
value Difference
Cash and due from banks ¥ 242,670 ¥ 242,670 ¥ –Call loans and bills purchased 2,871 2,871 –Securities - available-for-sale securities (*1) 967,178 967,178 –Loans and bills discounted: 2,241,953 Reserve for possible loan losses (*2) (12,041)
Loans and bills discounted – subtotal 2,229,912 2,253,954 24,042
Total ¥ 3,442,632 ¥ 3,466,674 ¥ 24,042
Deposits ¥ 3,199,702 ¥ 3,201,375 ¥ 1,672Call money and bills sold 10,141 10,141 –Payables under securities lending transactions 18,488 18,488 –Borrowed money 26,526 26,562 36Bonds with stock acquisition rights 11,268 11,176 (91)
Total ¥ 3,266,127 ¥ 3,267,745 ¥ 1,618
Derivative transactions (*3): Hedge accounting not applied ¥ 796 ¥ 796 ¥ –Hedge accounting applied 12 12 –
Total ¥ 808 ¥ 808 ¥ – Millions of yen
2015
Carrying
valueFair
value Difference
Cash and due from banks ¥ 269,659 ¥ 269,659 ¥ –Call loans and bills purchased 647 647 –Trading account securities 93 93 –Securities - available-for-sale securities (*1) 992,287 992,287 –Loans and bills discounted: 2,141,885 Reserve for possible loan losses (*2) (15,611)
Loans and bills discounted – subtotal 2,126,274 2,148,625 22,351
Total ¥ 3,388,961 ¥ 3,411,312 ¥ 22,351
Deposits ¥ 3,144,113 ¥ 3,145,565 ¥ 1,452Call money and bills sold 10,214 10,214 –Payables under securities lending transactions 10,392 10,392 –Borrowed money 22,148 22,194 45Bonds with stock acquisition rights 12,017 11,812 (204)
Total ¥ 3,198,885 ¥ 3,200,179 ¥ 1,293
Derivative transactions (*3): Hedge accounting not applied ¥ (2,062) ¥ (2,062) ¥ –Hedge accounting applied (15) (15) –
Total ¥ (2,078) ¥ (2,078) ¥ –

37
Thousands of U.S. dollars
2016
Carrying
value Fair
value
Difference
Cash and due from banks $ 2,153,626 $ 2,153,626 $ –Call loans and bills purchased 25,481 25,481 –Securities - available-for-sale securities (*1) 8,583,406 8,583,406 –Loans and bills discounted: 19,896,641
Reserve for possible loan losses (*2) (106,861)
Loans and bills discounted – subtotal 19,789,780 20,003,147 213,367
Total $ 30,552,293 $ 30,765,660 $ 213,367
Deposits $ 28,396,370 $ 28,411,217 $ 14,847Call money and bills sold 90,000 90,000 –
Payables under securities lending transactions 164,084 164,084 –Borrowed money 235,413 235,737 324Bonds with stock acquisition rights 100,000 99,191 (809)
Total $ 28,985,867 29,000,229 14,362
Derivative transactions (*3): Hedge accounting not applied $ 7,070 $ 7,070 $ –Hedge accounting applied 108 108 –
Total $ 7,178 $ 7,178 $ –
Notes:
(*1) The following securities were excluded from the above table because management of the Bank concluded that the fair value was virtually impossible to estimate.
Millions of yen
Thousands of U.S. dollars
2016 2015 2016
Unlisted stocks *1 ¥ 2,442 ¥ 4,326 $ 21,673
Investments in partnerships *2 5 988
Total ¥ 2,553 ¥ 4,331 $ 22,661
*1 The Group wrote off unlisted stocks amounting to ¥4 million ($38 thousand) and ¥4 million for the years ended March 31, 2016 and 2015, respectively.
*2 The fair value of investments in partnerships that comprised assets whose fair value could not be reliably determined were not disclosed.
(*2) General and individual reserves for possible loan losses corresponding to loans and bills discounted were
deducted. (*3) Derivative transactions show net amounts after offsetting related receivables and payables. Amounts in
parentheses denote net payables.
Details of the methodologies and assumptions used to calculate fair values of financial instruments are summarized below.
Financial assets:
Cash and due from banks
Since the carrying value of due from banks on demand or with an original maturity of up to one year approximates the fair value, the carrying value is deemed the fair value. For due from banks with an original maturity exceeding one year, the present value is calculated by discounting such due from banks by the remaining term to maturity at the rate applicable for a similar new transaction.

38
Call loans and bills purchased
The carrying value of call loans and bills purchased approximate fair value because of the short maturity (original maturities of up to one year). Trading account securities
The fair value of trading account securities held for trading operation is based on the price published by Japan Securities Dealers Association (“JSDA”) or provided by the contracted financial institution. Securities
The fair value of equity securities, bonds and investment trusts is based on the quoted market price at the applicable exchange, the price published by JSDA or provided by the contracted financial institution and publicly available net asset value, respectively. The fair value of privately-placed bonds are determined by discounting the estimated future cash flows at the risk free rate plus the credit spread or the like. The fair value of securities issued by issuers in legal bankruptcy or de facto bankruptcy or who are at risk of bankruptcy are calculated based on the present value of estimated future cash flows or the amount expected to be collected through the disposal of collateral or from guarantees. Loans and bills discounted
The fair value of commercial bills, loans on bills and overdrafts, all of which have short maturities (original maturities of up to one year), approximate the carrying value unless the credit status of the borrower has changed dramatically after execution because of the quick reaction of market interest rates to such changes. Therefore, the carrying value of these instruments is deemed the fair value. The fair value of loans on deeds is determined by discounting the estimated future cash flows at the risk free rate plus the credit spread or the like at the rate for a similar new loan, depending on the nature of such loans. The fair value of structured loans is determined by considering the value calculated by using the option pricing model in addition to using the method applicable to measuring the fair value of loans on deeds as mentioned above. For loans to borrowers in legal bankruptcy or de facto bankruptcy or who are at risk of bankruptcy risk, a reserve for possible loan losses is estimated based on the present value of estimated future cash flows or the amount expected to be collected through disposal of collateral or from guarantees. Thus, the fair value of such loans approximates the carrying amount of receivables minus the corresponding reserve for possible loan losses on the consolidated balance sheets at the closing date. Therefore, such carrying amounts are deemed to be the fair value of such loans. The carrying value of loans and bills discounted without repayment terms due to characteristics such as limitations on loans to the range of collateral assets is deemed the fair value as the carrying values approximates the fair value when considering the expected repayment period and interest rate conditions for such loans and bills discounted without repayment terms.
Financial liabilities: Deposits
The fair value of demand deposits in Japanese yen is deemed the amount to be paid (carrying amount) assuming that the Group is demanded to pay on the consolidated balance sheet date. The fair value of time deposits in Japanese yen and negotiable certificates of deposit is determined by discounting future cash flows by the term to maturity at the rate used for accepting a new deposit. For all deposits in foreign currencies, original maturities are short (within one year) and the carrying value approximates the fair value. Thus, such carrying value is deemed the fair value.

39
Call money and bills sold
The original maturities of call money and bills sold are short (within one year) and the carrying value approximates the fair value. Thus, the carrying value is deemed the fair value. Payables under securities lending transactions
The original maturities of payables under securities lending transactions are short (within one year) and their carrying values approximate their fair values. Thus, such carrying values are deemed to be the fair values of such payables under securities lending transactions.
Borrowed money
The carrying value of borrowed money with a variable interest rate is deemed the fair value since the carrying value approximates the fair value. This is due to the quick reaction of market interest rates and immaterial changes in the credit status of the Bank and its subsidiaries after execution of such borrowing. The fair value of borrowed money with a fixed interest rate is the present value determined by discounting the sum of principal and interest by the term to maturity at the rate for a similar new borrowing. For borrowed money with a short maturity (original maturity of up to one year), the carrying value is deemed the fair value since the carrying value approximates the fair value. Bonds with stock acquisition rights
The fair value of bonds with stock acquisition rights issued by the Bank is determined based on market price.

40
(b) Maturity analysis for monetary claims and securities with contractual maturities as of March 31, 2016
Millions of yen 2016
Due in one year or less
Due after one year through
three years
Due after three years
through five years
Due after five years through
seven years
Due after seven years
through ten years
Due after ten years
Due from banks ¥ 208,149 ¥ – ¥ – ¥ – ¥ – ¥ –Call loans and bills
purchased 2,871 – – – – –Securities: Available-for-sale securities with maturities (*1)
National government bonds 62,700 36,400 41,800 25,500 18,000 2,000
Local government bonds 13,751 28,036 29,068 6,998 29,908 –
Bonds and debentures 44,920 97,788 172,614 64,807 34,916 2,508
Others (*2) 14,989 27,203 28,651 23,662 18,344 –
Securities - total 136,361 189,429 272,135 120,968 101,168 4,508Loans and bills
discounted (*3) 687,558 439,214 287,440 164,275 208,399 405,874
Total ¥ 1,034,940 ¥ 628,643 ¥ 559,575 ¥ 285,243 ¥ 309,568 ¥ 410,382
Thousands of U.S. dollars
Due from banks $ 1,847,258 $ – $ – $ – $ – $ –Call loans and bills
purchased 25,481 – – – – –
Securities: Available-for-sale securities with maturities (*1) National
government bonds 556,443 323,039 370,962 226,304 159,744 17,750
Local government bonds 122,041 248,817 257,978 62,105 265,425 –
Bonds and debentures 398,659 867,845 1,531,904 575,151 309,873 22,258
Others (*2) 133,023 241,424 254,274 210,000 162,800 –
Securities - total 1,210,166 1,681,125 2,415,118 1,073,560 897,842 40,008Loans and bills
discounted (*3) 6,101,867 3,897,895 2,550,944 1,457,890 1,849,479 3,602,007
Total $ 9,184,772 $ 5,579,020 $ 4,966,062 $ 2,531,450 $ 2,747,321 $ 3,642,015
Notes: (*1) Amounts of securities were stated on the basis of scheduled redemption amounts regarding the principal and do not match
the amounts shown in the consolidated balance sheets. (*2) “Others” include Samurai bonds, Euro-Yen bonds and other foreign bonds. (*3) The portion whose timing of collection is unforeseeable, including loans to “legal bankruptcy” borrowers, loans to “de
facto bankruptcy” borrowers and loans to “bankruptcy risk” borrowers, amounting to ¥49,191 million ($436,559 thousand) was not included in the above table.
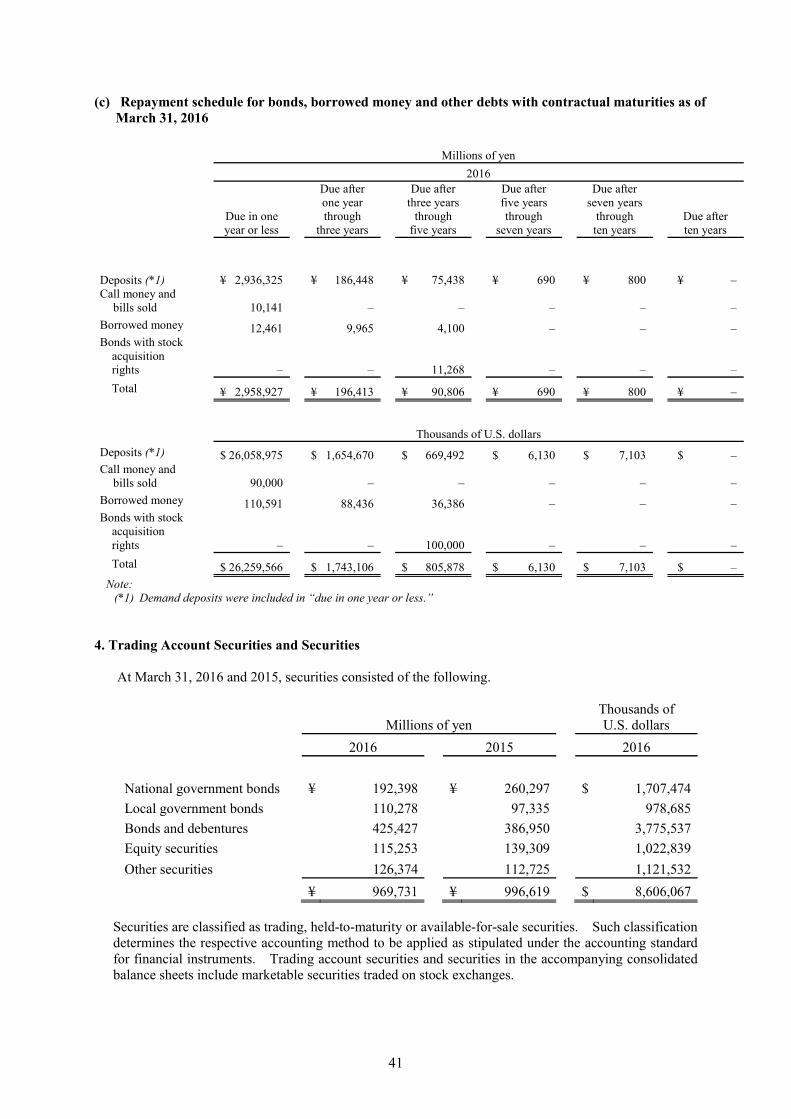
41
(c) Repayment schedule for bonds, borrowed money and other debts with contractual maturities as of March 31, 2016
Millions of yen
2016
Due in one year or less
Due after one year through
three years
Due after three years
through five years
Due after five years through
seven years
Due after seven years
through ten years
Due after ten years
Deposits (*1) ¥ 2,936,325 ¥ 186,448 ¥ 75,438 ¥ 690 ¥ 800 ¥ –Call money and
bills sold 10,141 – – – – –
Borrowed money 12,461 9,965 4,100 – – –Bonds with stock
acquisition rights – – 11,268 – – –
Total ¥ 2,958,927 ¥ 196,413 ¥ 90,806 ¥ 690 ¥ 800 ¥ –
Thousands of U.S. dollars
Deposits (*1) $ 26,058,975 $ 1,654,670 $ 669,492 $ 6,130 $ 7,103 $ –Call money and
bills sold 90,000 – – – – –
Borrowed money 110,591 88,436 36,386 – – –Bonds with stock
acquisition rights – – 100,000 – – –
Total $ 26,259,566 $ 1,743,106 $ 805,878 $ 6,130 $ 7,103 $ –
Note: (*1) Demand deposits were included in “due in one year or less.”
4. Trading Account Securities and Securities
At March 31, 2016 and 2015, securities consisted of the following.
Thousands of
Millions of yen U.S. dollars
2016 2015 2016
National government bonds ¥ 192,398 ¥ 260,297 $ 1,707,474
Local government bonds 110,278 97,335 978,685
Bonds and debentures 425,427 386,950 3,775,537
Equity securities 115,253 139,309 1,022,839
Other securities 126,374 112,725 1,121,532
¥ 969,731 ¥ 996,619 $ 8,606,067 Securities are classified as trading, held-to-maturity or available-for-sale securities. Such classification determines the respective accounting method to be applied as stipulated under the accounting standard for financial instruments. Trading account securities and securities in the accompanying consolidated balance sheets include marketable securities traded on stock exchanges.

42
At March 31, 2016 and 2015, the carrying values of trading account securities and the related valuation differences included in the consolidated statements of income were as follows.
Millions of yen Thousands of U.S. dollars
2016 2015 2016
Carrying
value Valuation difference
Carrying value
Valuation difference
Carrying value
Valuation difference
Trading
account securities
¥ – ¥ – ¥ 93 ¥ (0) $ – $ – Gross unrealized gains and losses on available-for-sale securities with fair values at March 31, 2016 and 2015 are summarized as follows.
Millions of yen
Acquisition cost
Gross unrealized
gains
Gross unrealized
losses
Fair and carrying
value
Available-for-sale securities with fair values at March 31, 2016:
Equity securities ¥ 51,522 ¥ 61,570 ¥ (281) ¥ 112,811
Bonds:
National government bonds 188,402 3,995 – 192,398
Local government bonds 108,261 2,017 (0) 110,278
Bonds and debentures 419,689 5,758 (21) 425,427
Others 125,130 1,914 (782) 126,262
¥ 893,006 ¥ 75,257 ¥ (1,086) ¥ 967,178
Available-for-sale securities with fair values at March 31, 2015:
Equity securities ¥ 51,347 ¥ 83,860 ¥ (224) ¥ 134,983
Bonds:
National government bonds 257,576 2,785 (64) 260,297
Local government bonds 95,952 1,422 (39) 97,335
Bonds and debentures 382,909 4,212 (171) 386,950
Others 110,723 2,141 (144) 112,720
¥ 898,509 ¥ 94,422 ¥ (644) ¥ 992,287
Thousands of U.S. dollars
Available-for-sale securities with fair value at March 31, 2016:
Equity securities $ 457,243 $ 546,423 $ (2,501) $ 1,001,165
Bonds:
National government bonds 1,672,017 35,458 – 1,707,475
Local government bonds 960,791 17,902 (8) 978,685
Bonds and debentures 3,724,616 51,109 (188) 3,775,537
Others 1,110,492 16,995 (6,943) 1,120,544
$ 7,925,159 $ 667,887 $ (9,640) $ 8,583,406
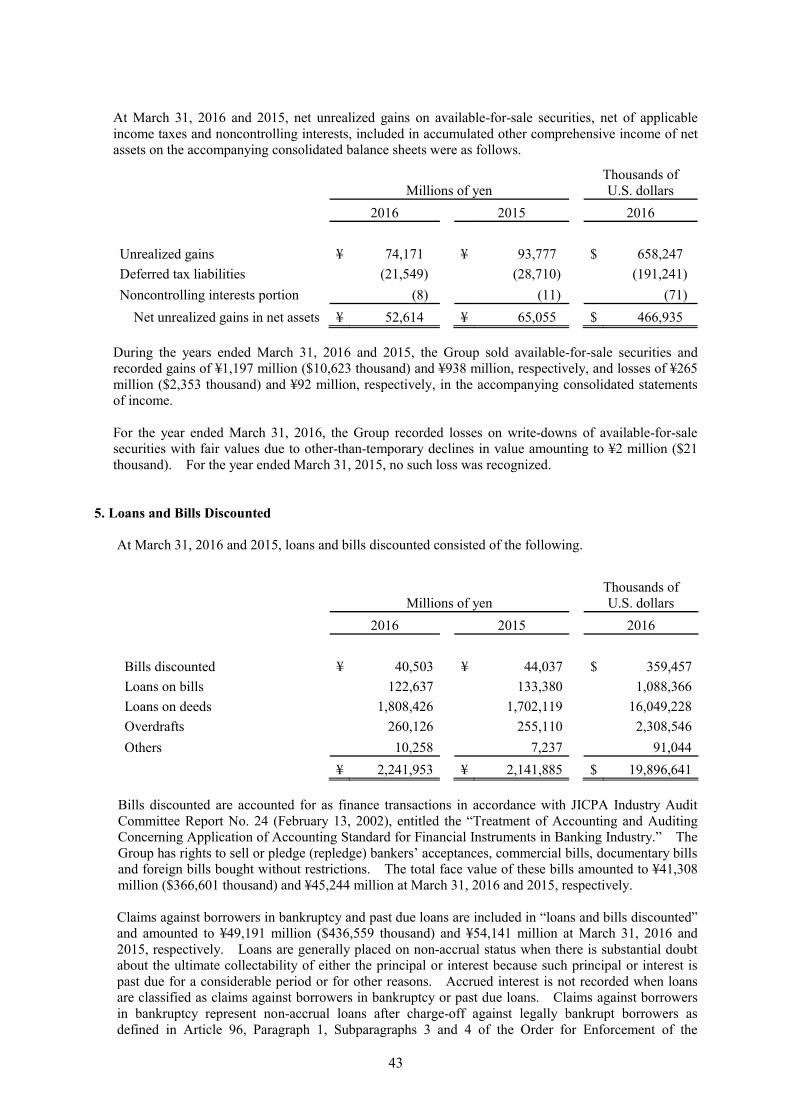
43
At March 31, 2016 and 2015, net unrealized gains on available-for-sale securities, net of applicable income taxes and noncontrolling interests, included in accumulated other comprehensive income of net assets on the accompanying consolidated balance sheets were as follows.
Millions of yen Thousands of U.S. dollars
2016 2015 2016
Unrealized gains ¥ 74,171 ¥ 93,777 $ 658,247
Deferred tax liabilities (21,549) (28,710) (191,241)
Noncontrolling interests portion (8) (11) (71)
Net unrealized gains in net assets ¥ 52,614 ¥ 65,055 $ 466,935 During the years ended March 31, 2016 and 2015, the Group sold available-for-sale securities and recorded gains of ¥1,197 million ($10,623 thousand) and ¥938 million, respectively, and losses of ¥265 million ($2,353 thousand) and ¥92 million, respectively, in the accompanying consolidated statements of income. For the year ended March 31, 2016, the Group recorded losses on write-downs of available-for-sale securities with fair values due to other-than-temporary declines in value amounting to ¥2 million ($21 thousand). For the year ended March 31, 2015, no such loss was recognized.
5. Loans and Bills Discounted
At March 31, 2016 and 2015, loans and bills discounted consisted of the following.
Thousands of U.S. dollars Millions of yen
2016 2015 2016
Bills discounted ¥ 40,503 ¥ 44,037 $ 359,457
Loans on bills 122,637 133,380 1,088,366
Loans on deeds 1,808,426 1,702,119 16,049,228
Overdrafts 260,126 255,110 2,308,546
Others 10,258 7,237 91,044
¥ 2,241,953 ¥ 2,141,885 $ 19,896,641 Bills discounted are accounted for as finance transactions in accordance with JICPA Industry Audit Committee Report No. 24 (February 13, 2002), entitled the “Treatment of Accounting and Auditing Concerning Application of Accounting Standard for Financial Instruments in Banking Industry.” The Group has rights to sell or pledge (repledge) bankers’ acceptances, commercial bills, documentary bills and foreign bills bought without restrictions. The total face value of these bills amounted to ¥41,308 million ($366,601 thousand) and ¥45,244 million at March 31, 2016 and 2015, respectively. Claims against borrowers in bankruptcy and past due loans are included in “loans and bills discounted” and amounted to ¥49,191 million ($436,559 thousand) and ¥54,141 million at March 31, 2016 and 2015, respectively. Loans are generally placed on non-accrual status when there is substantial doubt about the ultimate collectability of either the principal or interest because such principal or interest is past due for a considerable period or for other reasons. Accrued interest is not recorded when loans are classified as claims against borrowers in bankruptcy or past due loans. Claims against borrowers in bankruptcy represent non-accrual loans after charge-off against legally bankrupt borrowers as defined in Article 96, Paragraph 1, Subparagraphs 3 and 4 of the Order for Enforcement of the

44
Corporation Tax Law of Japan. Other than claims against borrowers in bankruptcy and loans for which interest payments are deferred in order to assist the financial recovery of borrowers in financial difficulties, past due loans are recognized as non-accrual loans. At March 31, 2016 and 2015, accruing loans for which the payment of principal or interest was contractually past due by three months or more, excluding non-accrual loans, amounted to ¥27 million ($247 thousand) and ¥30 million, respectively. At March 31, 2016 and 2015, restructured loans (excluding non-accrual and accruing loans contractually past due by three months or more as mentioned above) for which the Bank had restructured the terms and conditions in favor of the borrowers in financial difficulties, such as through reduction or exemption of the original interest rate, extension of interest payments and/or principal repayments and debt forgiveness, in order to support the financial recovery or restructuring of such borrowers amounted to ¥13,760 million ($122,118 thousand) and ¥19,189 million, respectively. Total non-performing loans before charge-offs, which consist of non-accrual loans, accruing loans contractually past due by three months or more and restructured loans, amounted to ¥62,979 million ($558,924 thousand) and ¥73,361 million at March 31, 2016 and 2015, respectively.
6. Tangible Fixed Assets
At March 31, 2016 and 2015, major classifications of accounts were as follows.
Millions of yen Thousands of U.S. dollars
2016 2015 2016
Land ¥ 23,242 ¥ 23,845 $ 206,271
Buildings and structures 9,072 8,373 80,515
Equipment 3,673 3,668 32,604
Leased assets as lessee – 0 –
Construction in progress 247 611 2,193
Tangible fixed assets ¥ 36,235 ¥ 36,499 $ 321,583 At March 31, 2016 and 2015, accumulated depreciation for tangible fixed assets amounted to ¥32,960 million ($292,516 thousand) and ¥32,366 million, respectively. The Bank elected a one-time revaluation to restate the cost of land used for the banking business at values rationally reassessed and reflecting appropriate adjustments for geographical shape and other factors based on the municipal property tax bases effective on March 31, 1998 under the Act on Revaluation of Land. According to the Act, the amount equivalent to the tax effect on the excess of reassessed values over the original book values is to be recorded as “deferred tax liabilities for revaluation,” and the rest of the excess, net of the tax effect, is to be recorded as “land revaluation excess” under accumulated other comprehensive income of net assets in the consolidated balance sheets. At March 31, 2016 and 2015, the differences in the carrying values of land used for the banking business after revaluation over market values amounted to ¥8,878 million ($78,798 thousand) and ¥9,407 million, respectively. As permitted by Japanese GAAP, deferred capital gains on the sale of real property are deducted from the original acquisition costs of property which is newly acquired for replacement purposes in the same line of business as the property sold by the Bank. At March 31, 2016 and 2015, ¥1,750 million ($15,537 thousand) and ¥1,750 million, respectively, were directly deducted from the acquisition costs of land.

45
7. Pledged Assets
The carrying amounts of assets pledged as collateral and related collateralized debt at March 31, 2016 and 2015 were as follows.
Thousands of U.S. dollars Millions of yen
2016 2015 2016
Assets pledged:
Securities ¥ 50,418 ¥ 42,673 $ 447,446
Other assets 20 20 181
Related collateralized debts:
Deposits ¥ 16,790 ¥ 16,226 $ 149,011
Payables under securities
lending transactions 18,488 10,392 164,084
Borrowed money 4,604 4,523 40,862 In addition, securities amounting to ¥66,484 million ($590,032 thousand) and ¥65,920 million at March 31, 2016 and 2015, respectively, were pledged as collateral for the settlement of exchange and other transactions.
8. Deposits
At March 31, 2016 and 2015, deposits consisted of the following.
Thousands of U.S. dollars Millions of yen
2016 2015 2016
Demand deposits ¥ 1,828,675 ¥ 1,763,761 $ 16,228,923
Time deposits 1,266,699 1,277,595 11,241,561
Other deposits 47,564 49,171 422,125
Subtotal 3,142,939 3,090,527 27,892,609Negotiable certificates of
deposit 56,763 53,585 503,761
¥ 3,199,702 ¥ 3,144,113 $ 28,396,370

46
9. Borrowed Money and Finance Lease Obligations Borrowed money consisted principally of borrowings from financial institutions due through February 2021 with average interest rates of 0.49% and 0.53% per annum at March 31, 2016 and 2015, respectively. There was no financial lease obligations outstanding at March 31, 2016. At March 31, 2016, the annual maturities of borrowed money were as follows.
Year ending March 31, Millions of yenThousands of U.S. dollars
2017 ¥ 12,461 $ 110,591
2018 5,682 50,426
2019 4,283 38,010
2020 2,775 24,627
2021 1,325 11,759
¥ 26,526 $ 235,413
10. Bonds with Stock Acquisition Rights
At March 31, 2016 and 2015, bonds with stock acquisition rights consisted of the followings
Millions of yen
Thousands ofU.S. dollars Interest
rate Due 2016 2015 2016 U.S. dollar denominated
zero-coupon convertible bond-type bonds with stock acquisition rights, due in 2020 ¥ 11,268 ¥ 12,017 $ 100,000 – March 26, 2020 The following is a summary of the terms for conversion and redemption of the convertible bonds with stock acquisition rights:
Issue price of stock acquisition rights
Issue price of common stock
Total issue price
Exercise period
U.S. dollar denominated zero-coupon convertible bond-type bonds with stock acquisition rights, due in 2020
Gratis $3.73 $100,000 thousand
From April 9, 2015 to March 12, 2020
Note: The value of the assets to be invested at the exercise of the stock acquisition rights is equal to the face value of this convertible bond.

47
At March 31, 2016, the annual maturities of bonds with stock acquisitions rights were as follows.
Year ending March 31, Millions of yenThousands of U.S. dollars
2017 ¥ – $ –
2018 – –
2019 – –
2020 11,268 100,000
2021 – –
¥ 11,268 $ 100,000 11. Employee Retirement Benefits
The Bank maintains “funded and unfunded defined benefit plans” and “a selection of either a defined contribution plan or prepayment of retirement allowance” for employee retirement benefits. Eligible employees are entitled to receive lump-sum payments or pension payments based on the level of salary and the length of service under the defined benefit (“DB”) corporate pension plans, all of which are funded plans. The Bank has set up retirement benefit trusts for certain plans among the defined benefit corporate pension plans. Eligible employees are entitled to receive lump-sum payments based on the level of salary and the length of service under the lump-sum payment plans, most of which are funded as a result of establishing retirement benefit trusts; however, some of which have been unfunded plans. One of the Bank’s consolidated subsidiaries participates in a multi-employer pension program under a certain public pension plan as part of the lump-sum retirement benefit plan. The Bank’s other three consolidated subsidiaries have each adopted only the lump-sum retirement benefit plan. The consolidated subsidiaries use the simplified method in calculating employee retirement defined benefit liability and retirement benefit expenses. Under this method, the amount for severance payments required at the year-end for voluntary termination is deemed retirement benefit obligations.
(a) Defined benefit plans
(1) Movement in retirement benefit obligation, excluding plans applying the simplified method:
Millions of yen
Thousands of U.S. dollars
2016 2015 2016
Balance at beginning of year ¥ 30,372 ¥ 31,852 $ 269,545Cumulative effects of changes in accounting
policies – (992)
–
Restated balance at beginning of year 30,372 30,859 269,545
Service cost 739 749 6,561
Interest cost 364 370 3,235
Actuarial differences 4,215 369 37,407
Retirement benefits paid (1,977) (1,976) (17,549)
Others (0) – (1)
Balance at end of year ¥ 33,713 ¥ 30,372 $ 299,198

48
(2) Movement in plan assets, excluding plans applying the simplified method:
Millions of yen Thousands of U.S. dollars
2016 2015 2016
Balance at beginning of year ¥ 45,803 ¥ 40,252 $ 406,492
Expected return on pension plan assets 722 646 6,415
Actuarial differences (2,733) 5,214 (24,255)
Contribution paid by the employer 957 901 8,500
Retirement benefits paid (1,231) (1,211) (10,926)
Balance at end of year ¥ 43,519 ¥ 45,803 $ 386,226
(3) Movement in employee retirement benefit liability for plans applying the simplified method:
Millions of yen Thousands of U.S. dollars
2016 2015 2016 Employee retirement benefit liability at
beginning of year ¥ 127 ¥ 127 $ 1,133
Retirement benefit expenses 27 31 240
Retirement benefits paid (29) (31) (264)
Retirement benefit liability at end of year ¥ 124 ¥ 127 $ 1,109
(4) Reconciliation from retirement benefit obligation and plan assets to retirement benefit (asset)/liability recognized in the consolidated balance sheets:
Millions of yen Thousands of U.S. dollars
2016 2015 2016
Funded retirement benefit obligation ¥ 33,787 ¥ 30,447 $ 299,849
Plan assets (43,519) (45,803) (386,226)
(9,732) (15,356) (86,377)
Unfunded retirement benefit obligation 51 52 458
Net retirement benefit (asset)/liability ¥ (9,681) ¥ (15,303) $ (85,919)
Employee retirement benefit liability ¥ 4,937 ¥ 3,824 $ 43,817
Employee retirement benefit assets (14,618) (19,127) (129,736)
Net retirement benefit (asset)/liability ¥ (9,681) ¥ (15,303) $ (85,919)

49
(5) Net periodic retirement benefit expense and its breakdown:
Millions of yen Thousands of U.S. dollars
2016 2015 2016
Service cost ¥ 739 ¥ 749 $ 6,561
Interest cost 364 370 3,235
Expected return on plan assets (722) (646) (6,415)
Amortization of actuarial differences (164) 430 (1,462)
Amortization of past service cost (144) (144) (1,287)Retirement benefit expense for plans applying the simplified method 27 31 240
Others 6 – 58 Net periodic retirement benefit expense
of defined benefit plans ¥ 104 ¥ 790 $ 930
(6) Retirement benefit adjustments in other comprehensive income, before tax effects:
Millions of yen Thousands of U.S. dollars
2016 2015 2016
Past service cost ¥ (144) ¥ (144) $ (1,287)
Actuarial differences (7,112) 5,274 (63,124)
Total ¥ (7,257) ¥ 5,129 $ (64,411)
(7) Retirement benefit adjustments in accumulated other comprehensive income, before tax effects:
Millions of yen Thousands of U.S. dollars
2016 2015 2016
Unrecognized past service cost ¥ 1,304 ¥ 1,449 $ 11,578
Unrecognized actuarial differences (707) 6,405 (6,275)
Total ¥ 597 ¥ 7,855 $ 5,303
(8) Plan assets (i) Plan assets comprise:
2016 2015
Debt securities 40% 36%
Equity securities 30% 40%
Cash and deposits 12% 11%
General accounts 18% 13% Total * 100% 100%
Note: As of March 31, 2016 and 2015, retirement benefit trusts that are set up for the defined
benefit pension plan and lump-sum retirement benefit plan represented 44% and 46% of plan assets, respectively.

50
(ii) Determination of long-term expected rate of return on plan assets In determining the long-term expected rate of return on plan assets, the Group considers the current and target asset allocation as well as the current and expected long-term rate of return on various asset categories comprising plan assets.
(9) Actuarial assumptions at end of year:
2016 2015
Discount rate 0.3% 1.2% Long-term expected rate of return on plan assets 2.5% 2.5%
Note: The Bank maintains a point system for defined benefit corporate pension plans and
lump-sum payment plans. Points are calculated based on past salaries. (b) Defined contribution plan
The required contribution of the Bank and its consolidated subsidiaries to the defined contribution plan amounted to ¥167 million ($1,484 thousand) and ¥162 million for the year ended March 31, 2016 and 2015, respectively.
12. Acceptances and Guarantees
The Bank provides guarantees with respect to liabilities of its customers for payment of loans or other liabilities with other financial institutions. As a contra account, “customers’ liabilities for acceptances and guarantees” has been shown in assets on the accompanying consolidated balance sheets, indicating the Bank’s right of indemnity from customers.
Guarantees are provided on certain privately placed bonds included in securities in accordance with Article 2, Paragraph 3 of the Financial Instruments and Exchange Act of Japan. The guarantees amounted to ¥13,316 million ($118,178 thousand) and ¥12,976 million at March 31, 2016 and 2015, respectively.
13. Net Assets
At both March 31, 2016 and 2015, the authorized number of shares of common stock without par value was 500 million shares, and the number of shares of common stock issued was 205,054,873 shares. At March 31, 2016 and 2015, the number of shares of treasury stock held by the Group was 7,974 thousand and 7,961 thousand shares, respectively. Under Japanese laws and regulations, the entire amount paid for new shares is required to be designated as common stock. However, a company may, by a resolution of the Board of Directors, designate an amount not exceeding one-half of the issue price of the new shares as additional paid-in capital, which is included in capital surplus.
Capital surplus consists principally of additional paid-in capital. The Banking Act of Japan provides that an amount equivalent to at least 20% of the cash payments as appropriation of retained earnings shall be appropriated as legal earnings reserve until the total amount of additional paid-in capital and such reserve equals 100% of common stock. The legal earnings reserve has been included in the retained earnings in the accompanying consolidated balance sheets. Under the Act, the legal earnings reserve and additional paid-in capital can be used to eliminate or reduce a deficit by a resolution at the shareholders’ meeting. The additional paid-in capital and legal earnings reserve may not be distributed as dividends. All additional paid-in capital and legal earnings reserve may be transferred to other capital surplus and retained earnings, respectively, which may become available for distribution as dividends. Both at March 31, 2016 and 2015, the legal earnings reserve amounted to ¥8,029 million ($71,264 thousand).

51
The maximum amount that the Bank can distribute as dividends is calculated based on the nonconsolidated financial statements of the Bank in accordance with Japanese laws and regulations.
14. Stock Options (a) Stock option expenses
The Bank recorded stock option expenses of ¥40 million ($361 thousand) and ¥38 million in “General and administrative expenses” for the years ended March 31, 2016 and 2015, respectively.
(b) Outline of stock options i) Outline of stock options:
2014 stock options 2015 stock options Position and number of grantees 13 directors of the Bank 13 directors of the BankNumber of options granted* 109,800 common shares of
the Bank 88,700 common shares of
the Bank Grant date August 13, 2014 August 13, 2015 Conditions for vesting Not defined Not defined Requisite service period Not defined Not defined Exercise period From August 14, 2014 to
August 13, 2064 From August 14, 2015 to
August 13, 2065
Note: * Calculated in terms of the number of shares.
ii) Size and changes in stock options: The following describes the size of and changes in stock options that existed during the year ended March 31, 2016. The number of stock options is calculated in terms of the number of shares. a) Number of stock options 2014 stock options 2015 stock options Non-vested
April 1, 2015 - Outstanding - - Granted - 88,700 shares Forfeited - - Vested - 88,700 shares March 31, 2016 - Outstanding - -
Vested April 1, 2015 - Outstanding 109,800 shares - Vested - 88,700 shares Exercised 7,500 shares - Forfeited - - March 31, 2016 - Outstanding 102,300 shares 88,700 shares
b) Price information:
2014 stock option 2015 stock option Exercise price ¥1 ($0.01) per share ¥1 ($0.01) per share Average exercise price - - Fair value at grant date* ¥347 ($3.08) per share ¥459 ($4.07) per share

52
iii) Valuation technique to estimate fair value of stock options
a) Valuation technique used: Black-Scholes model
b) Major assumptions and estimation method
2015 stock option Expected volatility (*1) 33.238% Expected life (*2) 6 years Expected dividends (*3) ¥6.5 ($0.06) per share Risk free interest rate (*4) 0.113%
Notes: (*1) Expected volatility is calculated based on the actual stock prices on each trading day during the period from April 13, 2009 to August 13, 2015.
(*2) Expected life is estimated based on the average term of office of directors, etc., who retired during the past 10 years.
(*3) Expected dividends are the actual dividends for the year ended March 31, 2015. (*4) Risk free interest rate is a Japanese government bond yield which corresponds to the expected life.
iv) Method of estimating number of stock options vested
Only the actual number of forfeited stock options is reflected because it is difficult to rationally estimate the number of stock options to be forfeited in the future.

53
15. Commitments
(a) Loan commitments
Overdraft facilities and loan commitment lines are contracts under which the Bank is obligated to advance funds up to a predetermined amount to a customer upon request, provided that the customer has met the terms and conditions of the applicable contract. At March 31, 2016 and 2015, the unused amounts within the limits relating to these contracts amounted to ¥727,776 million ($6,458,794 thousand) and ¥705,149 million, respectively. Such outstanding contract amounts included amounts which originally expire within one year or are revocable by the Bank at any time without any conditions in the amounts of ¥716,291 million ($6,356,866 thousand) and ¥695,697 million at March 31, 2016 and 2015, respectively. Since many of these commitments expire without being drawn down, the unused amount does not necessarily represent a future cash requirement. Most of these contracts have conditions that allow the Bank to refuse customers’ applications for loans or decrease the contract limits for appropriate reasons (e.g., changes in financial situation and deterioration in customers’ creditworthiness). At the execution of such contracts, the Bank obtains real estate, securities, etc., as collateral if considered necessary. Subsequently, the Bank performs periodic reviews of customers’ business results based on internal rules and may take necessary measures that include reconsidering conditions of such contracts and/or requiring additional collateral and/or guarantees.
(b) Lease commitments
(Lessee contracts) The Group leases certain office space and equipment as lessee under long-term non-cancellable lease contracts. The aggregate future minimum lease commitments for non-cancellable operating leases at March 31, 2016 and 2015 were as follows.
Thousands of
Millions of yen U.S. dollars
2016 2015 2016
Operating leases as lessee:
Due within one year ¥ 663 ¥ 330 $ 5,885
Due after one year 1,957 264 17,369
¥ 2,620 ¥ 594 $ 23,254 (Lessor contracts) A consolidated subsidiary engaged in leasing operations as lessor entered into various long-term, non-cancellable lease contracts with third parties, which were categorized as finance leases. At March 31, 2016 and 2015, investments in leased assets as lessor consisted of the following.
Thousands of
Millions of yen U.S. dollars
2016 2015 2016
Future minimum lease payments to be received ¥ 26,309 ¥ 22,909 $ 233,493
Estimated residual value 2,141 1,974 19,002
Imputed interest (2,006) (2,003) (17,809)
Investments in leased assets ¥ 26,444 ¥ 22,881 $ 234,686

54
The aggregate annual maturities of future minimum lease payments to be received related to investments in leased assets at March 31, 2016 were as follows.
Millions of yen
Thousands of Year ending March 31, U.S. dollars
2017 ¥ 7,965 $ 70,689
2018 6,424 57,019
2019 4,946 43,896
2020 3,481 30,896
2021 2,007 17,817
2022 and thereafter 1,484 13,176
¥ 26,309 $ 233,493
At March 31, 2016 and 2015, future lease payments to be received for non-cancellable operating leases were as follows.
Thousands of
Millions of yen U.S. dollars
2016 2015 2016
Operating leases as lessor:
Due within one year ¥ 78 ¥ 64 $ 694
Due after one year 129 116 1,147
¥ 207 ¥ 181 $ 1,841

55
16. Derivative Instruments
At March 31, 2016 and 2015, derivative instruments, other than those to which hedge accounting was applied, were stated at fair value with valuation gains and losses recognized as current earnings in the accompanying consolidated statements of income as follows.
Millions of yen
Notional principals or contract amounts
Fair value * Valuation gain/(loss)
Over one year Total
At March 31, 2016:
Interest rate swaps ¥ 20,000 ¥ 20,000 ¥ (671) ¥ (671)
Currency swaps 54,717 – 1,331 1,331
Forward foreign exchange contracts 4,540 – 136 136
At March 31, 2015:
Interest rate swaps ¥ 20,000 ¥ 20,000 ¥ (857) ¥ (857)
Currency swaps 37,255 – (1,152) (1,152)
Forward foreign exchange contracts 3,830 – (52) (52)
Thousands of U.S. dollars
At March 31, 2016:
Interest rate swaps $ 177,494 $ 177,494 $ (5,961) $ (5,961)
Currency swaps 485,598 – 11,820 11,820
Forward foreign exchange contracts 40,293 – 1,211 1,211
Note: Fair values were calculated based on the discounted cash flow method, etc. Derivative instruments to which hedge accounting was applied at March 31, 2016 and 2015 were as follows.
Millions of yen
Hedged items
Notional principal or contract amounts
Fair value * Total
Over one year
Currency swap contracts:
As of March 31, 2016 Loans in foreign
currencies ¥ 275 ¥ – ¥ 12
As of March 31, 2015 Loans in foreign
currencies 275 – (15)
Thousands of U.S. dollars
Currency swap contracts:
As of March 31, 2016 Loans in foreign
currencies $ 2,441 $ – $ 108
Note: Fair values were calculated based on the discounted cash flow method, etc.

56
17. Income Taxes
Income taxes for the years ended March 31, 2016 and 2015 consisted of the following.
Thousands of U.S. dollars Millions of yen
2016 2015 2016
Income taxes:
Current ¥ 1,668 ¥ 1,883 $ 14,808
Deferred 2,316 2,549 20,554
¥ 3,984 ¥ 4,432 $ 35,362 At March 31, 2016 and 2015, income taxes (including enterprise taxes) payable amounting to ¥512 million ($4,550 thousand) and ¥446 million, respectively, were included in “other liabilities” in the accompanying consolidated balance sheets. The tax effects of temporary differences that gave rise to a significant portion of deferred tax assets and liabilities at March 31, 2016 and 2015 were as follows.
Thousands of
Millions of yen U.S. dollars 2016 2015 2016
Deferred tax assets:
Reserve for possible loan losses ¥ 3,791 ¥ 5,165 $ 33,648 Employee retirement benefit (asset)/liability 1,799 95 15,971 Loss on devaluation of stocks and other
securities 2,553 2,702 22,665 Reserve for contingent losses 561 787 4,986 Depreciation 652 716 5,794 Others 2,978 3,159 26,436 Less valuation allowance (4,411) (4,527) (39,149)
Subtotal 7,927 8,100 70,351
Deferred tax liabilities: Unrealized gains on available-for-sale
securities (21,549) (28,710) (191,241) Gain on transfer of securities to trusts for
retirement benefit plan (2,403) (2,521) (21,329) Others (72) (90) (642) Subtotal (24,024) (31,323) (213,212) Net deferred tax assets (liabilities) ¥ (16,097) ¥ (23,223) $ (142,861)
At March 31, 2016 and 2015, deferred tax assets and liabilities were as follows.
Thousands of
Millions of yen U.S. dollars 2016 2015 2016
Deferred tax assets ¥ 811 ¥ 953 $ 7,201
Deferred tax liabilities (16,908) (24,176) (150,062)

57
In assessing the realizability of deferred tax assets, management of the Group considers whether some portion or all of the deferred tax assets will not be realized. The ultimate realization of deferred tax assets is dependent upon the generation of future taxable income during the periods in which those temporary differences become deductible. At both March 31, 2016 and 2015, a valuation allowance was provided to reduce the deferred tax assets to amounts that management believed would be realizable. The Group is subject to Japanese national and local income taxes which in the aggregate resulted in an effective statutory tax rate of approximately 32.8% and 35.3% for the years ended March 31, 2016 and 2015, respectively. Reconciliations between the Japanese statutory effective tax rate and the actual effective income tax rate on pre-tax profit reflected in the accompanying consolidated statements of income for the years ended March 31, 2016 and 2015 were as follows.
Percentage of pre-tax profit
2016 2015
Japanese statutory effective tax rate 32.8 % 35.3 %
Increase (decrease) due to:
Permanently non-deductible expenses 0.5 0.6
Tax exempt income (1.9) (4.3)
Local minimum taxes - per capita basis 0.6 0.6
Changes in valuation allowance 0.9 0.7
Effects of income tax rate change 2.0 5.9
Others 0.4 (0.0)
Actual effective tax rate 35.3 % 38.8 %
Following the enactment at the Diet session on March 29, 2016 of the “Act for Partial Revision of the Income Tax Act, etc.” (Act No. 15 of 2016) and “Act for Partial Revision of the Local Tax Act, etc.” (Act No. 13 of 2016), corporate tax rates will be reduced from the fiscal year beginning on or after April 1, 2016. In line with these revisions, the Bank has changed the statutory tax rate used to calculate deferred tax assets and liabilities from 32.0% to 30.7% for temporary differences expected to be reversed in the fiscal year beginning on April 1, 2016 and the fiscal year beginning on April 1, 2017 and to 30.5% for temporary differences expected to be reversed in the fiscal years beginning on April 1, 2018 and thereafter. As a result of this tax rate change, deferred tax liabilities, net of deferred tax assets, decreased by ¥847 million ($7,521 thousand), “net unrealized gains on available-for-sale securities” and “retirement benefit adjustments” increased by ¥1,059 million ($9,404 thousand) and ¥8 million ($80 thousand) as of March 31, 2016, respectively, and “deferred income taxes” increased by ¥221 million ($1,962 thousand) for the year ended March 31, 2016. “Deferred tax liabilities for revaluation” decreased by ¥158 million ($1,407 thousand) and “land revaluation excess” increased by the same amount as of March 31, 2016 Following the promulgation on March 31, 2015 of the “Act for Partial Revision of the Income Tax Act, etc.” (Act No. 9 of 2014), corporate tax rates were reduced from the fiscal year beginning on or after April 1, 2015. In line with this revision, the Bank has changed the statutory tax rate used to calculate deferred tax assets and liabilities from 35.3% to 32.8% for temporary differences expected to be reversed in the fiscal year beginning on April 1, 2015 and to 32.0% for temporary differences expected to be reversed in the fiscal years beginning on April 1, 2016 and thereafter. As a result of this tax rate change, deferred tax liabilities, net of deferred tax assets, decreased by ¥2,547 million, “net unrealized gains on available-for-sale securities” and “retirement benefit adjustments” increased by ¥2,960 million and ¥259 million as of March 31, 2015, respectively, and “deferred income taxes” increased by ¥672 million for the year ended March 31, 2015. “Deferred tax liabilities for revaluation” decreased by ¥354 million and “land revaluation excess” increased by the same amount as of March 31, 2015.

58
18. General and administrative expenses
General and administrative expenses for the year ended March 31, 2016 and 2015 included the following:
Millions of yen Thousands of U.S. dollars
2016 2015 2016 Salaries and allowances (including
bonuses) ¥ 15,684 16,031 $ 139,191
Retirement benefit expenses 271 959 2,413 19. Comprehensive Income
Amounts reclassified to profit (loss) in the current period that were recognized in other comprehensive income in the current or previous periods and the tax effects for each component of other comprehensive income for the years ended March 31, 2016 and 2015 were as follows.
Millions of yen Thousands of U.S. dollars
2016 2015 2016 Net change in unrealized gains on
available-for-sale securities:
Increase (decrease) during the year ¥ (18,344) ¥ 37,596 $ (162,802) Reclassification adjustments (1,262) (1,086) (11,200) Pre-tax amount (19,606) 36,510 (174,002) Tax effect amount 7,161 (9,345) 63,559
Net change in unrealized gains on available-for-sale securities, net of tax (12,444) 27,165 (110,443)
Net change in deferred losses on hedging instruments:
Decrease during the year (49) (24) (440) Reclassification adjustments 49 24 441 Pre-tax amount 0 0 1 Tax effect amount (0) (0) (0)
Net change in deferred losses on hedging instruments, net of tax 0 0 1
Land revaluation excess: Tax effect amount 158 354 1,407
Land revaluation excess, net of
tax 158 354 1,407Retirement benefit adjustments: Increase (decrease) during the year (6,948) 4,844 (61,662) Reclassification adjustments (309) 285 (2,749) Pre-tax amount (7,257) 5,129 (64,411) Tax effect amount 2,331 (1,551) 20,691
Retirement benefit adjustments,
net of tax (4,926) 3,578 (43,720)
Total other comprehensive
income ¥ (17,212) ¥ 31,097 $ (152,755)

59
20. Business Combinations Transaction under common control
Acquisition of additional shares of a subsidiary (a) Outline of the transaction
(1) Name and business of the company under the business combination
Name: Nagoya Lease Co., Ltd., a consolidated subsidiary of the Bank Business: Comprehensive finance leasing business
(2) Date of the business combination September 14, 2015
(3) Legal form of the business combination Acquisition of shares from noncontrolling shareholders
(4) Name of company after the business combination Unchanged
(5) Other matters related to the business combination The Bank acquired the shares at the request from noncontrolling shareholders.
(b) Outline of accounting treatment
This transaction was accounted for as a transaction with noncontrolling shareholders among transactions under common control in accordance with the “Accounting Standard for Business Combinations” (ASBJ Statement No. 21, September 13, 2013) and the “Guidance on Accounting Standard for Business Combinations and Accounting Standard for Business Divestitures” (ASBJ Guidance No. 10, September 13, 2013).
(c) Acquisition cost and consideration paid
Consideration paid for acquisition: Cash and due from banks ¥272 million ($2,423 thousand) (d) Change in capital surplus of the Bank in connection with the transaction with noncontrolling
shareholders (1) Major reason for change in capital surplus
Acquisition of additional shares of s subsidiary
(2) Increase in capital surplus due to the transaction with noncontrolling shareholders ¥164 million ($1,461 thousand)
Absorption of a consolidated subsidiary
At the meeting of the Board of Directors held on July 29, 2015, the Bank resolved to enter into a merger agreement with Meigin Real Property Research Co., Ltd., a wholly owned subsidiary of the Bank. The merger was conducted on January 1, 2016. This merger is a transaction under common control and an outline of the transaction is described below.
(a) Outline of the transaction
(1) Name and business of the companies under the business combination
Absorbing company’s name: The Bank of Nagoya, Ltd. Absorbing company’s business: Banking Absorbed company’s name: Meigin Real Property Research Co., Ltd. Absorbed company’s business: Investigation and assessment of real estate collateral

60
(2) Date of business combination January 1, 2016
(3) Legal form of the business combination Absorption type merger The Bank was a surviving company and Meigin Real Property Research Co., Ltd. was an absorbed company.
(4) Name of company after the business combination The Bank of Nagoya, Ltd.
(5) Purpose of the business combination The Bank merged Meigin Real Property Research Co., Ltd. for the purpose of improving operational efficiency in investigation and assessment of real estate collateral.
(b) Outline of accounting treatment
This transaction was accounted for as a transaction under common control in accordance with the “Accounting Standard for Business Combinations” (ASBJ Statement No. 21, September 13, 2013) and the “Guidance on Accounting Standard for Business Combinations and Accounting Standard for Business Divestitures” (ASBJ Guidance No. 10, September 13, 2013).
21. Related Party Transactions
During the years ended March 31, 2016 and 2015, the Bank had significant transactions with the Bank’s directors and audit and supervisory board members and their immediate family members and/or the companies in which they hold directly or indirectly a majority voting interest. A summary of the significant related party transactions as of and for the years ended March 31, 2016 and 2015 is as follows.
Millions of yen Thousands of U.S.
dollars
2016 2015 2016
For the year:
Number of related parties 12 11
Amount of lending loan transactions (average balance) ¥ 368 ¥ 399 $ 3,271
Underwriting private placement bonds (average balance) 80 111 714
At year-end:
Loans and bills discounted ¥ 481 ¥ 392 $ 4,277
Securities (bonds and debentures) 75 105 666

61
22. Subsequent Events Appropriation of retained earnings
Shareholders of the Bank approved the following appropriation of retained earnings at the annual general meeting held on June 24, 2016.
Millions of
yen Thousands of U.S. dollars
Cash dividends at ¥3.50 per share ($0.03 per share) ¥ 689 $ 6,122
Consolidation of shares and other related matters
The Bank resolved at the Board of Directors meeting held on May 11, 2016 to submit a proposal for the consolidation of shares, change in the number of shares constituting one unit and partial amendments to the Articles of Incorporation. The proposal was approved at the Annual General Meeting of Shareholders for the 98th fiscal period held on June 24, 2016. The consolidation of shares and other related matters are summarized below.
(a) Consolidation of shares and change in the number of shares constituting one unit
(1) Purpose Stock exchanges in Japan have announced the Action Plan for Consolidating Trading Units aiming to standardize the one trading unit of one hundred shares of common stock for Japanese listed companies. The Bank, as an entity listed on the Tokyo Stock Exchange and the Nagoya Stock Exchange, respects the intention of the stock exchanges and will change the number of shares to constitute one trading unit from 1,000 shares to 100 shares. In addition, the Bank will consolidate 10 shares into one share in order to maintain the level of investment unit considered desirable by the stock exchanges (more than ¥50,000 and less than ¥500,000).
(2) Consolidation of shares
(i) Type of shares to be consolidated Common stock
(ii) Method and ratio of the consolidation As of October 1, 2016, shares owned by shareholders recorded in the latest Shareholder Registry as of September 30, 2016 will be consolidated at the ratio of ten shares to one share.
(iii) Reduction in the number of shares resulting from the consolidation Total number of issued shares before the consolidation (as of March 31, 2016)
205,054,873 shares
Number of shares reduced due to the consolidation 184,549,386 sharesTotal number of issued shares after the consolidation 20,505,487 shares
(Note) The “Number of shares reduced due to the consolidation” and “Total number of issued shares after the consolidation” are theoretical values calculated based on the total number of issued shares before the consolidation and the ratio of the consolidation.
(iv) Treatment of fractional shares Any fractional shares of less than one share arising from the consolidation will be subject to a bulk sale in accordance with Article 235 of the Companies Act, and proceeds from the sale will be distributed to the shareholders in proportion to their respective fractional shares.
(3) Change in the number of shares constituting one trading unit As of October 1, 2016, the number of shares of common stock constituting one trading unit will be changed from 1,000 shares to 100 shares.
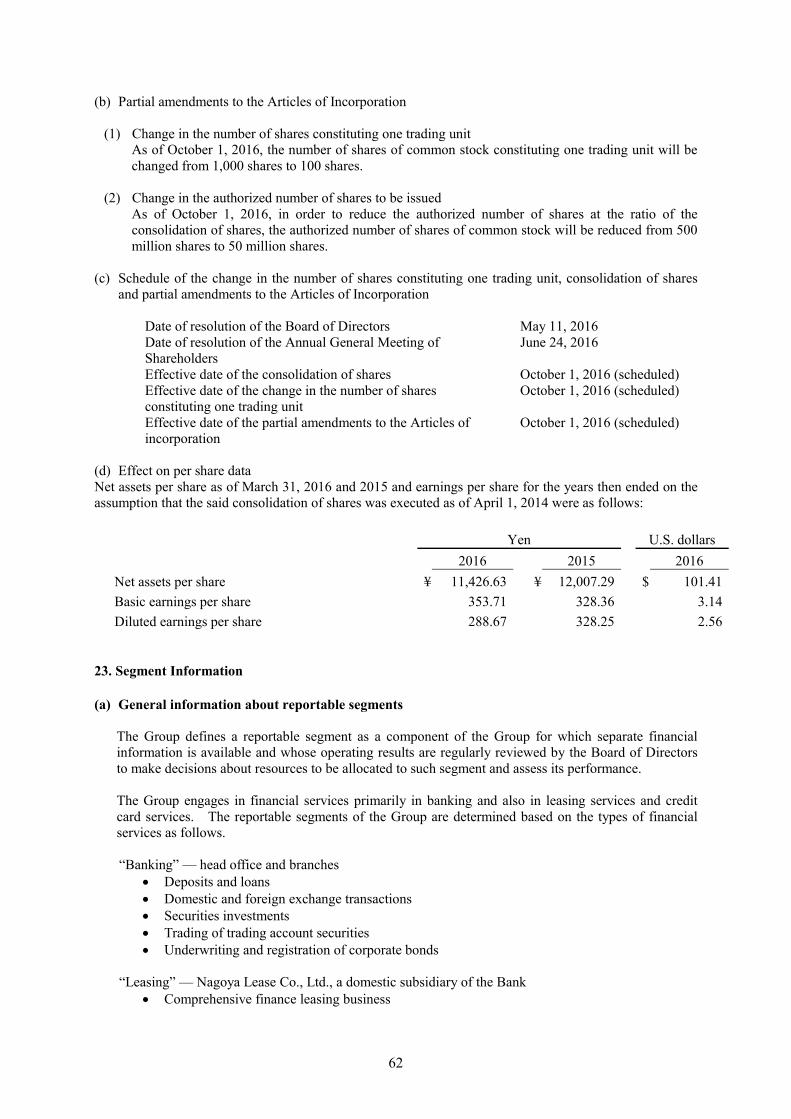
62
(b) Partial amendments to the Articles of Incorporation
(1) Change in the number of shares constituting one trading unit As of October 1, 2016, the number of shares of common stock constituting one trading unit will be changed from 1,000 shares to 100 shares.
(2) Change in the authorized number of shares to be issued
As of October 1, 2016, in order to reduce the authorized number of shares at the ratio of the consolidation of shares, the authorized number of shares of common stock will be reduced from 500 million shares to 50 million shares.
(c) Schedule of the change in the number of shares constituting one trading unit, consolidation of shares
and partial amendments to the Articles of Incorporation
Date of resolution of the Board of Directors May 11, 2016 Date of resolution of the Annual General Meeting of June 24, 2016 Shareholders Effective date of the consolidation of shares October 1, 2016 (scheduled) Effective date of the change in the number of shares October 1, 2016 (scheduled) constituting one trading unit Effective date of the partial amendments to the Articles of October 1, 2016 (scheduled) incorporation
(d) Effect on per share data Net assets per share as of March 31, 2016 and 2015 and earnings per share for the years then ended on the assumption that the said consolidation of shares was executed as of April 1, 2014 were as follows:
Yen U.S. dollars
2016 2015 2016
Net assets per share ¥ 11,426.63 ¥ 12,007.29 $ 101.41
Basic earnings per share 353.71 328.36 3.14
Diluted earnings per share 288.67 328.25 2.56 23. Segment Information (a) General information about reportable segments
The Group defines a reportable segment as a component of the Group for which separate financial information is available and whose operating results are regularly reviewed by the Board of Directors to make decisions about resources to be allocated to such segment and assess its performance. The Group engages in financial services primarily in banking and also in leasing services and credit card services. The reportable segments of the Group are determined based on the types of financial services as follows.
“Banking” –– head office and branches
Deposits and loans Domestic and foreign exchange transactions Securities investments Trading of trading account securities Underwriting and registration of corporate bonds
“Leasing” –– Nagoya Lease Co., Ltd., a domestic subsidiary of the Bank
Comprehensive finance leasing business

63
“Credit Card” –– Nagoya Card Co., Ltd. and Nagoya MC Card Co., Ltd., domestic subsidiaries of the Bank
Credit card business
(b) Basis of measurement for segment profit, segment assets, segment liabilities and other material items for each reportable segment
The basis of measurement for reportable segment information follows the accounting principles used in the consolidated financial statements as described in Note 2, “Summary of Significant Accounting Policies.” The segment profit is based on “ordinary income,” which is defined as total income less certain special gains and certain special losses included in the accompanying consolidated statements of income. Intersegment income is accounted for based on prices of ordinary transactions with independent third parties.

64
(c) Information about reportable segment profit, segment assets, segment liabilities and other material items by reportable segment Segment information as of and for the years ended March 31, 2016 and 2015 was as follows. Millions of yen
2016
Reportable segment
Banking Leasing Credit Card Total Other (*2) Total
Ordinary income (*1):
External customers ¥ 47,874 ¥ 13,785 ¥ 2,185 ¥ 63,845 ¥ 0 ¥ 63,845Intersegment 163 219 198 582 345 927
Total ordinary income 48,038 14,004 2,384 64,427 345 64,772
Segment profit 10,103 490 853 11,447 92 11,539
Segment assets 3,516,111 39,753 15,797 3,571,663 380 3,572,043
Segment liabilities 3,296,525 33,964 9,768 3,340,257 22 3,340,280
Other material items: Depreciation and amortization (*3) 2,263 226 6 2,497 0 2,497Interest income 34,814 6 132 34,954 0 34,954Interest expense 2,450 169 3 2,623 – 2,623Provision for possible loan losses – – – – – –Changes in tangible and intangible fixed
assets
2,637 410 13 3,061 – 3,061 Millions of yen
2015
Reportable segment
Banking Leasing Credit Card Total Other (*2) Total
Ordinary income (*1):
External customers ¥ 48,468 ¥ 12,312 ¥ 2,021 ¥ 62,802 ¥ 0 ¥ 62,802Intersegment 152 203 198 553 366 920
Total ordinary income 48,620 12,515 2,219 63,356 366 63,722
Segment profit 10,155 550 728 11,433 80 11,514
Segment assets 3,468,741 31,977 14,452 3,515,171 704 3,515,875
Segment liabilities 3,242,220 26,484 8,965 3,277,669 65 3,277,734Other material items:
Depreciation and amortization (*3) 2,303 296 5 2,604 0 2,604Interest income 35,584 6 141 35,731 0 35,731Interest expense 1,944 186 3 2,134 – 2,134Provision for possible loan losses – – 9 9 – 9Changes in tangible and intangible fixed
assets
2,554 239
27 2,821 – 2,821

65
Thousands of U.S. dollars
2016
Reportable segment
Banking Leasing Credit Card Total Other (*2) Total
Ordinary income (*1):
External customers $ 424,872 $ 122,338 $ 19,397 $ 566,607 $ 3 $ 566,610Intersegment 1,455 1,948 1,762 5,165 3,063 8,228
Total ordinary income 426,327 124,286 21,159 571,772 3,066 574,838
Segment profit 89,664 4,349 7,577 101,590 819 102,409
Segment assets 31,204,401 352,803 140,198 31,697,402 3,373 31,700,775
Segment liabilities 29,255,637 301,425 86,689 29,643,751 199 29,643,950Other material items:
Depreciation and amortization (*3) 20,091 2,013 61 22,165 2 22,167Interest income 308,972 62 1,177 310,211 0 310,211Interest expense 21,745 1,507 32 23,284 – 23,284Provision for possible loan losses – – – – – –Changes in tangible and intangible fixed
assets
23,407 3,639
120 27,166 – 27,166
Notes: 1. “Ordinary income” represents total income less certain special gains included in the accompanying consolidated statements of income.
2. The “other” business segment includes principally the clerical outsourcing business.
3. Depreciation and amortization include amounts relating to information technology investments.

66
(d) Reconciliations of the totals of each segment item to corresponding Group amounts
Thousands of U.S. dollars Millions of yen
2016 2015 2016
Ordinary income:
Total reportable segments ¥ 64,427 ¥ 63,356 $ 571,772
Other 345 366 3,066
Intersegment elimination (927) (920) (8,228)Gain on reversal of reserve for possible
loan losses – (9) –
63,845 62,792 566,610
Special gains 16 2 149 Total income on consolidated statements of income ¥ 63,862 ¥ 62,795 $ 566,759
Segment profit:
Total reportable segments ¥ 11,447 ¥ 11,433 $ 101,590
Other 92 80 819
Intersegment elimination (14) (13) (126)
11,525 11,500 102,283
Special gains (losses), net (252) (72) (2,245)Profit before income taxes on consolidated statements of income ¥ 11,272 ¥ 11,428 $ 100,038
Segment assets:
Total reportable segments ¥ 3,571,663 ¥ 3,515,171 $ 31,697,402
Other 380 704 3,373
Intersegment elimination (19,095) (15,362) (169,464)
Adjustment of retirement benefit assets 1,363 7,119 12,102Total assets on consolidated balance sheets ¥ 3,554,311 ¥ 3,507,632 $ 31,543,413
Segment liabilities:
Total reportable segments ¥ 3,340,257 ¥ 3,277,669 $ 29,643,751
Other 22 65 199
Intersegment elimination (16,350) (12,862) (145,110)
Adjustment of retirement benefit liability 948 1,777 8,417Total liabilities on consolidated balance sheets ¥ 3,324,877 ¥ 3,266,650 $ 29,507,257

67
Millions of yen
2016
Other material items:
Total reportable segments Other Reconciliation Consolidated
Depreciation and amortization ¥ 2,497 ¥ 0 ¥ – ¥ 2,497
Interest income 34,954 0 (68) 34,886
Interest expense 2,623 – (84) 2,539
Changes in tangible and intangible fixed assets 3,061
–
3,061
Millions of yen
2015
Other material items:
Total reportable segments Other Reconciliation Consolidated
Depreciation and amortization ¥ 2,604 ¥ 0 ¥ – ¥ 2,604
Interest income 35,731 0 (79) 35,652
Interest expense 2,134 – (92) 2,041
Provision for possible loan losses 9 – (9) –
Changes in tangible and intangible fixed assets
–
–
2,821
Thousands of U.S. dollars
2016
Other material items:
Total reportable segments Other Reconciliation Consolidated
Depreciation and amortization $ 22,165 $ 2 $ – $ 22,167Interest income 310,211 0 (606) 309,605Interest expense 23,284 – (746) 22,538Changes in tangible and intangible fixed assets
27,166
–
–
27,166

68
(e) Related information for enterprise-wide disclosure
(1) Information by service
Millions of yen
Service
Loans
Security investments Leasing Other Total
Ordinary income from external customers:
For the year ended March 31, 2016 ¥ 27,447 ¥ 10,696 ¥ 13,785 ¥ 11,916 ¥ 63,845
For the year ended March 31, 2015 26,585 9,676 12,312 14,227 62,802
Thousands of U.S. dollars
Ordinary income from external customers:
For the year ended March 31, 2016 $ 243,590 $ 94,926 $ 122,338 $ 105,756 $ 566,610
(2) Information by geographical area for the years ended March 31, 2016 and 2015 was omitted since
income accounted for in Japan was more than 90% of total consolidated income, and tangible fixed assets in Japan were more than 90% of tangible fixed assets on the consolidated balance sheets.
(3) Information by major customer for the years ended March 31, 2016 and 2015 was omitted since there were no external customers accounting for 10% or more of consolidated income.
(f) Information about impairment loss on fixed assets by reportable segment
Millions of yen
Reportable segment
Other Total
Banking LeasingCredit Card Total
Impairment loss on fixed assets: For the year ended
March 31, 2016 ¥ 250 ¥ – ¥ – ¥ 250 ¥ – ¥ 250 For the year ended March 31, 2015 46 – – 46 – 46
Thousands of U.S. dollars
Impairment loss on fixed assets: For the year ended March 31, 2016 $ 2,227 $ – $ – $ 2,227 $ – $ 2,227
(g) Information with regard to goodwill by reportable segment: None.


![The Delta Sequence - - - [n] - IEEE Entity Web Hosting In this chapter, we shall consider some fundamental concepts of linear systems analysis and use the power of MATLAB to undertake](https://img.pdfslide.tips/doc/110x75/5a9f65bf7f8b9a89178cb1f9/pdfthe-delta-sequence-n-ieee-entity-web-hosting-in-this-chapter-we.jpg)