Embed Size (px)
Citation preview
THE DIVIDEND POLICIES OF SHENZHEN LISTED FIRMS
by
Wong Ting Yu
MBA PROJECT REPORT
Presented to 。; i The Graduate School
激 • •S. »
• 子
I In Partial Fulfillment m
I of the Requirements for the Degree of a I MASTER OF BUSINESS ADMINISTRATION i i I I
I J TWO-YEAR MBA PROGRAMME a . . J J THE CHINESE UNIVERSITY OF HONG KONG
I MAY 1995 I • I I
� ‘ ‘ r
1
*
统系馆書因v-k\
p 1 5 B 慨 ill i-M Jrj UNIVERSITY y ^ %t lBRARY SYSTEiyW ,
^ ^ ^ ^ I仏
[a) “
多
IKL^
\
APPROVAL
Name: Wong Ting Yu Degree: Master Of Business Administration Title of project: The Dividend Policies of Shenzhen Listed
Firms
(Dr. Dermis K. K. Fan ) Date Approved:
• •
\ \
• • 1直
ABSTRACT
After providing some background information on the China Shenzhen
stock market and then the details of the constraints on dividend distribution in
China, this paper examines the general behavior of publicly listed firms of
Shenzhen, in terms of their dividend policies. Results of the examination
support the author's contentions. These are: 1) Firms listed in Shenzhen
retain most of the earnings and distribute low cash dividends; 2) At the same
time, they pursue high stock dividend policies; 3) Dividend policies of a large
number of listed firms are in effect “net negative dividend” policies if rights
issues are taken Into considerations; 4) Dividend policies of a large number of
listed firms are highly complex in design; 5) For some listed firms, dividend
policies often result in changes in equity stakes, among the shareholders.
The author has explained how the low cash dividend policies suit
China's current frictional, heterogeneous, “money-thirsty” capital market »
conditions. The popularity of stock dividends Is explained as a result of the
customary practice of equating stock and cash dividends In the calculation of
1
• • • 111
dividend payout ratio. Such a practice makes stock dividend a good substitute
for cash dividend in the signal function.
Often Shenzhen listed firms may distribute dividends of different forms
(cash vis-^vis stock) to different shareholders in the perception that there
exists preference for cash dividends among those holding unlisted and hence
un-tradable shares than among those who hold listed public shares.
A simplified time series and cross-sectional review suggest
inconclusively that there also exist differences between China listed firms and
their western counterparts, in terms of stability of dividend amount, cash
payout ratio, and industry characteristics.
1
iv
i ‘
TABLE OF CONTENTS �
ABSTRACT » TABLE OF CONTENTS iv LIST OF TABLES vi ACKNOWLEDGMENTS vii Chapter 1. INTRODUCTION 1
1.1 Objective and Structure 1 11 Dividends and Dividend Policy 3
2. LITERATURE REVIEW 5 3 • A BRIEF REVIEW OF THE DEVELOPMENT OF THE
SHENZHEN STOCK MARKET 9 4. PRACTICES OF AND CONSTRAINTS ON SHENZHEN
LISTED FIRMS' DIVIDEND POLICIES 12 4.1 Legal Constraints on Dividends. 12 4.2 Stipulations in Company Articles 14 4.3 Constraints of Authorities on Dividend Policies 15 4 .4 Practices of Dividend Policies 17
5. A GENERAL BEHAVIOR STUDY ON SHENZHEN LISTED FIRMS DIVIDEND POLICIES 19
5.1 Hypotheses 19 5.2 Evidences 22 5.3 Further Explanations 31 5.4 Preliminary Evidence for Market Response of
Dividend Policies 35

V
. �
6. A TIME SERIES AND CROSS SECTIONAL COMPARISON AMONG DIVIDEND POLICIES.. 37
6.1 Comparison of Cash Dividends in 1992/1993 37 6.2 Comparison of Cash Dividend Payout Ratio
Among Industries 39 7. CONCLUSIONS 41 BIBLIOGRAPHY 43
V
vi
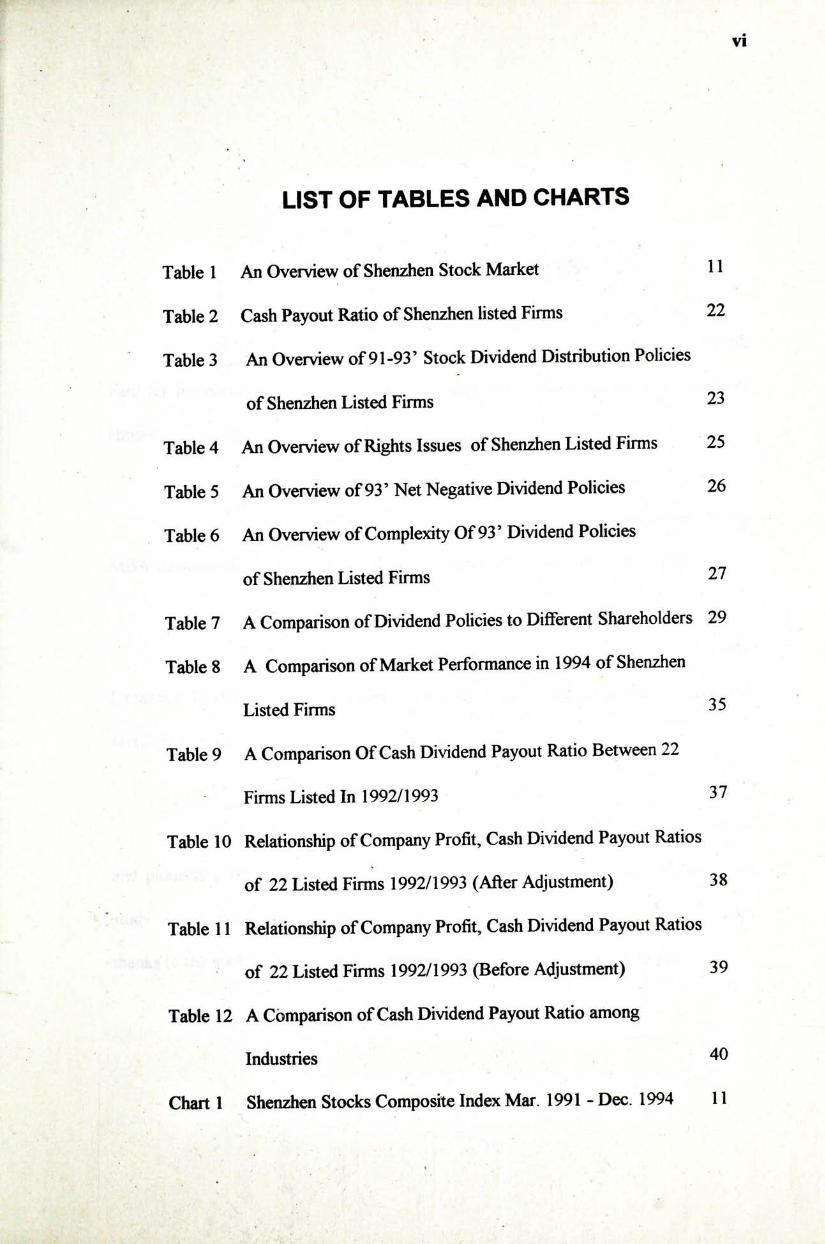
LIST OF TABLES AND CHARTS
Table 1 An Overview of Shenzhen Stock Market 11 Table 2 Cash Payout Ratio of Shenzhen listed Firms 22 Table 3 An Overview of 91-93' Stock Dividend Distribution Policies
of Shenzhen Listed Firms 23 Table 4 An Overview of Rights Issues of Shenzhen Listed Firms 25 Table 5 An Overview of 93' Net Negative Dividend Policies 26 Table 6 An Overview of Complexity Of 93 ’ Dividend Policies
of Shenzhen Listed Firms 27 Table 7 A Comparison of Dividend Policies to Different Shareholders 29 Table 8 A Comparison of Market Performance in 1994 of Shenzhen
Listed Firms 35 Table 9 A Comparison Of Cash Dividend Payout Ratio Between 22
Firms Listed In 1992/1993 37 Table 10 Relationship of Company Profit, Cash Dividend Payout Ratios
of 22 Listed Firms 1992/1993 (After Adjustment) 38 Table 11 Relationship of Company Profit, Cash Dividend Payout Ratios
of 22 Listed Firms 1992/1993 (Before Adjustment) 39 Table 12 A Comparison of Cash Dividend Payout Ratio among
Industries ^^ Chart 1 Shenzhen Stocks Composite Index Mar. 1991 - Dec. 1994 11
\
, ‘
• # VII
A
ACKNOWLEDGMENTS
First and foremost, I am much indebted to and thank my supervisor Dr. Dennis Fan, for his encouragement and tolerance. Without Dr. Fan's guidance, I may have chosen an unrealistic approach right from the start.
I should also acknowledge that without the polishing of the grammar by my MBA classmate Dr. Kanta Singh,this paper would have been rather unreadable.
Another former classmate Mr. Warren Zhou, of the Shenzhen Foreign Exchange Trading Center, has been very kind in providing computer services and sacrificing his time during my stay in Shenzhen.
Last but not the least, without access to Shenzhen Newlands Co.'s assiduous and pioneering data collection and processing regarding China's stock markets, this study would simply have been impossible. I especially would like to convey many thanks to the staff at Newlands' Information Department for bearing with me.
\
1
X •
CHAPTER 1
INTRODUCTION
1.1 Objective and Stracture
This project is a behavioral study of the dividend policies of the firms listed on Shenzhen Securities Exchange, the People's Republic of China.
Though dividend policy is one of the most confounding topics in corporate finance,it was never a concern in China until the late 80s when the PRC enterprises started to incorporate and list themselves on stock exchange. Thanks to the new-sprung China stock market, dividend became a household word to millions of investors. Most investors perceive dividends to be relevant and that a proper dividend payout would enhance the listed firm's value. Discussions and evaluations appear here and there. Yet there are no specific and detailed studies on dividend policies in China. Interestingly, nobody has ever mentioned Miller and Modigliani's (M&M) irrelevancy theorem. Outside China, there appear to be few scholars engaged in studies of dividend policies in China.
This paper tries to fill in the gap and therefore attempts to be an original study. Due to the lack of organized data and information and the incompleteness or mistakes in the available raw data, there may be some omissions and errors in this study. However, this study could be helpful as a reference. The author expects the ideas
t
2
expressed here would be of interest to researchers who may wish to conduct further studies in this area.
In this project, the author has focused mainly on the behavioral patterns of Shenzhen listed firms in setting their dividend policies, rather than the stock market's reaction to such policies. The author believes the latter is more difficult to identify at
峰
present. In addition, this study puts an emphasis on the common characteristics rather than the differences in the dividend policies of the these firms. Chapter 5 of this thesis is the key chapter that presents such efforts.
The plan of the thesis is as follows. Section 1.2 of this chapter provides a general introduction of dividends and dividend policy. Chapter 2 briefly reviews relevant academic and empirical studies on dividend policies. Chapter 3 is a very brief introduction to the Shenzhen stock market. Chapter 4 is also mainly for reference and outlines the legal constraints and practical issues of Shenzhen listed firms' vis-a-vis their dividend policies. After the background of the previous chapters,the author suggests several hypotheses in Section 5.1 of Chapter 5. In Section 5.2, the author provides organized data to support his hypotheses. Then in Section 5.3, he gives further explanations to the evidence of Section 5.2. Finally, in Section 5.4, a rough description of the market response is provided. Chapter 6 provides an inconclusive time series and cross-sectional inter-industry comparison. Chapter 7 presents the conclusions.
,The study concerns only the Shenzhen listed firms' dividend policies. The author believes that finiis listed in Shanghai would have a similar pattern. There will definitely be some subtle differences and such differences may be worth further studies.
*
3
1,2 Dividends and PiTidend Policy
Dividend refers to the portion of earnings that firms distribute to shareholders in proportion to the shares held. Dividend distribution can be annual or semiannual. In addition to regular dividends, firms sometimes pay an extra dividend which is understood to be non-repeating. Strictly speaking, dividends are not necessarily related to the current year's earnings. Finns can pay dividends even if there is a loss in the current year. Yet, people usually regard dividends as distribution from current year's earnings.
Dividends in the narrowest sense refer to cash dividends. In a broader sense, .dividends can also be stock dividends. Stock dividends arise when companies distribute
certain new shares to shareholders' accounts in proportion to shares already held by them. Stock dividends involve no money transfer and are therefore not substantially
_
different from stock splits. Both increase the number of shares held per shareholder and conversely, reduce stake per new share, such that the total stake held by any shareholder is unchanged. The only distinction is in the accounting treatment: stock splits reduce the par value of shares, whereas stock dividend distribution involves a transfer from retained earnings to equity capital. Most people treat large stock dividend distribution as the same as stock splits.
For many firms, a rights issue relates to dividend policy. The author contends that in an even broader sense, the rights issue is an extension and a part of dividend policies and its essence is "negative dividends." This study of Shenzhen listed firms' dividend policies setting concerns itself with this broadest understanding of dividends.
\
4
Under constraints of relevant state laws, company articles, and debt covenants, firms can decide dividend polices at their discretion: dividend omission, cash dividend distribution, stock dividend distribution, or both cash and stock distribution. If we consider rights issues to be negative dividends, there are eight possible scenarios instead of four.
Regarding cash dividends, there are two measures of dividend policy. We can either compare current dividends to past years' dividends to judge if there is an increase in absolute amount; or calculate the cash payout ratio, which is to divide dividends by current earnings. Consequently, firms can adopt policies that may result in a fixed dividend (or floating within a range), in absolute amount; or maybe a fixed payout ratio (or floating with in a range). Firms can also set a gradually increasing dividend policies or other policies that show some degree of steadiness and smoothness. Of course, firms can also at their discretion set dividends at random and without continuity.
I
• I ‘
5
CHAPTER 2
LITERATURE REVIEW
One of the earliest and the most important research on dividend policies is that of Lintner [1956]. After a series of interviews with company managers, Lintner finds that unless there is an important and substantial change in a firm's earning power, the management is inclined to maintain stability of dividend distribution. The stability is visible in their policy of limited changes in dividends, judging by absolute amounts. It is also seen in the fact that firms try to have a target payout ratio that is fixed or floating within a narrow range, for a long period.
According to Lintner's model, companies set cash dividends mainly on the basis of current earnings and the target payout ratio. Also influencing is last year's dividend (allowance for change in dividends by absolute amount). In short, companies do not set dividend policies at random or in disregard to fiindamentals.
However, Miller and Modigliani [1961] point out that, if in practice dividends are not set at random, in theory the dividend policies are irrelevant to company's value and can be set at discretion. Under the assumptions of no tax discrimination, information symmetry, transaction costs approaching zero, and independence of investment decisions from financing behavior, firms can distribute dividends of any amounts. Any fund needed for such distribution can be financed at the same capital cost. For investors,dividends and capital appreciation are equivalent. Dividends result
I
6
in corresponding decrease of share value ex-dividend. Therefore dividend policy is only a "mathematical game” for both firms and investors.
Miller & ModigUanTs "Dividend & Debt Irrelevancy" theory is a major breakthrough in modem finance. However the assumptions mentioned above can not stand true in real world. Empirical studies for the famous hypothesis "dividend policies can not result in risk-adjusted abnormal returns" have shown mixed and often negative results. Therefore, later researches concentrate on the relevant side of dividend policies instead of their theoretical irrelevance.
Taxation of dividends is often at a disadvantage compared with capital appreciation. Dividend allocation (and the subsequent external financing to compensate cash outflow when necessary) will result in certain amounts of transaction costs. Thus under M&M frame, dividend distribution will reduce shareholders' wealth.
On the other hand,according to Easterbrook [1984],s agency costs model, dividend distribution helps reduce agency costs that arise due to separation of ownership and management. Easterbrook [1984] divides agency costs into two categories: monitoring expenditures, and opportunity expenditures. The reason for investors' demand of dividends is that dividend distribution will improve company's reliance on external capital. The external capital financing would associate well with overall audit and performance appraisal. The opportunity expenditures due to external financing would be remarkably lower than monitoring expenditures for directly monitoring managerial behavior. In addition, dividend distribution can reduce degree of information asymmetry. Managers can rely on dividend policies to signal the firms' financial positions and prospects. Such signaling effects would also lower the agency costs. To sum up, according to agency theory, investors usually welcome dividends
\
7
which result in net decrease of agency costs. It also explains that a firm asking for refinancing after dividend distribution is not as uneconomical as it appears to be.
Trends in the literature continue to focus on behavioral or cognitive elements of corporate dividend policies setting (see Miller [1986], for a general review summary). Three major functions are found: net decrease of agency costs; signaling effect; wealth transfer from creditor to shareholders. These offer possible explanations to the empirical findings that there exists investor's "cash preference" (see Long [1978]),An interesting explanation is by Shefrin and Statman [1984]. They suggest that, according to Thaler & Shefrin’s self control theory, “cash preference" may be positively correlated to age and negatively correlated to savings. Therefore, investors may differ in attitudes due to different income and expenditure pattern. Christie [1984] finds a U shape attitude towards decrease of dividends. There are no obvious differences in negative impacts of large decrease of dividends and total cut of dividends.
There are fewer concerns about stock dividends. In substance, a stock dividend is only a transfer in terms of accounting. Yet empirical studies find that the market responses have largely been favorable. The early studies done by Dolley [1933], Barker [1956], and Sussman [1962], identify the main reasons for stock splits
.(and thus stock dividends). These are to conserve cash; to facilitate future equity financing (by lowering the subscription price and increasing the number of shareholders outstanding); to please the shareholders by giving something they perceive as having value. Later researchers suggest stock splits and stock dividends may convey "economic value" (for details, see Nichols [1978]). Doran [1994] contends it may be because stock dividends convey strong optimistic messages to the market and there
8
also exists an "attraction effect": financial analysts usually adjust upwards, the earning predictions for those firms that distribute stock dividends or exercise stock splits.
. c (
.、 , •...‘.• - ‘
9
CHAPTER 3
A BRIEF REVIEW OF THE DEVELOPMENT OF THE SHENZHEN STOCK MARKET
Till now, there are two security exchanges in China: one in Shanghai and the other in Shenzhen. As this study focuses on Shenzhen listed firms, it does not discuss the development of Shanghai Stock market. In brief, Shanghai stock market was developed later than Shenzhen's but has now emerged to be bigger in size. In other respects these two stock markets have been largely similar in their development.
Shenzhen stock market, counting from the equity issue of the first public company in Shenzhen-Shenzhen Development in May 1987, already has a nine years long history. The secondary market began with the listing of Shenzhen Development Bank in April 1988. However, trading until December 1990 was of over the counter (OTC) type. The Shenzhen stock exchange began regular operations in December 1990.
The following is a brief chronological review of Shenzhen stock market: March 1987 一 April 1990: This period can be described as an "introductory
stage". At the time people had little knowledge of stocks. The equity issues met tremendous difficulties in subscription. By early 1989, the first issue (Shenzhen Development Bank) and second issue (Shenzhen Wanke) had appeared and proved unsuccessful. The government had to order compulsory subscription of 50% of total stocks in the Development Bank case. In Wanke case, the underwriter had to subscribe
10 � •
to the leftover 25%. In 1989, investors found that, in less than two years the cash dividend returns from Shenzhen Development had already exceeded the initial subscription price. Such high returns facilitated the third and forth rounds of issuing of equity in 1989 and early 1990. Yet, the secondary market was still inactive.
April 90 一 February 93: During this period, the Shenzhen Stock Market saw several ups and downs, but, in general,there was an upwards trend. This corresponded with China's rapid economic growth in early 90s, yet the widely accepted major reason was that supply of equity issues could not satisfy the ever-increasing demand for financial assets by private investors. The market was so speculative that the government had frequently interfered. However,the government's determination to develop China stock market largely offset its 'suppressing' policies.
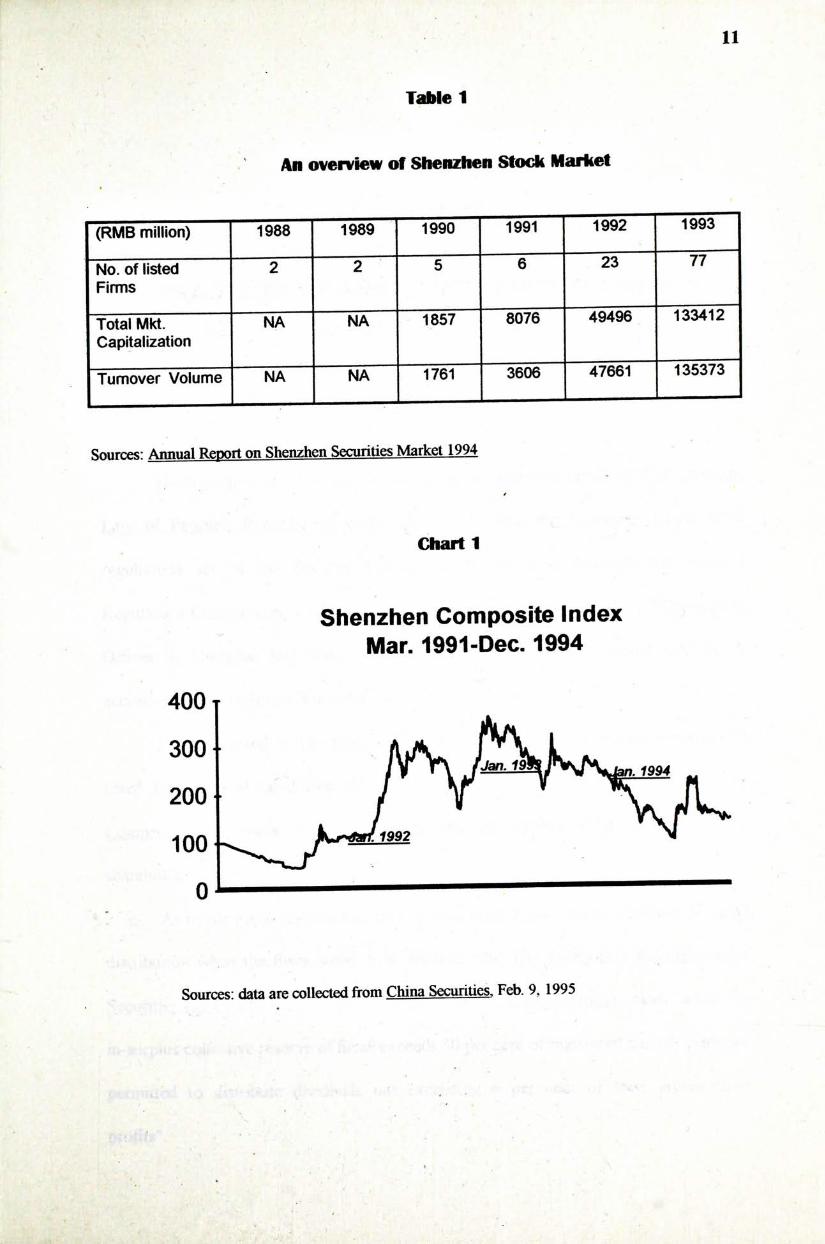
February 93 - the present: Stock market has seen a declining trend after February 93. The macro-economics adjustments, high-inflation rate, and the listings of new issues, have given rise to the present bearish situation. For details, see Table 1 and Chart 1.
One of the most important features of China stock market is that state and legal shares occupy controlling stakes in most listed firms. Such shares are not listed on the Exchange and thus not traded. Percentage holding varies from industry to industry, and from firm to firm. On average, the non-listed shares occupy more than 60% of total equity.
\
11
Table 1
An overview of Shenzhen Stock Market
(RMB m i l l i o n ) 1 9 8 8 1989 1990 1991 ~ ~ 侧
No. of listed 2 5 6 23 77 Firms
Total Mkt. NA NA 8076 49496 133412 Capitalization
Turnover Volume NA 3606 47661 135373
Sources: Annual Report on Shenzhen Securities Market 1994
Chart 1
Shenzhen Composite Index Mar. 1991-Dec. 1994
400 T
3 0 0
o' —
Sources: data are collected from China Securities, Feb. 9,1995
�
12
CHAPTER 4
PRACTICES OF AND CONSTRAINTS ON SHENZHEN PUBLICLY LISTED FIRMS' DIVIDEND POLICIES
4,1 Legal Constraints on Dividends
Dividend policies of listed firms are regulated and constrained by Jhe Company Law of People'f; Republic of China (hereafter called the Company Law),other
regulations set by the Security Committee of the State Council, the Security Regulatory Commission, and regional authorities (such as the Security Management Offices in Shanghai and Shenzhen). At the same time, they should also be in accordance with company's articles.
It is expressed in The Company Law that the profit distribution proposals of listed firms should be drawn up by the board of directors (Section 112, of the Company Law unless otherwise stated) and be subject to permission of the shareholders' meeting (Section 102):
As to the profit distribution, there are no explicit statements admitting dividend distribution when the firms suffer loss. Section 129,The Temporary Regulations on Securities Issue and Trade (hereafter as the Temporary Regulations), states "when the in-surplus collective reserve of firms exceeds 50 per cent of registered capital, firms are permitted to distribute dividends not exceeding 6 per cent of their accumulated profits".
*
13
When the compulsory collective reserve is not able to compensate the last year's loss, firms should compensate the loss by current year's profit. Afterwards, 10 per cent of net profit should be retained as compulsory collective reserve till this reserve reaches 50 per cent of the registered capital. Another 5-10 per cent of profit is for welfare fund (similar to 'pension fund') (Section 180). The non-compulsory
collective reserve retention is after that for the welfare fund, and the necessity and amount are subject to the permission of the shareholders' meeting (Section 177).
The balance portion of profit may be distributed according to the proportion of shares held. The Company Law does not state if dividends should be in cash or as stock dividends. As per the Temporary Regulations, firms can distribute dividends in cash and for as stock (Section 40), while according to the Company Law,stock dividends are defined as new shares and the estimated profit rate should be more than the current bank deposit interest rate (Section 137).
To conclude: (A) It is not expressed in the Company Law that firms should not distribute
dividend when at loss. (B) The historical loss constrains the current dividend distribution. (C) Generally, the dividend should not exceed 85 per cent of the net profit. The
compulsory collective reserve does not need to exceed 50 per cent of the registered capital. The shareholders' meeting can decide to transfer collective reserve to capital account as long as remaining collective reserve is not less than 25 per cent of the registered capital Thus in effect, the Company Law does not create practical restrictions to the stock dividend distribution.
I
14
(D) Cash dividend exceeding 95 per cent of the net profit,should not be distributed (if not r^aining collective reserve);
(E) Cash and stock dividends are not distinguished in the Company Law. It is also not stated that the value of stock dividend must be represented by its par value. It is however, mentioned that stock dividend can be distributed to capitalize collective
reserve; (F) There is no mention in the Company Law as to whether rights issue should
be treated as new share issue. (G) There aren't any constraints in the Company Law on dividend policies due
to debt covenants. As the Company Law was passed by the National Conference and is effective
since July 1st, 1994,this study, which relates to the dividend policies before the end of 1993, would not be affected essentially. The new law is not retrospective.
4.2 Stintdaticms in Otnpanv Articles
The distribution of profit should comply with company articles. Profit distribution, collective reserve retention, welfare fund retention, and dividend payout ratio are highlighted and set specifically and separately in company articles. As per the
• articles of the first 16 listed firms in Shenzhen, the fund for dividend distribution usually occupies 30 to 55 per cent of the profit after tax. As dividends can be cash and /or stock according to these articles, the above percentages actually are the ceiling for cash dividend payout ratios. Only 4 listed firms have specified in their articles when and how often to distribute dividends.
15
4.3 Constraints of Authorities cm Dividetid Policies
The main authorities in decreasing order of importance are the Security Committee, the Security Regulatory Commission, Shanghai and Shenzhen Security Management Office, and other relevant taxation and state assets authorities. These authorities promulgate regulations/notices which play an important role in dividend distribution and rights issues. Presented here chronologically, are major contents of the regulations after 1993, except the first one that pertains to 1990. As a matter of fact, the authorities have seriously been considering the dividend and the rights issue policies only since 1994.
July 1st, 1990: Shenzhen government stipulated that on the portion of the dividend exceeding one year bank deposit interest, the investors should pay individual income tax.
March 4th, 1994: The Shenzhen Security Management Office issued "Notice on Circulation of New Shares after Rights Issue by Listed Firms," stipulating that new state shares, legal or founders' shares due to rights issue can be listed in the securities exchange. The Security Management stressed that it reserves the right to decide the acceleration or the delaying of the listing.
March 5th, 1994: The Security Regulatory Commission negated the March 4, 1994 notice issued about listing of new shares after rights issue.
March 12, 1994: The chairman of the Security Regulatory Commission, Mr. Liu Hong-ru, announced ‘Four "NO"s' policies to save the securities market. One "No" is that listed firms should not abuse the power of rights issues.
I
» :
. . . . / . . 、 」 :
16
May 12, 1994: The State Taxation Bureau stated that stock dividend should be taxed by 20 per cent of the par value. The Shenzhen Taxation Bureau announced postponement of the effective date of this regulation.
Oct. 5th, 1994: The Security Committee gave out a notice about normalizing rights issue behavior and the maximum allowance in a year for rights issue is to be 30 per cent of the existing shares.
Oct. 26,1994: The State Assets Bureau announced that listed firms should normalize their rights issue behavior and state shareholders should assume their duties strictly according to 'Notice About Protecting the State Share Equity During Rights Issuing'.
Nov. 31,1994: The Security Committee issued a notice that listed firms should strictly comply with regulations during rights issuing. It also said that before new regulations come out, the new state/legal shares after the rights issue and dividend distribution, should not be listed for the time being.
Dec. 14’ 1994: The State Assets Bureau issued 'the Notice on Problems of Rights Issue on State Share and Equity Transference', stipulating that the equity transference of state shares should be examined by the State Assets Bureau and the examination document was necessary when reexamining the rights issue.
Influences of the laws and regulations above mainly are: 1) The additional 10% tax on dividend exceeding bank interest in 1990s and the postponement of the 20% levy on stock dividends were both based on market conditions. The former practice favored low dividend policies in early stage, the latter encouraged firms to distribute more stock dividends; 2) The constraints on rights issue show the intentional "total control" by government in tight money condition; 3) Worry of government about state
17
equity loss shows dividend and rights issue policies may to some extent cause changes of equity structure.
4,4 Practice of EHiddend Policies
The profit distribution proposals are drawn up by the board of directors and promulgated in annual reports within 120 days after the end of a fiscal year. They include profit retaining and dividend declaration per share. As to the ratios of cash and stock in dividend, they are not necessarily included in the annual report. Rights issue proposals are also not necessarily included.
The time when the shareholders' meeting should be held, may vary from company to company. The shareholders' meeting examines the current year's annual report and dividend, and rights issue proposals. Afterwards, dividend and rights issue proposals are submitted to the Security Management Office for permission. If such proposals concern themselves with state equity or warrants transference, the permission of the regional state assets bureau is also needed.
After obtaining all necessary permissions, listed firms are able to start distribution, set rights register closing day, ex-dividend day and stock dividend listing day, etc. Detailed introduction on procedures is available in The New Handbook of Stock Market compiled by Shenzhen Newlands Co..
Dividends and rights issues may be announced simultaneously but this is not compulsory. The former are usually declared in March • July for the previous year while the practice for the latter is determined by actual market conditions.
Some listed firms issue B Shares (for, and tradable among, overseas investors). B share holders would receive the same dividends as local shareholders except that the

18
currency is foreign (HK dollars for Shenzhen listed firms). The dividends for B shares may be different from local shares if there exist equity issue time differences. Such a different treatment is only done once, in the beginning and is stated in the prospectus. There may be some specific features in dividend setting in those firms which issue B shares and this could be worth further studies.
*
19
CHAPTER 5
A GENERAL BEHAVIOR STUDY ON SHENZHEN PUBLICLY LISTED FIRMS' DIVIDEND POLICY
5.1 Hypotheses
According to M&M Model,in a M y efficient capital market, to lend and to borrow money cost the same. Thus the financing ability of firms is infinitely large,and the firms have high flexibility on when and how to carry out financing. If the taxation treatment of debt capital and equity capital for firms is not different, there is also no tax disadvantage for investors on dividends as compared with capital appreciation, then different distribution and financing methods (earnings retaining, new share issuing or bond issuing) would not affect company value. In such circumstance,dividend policies would be unnecessary and would only be a "mathematical game".
Alternatively, firms are able to choose dividend policies to be whatever and however they like. They can either issue new shares after distributing all dividends to compensate cash outflow, or distribute no dividends at all. There are no differences in costs or in substance. Neither will increase or reduce the financing cost of firms. Correspondingly, neither will influence the investment behavior of firms.
The irrelevancy of dividend policies expounded by M&M Model denies any worth of dividends. Still, even if the dividend policies are irrelevant, their patterns can
20 - .
have some common features It is also worth noticing that the several assumptions for the irrelevancy can only exist under ideal states. Hence we deduce that, in an imperfect capital market like China, dividend policies of listed firms are not only relevant, but also affect firms' values.
Obviously, the assumption that to lend and borrow money cost the same,does not stand in China. China, experiencing the course of industrialization, is capital thirsty. Besides, the capital markets appear frictional and disintegrated: interest rates are regulated by the central bank and can not reflect the balance of money supply and demand (the existence of gray money market is an evidence). Banks still have a long way to go before fiiU commercialization and corporate bond market hasn't taken a shape. Capital thirst and market friction together mean the realities in China are far different from M&M assumption.
In this period in China, listed firms are experiencing a course of development. They have vigorous demand for capital but limited financing abilities. Corporate bonds have difficulties in being issued or do not find a sufficiently liquid secondary market New share issues and rights issues suffer from the restrictions of government policies Therefore retained earnings are the cheapest fund for expansion. For this reason, we suppose that the cash dividend payout ratios of Shenzhen listed firms are low (Hypothesis 1).
Hypothesis 1 is also based on the fact that there are no effective monitoring mechanisms on managerial behavior, which is inclined towards growth of corporate size and investors have more interest in the market prices than in dividends (for further explanation, sees Section 5.3).
�
21
At the same time, in the China stock market where information is asymmetric and not transparent, we believe that dividend should play a strong signaling role. When
�
the distribution of stock dividend relates to earnings, and firms are not obliged to pay any actual cash dividends, we could suppose that firms distribute stock dividend generously (Hypothesis 2) to signal satisfactory current earnings and optimistic prospects.
Dividend policy, in this study, also includes rights issue policy. Thus, we can hypothesize that there is actually a net cash inflow resulting from dividends payout accompanied by rights issue by the Shenzhen listed firms. That is,a number of listed firms conduct rights issues which would result in net negative dividend (Hypothesis 3).
We also suppose that listed firms in China, to M y utilize dividend policies as signals and to reduce agency costs, may adopt complicated dividend policies (Hypothesis 4). Thus they may distribute stock dividends to indicate earnings, pay cash dividends to indicate healthy financial positions, and offer rights issues to show capital needs for expansion.
Finally, equity structure of listed firms in China includes state shares,legal shares, public shares and employee shares. Only public shares are listed in security exchanges (employee share will be listed gradually in six months after new issue) and correspondingly possess liquidity. It can be asserted that different shareholders prefer different kinds of dividends due to different liquidities. Thus, it is possible to assume that some listed firms apply different dividend policies to different shareholders without breaching laws. Thus these different dividend distribution policies (hereafter referred to as DDD in short) result in changes of shareholders' stakes (Hypothesis 5).
22
5.2 Evideace
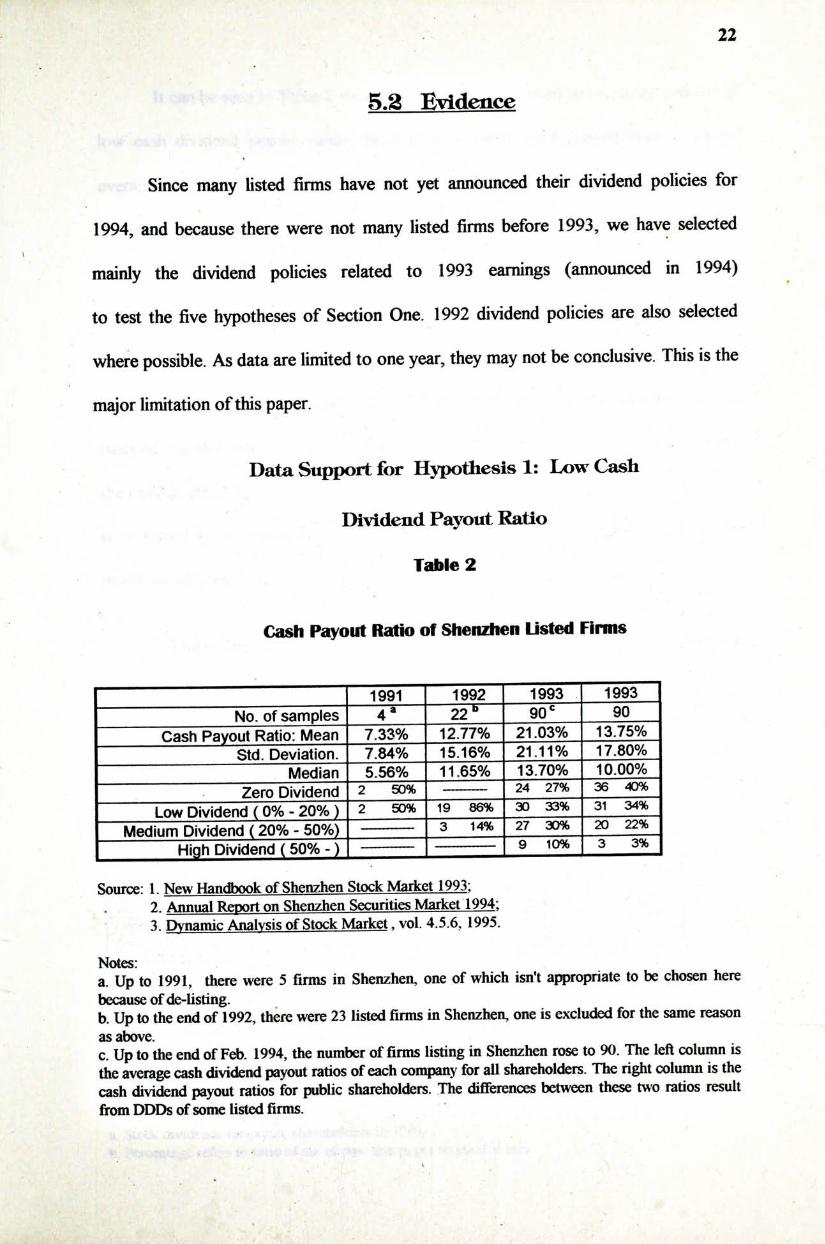
Since many listed firms have not yet announced their dividend policies for 1994, and because there were not many listed firms before 1993, we have selected
I mainly the dividend policies related to 1993 earnings (announced in 1994) to test the five hypotheses of Section One. 1992 dividend policies are also selected where possible. As data are limited to one year, they may not be conclusive. This is the major limitation of this paper.
Data Support for Hypothesis 1: Low Cash
Dividend Payout Ratio
Table 2
Cash Payout Ratio of Shenzhen Listed Firms
1991 1993 I 1993 No. of samples 4 ' 一 2 2 ° 90 = — 9 0 一
Cash Payout Ratio: Mean 12.77% 21.03% 13.75% Std. Deviation. 7.84% 15.16% 21.11% 17.80%
Median ~5 .56% 11.65% 13.70% 10.00% — Zero PividendT 2 50% — 24
一 Low Dividend ( 0 % - 2 0 % r 2 50% ~ 9 86% 30 33% 31 34% Medium Dividend (20% - 50%) 3 _ _ 2 0 22%
High Dividend (50% - ) | 9 10% | 3 3%
Source: 1. New Handbook of Shenzhen Stock Market 1993; * 2. Annual Report on Shenzhen Securities Market 1994;
3. Dynamic Analysis of Stock Market, vol. 4.5.6,1995. Notes: a. Up to 1991, there were 5 firms in Shenzhen, one of which isn't appropriate to be chosen here because of de-listing. b. Up to the end of 1992, there were 23 listed firms in Shenzhen, one is excluded for the same reason as a^ve. c. Up to the end of Feb. 1994,the number of firms listing in Shenzhen rose to 90. The left column is the average cash dividend payout ratios of each company for all shareholders. The right column is the cash dividend payout ratios for public shareholders. The differences between these two ratios result from DDDs of some listed firms.
\
23
It can be seen in Table 2 that, generally speaking, listed firms pursue policies of low cash dividend payout ratios. In 1992 and 1993, public shareholders obtained average cash dividends less than 14 per cent of net earnings. What's more, 40 per cent oflisted firms in 1993 did not pay public shareholders any cash dividends at all.
t
Historically, the average cash dividend payout ratio of the US firms has floated around 50 per cent. Compared to this figure, the cash dividend payout ratio of Shenzhen listed firms is low.
The average price-earning ratio of Shenzhen listed firms, calculated on the basis of the closing index of 1994 and the earnings level of 1993, is about 13. Thus, the cash dividend yield of Shenzhen listed firms is slightly more than 1 per cent, which is reckoned as extremely low dividend yield rate compared to three per cent of the international standard.
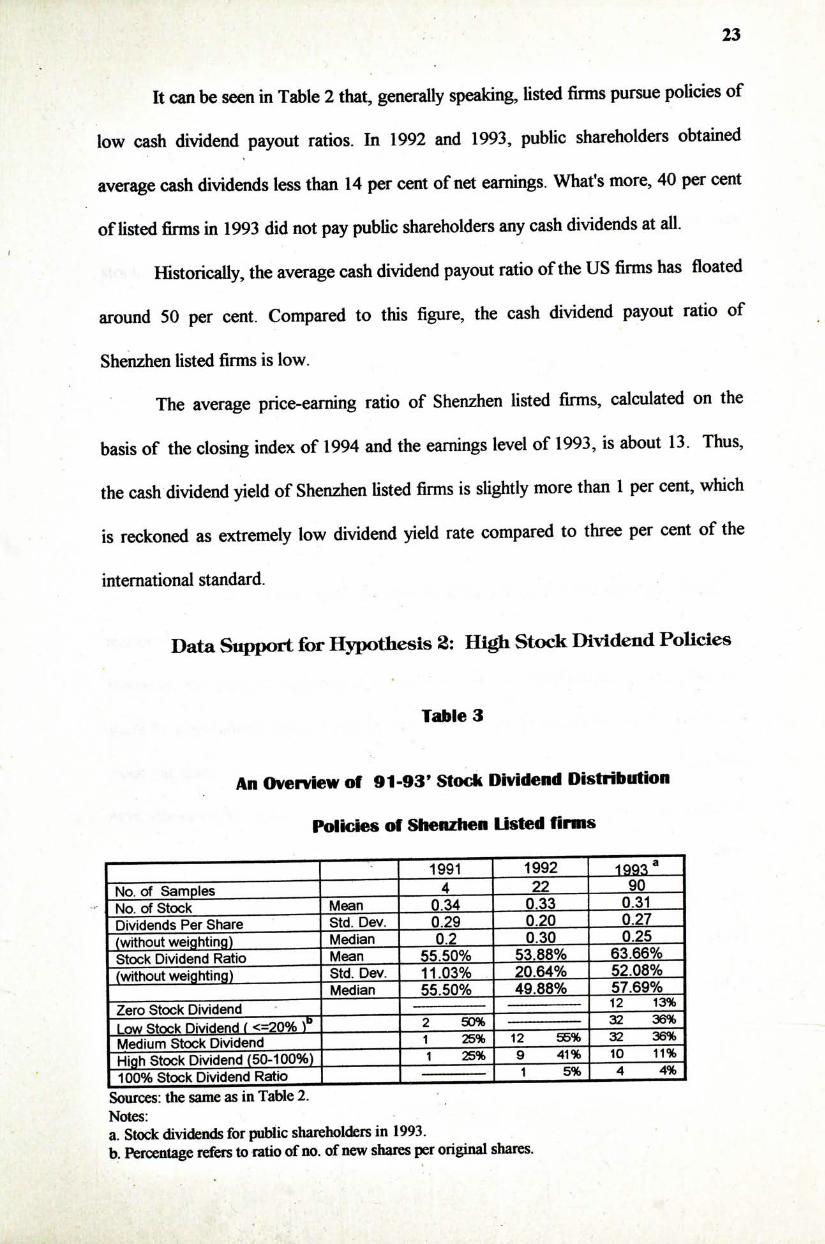
Data Support for Hypothesis 2: High Stock Dividend Policies
Tables
An Overview of 91-93' Stock Dividend DistHbution
Policies of Shenzhen Listed firms
1991 1992 No. of Samples 4 22 ^ ^ No. of Stock Mean 0.34 0-33 Q ^ Dividends Per Share Std. Dev." 0.29 Q2Q 0 2 7 — — (without weighting) Median 02 QJO 025—— Stock Dividend Ratio Mean 55.50% 53.88% 63.66% (without weighting) — Std. Dev. 11.03% 20.64% 52.08%
Median 55.50% 49.88% 57.69% -J——stock Dividend “ 12 13%
I , : 二 ‘ Hiv/iHAnH ( 观 、 b I 一 2 5 0 ^ ~ 32 M^ium Stock Dividend | 一 1 25% 12 56%
I Hinh Stock Dividend (50-100%) I "“ 1 25%" 9 41%" 10 11% I inn% Stock Dividend Ratio I - | 1 5% 4 4% Sources: the same as in Table 2. Notes: a. Stock dividends for public shareholders in 1993. b. Percentage refers to ratio of no. of new shares per original shares.
24
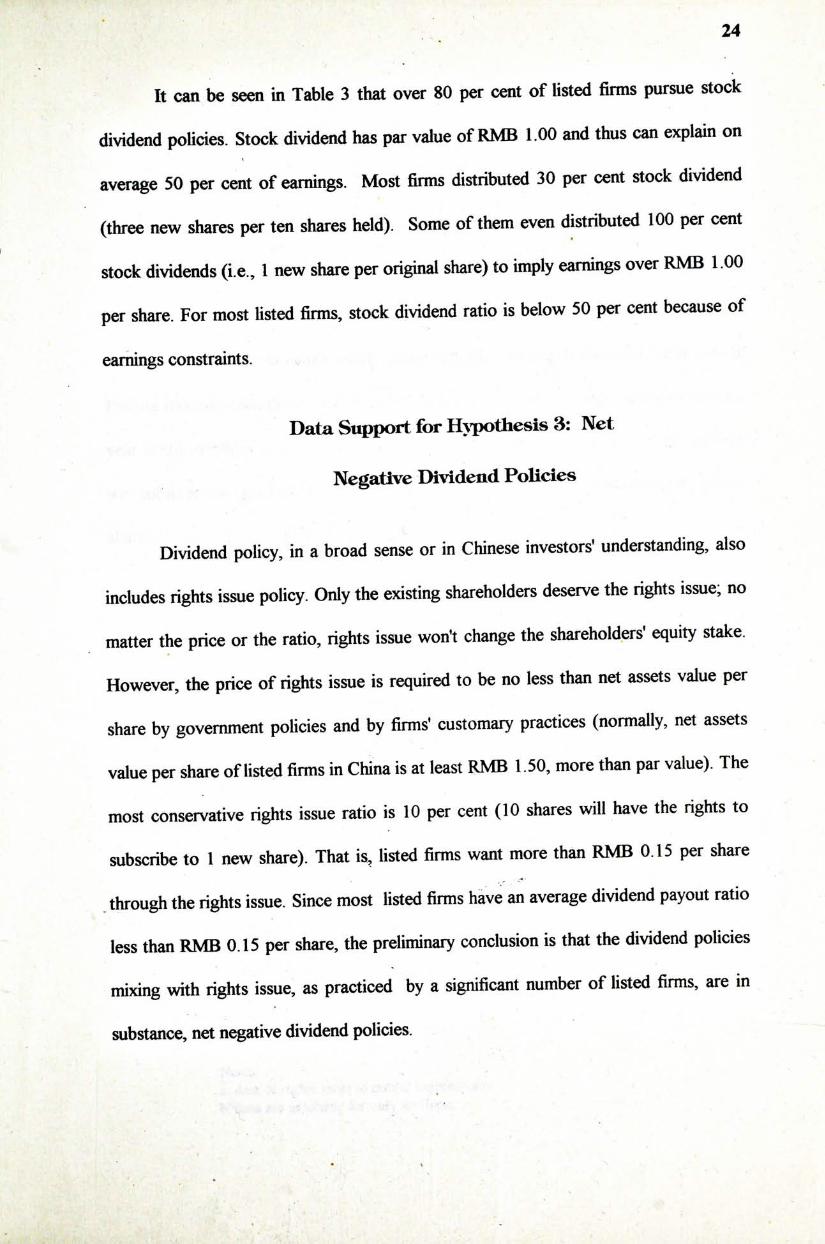
It can be seen in Table 3 that over 80 per cent of listed firms pursue stock dividend policies. Stock dividend has par value ofRMB 1.00 and thus can explain on average 50 per cent of earnings. Most firms distributed 30 per cent stock dividend (three new shares per ten shares held). Some of them even distributed 100 per cent stock dividends (i.e., 1 new share per original share) to imply earnings over RMB 1.00 per share. For most listed firms,stock dividend ratio is below 50 per cent because of earnings constraints.
Data Support for Hypothesis 8: Net
Negative Dividend Policies
Dividend policy, in a broad sense or in Chinese investors' understanding, also includes rights issue policy. Only the existing shareholders deserve the rights issue; no matter the price or the ratio, rights issue won't change the shareholders' equity stake. However,the price of rights issue is required to be no less than net assets value per share by government policies and by firms' customary practices (normally, net assets value per share of listed firms in China is at least RMB 1.50,more than par value). The most conservative rights issue ratio is 10 per cent (10 shares will have the rights to subscribe to 1 new share). That is, listed firms want more than RMB 0.15 per share through the rights issue. Since most listed firms have an average dividend payout ratio less than RMB 0.15 per share, the preliminary conclusion is that the dividend policies mixing with rights issue, as practiced by a significant number of listed firms, are in substance, net negative dividend policies.
• »
25
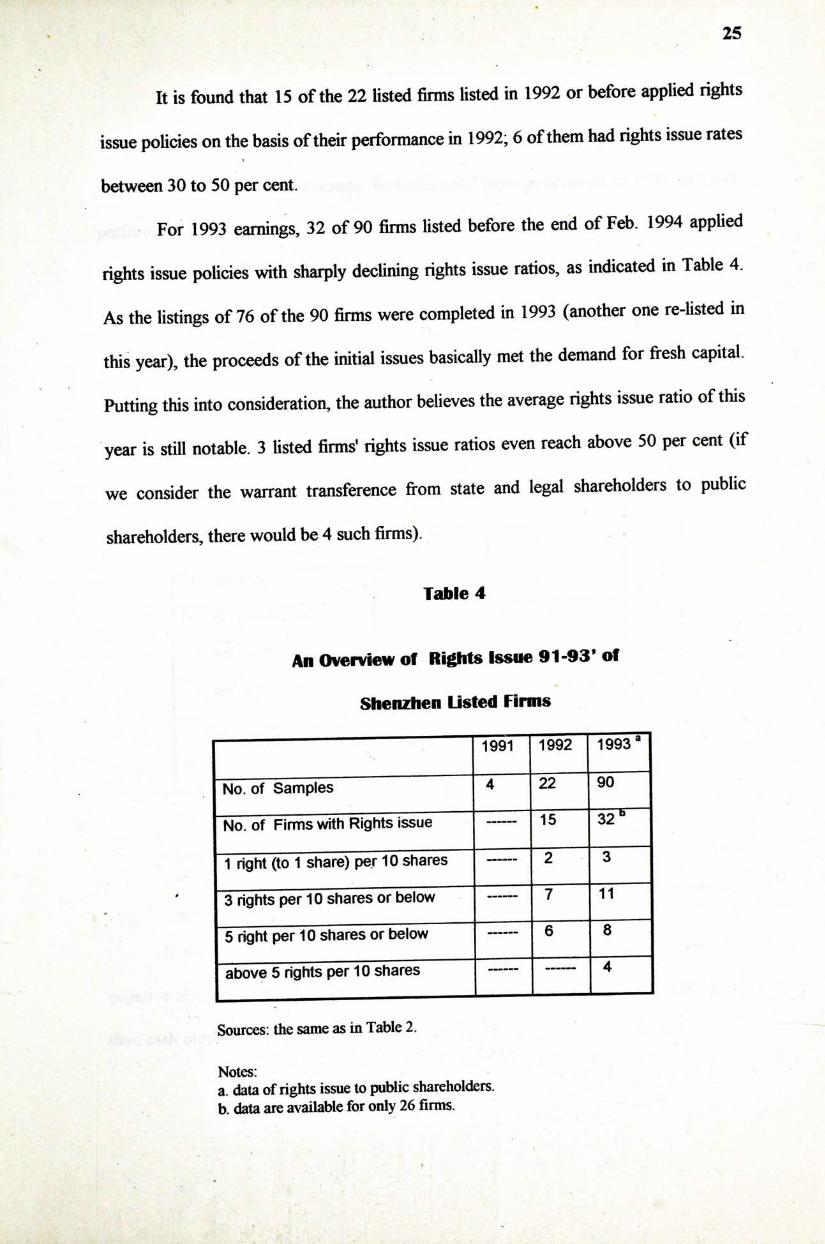
It is found that 15 of the 22 listed firms listed in 1992 or before applied rights issue policies on the basis of their performance in 1992; 6 of them had rights issue rates between 30 to 50 per cent.
For 1993 earnings, 32 of 90 firms listed before the end of Feb. 1994 applied rights issue policies with sharply declining rights issue ratios,as indicated in Table 4. As the listings of 76 of the 90 firms were completed in 1993 (another one re-listed in this year), the proceeds of the initial issues basically met the demand for fresh capital. Putting this into consideration, the author believes the average rights issue ratio of this year is still notable. 3 listed firms' rights issue ratios even reach above 50 per cent (if we consider the warrant transference from state and legal shareholders to public shareholders,there would be 4 such firms).
Table 4
An Overview of Rights 丨ssue 91-93,of
Shenzhen listed Firms
— I 1991 1992 1993'
No. of Samples 4 22 90
No. of Firms with Rights issue 15 32
1 right (to 1 share) per 10 s h a r e s ~ 2 3
‘ 3 rights per 10 shares or below~一 7 11
5 right per 10 shares or below 6 8
above 5 rights per 10 shares 4
Sources: the same as in Table 2. Notes: a. data of rights issue to public shareholders. b. data are available for only 26 firms.
26
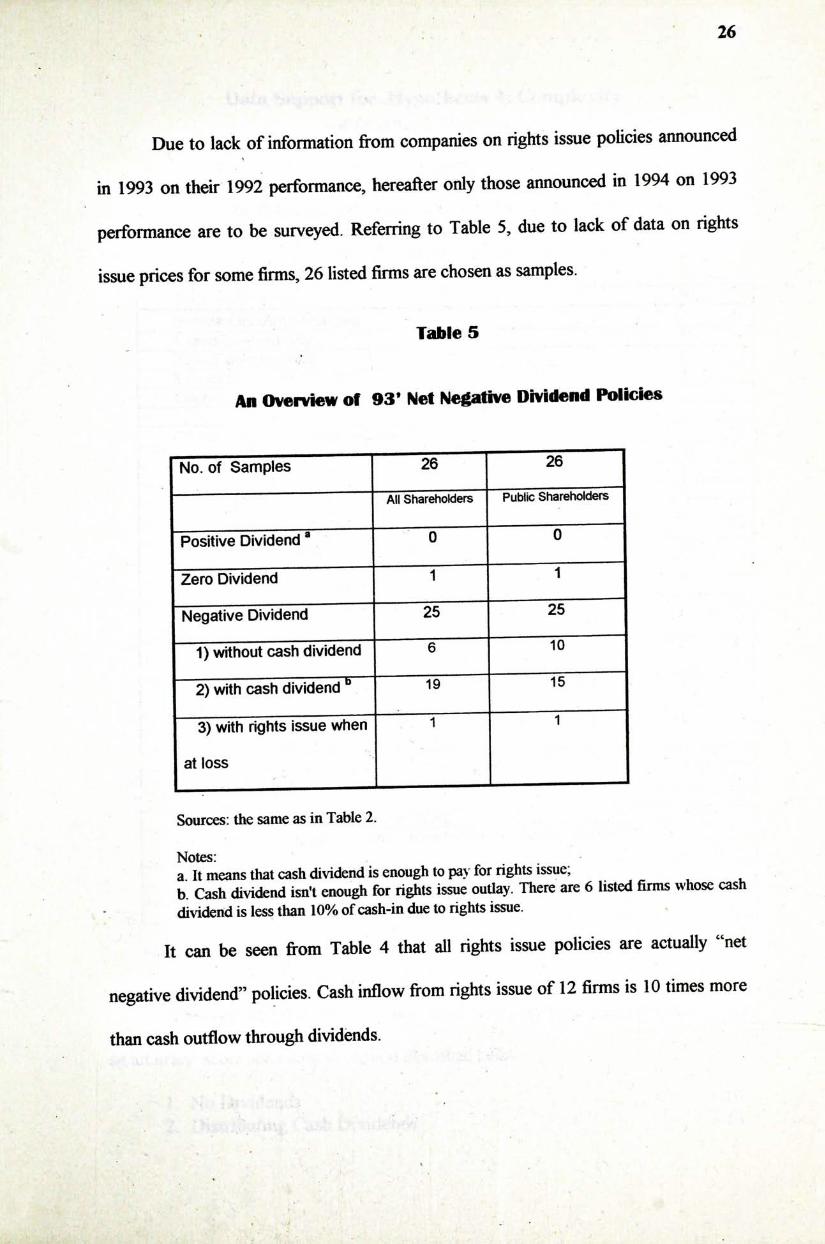
Due to lack of information from companies on rights issue policies announced � in 1993 on their 1992 performance, hereafter only those announced in 1994 on 1993 performance are to be surveyed. Referring to Table 5,due to lack of data on rights
issue prices for some firms, 26 listed firms are chosen as samples.
Table 5
An Overview of 93' Net Negative Dividend Policies
No. of Samples ^ 26
"“ ―“ All Shareholders Public Shareholders
Positive Dividend ® 0 0
Zero Dividend 1 1
Negative Dividend 25 25
1) without cash dividend 6 10
2) with cash dividend “ ^ 15
3) with rights issue when 1 1
at loss
Sources: the same as in Table 2.
Notes: a It means that cash dividend is enough to pay for rights issue; b. Cash dividend isn't enough for rights issue outlay. There are 6 listed firms whose cash
. dividend is less than 10% of cash-in due to rights issue.
It can be seen from Table 4 that all rights issue policies are actually "net
negative dividend" policies. Cash inflow from rights issue of 12 firms is 10 times more
than cash outflow through dividends.
27
Data Support for Hypothesis 4: Complexity of Dividend Policies
Table 6
An Overview of Complexity of 93' Dividend Policies
off StienzKen Listed Firms
Total No. of Firms: 22 Simple Dividend Policies I L 1 .cash dividend only 2.stock dividend only Z 3.no cash or stock dividend ^ 4.rights issue only ?
Complicated Dividend Polices — 1 .both cash and stock dividend
• 2.cash dividend and rights issue ] 3.stock dividend and rights issue ?
Highly Complicated Dividend Policies cash, stock dividend and rights issue ?1
Different Dividend Policies to Different Shareholders (DDDs)
1.cash dividend for unlisted share holders, stock dividend for 6 listed share holders; 2.cash and stock dividend for unlisted share holders, stock 5 dividend for listed share holders; 5.stock dividend for unlisted share holders, cash and stock 5 dividend for listed share holders.
Different Rights issue Policies No. of Firms — 1 .direct subscription, warrants not listed; 15 2.warTants of unlisted shares transferred to listed share holders:
1) two warrants listed together ^ 2) two warrants listed separated as Warrant A1 and A2 IJ
- a.rights issue based on share numbers ex-dividend ?
Sources: the same as in Table 2.
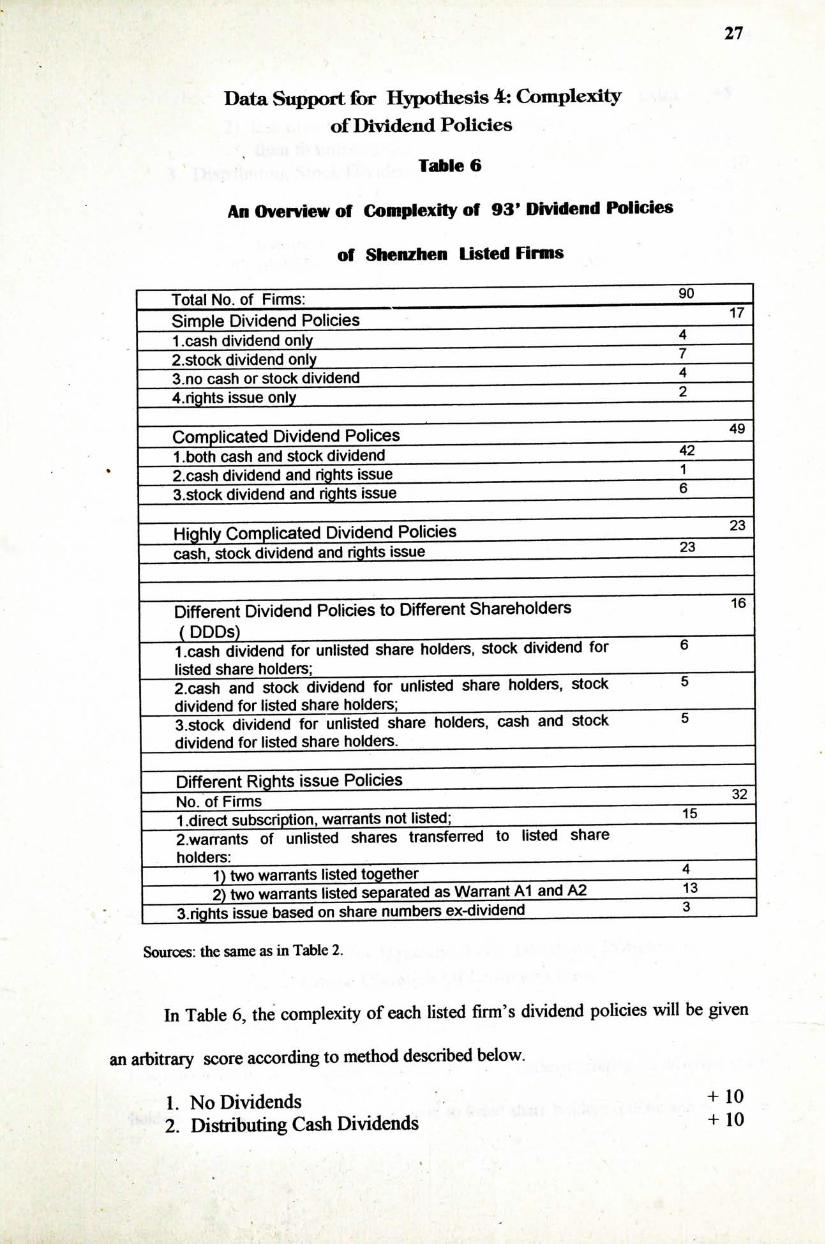
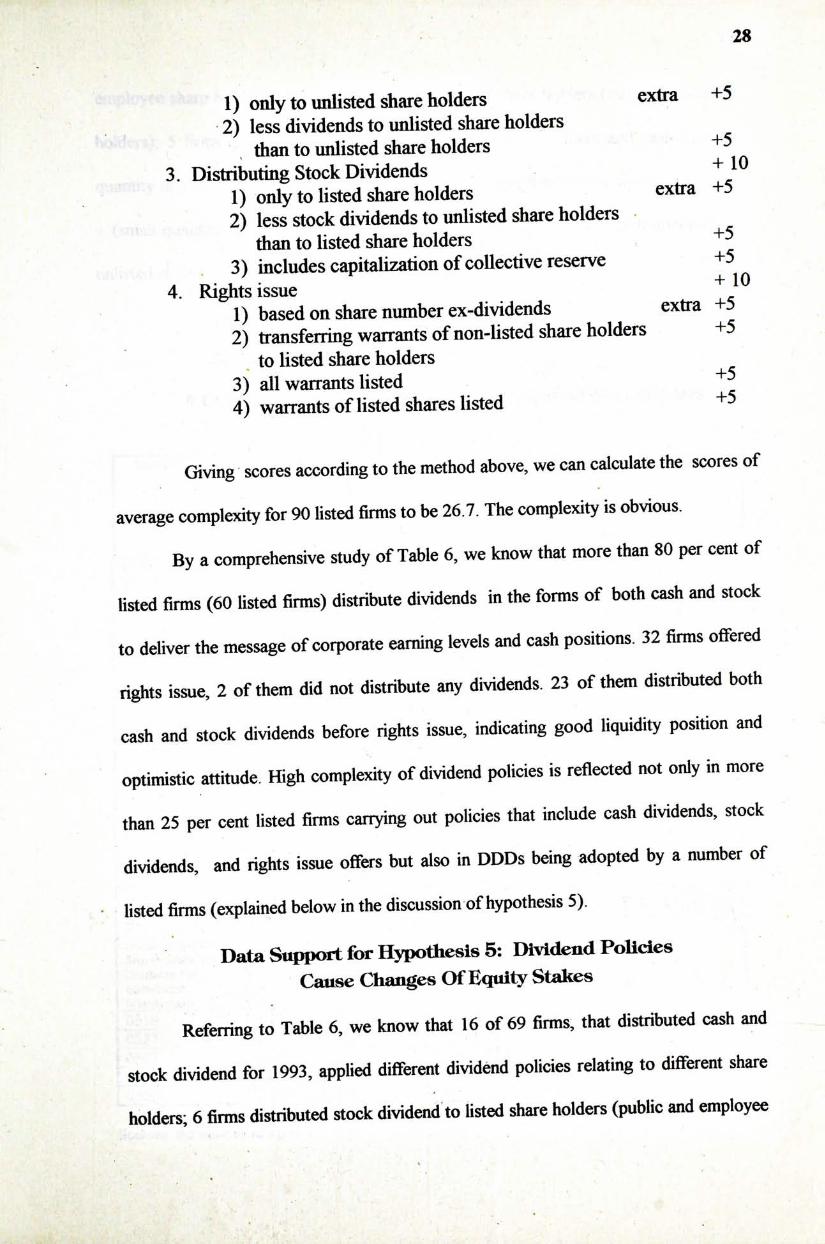
In Table 6, the complexity of each listed firm's dividend policies will be given an arbitrary score according to method described below.
1. No Dividends + 1 � 2. Distributing Cash Dividends + 10
\
28
1) only to unlisted share holders extra +5 2) less dividends to unlisted share holders
than to unlisted share holders +5 3. Distributing Stock Dividends + 1 �
1) only to listed share holders extra +5 2) less stock dividends to unlisted share holders
than to listed share holders 3) includes capitalization of collective reserve +5 4. Rights issue
1) based on share number ex-dividends extra +’ 2) transferring warrants of non-listed share holders +5
to listed share holders 3) all warrants listed 4) warrants of listed shares listed +5
Giving scores according to the method above, we can calculate the scores of average complexity for 90 listed firms to be 26.7. The complexity is obvious.
By a comprehensive study of Table 6,we know that more than 80 per cent of listed firms (60 listed firms) distribute dividends in the forms of both cash and stock to deliver the message of corporate earning levels and cash positions. 32 firms offered rights issue, 2 of them did not distribute any dividends. 23 of them distributed both cash and stock dividends before rights issue, indicating good liquidity position and optimistic attitude. High complexity of dividend policies is reflected not only in more than 25 per cent listed firms carrying out policies that include cash dividends,stock dividends, and rights issue offers but also in DDDs being adopted by a number of
. l i s t e d firms (explained below in the discussion of hypothesis 5).
Data Support for Hypothesis 5: Dividend Policies Cause Changes Of Equity Stakes
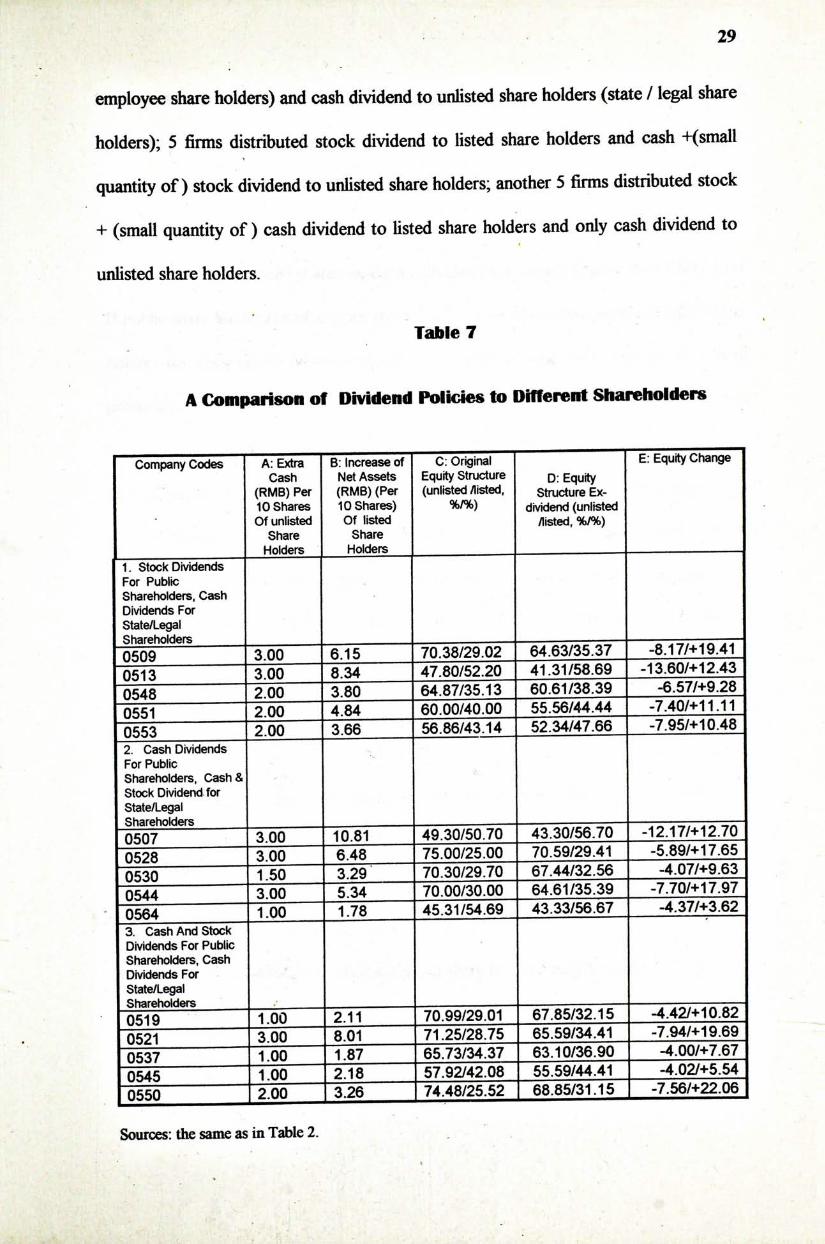
Referring to Table 6, we know that 16 of 69 firms, that distributed cash and stock dividend for 1993,applied different dividend policies relating to different share holders; 6 firms distributed stock dividend to listed share holders (public and employee
29 - .
employee share holders) and cash dividend to unlisted share holders (state / legal share holders); 5 firms distributed stock dividend to listed share holders and cash +(small quantity o f ) stock dividend to unlisted share holders; another 5 firms distributed stock + (small quantity o f ) cash dividend to listed share holders and only cash dividend to unlisted share holders.
Table 7
A Comparison off Dividend Policies to Different Shareholders
Company Codes“""“ A: Extra B: Increase of ~ C : O r i g i n a l [ E: Equity Change Cash Net Assets Equity Structure D: Equity
(RMB) Per (RMB) (Per (unlisted /listed, structure Ex-10 Shares 10 Shares) %/%) dividend (unlisted Of unlisted Of listed /listed, %/%)
Share Share Holders Holders
1. Stock Dividends For Public Shareholders, Cash Dividends For State/Legal Shareholders ^ ^ , . .
-0509 3 00 6.15 70.38/29.02 64.63/35.37 -8.17/+19.41 -0513 1T80/52.20 41.31/58.69 -13.60/+12.43 -0548 2 " 0 0 ~ 3.80 64.87/35.13 60.61/38.39 -6.57/+9.28 "0551 " Z j j L — jgM^Q-QQ 55.56/44.44 -7.40/+11.11 0553 ^ 3.66 56.86/43.14 52.34/47.66 -7.95/+10.48 2. Cash Dividends For Public Shareholders, Cash& Stock Dividend for State/Legal Shareholders — � 八 一 , ^ ^ __
" O ^ 3 00 10.81 49.30/50.70 43.30/56.70 -12.17/+12.70 " O ^ " 7 ^ / 2 5 . 0 0 70.59/29.41 -5.89/+17.65 "OsSo 3.29 70.30/29.70 67.44/32.56 -4.07/+9.63 "0544 3 00 "5.34 "70^.00/30.00 64.61/35.39 -7.70/+17.97 0564 1^00 1-78 45.31/54.69 43.33/56.67 -4.37/-t-3.62 3. Cash And Stock~ Dividends For Public Shareholders, Cash Dividends For State/Legal Shareholders , —
"0519 1 00 2 11 70.99/29.01 67.85/32.15 -4.42/+10.82 " O ^ 3 00 8.01 Tr25/28.75 65.59/34.41 -7.94/+19.69 "0537 " ^ 3 / 3 4 . 3 7 63.10/36.90 -4.00/+7.67 - 0 ^ 5 " ^ 2 / 4 2 . 0 8 " 55.59/44.41 -4.02/+5.54 0550 I 2.00 I 3.26 174.48/25.52 68.85/31.15 -7.56/+22.06
Sources: the same as in Table 2. �
30
It's worth to note that, if we equate each stock dividend to RMB 1.00 in cash according to its par value, public share holders and state / legal share holders both receive equal value of dividends even with different distribution methods.
We know that par value does not reflect real value. The market price and net assets per share of public shares ex-right / dividend are usually higher than RMB 1.00. If public share holders receive more stock dividend per share than state and legal share holders do, their equity proportion will correspondingly increase. The actual gain of public share holders is more than their opportunity loss (costs) in cash. Table 7 shows that since the net asset value per share ex right / dividend is more than RMB 1.00,the gain of public share holders in asset value due to extra stock dividends is larger than the cash loss due to lower cash dividends. If RMB 1.00 net asset value is equivalent to RMB 1.00 cash, 1/2 of the difference between column a and b would be the extra gain of public share holders in dividend distribution, and 1/2 of the difference would be the extra loss of unlisted share holders. Not considering cash dividends, public share holders gain more stock dividend causing their equity stake percentages to improve: public share percentages of 11 firms are improved by 10 per cent. Even so, public shares of most firms have not changed from minority position (<50 per cent) to a controlling position.
At the same time warrants of 5 listed firms' state and legal share holders are transferred to public share holders at the consideration of RMB 0.05-0.10. This causes further dilution of state and legal share holders' equity stake.
31
5.3 Further Explanatioas
Hypotheses posed in Section 5.1 are tested by data of Section 5.2. In other words,the features of dividend policies of Shenzhen listed firms are: 1) low cash dividend payout ratio; 2) high stock dividend payout ratio; 3) constant practice of rights issues; 4) insisting dividend distribution even when there exists strong demand for new fiinds; 5) different distribution and rights issue policies to shareholders of different natures.
Further explanations are given here: (A) Low cash dividend payout ratio is understandable. Retained earnings is
usually the cheapest money source for most firms planning to expand production. It is also reasonable to suspect that many listed firms, when reporting
satisfactory earnings, put in some long term investment projects such as property investment and demand for higher working capital, so that it subsequently results in cash illiquidity. On the contrary, many newly-listed firms have strong cash inflow from the initial public offering, but do not think it acceptable to return part of this money to investors. The low cash dividend payout ratio is almost necessary because of financing rigidity.
1 ... - -.
Besides, customarily, in the calculation of dividend payout ratio, stock dividend is included (by its par value) as is cash. It not only weakens the "signaling effect" of cash, but also provides the possibility and a channel to avoid cash outflow.
From the viewpoint of investors, the high volatility of stock market causes investment returns to largely depend on stock price changes (capital appreciation). No matter how much dividend there is, it only occupies a negligible position in the total
\
32
return to investors. Investors attempt to make profits from "buy low, sell high" instead of obtaining regular, stable dividends. This phenomenon is perhaps due to the lack of participation of institutional investors such as trust fiinds and pension fiinds, etc., who rely on dividend revenue as consumption source. And it is also noticed that the average age of investors is lower than their western counterparts (see Shefiin and Statman [1984]). In addition, there is short term speculation: the average turnover rate in 1994 is above five hundred per cent. It makes cash dividend less important, or even unnecessary.
(B) Stock dividend policies are essentially a "mathematics game," same as stock splits. Stock splits can reduce the minimum tradable quantity. The minimum trade quantity is one lot. The lower the price, the less money one trade lot needs. It helps to enhance investing ability of small investors. Secondly, psychologists believe that low price has more flexibility. Shares with appreciation potential would more easily appreciate after stock splits.
Besides, in the customary practices in China stock market, stock dividends reflect earnings levels. It's a good substitute for cash dividend as a "signal".
In addition, collective reserves can be capitalized through stock dividend distribution, showing: 1) good previous earnings; 2) confidence in future achievements; 3) arousing attention of investors (Doran, 1994 ).
(C) Many listed firms apply rights issue policies as complementary parts of dividend policies, causing actual negative dividends for the same reasons as of low cash dividends. Quota restrictions of new issue, divergence of planned capital inflow and actual demand caused by unstable economic climate, etc., will also be the reasons.
\
33
It should be noted that rights issue is of mandatory nature to some extent: if there is a big discount between market price and rights issue price, investors who give up rights have to assume some loss.
(D) Many listed firms apply consciously and unconsciously complicated and integrated policies of distributing both cash and stock dividend together with rights issue at the same time. It may be connected with saving agency costs (Easterbrook [1984]). Therefore, to insist on a little cash dividend while there is strong demand for the rights issue,is to use the "signal effect" fiinction to show healthy financial position. The rights issue here is not problem oriented but prospect oriented.
These practices emerge at the very beginning and become the pattern for dividend policies of listed firms right from the beginning.
Usually, there is a set minimum dividend payout ratio in company articles. Thus firms have to distribute both cash and stocks to meet these ratios, or, to meet the double psychological demand of investors: to have both more cash and more stocks.
(E) It is found that the so called "same share, same right" is not reflected correctly in dividend policies. Else how can one explain state / legal shareholders, as controlling shareholders, apparently formulating policies unfavorable for themselves?
Actually, state / legal shareholders have a significant cash preference. Since their shares can not be listed, and thus very illiquid, the annual cash dividend is the main return of their investment. To them, dividend policies are not irrelevant but extremely relevant.
The demand for cash realization of main shareholders, especially those state shareholders goes against the listed firms' will of expansion. Firms have limited abilities to pay cash dividend. Therefore, the main shareholders have to pay the consideration
\
34
of equity dilution to obtain more cash dividend. As the controlling positions would not be fundamentally changed after dilution and individual representatives of state / legal shares usually do not have the will to maximize the shareholders' earnings, the outcomes reflected by data of last section should not be astonishing.
Because of differences on liquidity nature of different shares, the author believes such dividend policies will result in a win-win situation instead of a "zero-sum" effect. Although such policies violate the principle of "same share, same right",
they indeed meet the requirements of both sides. Gradually losing controlling right arouses attention of government, but this situation in the author's opinion will not change fundamentally until state / legal shares have been listed.
It is worth mentioning that money in the hands of state/legal share holders is scarce to meet rights issue because their portfolios can not be adjusted. Dilution of equity seems to accord with the demands for company development.
In the end, it should be mentioned that, in the past,main shareholders of listed firms in Shanghai and Shenzhen often gave up rights because of shortage of cash. This behavior was favorable neither to firms nor to major shareholders themselves. Till last year, state / legal shareholders of some firms in Shanghai transferred their rights to public shareholders for the consideration of transfer fee. The cheap transfer fee didn't retrieve much loss of these shareholders. Since last September, a number of Shenzhen listed firms invented a smarter way by which they listed rights warrants of state / legal shares (warrant A2) together with those of public shares (warrant Al) Before any specific policies are promulgated, shares bought by exercising warrant A2 will not be listed. Thus, the market may give fair prices to such rights and transfer such rights to investors who can afford them. It is interesting that warrant A2 usually becomes
35
worthless right before delisting. It shows great discount between non-listed and listed stocks. It also supports the cash preference of state/legal shareholders.
5.4 Preliminary Kvidence for M&^^t Response of
Dividend Policies o f Sh應hen Listed Firms Tables
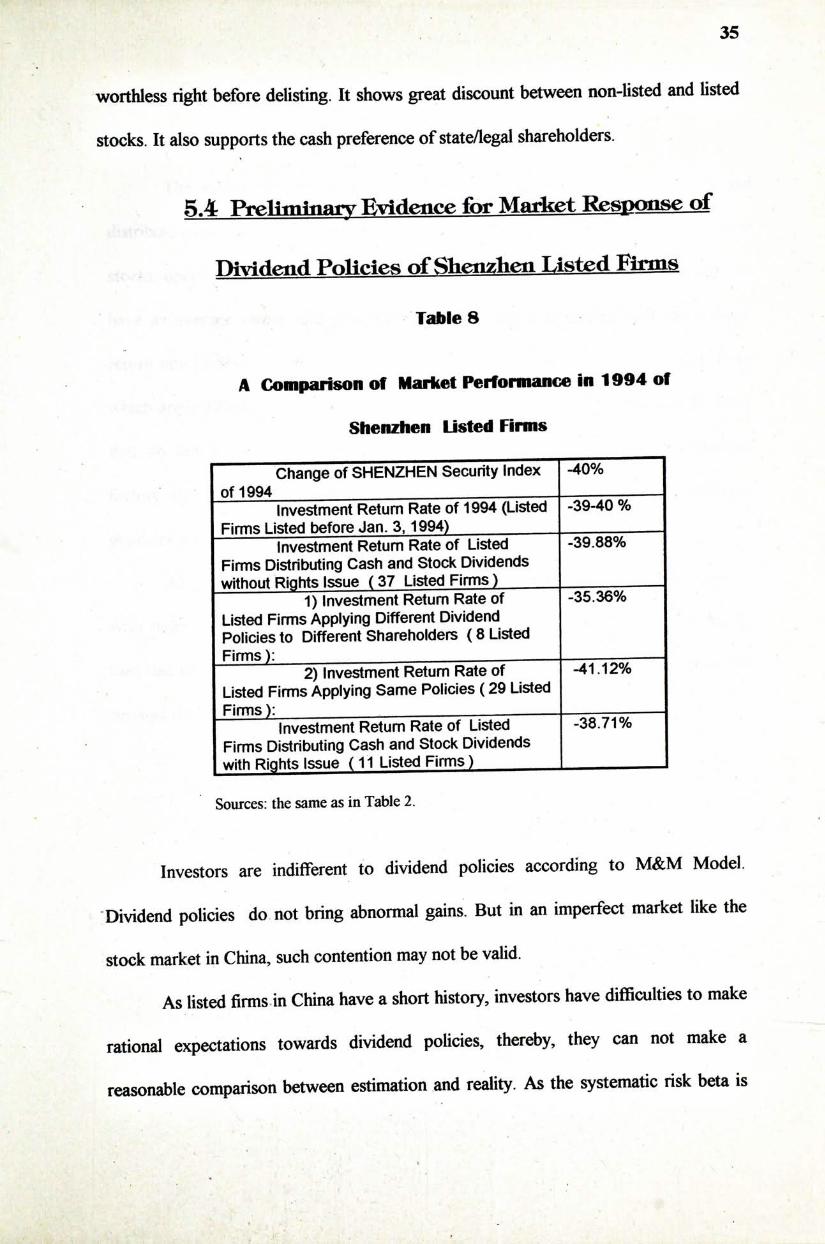
A Comparison of Market Performance in 1994 of
Shenzhen Listed Firms
Change of SHENZHEN Security Index -40% of 1994
Investment Return Rate of 1994 (Listed -39-40 % Firms Listed before Jan 3,1994)
Investment Return Rate of Listed -39.88% Firms Distributing Cash and Stock Dividends without Rights Issue (37 Listed Firms)
1) Investment Return Rate of -35.36% Listed Firms Applying Different Dividend Policies to Different Shareholders ( 8 Listed Firms):
2) Investment Return Rate of -41.12% Listed Firms Applying Same Policies (29 Listed Firms):
Investment Return Rate of Listed -38.71% Firms Distributing Cash and Stock Dividends with Rights Issue (11 Listed Firms)
Sources: the same as in Table 2.
Investors are indifferent to dividend policies according to M&M Model. Dividend policies do not bring abnormal gains But in an imperfect market like the stock market in China, such contention may not be valid.
As listed firms in China have a short history, investors have difficulties to make rational expectations towards dividend policies, thereby, they can not make a reasonable comparison between estimation and reality. As the systematic risk beta is
36
whether dividend policies bring investors risk-adjusted abnormal gains. Due to the above difficulties, the author cannot provide a discussion in depth.
The author has chosen 37 firms that were listed before Jan. 3rd, 1994 and distribute cash and stock dividend without rights issue. Making an adjustment to their stocks, opening and closing prices of year 94 (reverse calculation of ex-dividend), we have an average return rate of -39.88% in 1994 which is similar with the average return rate of Shenzhen Securities Composite Index in 1994. As to the 8 listed firms which apply DDDs,the average return rate is -35.36%,higher than that of 29 firms that do not apply different policies. Because it's hard to isolate other influential factors, the data may only be a coincidence. Yet it can not be denied that different dividend policies to different shareholders might be more popular.
As to the 11 listed firms which distribute cash and stock dividends together with rights issue, the average return rate of their stocks is -38.71% , slightly higher than that of firms without rights issue -39.88%. It shows that so far, investors have not resisted the actual negative dividend policies.
37
. \
CHAPTER 6
A TIME SERIES AND CROSS-SECTIONAL COMPARISON AMONG DIVIDEND
POLICIES
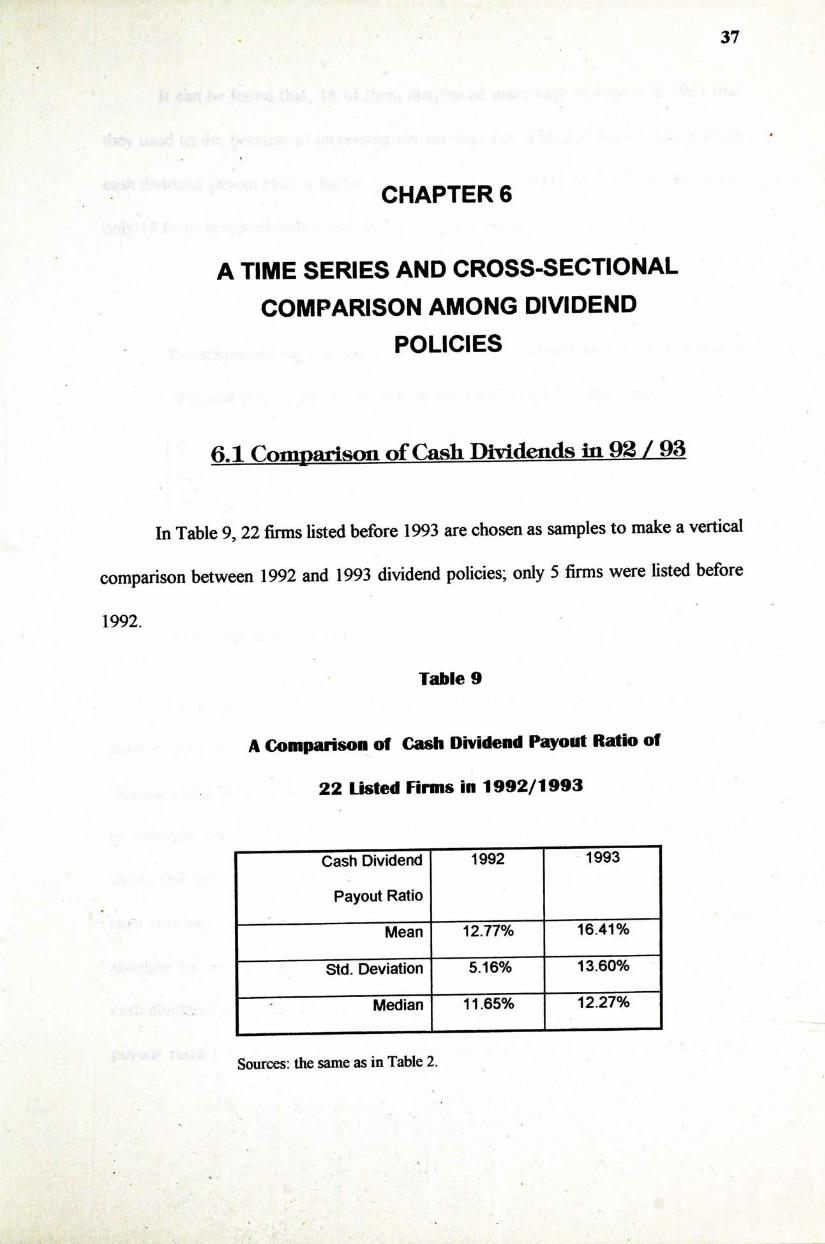
6,1 Comparison of Cash Dividends in 92 / 93
In Table 9,22 firms listed before 1993 are chosen as samples to make a vertical comparison between 1992 and 1993 dividend policies; only 5 firms were listed before 1992.
Table 9
A Comparison of Cash Dividend Payout Ratio of
22 Listed Firms in 1992/1993
Cash Dividend T o ^ 1993
Payout Ratio
12.77% 16.41%
Std. Deviation 5.16% 13.60%•"”一
~ Median 11.65% 12.27%
Sources: the same as in Table 2.
# . • 二
. . . • • J , " , .
38
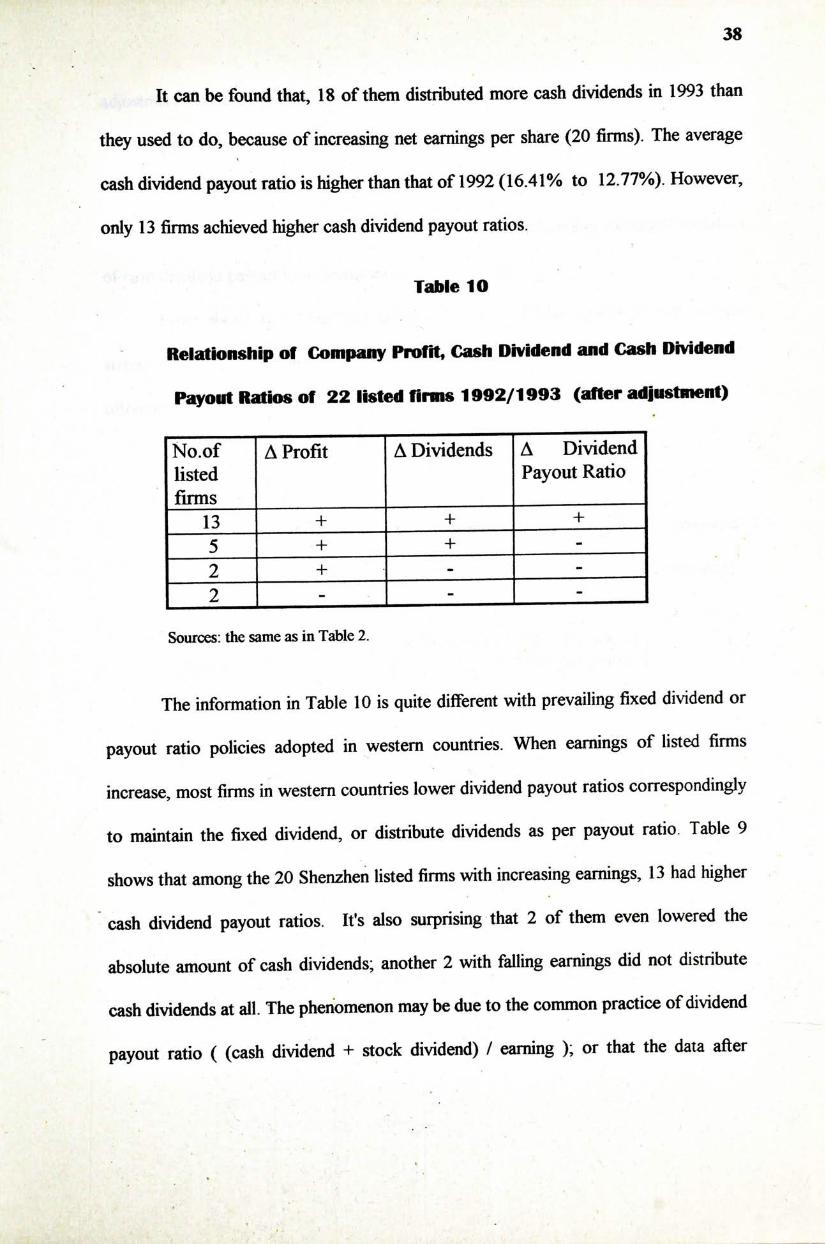
It can be found that, 18 of them distributed more cash dividends in 1993 than they used to do, because of increasing net earnings per share (20 firms). The average cash dividend payout ratio is higher than that of 1992 (16.41% to 12.77%). However,
only 13 firms achieved higher cash dividend payout ratios.
Table 10
Relationship of Company Profit, Cash Dividend and Cash Dividenfl
Payout Ratios of 22 listed firms 1992/1993 (after adjustment)
No.of A Profit A Dividends A Dividend listed Payout Ratio firms — 1 3 + + — +
5 + + -2 + -2 - I - -
Sources: the same as in Table 2.
The information in Table 10 is quite different with prevailing fixed dividend or payout ratio policies adopted in western countries. When earnings of listed firms increase, most firms in western countries lower dividend payout ratios correspondingly to maintain the fixed dividend, or distribute dividends as per payout ratio. Table 9 shows that among the 20 Shenzhen listed firms with increasing earnings, 13 had higher
‘cash dividend payout ratios. It's also surprising that 2 of them even lowered the absolute amount of cash dividends; another 2 with falling earnings did not distribute cash dividends at all. The phenomenon may be due to the common practice of dividend payout ratio ( (cash dividend + stock dividend) / earning ); or that the data after
»
39
adjustment (to treat stock dividends as stock split ) fail to reflect the natures of dividend policies.
�
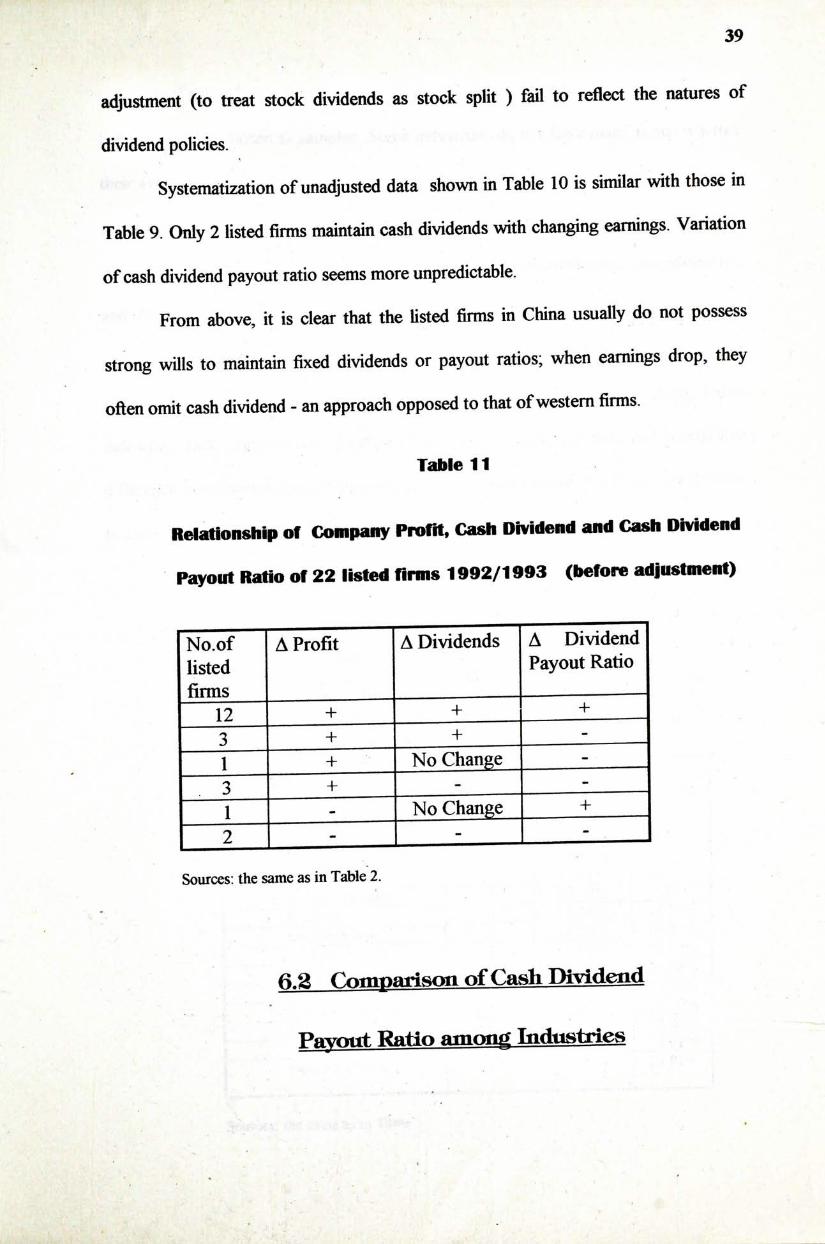
Systematization of unadjusted data shown in Table 10 is similar with those in Table 9. Only 2 listed firms maintain cash dividends with changing earnings. Variation of cash dividend payout ratio seems more unpredictable.
From above, it is clear that the listed firms in China usually do not possess strong wills to maintain fixed dividends or payout ratios; when earnings drop,they often omit cash dividend - an approach opposed to that of western firms.
Table 11
Relationship of Company Profit, Cash Dividend and Cash Dividend
Payout Ratio of 22 listed firms 1992/1993 (before adjustment)
N o . o f ~ A Profit A Dividends A Dividend listed Payout Ratio firms —
_ _ 1 2 + + I + 3 + 1 : 1 + No Change :
‘ 3 + - :
1 - No Change + 2 I - I • I
Sources: the same as in Table 2.
aa Conroarison of Canh Dj^ideiid
Payout Ratio amoti^ I n d t t s t r i e s
40
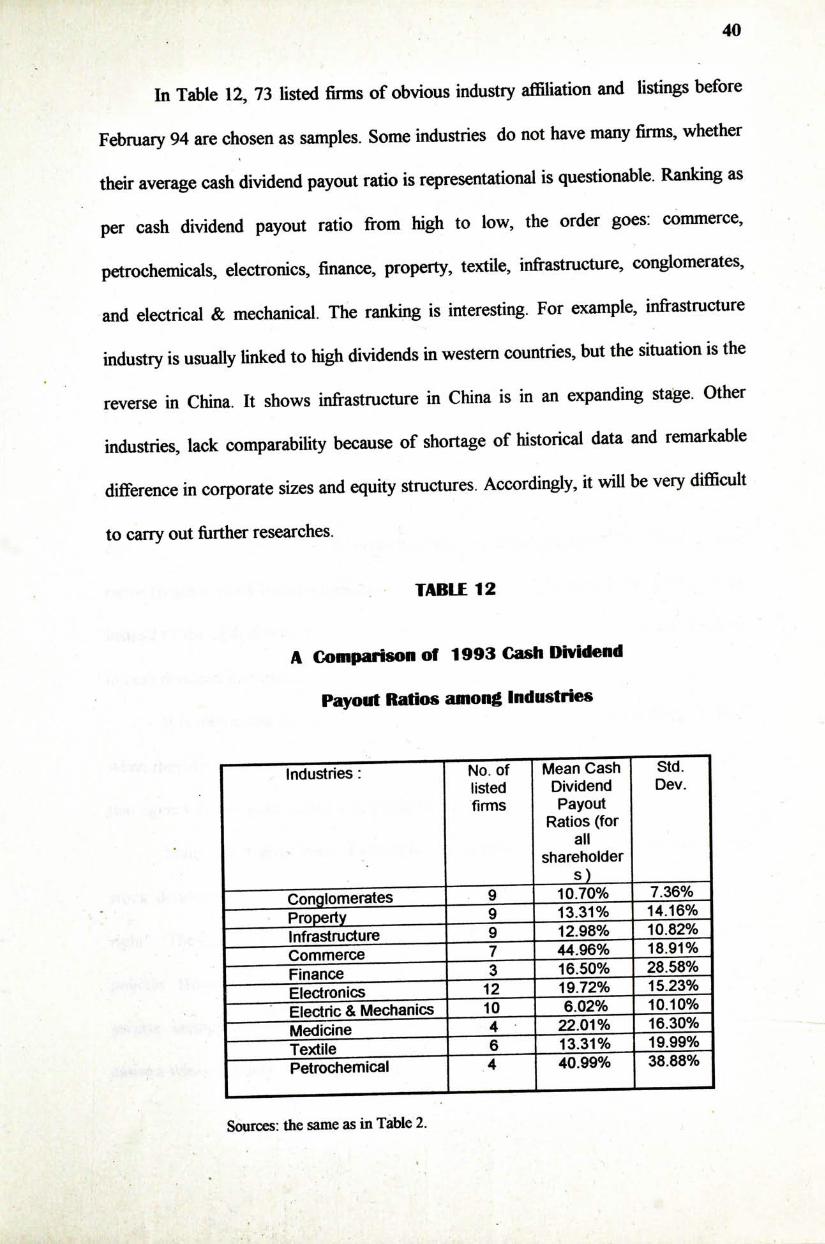
In Table 12, 73 listed firms of obvious industry affiliation and listings before February 94 are chosen as samples. Some industries do not have many firms, whether their average cash dividend payout ratio is representational is questionable. Ranking as per cash dividend payout ratio from high to low, the order goes: commerce, petrochemicals, electronics, finance, property, textile, infrastructure, conglomerates, and electrical & mechanical. The ranking is interesting. For example, infrastructure industry is usually Unked to high dividends in western countries, but the situation is the reverse in China. It shows infrastructure in China is in an expanding stage. Other industries, lack comparability because of shortage of historical data and remarkable difference in corporate sizes and equity structures. Accordingly, it will be very difficult to carry out fiirther researches.
TABLE 12
A Comparison of 1993 Cash Dividend
Payout Ratios among Industries
Industries • “ N o . o f M e a n Cash StST listed Dividend Dev. firms Payout
Ratios (for all
shareholder s j Conglomerates 9 10-70% 7.36%
• Proi^rtv 9 1 3 . 3 1 % _ _ _ 1 4 . 1 6 % Infr^ructure — 9 12 .98%__10.82% Commerce 7 44.96o/o__18.91% Finance 一 3 16.50% 28.58% Electronics 12 19 .72%__15.23%
po 咖v^jjyjgfjij^i^ 10 6.020/0 1010% Medicine 4 2 2 . 0 1 % 1 6 - 3 0 % Textile 6 13.31% 19.99% Petrochemical 4 40.99% 38.88%
Sources: the same as in Table 2. t
» - •
41
CHAPTER 7
CONCLUSIONS
The author finds that China Shenzhen publicly listed firms set low cash dividend policies because they are in an expanding stage, there is high friction in the Chinese capital markets, and there is no cash preference by the public share investors.
The author also finds that listed firms use stock dividend as a substitute for cash dividend to execute signal function. The idea that the value of stock dividend is equal to its par value, accepted through customary practices, makes dividend payout ratios ((cash + stock dividend)/eamings) the target ratios of company dividend policies instead of the cash dividend payout ratios. As a result, listed firms have much freedom in cash dividend distribution.
It is interesting that a number of listed firms insist on distributing dividend first when they desire new capital. The author does not believe it to be a mere coincidence that agency theory gains support in China stock market.
Many listed firms treat shareholders differently by mixing cash dividends and stock dividends in different weights and violate the principle of "same share, same right". The Government is worried about dilution of state equity due to such dividend policies. However, under the influence of differing liquidities,and rapidly increasing private savings as against tight government financial condition, such practice may cause a win-win effect.
42
From the comparison of different cash dividend policies in Chapter 6, we find not only that the general cash dividend payout ratios of China Shenzhen listed firms are relatively low but also that the cash dividend payout ratios have an unstable nature. Moreover, the pattern of industry difference is very dissimilar to its western counterpart.
It can not be judged if such dividend policies of Shenzhen listed firms are optimized. Yet it can be contended that dividend policies in China do affect corporate values, and such effects may be more in-depth than in their western counterparts.
This is only a preliminary study. Topics worthy of future studies definitely include how the market reacts to dividend announcement. Other topics of interest are the relationship between dividends and corporate size,leverage, and ownership diffiision.
. .. . • •.... . . . . . • : . ,、• . . . 、 . . . . . . , . . : . . . . . ..
,•, . . ‘ . , ‘ ‘ ..•广. , • - . . . ..、 ‘ ... . •••• . 、 , . . ‘ . •‘ 43
• . , . : .丨’ . . . . , .,
‘ . . , • : , • . • . . . 厂 . • ^ . 、, . . . , � .
. , . . . . . . : •:"’:.:』………—.,..•• • , • I 飞,. . • 』 、 . ‘
, - ;.. ••.. ‘-.. ... ‘ - • . . . :、. ‘ . . • . • ‘. .1 • - . . .
,• - . . . • - .
」 ,- . . ,
‘ .......又 V,.. . » •
BIBLIOGRAPHY ..1.-
- 、i.
Books
Ang, James S., Do Dividends Matter? A Review of Corporate Dividend Theories and Evidence (Monograph Series in Finance and Economics), New York: Solomon Brothers Center for the Study of Financial Institutions, 1987.
Brealey, Richard, and Stewart Myers, Principles of Corporate Finance, �
New York: McGraw Hill Inc., 1991. Nichols, William Donald, An Empirical Study of Stock Splits and Stock
Dividends. Their Accountog Treatments and the Market's Perception of Their Economic Value, London: University Microfilms International, 1980.
Periodicals
Bhattacharya, S., "Imperfect Information, Dividend Policy and the Bird in the Hand Fallacy," vol. 10, Bell Journal of Economics, Spring 1979.
Bom, Jeffery A., and James N. Rimbey, "A Test of the Easterbrook Hypothesis Regarding Dividend Payment and Agency Costs,” Journal of Financial Rescarclu vol. 16,no. 3, Fall 1993.
44
Christie, William G., “Are Dividend Omissions Truly the Crudest Cut of AU,”
ofFinance and Q i ^ j p ^ a ^ Y ^ ^ n^, v o l . 29,no. 3, September
1994. Doran, David T., "Stock Splits: Tests of the Earnings Signaling and Attention
Directing Hypothesis Using Analyst Forecasts and Provision;, J m ^
ArPniintiTig. A u…柳 & Finance, 1994. Kao Chihwa and Chunchi Wu, “Tests of Dividend Signaling Using the Marsh-
Merton Model,” T � ,議 1 of Business, vol 67, no. 1,1994.
Miller, Merton H.,"Behavioral Rationality in Finance; The Case of
Dividends’” JmfflmLotBM^to vol. 59, October 1986. Miller, Merton H. and Franco Modigliani, "Dividend Policy, Growth and the
Valuation e m a r e s , ” _ M l ^ £ B M t o , ‘ 34, October 1961. Woolridge, J. Randall, “Dividend Changes and Security P r i c e s ^ ' J o u n ^
Finance, vol. 38, no. 5, December 1983.
TW lo In Ch似嫩 Versi迪
ShenzhenNewlands Co., AoOMlS^E^I tm^ i^^^^ to^^^^^^^^^^^^^^^^^^^,
Shenzhen: China Economics Press, 1994.
Shenzhen Newlands Co” Shenzhen: Haitian Press, 1992.
ShenzhenNewlands Co” M ^ ^ ^ J M t e k M S l ^ I ^ ^ m S i ^ ^ l ^ ^ l M k ^ Shenzhen: China Economics Press, 1993.
%
45
Hu, Y. B.,The Latest Directory of Investment on China Stock Market, Hong
Kong: Tiandi Press, 1993. Wang, X. Y., Z.W. Lei, and S. Y. Xia- ^ ^ Fmprppnre of Shenzhen Stock
Market Beijing: China Financial Press, 1992.
Periodicals in Chinese Version
Shenzhen Newlands Co.: Dynamic A n a l — of Stock Market vol. 4-5-6,1995.

sfisly‘、?,:. .
: .
•
.
.
「
蕃
: 、..
.:
:...:...
、:“式醉彦^
•藝溝着V、
5:::::
」、:.:;..
....:.:
? 、
、:1赛震
〜:
、
.
.
-
.
..
:
-、.’
:..
•
;
\ -
/
“
,
.
.
::、
.
•
-
讓…、;.. ...、..;......
.
:
”
•
- -
•
..
- 署就
.^ V
Hr
u,
,.,
•
.
—
f
-
L
Fv
J
.
‘
—-
,
-
nv.'-
v,^
f
、 >^
‘
., -
\
•
‘
、
\
.
.
\
V'
:
,
“
•
•
,
A.
.
:
: ,
.
J
>
:
•
V I
rr \ '
• ,
•
.
•
,
,
^
5
-
,
-
.
:「...
.:,_
\
- , . 、. 4
— 々.’
/ •
-
•
.
:
:
/
.
..
:
- c
.
『
.
慮
- /
: .
.
.
.
.
」
,
,
,
、
.
•
....
.
、 .,
,
,
i
L
.、?
:
、.
.
-—
•
:、< 'f
.
.
、‘、:
,
「1
‘
.
)
《
/
. .
^ ,
. ,
. .
.
.
’.
...
. ..
,
,
:
、
,
:‘
Jj
‘ .
,
^
•
,„
’
•
I :
/N
,
M !
;
-.
.
.
...
••
r
r
.
.
.
. 购
L
ilt/了
< .
厂 —•
: ,1
.
: .
.1
..
.)
/
i
^ • V
\ 广
— n N ..
..
.
.
-
-
.
.
.
”
. . ..
- ,,
; .
、-
“ : ;
...
-
,
•
-
•
..
/
:
.
、
^
卞
.
.
-
..
.1
/
.
. -
>
‘4
T
•
•
•
-
•
‘、-
•-,
•‘
”
.
-.
•
•
賣
.
•
认
,
,
/
4
^ I r
f-.fr-^ --J
••
.
.
: -
-
.
.
.
.
.
.
rib
11
•
•
/
I
: ,)
•
,
.
.
.
•
/
\
,
:『
.
,
,
<
? •
-
•
.
.
,
二 、
:
.
.
.
•
-
•:,
. 乂
,
,
-J! .
.
.
.
•
I
.
.
-
,..
f
‘
,
•
•
•
...
• r.
~
.
.
,
•
•
.
•
‘
“
f
〜
_
: •
.
.
^
。
.
. -
“
. •
-
.
揪
赞
..
.
-
•
•
??M;
、 .
. .
..
•
•
...
-
.1
•
繁?〉Z ? : .
: :
...
...
-
: .
,
、..
.、
,‘
~
--.....现二
\ J ,
•
.
.
.
.
.
,
•
.
.
.
.
‘! -
;.
•
•
-
-
,
.
‘
-
.
:
:
/
.
-
——.,::.
,
/ <
/
-
.
——
.
,
:.:、•
: -
:
-
• ~
•
,
.
-
• •
.
.
.
,
S.V
f^'M,
?
卞
、 .4
J.
r.
, . .
...
/ .
:
:
.
、
•
:
•
.
-
二..
i
,
- -,-:/?•:、:?,:」.A.—:二.“
,
J-
‘
〜〜,5;

‘.. ... • y • .
, • • ‘�- . . ‘ •
“ ‘ / .
• . • ^
/丄 ‘
iSbEbEDDD
UmMMi ssLJBJqn >lHnD
I
• ‘ !- • i