Embed Size (px)
Citation preview

15th Needham
Growth
Conference
New York
15th January, 2013
© Copyright Datalogic 2007-2013
2 2
GROUP OVERVIEW
STRATEGY AND OUTLOOK
APPENDIX
© Copyright Datalogic 2007-2013
© Copyright Datalogic 2007-2013 3
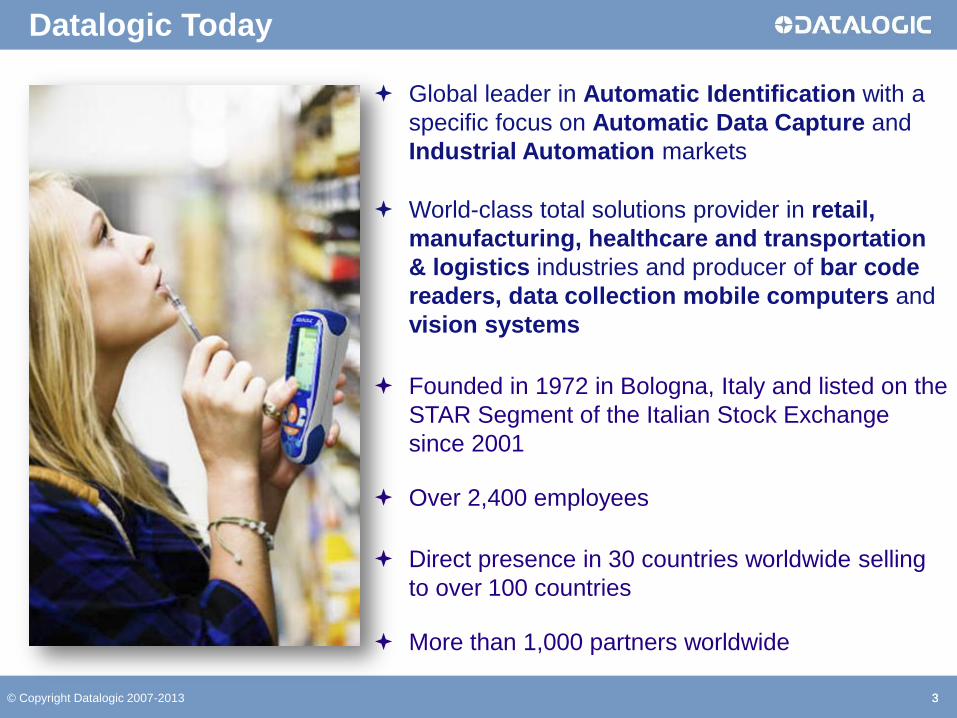
Global leader in Automatic Identification with a
specific focus on Automatic Data Capture and
Industrial Automation markets
World-class total solutions provider in retail,
manufacturing, healthcare and transportation
& logistics industries and producer of bar code
readers, data collection mobile computers and
vision systems
Founded in 1972 in Bologna, Italy and listed on the
STAR Segment of the Italian Stock Exchange
since 2001 Over 2,400 employees
Direct presence in 30 countries worldwide selling
to over 100 countries
More than 1,000 partners worldwide
Datalogic Today
3
© Copyright Datalogic 2007-2013 4
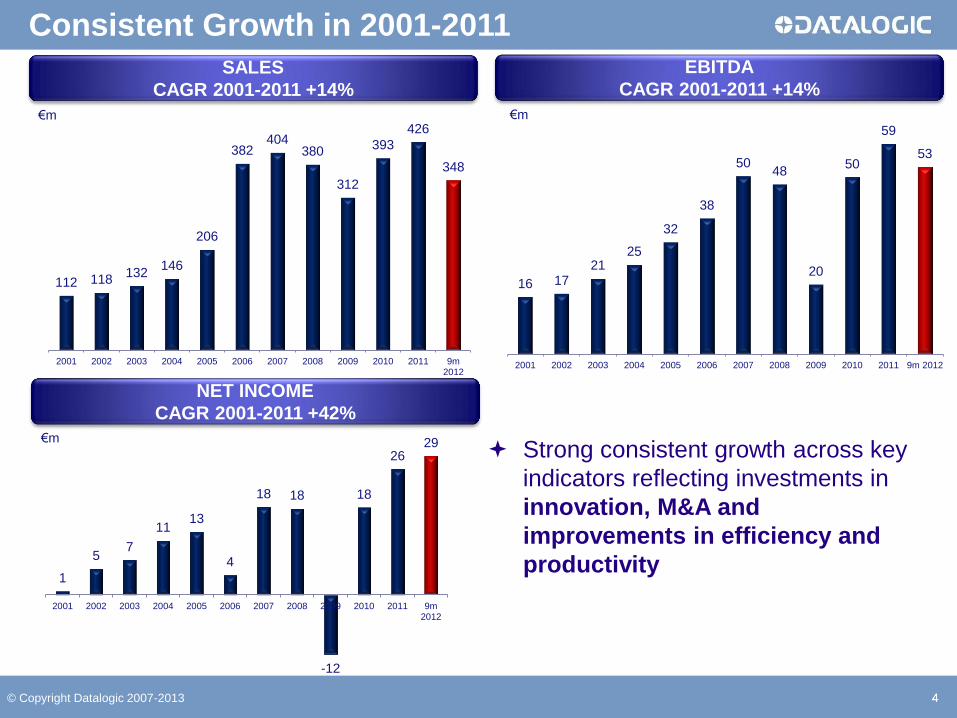
Consistent Growth in 2001-2011
4
112 118 132
146
206
382 404
380
312
393
426
348
2001 2002 2003 2004 2005 2006 2007 2008 2009 2010 2011 9m2012
SALES
CAGR 2001-2011 +14%
EBITDA
CAGR 2001-2011 +14%
16 17 21
25
32
38
50 48
20
50
59
53
2001 2002 2003 2004 2005 2006 2007 2008 2009 2010 2011 9m 2012
1
5 7
11 13
4
18 18
-12
18
26 29
2001 2002 2003 2004 2005 2006 2007 2008 2009 2010 2011 9m2012
NET INCOME
CAGR 2001-2011 +42%
Strong consistent growth across key
indicators reflecting investments in
innovation, M&A and
improvements in efficiency and
productivity
€m €m
€m
5 © Copyright Datalogic 2007-2013
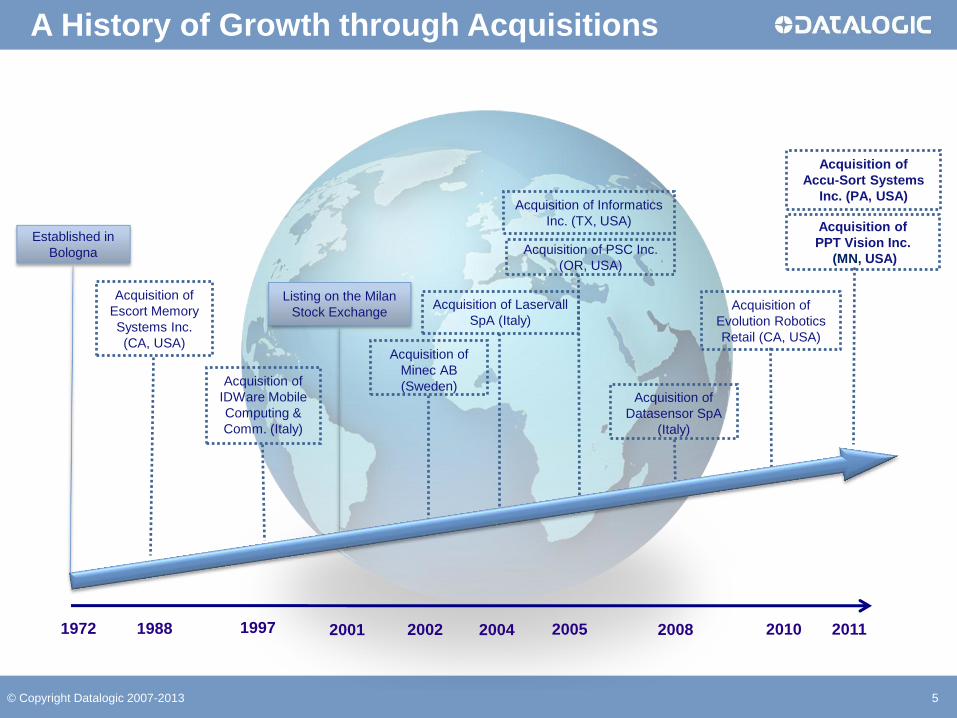
Acquisition of
Datasensor SpA
(Italy)
Listing on the Milan
Stock Exchange
Acquisition of
Minec AB
(Sweden)
Acquisition of Laservall
SpA (Italy)
Acquisition of Informatics
Inc. (TX, USA)
Acquisition of PSC Inc.
(OR, USA)
2001 2002 2005 2004 2008 2010
Acquisition of
Evolution Robotics
Retail (CA, USA)
2011
Acquisition of
Accu-Sort Systems
Inc. (PA, USA)
Acquisition of
PPT Vision Inc.
(MN, USA)
A History of Growth through Acquisitions
Established in
Bologna
1972 1988
Acquisition of
Escort Memory
Systems Inc.
(CA, USA)
Acquisition of
IDWare Mobile
Computing &
Comm. (Italy)
1997
6 © Copyright Datalogic 2007-2013
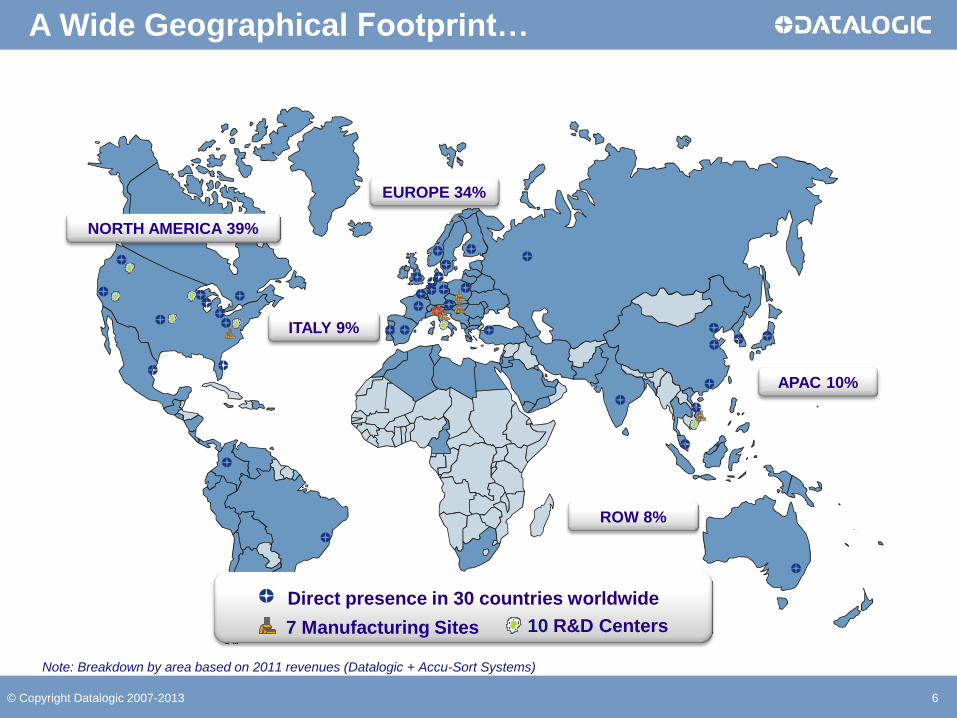
Direct presence in 30 countries worldwide
7 Manufacturing Sites 10 R&D Centers
EUROPE 34%
ITALY 9%
NORTH AMERICA 39%
ROW 8%
APAC 10%
Note: Breakdown by area based on 2011 revenues (Datalogic + Accu-Sort Systems)
A Wide Geographical Footprint…
7 © Copyright Datalogic 2007-2013
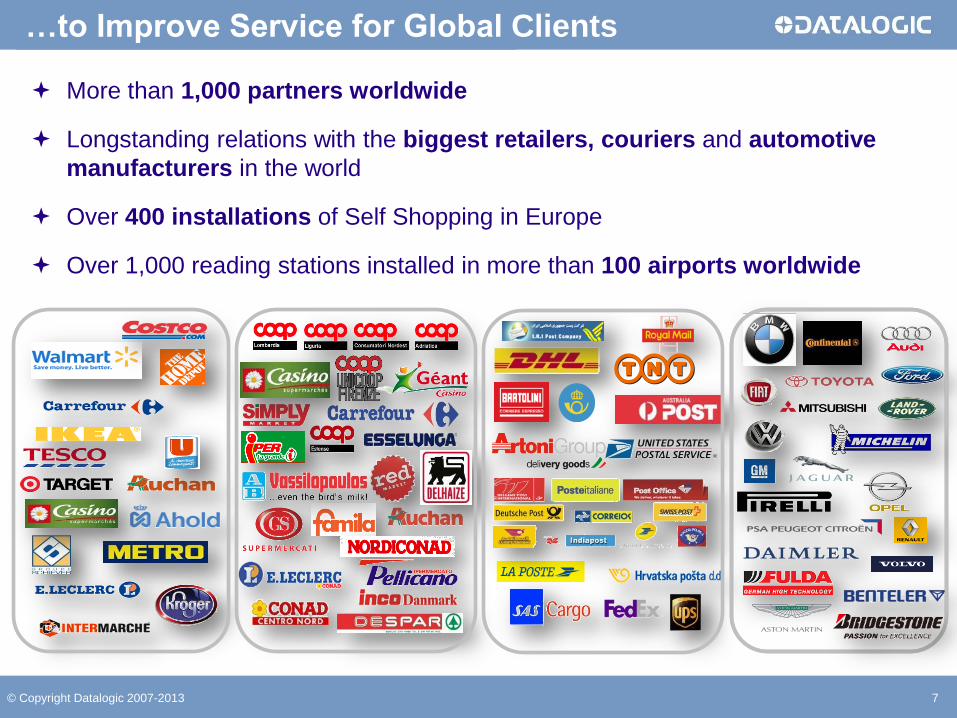
More than 1,000 partners worldwide
Longstanding relations with the biggest retailers, couriers and automotive
manufacturers in the world
Over 400 installations of Self Shopping in Europe
Over 1,000 reading stations installed in more than 100 airports worldwide
…to Improve Service for Global Clients
8 8
GROUP OVERVIEW
STRATEGY AND OUTLOOK
APPENDIX
© Copyright Datalogic 2007-2013
9 © Copyright Datalogic 2007-2013
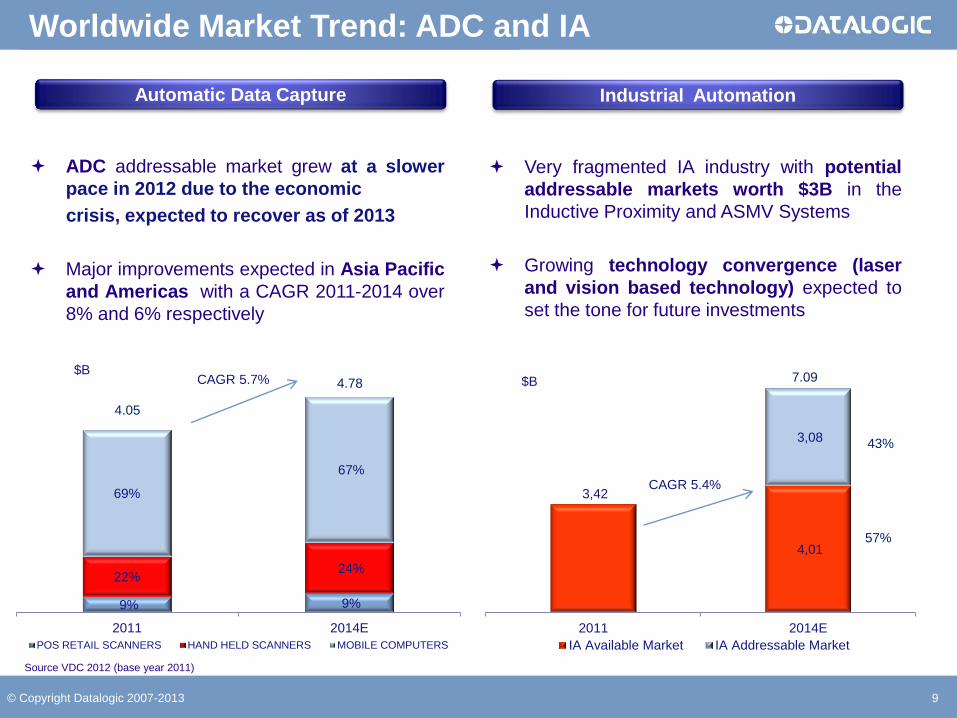
9% 9%
22% 24%
69%
67%
2011 2014E
POS RETAIL SCANNERS HAND HELD SCANNERS MOBILE COMPUTERS
4.05
4.78 $B
CAGR 5.7%
Automatic Data Capture
ADC addressable market grew at a slower
pace in 2012 due to the economic
crisis, expected to recover as of 2013
Major improvements expected in Asia Pacific
and Americas with a CAGR 2011-2014 over
8% and 6% respectively
Worldwide Market Trend: ADC and IA
Source VDC 2012 (base year 2011)
3,42
4,01
3,08
2011 2014E
IA Available Market IA Addressable Market
7.09
57%
43%
$B
CAGR 5.4%
Industrial Automation
Very fragmented IA industry with potential
addressable markets worth $3B in the
Inductive Proximity and ASMV Systems
Growing technology convergence (laser
and vision based technology) expected to
set the tone for future investments
10 © Copyright Datalogic 2007-2013
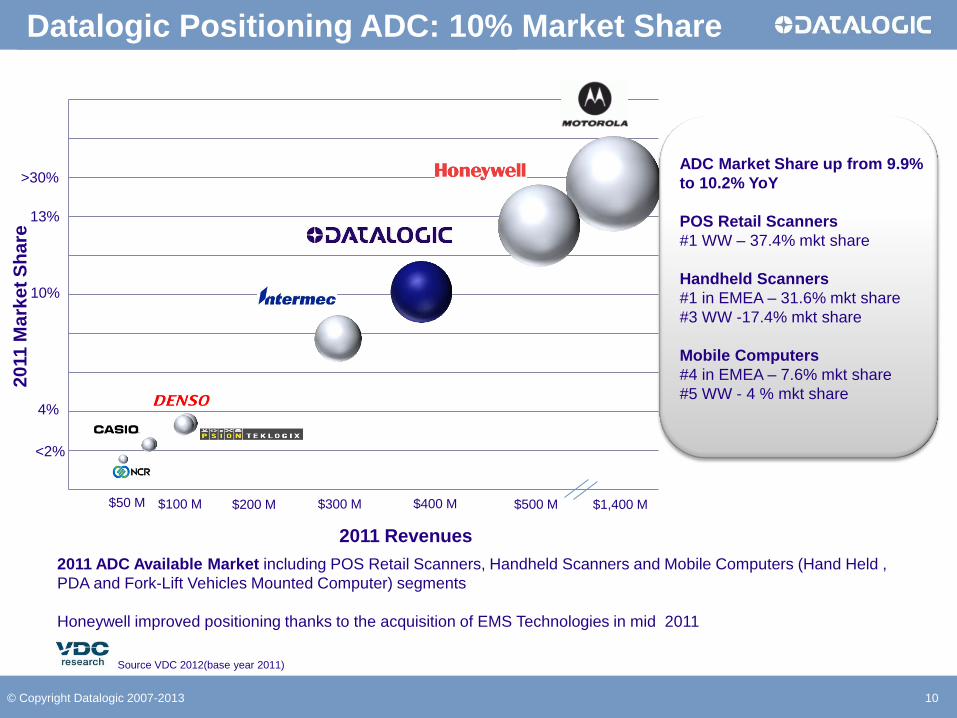
Datalogic Positioning ADC: 10% Market Share
$300 M $500 M $1,400 M $400 M
2011 Revenues
$50 M $200 M $100 M
>30%
10%
<2%
4%
13%
20
11
Ma
rke
t S
ha
re
2011 ADC Available Market including POS Retail Scanners, Handheld Scanners and Mobile Computers (Hand Held ,
PDA and Fork-Lift Vehicles Mounted Computer) segments
Honeywell improved positioning thanks to the acquisition of EMS Technologies in mid 2011
Source VDC 2012(base year 2011)
ADC Market Share up from 9.9%
to 10.2% YoY
POS Retail Scanners
#1 WW – 37.4% mkt share
Handheld Scanners
#1 in EMEA – 31.6% mkt share
#3 WW -17.4% mkt share
Mobile Computers
#4 in EMEA – 7.6% mkt share
#5 WW - 4 % mkt share
11 © Copyright Datalogic 2007-2013
$50 M $100 M $200 M $300 M
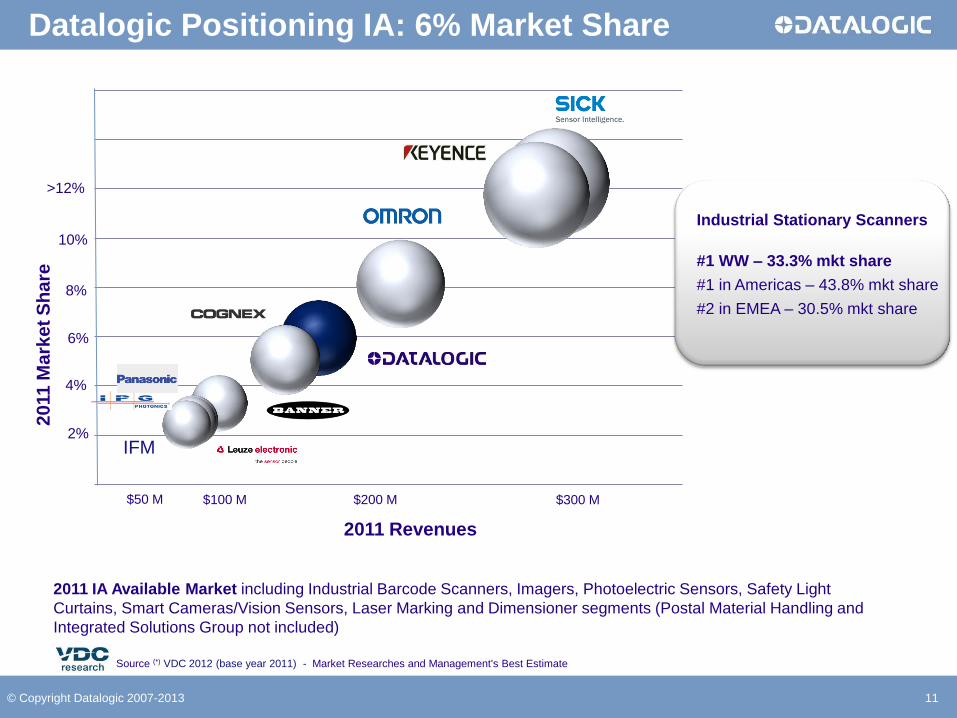
Datalogic Positioning IA: 6% Market Share
IFM
10%
>12%
6%
2%
4%
8%
2011 IA Available Market including Industrial Barcode Scanners, Imagers, Photoelectric Sensors, Safety Light
Curtains, Smart Cameras/Vision Sensors, Laser Marking and Dimensioner segments (Postal Material Handling and
Integrated Solutions Group not included)
Source (*) VDC 2012 (base year 2011) - Market Researches and Management's Best Estimate
2011 Revenues
20
11
Ma
rke
t S
ha
re
Industrial Stationary Scanners
#1 WW – 33.3% mkt share
#1 in Americas – 43.8% mkt share
#2 in EMEA – 30.5% mkt share
© Copyright Datalogic 2007-2013 12
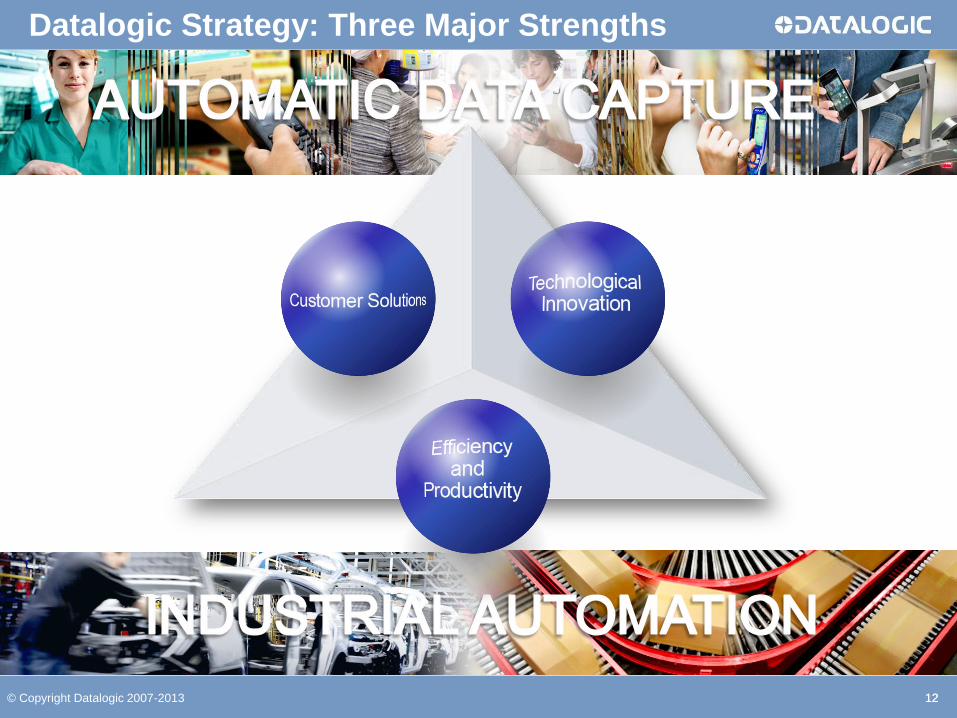
Datalogic Strategy: Three Major Strengths
12
© Copyright Datalogic 2007-2013 13
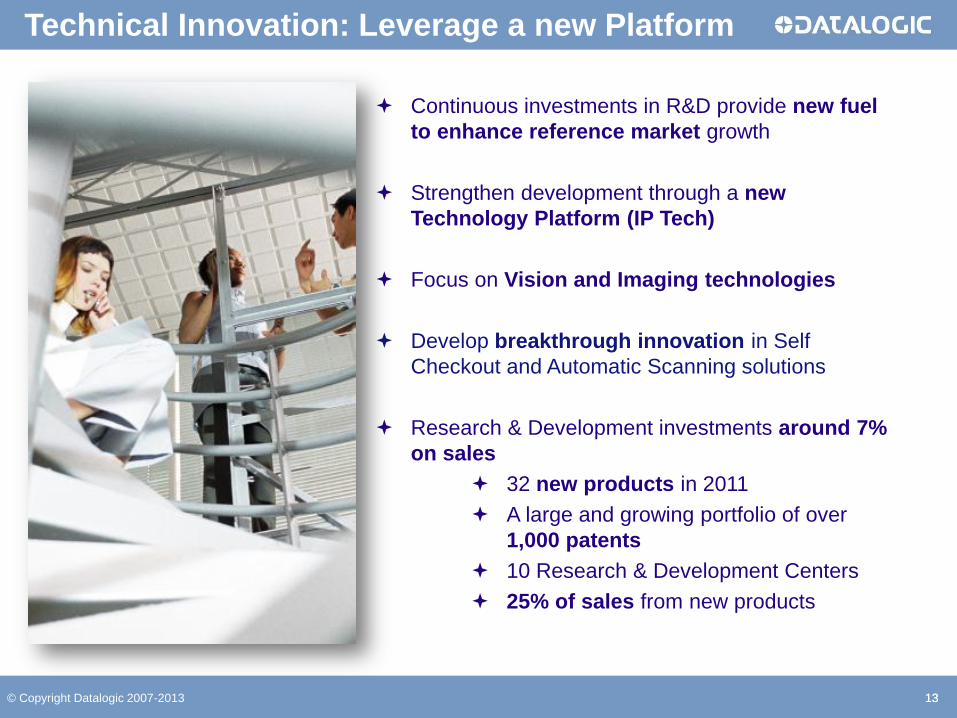
Technical Innovation: Leverage a new Platform
13
Continuous investments in R&D provide new fuel
to enhance reference market growth
Strengthen development through a new
Technology Platform (IP Tech)
Focus on Vision and Imaging technologies
Develop breakthrough innovation in Self
Checkout and Automatic Scanning solutions
Research & Development investments around 7%
on sales
32 new products in 2011
A large and growing portfolio of over
1,000 patents
10 Research & Development Centers
25% of sales from new products
© Copyright Datalogic 2007-2013 14 14
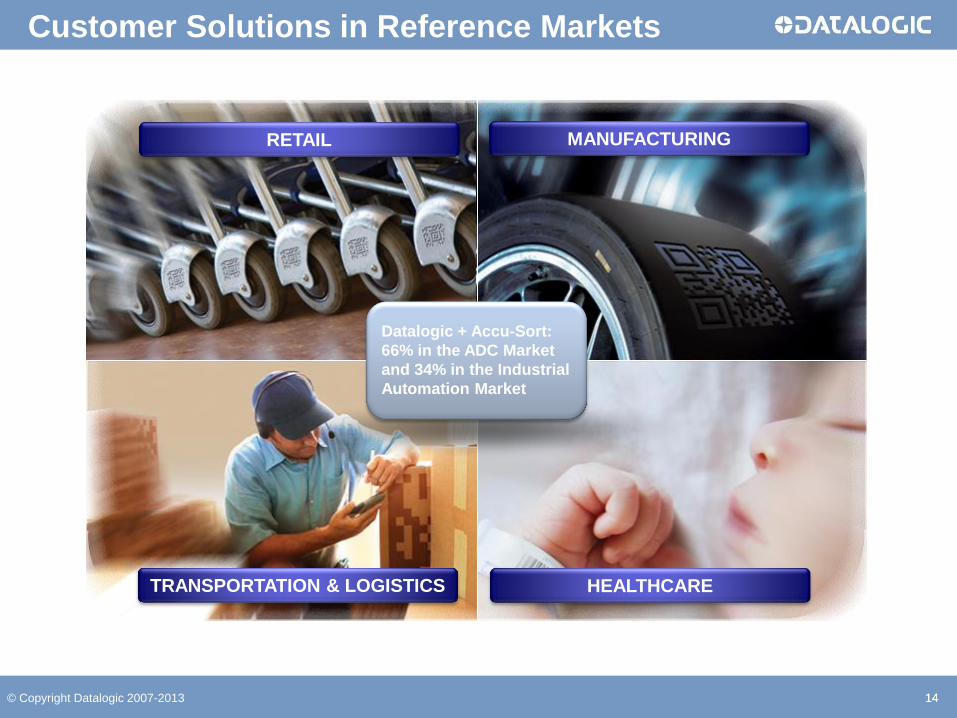
Customer Solutions in Reference Markets
TRANSPORTATION & LOGISTICS HEALTHCARE
RETAIL MANUFACTURING
Datalogic + Accu-Sort:
66% in the ADC Market
and 34% in the Industrial
Automation Market
© Copyright Datalogic 2007-2013 15 15
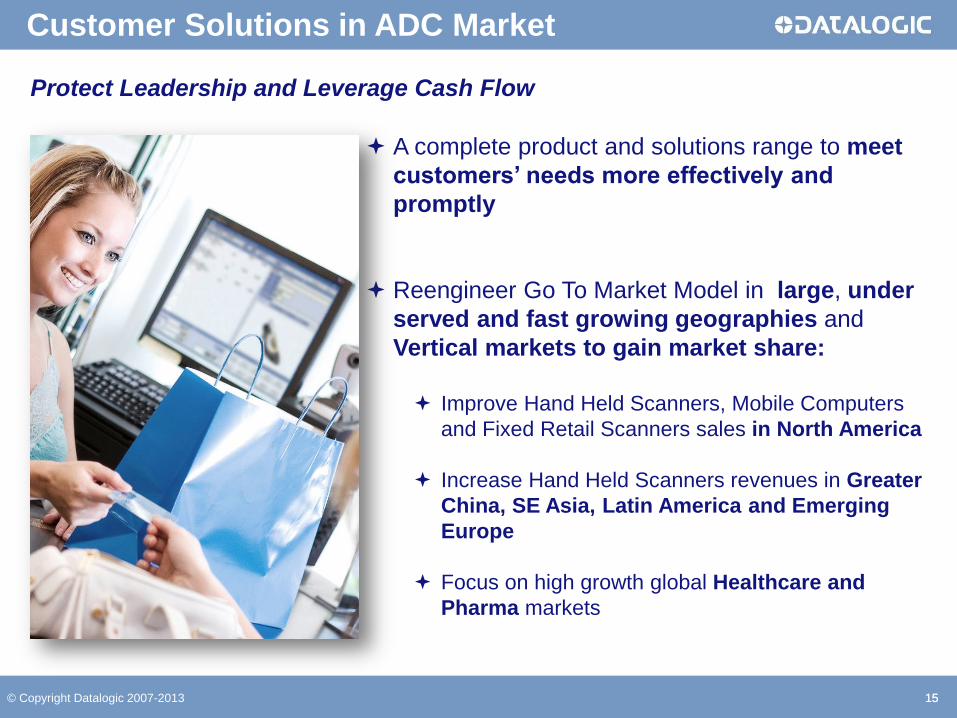
Customer Solutions in ADC Market
A complete product and solutions range to meet
customers’ needs more effectively and
promptly
Reengineer Go To Market Model in large, under
served and fast growing geographies and
Vertical markets to gain market share:
Improve Hand Held Scanners, Mobile Computers
and Fixed Retail Scanners sales in North America
Increase Hand Held Scanners revenues in Greater
China, SE Asia, Latin America and Emerging
Europe
Focus on high growth global Healthcare and
Pharma markets
Protect Leadership and Leverage Cash Flow
© Copyright Datalogic 2007-2013 16 16
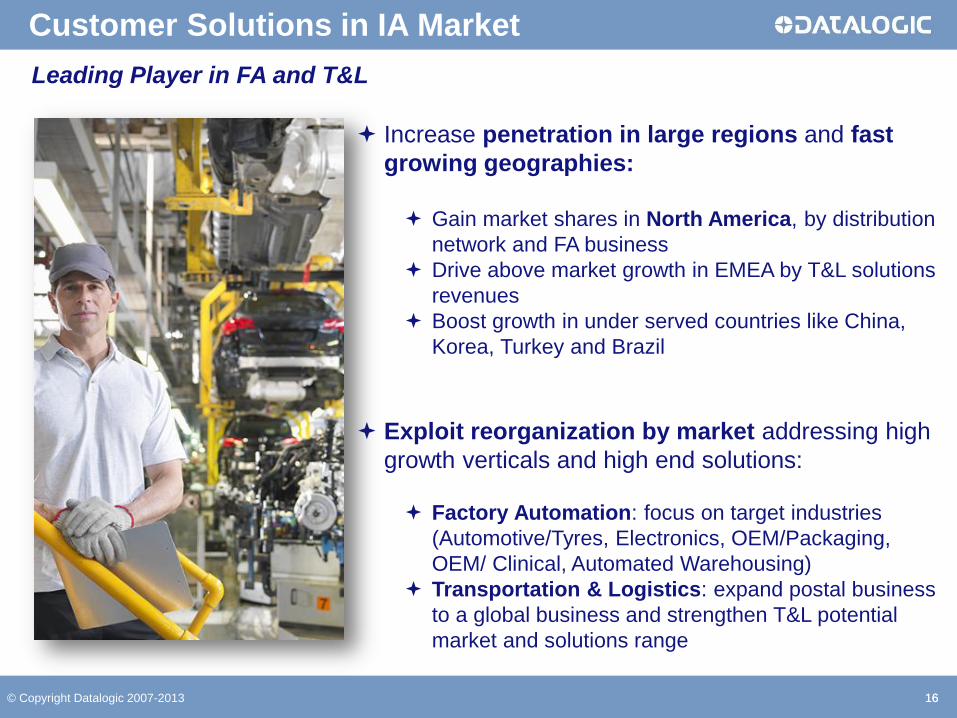
Customer Solutions in IA Market
Increase penetration in large regions and fast
growing geographies:
Gain market shares in North America, by distribution
network and FA business
Drive above market growth in EMEA by T&L solutions
revenues
Boost growth in under served countries like China,
Korea, Turkey and Brazil
Exploit reorganization by market addressing high
growth verticals and high end solutions:
Factory Automation: focus on target industries
(Automotive/Tyres, Electronics, OEM/Packaging,
OEM/ Clinical, Automated Warehousing)
Transportation & Logistics: expand postal business
to a global business and strengthen T&L potential
market and solutions range
: Leading Player in FA and T&L
© Copyright Datalogic 2007-2013 17 17
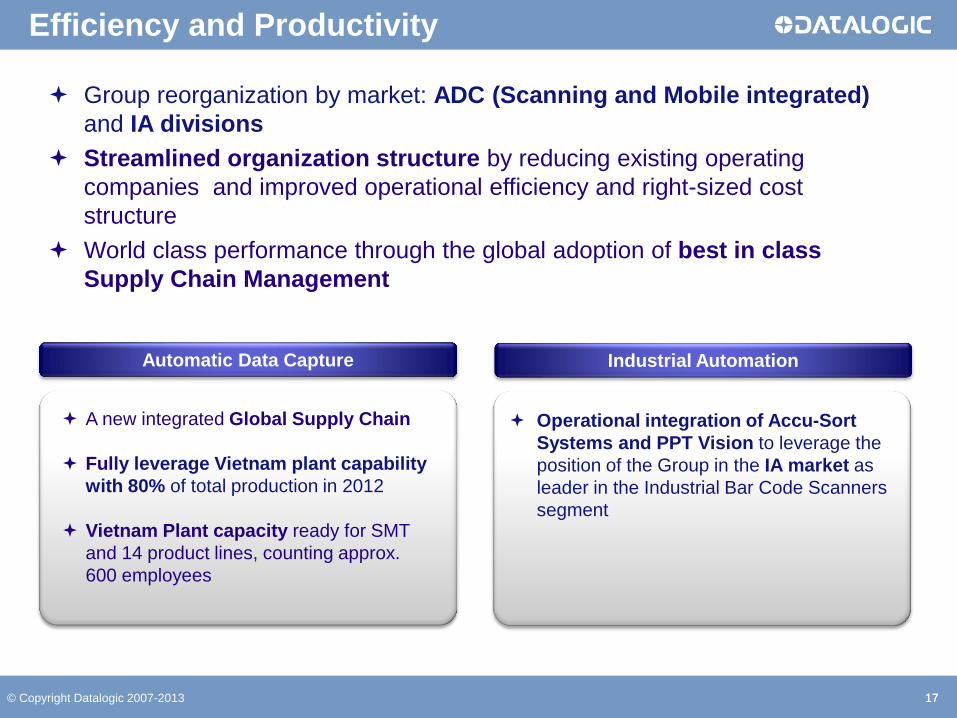
Efficiency and Productivity
Group reorganization by market: ADC (Scanning and Mobile integrated)
and IA divisions
Streamlined organization structure by reducing existing operating
companies and improved operational efficiency and right-sized cost
structure
World class performance through the global adoption of best in class
Supply Chain Management
A new integrated Global Supply Chain
Fully leverage Vietnam plant capability
with 80% of total production in 2012
Vietnam Plant capacity ready for SMT
and 14 product lines, counting approx.
600 employees
Automatic Data Capture
Operational integration of Accu-Sort
Systems and PPT Vision to leverage the
position of the Group in the IA market as
leader in the Industrial Bar Code Scanners
segment
Industrial Automation
© Copyright Datalogic 2007-2013 18 18
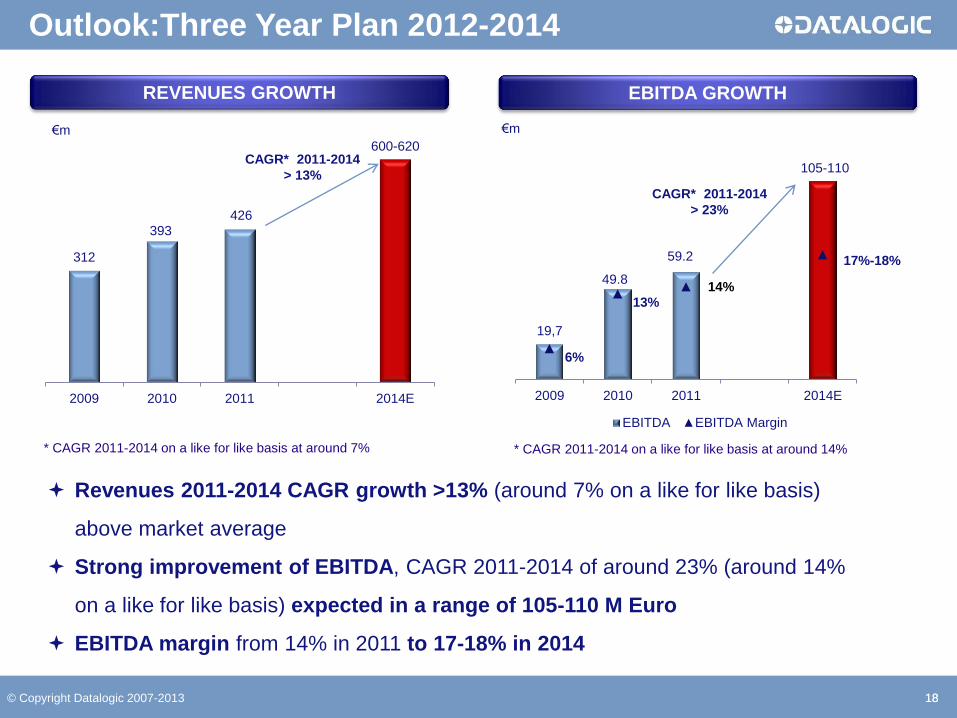
Outlook:Three Year Plan 2012-2014
312
393 426
600-620
2009 2010 2011 2014E
REVENUES GROWTH EBITDA GROWTH
€m €m
19,7
105-110
6%
13%
17%-18%
2009 2010 2011 2014E
EBITDA EBITDA Margin
14%
* CAGR 2011-2014 on a like for like basis at around 7% * CAGR 2011-2014 on a like for like basis at around 14%
Revenues 2011-2014 CAGR growth >13% (around 7% on a like for like basis)
above market average
Strong improvement of EBITDA, CAGR 2011-2014 of around 23% (around 14%
on a like for like basis) expected in a range of 105-110 M Euro
EBITDA margin from 14% in 2011 to 17-18% in 2014
CAGR* 2011-2014
> 13%
49.8
59.2
CAGR* 2011-2014
> 23%
© Copyright Datalogic 2007-2013 19 19
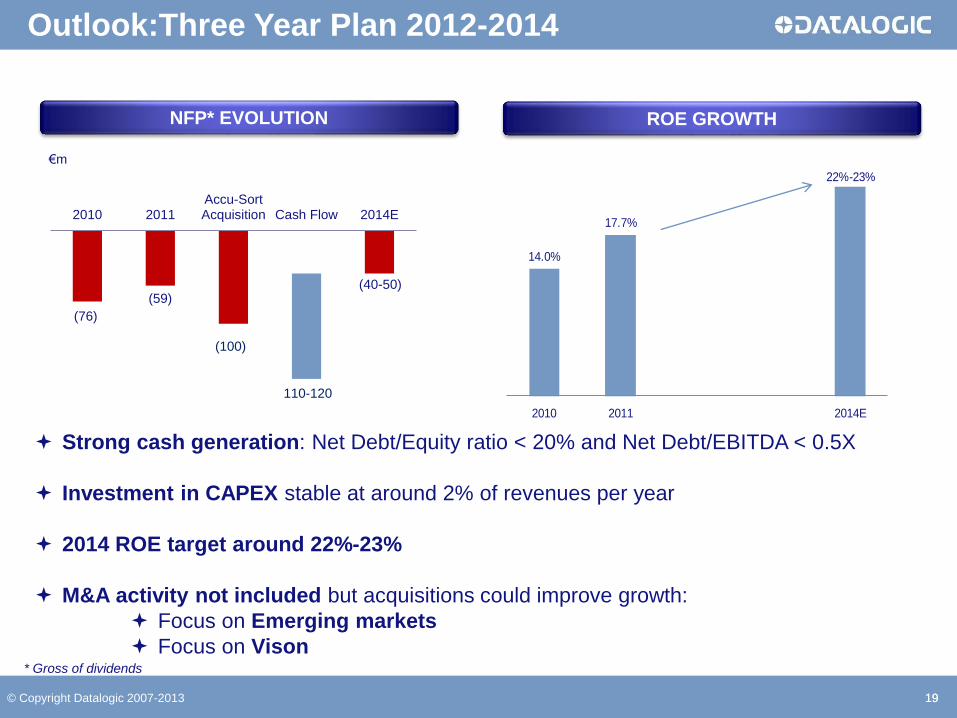
Outlook:Three Year Plan 2012-2014
NFP* EVOLUTION ROE GROWTH
Strong cash generation: Net Debt/Equity ratio < 20% and Net Debt/EBITDA < 0.5X
Investment in CAPEX stable at around 2% of revenues per year
2014 ROE target around 22%-23%
M&A activity not included but acquisitions could improve growth:
Focus on Emerging markets
Focus on Vison
(76)
(59) (40-50)
2010 2011Accu-SortAcquisition Cash Flow 2014E
(100)
110-120
14.0%
17.7%
2010 2011 2014E
22%-23%
€m
* Gross of dividends
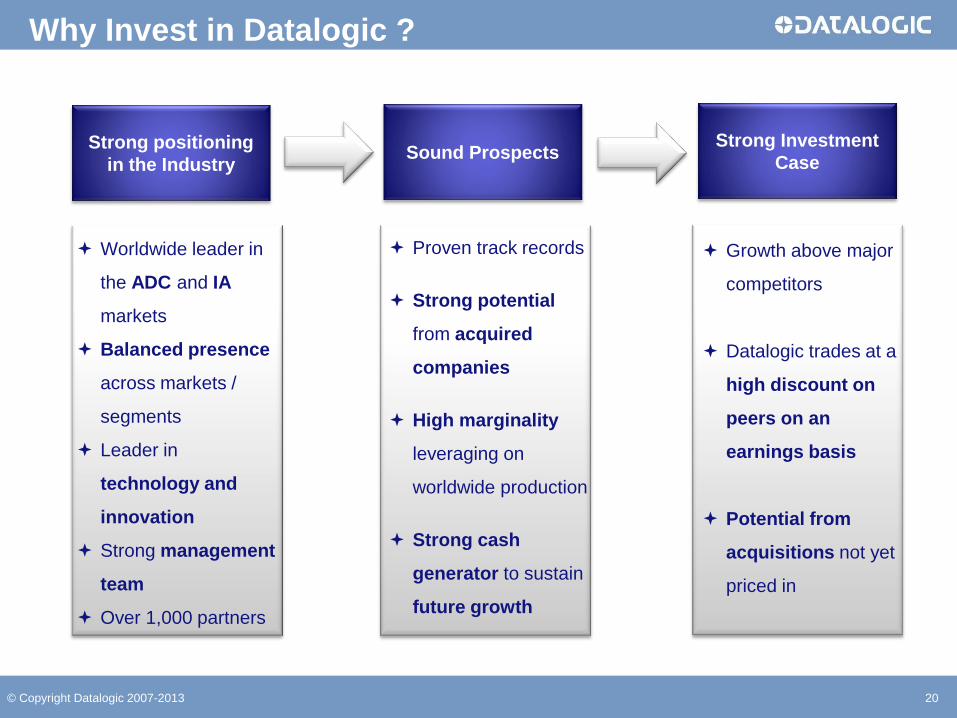
Worldwide leader in
the ADC and IA
markets
Balanced presence
across markets /
segments
Leader in
technology and
innovation
Strong management
team
Over 1,000 partners
20
Strong positioning
in the Industry
Proven track records
Strong potential
from acquired
companies
High marginality
leveraging on
worldwide production
Strong cash
generator to sustain
future growth
Growth above major
competitors
Datalogic trades at a
high discount on
peers on an
earnings basis
Potential from
acquisitions not yet
priced in
Why Invest in Datalogic ?
Sound Prospects Strong Investment
Case
© Copyright Datalogic 2007-2013
21 21
GROUP OVERVIEW
STRATEGY AND OUTLOOK
APPENDIX
© Copyright Datalogic 2007-2013
22 © Copyright Datalogic 2007-2013
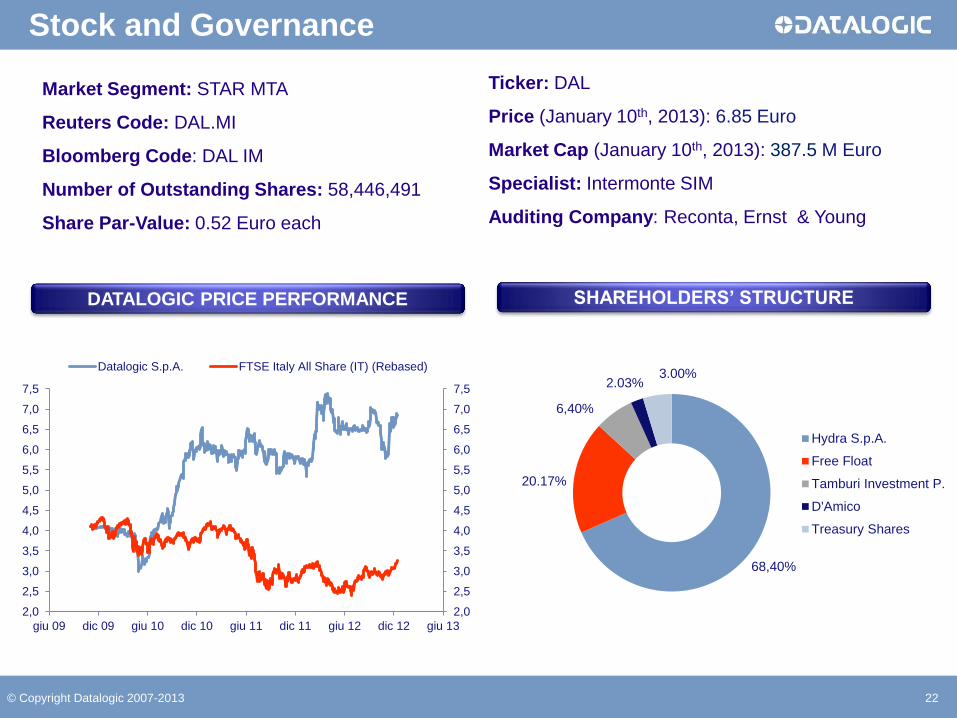
Market Segment: STAR MTA
Reuters Code: DAL.MI
Bloomberg Code: DAL IM
Number of Outstanding Shares: 58,446,491
Share Par-Value: 0.52 Euro each
SHAREHOLDERS’ STRUCTURE
68,40%
20.17%
6,40%
2.03% 3.00%
Hydra S.p.A.
Free Float
Tamburi Investment P.
D'Amico
Treasury Shares
Ticker: DAL
Price (January 10th, 2013): 6.85 Euro
Market Cap (January 10th, 2013): 387.5 M Euro
Specialist: Intermonte SIM
Auditing Company: Reconta, Ernst & Young
DATALOGIC PRICE PERFORMANCE
Stock and Governance
2,0
2,5
3,0
3,5
4,0
4,5
5,0
5,5
6,0
6,5
7,0
7,5
2,0
2,5
3,0
3,5
4,0
4,5
5,0
5,5
6,0
6,5
7,0
7,5
giu 09 dic 09 giu 10 dic 10 giu 11 dic 11 giu 12 dic 12 giu 13
Datalogic S.p.A. FTSE Italy All Share (IT) (Rebased)
23
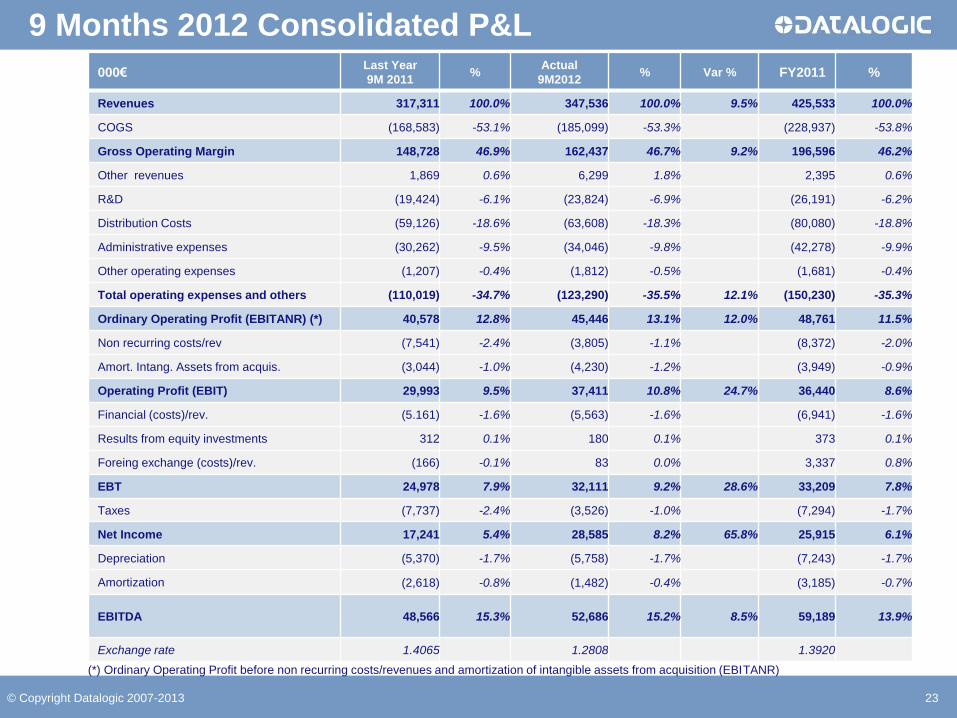
000€ Last Year
9M 2011 %
Actual
9M2012 % Var % FY2011 %
Revenues 317,311 100.0% 347,536 100.0% 9.5% 425,533 100.0%
COGS (168,583) -53.1% (185,099) -53.3% (228,937) -53.8%
Gross Operating Margin 148,728 46.9% 162,437 46.7% 9.2% 196,596 46.2%
Other revenues 1,869 0.6% 6,299 1.8% 2,395 0.6%
R&D (19,424) -6.1% (23,824) -6.9% (26,191) -6.2%
Distribution Costs (59,126) -18.6% (63,608) -18.3% (80,080) -18.8%
Administrative expenses (30,262) -9.5% (34,046) -9.8% (42,278) -9.9%
Other operating expenses (1,207) -0.4% (1,812) -0.5% (1,681) -0.4%
Total operating expenses and others (110,019) -34.7% (123,290) -35.5% 12.1% (150,230) -35.3%
Ordinary Operating Profit (EBITANR) (*) 40,578 12.8% 45,446 13.1% 12.0% 48,761 11.5%
Non recurring costs/rev (7,541) -2.4% (3,805) -1.1% (8,372) -2.0%
Amort. Intang. Assets from acquis. (3,044) -1.0% (4,230) -1.2% (3,949) -0.9%
Operating Profit (EBIT) 29,993 9.5% 37,411 10.8% 24.7% 36,440 8.6%
Financial (costs)/rev. (5.161) -1.6% (5,563) -1.6% (6,941) -1.6%
Results from equity investments 312 0.1% 180 0.1% 373 0.1%
Foreing exchange (costs)/rev. (166) -0.1% 83 0.0% 3,337 0.8%
EBT 24,978 7.9% 32,111 9.2% 28.6% 33,209 7.8%
Taxes (7,737) -2.4% (3,526) -1.0% (7,294) -1.7%
Net Income 17,241 5.4% 28,585 8.2% 65.8% 25,915 6.1%
Depreciation (5,370) -1.7% (5,758) -1.7% (7,243) -1.7%
Amortization (2,618) -0.8% (1,482) -0.4% (3,185) -0.7%
EBITDA 48,566 15.3% 52,686 15.2%
8.5%
59,189 13.9%
Exchange rate 1.4065 1.2808 1.3920
(*) Ordinary Operating Profit before non recurring costs/revenues and amortization of intangible assets from acquisition (EBITANR)
9 Months 2012 Consolidated P&L
© Copyright Datalogic 2007-2013
24 24 24
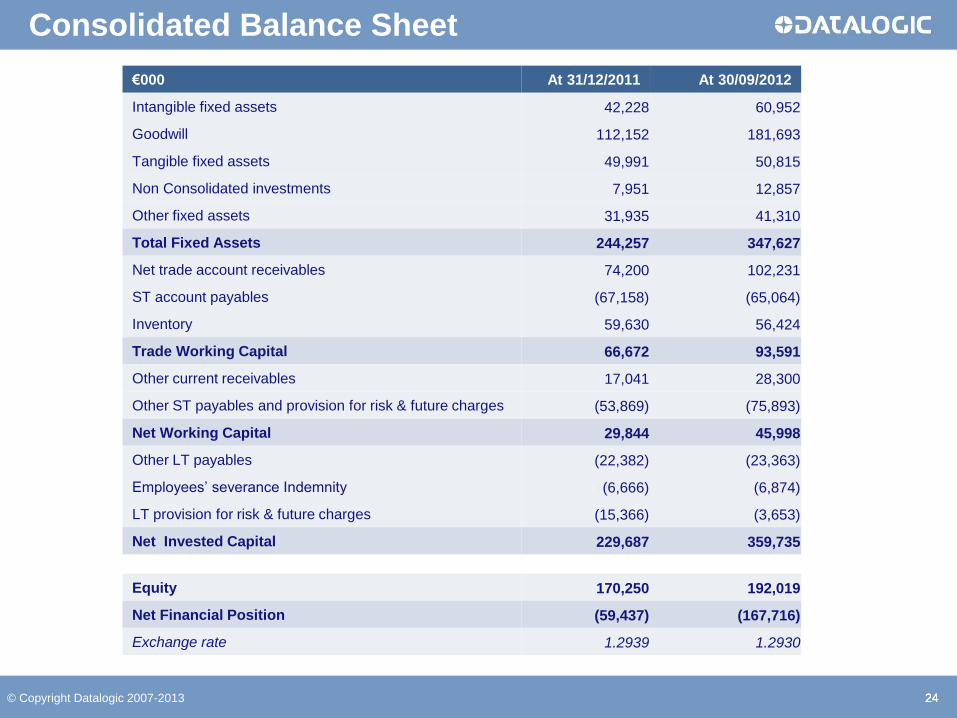
Consolidated Balance Sheet
€000 At 31/12/2011 At 30/09/2012
Intangible fixed assets 42,228 60,952
Goodwill 112,152 181,693
Tangible fixed assets 49,991 50,815
Non Consolidated investments 7,951 12,857
Other fixed assets 31,935 41,310
Total Fixed Assets 244,257 347,627
Net trade account receivables 74,200 102,231
ST account payables (67,158) (65,064)
Inventory 59,630 56,424
Trade Working Capital 66,672 93,591
Other current receivables 17,041 28,300
Other ST payables and provision for risk & future charges (53,869) (75,893)
Net Working Capital 29,844 45,998
Other LT payables (22,382) (23,363)
Employees’ severance Indemnity (6,666) (6,874)
LT provision for risk & future charges (15,366) (3,653)
Net Invested Capital 229,687 359,735
Equity 170,250 192,019
Net Financial Position (59,437) (167,716)
Exchange rate 1.2939 1.2930
© Copyright Datalogic 2007-2013
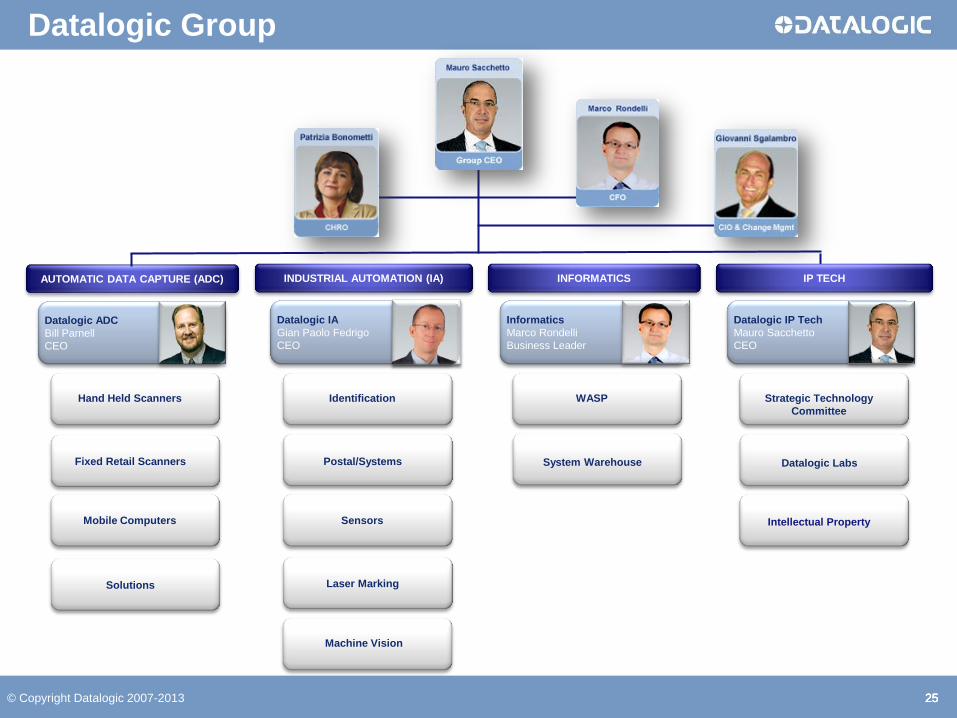
Datalogic IP Tech
Mauro Sacchetto
CEO
Datalogic IA
Gian Paolo Fedrigo
CEO
25 25 25 25
AUTOMATIC DATA CAPTURE (ADC) INDUSTRIAL AUTOMATION (IA)
Datalogic ADC
Bill Parnell
CEO
Hand Held Scanners
Fixed Retail Scanners
Datalogic Group
Mobile Computers
Solutions
Identification
Postal/Systems
Sensors
Laser Marking
Informatics
Marco Rondelli
Business Leader
INFORMATICS
WASP
System Warehouse
IP TECH
Strategic Technology
Committee
Datalogic Labs
Intellectual Property
© Copyright Datalogic 2007-2013
Machine Vision
26 26 26 26
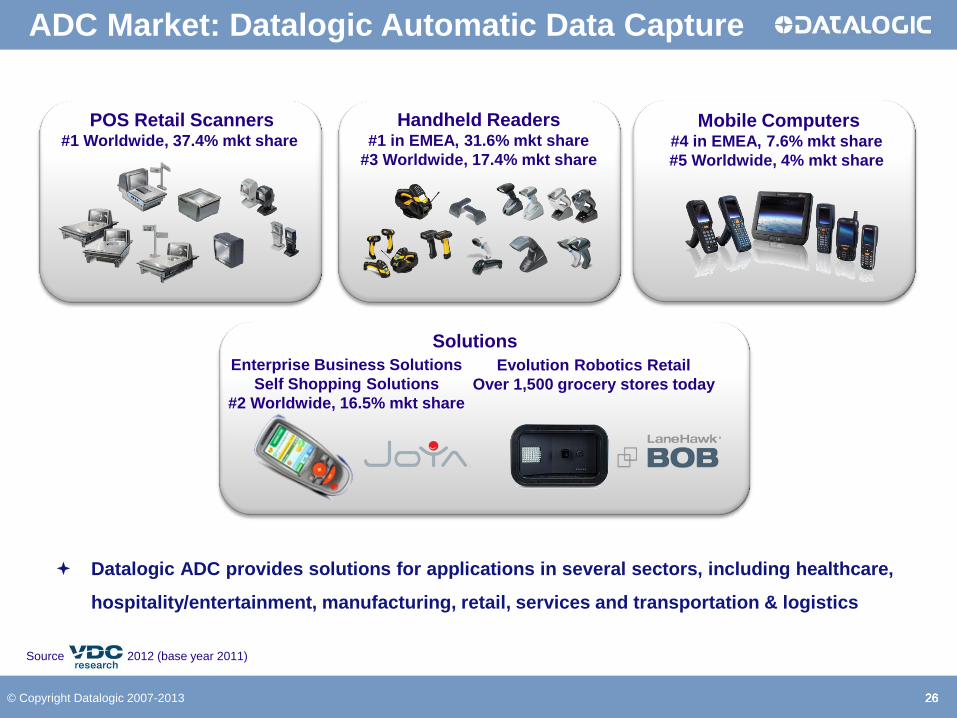
ADC Market: Datalogic Automatic Data Capture
Source 2012 (base year 2011)
Mobile Computers #4 in EMEA, 7.6% mkt share
#5 Worldwide, 4% mkt share
Datalogic ADC provides solutions for applications in several sectors, including healthcare,
hospitality/entertainment, manufacturing, retail, services and transportation & logistics
POS Retail Scanners #1 Worldwide, 37.4% mkt share
Handheld Readers #1 in EMEA, 31.6% mkt share
#3 Worldwide, 17.4% mkt share
Solutions
Enterprise Business Solutions
Self Shopping Solutions
#2 Worldwide, 16.5% mkt share
Evolution Robotics Retail
Over 1,500 grocery stores today
© Copyright Datalogic 2007-2013
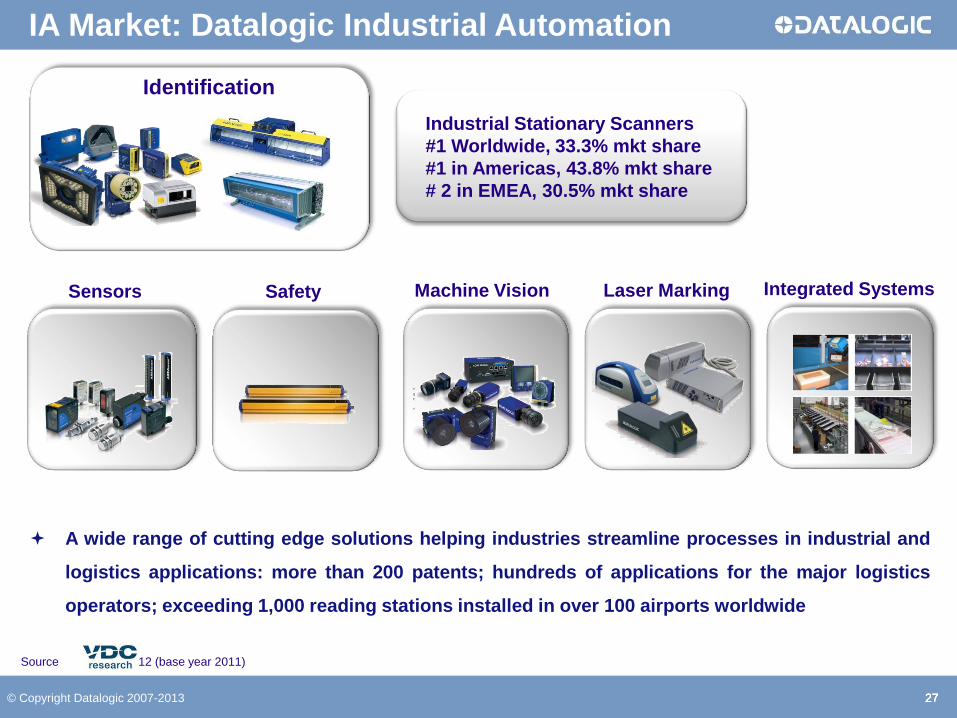
Industrial Stationary Scanners
#1 Worldwide, 33.3% mkt share
#1 in Americas, 43.8% mkt share
# 2 in EMEA, 30.5% mkt share
Identification
27 27 27 27 © Copyright Datalogic 2007-2013
A wide range of cutting edge solutions helping industries streamline processes in industrial and
logistics applications: more than 200 patents; hundreds of applications for the major logistics
operators; exceeding 1,000 reading stations installed in over 100 airports worldwide
Source 2012 (base year 2011)
IA Market: Datalogic Industrial Automation
Safety
Sensors
Machine Vision
Laser Marking
Integrated Systems
28 28 © Copyright Datalogic 2007-2013
Contacts
IR CONTACTS NEXT EVENTS
IR Manager
Marco Rondelli
E-mail [email protected]
IR Assistant
Daniela Giglioli
Tel. +39 051 3147109
Fax +39 051 3147205
E-mail [email protected]
Via Candini, 2
40012 Lippo di Calderara di Reno
Bologna – Italy
IR Consultant Vincenza Colucci
CDR Communication Srl
Tel. +39 335 6909547
March 7, 2013
Approval of the 2012 Datalogic Group year-end
Financial Statements
March 26-27, 2013
STAR Conference, Milan
April 23, 2013
Ordinary Shareholders’ Meeting
May 9, 2013
Approval of the Consolidated Financial Report
as of March 31, 2013
July 30, 2013
Approval of the Consolidated Financial Report
as of June 30, 2013
November 7, 2013
Approval of the Consolidated Financial Report
as of September 30, 2013
DATALOGIC ON LINE
www.datalogic.com

30 30
We Welcome Your Questions!
© Copyright Datalogic 2007-2013
© 2013 Datalogic S.p.A. - All rights reserved. • Protected to the fullest extent under U.S. and international laws. • Copying, or altering of this document is
prohibited without express written consent from Datalogic S.p.A. Datalogic and the Datalogic logo are registered trademarks of Datalogic S.p.A. in many
countries, including the U.S.A. and the E.U. All other brand and product names may be trademarks of their respective owners.
![Index [aima.cs.berkeley.edu]aima.cs.berkeley.edu/Index.pdf · Index Page numbers in bold refer to definitions of terms and algorithms. Page numbers in italics refer to items in the](https://img.pdfslide.tips/doc/110x75/5ff52079feb0ce7f6b70d43c/index-aimacs-aimacs-index-page-numbers-in-bold-refer-to-deinitions-of-terms.jpg)


![INDEX [librairie.vetbooks.fr]...INDEX Note: page numbers in italics refer to fi gures, those in bold refer to tables.AB blood group typing 715–17, 1102, 1103 abdominal artery aneurysms](https://img.pdfslide.tips/doc/110x75/5e6849c121f76b3fda6af5c7/index-index-note-page-numbers-in-italics-refer-to-i-gures-those-in-bold.jpg)


![Index [aima.eecs.berkeley.edu]aima.eecs.berkeley.edu/3rd-ed/31-Index.pdfIndex Page numbers in bold refer to definitions of terms and algorithms; page numbers in italics refer to items](https://img.pdfslide.tips/doc/110x75/5ff958398a3bd11a451c172f/index-aimaeecs-aimaeecs-index-page-numbers-in-bold-refer-to-deinitions-of.jpg)