Embed Size (px)
Citation preview
九州大学学術情報リポジトリKyushu University Institutional Repository
The Economics of Dairy Cow Raising in the SouthEast of Vietnam
Loan, Chu Thi KimLaboratory of Agricultural Economics,Division of International Agricultural Resource Economicsand Business Administration,Department of Agricultural and Resource Economics,Graduate Schoolof Bioresource and Bioenvironmental Sciences,Kyushu University
Yokogawa, HiroshiLaboratory of Agricultural Economics,Division of International Agricultural Resource Economicsand Business Administration,Department of Agricultural and Resource Economics,Faculty ofAgriculture,Kyushu University
Kawaguchi, TsunemasaDepartment of Economics,Faculty of Economics,Kyushu University
http://hdl.handle.net/2324/4610
出版情報:九州大学大学院農学研究院紀要. 49 (2), pp.497-512, 2004-10-01. Faculty ofAgriculture, Kyushu Universityバージョン:published権利関係:
J. Fac. Agr.. Kyushu Univ., 49 (2), 497-512 (2004)
The Econolnics of Dairy Cow Raising in the South East of Vretnaln
CHU Thi Kiln Loan~*, mroshi YOKOGAWA and Tsunemasa KAWAGUCHI'
Laboratory of Agricultural Economics, Division of International Agricultural Resource .
Economics and Business Administration, Department of Agricultural and Resource
Economics, Faculty of Agriculture, Kyushu University, Fukuoka 812-8581
(Received April 8, 2004 aud accepted July 13, 2004)
Milk processing factories located in the South East of Vietnam use mostly imported mate-
rials at present to process milk and dairy products. This study was thus conducted to unravel
the underlying situation of dairy cattle raising in the region. The results of the study are based
on the original data collected from 80 farm households in Ho Chi Minh and Binh Duong provinces. Descriptive statistics is used as the principal method of data analysis.
The survey reveals that dairy farm is quite small in size with an average of alinost 6 heads;
of which most is the crossbreed of 3/4 HF blood. Total production costs are found to vary by
some breeds and dairy sizes. Farmers can benefit from raising cows with an average net return
of almost 3 million VND per milking cow. Poor situation of breeding and veterinary services,
shortage of good breeds, Iack of capital and technical knowledge are the most important obsta-
cles for expanding the dairy fanuing.
INTRODUCTION Vietnam has a total population of alrnost 80 mjJlion people, of which more than 75 per-
cent live in rural areas and depend on agricultural production as their source of income
(General Statistical Office, 2002). After the introduction of the renovation policy in 1986,
the living standard of Vietnamese residents improved considerably, e.g., the average
income per person wlthin a month increased from 226.7 thousand VND in 1996 to 295
thousand VND in 1999 wlth the average growih rate of 8.8percent each year over the
1996-1999 period (General Statistical Office, 2000). In line with the income increase,
demand for protein-rich agricultural products such as meats and dairy products has
rapidly increased (i.e. per capita consumption of milk equivalent grew from 0.47kg in
1990 to 7.5kg in 2002) . As a result, livestock production has remarkably developed to
meet the demand. Total live weight of animals tremendously accelerated from I ,007.9
thousand tons in 1990 to 2,146.3 thousand tons in 2002 with the aunual average increas-
ing rate of 6.5percent. Among the kinds of animals, pig had the highest growih in live
weight that r~ached the rate of 7.2percent, followed by poultry wlth 6 percent over the
period of 1990-2002. The share of animal sector in the agricultural GDP also increased
* Laboratory of Agricultural Economics, Division of International Agricultural Resource Economics and
Business Administration, Department of Agricultural and Resource Economics, Graduate School of
Bioresource and Bioenvironmental Sciences, Kyushu University.
2 Department of Economics, Faculty of Economics, Kyushu Sangyo University
* Corresponding author (email: [email protected])
497

498 C. T. LOANet al.
from 17.8 percent in 1998 to 20.5 ~ercent in 2002 (Anh, 2003).
Dairy production in Vietnam is ・ a relatively new sector, but has a high growih rate.
The cow population increased from 16.5 thousand heads in 1994 to 54.3 thousand heads
in 2002 with the annual average growih rate of 18.6~ercent. Similarly, the total milk
output grew from 16 thousand tons in 1994 to alinost 65 thousand tons in 2001 (MARD,
2002; Luong, 2003) . According to Lich and Tuyen (2002), about 92 percent of the total
cow population in the country are raised in farm households; the remainder is fed in state
enterprises for breeding purpose. Over the past few, years, dairy production has begun to
play an increasingly important role in livestock sector. It has considerably contributed to
changing the structure of anirnal breed as well as increasing the total income of farmers.
However, the milk output in Vietnam is still too low compared to that of neighboring
countries like China, Thailand and Indonesia (e.g., the ~omestic milk production of
Vietnam in 1997 was about 31 thousand tons, while that of Thailand was 632 thousand
tons - Chantalakhana and Skunmun, 2001). It satisfied only almost 12percent of the
national demand for milk and dairy prbducts in 2001. The remainder came from imports.
The development of dairy cow raising therefore is essential for Vietnam in order to
increase the domestic milk production to 40 percent by 2010 (MARD, 2002) .
The South East (SE) is one of the 8 socio-economic regions in Vietnam including 8
provinces named Ho Chi Minh, Ninh Thuan, Binh Phuoc, Tay Ninh, Binh Duong, Dong Nai, Binh Thuan and Ba Ria - Vung Tau~. Its average population density in 1999 was 337
persons/km2 standing a third order among 8 regions of the country; especially the figure of
Ho Chi Minh City reached 2,400 people/km2. The region has the lowest ratio of poor
households in the nation, which was 20 percent compared to an average national level of
28percent (General Statistical Office', 2002) . Better living standard and high population
density of the region imply large demand for milk and dairy products. In addition,
resources and service networks for raising cows are quite available. There are some large
milk- and feed - processing factories located in the region, i.e. Truong Tho and Thong
Nhat Milk Factories (Vinamilk Company) , Vietnam Foremost Dairy Company, Lotha Milk
Factory. Thanh Binh Feed Mill and V-pro F~ed Lirnited Company. As a reSult, most dairy
cows in the nation have been by far concentrated in the South East. In 2002, the number
of cows in the region was about 37 thousand heads accounting for 69 percent of the
national qow population. However, the milk processing factories in the region at present
still have to use mostly imported materials for processing. The volume of domestic milk
materials bought by Vinamilk Company - a major milk buyer in the region, has just met
less than 10percent qf its demand (Van, 2002). Consequently, a question posed is why
the amowat of raw milk produced is too low i7~ comparison wit/~ the capcbcities of the
udlk processingfactories. Does it resultfrom waprofitabilit~/ ofraising cows orfrom
otherfactors? Actually, there have been several researches on the ~airy ,sector but
mostly focusing on technical aspects; few are socioeconomic oriented. This study was
thus conducted to contribute to answering the above question.
1 Currently, Vietnam is reported to have 8 socio-economic regions as the North Mountain and Midland
has been divided into two regions.
Provinces in each region have been changed according to Decision No 31/2001 of the Director General
of the General Statistics Office.

The Economics ofDair~/ Cow Raising in the South East of Vietuam 499
The specific purposes of this paper are, (1) to investigate the
dairy production in farm households in the South East of Vietnam,
economics of dairy cow raising to understand its profitability.
current situation of
(2) to evaluate the
METHODOLOGY A household survey was conducted in November and December 2003 ih two
provinces of the South East region, namely Binh Duong and Ho Chi Minh. The provinces
were chosen based on their large contributions to the total milk production in the region.
In total, a sample of eighty dairy farm households was randomly selected from two dis-
tricts named Thuan An (Binh Duong province) and Cu Chi (HO Chi Minh city) . Forty
households from each district were interviewed. Descriptive statistics with contingency
tables and diagrams was used as a major method to achieve the study objectives.
BACKGROUND OF THE SAMPLED HOUSEHOLDS General characteristics of the sample
Around two thirds of the total household heads were in the active age group of 31 to
50 years old CTable 1). The number of young household heads below 31 years・old accounted for only 2.5 and 7.5percent of the sample in Ho Chi Minh and Binh Duong,
respectively. The survey also revealed that most dairy farmers in the study areas had
primary or secondary education. Only 12.5 and 15percent of them attained high school
education in Binh Duong and Ho Chi Minh, respectively. This educational level is
assessed to be lower than that of farmers in the North of Vietnam, ・i.e. the percentage of
dairy farmers who attained high school education in 1999 in Hanoi was 46percent, and
the figure for Ha Tay was 33percent (Loan and Kawaguchi, 2002). Low educational level
Table 1. General characteristics of the sample.
Items Unit Ho Chi Minh Binh Duong
Quantity Percent Quantity Percent
1. Information related to household heads
(1) Average age
Of which, a group of 31-50 years old
(2) Dairy farm experience
Of which, a group of 4+6 years
(3) Average education level
Of which, having secondary school education
2. Information related to households
(1) Household size
Of which, main laborer
(2) Total land holding
Ofwhich: -Homestead land -Annual crop land
(3) Total areas used for growing grass
years
persons
years
persons
years
persons
persons
persons m2 m2 m2 m2
47. 1
28 5.7
24 6.0
20
4.7
2.6
3,696.9
1,161.9
2,450.0
915.0
70 . o
60.0
50.0
100.0
55.3
100.0
31.4
66.3
24.8
45.8
26 4.0
14
5.9
19
4.4
2.9
5,203.0
1 ,OOI .8
2,23 1 .3
1,146.3
65.0
35.0
47.5
100.0
65.9
100.0
19.2
42.9
22.0
Source: Survey, 2003

500 C. T. LOANet al.
in the region may be explained by the fact that the South of Vietnam was just liberated
and reunified in 1975, and so people born before 1970 had poorer accesses to education.
With respect to experience in dairy farming, Ho Chi Minh farmers had practiced raising
cows for a longer time than Binh Duong ones. However, raising cows is a still new occu-
pation for both locations. On average, farmers had only 5.7 and 4 years of experience in
dairy farming in Ho Chi Minh and Binh Duong, respectively.
The average household size of 4.7persons was calculated for Ho Chi Minh and 4.4
people for Binh Duong, in which, over half of the members in the family were laborers in
working age. Regarding land holdings, Binh Duong farmers hold larger areas than Ho Chi
Minh farmers. On average, a household located in Binh Duong held 5,203 m', while this
indicator was 3,697m2 in the case of Ho Chi Minh household. This may be one of the rea-
sons explaining why a part of larger area was devoted for grass cultivation in Binh Duong.
Source of household income On average, income of a dairy household within a year was around 40million VND2
(Table 2). This average level is assessed to be almost threefold higher than that of rice
producing households (see Hien (2003)). It is interesting to note that off-farm activities
contribute a relatively high part to the total household income (e.g., it contributed almost
20 percent of the total income) . The foundation and development of the factories located
in the region has given more chances to residents to have off-farm jobs. Although holding
relatively smaller size of land area, Ho Chi Minh farmers still had an average income of
41 million VND, which was higher than that of Binh Duong farmers. This may be largely
because the households in Ho Chi Minh raised more animals, especially pigs and sows
than Binh Duong farrners .
Raising livestock was the main source of household income accounting for over
Table 2. The structure of households' income source.
Items Ho Chi Minh Binh Duong
Value (1000 VND) Percent Value (1000 VND) Percent
Total household incomes 1 . Crop cultivation
Of which: -Paddy
-Perennial crops
2. Livestock production
Of which: -Daity cow -Pig (1)
3. Off-farm activities
Of which, salary
41,065.1
l ,832 .5
1,316.0
416.5 3 1 ,267.7
25,927.4
2,994.6
7,965.0
5,835.0
100.0
4.5
71.8
22.7
76.1
82.9
9.6
19.4
73.3
40,802 . 1
4,389.9
426.8
3,017.5
29,039.8
27,164.4
1,199.9
7,372.5
5,560.0
100.0
10.8
9.7
68.7
71.2
93.5
4.1
18.1
75.4
Note: Intermediate products (i.e. cultivated grass, piglet) were excluded from the subtotal revenues of
each sector.(1) Income from raising sows was not included in the income of pig production.
Source: Survey, 2003
2 Income of each sector is a remaining part of the revenue after the cash costs is subtracted;
Exchange rate of VND per US dollar at the survey period was about 15,500 VND.
The Ec07tomics ofDairy Cow Raising in the South East of Vietnam 501
70 percent of the total income. Apart from animal production, alrnost 98percent of the
surveyed farmers also cultivated crops such as paddy, vegetable, perennial industrial
crops and fruit trees, which generated from 5 to 1 1 percent of the total household income.
DAIRY PRODUCTION AND ITS ECONOMICS
Structure of cow herd in the interviewed households
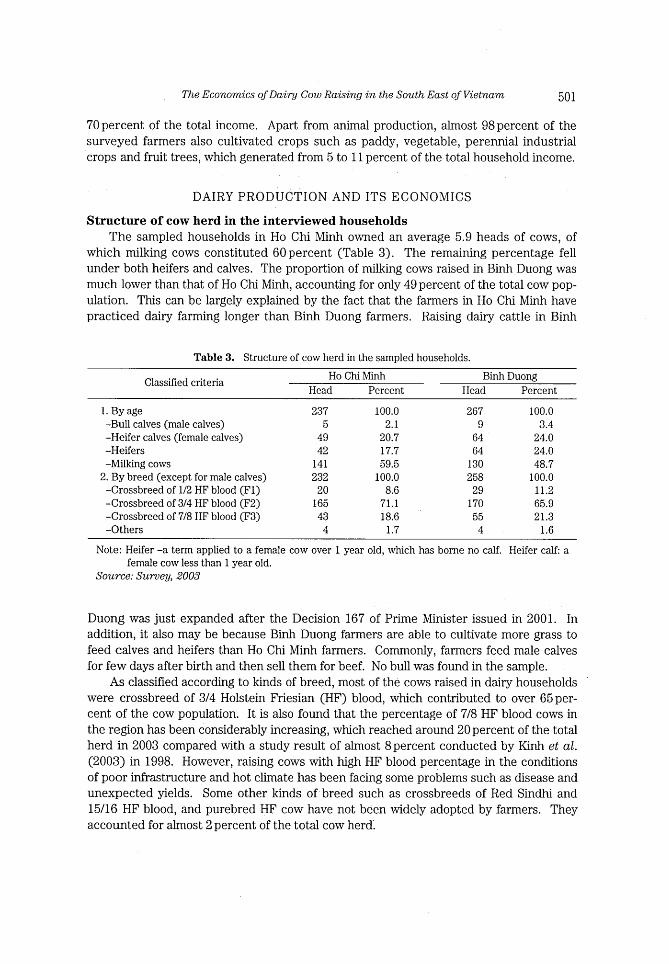
The sampled households in Ho Chi Minh owned an average 5.9 heads of cows, of
which milking cows constituted 60percent (Table 3). The remaining percentage fell
under both heifers and calves. The proportion of milking cows raised in Binh Duong was
much lower than that of Ho Chi Minh, accounting for only 49 percent of the total cow pop-
ulation. This can be largely explained by the fact that the farmers in Ho Chi Minh have
practiced dairy farming longer than Binh Duong farmers. Raising dairy cattle in Binh
Table 3. Structure of cow herd in the sampled households.
Classified criteria Ho Chi Minh Binh Duong
Head Percent Head Percent
1. By age
-Bull calves (male calves)
-Heifer calves (female calves)
-Heif ers
-Milking cows
2. By breed (except for male calves)
-Crossbreed of 1/2 HF blood (F1)
-Crossbreed of 3/4 HF blood (F2)
-Crossbreed of 7/8 HF blood (F3)
-Others
237 5
49 42
141
232 20 165
43
4
100.0
2.1
20.7
17.7
59.5
100.0
8.6
71.1
18.6
1.7
267 9
64
64
130
258 29
1 70
55
4
100.0
3.4
24.0
24.0
48.7
100.0
11.2
65.9
21.3
1.6
Note: Heifer -a term applied to a female cow over I year old, which has borne no calf. Heifer calf: a
female cow less than I year old.
Source: Survey, 2003
Duong was just expanded after the Decision 167 of Prime Minister issued in 2001. In
addition, it also may be because Binh Duong farmers are able to cultivate more grass to
feed calves and heifers than Ho Chi Minh farmers. Colnmonly, farmers feed male calves
for few days after birth and then sell them for beef. No bull was found in the sample.
As classified according to kinds of breed, most of the cows raised in dairy households
were crossbreed of 3/4 Holstein Friesian (HF) blood, which contributed to over 65per-
cent of the cow population. It is also found that the percentage of 7/8 HF blood cows in
the region has been considerably increasing, which reached around 20 percent of the total
herd in 2003 compared with a study result of almost 8 percent conducted by Kinh et aL
(2003) in 1998. However, raising cows with high HF blood percentage in the conditions
of poor infrastructure and hot climate has been facing some problems such as disease and
unexpected yields. Some other kinds of breed such as crossbreeds of Red Sindhi and
15/16 HF blood, and purebred HF cow have not been widely adopted by farmers. They
accounted for almost 2 percent of the total cow herd:
502 C. T. LOANet al
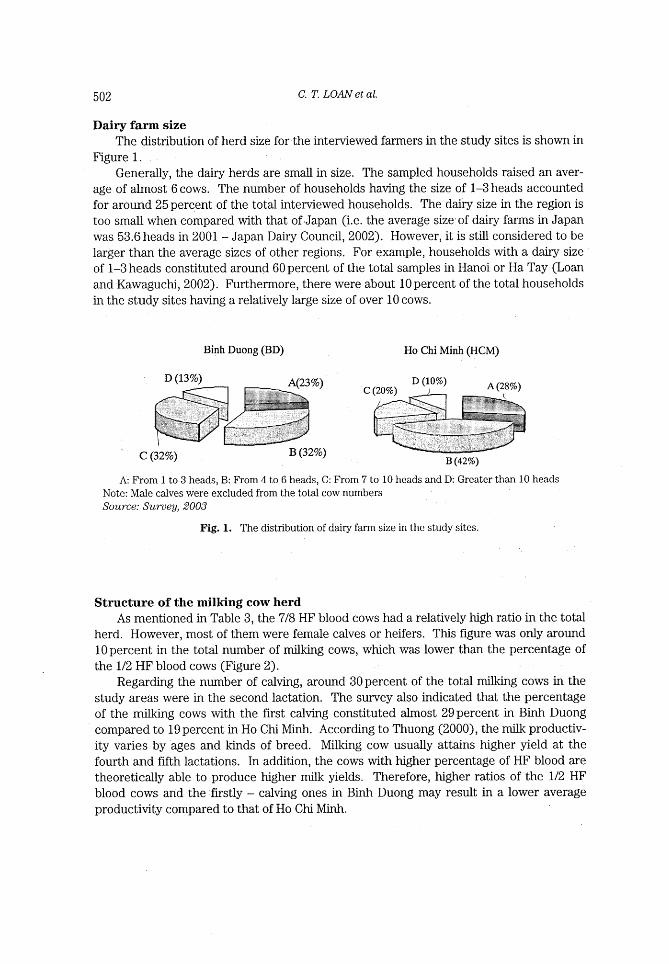
Dairy farm size The distribution of herd size for the interviewed fanners in the study sites is shown in
Figure I .
Generally, the dairy herds are small in size. The sampled households raised an aver-
age of almost 6 cows. The number of households having the size of 1-3 heads accounted
for around 25percent of the total interviewed households. The dairy size in the region is
too small when compared wlth that of・Japan (i.e. the average size'of dairy farms in Japan
was 53.6 heads in 2001 - Japan Dairy Council, 2002). However, it is still considered to be
larger than the average sizes of other regions. For example, households with a dairy size
of 1-3 heads constituted around 60 percent of the total samples in Hanoi or Ha Tay (Loan
and Kawaguchi, 2002). Furthermore, there were about 10 percent of the total households
in the study sites having a relatively large size of over 10 cows.
Binh Duong (BD) Ho Chi Minh (HCM)
D (13%) A(23 %) C (20%) D (10%) A (28%)
~~~***'*** ;'~~
C (32%) B (32%) B (42%) A: From I to 3 heads, B: From 4 to 6 heads, C: From 7 to 10 heads and D: Greater than 10 heads
Note: Male calves were excluded from the total cow numbers
Source: Survey, 2003
Fig. 1. The distribution of dairy farm size in the study sites.
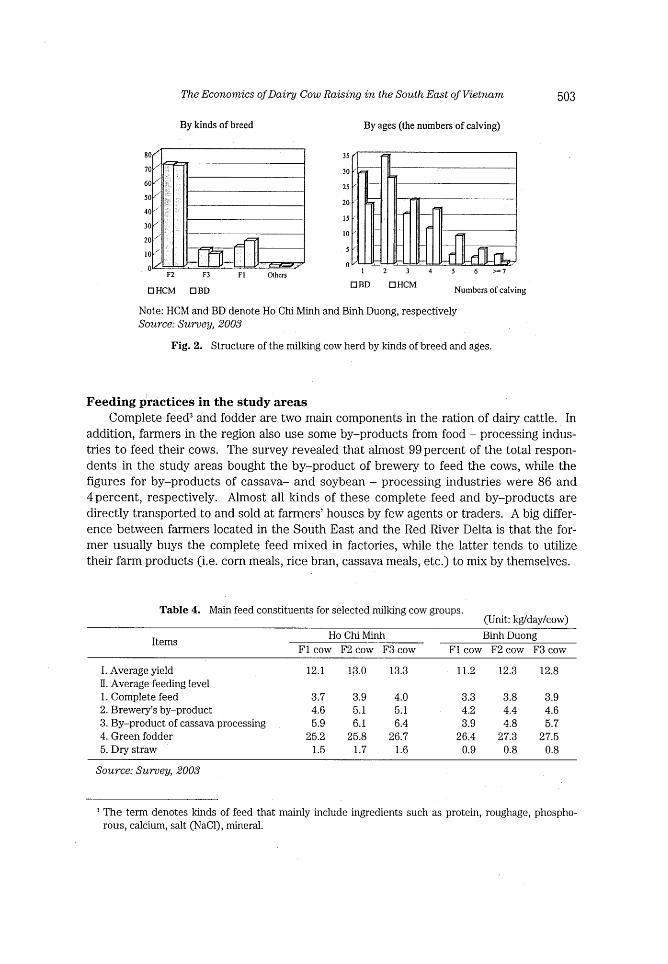
Structure of the Inilking cow herd As mentioned in Table 3, the 7/8 HF blood cows had a relatively high ratio in the total
herd. However, most of them were female calves or heifers. This figure was only around
10percent in the total number of milking cows, which was lower than the percentage of
the 1/2 HF blood cows (Figure 2).
Regarding the number of calving, around 30percent of the total nxilking cows in the
study areas were in the second lactation. The survey also indicated that the percentage
of the milking cows with the first calving constituted almost 29percent in Binh Duong
compared to 19 percent in Ho Chi Minh. According to Thuong (2000) , the tnilk productiv-
ity varies by ages and kinds of breed. Milking cow usually attains higher yield at the
fourth and fifth lactations. In addition, the cows with higher percentage of HF blood are
theoretically able to produce higher milk yields. Therefore, higher ratios of the 1/2 HF
blood cows and the firstly - calving ones in Binh Duong may result in a lower average
productivity compared to that of Ho Chi Minh.
The Economics ofDairy Cow Raising in the South East of Viet?zam 503
By kinds of breed By ages (the numbers of calving)
80 3s 70 > 30 60 25 50 20 40 15
30 lo
20
lo
o - >= 7 F2 F3 F I othe*s Cl HCM D BD D BD D HCM Numbers of calving
Note: HCM and BD denote Ho Chi Minh and Binh Duong, respectively
Source: Survey, 2003
Fig. 2. Structure of the milking cow herd by kinds of breed and ages.
Feeding practices in the study areas Complete feed3 and fodder are two main components in the ration of dairy cattle. In
addition, farmers in the region also use some by-products from food - processing indus-
tries to feed their cows. The survey revealed that almost 99percent of the total respon-
dents in the study areas bought the by-product of brewery to feed the cows, while the
figures for by-products of cassava- and soybean - processing industries were 86 and
4percent, respectively. Almost all kinds of these complete feed and by-products are
directly transported to and sold at farmers' houses by few agents or traders. A big differ-
ence between farmers located in the South East and the Red River Delta is that the for-
mer usually buys the complete feed mixed in factories, while the latter tends to utilize
their farm products (i.e. corn meals, rice bran, cassava meals, etc.) to mix by themselves.
Table 4 Mam feed constituents for selected nulking cow groups. (Unit: kg/day/cow)
Items Ho Chi Minh Binh Duong
F1 cow F2 cow F3 cow F1 cow F2 cow F3 cow
I . Average yield
ll. Average feeding level
1. Complete feed
2. Brewery's by-product
3. By-product of cassava processing
4. Green fodder
5. Dry straw
12.1 13.3 13.0
3.7
4.6
5.9
25.2
1.5
3.9
5.1
6.1
25.8
1.7
4.0
5. 1
6.4
26.7
1.6
11.2 12.8 12.3
3.3
4.2
3.9
26.4
0.9
3.8
4.4
4.8
27.3
0.8
3.9
4.6
5.7
27.5
0.8
Source: Survey, 2003
3 The term denotes kinds of feed that mainly include ingredients such as protein, roughage, phospho-
rous, calcium, salt (NaCl), mineral.
504 C. T. LOAN et al.
Regarding the level of feeding, dairy farmers in the study region commonly consider
the stages of lactation, the kinds of breed and the existing conditions of their cows to feed
them. Most respondents answered that they usually fed the complete feed to a cow according to her milk yield. For example: when a milking cow produces 10-12 kg of milk
per day, the farmers feed around 2.5-3.5kg of the complete feed. In addition, depending
on the number of cow's pregnant months in a milking cycle, they feed 0.5-1.5kg of the
complete feed more for fetal development. Some by-products of food-processing indus-
tries are used to substitute the complete feed. Table 4 illustrates the average quantity of
feed per day for selected cow groups in the milking period. Generally, the average feed-
ing level per day for a milking covf~ included 3.3-4.0 kg of the complete feed, 4.2-5.1 kg of
brewery's by-product and 3.9-6.4 kg of by-product of cassava processing, which varied by
kinds of breed and locations.
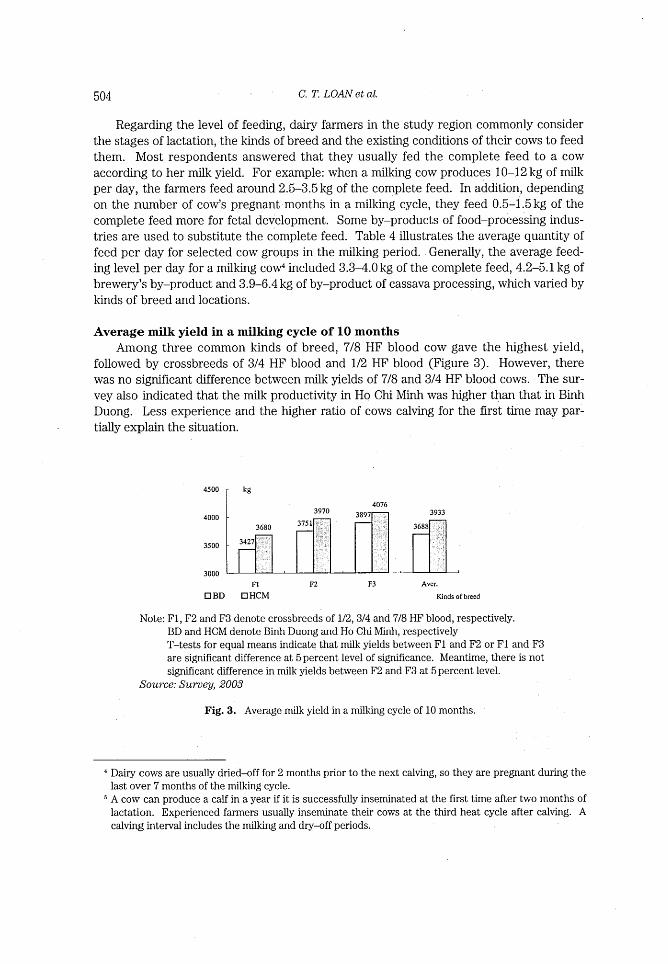
Average milk yield in a milking cycle of I O months
Among three common kinds of breed, 7/8 HF blood cow gave the highest yield,
followed by crossbreeds of 3/4 HF blood and 1/2 HF blood (Figure 3). However, there
was no significant difference between milk yields of 7/8 and 3/4 HF blood cows. The sur-
vey also indicated that the milk productivity in Ho Chi Minh was higher than that in Binh
Duong. Less experience and the higher ratio of cows calving for the first time may par-
tially explain the situation.
4500
4000
3500
3000
kg
3680 3751 3427 ~ ;
3970 3897 4076
3688
3933
P1
D BD EI HCM F2 F3 Aver.
Kinds of breed
Note: F1, F2 and F3 denote crossbreeds of 1/2, 3/4 and 7/8 HF blood, respectively.
BD and HCM denote Binh Duong and Ho Chi Minh, respectively
T-tests for equal means indicate that milk yields between F1 and F2 or F1 and F3
are significant difference at 5 percent level of significance. Meantime, there is not
significant difference in milk yields between F2 and F3 at 5 percent level.
Source: Survey, 2003
Fig. 3. Average milk yield in a milking cycle of 10 months.
' Dairy cows are usually dried-off for 2 months prior to the next calving, so they are pregnant during the
last over 7 months of the milking cycle.
5 A cow can produce a calf in a year if it is successfully inseminated at the first time after two months of
lactation. Experienced farmers usually inseminate their cows at the third heat cycle after calving. A
calving interval includes the milking and dr~~off periods.
The Economics ofDairy Cow Raising in the South East of Vietnam 505
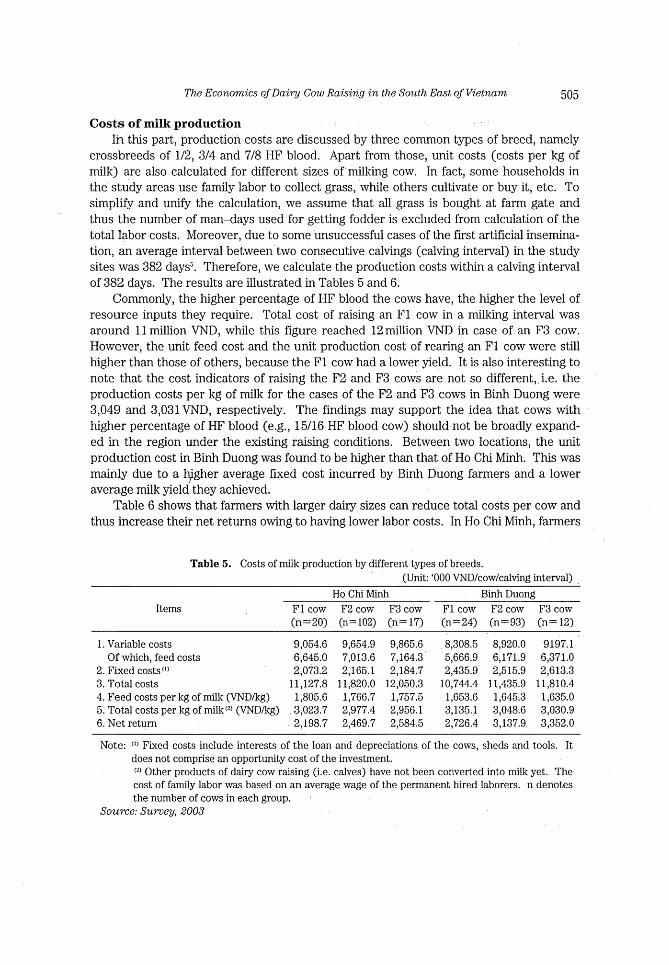
Costs of milk production lh this part, productioh costs are discussed by three common types of breed, namely
crossbreeds of 1/2, 3/4 and 7/8 HF blood. Apart from those, unit costs (costs per kg of
milk) are also calculated for different sizes of milking cow. In fact, some households in
the study areas use family labor to collect grass, while others cultivate or buy it, etc. To
simplify and unify the calculation, we assume that all grass is bought at farm gate and
thus the number of man-days used for getting fodder is excluded from calculation of the
total labor costs. Moreover, due to some unsucces~ful cases of the first artificial insemina-
tion, an average interval between two consecutive calvings (calving interval) in the study
sites was 382 days". Therefore, we calculate the production costs within a calving interval
of 382 days. The results are illustrated in Tables 5 and 6.
Commonly, the higher percentage of HF blood the cows have, the higher the level of
resource inputs they require. Total cost of raising an F1 cow in a milking interval was
around 1 1 million VND, while this figure reached 12million VND in case of an F3 cow.
However, the unit feed cost and the unit production cost of rearing an F1 cow were still
higher than, those of others, because the F1 cow had a lower yield. It is also interesting to
note that the cost indicators of raising the F2 and F3 cows are not so different,.i.e. the
production costs per kg of milk for the cases of the F2 and F3 cows in Binh Duong were
3,049 and 3,031 VND, respectively. The findings may support the idea that cows with
higher percentage of HF blood (e.g., 1 5/16 HF blood cow) should not be broadly expand-
ed in the region under the existing raising conditions. Between two locations, the unit
production cost in Binh Duong was found to be higher than that of Ho Chi Minh. This was
mainly due to a tygher average fixed cost incurred by Binh Duong farmers and a lower
average milk yield they achieved.
Table 6 shows that farmers wlth larger dairy sizes can reduce total costs per cow and
thus increase their net returns owing to having lower labor costs. In Ho Chi Minh, fanners
Table 5. Costs of milk production by different types of breeds.
(Unit: 'OOO VND/cow/calving interval)
Ho Chi Minh Binh Duong
Items F1 cow F2 cow F3 cow F1 cow F2 cow F3 cow (n=20) (n=102) (n=17) (n=24) (n=93) (n=12)
1. Variable costs
Of which, feed costs
2. Fixed costs (1)
3. Total costs
4. Feed costs per kg of milk (VND/kg)
5. Total costs per kg of milk(2) (VND/kg)
6. Net return
9,054.6
6,645.0
2,073.2
1 1 ,127.8
1 ,805.6
. 3,023.7
2,198.7
9,654.9
7,013.6
2,165.1
1 1 ,820.0
1,766.7
2,977.4
2,469.7
9,865.6
7,164.3
2,184.7
12,050.3
1,757.5
2,956.1
2,584.5
8,308.5
5,666.9
2,435.9
10,744.4
1,653.6
3,135.l
2,726.4
8,920.0
6,171.9
2,515.9
1 1 ,435.9
1 ,645.3
3,048.6
3,137.9=
9197.1
6,371.0
2,613.3
1 1 ,810.4
l ,635.0
3,030.9
3,352.0
Note: (1) Fixed costs include interests of the loan and depreciations of the cows, sheds and tools. It
does not comprise an opportunity cost of the investment.
(2) Other products of dairy cow raising (i.e, calves) have not been converted into milk yet. The
cost of family labor was based on an average wage of the permanent hired laborers. n denotes
the number of cows in each group.
Source: Survey, 2003

506 C. T. LO~ret al.
Table 6. Costs of milk production by different sizes of milking cows.
(Unit: 'OOO VND/cow/calving interval)
Ho Chi Minh Binh Duong
Items 1-2 cowS 3~~ COwS 5-7 cowS 1-2 cowS 3~ COWS 5-7 cowS (n = 14) (n = 16) (n= 8) (n= 1 7) Cn= 16) (n = 5)
1. Variable costs
Of which: -Feed costs
-Labor costs
2. Fixed costs (1)
3. Total costs
4. Feed costs per kg of milk (VND/lcg)
5. Total costs per kg of milk(-") (VND/kg)
6. Net returns
10 274.2
6,551.5
2 611.9
2 210.8
12,485.0
1,710.4
3 259.4
1,143.5
9,739.3
6,922.4
1 ,766.9
2,238.4
1 1 ,977.7
1 ,769.9
3,062.3
1 ,729. 1
9,285.0
7,099.9
1,337.7
2,046.2
11,331.2
1,780.8
2,842.1
3,249.5
9,569.1
5,926.6
2,658.9
2,733. 1
12,302.2
1 ,644.6
3,413.8
2003.4
8,766.3
6,065.8
1,770.5
2,390.9
1 1 , 157.2
1,652.4
3,039.3
3,018.9
8,354.5
6,082.1
1,490.4
2,452.4
10,806.9
1,638.6
2,911.6
3,791.1
Note: (1) Fixed costs include interests of the loan and depreciations of the cows, sheds and tools. It
does not comprise an opportunity cost of the investment.
(2) Other products of dairy cow raising (i.e. calves) have not been converted into milk yet. The
cost of family labor was based on an average wage of the perrnanent hired laborers, n denotes
the number of households in a group. Four households (2 for each location) having over 7
milking cows were not considered here because of their small samples.
Source: Survey, 2003
wlth a size of 5-7 heads had an average net return of almost 3.3 million VND, which was
almost 2 million VND higher than that of farmers with 1-2 heads. This difference was
mainly because the former had about I .3 million VND of labor cost lower. The reason may
be that most of the activities in dairy farming such as cleaning the sheds and cows,
feeding and getting grass are done everyday in a year. Therefore, farmers can decrease
considerably man-days per cow when their dairy sizes become bigger. Meanwhile, the
relation of inverse proportion between feeding costs and dairy size was not observed in
the study sites. Generally speaking, feed costs per kg of milk in the same location were
not so different according to the range of dairy sizes considered. The findings suggest
that in the conditions of abundant family labor and limited capital, farmers still may bene-
fit from raising a small number of cows. However, farmers with hired labor will achieve
higher net returns if they increase their dairy sizes.
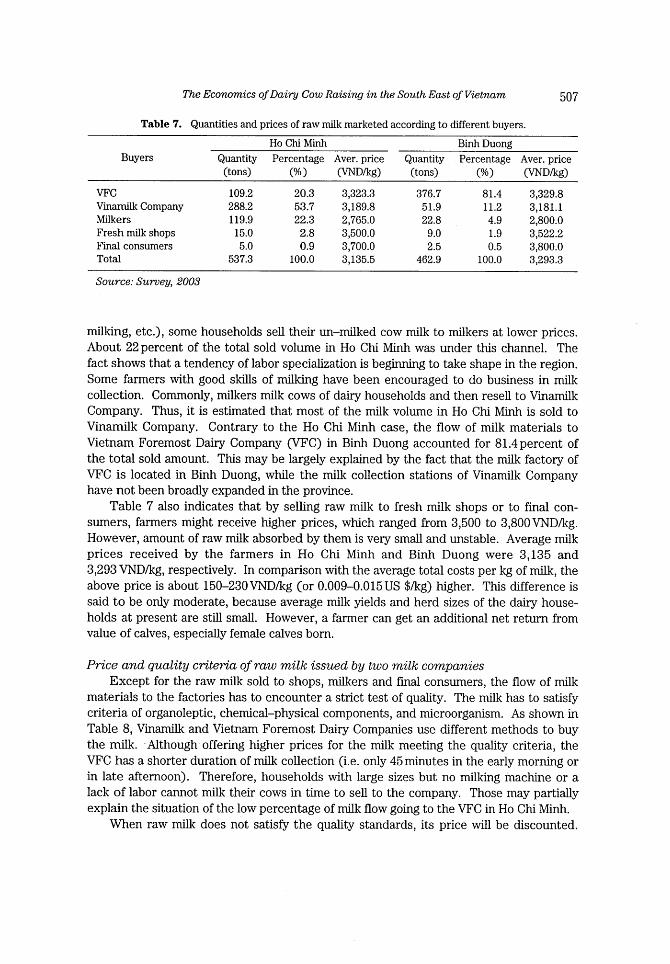
Marketing of raw milk Qua7btities on2;d prices of raw milk marketed
About 3.1 and 3.5percent of the total milk output was used for home and intermedi-
ate consumption in Ho Chi Minh and Binh Duong, respectively. The remainirlg amount
was sold to different buyers" (Table 7). The main flow of raw miik in Ho Chi Minh was
from farmers to Vinamilk Company, which accounted for 53.7percent of the total sold
volume. Due to different reasons (i.e. a lack of farnily labors, unskilfulness of farmers in
6 In addition to the milk collection stations belonging two milk-processing factories, there are few others
built and managed by individuals. However, the check of milk quallty and the level of buying price at
these stations are mostly conducted and decided by Vinamilk Company or based on its criteria. Moreover, all volume of the milk collected there is also sold to Vinamilk. Thus, we suppose that there is
no difference between milk flows from the farmers going to those stations and to the company.
The Economics ofDairy Cow Raising in the South East of Vietuam 507
Table 7. Quantities and prices of raw milk marketed according to different buyers.
Ho Chi Minh Binh Duong B uye rs Quantity Percentage Aver. price Quantity Percentage Aver. price
(tons) (o/o ) (VND/kg) (tons) (olo ) (VND/kg)
VFC Vinamilk Company Milkers
Fresh milk shops
Final consumers
Total
109.2
288.2
1 19.9
15.0
5.0
537.3
20.3 53 . 7
22.3
2.8
0.9
100.0
3,323.3
3,189.8
2,765.0
3,500.0
3,700.0
3,135.5
376.7
51.9
22.8
9.0
2.5
462.9
81.4
11.2
4.9
1.9
0.5
100.0
3,329.8
3,181.1
2,800.0
3,522.2
3,800.0
3,293.3
Source: Survey, 2003
milking, etc.), some households sell their un-milked cow milk to milkers at lower prices.
About 22 percent of the total sold volume in Ho Chi Minh was under this channel. The
fact shows that a tendency of labor specialization is beginning to take shape in the region.
Some farmers with good skills of milking have been encouraged to do business in milk
collection. Conunonly, milkers milk cows of dairy households and then resell to Vinamilk
Company. Thus, it is estimated that most of the milk volume in Ho Chi Minh is sold to
Vinamilk Company. Contrary to the Ho Chi Minh case, the flow of milk materials to
Vietnam Foremost Dairy Company (VFC) in Binh Duong accounted for 81.4percent of the total sold amount. This may be largely explained by the fact that the milk factory of
VFC is located in Binh Duong, while the milk collection stations of Vinamilk Company
have not been broadly expanded in the province.
Table 7 also indicates that by selling raw milk to fresh milk shops or to final con-
sumers, farmers might receive higher prices, which ranged from 3,500 to 3,800VND/kg.
However, amount of raw milk absorbed by them is very small and unstable. Average milk
prices received by the farmers in Ho Chi Minh and Binh Duong were 3,135 and 3,293 VND/kg, respectively. In comparison wlth the average total costs per kg of milk, the
above price is about 150-230VND/kg (or 0.009-0.015US $/kg) higher. This difference is
said to be only moderate, because average milk yields and herd sizes of the dairy house-
holds at present are still small. However, a farmer can get an additional net return from
value of calves, especially female calves born.
price a7~d quality criteria of raw milk issued by two milk compa?~ies
Except for the raw milk sold to shops, milkers and rmal consumers, the flow of milk
materials to the factories has to encounter a strict test of quality. The milk has to satisfy
criteria of organoleptic, chemical-physical components, and microorganism. As shown in
Table 8, Vinamilk and Vietnam Foremost Dairy Companies use different methods to buy
the milk. Although offering higher prices for the milk meeting the quality criteria, the
VFC has a shorter duration of milk collection (i.e. only 45 minutes in the early morning or
in late afternoon). Therefore, households with large sizes but no milking inachine or a
lack of labor cannot milk their cows in time to sell to the company. Those may partially
explain the situation of the low percentage of I~lk flow going to the VFC in Ho Chi Minh.
When raw milk does not satisfy the quality standards, its price will be discounted.

508 C. T. LO~ret al.
Table 8. Main information related to milk procurement of two milk comphnies.-
Items Unit Vinarnilk VFC
1. A number of times the milk are collected in a day
2. Duration of milk collection within a day
3. Duration of payment and taking a sample
4. Maxirnum prices at the collection stations
5. Major criteria of milk quality to decide the maxirnum prices
-Number of micro~)rganism
-Fat content
-Total solids
6. Methods are used to discount price when milk does not Ineet the criteria
times
minutes
days
VND
olo
olo
2
240 7
3. ,200.
~4 ~3.5 ~ 12.0
ranges
2
90 14
3,350
~4 ~3.5 ~ 12.2
points
Note: The number of micro-organism is determined by the time methylen blue decolors in the case of
Vinamilk (hours) and by Resazurin test in the case of VFC (grade). Both tests are based on the
ability of bacteria in the milk to reduce the color of the blue dye.
Source: Survey, 2003
The discounting methods used by two companies are different. Vinamilk discounts the
price of unsatisfied milk according to ranges of quality figures, while discount prices of
VFC are based on specific points. For example: if fat content of the milk ranges from 3.3
to 3.5percent, the level of discounted price issued by Vinarnilk will be 50VND/kg (other
criteria are still met). Similarly, when total solids range from 1 1.7 to 12percent, the dis-
counted level is 50VND/kg. Meantime, each lower 0.1 percentage of fat content or of total
solids compared to the standards will be discounted 40 or 50VNDlkg, respectively in the
case of VFC.
Profitabflity of Inilk production
Table 9 indicates that farmers can get relatively reasonable benefits from raising
cows. With an average size of 3.5milking cows, dairy households in Ho Chi Minh could
receive around 2.4million VND of net return per milking cow within a calving interval of
382 days if all fodder was to be bought. The figure was found to be 3 million VND for the
case of Binh Duong farmers who raised an average of 3.2 milking cows. However, most, of
the fanners in the study region use their family labor to cultivate or/and collect grass, so
their actual benefits are still higher. If family labor costs are added to net returns in the
real production situations (case 2), the indicators becorne 5.1 and 5.7million VND in Ho
Chi Minh and Binh Duong, respectively.
As compared to rice cultivation, the net return from raising a milking cow at a calving
interval of 382 days is equivaient to that of cultivating one hectare of rice in a season
(Table I O) . Evidences of the analysis show that ratios of net return and costs (e.g., vari-
able cost and fainily labor) frorn dairy production are lower than those of rice production
for both locations. However, it does not mean that rice cultivation is more pronxising than
dairy production. On the contrary, dairy farming has been attracting the 'fhigh class"
farmers due to its advantages: (1) generating regularly a high flow of cash for raisers, (2)
transforrning quickly the available resources of households such as on-farm products and
fainjly labor power into cash, and (3) creating great opportunities of employment. In fact,

The Economics ofDairy Cow Raising in the South East of Vietnam 509
Table 9. Economics of raising a milking cow.
(Unit: 'OOO VND/cow/calving interval)
Items Ho Chi Minh Binh Duong
Case 1 Case 2 Case 1 Case 2
1.
2.
3.
4.
5.
6.
7.
Gross revenue Total variable costs
Of which: -Feed costs
-Family labor cost
Gross margin Total fixed costs a)
Total costs
Net return
Net return to family labor (NRL)
14,164.8
9,581.9
6,966.7
1,614.0
4,582.9
2,148.2 1 1 , 730. 1
2,434.8
4,048.7
14,164.8
9,099.3
5,777.4
2,289.8
5,065.5
2,228.7
1 1 ,328.0
2,836.8
5,126.6
14,367.4
8,801.7
6,070.6
1,636.2
5,565.7
2,507.8
1 1 ,309.5
3,057.9
4,694.1
14,367.4
8,286.8
4,757.8
2,277.7
6,080.6
2,623.7
10,910.5
3,456.9
5,734.6
Note: Case I is based on an assumption that all green grass is bought at household gate and thus labors
used to get them are excluded.
Case 2 is a real situation of households (some of households cultivate green grass, while others
collect or buy, etc.). Price of the cultivated fodder is based on unit cost of grass production.
(1) Fixed costs include interests of the loan and depreciations of the cows, sheds and tools. It
does not comprise an opportunity cost of the investment.
Source: Survey, 2003
Table lO. Comparison on return from rice and dairy in the study areas.
Ho Chi Minh Binh Duong
Items Unit Dairy WS
rice
SA rice
Dairy WS rice
SA rice
1. Family labors employed
in an interval (a season)
2. Net return
3. Net return/variable cost
4. Net return/family labor
5. NRL/variable cost
man~iay/interval
(man-day/season) 1 OOO VND
VND 1 OOOVND/manday
VND
118
2,837
0.31
24.4
0.56
58
3,127
0.64 53 . 9
0.88
61
2,911
0.59
47.7
0.84
114
3,457
0.42
30.3
0.69
54
3,038
0.65
55.9
0.88
66
2,719
0.56
41.4
0.83
Note: Above data were calculated for one milking cow within a calving interval (the case of dairy cow
production) or for one hectare of rice in a season (the case of rice cultivation). WS and SA
denote winter-spring and summer-autumn (rice), respectively.
Source: Survey, 2003
there were 7 households (or 8.8percent of the total surveyed households) in the study
sites fallowing a total of 3.5 hectares of rice land areas. About 71 percent of those areas
were treated as places they could go to cut natural grass, while the remainder was fal-
lowed without the purpose of grass collection.
Constraints on dairy farming in the study areas As mentioned above, benefit of dairy production was not so small but there were still
41.2 percent of the total intelviewed households not choosing to expand their dairy farrn-
ing in following years. In response to the question about the main constraints of milk pro-
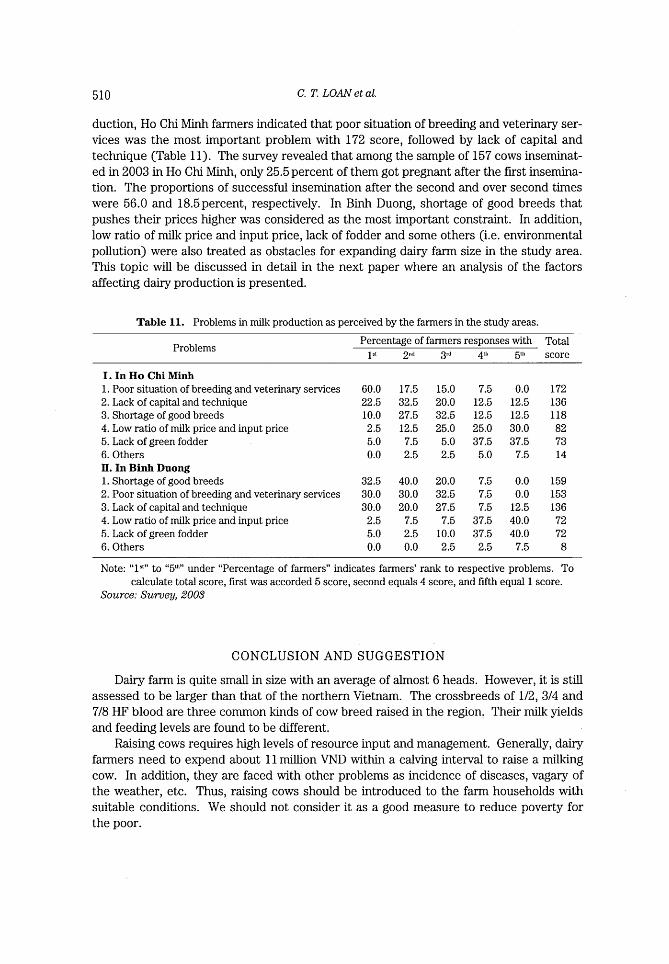
510 C. T. LOANet al.
duction, Ho Chi Minh farmers indicated that poor situation of breeding and veterinary ser-
vices was the most important problem wlth 172 score, followed by lack of capital and
technique (Table 1 1). The survey revealed that among the sample of 157 cows inseminat-
ed in 2003 in Ho Chi Minh, only 25.5 percent of them got pregnant after the first insemina-
tion. The proportions of successful insemination after the second and over second times
were 56.0 and 18.5percent, respectively. In Binh Duong, shortage of good breeds that
pushes their prices higher was considered as the most important constraint. In addition,
low ratio of milk price and input price, Iack of fodder and some others (i.e. environrnental
pollution) were also treated as obstacles for expanding dairy farm size in the study area.
This topic will be discussed in detail in the next paper where an analysis of the factors
affecting dairy production is presented.
Table 1 1. Problems in milk production as perceived by the fanners in the study areas.
Problems Percentage of farrners responses with Total
1=* 2,*d score 4th 3 ,d 5th
I. In Ho Chi Minh 1. Poor situation of breeding and veterinary services
2. Lack of capitai and technique
3. Shortage of good breeds
4. Low ratio of milk price and input price
5. Lack of green fodder
6. Others
II. In Binll Duong
1. Shortage of good breeds
2. Poor situation of breeding and veterinary servlces
3. Lack of capitai and technique
4. Low ratio of milk price and input price
5. Lack of green fodder
6. Others
60.0
22.5
10.0
2.5
5.0
0.0
32.5
30.0
30.0
2.5
5.0
0.0
17.5
32.5
27.5
12.5
7.5
2.5
40.0
30.0
20.0
7.5
2.5
0.0
15.0
20.0
32.5
25.0
5.0
2.5
20.0
32.5
27.5
7.5
10.0
2.5
7.5
12.5
12.5
25.0
37.5
5.0
7.5
7.5
7.5
37.5
37.5
2.5
0.0
12.5
12.5
30.0
37.5
7.5
0.0
0.0
12.5
40.0
40.0
7.5
1 72
136
118
82
73
14
159
153
136
72
72
8
Note"'Ist" to 5 under "Percentage of farmers" indicates farmers' rank to respective problems. To . '' *h" calculate total score, first was accorded 5 score, second equals 4 score, and rrfth equal I score.
Source: Survey, 2003
CONCLUSION AND SUGGESTION Dairy fam is quite small in size with an average of almost 6 heads. However, it is still
assessed to be larger than that of the northern Vietnam. The crossbreeds of 1/2, 3/4 and
7/8 HF blood are three conunon kinds of cow breed raised in the region. Their milk yields
and feeding levels are found to be different.
Raising cows requires high levels of resource input and management. Generally, dairy
farmers need to expend about 1 1 million VND within a calving interval to raise a milking
cow. In addition, they are faced with other problems as incidence of diseases, vagary of
the weather, etc. Thus, raising cows should be introduced to the falTn households with
suitable conditions. We should not consider it as a good measure to reduce poverty for
the poor.
The Economics ofDairy Cow Raising i7h the South East of Vietnam 511
The unit production costs and the net returns of raising a 3/4 HF blood cow and a 7/8
HF blood cow are not so different. The findings may support the idea that cows with
higher percentage of HF blood (e.g. 15/16 HF blood cow) should not be broadly expanded
in the region under the existing raising conditions. In the case of poorer raising skills and
limited capital, dairy farmers are advised to choose cows having lower percentage of HF
blood in crossbred (i.e. F1 1/2 of HF blood cow). They may still generate moderate net
returns.
Farmers with larger sizes may enjoy lower labor costs. However, the ratio of feed
costs and milk output is not significantly different by the range of dairy sizes considered.
The results suggest that in the conditions of abundant family labor and linxited capital,
farmers can still benefit from raising a small number of dairy cows. Nevertheless, farmers
with hired labor should have larger sizes of cow herd to achieve high net returns.
The farmers can benefit from raising cows with an average net return of almost
3 million VND per milking cow. However, the difference between the average milk price
the farmer received and the average total costs per kg of milk is only moderate (i.e.
around 150-230VND/kg of milk). Therefore, a difference in the net return among dairy
farmers also depends highly on the sex of calves born. Moreover, the price of raw milk is
pre-determined by buyers, so the best way to get higher net return is to diminish the
total costs per kg of milk.
The tendency of labor specialization is beginning to form its shape in the region.
Some farmers with good skills of milking have done business in collecting milk.
Meanwhile, some others have been encouraged to do input services such as fodder, feed
and veterinary, etc. In addition, dairy farming can create large opportunities of employ-
ment for rural labor (i.e. almost 120 man-days are utilized in a calving interval of 382 days
to raise a milking cow). Therefore, dairy production contributes considerably to restruc-
turing agriculture and rural labor. In other words, it may be considered as an attractive
occupation to change agricultural and rural restructures.
Poor situation of breeding and veterinary services, shortage of good breeds, Iow ratio
of milk price and feed price, Iack of capital, technique and fodder are the main constraints
for the expansion of dairy farming. Thus, to develop cow herd in the region, it is neces-
sary to solve these obstacles.
REFERENCES Anh, T. K. 2003 Some Incentive Policies for Development of Animal Sub-sector and Orientation of the
Development in Future in http://w~~v.vcn.vnn.vn/hoatdong/ hd_2003/hd_20_6_2003_3.htm
Chantalakhana, C. and P. Skunmun 2001 Dairy Development in Thailand and a Case Study on Environmental Impacts of Peri-urban Dairy Colonies Part I. Smallholder Dairy Development in http ://wllrw.ssdairy.org/Programme/htntl/chl2.htm
General Statistical Office 2000 Statistical Data of Vietnam SocioH~conomy 1975~OOO. Statistical
Publishing House, Hanoi
General Statistical Office 2002 Statistical Data on Population, Ec07tomic aud Social Sector of Vietnam
1975~001 . Statistical Publishing House, Hanoi
Hien, N. T. M. 2003 An Economics Study of Rice Production in the Mekong Delta, Vietnam. (Doctor Thesis), Graduate School of Bioresource and Environmental Sciences, Kyushu University
Japan Dairy Council Japan 2002 Dairy Farming for Yesterday, Today and Tomorrow in htt p ://j dc.lin.go j p/eng/eng02.htm
Kinh, V. K. et al. 2003 Feeding HF cows in Ho Chi Minh and its Vicinity. Journal of Technical aud

512 C. T. LO~Net al.
Scient~fic Information ofAnimal Husbaudry, 4: 4-15 Lich, L. B and D. K. Tuyen 2002 Report on Situation and Direction of Dairy Development in Vietnam
from 2002 to 2010. Paper was presented at Workshop on National Dairy Raising, Ho Chi Minh city,
January 3.* 2002
Loan, C. T. and T. Kawaguchi 2002 A Comparative Study on the Courses of Development of Dairy Industry in Vietnam and Thailaud in Economic Ewoironment of Internationally Globalized Region (Provisional Book Title) . Kyushu University Press, Japan (in Japanese)
Luong, N. H. 2003 Situation of Dairy Production in Vietnam. Journal of Technical aud Scientzfic
Information ofAnimal Husbaudry, 4: 16-17 MARD (Ministry of Agriculture and Rural Development) 2002 Dairy Cattle Production in Vietnam and
Development Plan for 2002-2010. Paper was presel~ted at Workshop on National Dairy Raising
in Ho Chi Minh city (Vietuam), January 3."
Thuong, N. V. 2000 Techeeique of Cow Raising at Farm Household Level. Agricultural Publisher,
Hanoi. (in Vietnamese)
Van, H. 2002 Development of Cow Herd in the Southem Vietnam. Newspaper ofSai Gon Economy, January 25,~
Vang, V. D. 1998 Some Research Results and Advanced Technologies Could Be Transferred to Mass
Production. Journal ofMarket aud Price, 1(March): 181-189.