Embed Size (px)
Citation preview
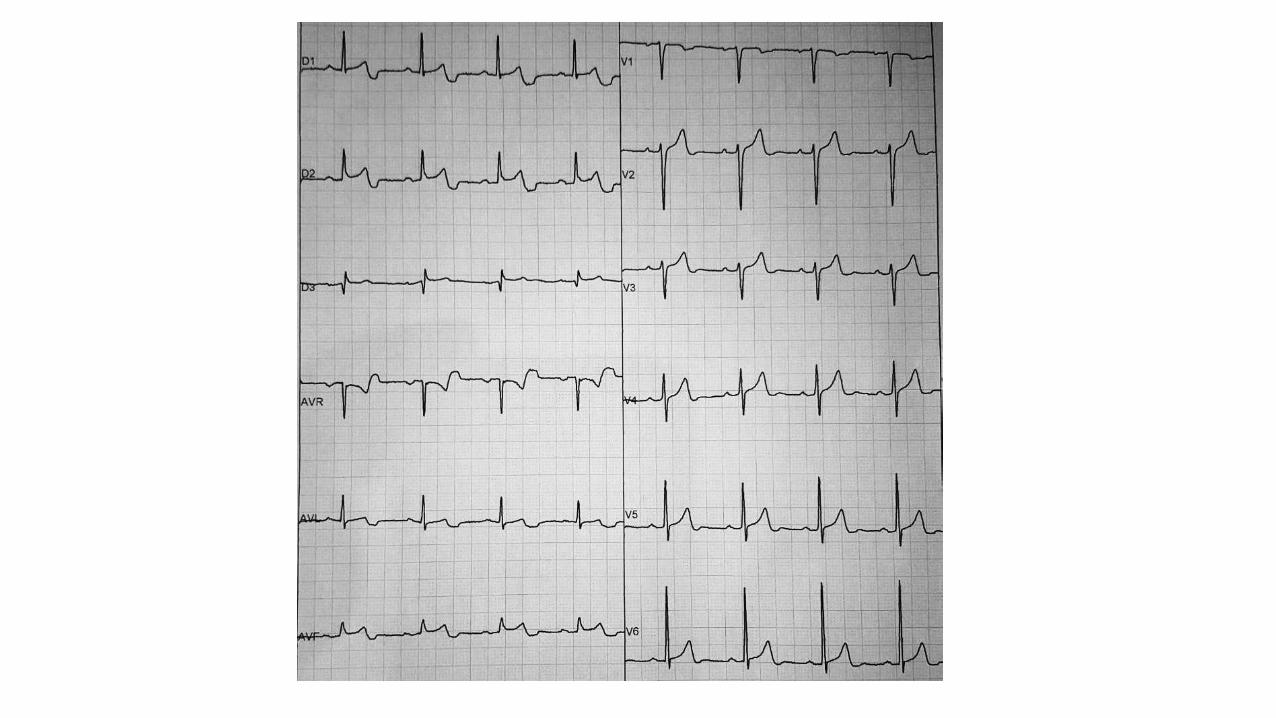
The electrocardiogram of impossible diagnosis: Diffuse biphasic up-down T-wave José Cláudio Lupi Kruse M.D.
Porto Alegre, Rio Grande do Sul Brazil.... Tchê
PortuguêsEste ECG pertence a um homem de media idade, assintomático, hipertenso bem controlado. Foi repetidovárias vezes e sempre manteve o mesmo padrão.Temos certeza que não se trata de eletrodo mal colocado, ou frouxo.Ecocardiograma: normal.
Pergunta:Como explicar a onda T bifásica "plus-minus" registrada difusamente?
EnglishThis ECG belongs to a middle aged man, asymptomatic, hypertensive well controlled. It was repeated severaltimes and always kept the same ECG pattern.We are sure that it is not electrode misplaced, or loose.Echocardiogram: normal.
Question:How to explain the biphasic "plus-minus" or up-down T-waves diffusely registered?
José Cláudio Lupi Kruse M.D.
IIIII
aVF
X I
Y
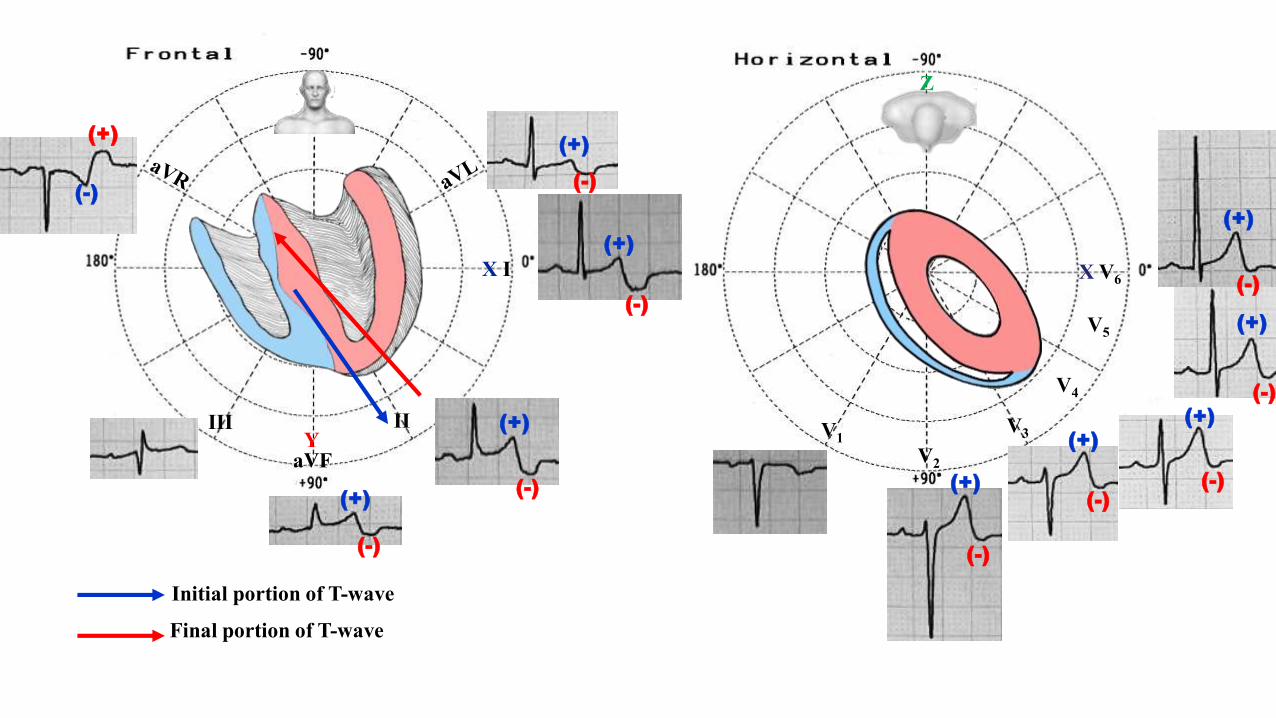
Initial portion of T-wave
Final portion of T-wave
X V6
V1
V4
V5
V2
V3
Z
(-)
(+)
(+)
(+)
(+)
(+)
(+)
(+)
(+)
(+)
(+)
(-)
(-)
(-)
(-)
(-)
(-)(-)
(-)
(-)
Colleagues opinions
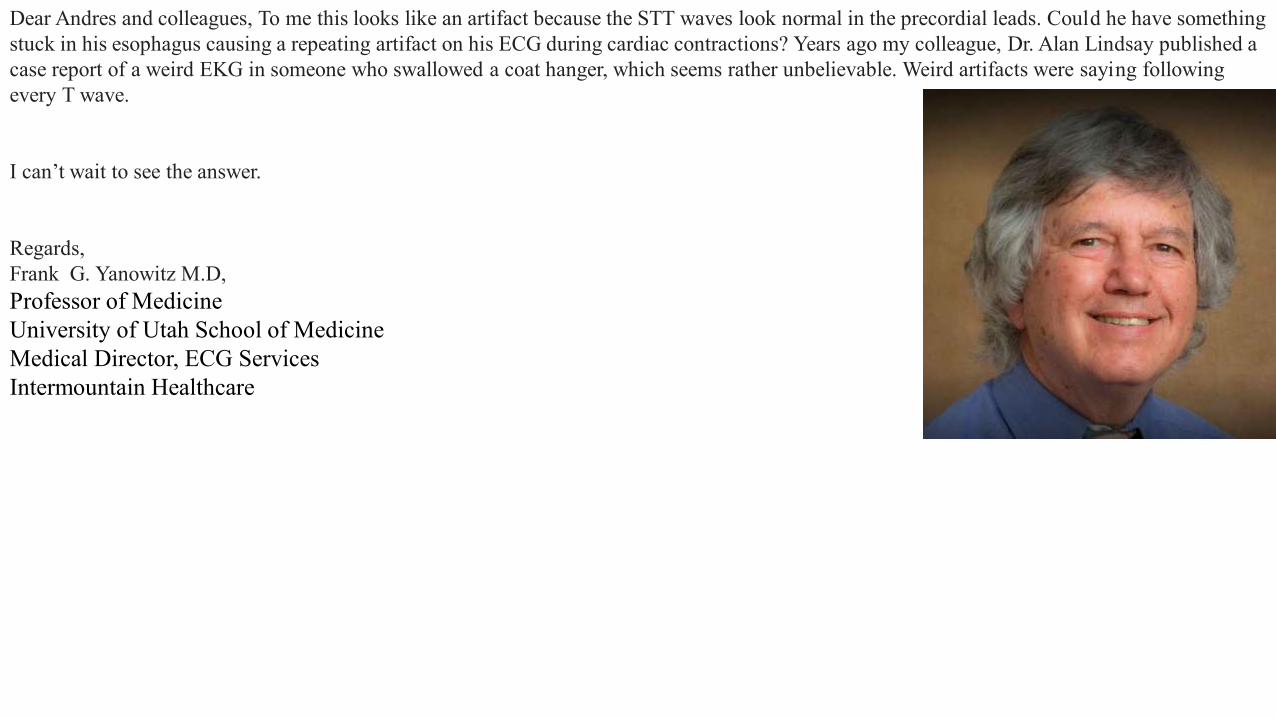
Dear Andres and colleagues, To me this looks like an artifact because the STT waves look normal in the precordial leads. Could he have something stuck in his esophagus causing a repeating artifact on his ECG during cardiac contractions? Years ago my colleague, Dr. Alan Lindsay published a case report of a weird EKG in someone who swallowed a coat hanger, which seems rather unbelievable. Weird artifacts were saying following every T wave.
I can’t wait to see the answer.
Regards,Frank G. Yanowitz M.D,Professor of MedicineUniversity of Utah School of MedicineMedical Director, ECG ServicesIntermountain Healthcare
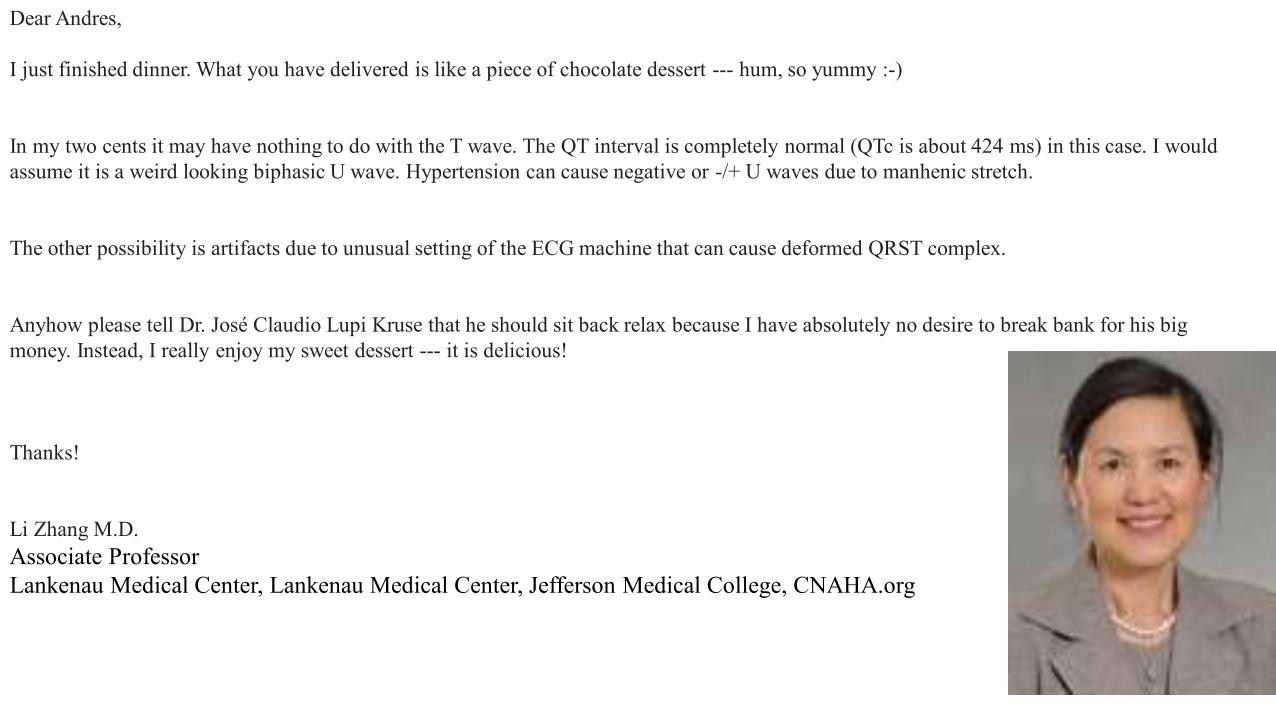
Dear Andres,
I just finished dinner. What you have delivered is like a piece of chocolate dessert --- hum, so yummy :-)
In my two cents it may have nothing to do with the T wave. The QT interval is completely normal (QTc is about 424 ms) in this case. I would assume it is a weird looking biphasic U wave. Hypertension can cause negative or -/+ U waves due to manhenic stretch.
The other possibility is artifacts due to unusual setting of the ECG machine that can cause deformed QRST complex.
Anyhow please tell Dr. José Claudio Lupi Kruse that he should sit back relax because I have absolutely no desire to break bank for his big money. Instead, I really enjoy my sweet dessert --- it is delicious!
Thanks!
Li Zhang M.D.Associate ProfessorLankenau Medical Center, Lankenau Medical Center, Jefferson Medical College, CNAHA.org
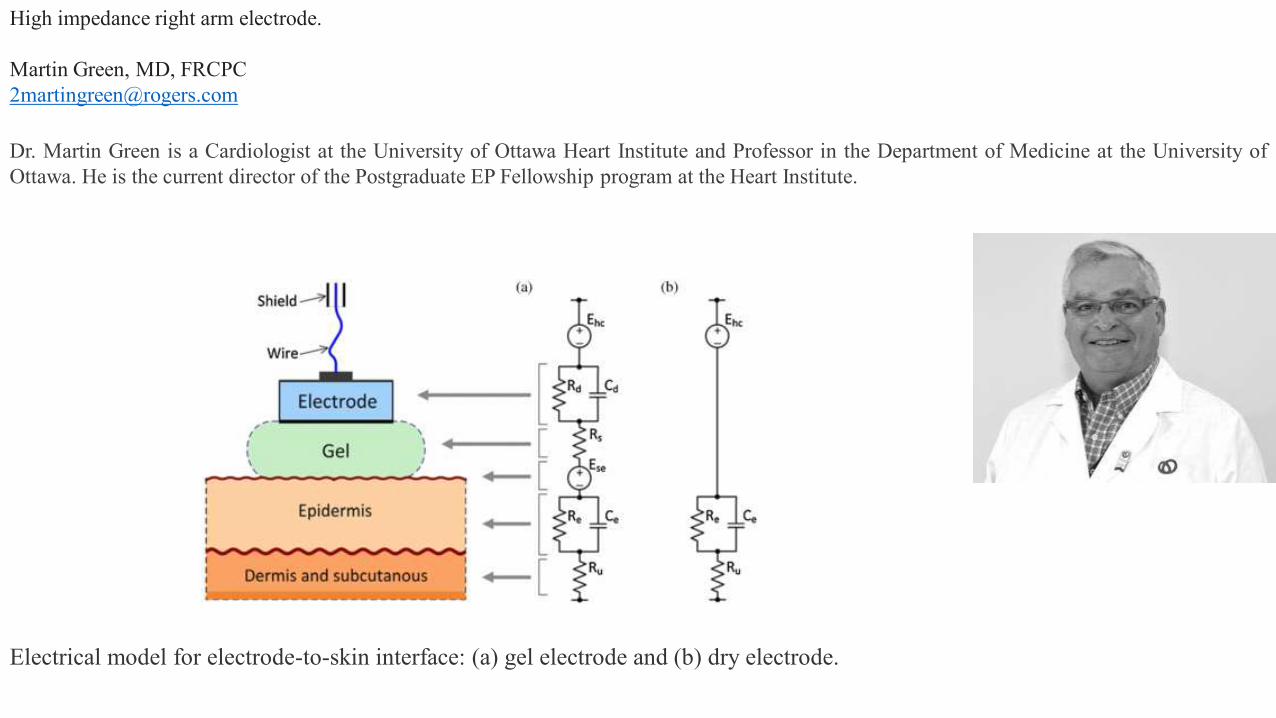
High impedance right arm electrode.
Martin Green, MD, [email protected]
Dr. Martin Green is a Cardiologist at the University of Ottawa Heart Institute and Professor in the Department of Medicine at the University ofOttawa. He is the current director of the Postgraduate EP Fellowship program at the Heart Institute.
Electrical model for electrode-to-skin interface: (a) gel electrode and (b) dry electrode.
Atrial T waveCheers,
Augusto H Uchida M.D. Ph.D
He holds a medical degree from the University of São Paulo (1994). Residency in Clinical Medicine byHCFMUSP and Cardiology by Incor-HCFMUSP. He was Preceptor of InCor Residents. He is currently anassistant physician at InCor - HCFMUSP. He is PhD from USP. He has experience in Medicine, with emphasis inCardiology, working mainly in the following subjects: myocardial ischemia, coronary disease, nuclearcardiology, sports cardiology, exercise test and electrocardiogram.
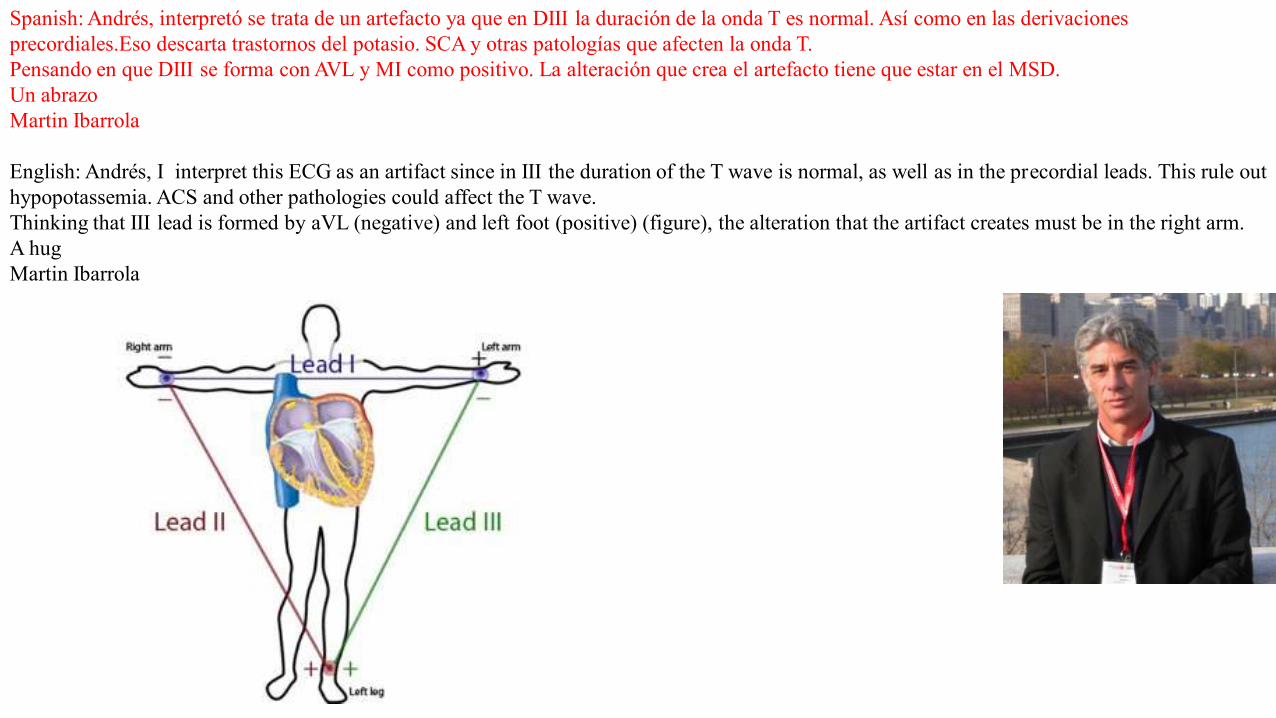
Spanish: Andrés, interpretó se trata de un artefacto ya que en DIII la duración de la onda T es normal. Así como en las derivacionesprecordiales.Eso descarta trastornos del potasio. SCA y otras patologías que afecten la onda T.Pensando en que DIII se forma con AVL y MI como positivo. La alteración que crea el artefacto tiene que estar en el MSD.Un abrazoMartin Ibarrola
English: Andrés, I interpret this ECG as an artifact since in III the duration of the T wave is normal, as well as in the precordial leads. This rule out hypopotassemia. ACS and other pathologies could affect the T wave.Thinking that III lead is formed by aVL (negative) and left foot (positive) (figure), the alteration that the artifact creates must be in the right arm.A hugMartin Ibarrola
The T wave changes do not seem to be of electrical origin. I think they are mechanical at the time of isovolumetric relaxation. One possibility isexcessive motion of the heart like it occurs in pericardial agenesis.I look forward to learn the correct answer from Dr. Kruse.
Mario D. Gonzalez

Hola:Es muy probable que sea el ECG de un animal.Saludos
Hi,It is probably that this ECG belongs to an animal.
Eduardo Quiñones, MDCórdoba, Argentina
Dear colleagues,This is indeed a puzzling ECG.I am concerned by the very sharp jonction between the end of the "T wave" and the isoelectric line.In addition, the baseline between end of T and P wave looks too flat.I would suspect an artefact related to signal processing (high pass or baseline correction) rather than a real electrophysiologic signal.I would be very interested in knowing the answerBest regards,Fabrice ExtramianaUniv Paris Diderot, Sorbonne Paris Cité - Bichat Hospital, 75018 Paris, France. Electronic address: [email protected].
Hello. This is a strange ECG change with “biphasic” T waves. Always when there are “strange” changes in all the extremity leads, except in lead III, I suspect some kind of technical error. It is stated that there is no misplacement of the leads or loose leads. Probably then, there is something wrong with the ECG machine. Anyhow, I would not consider this as a clinically relevant change.
Because there is an offer of 1M$ for correct answer, it is most probable that my explanation is wrong!
best regards
Kjell Nikus MD PhD Tampere University Hospital (TAUH), Tampere Finland
Dear Dr Pérez-Riera,The late negativity in the T-waves, predominantly in the extremity leads looks like a mechanical artefact related to a pulsating structuresynchronously with the heart action, such as a peripheral artery.Where can I send my account number?😂Another possibility: This ECG is difficult to interpret and is made all the more so by the patient's apparently benign medical history. I believe thatan important aspect of the ECG is the localized nature of some of the abnormalities. The ST segments are slightly elevated in II, III, aVF andslightly depressed in I and aVL. This strongly suggests an abnormality confined to the inferior portion of the left ventricular wall. Theoverwhelmingly most common cause of this is narrowing of either the right coronary artery or of a dominant circumflex artery. However, theabsence of clinical symptoms, the reported temporal stability of these findings and the normal echocardiogram suggest something different. Mydiagnosis is an coronary arteriovenous malformation of the inferior wall of the left ventricle that involves either the right coronary (right dominantcirculation) or the circumflex coronary artery (left dominant circulation). This AV malformation could produce localized, low grade andasymptomatic ischemia and is probably a congenital abnormality..
Bob Warner, MD Retired from the Maastricht University, the Netherlands.
With best regards
Ton G. Gorgels
Hola a todos:Podría tratarse de un artificio producido por una fistula arteriovenosa quirúrgica para diálisis o no quirúrgica, en el miembro superior derecho. Los fundamentos serían los siguientes:- Alteración exclusiva de la onda T en el plano frontal con preeminencia del electrodo del miembro superior derecho- Ausencia de alteración de la onda T en el plano horizontal- Retraso electro-mecánico compatible con la llegada de la onda de pulso al miembro superior derecho.
Me vendría muy bien un millón de dólares.Saludos cordiales.Dr. Máximo Senesi. Jefe del Servicio de Cardiología en Hospital Carlos G. Durand
EnglishHello everyone:It could be an artifice produced by a surgical arteriovenous fistula for dialysis or non-surgical with location in the upper right limb.The fundamentals would be:- Exclusive alteration of the T wave in the frontal plane with preeminence of the right upper limb electrode- Absence of alteration of the T wave in the horizontal plane- Electro-mechanical delay compatible with the arrival of the pulse wave to the right upper limb.
Receiving a million dollars would be very opportune for me.Best regards.Dr. Máximo Senesi.
Spanish
Are they T waves or giant U waves? Based on the timing and the precordial leads, I think these are giant U waves. Negative U waves have beendescribed after MI and brain death.Yochai Birnbaum, M.D., FAHA, FACC
Professor of MedicineJohn S. Dunn Chair in Cardiology Research and EducationThe Department of Medicine, Section of CardiologyBaylor College of MedicineOne Baylor PlazaMS BCM620Houston, TX 77030Phone: 713-798-2735Fax: 713-798-0270Email: [email protected] INTERESTSNon-invasive cardiology, echocardiography, electrocardiography, clinical cardiology and acute coronary syndrome
Isso me parece bigeminismo atrial bloqueado!
This seems to me blocked atrial bigeminism!
Dalmo Antônio Ribeiro Moreira, MD PhDChefe da Seção Médica de Eletrofisiologia Cardíaca e Eletrocardiografia do Instituto Dante Pazzanese de Cardiologia.Doutor em Ciências pela Faculdade de Medicina da Universidade de São Paulo.Professor Pleno de Pós-Graduação em Cardiologia do Instituto Dante Pazzanese de Cardiologia – Universidade de São Paulo.Professor Titular da Disciplina de Fisiologia Humana da Faculdade de Medicina de Itajubá
Final comments byAndrés Ricardo Pérez-Riera, MD PhD
Design of Studies and Scientific Writing Laboratory of the ABC School of Medicine, Santo Andre, BrazilVectorcardiography section editor at Journal of Electrocardiology
https://ekgvcg.wordpress.com/CV Lattes: http://buscatextual.cnpq.br/buscatextual/visualizacv.do?id=K4244824E7
Initially, we will try to answer the few and distinguished colleagues that had the “courage” to express their respective opinions.To reply to the great master of electrocardiology, Professor Frank G. Yanowitz, who initially suggests that this could be an artifact because thereare no biphasic T waves observed in the precordial leads; we answer: if you pay careful attention, you may see that the precordial T waves are alsobiphasic: plus-minus, up-down; and in spite of the terminal part of T being less emphasized, it is negative from V2 through V6. Consequently, thiswould rule out the chance of this being an artifact.The second hypothesis is that of a case commented by that icon of electrocardiology, Dr. Alan Lindsay, about a patient that swallowed a hook thatcaused bizarre ECG artifacts. In this case, the patient had not swallowed anything. Out of curiosity we researched in PubMed the publications byDr. Alan Lindsay, “A teacher of substance and style (Lindsay AE)” and we found nothing published in relation to artifacts.The brilliant opinion by Dr. Li Zhang, who I count among my dearest friends, was about the duration of QT interval being normal, and we agree onthis. Moreover, she raises the hypothesis that hypertension proper eventually causes final negative U wave by fiber stretching. Indeed, thishypothesis was confirmed by Miwa (Miwa 2009). This author presented the hypothesis that “the genesis of initial U inversion in patients withhypertension may be related to pressure-induced diastolic dysfunction”. In order to clarify the genesis of initial U-wave inversion theauthor studied 11 consecutive hypertensive patients with both initial U inversion and impaired left ventricular early relaxation who were evaluatedusing Doppler echocardiography. The U inversion disappeared during acute pressure lowering by sublingual administration of nitroglycerin.The U inversion also disappeared and relaxation improved significantly after chronic blood pressure lowering. Initial U inversion reappearedduring a cold pressor test. He concluded that the appearance of initial U inversion was dependent on the pressure-induced impaired left ventricularearly relaxation in hypertensive patients” as in this case, where the final negative component is giant and negative. If we think that U waves arecaused by hypertension associated to hypokalemia as proven by Kanemoto et al (Kanemoto 1992), in patients with uncontrolled hypertension andsevere hypokalemia, but this doesn’t seem to be the case. On the other hand, the case presented by Kanemoto et al, showed giant negative U wavesonly in the left precordial leads and not in a diffuse manner as in this case. These authors presented “a 66-year-old woman with a long historyof hypertension had an ECG with giant negative U waves in left precordial leads despite hypokalemia. This was the first report of giantnegative U waves induced by uncontrolled hypertension with hypokalemia. The occurrence of negative U waves in the presence ofa negative U wave is highly specific for the presence of heart disease and is associated with other ECG abnormalities in > 90% of patients.The most common conditions associated with a negative U wave are systemic hypertension, aortic and mitral regurgitationand CHD. The U wave vector is directed opposite to the QRS axis in the horizontal plane in patients both LVH and RVH. In patients with CHD,the U wave vector tends to be directed away from the site of the akinetic or dyskinetic region. The change from a negative to an upright U waveafter a reduction in blood pressure, renal transplantation, insertion of a valve prosthesis or a coronary arterial bypass graft procedure is associated
with a decrease in the QRS amplitude but with no consistent changes in T wave polarity. The timing of the U wave apex is dependent on theduration of ventricular repolarization but not on the QRSd. This ECG observations are explained better by the ventricular relaxation than by thePurkinje fiber repolarization theory of U wave genesis (Kishida 1982)."Caruso et al. assessed by ECG and echocardiography 559 patients withlongstanding arterial hypertension. Negative U wave was significantly more frequent in patients with increased LV mass and/or with CHF,particularly in the middle-age hypertension group. Negative U wave appears to be an ECG sign closely associated with the anatomical evolutiontoward hypertensive heart disease with hypertrophy and/or CHF (Caruso 1990).The U wave is the last, inconstant, smallest, rounded and upward deflection of the electrocardiogram. Controversial in origin, it is sometimes seenfollowing the T wave with the TU junction along the baseline or fused with it and before P of the following cycle on the TP segment. In this reviewwe will study its temporal location related to monophasic action potential, cardiac cycle and heart sounds, polarity, voltage or amplitude,frequency and shapecontour. We will analyze the clinical significance of negative, alternant, prominent U wave, and the difference between Twave with two peaks (T1–T2) and true U wave. Finally we will analyze the four main hypotheses about the source of U wave: repolarization of theintraventricular conducting system or Purkinje fibers system, delayed repolarization of the papillary muscles, afterpotentials caused bymechanoelectrical hypothesis or mechanoelectrical feedback, and the prolonged repolarization in the cells of the mid-myocardium (“M-cells”)(Pérez-Riera 2008).
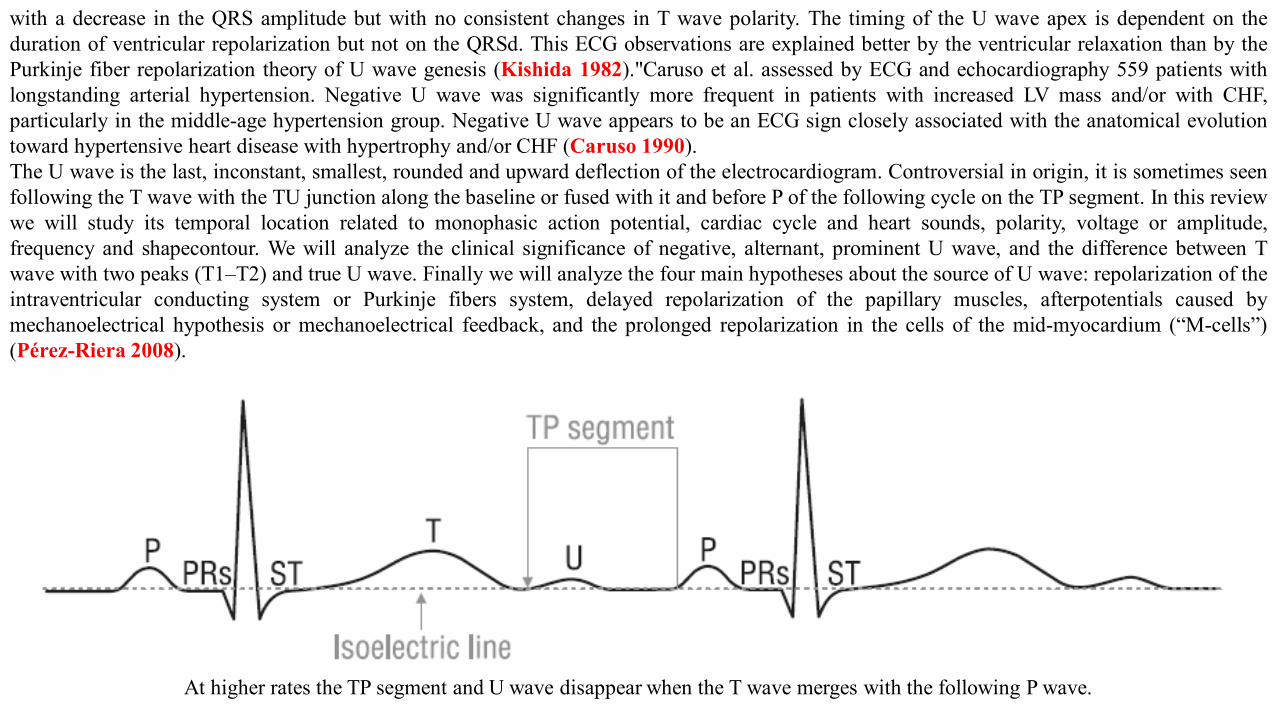
At higher rates the TP segment and U wave disappear when the T wave merges with the following P wave.
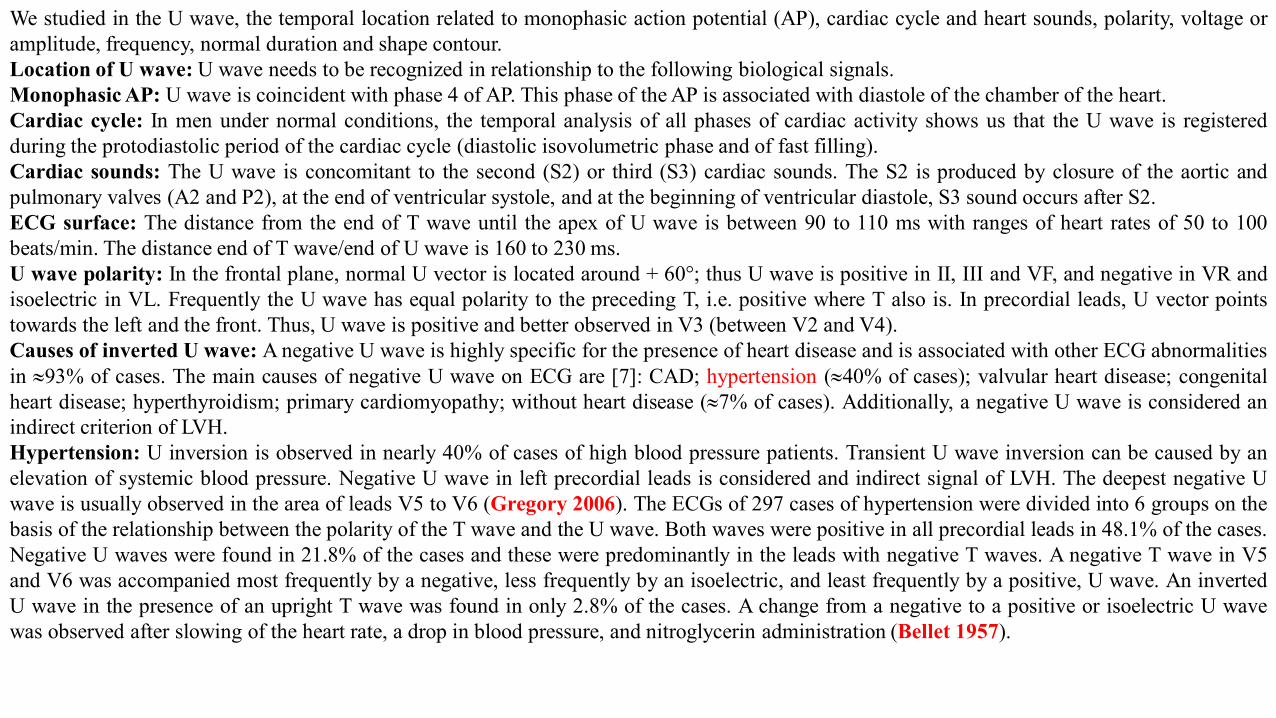
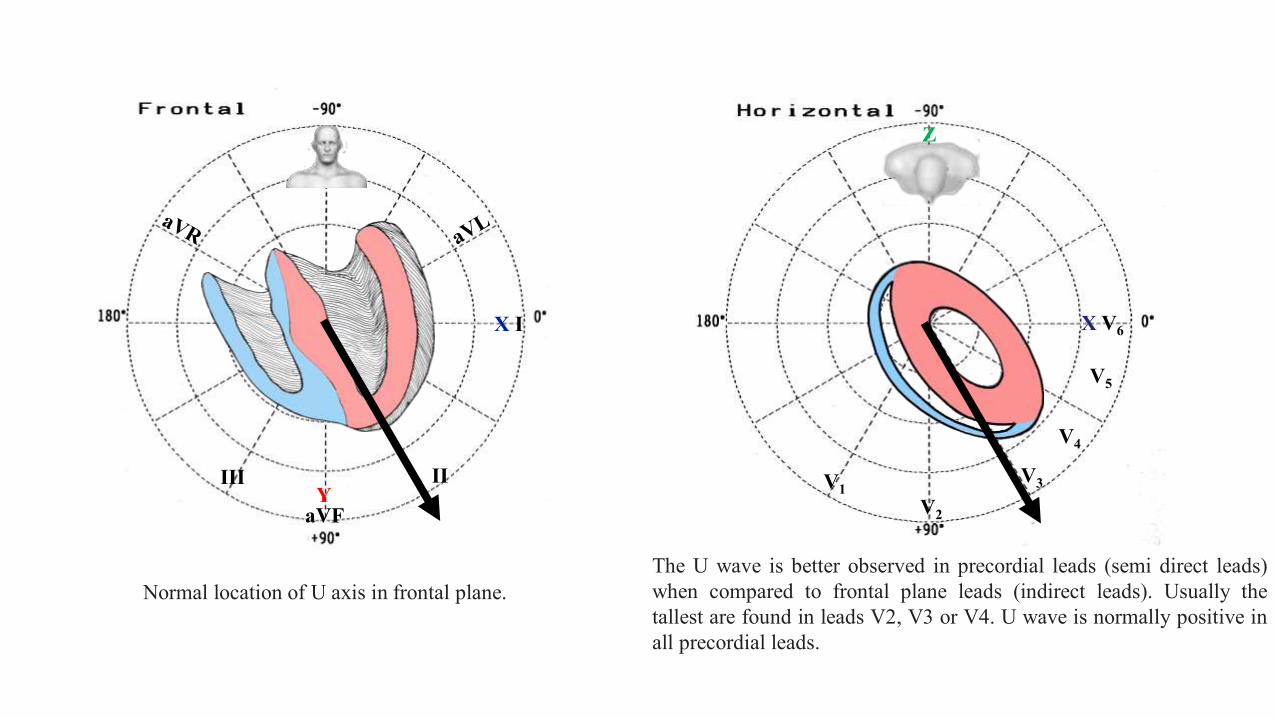
We studied in the U wave, the temporal location related to monophasic action potential (AP), cardiac cycle and heart sounds, polarity, voltage oramplitude, frequency, normal duration and shape contour.Location of U wave: U wave needs to be recognized in relationship to the following biological signals.Monophasic AP: U wave is coincident with phase 4 of AP. This phase of the AP is associated with diastole of the chamber of the heart.Cardiac cycle: In men under normal conditions, the temporal analysis of all phases of cardiac activity shows us that the U wave is registeredduring the protodiastolic period of the cardiac cycle (diastolic isovolumetric phase and of fast filling).Cardiac sounds: The U wave is concomitant to the second (S2) or third (S3) cardiac sounds. The S2 is produced by closure of the aortic andpulmonary valves (A2 and P2), at the end of ventricular systole, and at the beginning of ventricular diastole, S3 sound occurs after S2.ECG surface: The distance from the end of T wave until the apex of U wave is between 90 to 110 ms with ranges of heart rates of 50 to 100beats/min. The distance end of T wave/end of U wave is 160 to 230 ms.U wave polarity: In the frontal plane, normal U vector is located around + 60°; thus U wave is positive in II, III and VF, and negative in VR andisoelectric in VL. Frequently the U wave has equal polarity to the preceding T, i.e. positive where T also is. In precordial leads, U vector pointstowards the left and the front. Thus, U wave is positive and better observed in V3 (between V2 and V4).Causes of inverted U wave: A negative U wave is highly specific for the presence of heart disease and is associated with other ECG abnormalitiesin |93% of cases. The main causes of negative U wave on ECG are [7]: CAD; hypertension (|40% of cases); valvular heart disease; congenitalheart disease; hyperthyroidism; primary cardiomyopathy; without heart disease (|7% of cases). Additionally, a negative U wave is considered anindirect criterion of LVH.Hypertension: U inversion is observed in nearly 40% of cases of high blood pressure patients. Transient U wave inversion can be caused by anelevation of systemic blood pressure. Negative U wave in left precordial leads is considered and indirect signal of LVH. The deepest negative Uwave is usually observed in the area of leads V5 to V6 (Gregory 2006). The ECGs of 297 cases of hypertension were divided into 6 groups on thebasis of the relationship between the polarity of the T wave and the U wave. Both waves were positive in all precordial leads in 48.1% of the cases.Negative U waves were found in 21.8% of the cases and these were predominantly in the leads with negative T waves. A negative T wave in V5and V6 was accompanied most frequently by a negative, less frequently by an isoelectric, and least frequently by a positive, U wave. An invertedU wave in the presence of an upright T wave was found in only 2.8% of the cases. A change from a negative to a positive or isoelectric U wavewas observed after slowing of the heart rate, a drop in blood pressure, and nitroglycerin administration (Bellet 1957).
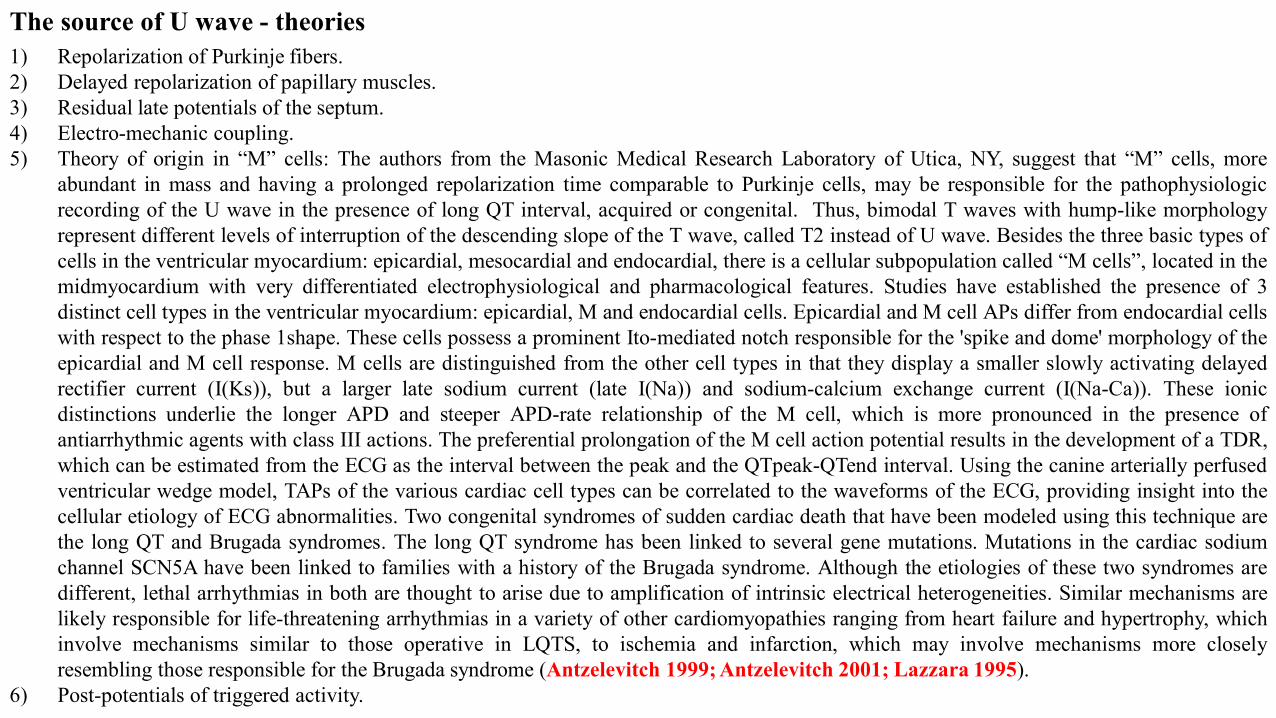
The source of U wave - theories1) Repolarization of Purkinje fibers.2) Delayed repolarization of papillary muscles.3) Residual late potentials of the septum.4) Electro-mechanic coupling.5) Theory of origin in “M” cells: The authors from the Masonic Medical Research Laboratory of Utica, NY, suggest that “M” cells, more
abundant in mass and having a prolonged repolarization time comparable to Purkinje cells, may be responsible for the pathophysiologicrecording of the U wave in the presence of long QT interval, acquired or congenital. Thus, bimodal T waves with hump-like morphologyrepresent different levels of interruption of the descending slope of the T wave, called T2 instead of U wave. Besides the three basic types ofcells in the ventricular myocardium: epicardial, mesocardial and endocardial, there is a cellular subpopulation called “M cells”, located in themidmyocardium with very differentiated electrophysiological and pharmacological features. Studies have established the presence of 3distinct cell types in the ventricular myocardium: epicardial, M and endocardial cells. Epicardial and M cell APs differ from endocardial cellswith respect to the phase 1shape. These cells possess a prominent Ito-mediated notch responsible for the 'spike and dome' morphology of theepicardial and M cell response. M cells are distinguished from the other cell types in that they display a smaller slowly activating delayedrectifier current (I(Ks)), but a larger late sodium current (late I(Na)) and sodium-calcium exchange current (I(Na-Ca)). These ionicdistinctions underlie the longer APD and steeper APD-rate relationship of the M cell, which is more pronounced in the presence ofantiarrhythmic agents with class III actions. The preferential prolongation of the M cell action potential results in the development of a TDR,which can be estimated from the ECG as the interval between the peak and the QTpeak-QTend interval. Using the canine arterially perfusedventricular wedge model, TAPs of the various cardiac cell types can be correlated to the waveforms of the ECG, providing insight into thecellular etiology of ECG abnormalities. Two congenital syndromes of sudden cardiac death that have been modeled using this technique arethe long QT and Brugada syndromes. The long QT syndrome has been linked to several gene mutations. Mutations in the cardiac sodiumchannel SCN5A have been linked to families with a history of the Brugada syndrome. Although the etiologies of these two syndromes aredifferent, lethal arrhythmias in both are thought to arise due to amplification of intrinsic electrical heterogeneities. Similar mechanisms arelikely responsible for life-threatening arrhythmias in a variety of other cardiomyopathies ranging from heart failure and hypertrophy, whichinvolve mechanisms similar to those operative in LQTS, to ischemia and infarction, which may involve mechanisms more closelyresembling those responsible for the Brugada syndrome (Antzelevitch 1999; Antzelevitch 2001; Lazzara 1995).
6) Post-potentials of triggered activity.
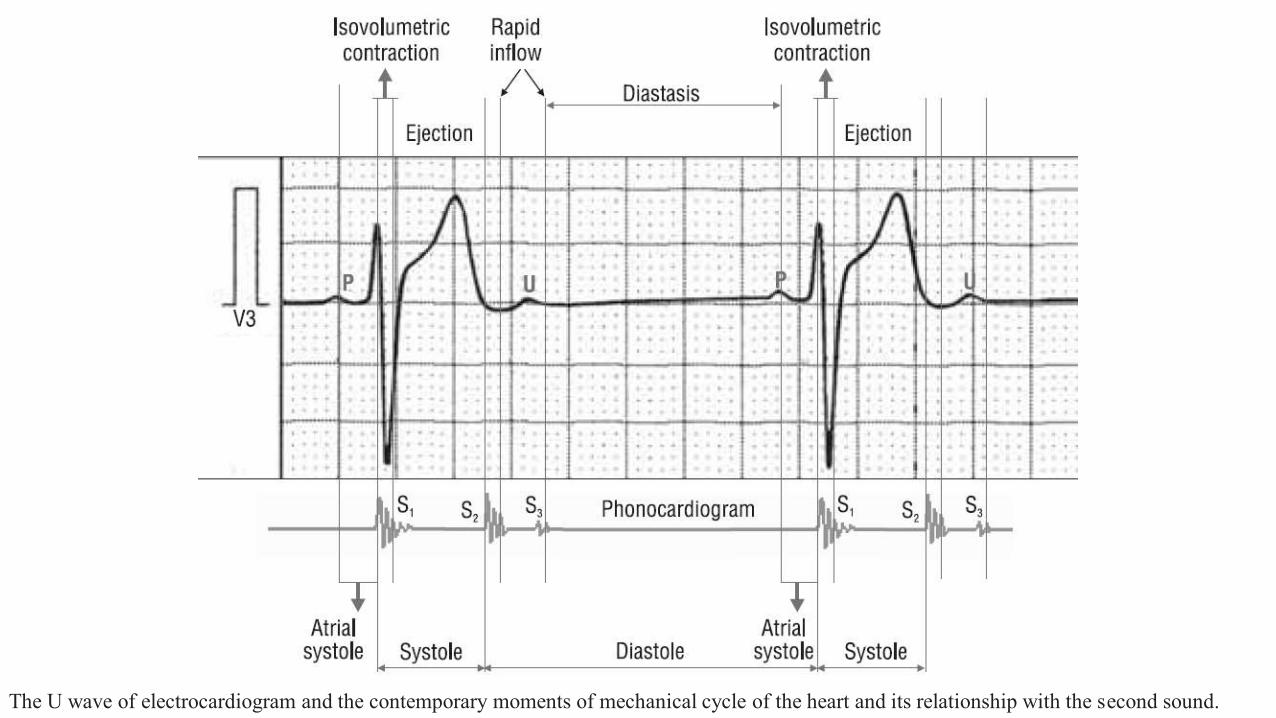
The U wave of electrocardiogram and the contemporary moments of mechanical cycle of the heart and its relationship with the second sound.
IIIII
aVF
X I
Y
X V6
V1
V4
V5
V2
V3
Z
Normal location of U axis in frontal plane.The U wave is better observed in precordial leads (semi direct leads)when compared to frontal plane leads (indirect leads). Usually thetallest are found in leads V2, V3 or V4. U wave is normally positive inall precordial leads.
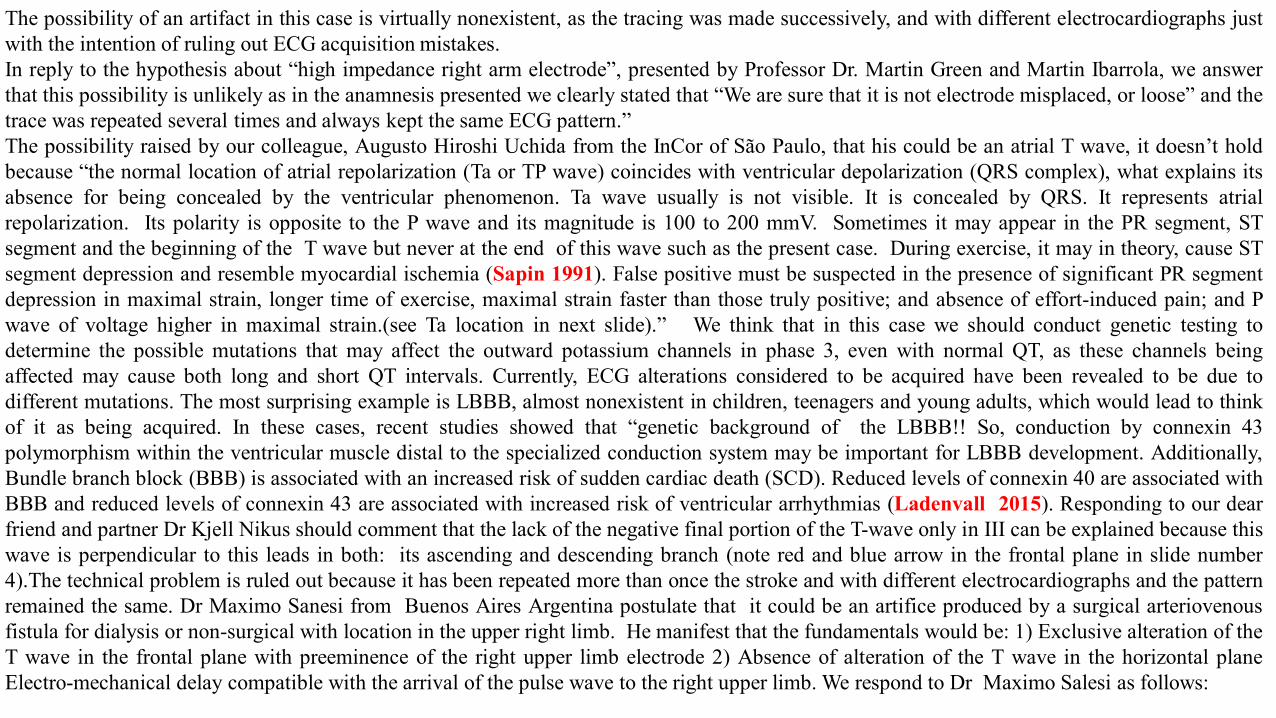
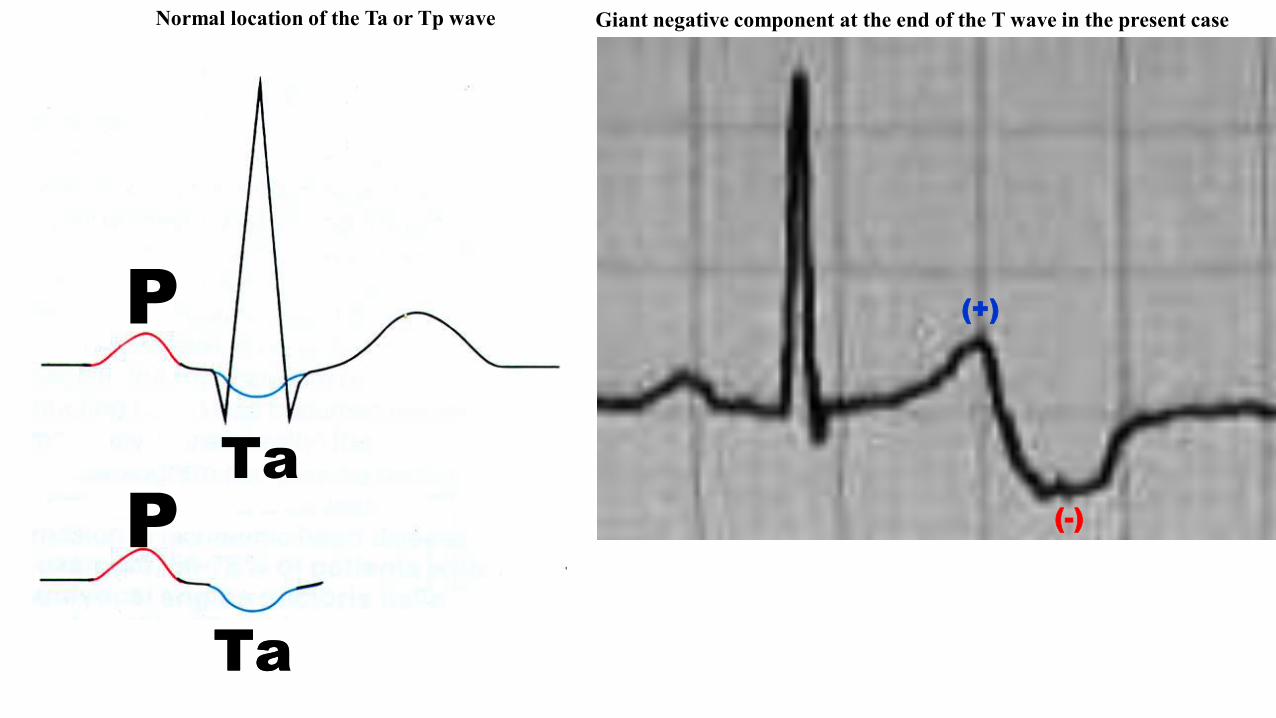
The possibility of an artifact in this case is virtually nonexistent, as the tracing was made successively, and with different electrocardiographs justwith the intention of ruling out ECG acquisition mistakes.In reply to the hypothesis about “high impedance right arm electrode”, presented by Professor Dr. Martin Green and Martin Ibarrola, we answerthat this possibility is unlikely as in the anamnesis presented we clearly stated that “We are sure that it is not electrode misplaced, or loose” and thetrace was repeated several times and always kept the same ECG pattern.”The possibility raised by our colleague, Augusto Hiroshi Uchida from the InCor of São Paulo, that his could be an atrial T wave, it doesn’t holdbecause “the normal location of atrial repolarization (Ta or TP wave) coincides with ventricular depolarization (QRS complex), what explains itsabsence for being concealed by the ventricular phenomenon. Ta wave usually is not visible. It is concealed by QRS. It represents atrialrepolarization. Its polarity is opposite to the P wave and its magnitude is 100 to 200 mmV. Sometimes it may appear in the PR segment, STsegment and the beginning of the T wave but never at the end of this wave such as the present case. During exercise, it may in theory, cause STsegment depression and resemble myocardial ischemia (Sapin 1991). False positive must be suspected in the presence of significant PR segmentdepression in maximal strain, longer time of exercise, maximal strain faster than those truly positive; and absence of effort-induced pain; and Pwave of voltage higher in maximal strain.(see Ta location in next slide).” We think that in this case we should conduct genetic testing todetermine the possible mutations that may affect the outward potassium channels in phase 3, even with normal QT, as these channels beingaffected may cause both long and short QT intervals. Currently, ECG alterations considered to be acquired have been revealed to be due todifferent mutations. The most surprising example is LBBB, almost nonexistent in children, teenagers and young adults, which would lead to thinkof it as being acquired. In these cases, recent studies showed that “genetic background of the LBBB!! So, conduction by connexin 43polymorphism within the ventricular muscle distal to the specialized conduction system may be important for LBBB development. Additionally,Bundle branch block (BBB) is associated with an increased risk of sudden cardiac death (SCD). Reduced levels of connexin 40 are associated withBBB and reduced levels of connexin 43 are associated with increased risk of ventricular arrhythmias (Ladenvall 2015). Responding to our dearfriend and partner Dr Kjell Nikus should comment that the lack of the negative final portion of the T-wave only in III can be explained because thiswave is perpendicular to this leads in both: its ascending and descending branch (note red and blue arrow in the frontal plane in slide number4).The technical problem is ruled out because it has been repeated more than once the stroke and with different electrocardiographs and the patternremained the same. Dr Maximo Sanesi from Buenos Aires Argentina postulate that it could be an artifice produced by a surgical arteriovenousfistula for dialysis or non-surgical with location in the upper right limb. He manifest that the fundamentals would be: 1) Exclusive alteration of theT wave in the frontal plane with preeminence of the right upper limb electrode 2) Absence of alteration of the T wave in the horizontal planeElectro-mechanical delay compatible with the arrival of the pulse wave to the right upper limb. We respond to Dr Maximo Salesi as follows:
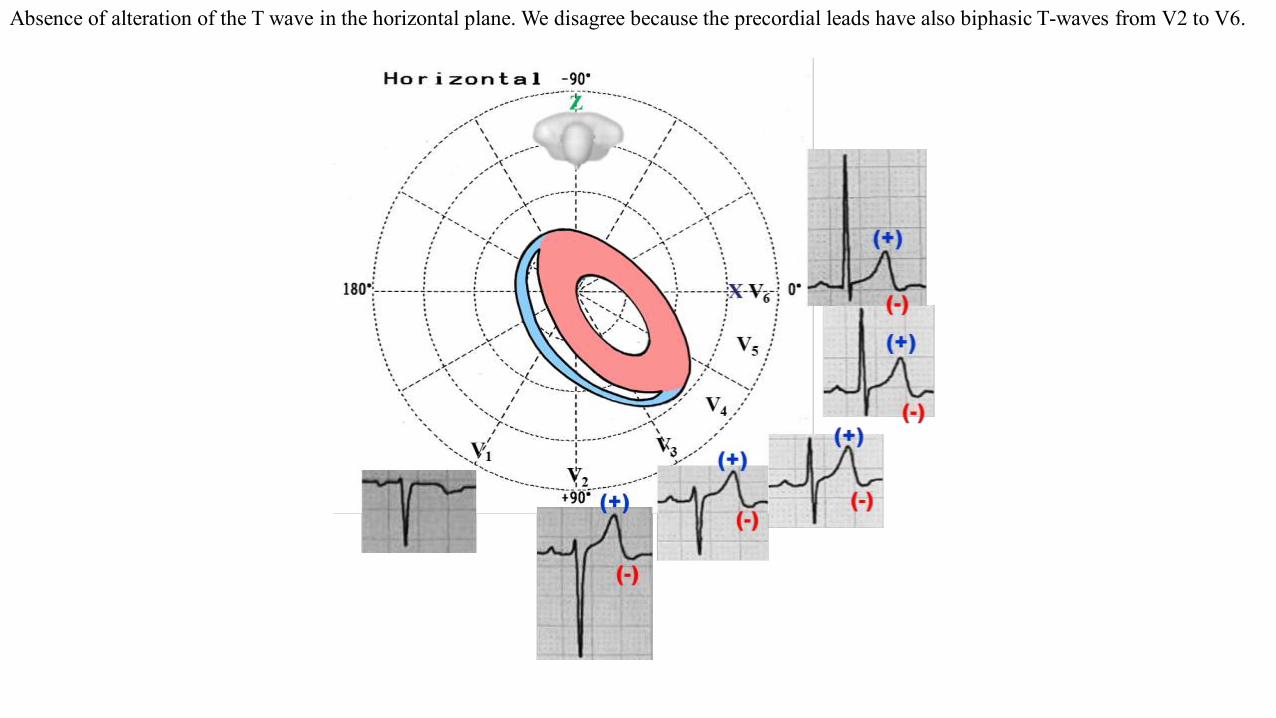
Absence of alteration of the T wave in the horizontal plane. We disagree because the precordial leads have also biphasic T-waves from V2 to V6.
P
PTa
Ta
P
PTa
Ta
(+)
(-)
Normal location of the Ta or Tp wave Giant negative component at the end of the T wave in the present case
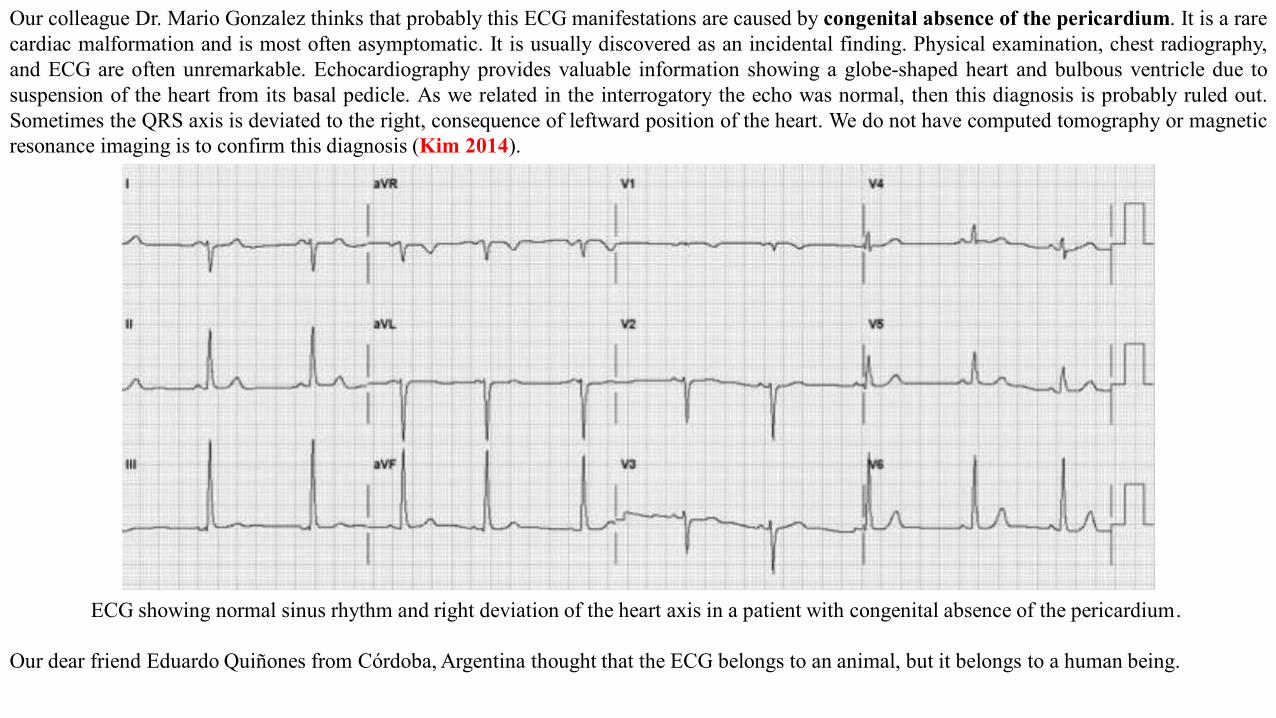
Our colleague Dr. Mario Gonzalez thinks that probably this ECG manifestations are caused by congenital absence of the pericardium. It is a rarecardiac malformation and is most often asymptomatic. It is usually discovered as an incidental finding. Physical examination, chest radiography,and ECG are often unremarkable. Echocardiography provides valuable information showing a globe-shaped heart and bulbous ventricle due tosuspension of the heart from its basal pedicle. As we related in the interrogatory the echo was normal, then this diagnosis is probably ruled out.Sometimes the QRS axis is deviated to the right, consequence of leftward position of the heart. We do not have computed tomography or magneticresonance imaging is to confirm this diagnosis (Kim 2014).
ECG showing normal sinus rhythm and right deviation of the heart axis in a patient with congenital absence of the pericardium.
Our dear friend Eduardo Quiñones from Córdoba, Argentina thought that the ECG belongs to an animal, but it belongs to a human being.
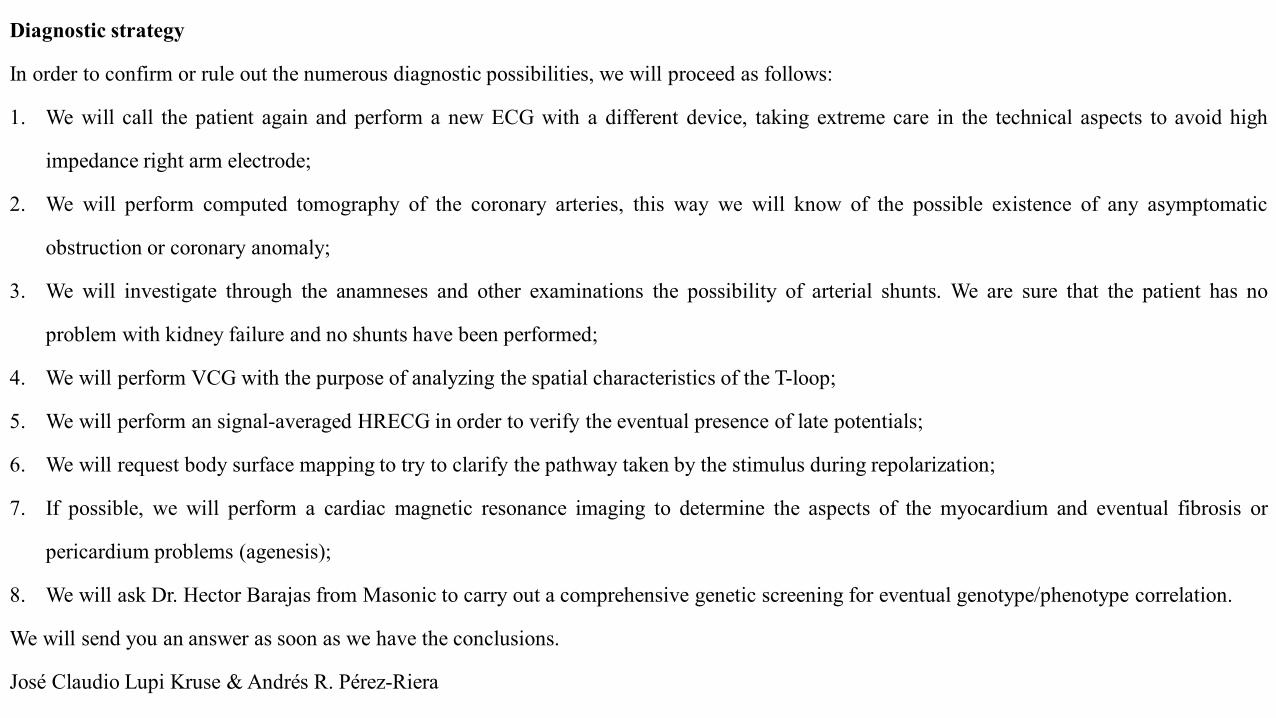
Diagnostic strategy
In order to confirm or rule out the numerous diagnostic possibilities, we will proceed as follows:
1. We will call the patient again and perform a new ECG with a different device, taking extreme care in the technical aspects to avoid high
impedance right arm electrode;
2. We will perform computed tomography of the coronary arteries, this way we will know of the possible existence of any asymptomatic
obstruction or coronary anomaly;
3. We will investigate through the anamneses and other examinations the possibility of arterial shunts. We are sure that the patient has no
problem with kidney failure and no shunts have been performed;
4. We will perform VCG with the purpose of analyzing the spatial characteristics of the T-loop;
5. We will perform an signal-averaged HRECG in order to verify the eventual presence of late potentials;
6. We will request body surface mapping to try to clarify the pathway taken by the stimulus during repolarization;
7. If possible, we will perform a cardiac magnetic resonance imaging to determine the aspects of the myocardium and eventual fibrosis or
pericardium problems (agenesis);
8. We will ask Dr. Hector Barajas from Masonic to carry out a comprehensive genetic screening for eventual genotype/phenotype correlation.
We will send you an answer as soon as we have the conclusions.
José Claudio Lupi Kruse & Andrés R. Pérez-Riera
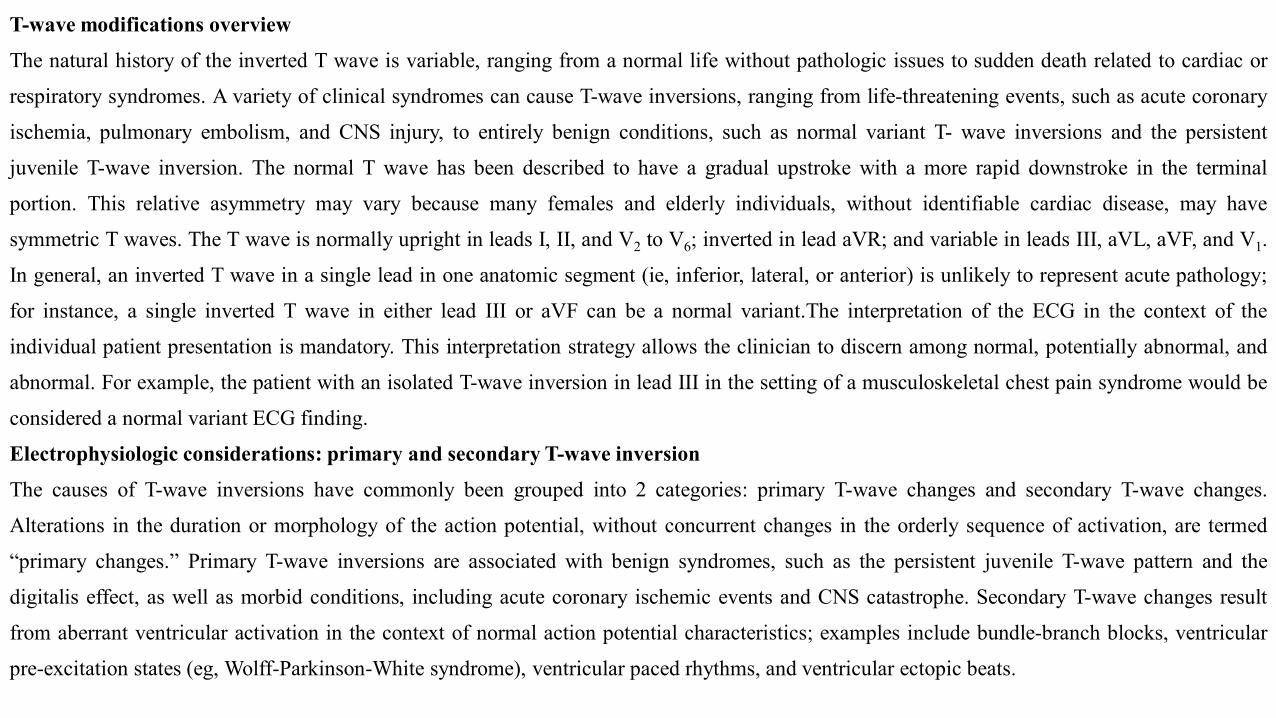
T-wave modifications overview
The natural history of the inverted T wave is variable, ranging from a normal life without pathologic issues to sudden death related to cardiac or
respiratory syndromes. A variety of clinical syndromes can cause T-wave inversions, ranging from life-threatening events, such as acute coronary
ischemia, pulmonary embolism, and CNS injury, to entirely benign conditions, such as normal variant T- wave inversions and the persistent
juvenile T-wave inversion. The normal T wave has been described to have a gradual upstroke with a more rapid downstroke in the terminal
portion. This relative asymmetry may vary because many females and elderly individuals, without identifiable cardiac disease, may have
symmetric T waves. The T wave is normally upright in leads I, II, and V2 to V6; inverted in lead aVR; and variable in leads III, aVL, aVF, and V1.
In general, an inverted T wave in a single lead in one anatomic segment (ie, inferior, lateral, or anterior) is unlikely to represent acute pathology;
for instance, a single inverted T wave in either lead III or aVF can be a normal variant.The interpretation of the ECG in the context of the
individual patient presentation is mandatory. This interpretation strategy allows the clinician to discern among normal, potentially abnormal, and
abnormal. For example, the patient with an isolated T-wave inversion in lead III in the setting of a musculoskeletal chest pain syndrome would be
considered a normal variant ECG finding.
Electrophysiologic considerations: primary and secondary T-wave inversion
The causes of T-wave inversions have commonly been grouped into 2 categories: primary T-wave changes and secondary T-wave changes.
Alterations in the duration or morphology of the action potential, without concurrent changes in the orderly sequence of activation, are termed
“primary changes.” Primary T-wave inversions are associated with benign syndromes, such as the persistent juvenile T-wave pattern and the
digitalis effect, as well as morbid conditions, including acute coronary ischemic events and CNS catastrophe. Secondary T-wave changes result
from aberrant ventricular activation in the context of normal action potential characteristics; examples include bundle-branch blocks, ventricular
pre-excitation states (eg, Wolff-Parkinson-White syndrome), ventricular paced rhythms, and ventricular ectopic beats.
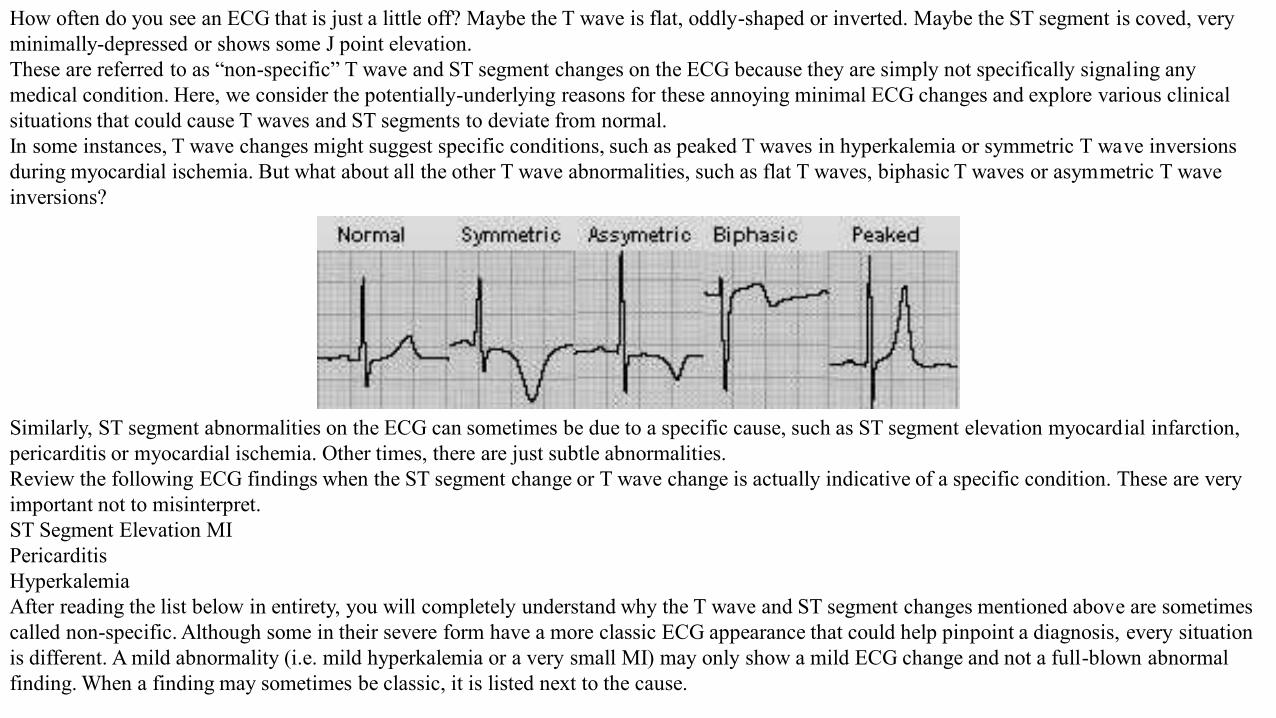
How often do you see an ECG that is just a little off? Maybe the T wave is flat, oddly-shaped or inverted. Maybe the ST segment is coved, very minimally-depressed or shows some J point elevation.These are referred to as “non-specific” T wave and ST segment changes on the ECG because they are simply not specifically signaling any medical condition. Here, we consider the potentially-underlying reasons for these annoying minimal ECG changes and explore various clinical situations that could cause T waves and ST segments to deviate from normal.In some instances, T wave changes might suggest specific conditions, such as peaked T waves in hyperkalemia or symmetric T wave inversions during myocardial ischemia. But what about all the other T wave abnormalities, such as flat T waves, biphasic T waves or asymmetric T wave inversions?
Similarly, ST segment abnormalities on the ECG can sometimes be due to a specific cause, such as ST segment elevation myocardial infarction, pericarditis or myocardial ischemia. Other times, there are just subtle abnormalities.Review the following ECG findings when the ST segment change or T wave change is actually indicative of a specific condition. These are very important not to misinterpret.ST Segment Elevation MIPericarditisHyperkalemiaAfter reading the list below in entirety, you will completely understand why the T wave and ST segment changes mentioned above are sometimes called non-specific. Although some in their severe form have a more classic ECG appearance that could help pinpoint a diagnosis, every situation is different. A mild abnormality (i.e. mild hyperkalemia or a very small MI) may only show a mild ECG change and not a full-blown abnormal finding. When a finding may sometimes be classic, it is listed next to the cause.
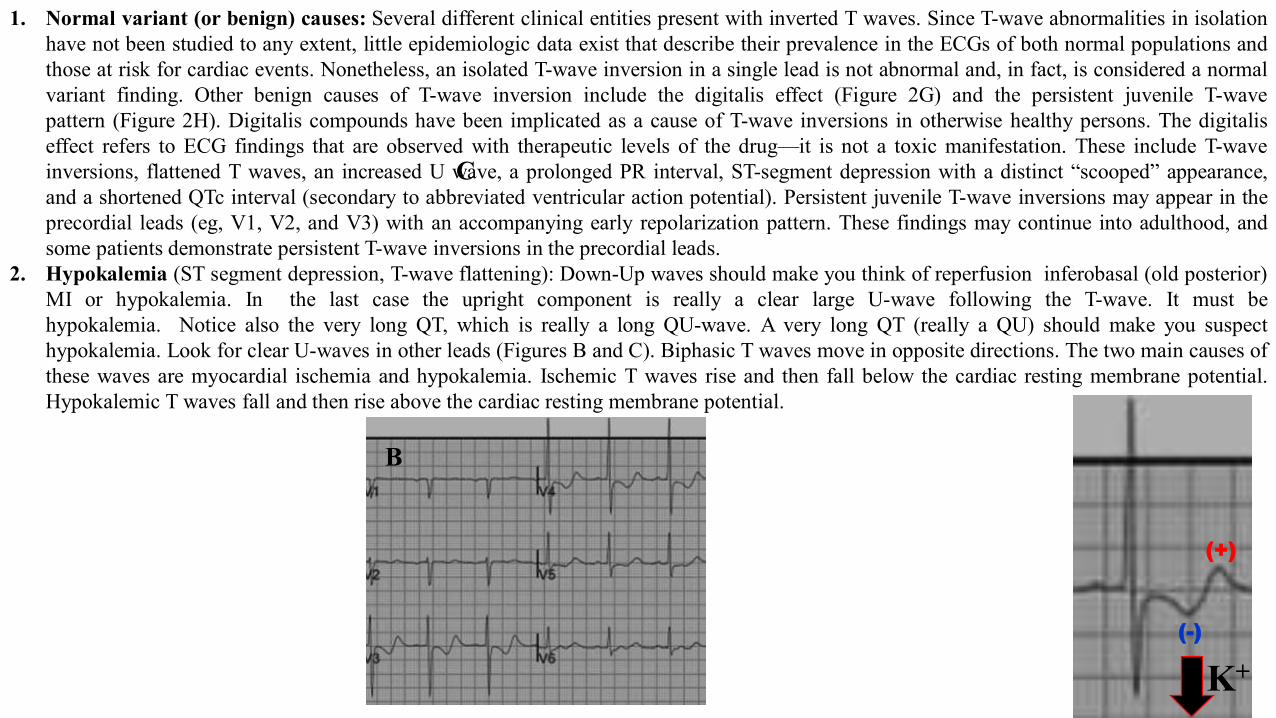
1. Normal variant (or benign) causes: Several different clinical entities present with inverted T waves. Since T-wave abnormalities in isolationhave not been studied to any extent, little epidemiologic data exist that describe their prevalence in the ECGs of both normal populations andthose at risk for cardiac events. Nonetheless, an isolated T-wave inversion in a single lead is not abnormal and, in fact, is considered a normalvariant finding. Other benign causes of T-wave inversion include the digitalis effect (Figure 2G) and the persistent juvenile T-wavepattern (Figure 2H). Digitalis compounds have been implicated as a cause of T-wave inversions in otherwise healthy persons. The digitaliseffect refers to ECG findings that are observed with therapeutic levels of the drug—it is not a toxic manifestation. These include T-waveinversions, flattened T waves, an increased U wave, a prolonged PR interval, ST-segment depression with a distinct “scooped” appearance,and a shortened QTc interval (secondary to abbreviated ventricular action potential). Persistent juvenile T-wave inversions may appear in theprecordial leads (eg, V1, V2, and V3) with an accompanying early repolarization pattern. These findings may continue into adulthood, andsome patients demonstrate persistent T-wave inversions in the precordial leads.
2. Hypokalemia (ST segment depression, T-wave flattening): Down-Up waves should make you think of reperfusion inferobasal (old posterior)MI or hypokalemia. In the last case the upright component is really a clear large U-wave following the T-wave. It must behypokalemia. Notice also the very long QT, which is really a long QU-wave. A very long QT (really a QU) should make you suspecthypokalemia. Look for clear U-waves in other leads (Figures B and C). Biphasic T waves move in opposite directions. The two main causes ofthese waves are myocardial ischemia and hypokalemia. Ischemic T waves rise and then fall below the cardiac resting membrane potential.Hypokalemic T waves fall and then rise above the cardiac resting membrane potential.
K+
B
C
(+)
(-)
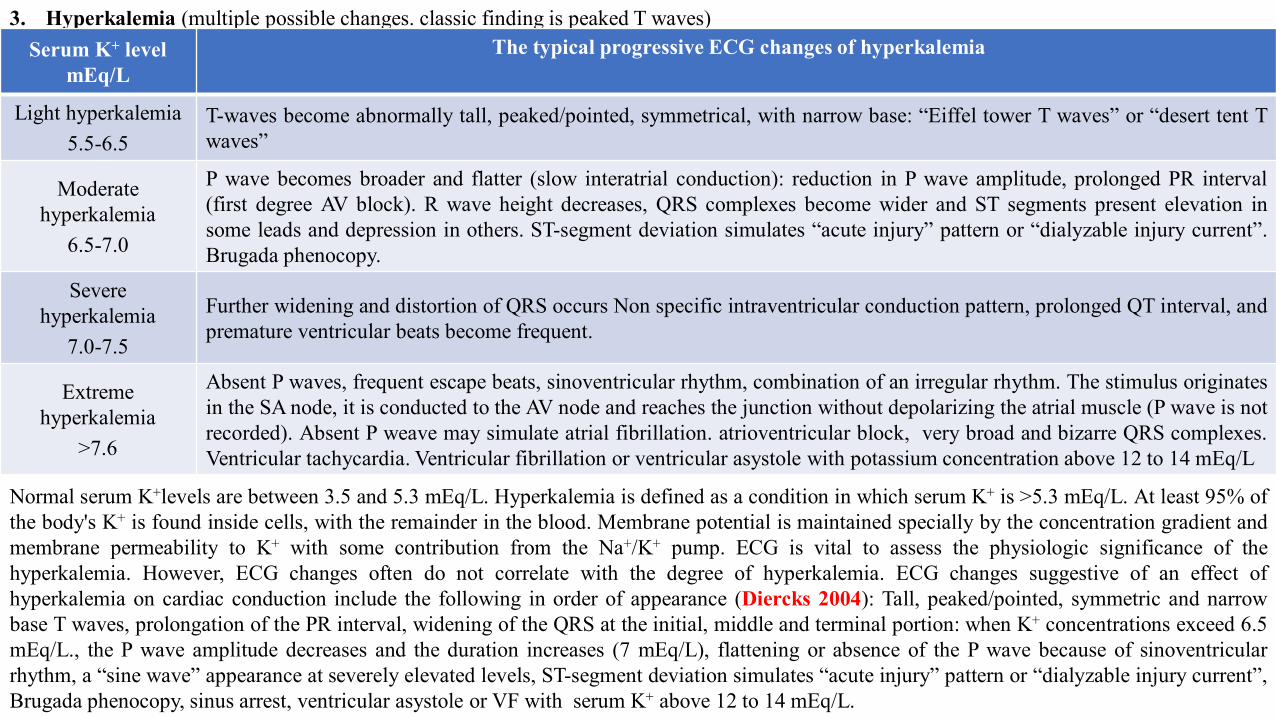
3. Hyperkalemia (multiple possible changes. classic finding is peaked T waves)Serum K+ level
mEq/LThe typical progressive ECG changes of hyperkalemia
Light hyperkalemia 5.5-6.5
T-waves become abnormally tall, peaked/pointed, symmetrical, with narrow base: “Eiffel tower T waves” or “desert tent Twaves”
Moderate hyperkalemia
6.5-7.0
P wave becomes broader and flatter (slow interatrial conduction): reduction in P wave amplitude, prolonged PR interval(first degree AV block). R wave height decreases, QRS complexes become wider and ST segments present elevation insome leads and depression in others. ST-segment deviation simulates “acute injury” pattern or “dialyzable injury current”.Brugada phenocopy.
Severe hyperkalemia
7.0-7.5
Further widening and distortion of QRS occurs Non specific intraventricular conduction pattern, prolonged QT interval, andpremature ventricular beats become frequent.
Extreme hyperkalemia
>7.6
Absent P waves, frequent escape beats, sinoventricular rhythm, combination of an irregular rhythm. The stimulus originatesin the SA node, it is conducted to the AV node and reaches the junction without depolarizing the atrial muscle (P wave is notrecorded). Absent P weave may simulate atrial fibrillation. atrioventricular block, very broad and bizarre QRS complexes.Ventricular tachycardia. Ventricular fibrillation or ventricular asystole with potassium concentration above 12 to 14 mEq/L
Normal serum K+levels are between 3.5 and 5.3 mEq/L. Hyperkalemia is defined as a condition in which serum K+ is >5.3 mEq/L. At least 95% ofthe body's K+ is found inside cells, with the remainder in the blood. Membrane potential is maintained specially by the concentration gradient andmembrane permeability to K+ with some contribution from the Na+/K+ pump. ECG is vital to assess the physiologic significance of thehyperkalemia. However, ECG changes often do not correlate with the degree of hyperkalemia. ECG changes suggestive of an effect ofhyperkalemia on cardiac conduction include the following in order of appearance (Diercks 2004): Tall, peaked/pointed, symmetric and narrowbase T waves, prolongation of the PR interval, widening of the QRS at the initial, middle and terminal portion: when K+ concentrations exceed 6.5mEq/L., the P wave amplitude decreases and the duration increases (7 mEq/L), flattening or absence of the P wave because of sinoventricularrhythm, a “sine wave” appearance at severely elevated levels, ST-segment deviation simulates “acute injury” pattern or “dialyzable injury current”,Brugada phenocopy, sinus arrest, ventricular asystole or VF with serum K+ above 12 to 14 mEq/L.
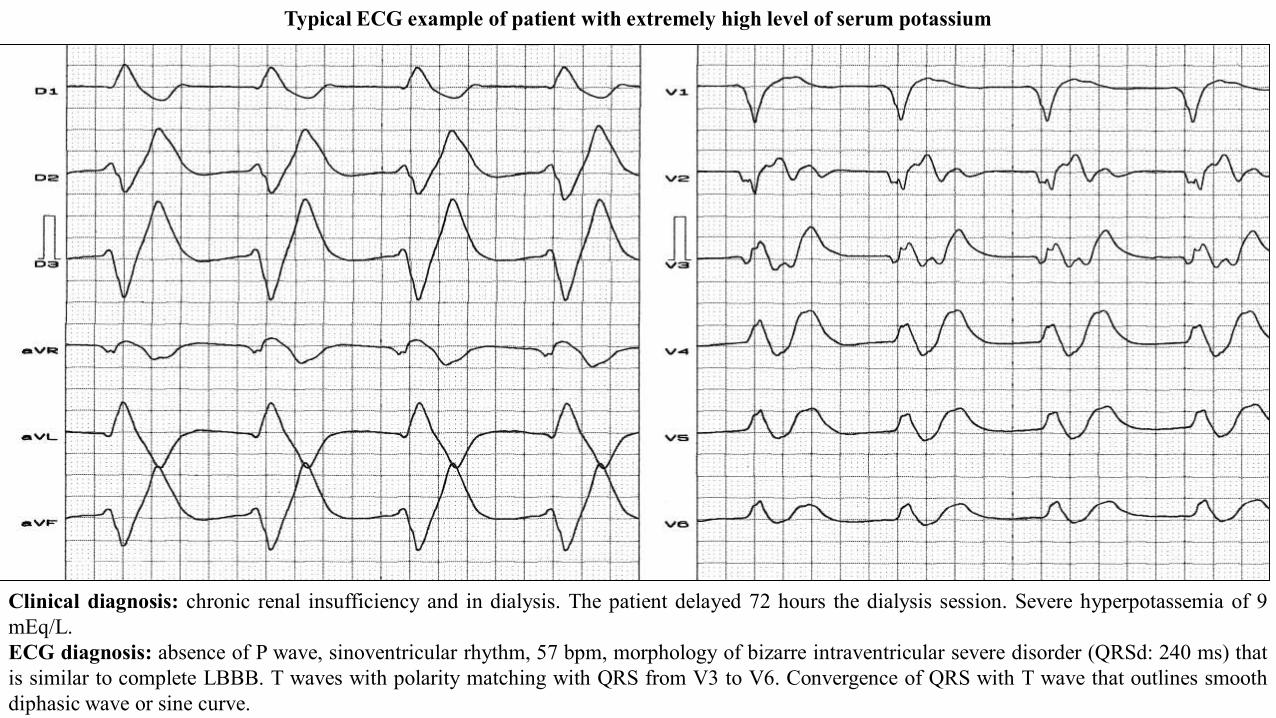
Clinical diagnosis: chronic renal insufficiency and in dialysis. The patient delayed 72 hours the dialysis session. Severe hyperpotassemia of 9mEq/L.ECG diagnosis: absence of P wave, sinoventricular rhythm, 57 bpm, morphology of bizarre intraventricular severe disorder (QRSd: 240 ms) thatis similar to complete LBBB. T waves with polarity matching with QRS from V3 to V6. Convergence of QRS with T wave that outlines smoothdiphasic wave or sine curve.
Typical ECG example of patient with extremely high level of serum potassium
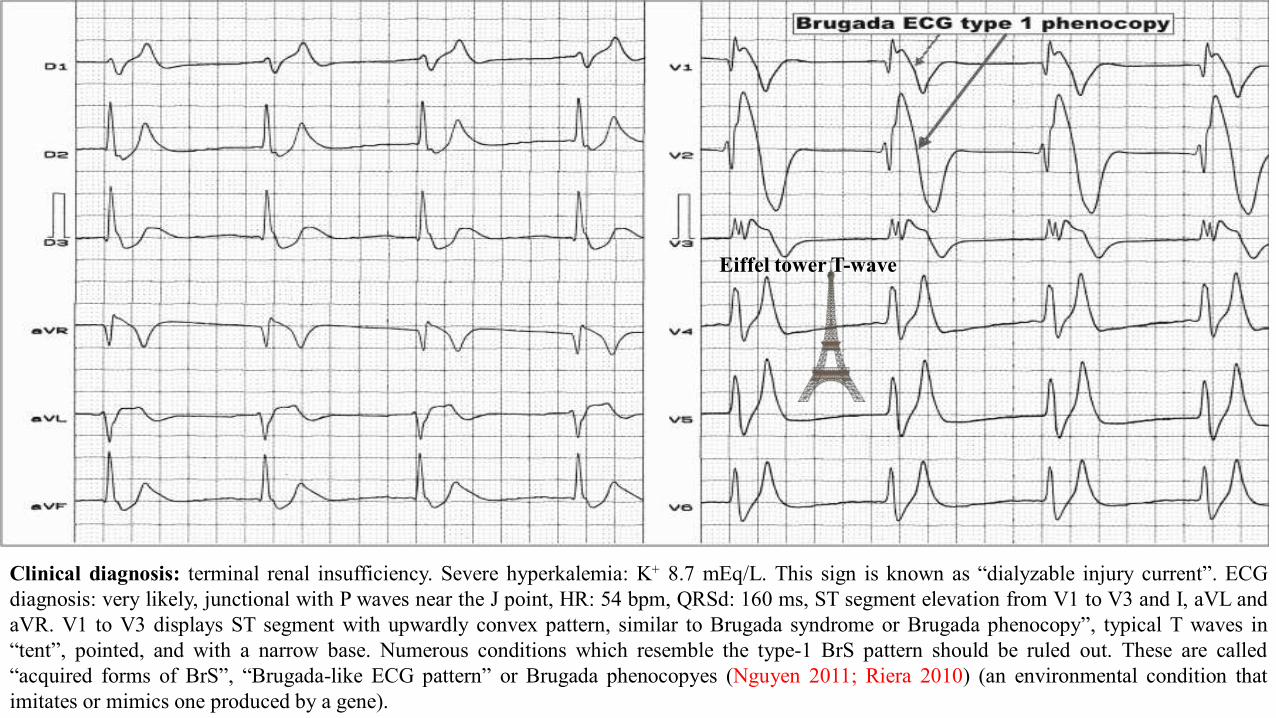
Clinical diagnosis: terminal renal insufficiency. Severe hyperkalemia: K+ 8.7 mEq/L. This sign is known as “dialyzable injury current”. ECGdiagnosis: very likely, junctional with P waves near the J point, HR: 54 bpm, QRSd: 160 ms, ST segment elevation from V1 to V3 and I, aVL andaVR. V1 to V3 displays ST segment with upwardly convex pattern, similar to Brugada syndrome or Brugada phenocopy”, typical T waves in“tent”, pointed, and with a narrow base. Numerous conditions which resemble the type-1 BrS pattern should be ruled out. These are called“acquired forms of BrS”, “Brugada-like ECG pattern” or Brugada phenocopyes (Nguyen 2011; Riera 2010) (an environmental condition thatimitates or mimics one produced by a gene).
Eiffel tower T-wave
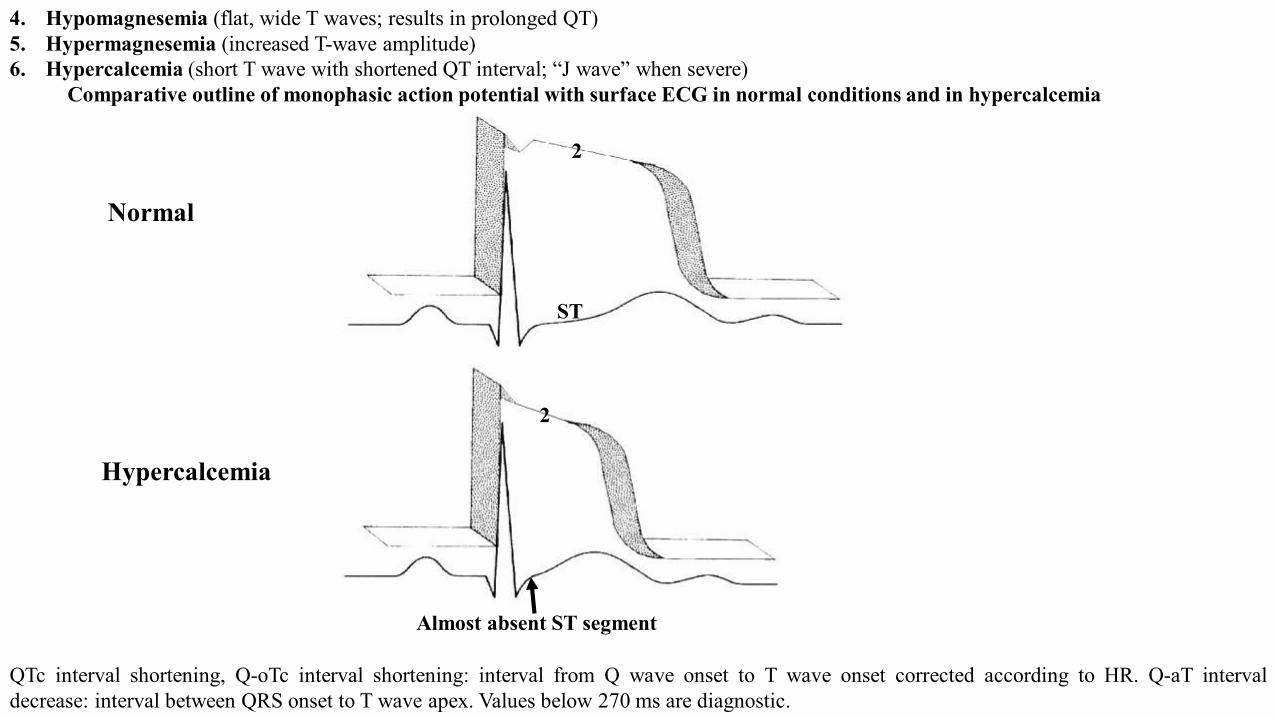
4. Hypomagnesemia (flat, wide T waves; results in prolonged QT)5. Hypermagnesemia (increased T-wave amplitude)6. Hypercalcemia (short T wave with shortened QT interval; “J wave” when severe)
Comparative outline of monophasic action potential with surface ECG in normal conditions and in hypercalcemia
Normal
Hypercalcemia
Almost absent ST segment
ST
2
2
QTc interval shortening, Q-oTc interval shortening: interval from Q wave onset to T wave onset corrected according to HR. Q-aT intervaldecrease: interval between QRS onset to T wave apex. Values below 270 ms are diagnostic.
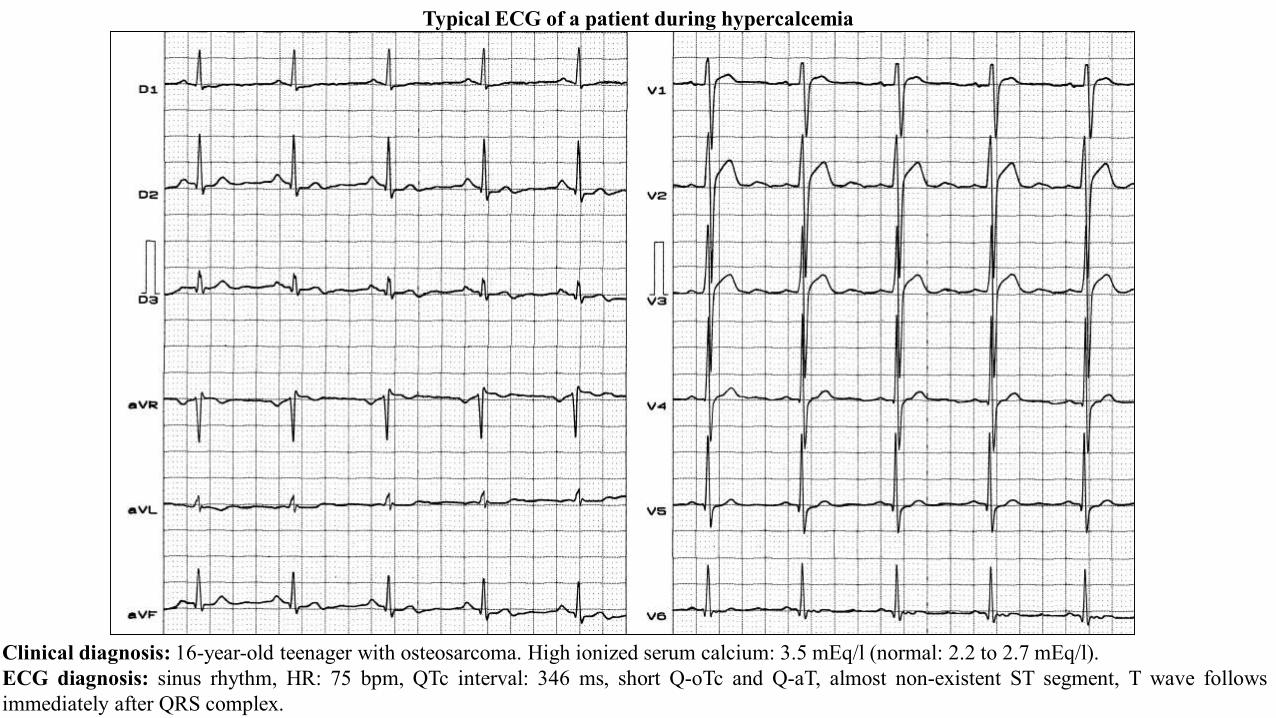
Clinical diagnosis: 16-year-old teenager with osteosarcoma. High ionized serum calcium: 3.5 mEq/l (normal: 2.2 to 2.7 mEq/l).ECG diagnosis: sinus rhythm, HR: 75 bpm, QTc interval: 346 ms, short Q-oTc and Q-aT, almost non-existent ST segment, T wave followsimmediately after QRS complex.
Typical ECG of a patient during hypercalcemia
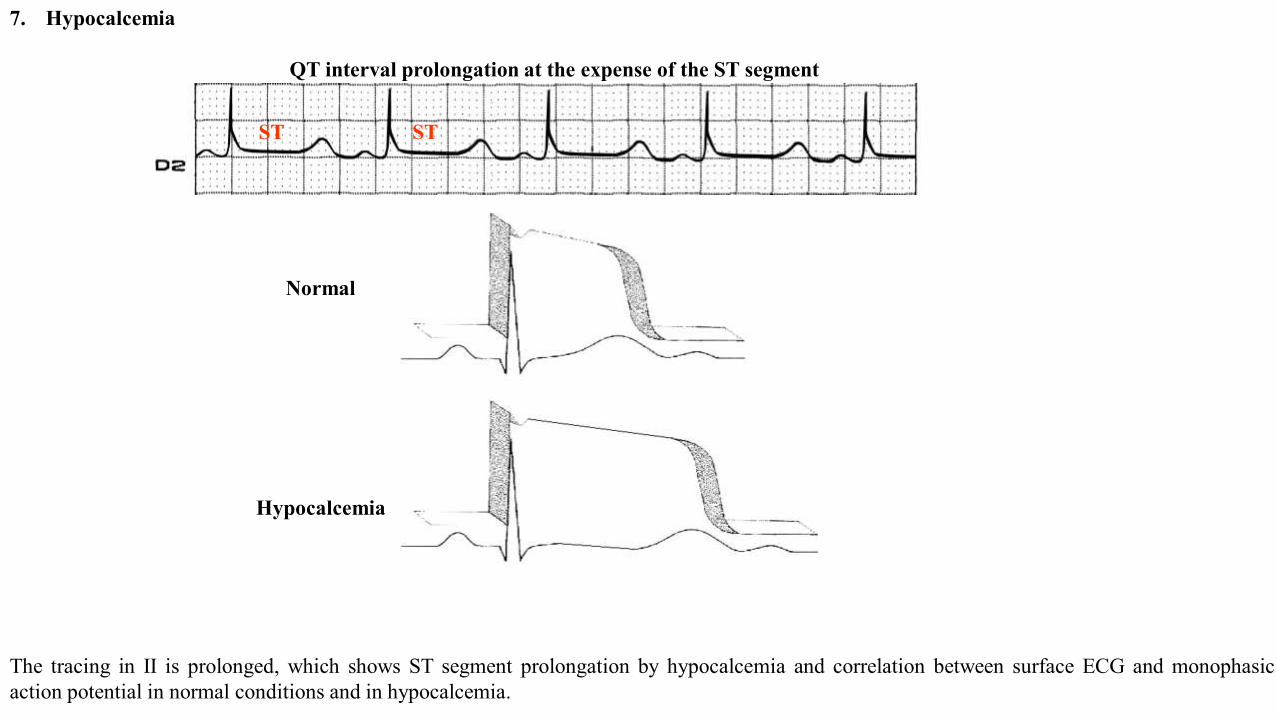
7. Hypocalcemia
QT interval prolongation at the expense of the ST segment
Normal
Hypocalcemia
ST ST
The tracing in II is prolonged, which shows ST segment prolongation by hypocalcemia and correlation between surface ECG and monophasicaction potential in normal conditions and in hypocalcemia.
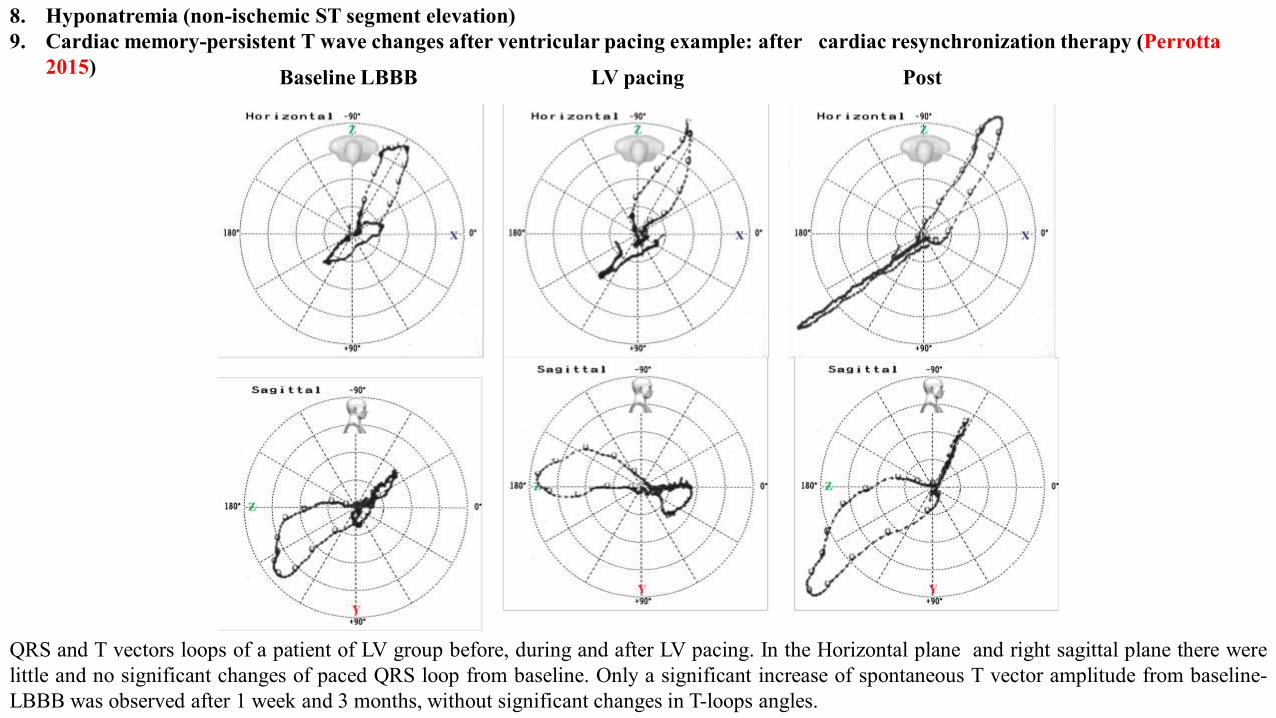
8. Hyponatremia (non-ischemic ST segment elevation)9. Cardiac memory-persistent T wave changes after ventricular pacing example: after cardiac resynchronization therapy (Perrotta
2015)
QRS and T vectors loops of a patient of LV group before, during and after LV pacing. In the Horizontal plane and right sagittal plane there werelittle and no significant changes of paced QRS loop from baseline. Only a significant increase of spontaneous T vector amplitude from baseline-LBBB was observed after 1 week and 3 months, without significant changes in T-loops angles.
Baseline LBBB LV pacing Post
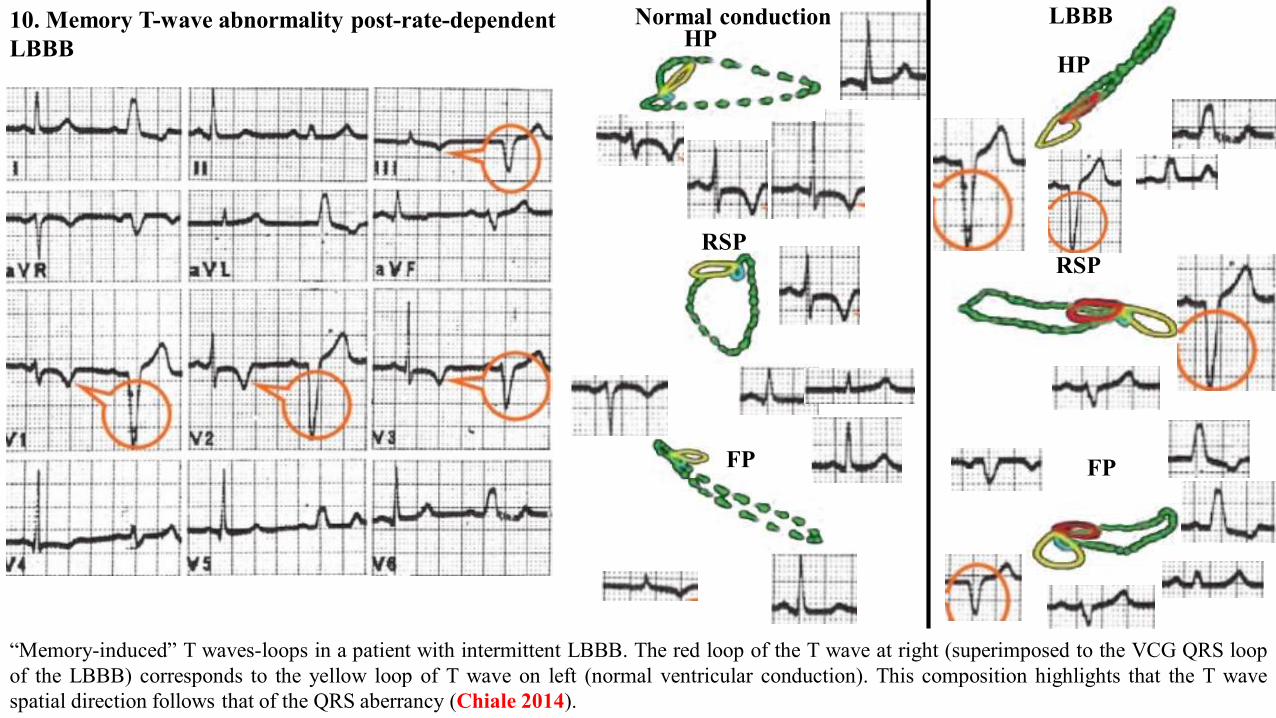
10. Memory T-wave abnormality post-rate-dependent LBBB
“Memory-induced” T waves-loops in a patient with intermittent LBBB. The red loop of the T wave at right (superimposed to the VCG QRS loopof the LBBB) corresponds to the yellow loop of T wave on left (normal ventricular conduction). This composition highlights that the T wavespatial direction follows that of the QRS aberrancy (Chiale 2014).
HP
RSP
FP
HP
RSP
FP
LBBBNormal conduction
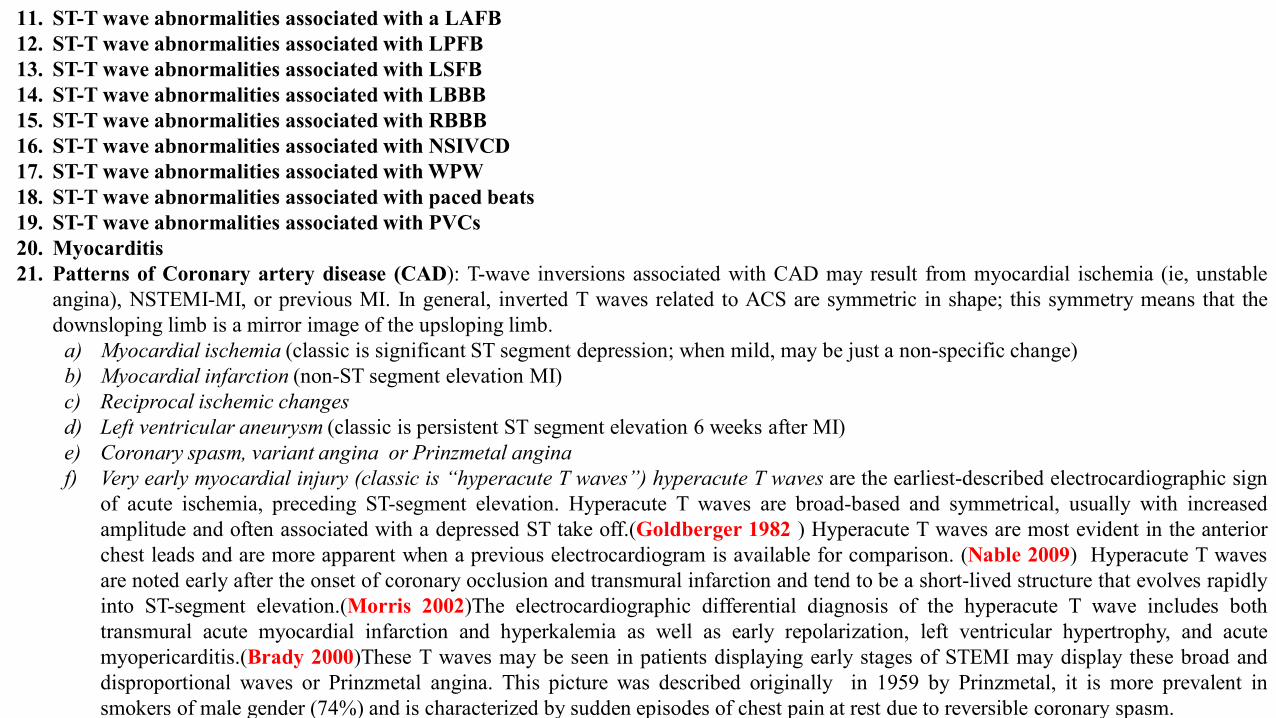
11. ST-T wave abnormalities associated with a LAFB12. ST-T wave abnormalities associated with LPFB13. ST-T wave abnormalities associated with LSFB14. ST-T wave abnormalities associated with LBBB15. ST-T wave abnormalities associated with RBBB16. ST-T wave abnormalities associated with NSIVCD17. ST-T wave abnormalities associated with WPW18. ST-T wave abnormalities associated with paced beats19. ST-T wave abnormalities associated with PVCs20. Myocarditis21. Patterns of Coronary artery disease (CAD): T-wave inversions associated with CAD may result from myocardial ischemia (ie, unstable
angina), NSTEMI-MI, or previous MI. In general, inverted T waves related to ACS are symmetric in shape; this symmetry means that thedownsloping limb is a mirror image of the upsloping limb.a) Myocardial ischemia (classic is significant ST segment depression; when mild, may be just a non-specific change)b) Myocardial infarction (non-ST segment elevation MI)c) Reciprocal ischemic changesd) Left ventricular aneurysm (classic is persistent ST segment elevation 6 weeks after MI)e) Coronary spasm, variant angina or Prinzmetal anginaf) Very early myocardial injury (classic is “hyperacute T waves”) hyperacute T waves are the earliest-described electrocardiographic sign
of acute ischemia, preceding ST-segment elevation. Hyperacute T waves are broad-based and symmetrical, usually with increasedamplitude and often associated with a depressed ST take off.(Goldberger 1982 ) Hyperacute T waves are most evident in the anteriorchest leads and are more apparent when a previous electrocardiogram is available for comparison. (Nable 2009) Hyperacute T wavesare noted early after the onset of coronary occlusion and transmural infarction and tend to be a short-lived structure that evolves rapidlyinto ST-segment elevation.(Morris 2002)The electrocardiographic differential diagnosis of the hyperacute T wave includes bothtransmural acute myocardial infarction and hyperkalemia as well as early repolarization, left ventricular hypertrophy, and acutemyopericarditis.(Brady 2000)These T waves may be seen in patients displaying early stages of STEMI may display these broad anddisproportional waves or Prinzmetal angina. This picture was described originally in 1959 by Prinzmetal, it is more prevalent insmokers of male gender (74%) and is characterized by sudden episodes of chest pain at rest due to reversible coronary spasm.
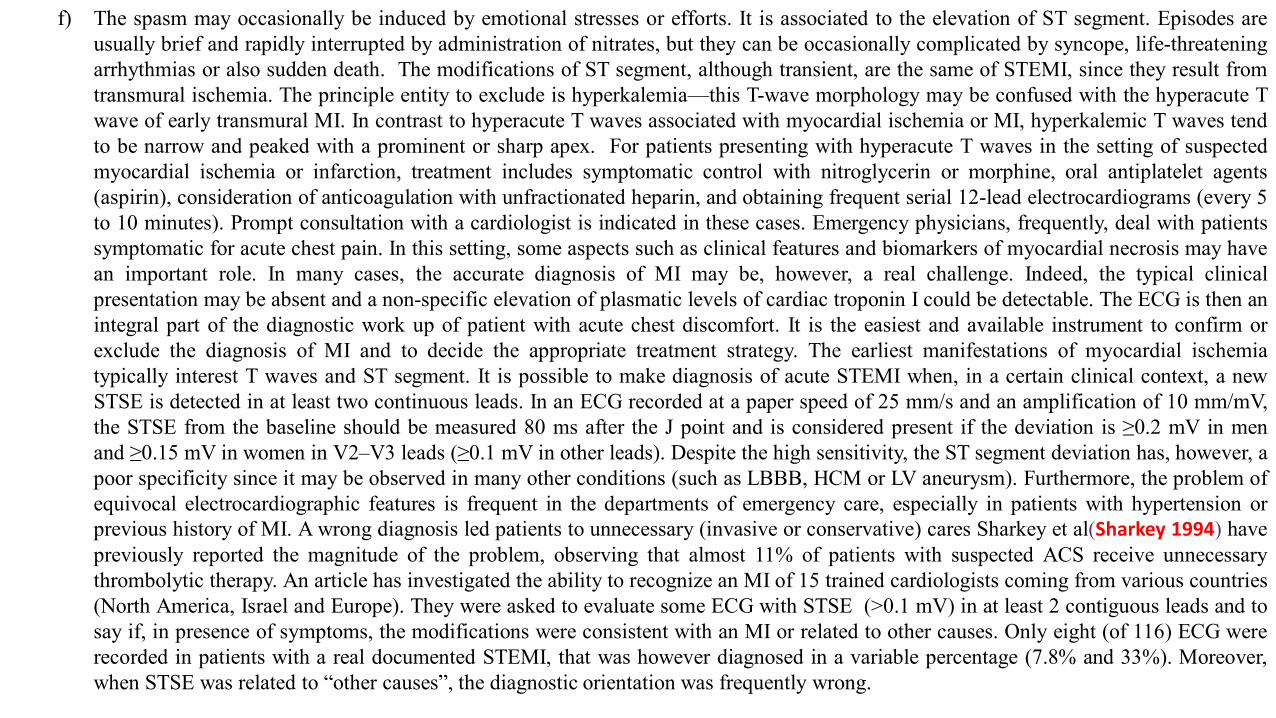
f) The spasm may occasionally be induced by emotional stresses or efforts. It is associated to the elevation of ST segment. Episodes areusually brief and rapidly interrupted by administration of nitrates, but they can be occasionally complicated by syncope, life-threateningarrhythmias or also sudden death. The modifications of ST segment, although transient, are the same of STEMI, since they result fromtransmural ischemia. The principle entity to exclude is hyperkalemia—this T-wave morphology may be confused with the hyperacute Twave of early transmural MI. In contrast to hyperacute T waves associated with myocardial ischemia or MI, hyperkalemic T waves tendto be narrow and peaked with a prominent or sharp apex. For patients presenting with hyperacute T waves in the setting of suspectedmyocardial ischemia or infarction, treatment includes symptomatic control with nitroglycerin or morphine, oral antiplatelet agents(aspirin), consideration of anticoagulation with unfractionated heparin, and obtaining frequent serial 12-lead electrocardiograms (every 5to 10 minutes). Prompt consultation with a cardiologist is indicated in these cases. Emergency physicians, frequently, deal with patientssymptomatic for acute chest pain. In this setting, some aspects such as clinical features and biomarkers of myocardial necrosis may havean important role. In many cases, the accurate diagnosis of MI may be, however, a real challenge. Indeed, the typical clinicalpresentation may be absent and a non-specific elevation of plasmatic levels of cardiac troponin I could be detectable. The ECG is then anintegral part of the diagnostic work up of patient with acute chest discomfort. It is the easiest and available instrument to confirm orexclude the diagnosis of MI and to decide the appropriate treatment strategy. The earliest manifestations of myocardial ischemiatypically interest T waves and ST segment. It is possible to make diagnosis of acute STEMI when, in a certain clinical context, a newSTSE is detected in at least two continuous leads. In an ECG recorded at a paper speed of 25 mm/s and an amplification of 10 mm/mV,the STSE from the baseline should be measured 80 ms after the J point and is considered present if the deviation is ≥0.2 mV in menand ≥0.15 mV in women in V2–V3 leads (≥0.1 mV in other leads). Despite the high sensitivity, the ST segment deviation has, however, apoor specificity since it may be observed in many other conditions (such as LBBB, HCM or LV aneurysm). Furthermore, the problem ofequivocal electrocardiographic features is frequent in the departments of emergency care, especially in patients with hypertension orprevious history of MI. A wrong diagnosis led patients to unnecessary (invasive or conservative) cares Sharkey et al(Sharkey 1994) havepreviously reported the magnitude of the problem, observing that almost 11% of patients with suspected ACS receive unnecessarythrombolytic therapy. An article has investigated the ability to recognize an MI of 15 trained cardiologists coming from various countries(North America, Israel and Europe). They were asked to evaluate some ECG with STSE (>0.1 mV) in at least 2 contiguous leads and tosay if, in presence of symptoms, the modifications were consistent with an MI or related to other causes. Only eight (of 116) ECG wererecorded in patients with a real documented STEMI, that was however diagnosed in a variable percentage (7.8% and 33%). Moreover,when STSE was related to “other causes”, the diagnostic orientation was frequently wrong.
12-lead electrocardiogram from a 47-year-old man presenting to the Emergency Department with left-sided chest discomfort, nowresolved following sublingual nitroglycerin. Demonstrates normal sinus rhythm with nonspecific ST-T wave changes includingflattening of T waves in the inferior and lateral leads.
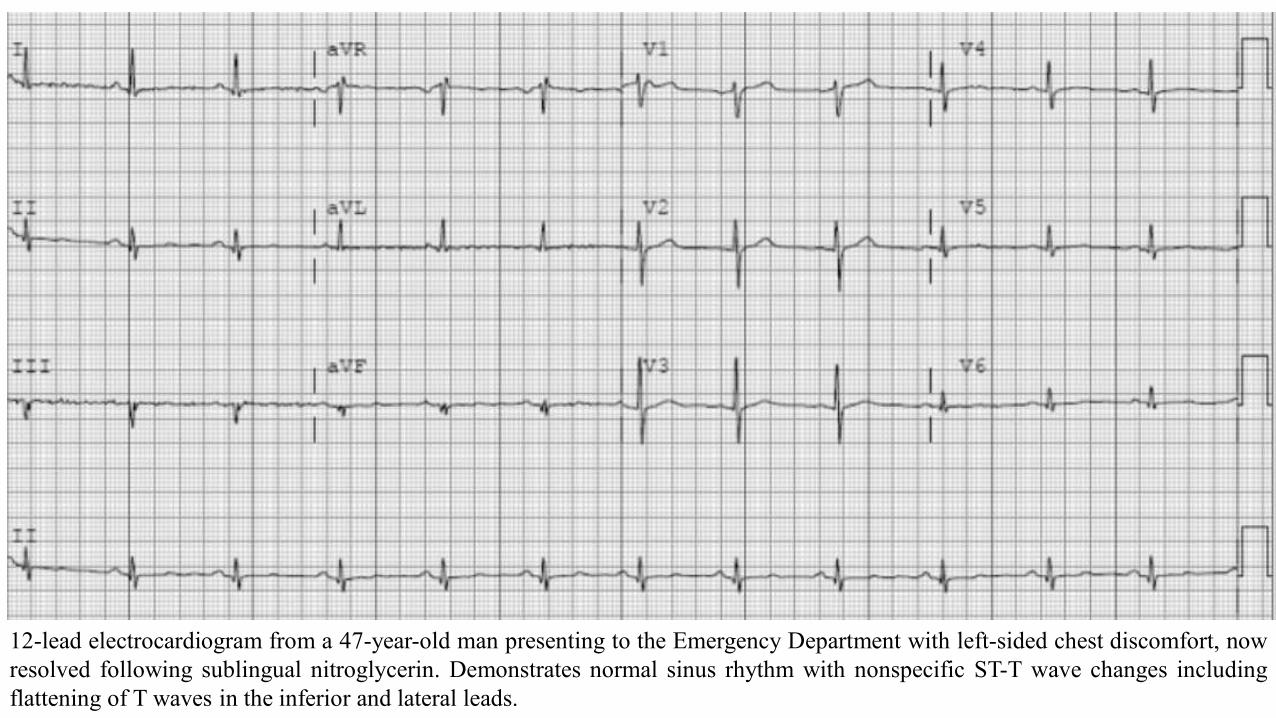
12-lead electrocardiogram from same patient, obtained 90 minutes later, with patient now experiencing 5/10 left-sided chest discomfort.Demonstrates large, symmetric T waves with depressed ST-segment take off consistent with hyperacute T waves in the anterior leads V2–V4.
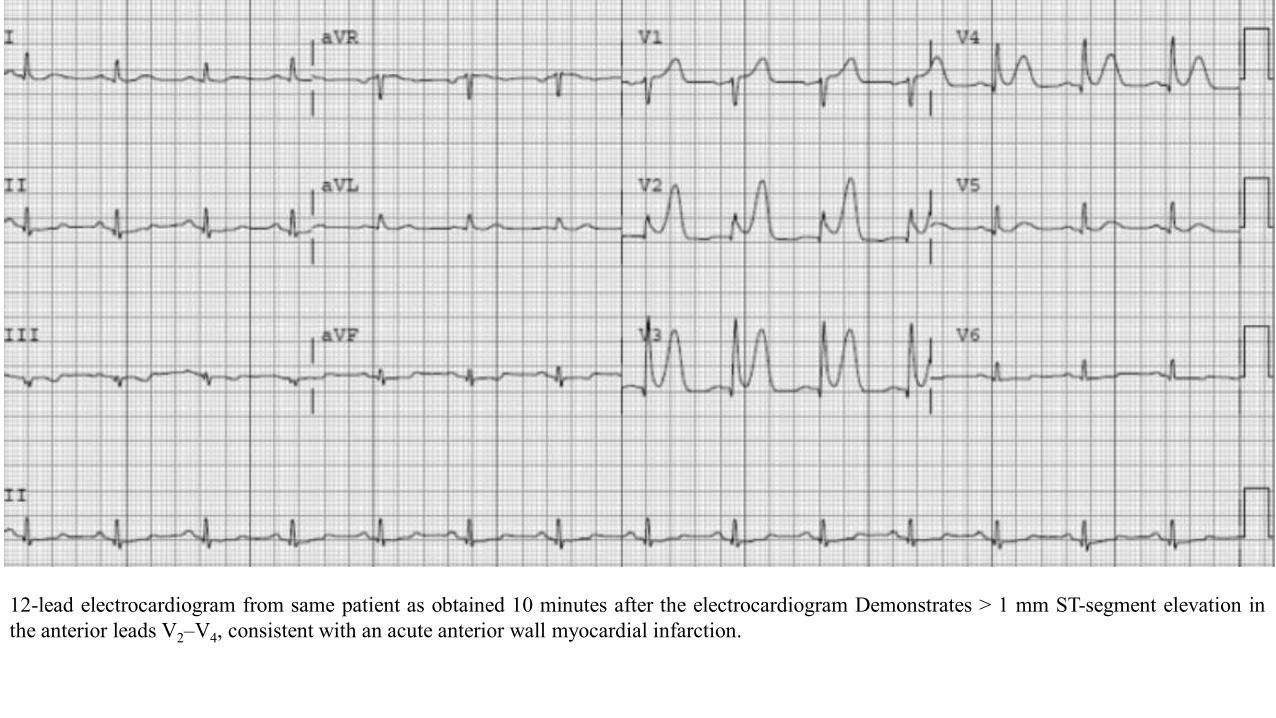
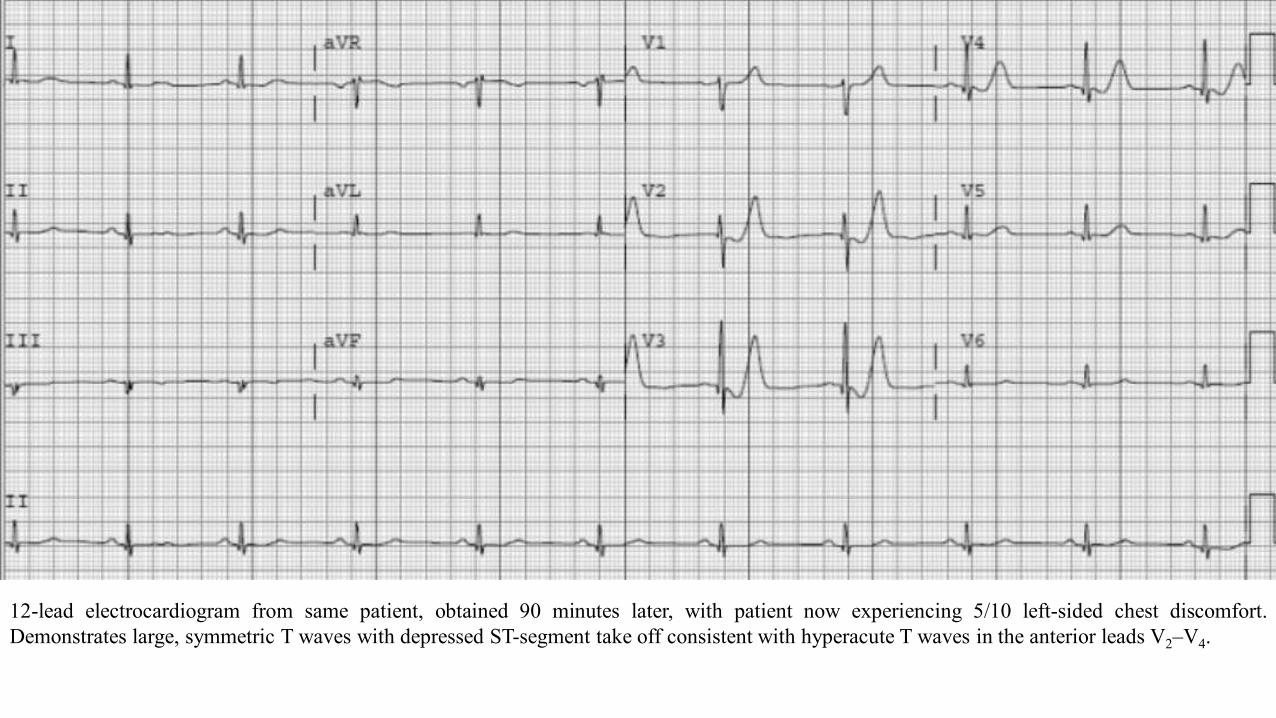
12-lead electrocardiogram from same patient as obtained 10 minutes after the electrocardiogram Demonstrates > 1 mm ST-segment elevation inthe anterior leads V2–V4, consistent with an acute anterior wall myocardial infarction.
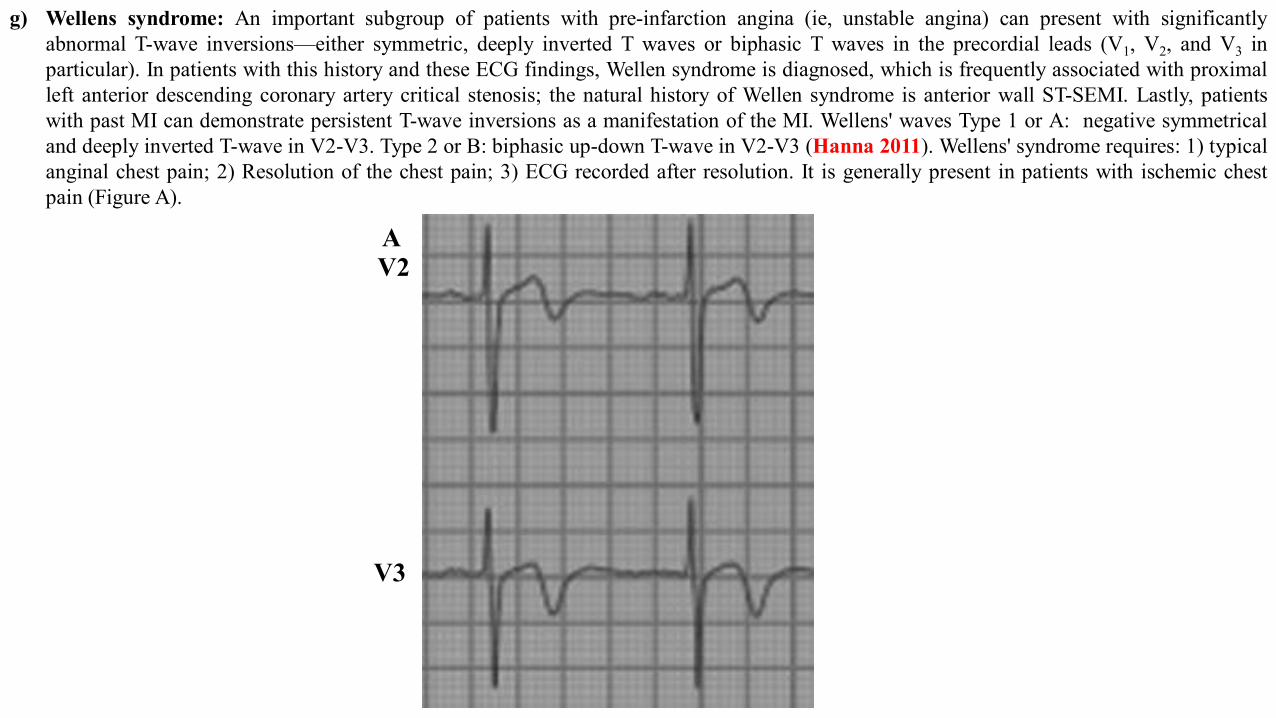
g) Wellens syndrome: An important subgroup of patients with pre-infarction angina (ie, unstable angina) can present with significantlyabnormal T-wave inversions—either symmetric, deeply inverted T waves or biphasic T waves in the precordial leads (V1, V2, and V3 inparticular). In patients with this history and these ECG findings, Wellen syndrome is diagnosed, which is frequently associated with proximalleft anterior descending coronary artery critical stenosis; the natural history of Wellen syndrome is anterior wall ST-SEMI. Lastly, patientswith past MI can demonstrate persistent T-wave inversions as a manifestation of the MI. Wellens' waves Type 1 or A: negative symmetricaland deeply inverted T-wave in V2-V3. Type 2 or B: biphasic up-down T-wave in V2-V3 (Hanna 2011). Wellens' syndrome requires: 1) typicalanginal chest pain; 2) Resolution of the chest pain; 3) ECG recorded after resolution. It is generally present in patients with ischemic chestpain (Figure A).
AV2
V3
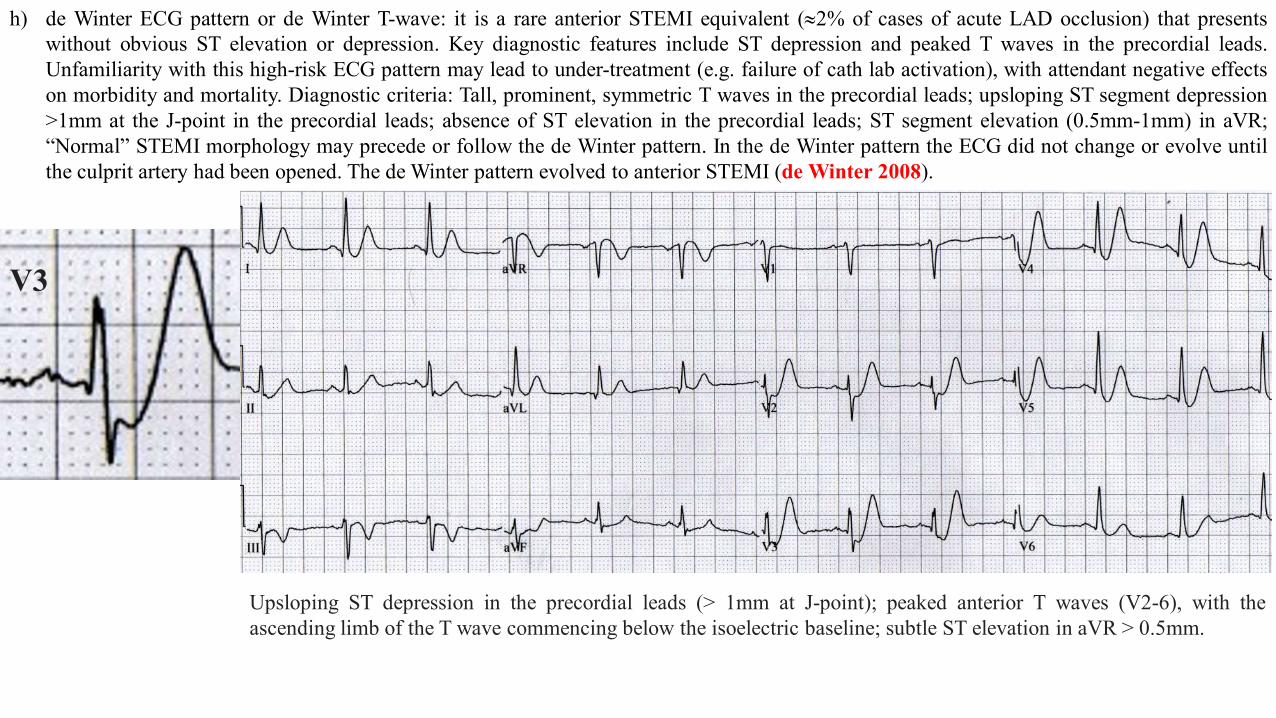
h) de Winter ECG pattern or de Winter T-wave: it is a rare anterior STEMI equivalent (|2% of cases of acute LAD occlusion) that presentswithout obvious ST elevation or depression. Key diagnostic features include ST depression and peaked T waves in the precordial leads.Unfamiliarity with this high-risk ECG pattern may lead to under-treatment (e.g. failure of cath lab activation), with attendant negative effectson morbidity and mortality. Diagnostic criteria: Tall, prominent, symmetric T waves in the precordial leads; upsloping ST segment depression>1mm at the J-point in the precordial leads; absence of ST elevation in the precordial leads; ST segment elevation (0.5mm-1mm) in aVR;“Normal” STEMI morphology may precede or follow the de Winter pattern. In the de Winter pattern the ECG did not change or evolve untilthe culprit artery had been opened. The de Winter pattern evolved to anterior STEMI (de Winter 2008).
Upsloping ST depression in the precordial leads (> 1mm at J-point); peaked anterior T waves (V2-6), with theascending limb of the T wave commencing below the isoelectric baseline; subtle ST elevation in aVR > 0.5mm.
V3
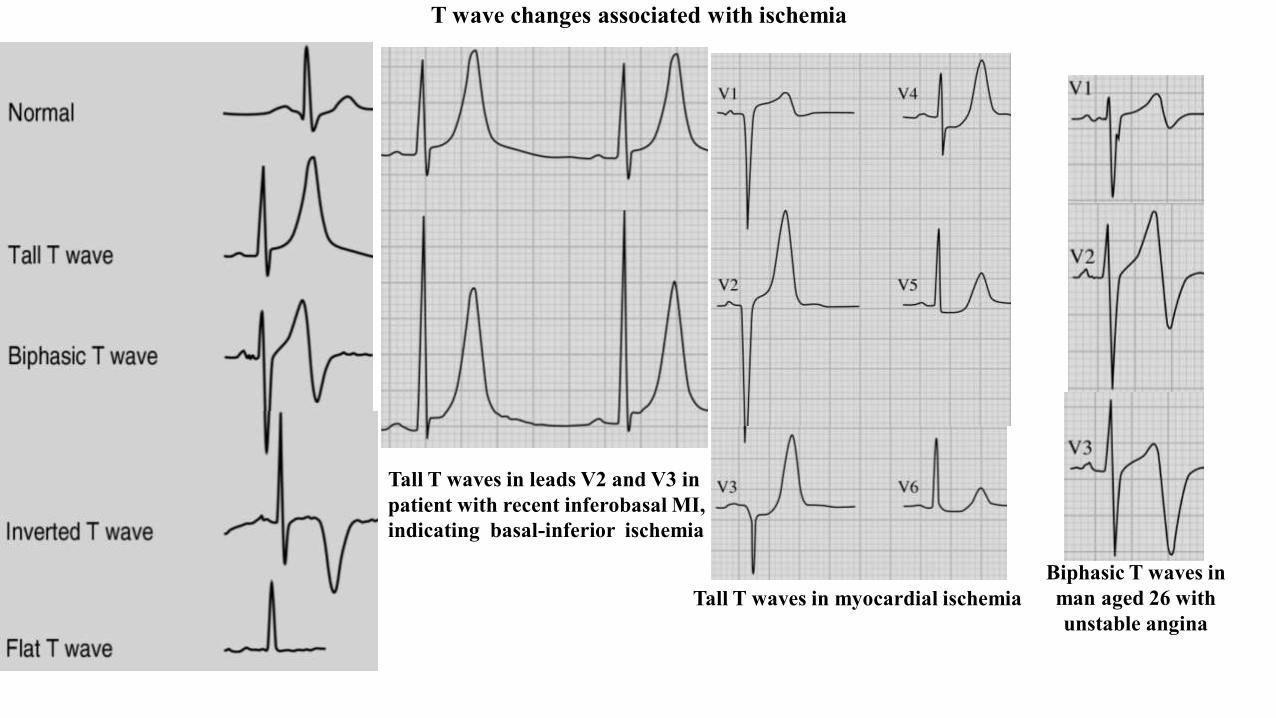
T wave changes associated with ischemia
Tall T waves in leads V2 and V3 in patient with recent inferobasal MI, indicating basal-inferior ischemia
Tall T waves in myocardial ischemiaBiphasic T waves in man aged 26 with unstable angina
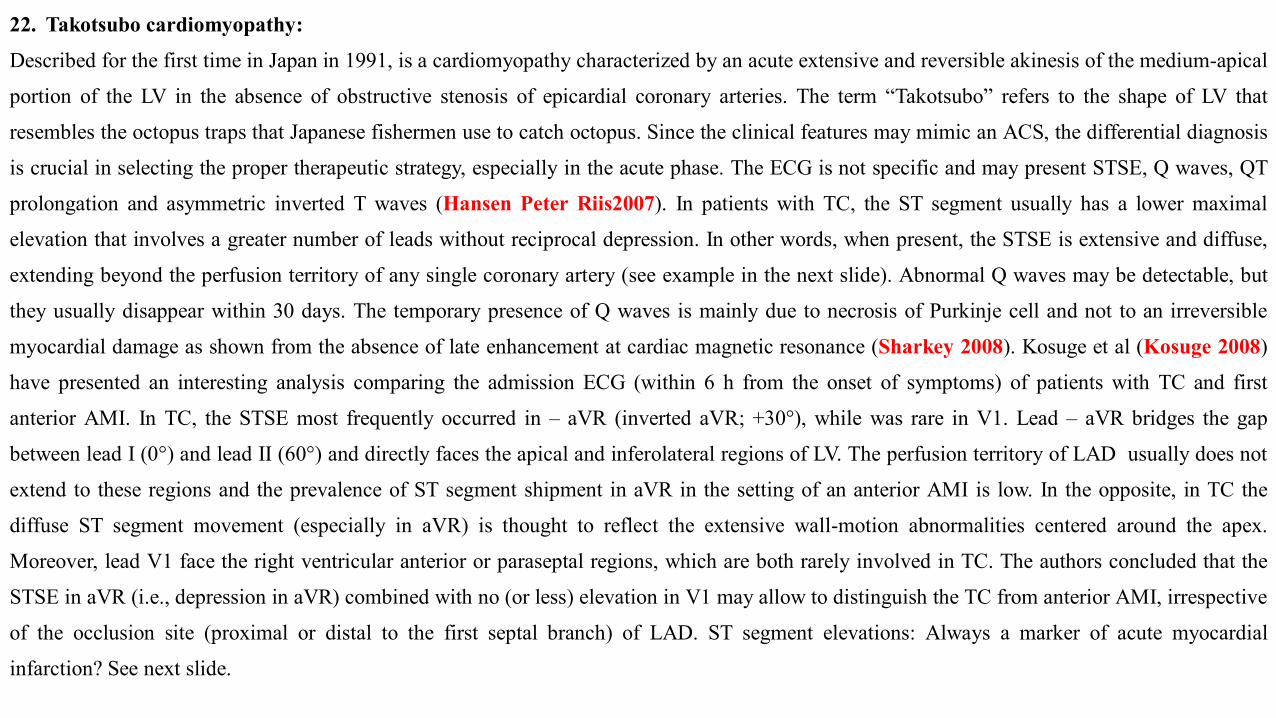
22. Takotsubo cardiomyopathy:
Described for the first time in Japan in 1991, is a cardiomyopathy characterized by an acute extensive and reversible akinesis of the medium-apical
portion of the LV in the absence of obstructive stenosis of epicardial coronary arteries. The term “Takotsubo” refers to the shape of LV that
resembles the octopus traps that Japanese fishermen use to catch octopus. Since the clinical features may mimic an ACS, the differential diagnosis
is crucial in selecting the proper therapeutic strategy, especially in the acute phase. The ECG is not specific and may present STSE, Q waves, QT
prolongation and asymmetric inverted T waves (Hansen Peter Riis2007). In patients with TC, the ST segment usually has a lower maximal
elevation that involves a greater number of leads without reciprocal depression. In other words, when present, the STSE is extensive and diffuse,
extending beyond the perfusion territory of any single coronary artery (see example in the next slide). Abnormal Q waves may be detectable, but
they usually disappear within 30 days. The temporary presence of Q waves is mainly due to necrosis of Purkinje cell and not to an irreversible
myocardial damage as shown from the absence of late enhancement at cardiac magnetic resonance (Sharkey 2008). Kosuge et al (Kosuge 2008)
have presented an interesting analysis comparing the admission ECG (within 6 h from the onset of symptoms) of patients with TC and first
anterior AMI. In TC, the STSE most frequently occurred in – aVR (inverted aVR; +30°), while was rare in V1. Lead – aVR bridges the gap
between lead I (0°) and lead II (60°) and directly faces the apical and inferolateral regions of LV. The perfusion territory of LAD usually does not
extend to these regions and the prevalence of ST segment shipment in aVR in the setting of an anterior AMI is low. In the opposite, in TC the
diffuse ST segment movement (especially in aVR) is thought to reflect the extensive wall-motion abnormalities centered around the apex.
Moreover, lead V1 face the right ventricular anterior or paraseptal regions, which are both rarely involved in TC. The authors concluded that the
STSE in aVR (i.e., depression in aVR) combined with no (or less) elevation in V1 may allow to distinguish the TC from anterior AMI, irrespective
of the occlusion site (proximal or distal to the first septal branch) of LAD. ST segment elevations: Always a marker of acute myocardial
infarction? See next slide.
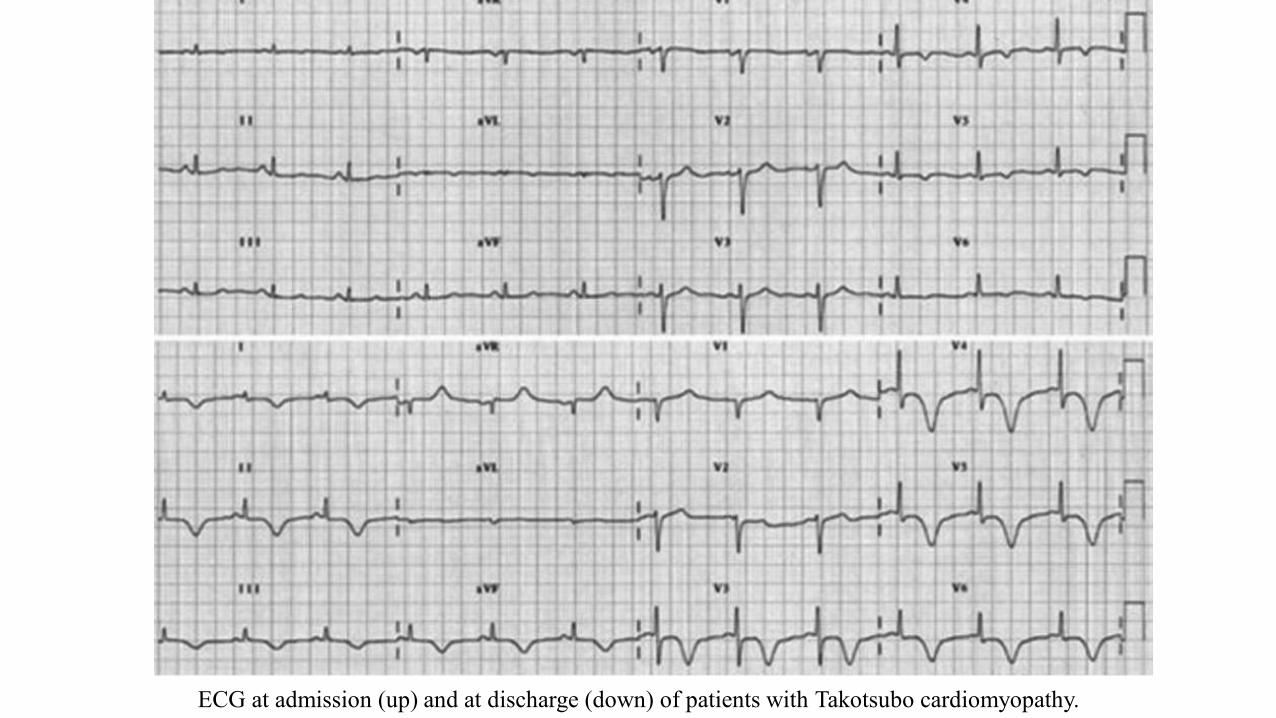
ECG at admission (up) and at discharge (down) of patients with Takotsubo cardiomyopathy.
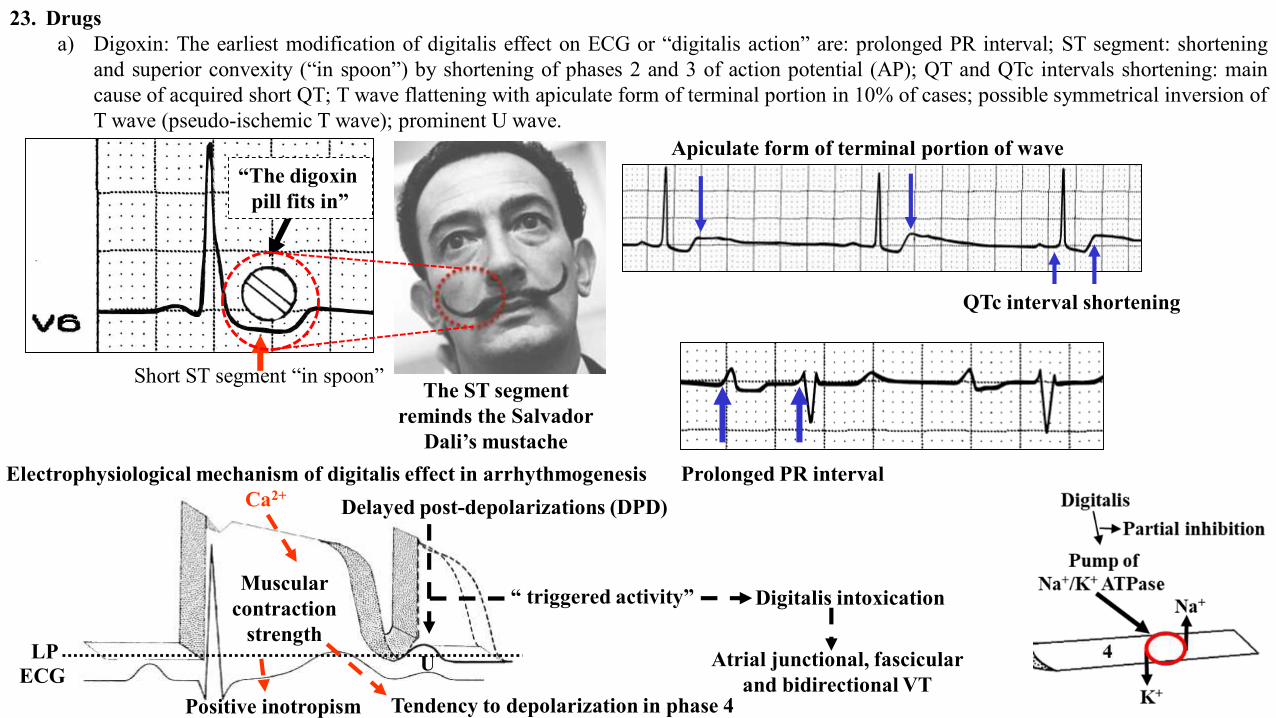
23. Drugsa) Digoxin: The earliest modification of digitalis effect on ECG or “digitalis action” are: prolonged PR interval; ST segment: shortening
and superior convexity (“in spoon”) by shortening of phases 2 and 3 of action potential (AP); QT and QTc intervals shortening: maincause of acquired short QT; T wave flattening with apiculate form of terminal portion in 10% of cases; possible symmetrical inversion ofT wave (pseudo-ischemic T wave); prominent U wave.
Short ST segment “in spoon”
“The digoxinpill fits in”
Prolonged PR interval
Apiculate form of terminal portion of wave
QTc interval shortening
The ST segment reminds the Salvador
Dali’s mustacheElectrophysiological mechanism of digitalis effect in arrhythmogenesis
LP
Delayed post-depolarizations (DPD)
Digitalis intoxication
ECG U Atrial junctional, fascicular and bidirectional VT
“ triggered activity”
Ca2+
Muscular contraction
strength
Positive inotropism Tendency to depolarization in phase 4
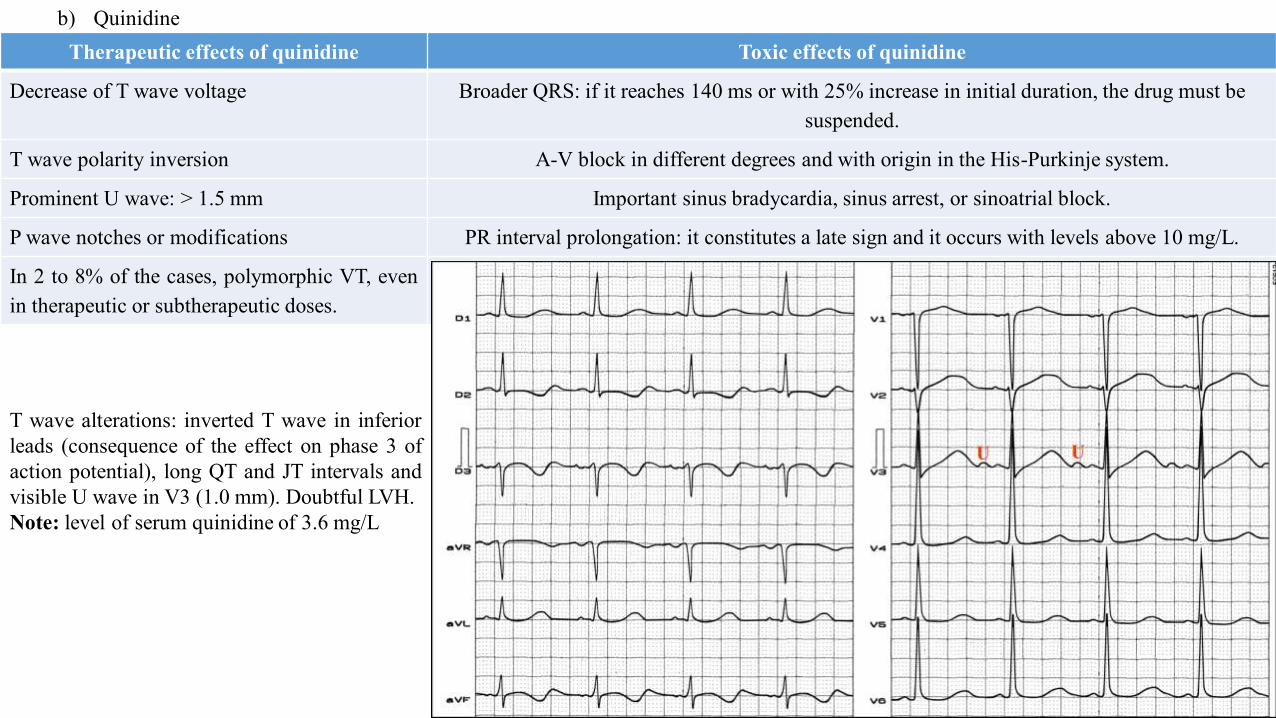
b) QuinidineTherapeutic effects of quinidine Toxic effects of quinidine
Decrease of T wave voltage Broader QRS: if it reaches 140 ms or with 25% increase in initial duration, the drug must be suspended.
T wave polarity inversion A-V block in different degrees and with origin in the His-Purkinje system.
Prominent U wave: > 1.5 mm Important sinus bradycardia, sinus arrest, or sinoatrial block.
P wave notches or modifications PR interval prolongation: it constitutes a late sign and it occurs with levels above 10 mg/L.
In 2 to 8% of the cases, polymorphic VT, evenin therapeutic or subtherapeutic doses.
T wave alterations: inverted T wave in inferiorleads (consequence of the effect on phase 3 ofaction potential), long QT and JT intervals andvisible U wave in V3 (1.0 mm). Doubtful LVH.Note: level of serum quinidine of 3.6 mg/L
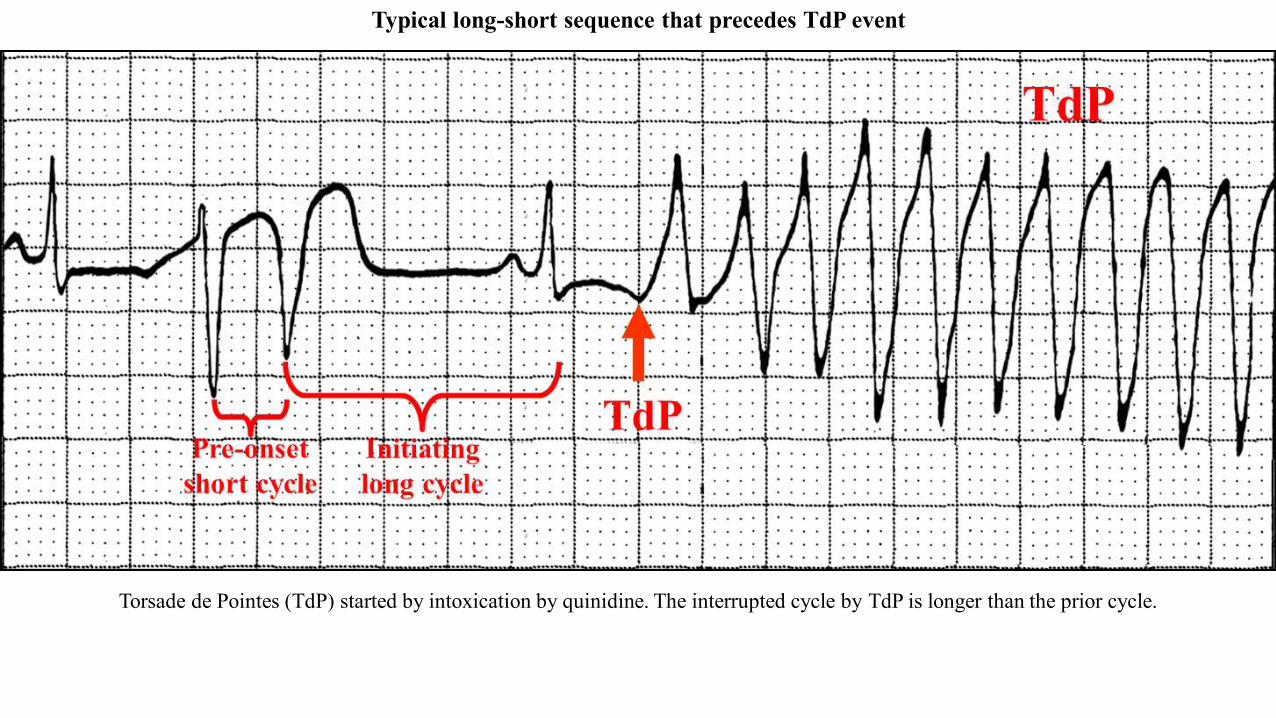
Torsade de Pointes (TdP) started by intoxication by quinidine. The interrupted cycle by TdP is longer than the prior cycle.
Typical long-short sequence that precedes TdP event
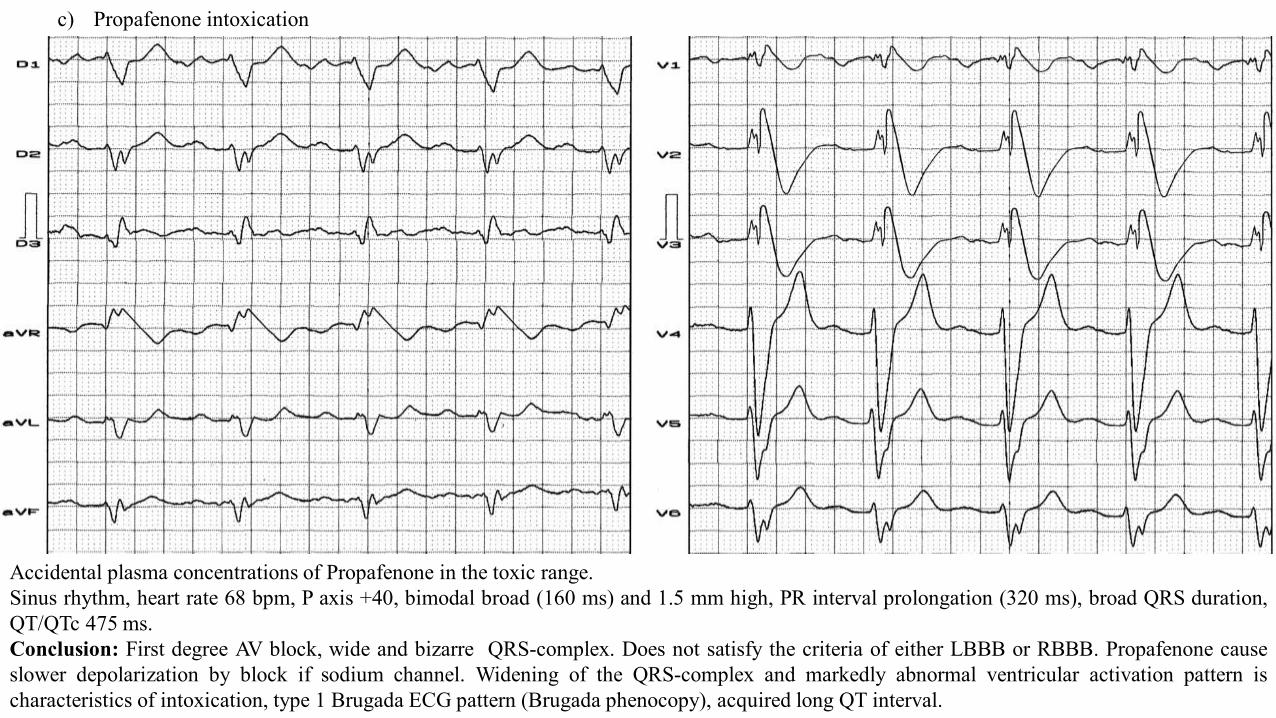
c) Propafenone intoxication
Accidental plasma concentrations of Propafenone in the toxic range.Sinus rhythm, heart rate 68 bpm, P axis +40, bimodal broad (160 ms) and 1.5 mm high, PR interval prolongation (320 ms), broad QRS duration,QT/QTc 475 ms.Conclusion: First degree AV block, wide and bizarre QRS-complex. Does not satisfy the criteria of either LBBB or RBBB. Propafenone causeslower depolarization by block if sodium channel. Widening of the QRS-complex and markedly abnormal ventricular activation pattern ischaracteristics of intoxication, type 1 Brugada ECG pattern (Brugada phenocopy), acquired long QT interval.
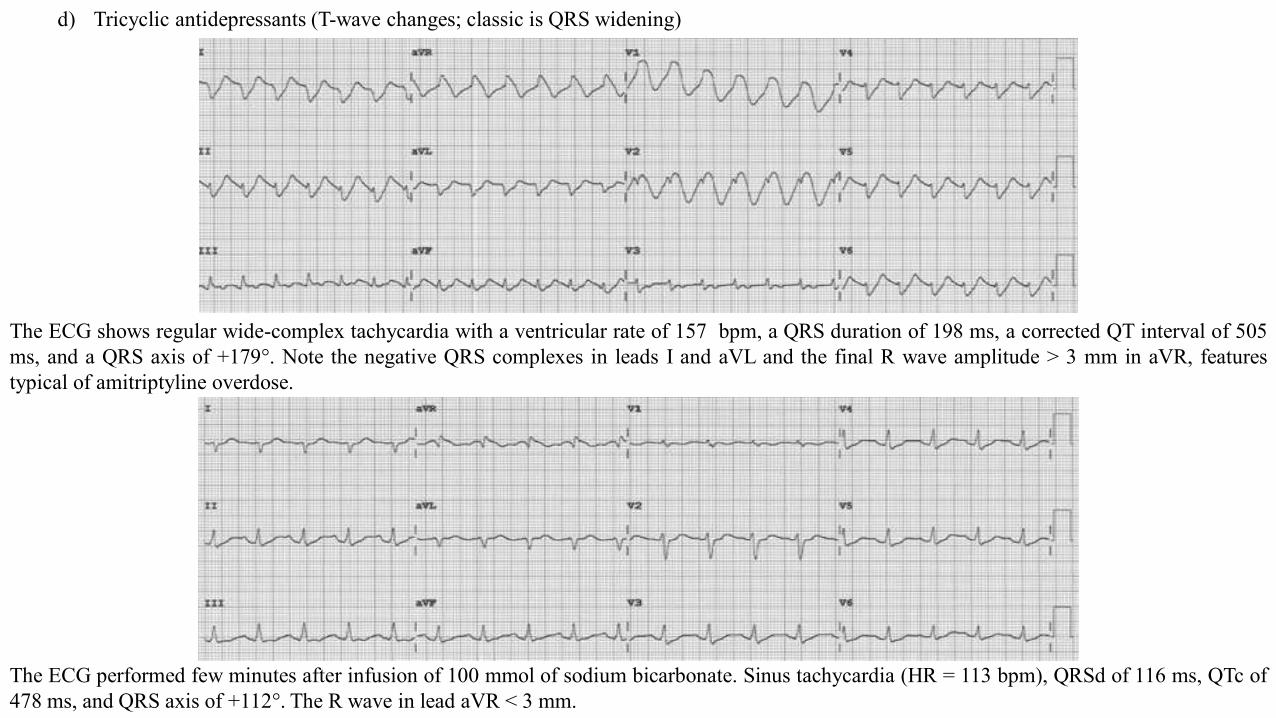
The ECG shows regular wide-complex tachycardia with a ventricular rate of 157 bpm, a QRS duration of 198 ms, a corrected QT interval of 505ms, and a QRS axis of +179°. Note the negative QRS complexes in leads I and aVL and the final R wave amplitude > 3 mm in aVR, featurestypical of amitriptyline overdose.
The ECG performed few minutes after infusion of 100 mmol of sodium bicarbonate. Sinus tachycardia (HR = 113 bpm), QRSd of 116 ms, QTc of478 ms, and QRS axis of +112°. The R wave in lead aVR < 3 mm.
d) Tricyclic antidepressants (T-wave changes; classic is QRS widening)
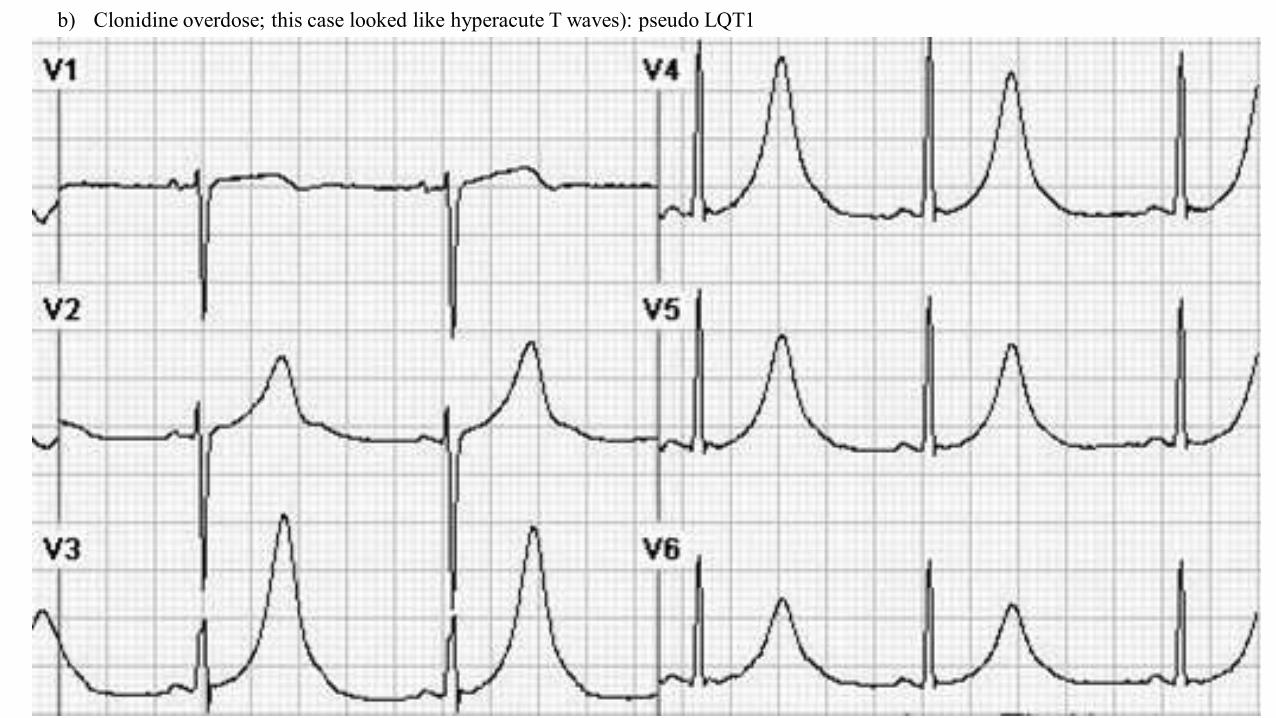
b) Clonidine overdose; this case looked like hyperacute T waves): pseudo LQT1
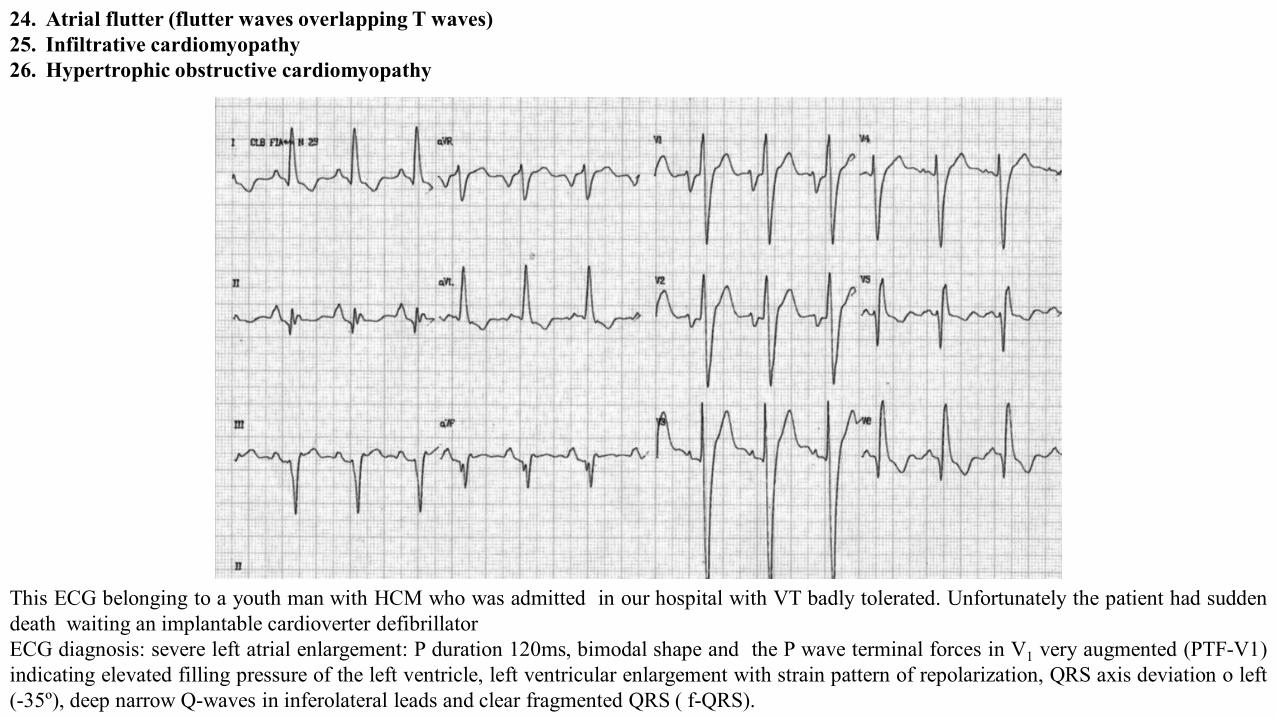
24. Atrial flutter (flutter waves overlapping T waves)25. Infiltrative cardiomyopathy26. Hypertrophic obstructive cardiomyopathy
This ECG belonging to a youth man with HCM who was admitted in our hospital with VT badly tolerated. Unfortunately the patient had suddendeath waiting an implantable cardioverter defibrillatorECG diagnosis: severe left atrial enlargement: P duration 120ms, bimodal shape and the P wave terminal forces in V1 very augmented (PTF-V1)indicating elevated filling pressure of the left ventricle, left ventricular enlargement with strain pattern of repolarization, QRS axis deviation o left(-35º), deep narrow Q-waves in inferolateral leads and clear fragmented QRS ( f-QRS).
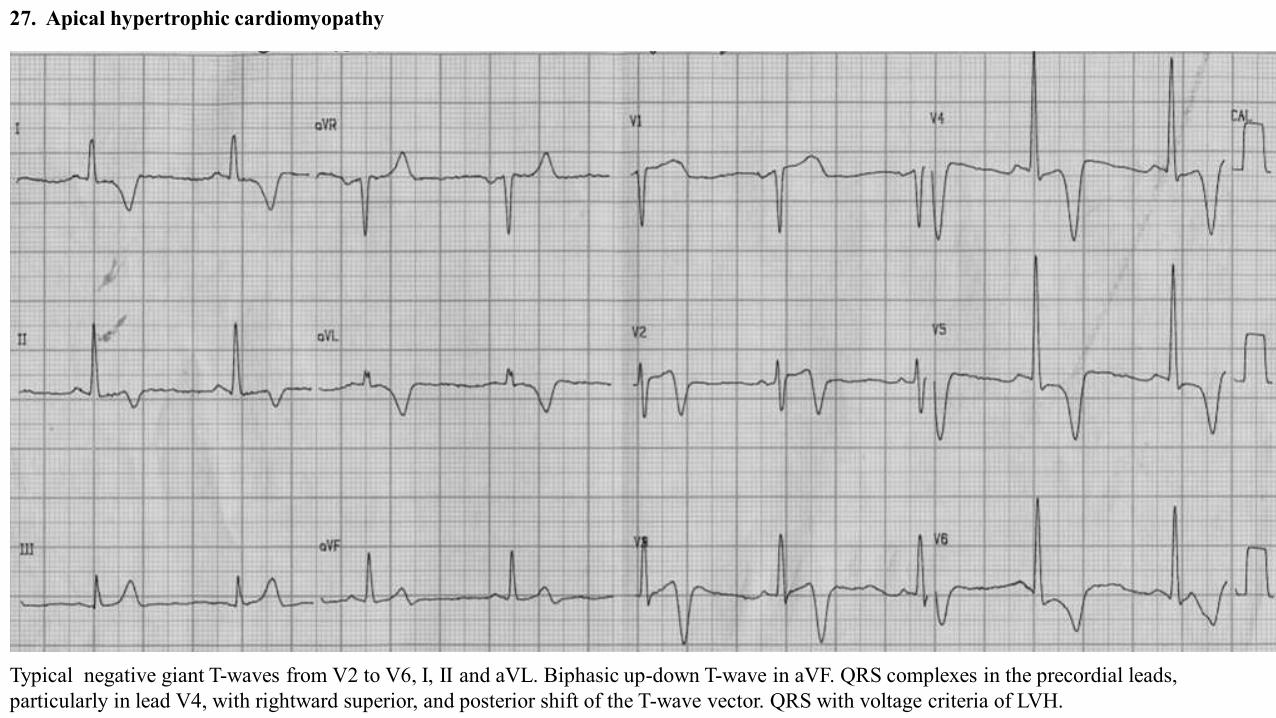
27. Apical hypertrophic cardiomyopathy
Typical negative giant T-waves from V2 to V6, I, II and aVL. Biphasic up-down T-wave in aVF. QRS complexes in the precordial leads, particularly in lead V4, with rightward superior, and posterior shift of the T-wave vector. QRS with voltage criteria of LVH.
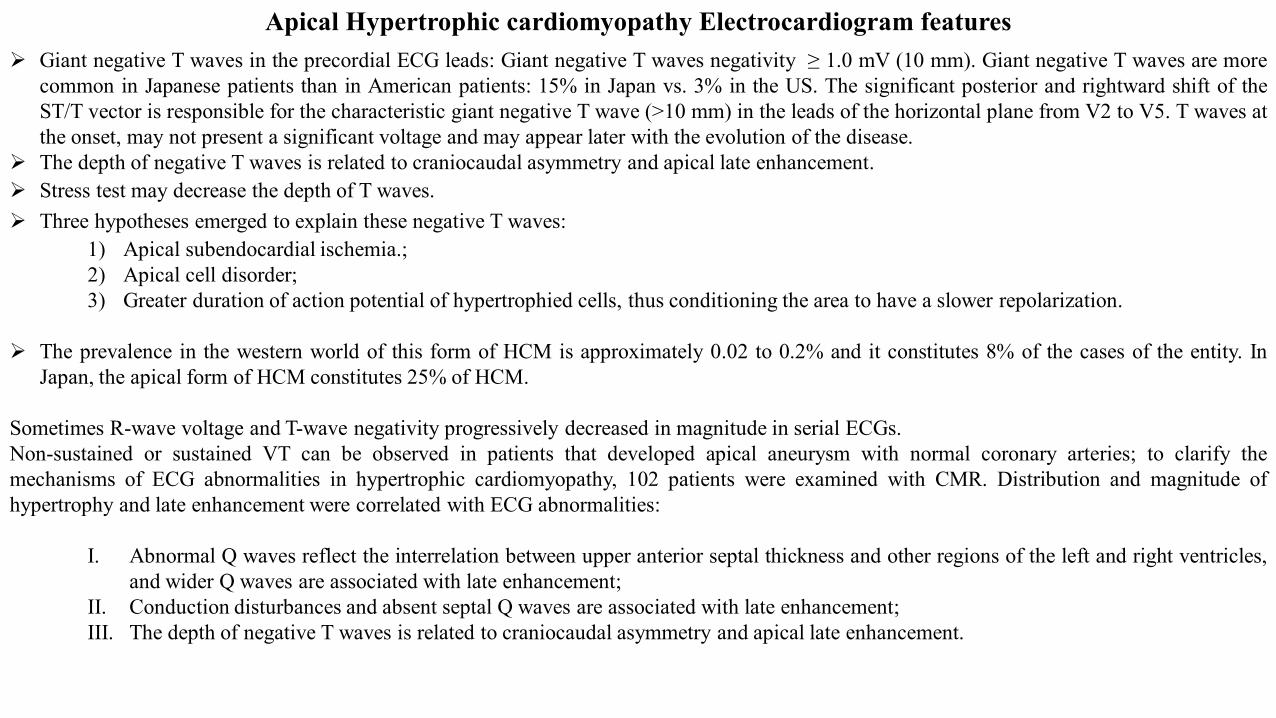
➢ Giant negative T waves in the precordial ECG leads: Giant negative T waves negativity ≥ 1.0 mV (10 mm). Giant negative T waves are morecommon in Japanese patients than in American patients: 15% in Japan vs. 3% in the US. The significant posterior and rightward shift of theST/T vector is responsible for the characteristic giant negative T wave (>10 mm) in the leads of the horizontal plane from V2 to V5. T waves atthe onset, may not present a significant voltage and may appear later with the evolution of the disease.
➢ The depth of negative T waves is related to craniocaudal asymmetry and apical late enhancement.➢ Stress test may decrease the depth of T waves.➢ Three hypotheses emerged to explain these negative T waves:
1) Apical subendocardial ischemia.;2) Apical cell disorder;3) Greater duration of action potential of hypertrophied cells, thus conditioning the area to have a slower repolarization.
➢ The prevalence in the western world of this form of HCM is approximately 0.02 to 0.2% and it constitutes 8% of the cases of the entity. InJapan, the apical form of HCM constitutes 25% of HCM.
Sometimes R-wave voltage and T-wave negativity progressively decreased in magnitude in serial ECGs.Non-sustained or sustained VT can be observed in patients that developed apical aneurysm with normal coronary arteries; to clarify themechanisms of ECG abnormalities in hypertrophic cardiomyopathy, 102 patients were examined with CMR. Distribution and magnitude ofhypertrophy and late enhancement were correlated with ECG abnormalities:
I. Abnormal Q waves reflect the interrelation between upper anterior septal thickness and other regions of the left and right ventricles,and wider Q waves are associated with late enhancement;
II. Conduction disturbances and absent septal Q waves are associated with late enhancement;III. The depth of negative T waves is related to craniocaudal asymmetry and apical late enhancement.
Apical Hypertrophic cardiomyopathy Electrocardiogram features
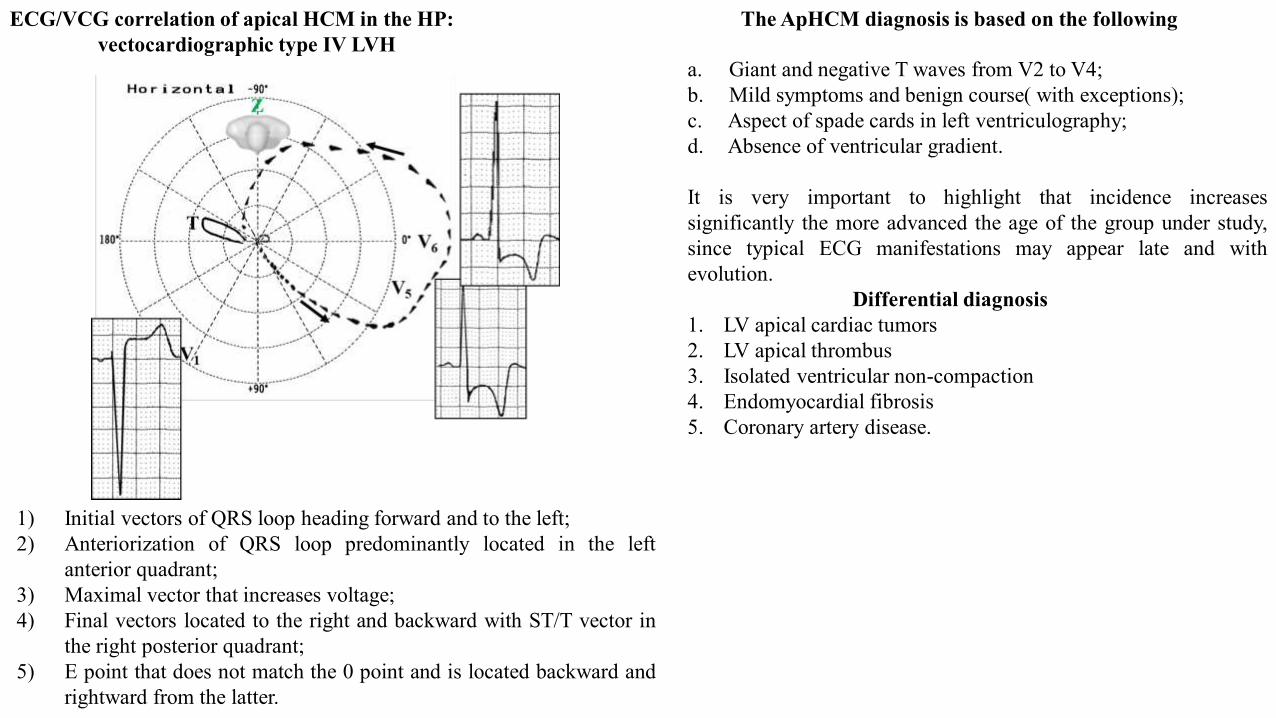
1) Initial vectors of QRS loop heading forward and to the left;2) Anteriorization of QRS loop predominantly located in the left
anterior quadrant;3) Maximal vector that increases voltage;4) Final vectors located to the right and backward with ST/T vector in
the right posterior quadrant;5) E point that does not match the 0 point and is located backward and
rightward from the latter.
ECG/VCG correlation of apical HCM in the HP: vectocardiographic type IV LVH
The ApHCM diagnosis is based on the following
a. Giant and negative T waves from V2 to V4;b. Mild symptoms and benign course( with exceptions);c. Aspect of spade cards in left ventriculography;d. Absence of ventricular gradient.
It is very important to highlight that incidence increasessignificantly the more advanced the age of the group under study,since typical ECG manifestations may appear late and withevolution.
Differential diagnosis1. LV apical cardiac tumors2. LV apical thrombus3. Isolated ventricular non-compaction4. Endomyocardial fibrosis5. Coronary artery disease.
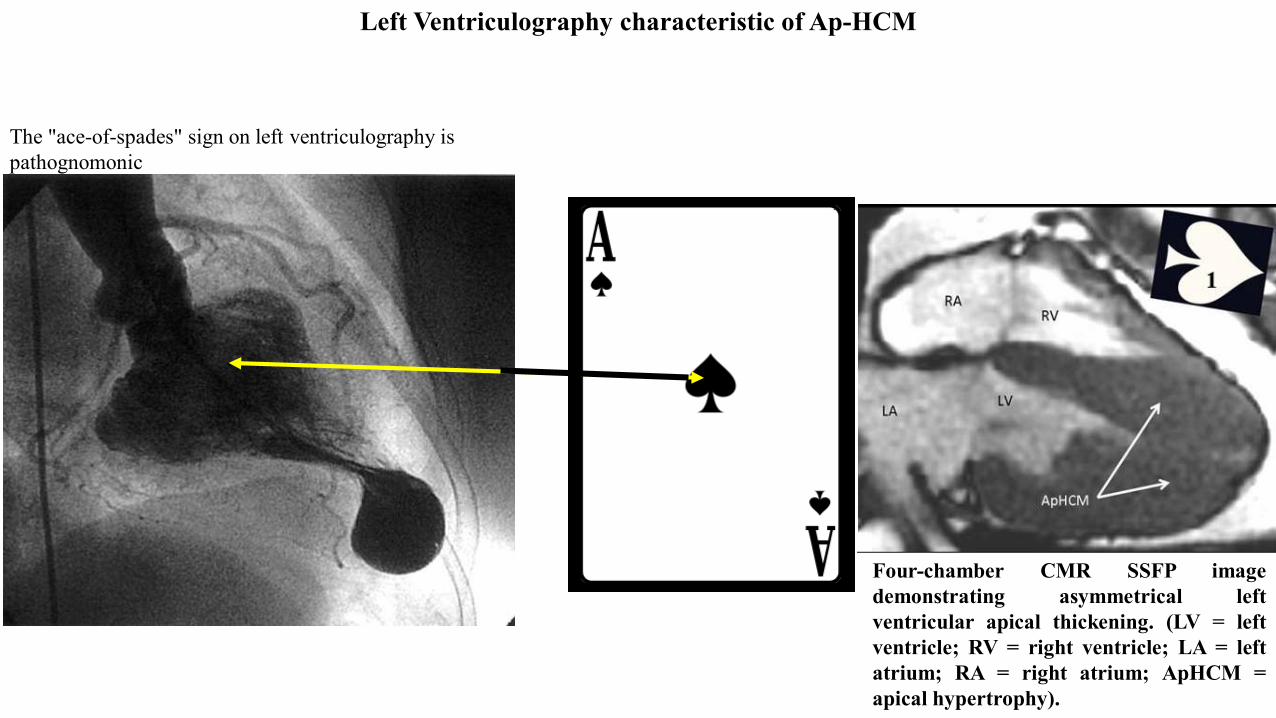
Left Ventriculography characteristic of Ap-HCM
The "ace-of-spades" sign on left ventriculography is pathognomonic
Four-chamber CMR SSFP imagedemonstrating asymmetrical leftventricular apical thickening. (LV = leftventricle; RV = right ventricle; LA = leftatrium; RA = right atrium; ApHCM =apical hypertrophy).
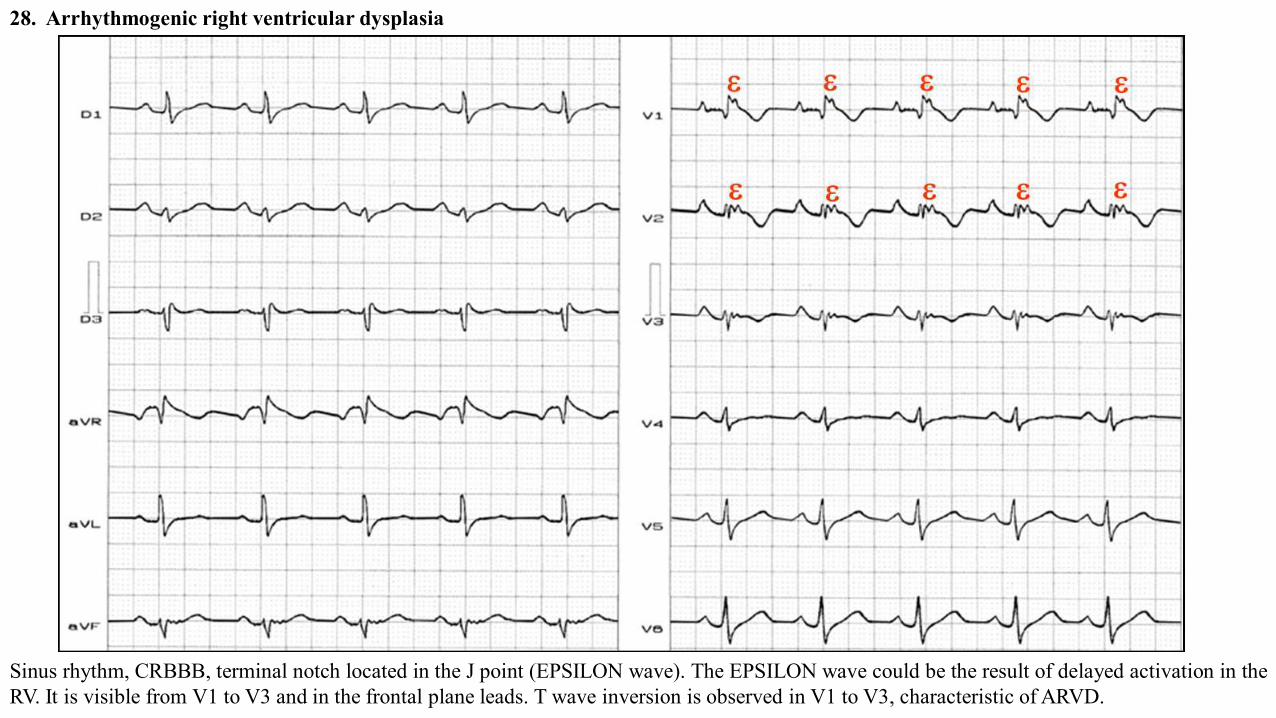
28. Arrhythmogenic right ventricular dysplasia
Sinus rhythm, CRBBB, terminal notch located in the J point (EPSILON wave). The EPSILON wave could be the result of delayed activation in theRV. It is visible from V1 to V3 and in the frontal plane leads. T wave inversion is observed in V1 to V3, characteristic of ARVD.
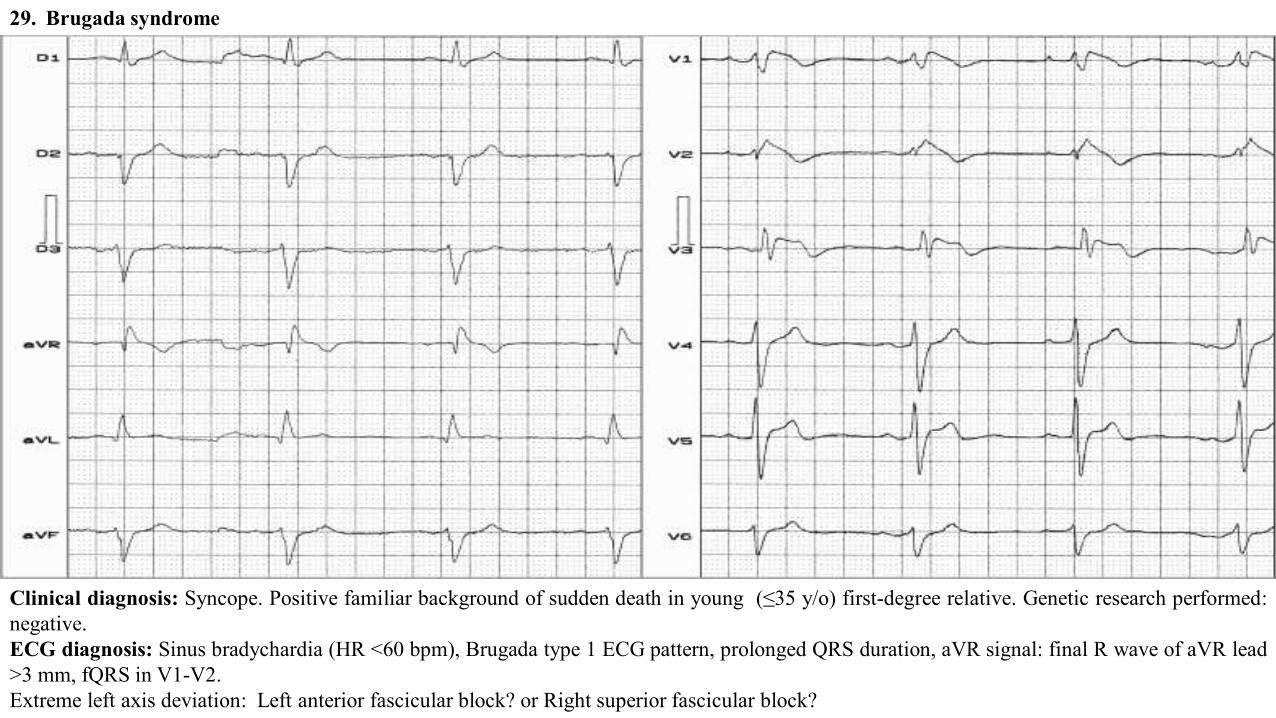
29. Brugada syndrome
Clinical diagnosis: Syncope. Positive familiar background of sudden death in young (≤35 y/o) first-degree relative. Genetic research performed:negative.ECG diagnosis: Sinus bradychardia (HR <60 bpm), Brugada type 1 ECG pattern, prolonged QRS duration, aVR signal: final R wave of aVR lead>3 mm, fQRS in V1-V2.Extreme left axis deviation: Left anterior fascicular block? or Right superior fascicular block?
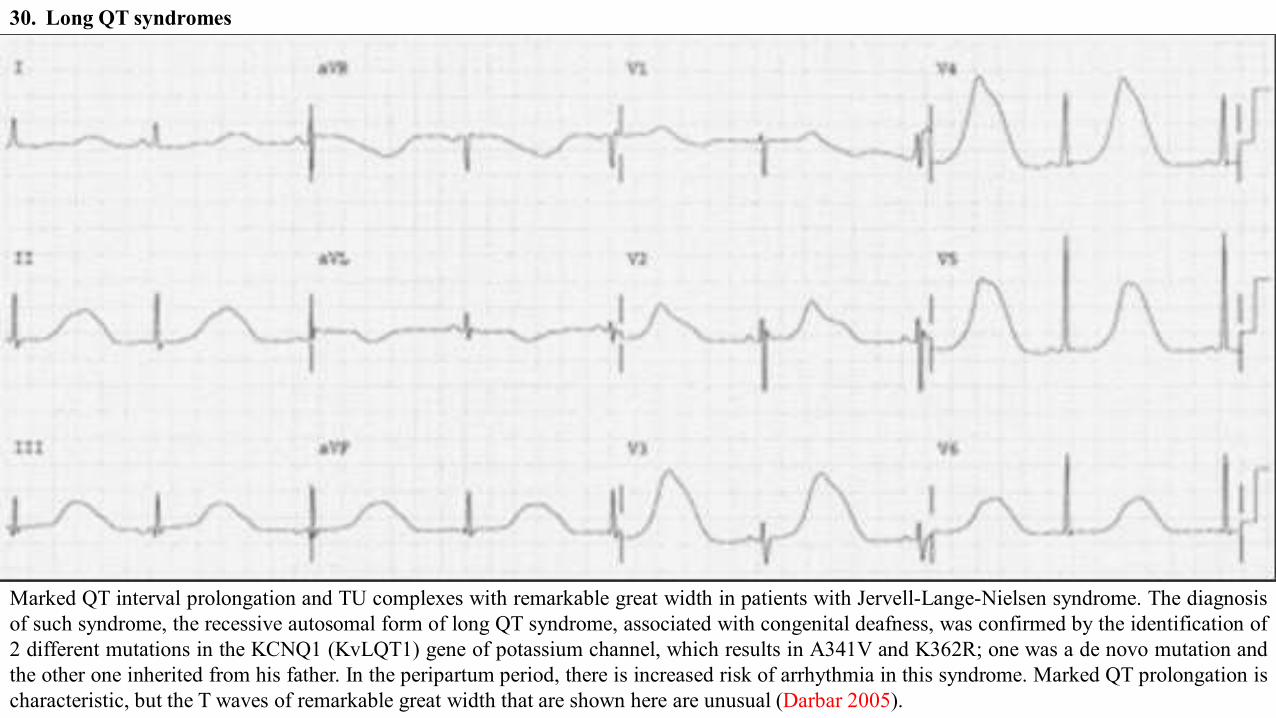
30. Long QT syndromes
Marked QT interval prolongation and TU complexes with remarkable great width in patients with Jervell-Lange-Nielsen syndrome. The diagnosisof such syndrome, the recessive autosomal form of long QT syndrome, associated with congenital deafness, was confirmed by the identification of2 different mutations in the KCNQ1 (KvLQT1) gene of potassium channel, which results in A341V and K362R; one was a de novo mutation andthe other one inherited from his father. In the peripartum period, there is increased risk of arrhythmia in this syndrome. Marked QT prolongation ischaracteristic, but the T waves of remarkable great width that are shown here are unusual (Darbar 2005).
31. LVH with strain by voltage pattern can be described via numerous ECG scoring systems. Perhaps the most sensitive system uses thesummation of the negative component of the QRS complex in lead V1 and the positive component of the QRS complex in lead V6. If the sumis greater than 35 mm in a patient older than 35 years, then the LVH by voltage pattern is diagnosed. In patients with LVH, ST-segment/T-wave changes are encountered in approximately 70% of cases, including ST-segment deviations and abnormal T waves. Of these findings, theT wave can be inverted and is most often seen in leads with large positive QRS complexes, such as leads I, aVL, V5, and V6(Figure2E). These inverted T waves have a gradual downsloping limb with a rapid return to the baseline. These abnormalities are related to the LVHpattern and are not suggestive of ACS.
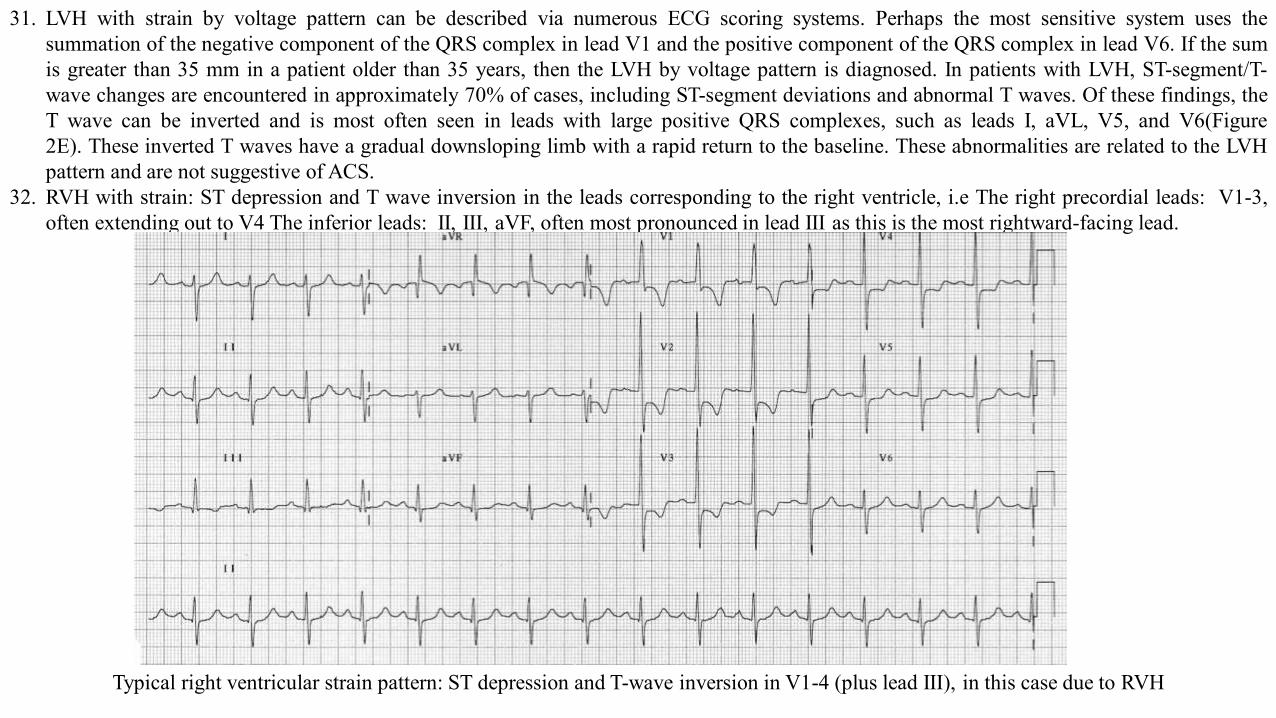
32. RVH with strain: ST depression and T wave inversion in the leads corresponding to the right ventricle, i.e The right precordial leads: V1-3,often extending out to V4 The inferior leads: II, III, aVF, often most pronounced in lead III as this is the most rightward-facing lead.
Typical right ventricular strain pattern: ST depression and T-wave inversion in V1-4 (plus lead III), in this case due to RVH
33. Inflammatory causes: Acute myocarditis and acute myopericarditis can present with a range of ECG abnormalities, including ST-segmentelevation and T-wave inversion. T-wave inversion is not seen in all such cases of myocardial inflammatory disorders. When it is seen in thesepatients, T-wave inversion usually indicates a resolving process.
34. Stage 3 pericarditis (T waves flattened)35. Cocaine abuse toxicity: The mechanisms responsible for these cardiotoxic actions of cocaine largely remain to be determined. Cocaine has two
primary pharmacological properties that can adversely affect the heart and vasculature. Cocaine acts both as a local anesthetic (sodium andpotassium channel blockade) and as a powerful cardiac stimulant that accentuates the actions of the sympathetic nervous system (inhibition ofcentral and peripheral neuronal catecholamine uptake). The local anesthetic properties could impair impulse conduction, as well as elicitinhomogeneities in repolarization (refractory period), which creates an ideal substrate for reentrant arrhythmias. In addition, high dosesof cocaine can depress contractile function due to inhibition of sodium/calcium exchange that results from decreased sodium influx (localanesthetic action). These actions are particularly obvious when sympathomimetic effects of cocaine are blunted. In a similar manner,the cocaine-induced accumulation of catecholamines potentiates the activation of D and β-adrenergic receptors, which can provoke coronaryvasospasm (myocardial ischemia and infarction), increased contractile force (increased metabolic demand), and cardiac arrhythmias. Theactivation of adrenergic receptors will elicit a cascade of second messengers, ultimately provoking an increase in cytosolic calcium. Theseelevations in cytosolic calcium can provoke oscillations in membrane potential, triggering sustained action potential generation and PVCs. Inparticular, activation of the D-IA-adrenergic receptor subtype and corresponding increase in calcium influx via voltage sensitive (L type)channels may play a critical role in the genesis of malignant arrhythmias. Thus, the adrenergic and local anesthetic properties of cocaine couldact synergistically to elicit toxic actions on the heart.
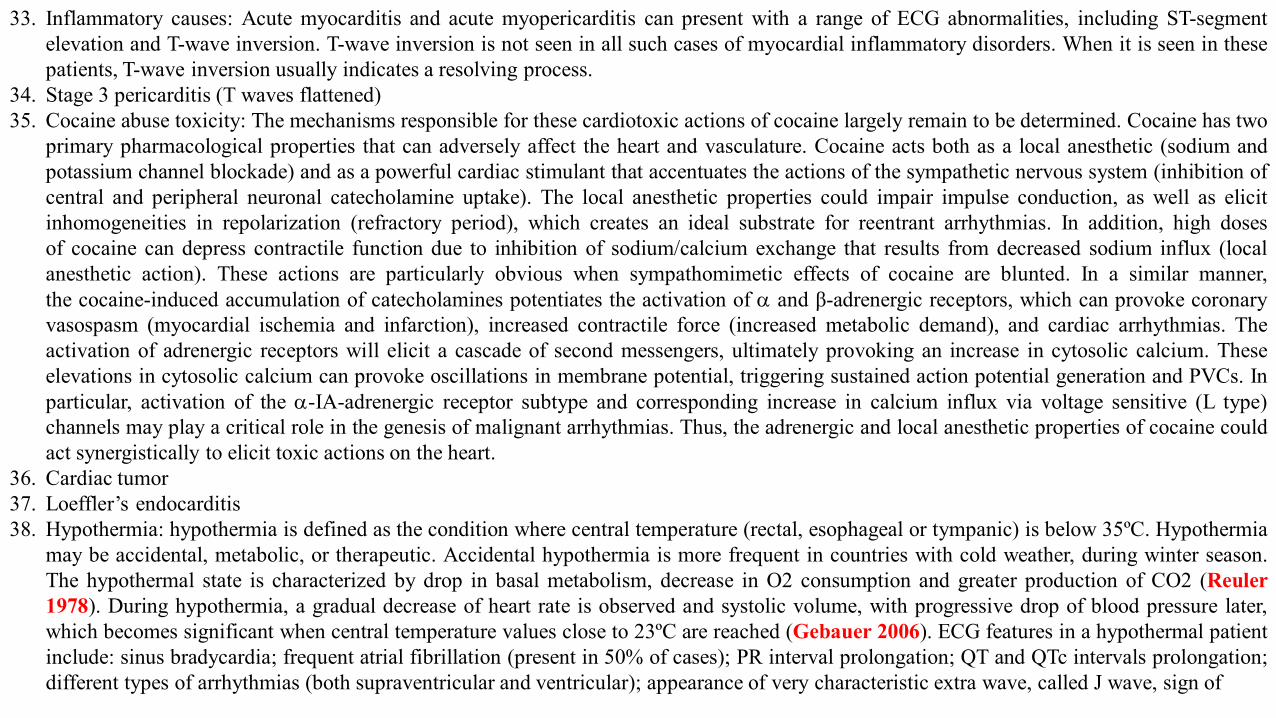
36. Cardiac tumor37. Loeffler’s endocarditis38. Hypothermia: hypothermia is defined as the condition where central temperature (rectal, esophageal or tympanic) is below 35ºC. Hypothermia
may be accidental, metabolic, or therapeutic. Accidental hypothermia is more frequent in countries with cold weather, during winter season.The hypothermal state is characterized by drop in basal metabolism, decrease in O2 consumption and greater production of CO2 (Reuler1978). During hypothermia, a gradual decrease of heart rate is observed and systolic volume, with progressive drop of blood pressure later,which becomes significant when central temperature values close to 23ºC are reached (Gebauer 2006). ECG features in a hypothermal patientinclude: sinus bradycardia; frequent atrial fibrillation (present in 50% of cases); PR interval prolongation; QT and QTc intervals prolongation;different types of arrhythmias (both supraventricular and ventricular); appearance of very characteristic extra wave, called J wave, sign of
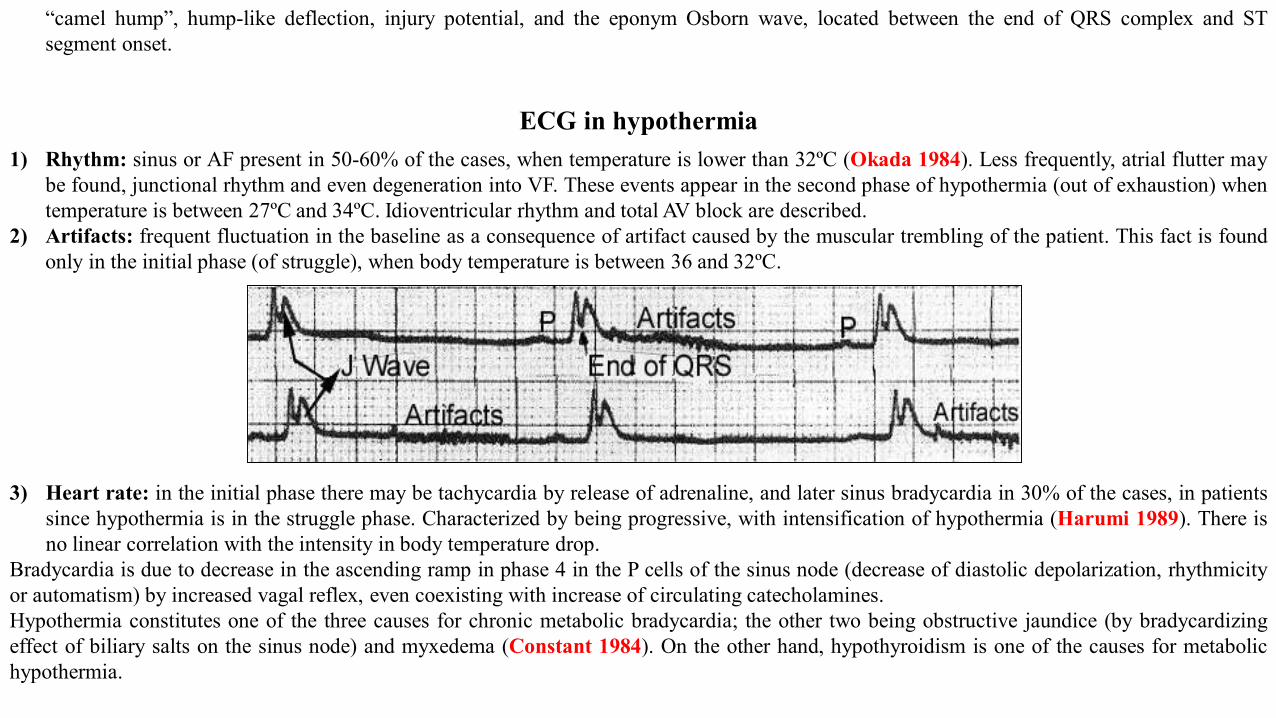
ECG in hypothermia1) Rhythm: sinus or AF present in 50-60% of the cases, when temperature is lower than 32ºC (Okada 1984). Less frequently, atrial flutter may
be found, junctional rhythm and even degeneration into VF. These events appear in the second phase of hypothermia (out of exhaustion) whentemperature is between 27ºC and 34ºC. Idioventricular rhythm and total AV block are described.
2) Artifacts: frequent fluctuation in the baseline as a consequence of artifact caused by the muscular trembling of the patient. This fact is foundonly in the initial phase (of struggle), when body temperature is between 36 and 32ºC.
3) Heart rate: in the initial phase there may be tachycardia by release of adrenaline, and later sinus bradycardia in 30% of the cases, in patientssince hypothermia is in the struggle phase. Characterized by being progressive, with intensification of hypothermia (Harumi 1989). There isno linear correlation with the intensity in body temperature drop.
Bradycardia is due to decrease in the ascending ramp in phase 4 in the P cells of the sinus node (decrease of diastolic depolarization, rhythmicityor automatism) by increased vagal reflex, even coexisting with increase of circulating catecholamines.Hypothermia constitutes one of the three causes for chronic metabolic bradycardia; the other two being obstructive jaundice (by bradycardizingeffect of biliary salts on the sinus node) and myxedema (Constant 1984). On the other hand, hypothyroidism is one of the causes for metabolichypothermia.
“camel hump”, hump-like deflection, injury potential, and the eponym Osborn wave, located between the end of QRS complex and STsegment onset.
4) P wave: voltage decrease is described (Okada 1984). Also widening of P wave (decreasing of the velocity of intra-atrial conduction)5) PRi interval: it tends to be prolonged as body temperature decreases (Emslie-Smith 1959);6) QRS complex: decrease in voltage and increase in duration. The latter may be mistakenly considered to be increased, by the presence of the
so-called J wave (see item as belonging to QRS), resembling branch block or intraventricular disorder of the stimulus. The explanation forQRS broadening is in the decrease of rest potential and consequently, phase 0 rise velocity and negative dromotropism.
7) J wave: it constitutes the most typical electrocardiographic element; however, not pathognomonic, since it may be found in other clinicalcircumstances. It is located at the point where QRS ends (late G wave) and the initial part of the ST segment (J point). It corresponds to phases1 and 2 of action potential. The J wave is due to different densities in the Ito channels concentration (phase 1) in ventricular myocardiumthickness. These channels of the initial potassium outflow are very numerous in the epicardium and scant or absent in the endocardium. Thisfact justifies phase 1 of AP in the epicardium showing a notch. On the contrary, phase 1 of endocardial cells lacks a notch (Yan 1996). The Jwave “per se” is not significant for ventricular fibrillation (VF) appearance, since QRS complex duration prolongation constitutes a reliablesign for VF appearance. When rapidly induced hypothermia for heart surgery causes QRS prolongation, it causes VF in almost all patients(Fleming 1957). J wave presents the following features: Location: the J wave is located at the point where the QRS complex ends (late G
wave) occupying the initial part of the ST segment, corresponding to phase 1 and 2 of monophasic action potential (Alsafwah 2001).Polarity: always positive and prominent in the leads that face the left ventricle: V5 and V6 and possibly and mainly in hearts in a verticalposition in inferior wall leads (Sgobba 1982), unlike J wave found in Brugada syndrome, located in right precordial leads V1 to V2 or V3.Voltage: slow and lasting inscription, and voltage greater in left leads V5 and V6 and inversely proportional to the severity of hypothermia,i.e. the lower the central temperature, the greater the voltage of J wave. In certain cases, J wave acquires a great voltage associated to superiorconvexity, mimicking the acute phase of myocardial infarction: "evolving myocardial infarction", which reverses with central temperaturenormalization (Sain 2002). There is inverse and significant correlation between J wave voltage (mm) and central temperature in hypothermia.
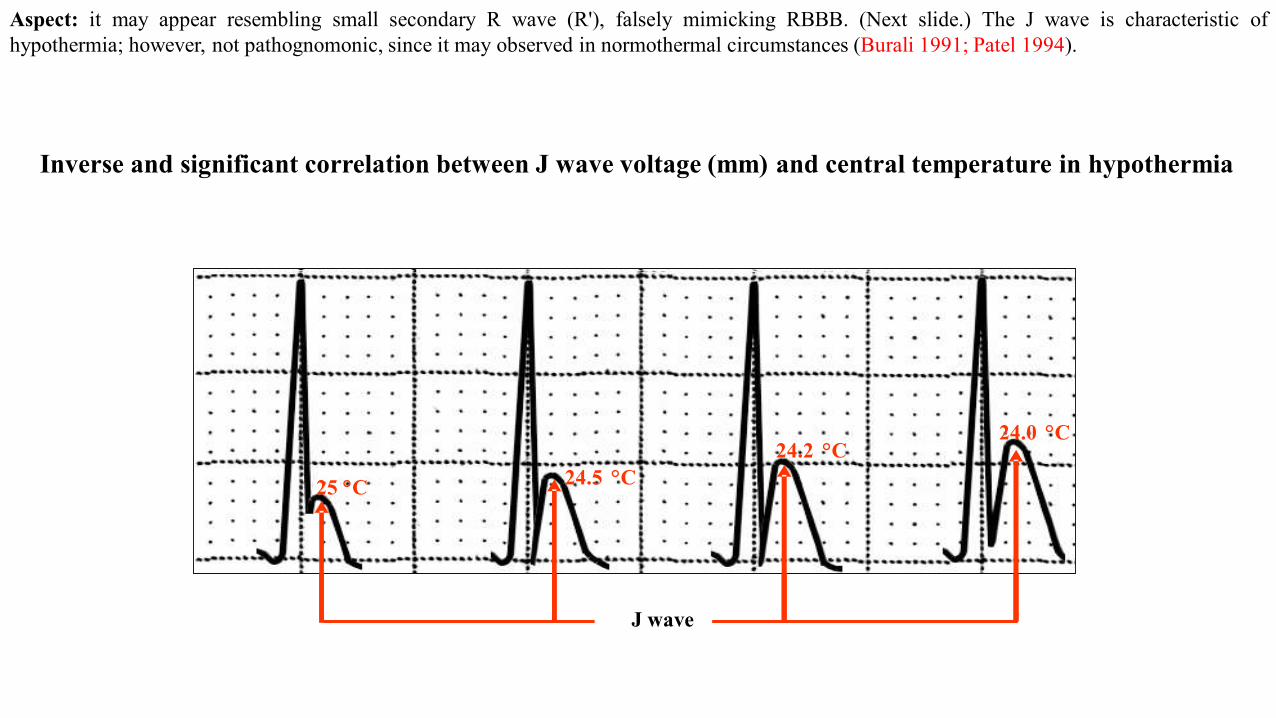
Aspect: it may appear resembling small secondary R wave (R'), falsely mimicking RBBB. (Next slide.) The J wave is characteristic ofhypothermia; however, not pathognomonic, since it may observed in normothermal circumstances (Burali 1991; Patel 1994).
Inverse and significant correlation between J wave voltage (mm) and central temperature in hypothermia
25 °C 24.5 °C24.2 °C
24.0 °C
J WAVE
25 °C 24.5 °C24.2 °C
24.0 °C
J wave
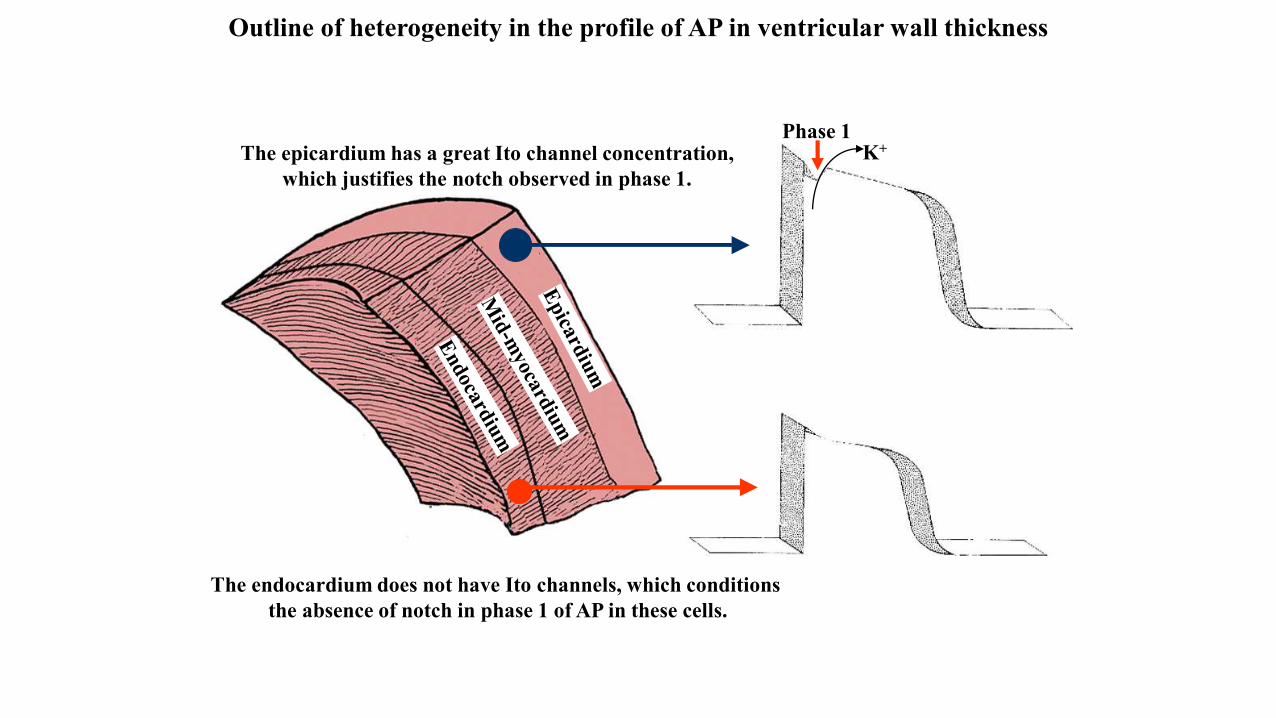
The epicardium has a great Ito channel concentration, which justifies the notch observed in phase 1.
Phase 1K+
The endocardium does not have Ito channels, which conditions the absence of notch in phase 1 of AP in these cells.
Outline of heterogeneity in the profile of AP in ventricular wall thickness
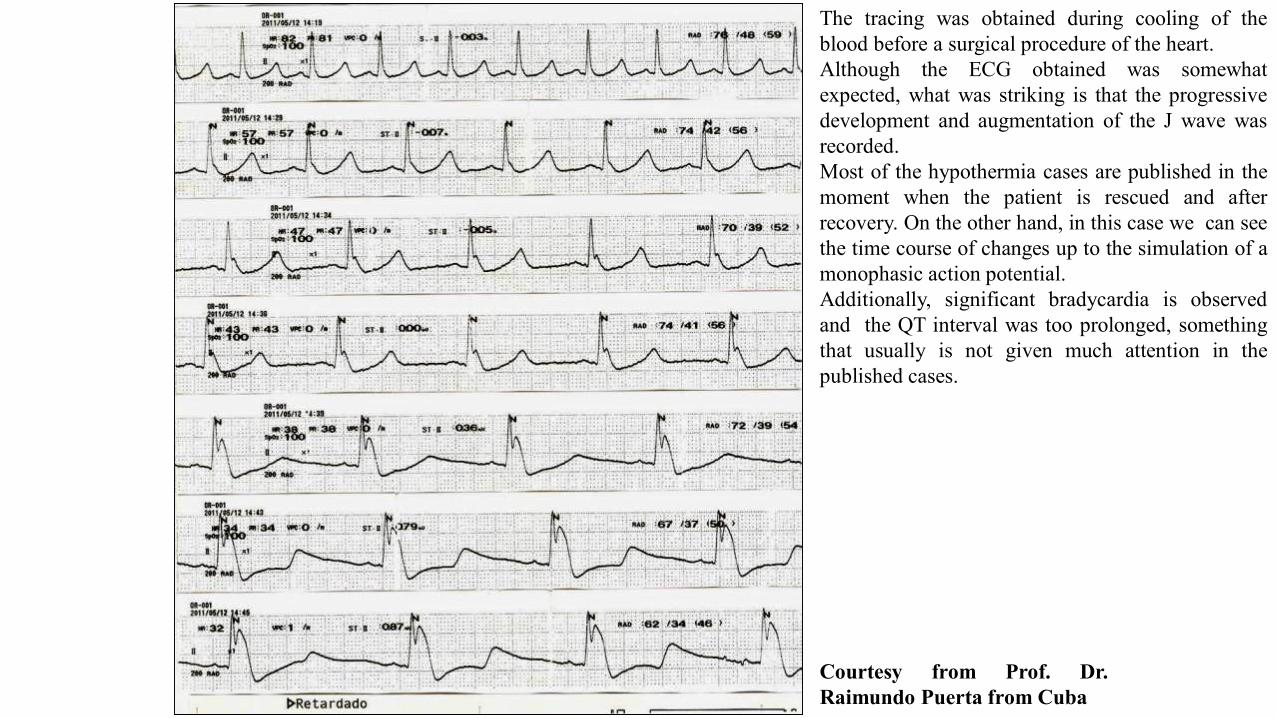
The tracing was obtained during cooling of theblood before a surgical procedure of the heart.Although the ECG obtained was somewhatexpected, what was striking is that the progressivedevelopment and augmentation of the J wave wasrecorded.Most of the hypothermia cases are published in themoment when the patient is rescued and afterrecovery. On the other hand, in this case we can seethe time course of changes up to the simulation of amonophasic action potential.Additionally, significant bradycardia is observedand the QT interval was too prolonged, somethingthat usually is not given much attention in thepublished cases.
Courtesy from Prof. Dr.Raimundo Puerta from Cuba
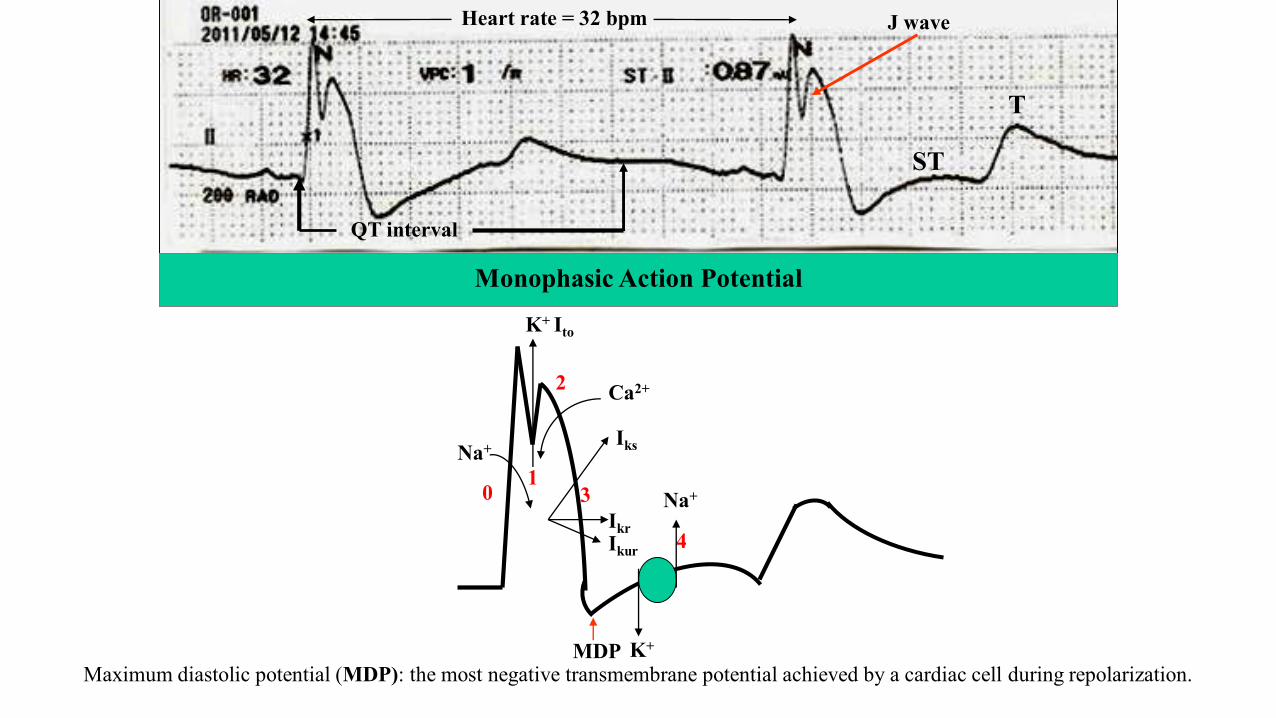
Monophasic Action Potential
Heart rate = 32 bpm
0
QT interval
4
Na+
Na+
K+
2 Ca2+
K+ Ito
ST
T
Iks
IkrIkur
Maximum diastolic potential (MDP): the most negative transmembrane potential achieved by a cardiac cell during repolarization.MDP
1
J wave

ECG diagnosis: sinus bradycardia of 30 bpm, prominent J wave, very evident in inferior leads and I, as well as in all precordial leads. PseudoCRBBB determined by J wave, which is not part of the QRS complex.
Characteristic ECG of patient in severe hypothermia
J-waveJ-wave
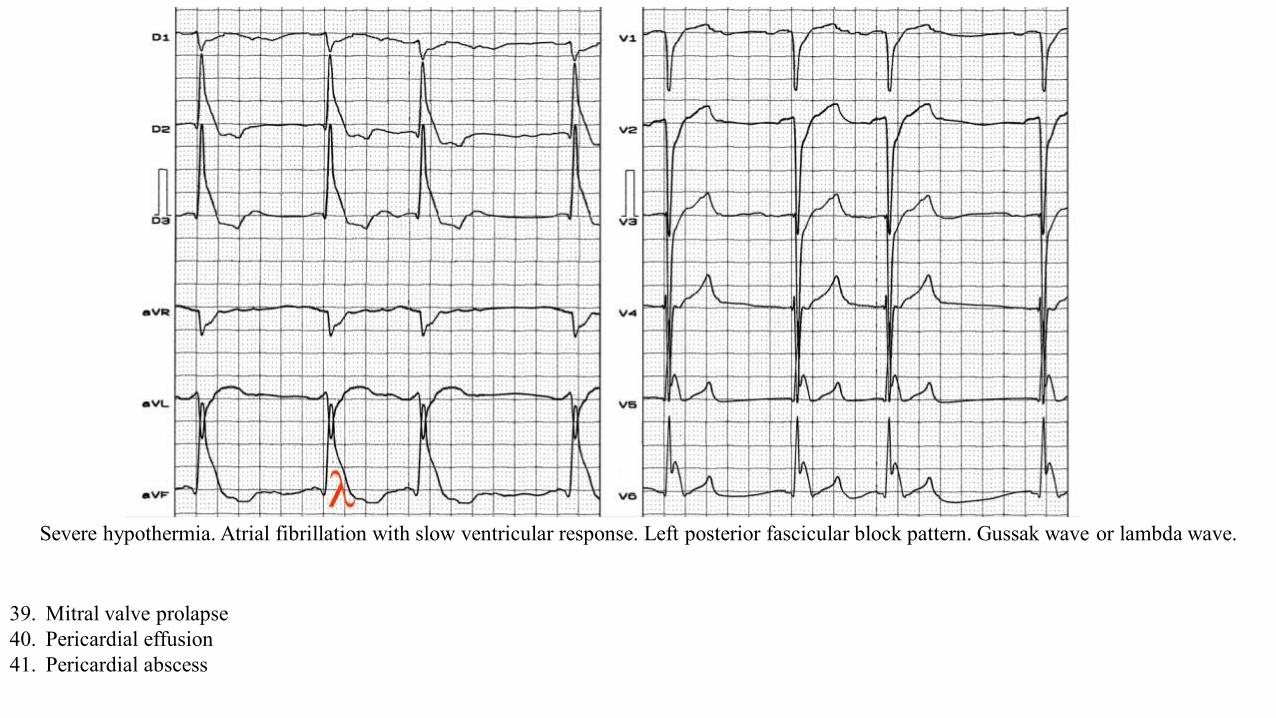
Severe hypothermia. Atrial fibrillation with slow ventricular response. Left posterior fascicular block pattern. Gussak wave or lambda wave.
39. Mitral valve prolapse40. Pericardial effusion41. Pericardial abscess
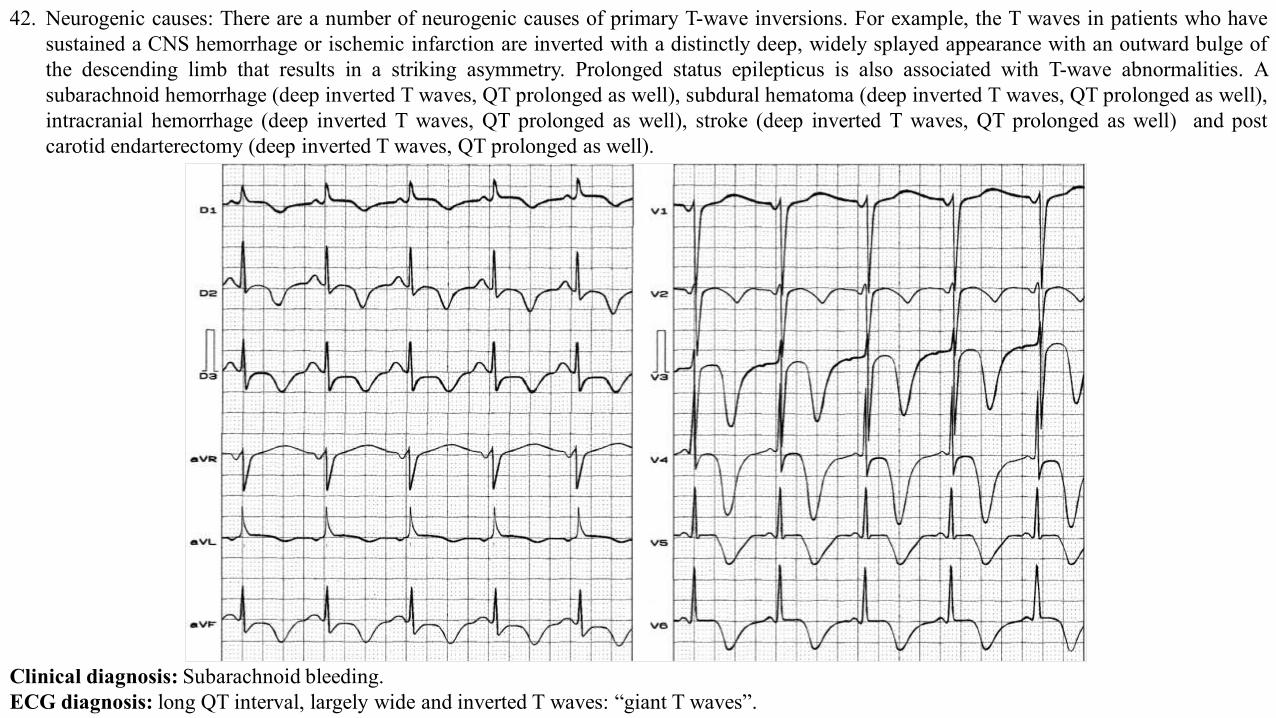
42. Neurogenic causes: There are a number of neurogenic causes of primary T-wave inversions. For example, the T waves in patients who havesustained a CNS hemorrhage or ischemic infarction are inverted with a distinctly deep, widely splayed appearance with an outward bulge ofthe descending limb that results in a striking asymmetry. Prolonged status epilepticus is also associated with T-wave abnormalities. Asubarachnoid hemorrhage (deep inverted T waves, QT prolonged as well), subdural hematoma (deep inverted T waves, QT prolonged as well),intracranial hemorrhage (deep inverted T waves, QT prolonged as well), stroke (deep inverted T waves, QT prolonged as well) and postcarotid endarterectomy (deep inverted T waves, QT prolonged as well).
Clinical diagnosis: Subarachnoid bleeding.ECG diagnosis: long QT interval, largely wide and inverted T waves: “giant T waves”.
43. Bundle-branch block and ventricular paced (implanted pacemaker) patterns: Bundle-branch block and ventricular paced (Figure 2D; implanted pacemaker) patterns produce a number of abnormalities of the ST segment and T wave. In general, leads with large positive QRS complexes will demonstrate T-wave inversions. In left bundle-branch block pattern, inverted T waves are seen in leads I, aVL, V5, and V6. In RBBB pattern, T waves are inverted in leads V1 and V2. In patients with implanted right ventricular pacemakers, inverted T waves are most often seen in leads I and aVL. The T waves are inverted in an asymmetric fashion with a gradual initial downslope and an abrupt return to the baseline.
44. Ventricular pre-excitation syndrome: Patients with Wolff-Parkinson-White syndrome can present with ST-segment and T-wave abnormalities as well as abnormalities of the QRS complex; these findings are termed the “pseudo-infarction findings.” For example, Q waves may be seen in leads II, III, and aVF that mimic past inferior MI. There may also be tall R waves in the right precordial leads, suggestive of a posterior wall acute MI; T-wave inversions are sometimes seen in these leads with prominent R waves.
45. Hyperventilation (can cause ST depression)46. Limb lead reversal47. ECG lead misplacement48. High impedance right arm electrode49. Physiologic junctional depression (occurs with sinus tachycardia)50. Pseudo ST-depression (wandering baseline from artifact, poor skin-electrode contact)51. Heightened adrenergic state (pain, panic attack, etc...)52. Early repolarization53. Hypothyroidism54. Truncal vagotomy55. Hypopituitarism56. Gallbladder disease57. Adrenal insufficiency58. Pulmonary causes: Patients with pulmonary embolism (PE) may also display T-wave abnormalities, including T-wave inversions (Figure
2A). The T-wave findings in these patients are typically shallow inversions in the inferior leads. Deeper T-wave inversions—attributed to acute right ventricular strain and occasionally seen in patients with massive PE—are generally observed in the right to mid-precordial leads V1 to V4; this finding is the most specific ECG finding seen in the PE patient.
59. Post-prandial60. Persistent juvenile T-wave pattern61. Left-sided pleural effusion
Flattened T wave Flat T waves (less than 0.1 mV in the limb leads and less than 0.2 mV in the precordial leads) may indicate coronary ischemia
or hypokalemia.A 10 mm upright as well as 5 mm inverted T wave , both can be normal. So . there is no element of surprise to note absent T
waves or a flat T wave to be called as normal.
Small or flattened T waves may be caused by: Ischaemia, thick chest wall or emphysema, pericardial effusion, cardiomyopathy or myocarditis,
constrictive pericarditis. Hypothyroidism, hypoadrenalism, hypokalaemia, hypocalcaemia.
Flat ST segment and absent T waves represent a same spectrum of ECG findings which are referred to as non specific ST segment changes
in clinical practice .Generally , they have little clinical significance.* In our experience we have found , female patients,
Anemia hypothyroidism are often associated with flat ST segments . If CAD is suspected exercise stress test should be done. Some believe a
flat ST segment is more likely to result in EST positivity (Not necessarily true positive !).
* Non specific ST/T changes by itself is a huge topic. Ideally the term non specific ST /T changes should be avoided , as it primarily came into
vogue to denote non ischemic ST segment (Still , other pathologies are very much possible) It is estimated there are about 50 causes for non
specific ST/T changes , right from a benign situation like deep respirations , to significant myocardial disorders. However , it still makes good
clinical sense for a general practitioner , to refer to a cardiologist , whenever ST segment deviates without any reason.
1. Alsafwah S. Electrocardiographic changes in hypothermia. Heart Lung. 2001;30(2):161-3.2. Antzelevitch C, Shimizu W, Yan G-X, et al. The M cell: its contribution to the ECG and to normal and abnormal electrical function of the
heart. 1999;10:1124-1152.3. Antzelevitch C, Fish J. Electrical heterogeneity within the ventricular wall. Basic Res Cardiol. 2001;96:517-527.4. Bellet S, Kemp Rl, Surawicz B. Polarity and amplitude of the U wave of the electrocardiogram in relation to that of the T wave. Circulation.
1957;15:90–97.5. Burali A, Porciello PI. Osborn wave in normothermic patients? G Ital Cardiol. 1991;21(9):1005-9.6. Caruso G, Trovato GM, Todaro G, Spatola S. Arterial hypertension: clinical significance of U wave inversion in electrocardiogram. Medicina
(Firenze). 1990;10(2):161-3.7. Chiale PA, Etcheverry D, Pastori JD, et al. The multiple electrocardiographic manifestations of ventricular repolarization memory. Curr
Cardiol Rev. 2014;10(3):190-201.8. Constant J. Electrocardiografia. Curso de enseñanza programada. 2a edición. Salvat editores, 1984.9. Darbar D, Roden DM, Ali MF, Yang T, Wathen MS. Images in cardiovascular medicine. Himalayan T waves in the congenital long-QT
syndrome. Circulation. 2005;111(11):e161.10. de Winter RJ, Verouden NJ, Wellens HJ, Wilde AA; Interventional Cardiology Group of the Academic Medical Center. A new ECG sign of
proximal LAD occlusion. N Engl J Med. 2008;359(19):2071-3.11. Diercks DB, Shumaik GM, Harrigan RA, et al.Electrocardiographic manifestations: electrolyte abnormalities.J Emerg Med. 2004;27(2):153-
60.12. Emslie-Smith D, Sladden GE, Stirling GR. The significance of changes in the electrocardiogram in hypothermia. Br Heart J. 1959;21:343-51.13. Fleming PR, Muir FH. Electrocardiographic changes in induced hypothermia in man. Br Heart J. 1957;19(1):59-66.14. Gebauer CM, Knuepfer M, Robel-Tillig E, Pulzer F, Vogtmann C. Hemodynamics among neonates with hypoxic-ischemic encephalopathy
during whole-body hypothermia and passive rewarming. Pediatrics. 2006;117(3):843-50.15. Goldberger AL. Hyperacute T waves revisited. Am Heart J. 1982;104(4 Pt 1):888–90.16. Gregory SA, Akutsu Y, Perlstein TS, Yasuda T, Yurchak PM. Inverted U waves. Am J Med, 2006; 119: 746–747.17. Hanna EB, Glancy DL.ST-segment depression and T-wave inversion: classification, differential diagnosis, and caveats.Cleve Clin J Med.
2011;78(6):404-14.
References
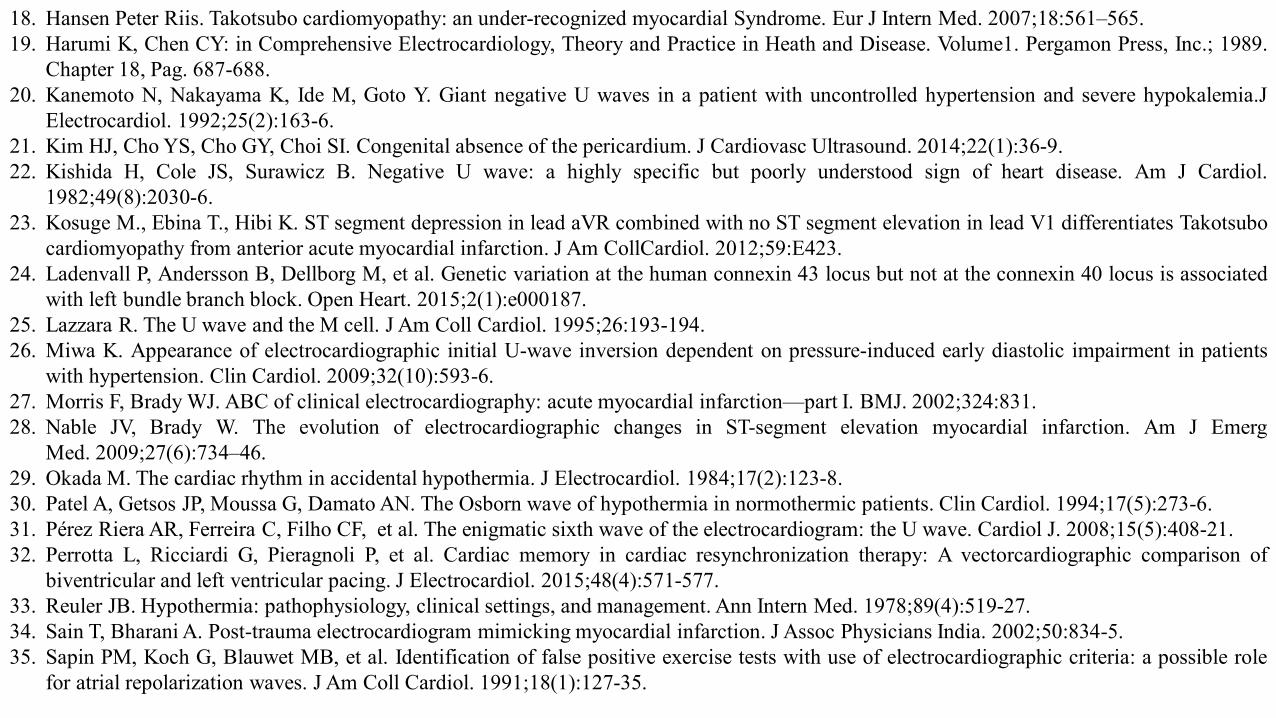
18. Hansen Peter Riis. Takotsubo cardiomyopathy: an under-recognized myocardial Syndrome. Eur J Intern Med. 2007;18:561–565.19. Harumi K, Chen CY: in Comprehensive Electrocardiology, Theory and Practice in Heath and Disease. Volume1. Pergamon Press, Inc.; 1989.
Chapter 18, Pag. 687-688.20. Kanemoto N, Nakayama K, Ide M, Goto Y. Giant negative U waves in a patient with uncontrolled hypertension and severe hypokalemia.J
Electrocardiol. 1992;25(2):163-6.21. Kim HJ, Cho YS, Cho GY, Choi SI. Congenital absence of the pericardium. J Cardiovasc Ultrasound. 2014;22(1):36-9.22. Kishida H, Cole JS, Surawicz B. Negative U wave: a highly specific but poorly understood sign of heart disease. Am J Cardiol.
1982;49(8):2030-6.23. Kosuge M., Ebina T., Hibi K. ST segment depression in lead aVR combined with no ST segment elevation in lead V1 differentiates Takotsubo
cardiomyopathy from anterior acute myocardial infarction. J Am CollCardiol. 2012;59:E423.24. Ladenvall P, Andersson B, Dellborg M, et al. Genetic variation at the human connexin 43 locus but not at the connexin 40 locus is associated
with left bundle branch block. Open Heart. 2015;2(1):e000187.25. Lazzara R. The U wave and the M cell. J Am Coll Cardiol. 1995;26:193-194.26. Miwa K. Appearance of electrocardiographic initial U-wave inversion dependent on pressure-induced early diastolic impairment in patients
with hypertension. Clin Cardiol. 2009;32(10):593-6.27. Morris F, Brady WJ. ABC of clinical electrocardiography: acute myocardial infarction—part I. BMJ. 2002;324:831.28. Nable JV, Brady W. The evolution of electrocardiographic changes in ST-segment elevation myocardial infarction. Am J Emerg
Med. 2009;27(6):734–46.29. Okada M. The cardiac rhythm in accidental hypothermia. J Electrocardiol. 1984;17(2):123-8.30. Patel A, Getsos JP, Moussa G, Damato AN. The Osborn wave of hypothermia in normothermic patients. Clin Cardiol. 1994;17(5):273-6.31. Pérez Riera AR, Ferreira C, Filho CF, et al. The enigmatic sixth wave of the electrocardiogram: the U wave. Cardiol J. 2008;15(5):408-21.32. Perrotta L, Ricciardi G, Pieragnoli P, et al. Cardiac memory in cardiac resynchronization therapy: A vectorcardiographic comparison of
biventricular and left ventricular pacing. J Electrocardiol. 2015;48(4):571-577.33. Reuler JB. Hypothermia: pathophysiology, clinical settings, and management. Ann Intern Med. 1978;89(4):519-27.34. Sain T, Bharani A. Post-trauma electrocardiogram mimicking myocardial infarction. J Assoc Physicians India. 2002;50:834-5.35. Sapin PM, Koch G, Blauwet MB, et al. Identification of false positive exercise tests with use of electrocardiographic criteria: a possible role
for atrial repolarization waves. J Am Coll Cardiol. 1991;18(1):127-35.
36. Sgobba G, Nassisi G, Giannelli F, et al. Electrocardiographic changes in accidental hypothermia. G Ital Cardiol. 1982;12(2):147-50.37. Sharkey SW, Berger CR, Brunette DD, Henry TD. Impact of the electrocardiogram on the delivery of thrombolytic therapy for acute
myocardial infarction. Am J Cardiol. 1994;73:550–3.38. Sharkey SW, Lesser J., Menon M, et al. Spectrum and significance of electrocardiographic patterns, troponin levels, and thrombolysis in
myocardial infarction frame count in patients with stress (Tako-tsubo) cardiomyopathy and comparison to those in patients with ST elevationanterior wall myocardial infarction. Am J Cardiol. 2008;101(12):1723–1728.
39. Yan GX, Antzelevitch C. Cellular basis for the electrocardiographic J wave. Circulation. 1996;93(2):372-9.