Embed Size (px)
Citation preview

771
ANKARA - TURKIYE
Özet
Büyük yakma tesislerinde enerji üretimi sırasında yakıtın yanması sonucu hava kirliliğine neden olacak çeşitli gazlar çıkmaktadır. Enerji üretimi için yakıtın yakılması sonucu oluşan bu kirletici gazların, çeşitli sistemler ile arıtımı sağlanmaktadır. Yaş baca gazı desülfürizasyon sistemleri, uygulanabilirliliği geniş ve kimyasal proseslerin yönetiminde büyük çapta bir bilgiye gerek olmaksızın kolay işletilebilirliğinden dolayı tercih edilmektedir. Yatağan termik santrali baca gazı arıtma sistemleri yaş baca gazı desülfürizasyon prosesi olarak tasarlanmıştır. Yatağan termik santrali üç üniteden oluşmaktadır. Ünitelerin her birinin kendi bacası ve kendi baca gazı arıtma sistemi vardır. Ünitelerin gücü 210 MW olarak tasarlanmıştır. Santralin toplam üretim kapasitesi 630 MW’tır. Baca gazı arıtma sistemlerinde SO2, SO3, toz ve ağır metallerin arıtımı yapılmaktadır. Yakıtın yakılması sonucu ortaya çıkan SO2 gazı, baca gazı arıtma sistemlerinde %98’e varan tutma verimi ile arıtılabilmektedir. Proses, belirli ölçülere kadar kırılmış kireç taşının değirmende öğütülmesi ve su ile karıştırılması sonucu hazırlanan kireç sütünün, yıkama kulesinde atık gazın üzerine püskürtülmesi esasına göre çalışmaktadır. Püskürtme sonrası kirlenen kireç sütü yoğunluk farkına göre hidro siklonlar vasıtası ile ayrılmakta ve atılmaktadır. Eksik kalan kireç sütü ise belirli miktarda kireç sütü depolama tankından alınarak sisteme verilmektedir. Yatağan termik santrali örneğinde baca gazı arıtma sistemine giren SO2 gazı 500 mg/Nm3’e kadar arıtılabilmektedir. Çıkan bu sonuçlar değerlendirildiğinde, santralin baca gazı desülfürizasyon proseslerinin çevre
kirliliğini önlemesi açısından ne kadar önemli olduğu ortaya çıkmaktadır.
anahtar kelimeler: baca gazı desülfüfizasyon, so2 absorbsiyonu, yatağan termik santrali, hava kalitesi, hava kirliliği
Abstract
During the production of energy from large combustion plants will cause the combustion process to air pollution stands out various gases. That pollutant gases resulting from the burning of fuel for energy production, the purification is achieved by several systems.Wet flue gas desulphurisation systems are preferred because of their applicability and easily operable structures without using information in a great extent. Yatağan Thermal Power Station flue gas purification systems are designed as a gas desulphurisation process. Yatağan Thermal Power Station is composed of three units. Each of these units has their own chimney and fluepurification systems. The powers of these units are designed as 210 MW. Total productivity capacity of this power station is 630 MW. In flue gas purification systems, SO2, SO3, dust and heavy metals are purified. SO2 which occurs by fuel burning can be increased in flue gas purification systems with 98% efficiency. The process is worked on the basis of spraying the lime milk produced by grinding the limestone in the mill and mixing it with water, into the waste gas in the washing tower. The lime milk polluted after spraying process is segregated by way of hydro cyclones and discarded. The lime milk which diminishes
THE ENvIRONMENTAL IMPORTANCE OF FLUE GAS PURIFICATION SYSTEMS; case of yatağan thermal poWer statIon
Ömer Ersoya, Prof.Dr. Mahmut Özbayb, Dr. Filiz Çetinkaya Karafakıc , Yard.Doç.Dr.Demet Erold
aAnkara, Türkiye, [email protected] Üniversitesi, Mühendislik Fakültesi, Makina Bölümü, Ankara, Türkiye, [email protected]
c Niğde Üniversitesi Mimarlık Fakültesi, Peyzaj Mimarlığı Bölümü, Ankara,Türkiye, [email protected] Gazi Üniversitesi, Mimarlık Fakültesi, Şehir ve Bölge Planlama Bölümü, Ankara, Türkiye, [email protected]

772
2nd International Sustainable Buildings Symposium
is taken from the stock tank and given to the system. In case of Yatağan Thermal Power Plant, SO2 gas which enters in the flue gas purification system can be increased to 500 mg/Nm3. When the results are evaluated, it is seen how important the flue gas desulphurisation process in preventing environment pollution.
keywords:flue gas desulphurisation, so2 absorption, yatağan thermal power plant, air quality, air pollution
1. Introduction
In the larger burning stations, several gases occur which cause air pollution during the process of fuel burning. One of the main of this waste is SO2. After burning the fuel, there becomes energy but after this burning process the gasses extracted to the air causes air pollution. Approximately 80% of SO2 emissions are produced by fuel burning [1]. It is seen that after the catalysation by solid particlesor sun rays or oxidation upon water drops by complex reactions, a minor part of SO2 turns to SO3 and after that it leaves atmosphere by solid dry deposit. It might be a fatal problem for the respiratory tract or lung failure patients when SO2 in the air reaches higher degrees. Besides that it also harms the plants and technological materials. However, its most serious effect on nature is demolishing and destroying effect on the forests, flora, soil structure and water resources [2]. On the purpose of controlling and decelerating the air pollution in producing energy, gas purification systems are established in burning stations. Flue gas purification systems are purified the pollution in its resource and they minimise the damage in the air quality. A well-working flue gas purification station can decrease the harm level of the gases that occur after fuel burning process and produce clean energy in this way. On this ground, flue gas purification systems are crucial to control air pollution and to protect the air quality. The waste which occurs after coal burning can be discarded by applying either or few of physical, chemical or biological methods [3].
As a rule, the method of purification the SO2, one of the contaminants found in flue gas, depends on the principle of transferring the contaminant to the purifier liquid prepared for the purpose of purification by reaction with flue gases. This transferring system depends on absorbing, ravelling or adsorption of the contaminant [4].
Flue gas purification systems purify the contaminants produced by coal burning in the thermal power stations in energy producing. These purified contaminants are SO2, SO3, dust and heavy metals. Flue gas purification systems are composed of flue gas washing tower, limestone stocking, the systems of preparing absorbent, cultivation, plaster dewatering and ash mixing and the other helper systems. Wet flue gas desulphurisation systems work as in the figure given below.
Figure 1. The desulphurisation process of wet chimney [5].
The flue gas purification system of our case Yatağan Thermal Power Station is also composed of the systems given in the figure above. The limestone needed for preparing lime milk are stocked in the silos, measured in dimensions and sent to the crackers. The limestone cracked in specific dimensions are granulated and transformed into water and lime milk. Well-granulated milestone are dispersed in the water and it turns into a suspension [2]. Prepared lime milk is stocked in the absorbent tank and the needed amount of it is sent to the washing tower (scrubber) through the feeding bands. Using the recirculation pumps, lime milk is given to the distribution bands in the washing tower and then sprayed in such a way that it contact with raw gas with the approximate percentage of 100% by the help of nozzles. SO2 found in flue gas is absorbed in the water and react with limestone.
Ca(HCO3)2 + 2SO2 ↔Ca(HSO3)2 + 2CO2
While the processed gas is getting high, it passes through the drop catchers, dehumidified here and sent to the chimney from the fresh air exit. Calciumsulphide which occurs after the reaction of lime milk and the polluted gas is osculated to the oxygen and tuned into calcium sulphate. When the density in the was hing tower exceeds the treshold limits (1130 kg/m3), the material is sent to the cyclones. Taking the advantage of the density gap, the one which has higher density is taken to the plaster tank and the other with lower density is taken again to the washing tower (scrubber). The reactions which occur in the washing tower through the purification process in the flue gas purification systems are given below.
Ca(HSO3)2 + CaCO3 + O2 ↔2CaSO4 + CO2 + H2O CaSO4 + 2H2O ↔CaSO4.2H2O
The well-used wet and dry flue gas purification systems and the information of the products which occur after the reaction of the active materials in these systems are given below.

773
28 - 30th May 2015 | Ankara - TURKIYE
Table 1. The processes of flue gas desulphurisation mostly applied
Process active material Product
WET SYSTEMS
Limestone CaCO3 (discarded) CaSO3 / CaSO4
Lime Ca(OH)2 (discarded) CaSO3 / CaSO4(discarded)
Double alkaline
Na2SO3 (regained) CaSO3 / CaSO4
Sodium carbonate
Na2CO3 /Na2SO3 (Na2CO3 /Na2SO3 regained)
CaSO3 / CaSO4
Mag-Ox MgO (regained) SO2 (may be used in the production of S or H2SO4)
Wellman-Lord
Na2SO3 (regained) H2SO4
DRY SYSTEMS
Limestone CaCO3(discarded) CaSO4
Lime Ca(OH)2 (discarded) CaSO4
Trona (Na2CO3- NaHCO3) (discarded)
Na2SO4
Spray drying
Lime, lime stone, soda (trona)
DryCaSO3 orNaSO3
Our case Yatağan Thermal Plant is composed of the sub-systems below:
Flue gas washing system
Limestone stocking, operating and preparing absorbent system
Dewatering plaster and ash jamming system
Flue gas washing system of every unit is composed of the sub-systems below
Flue gas way
Scrubber
Helper systems are composed of the sub-systems below
Limestone system
Limestone stocking, transporting and urgent stocking system
Preparing and feeding absorbent
Plaster dewatering
Hydrocyclone station (Units 1-2-3)
Gypsum parrying
Filtrates recycle
Transferring plaster mud
Ash transfer
Ash mixing
Provision of process water
Provision of the service and device air
Drainage hole
Urgent stocking tank
Flue gas washing system
Flue gas way: The elements of the way of flue gas which links the existing flue gas channels to scrubber are given below:
Flue gas channels
Booster fan
Urgent spraying system
Gas-gas warmer
Air dryer
The processes given below are done in washing tower
Disposing SO2
Disposing the dust
Turning the disposed SO2 andO2 tocipcium
Catching the drop
Sub-equipments of the washing tower are given below:
The entrance of flue gas
Absorption region
Drop catchers
Oxidation region
Crystallisation region
Scrubber pumps
The measurements of the analysis
Some of the technical information about the scrubber are given below
Flue gas entrance section:10 000×4200 mm
Speed of the dirty flue gas exit: 12,7 m/s
Absorption Region: 69 m³/h
The speed of the gas entrance in drop catchers: 4,4 m/s
The productivity of drop catcher: %99
Number of washing tower:3×1
Type :Bischoff
Gas flow rate (max) :1461595 Nm³/h (wet in the entrance)
Tower diameter: 13,5 m
Height of tower: 48,3 m
Drop catchers: 1 unit (two-level)
Scrubber materials:carbon steel
Spray level: 6 level

774
2nd International Sustainable Buildings Symposium
Number of mixers :4
Material:carbon steel
Nominal motor power:25 kW (each)
Speed of the gas in scrubber:3,3 m/sn
The height of oksidation region:from water level 5,4 m
Air temperature exiting from oxidation fan : 75°C
Oxidation fans
Total number:4 (one for reserve)
Type :turbo
Capacity:18 500 Nm³/hour
Pressure:1,85 bar
Height of crystallisationregion: 13.6 m (from bottom to oxidation region)
Circulation pumps: 3/scrubber
Type: santrifüj
Capacity: 13 500 m³/h
Pump pushing height: 19,90 / 23,40 / 27,00 m
Material: iron + rubber covering
shaft;
Power:1 200 / 1330 / 1540 kW
Speed: 350-450 rpm
Productivity: %87
Salmastra type:mechanic
Stimulation motor ;
Number: 3×3
Power:1 250-1750 kW
Voltage:6,3 kV
Speed:1 500 rpm
Measurements done
There is pressure meter, density meter, pH meter and flow meter in the pump line
The chemical attributions of limestone
CaCO3: min%90
MgO: <%3
SiO2: max%4
Moisture: %5
Grind ability: max 10 kWsaat/t
The capacity of reaction penetration: %50
Particle size: 0-60 mm
3. Persistent Measurement Systems in Flue Gas Purification Systems
SO2, nitrogen oxide NOX (NO), carbon monoxide (CO), oxygen (O2) and dust emission limits are persistently automatically monitored in the exit channels of the flue gas purification (FGP) systems. The attributions of the measurement devices are given in the table below.
Table 2. The attributions of constant measurement device
Place of measurement
Parameter Model Measurement range
Calibration Method
BGD Setting exit
CO
Siemens-Ultramat 23
0-750 mg/m3 Automatic
SO2 0-2.000 mg/m3
Automatic
NOX 0-2.000 mg/m3
Automatic
O2 0-%20 AutomaticDust Sick AG-
OMD41 0-450 mg/m3 Automatic
BGD Setting entrance
Flow SensorPiotoPub Method: Pressure Transmitter
2. Measurement Techniques in FGP Systems
Satisfying the isokinetic conditions and taking sample are important factors in doing right measurements. Taking isokinetic sample can be defined with taking the sample at an equal rate without any breakdown in flow conditions in the resource. The flow characteristics are crucially important in the samples which involve both of the gas and the particles. Taking a sample at any speed and point is sufficient if the flow speed and concentration are both stable in the sample taking point. But, in case of taking a sample from a resource which has unstable flow characteristic, expected concentration would be higher than the observed concentration when the speed of taking gas sample would be higher then the speed of the waste gas and vice versa. The characteristic of the flow speed are both valid for the gas and the particle materials [6].
In the table below isokinetic gas and dust samples are analysed within the scope of the principles that SKHKKY anticipates for the emission resource chimneys by using the standard measurement techniques given in the table. The way of isokinetic dust sampling is shown in the figure below.
Table 3. Standard measurement techniques using in emission measurements
Measured parameter Standard method
Designation case points EPA Method 1
Gas speed and flow measurement EPA Method 2
Identfying the moisture context EPA Method 4Oxidation gasesCOSO2NOx
EPA Method CTM 030EPA Method 6CEPA Method CTM 022
Dust EPA Method 17Halogens EPA 26

775
28 - 30th May 2015 | Ankara - TURKIYE
Figure 2. Isokinetic dust sample system
4. Results of the Measures Done in FGP Systems and their evaluation
The emission measurement results of the dust, CO, NOX and SO2 parameters taken from flue gas measurement device for each three unit in the dates between January 2011 and December 2012 in CGP system are gained as daily averages.
Carbon monoxide emissions and the evaluation
The results of the measures are shown in the graphics below where the CO emission values saved for each three unit are given with the treshold limits. From these graphics it is observed that CO emission data is rarely above from the treshold limits in terms of daily averages for Unit 1 and especially in Unit 3 its rate of being above extreme limit is higher. CO emission mostly increases parallel with the operation problems and negation in burning conditions. Looking these graphics it can be said that the burning conditions can be unfavourable.
Figure 3. CO emission values and its comparison with treshold limit (Unit 1)
Figure 4. CO emission values and its comparison with treshold limit (Unit 2)
Figure 5. CO emission values and its comparison with treshold limit (Unit 3)
Sulphur dioxide Emissions and the Evaluation
The results of the measurements are shown in the graphics below and the averages of the months where the number of measurements are below 10 are not calculated. In the graphics, SO2 daily emission data saved in the units are given with the treshold limits. In terms of Daily averages, in each of there units it is observed that SO2 concentrations is higher the treshold limit for somedays, but in general, they are below from the treshold limit for each three units.
Figure 6. SO emission values and its comparison with treshold limit (Unit 1)
Figure 7. SO emission values and its comparison with treshold limit (Unit 2)
Figure 8. SO emission values and its comparison with treshold limit (Unit 3)
776
2nd International Sustainable Buildings Symposium
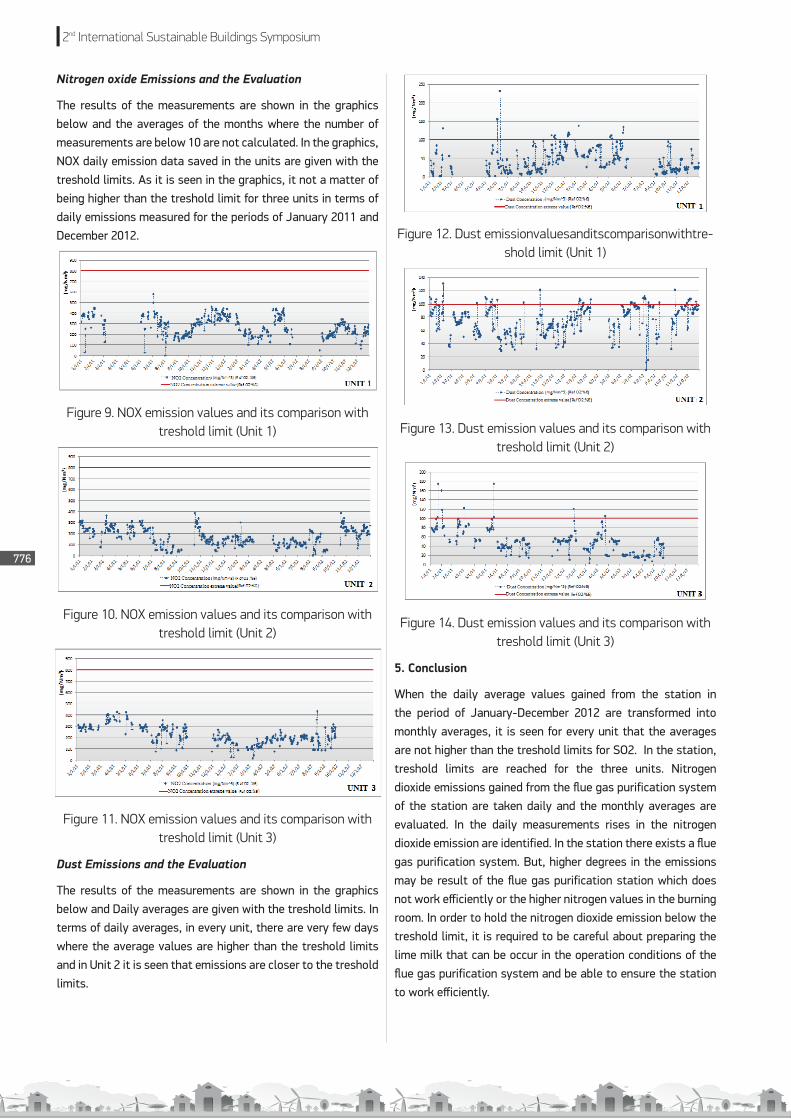
Nitrogen oxide Emissions and the Evaluation
The results of the measurements are shown in the graphics below and the averages of the months where the number of measurements are below 10 are not calculated. In the graphics, NOX daily emission data saved in the units are given with the treshold limits. As it is seen in the graphics, it not a matter of being higher than the treshold limit for three units in terms of daily emissions measured for the periods of January 2011 and December 2012.
Figure 9. NOX emission values and its comparison with treshold limit (Unit 1)
Figure 10. NOX emission values and its comparison with treshold limit (Unit 2)
Figure 11. NOX emission values and its comparison with treshold limit (Unit 3)
Dust Emissions and the Evaluation
The results of the measurements are shown in the graphics below and Daily averages are given with the treshold limits. In terms of daily averages, in every unit, there are very few days where the average values are higher than the treshold limits and in Unit 2 it is seen that emissions are closer to the treshold limits.
Figure 12. Dust emissionvaluesanditscomparisonwithtre-shold limit (Unit 1)
Figure 13. Dust emission values and its comparison with treshold limit (Unit 2)
Figure 14. Dust emission values and its comparison with treshold limit (Unit 3)
5. Conclusion
When the daily average values gained from the station in the period of January-December 2012 are transformed into monthly averages, it is seen for every unit that the averages are not higher than the treshold limits for SO2. In the station, treshold limits are reached for the three units. Nitrogen dioxide emissions gained from the flue gas purification system of the station are taken daily and the monthly averages are evaluated. In the daily measurements rises in the nitrogen dioxide emission are identified. In the station there exists a flue gas purification system. But, higher degrees in the emissions may be result of the flue gas purification station which does not work efficiently or the higher nitrogen values in the burning room. In order to hold the nitrogen dioxide emission below the treshold limit, it is required to be careful about preparing the lime milk that can be occur in the operation conditions of the flue gas purification system and be able to ensure the station to work efficiently.

777
28 - 30th May 2015 | Ankara - TURKIYE
In the station, in every unit and for the mentioned period, the averages are not higher than the treshold limits for NO. Any rise is seen in the emissions of NOx measured in the flue gas exit, but dust emissions are gained daily and the monthly averages are evaluated. In the dust emissions there are some levels where daily values are higher than the treshold limits. The electrostatic precipitator system of the station is renewed by annual revisions but it is seen that this renovation is now sufficient in some cases. In order to decrease the dust emissions, it is required to change or renew the electrostatic system.
In the station and for the period of January-December 2012, it is seen for every unit that the averagesare not higher than the treshold limits for CO. For CO emission treshold limits are ensured. The data gained from the automatic analyser in the flue gas purification station are noted daily and the monthly averages are evaluated. In the CO emissions there are some levels where daily values are higher than the treshold limits. These higher degrees in the emissions may be the result of unfavourable burning conditions or the problems about the operation system. If the oxygen is getting lower and the fuel is getting higher in the burning room, CO emission would rise. In order to ensure CO not to be exceeded from the treshold limits, it is required to control the amount of the oxygen and fuel in the burning room and the unfavourable conditions which arise from the operation systems should be removed and, by this way, emission values should be stabilised at the treshold limit.
References[1]. http://www.yildiz.edu.tr/~erturk/course_notes/air_pol_control/air70.doc[2]. Son erişim zamanı: 27.01.2015[3]. Çavuşoğlu, H &Gülaboğlu, M.Ş. (2013). Yaş baca gazı desülfürizasyon
yöntemleri. Pamukkale Üniversitesi Mühendislik Bilimleri Dergisi Cilt:19 Sayı: S.187, (In Turkish)
[4]. http://www.yildiz.edu.tr/~erturk/course_notes/air_pol_control/air70.docSon erişim zamanı: 27.01.2015
[5]. Durmaz, A., & Ercan, Y. (1987). A. Durmaz içinde, Türkiye’nin enerji altyapısı ve hava kirliliği (s. 32). Ankara, (In Turkish)
[6]. https://www.psnh.com/EnergyProjects/Clean-Air-Project.aspx Son erişim zamanı: 27.01.2015
[7]. TÜBİTAK MAM. (1993). Kimya Mühendisliği Araştırma Bölümü. M. Tırıs, H. Okutan, & E. Kalafatoğlu içinde, Hava kirliliği kaynakları ve kontrolü (s. 93-106). Gebze: Marmara Araştırma Merkezi, (In Turkish)
[8]. SKHKKY. (2009). Sanayi Kaynaklı Hava Kirliliğinin Kontrolü Yönetmeliği (30.03.2010 tarihli 27537 sayılı Resmi Gazete ile değişik). Ankara: T.C. Çevre ve Şehircilik Bakanlığı, (In Turkish)
[9]. Ersoy, Ö. (2014). Yatağan Termik Santrali Etki Alanında Hava Kirliliği Açısından Değerlendirilmesi, Yüksek Lisans Tezi, Gazi Üniversitesi Fen Bilimleri Enstitüsü, Ankara, (InTurkish)