Embed Size (px)
Citation preview
The equivalent amplitude stress as a solution of mean stress effect problem in fatigue analysis
Izabela Marczewska1, Tomasz Bednarek1,3, Artur Marczewski1, Włodzimierz Sosnowski1,3, Hieronim Jakubczak2, Jerzy Rojek1
1Institute of Fundamental Technological Research, Polish Academy of Sciences, ul. Swietokrzyska 21 00-049 Warsaw,
e-mail: [email protected] 2Warsaw University of Technology, Institute of Construction Machinery Engineering, ul. Narbutta 84 02-524 Warsaw 3Kazimierz Wielki University, Institute of Environmental Mechanics and Applied Computer Science, ul. Chodkiewicza
30 85-064 Bydgoszcz
In this paper an numerical algorithm is presented which makes possible to adopt different loading
schemes of specific structure at hand, for instance hydraulic cylinders, to specific Wöhler curves
characterizing fatigue resistance of given material. Hydraulic cylinders investigated under E.C.
project ”PROHIPP” are analyzed and some solution of the crack problem in oil port area are
proposed. Oil penetration in oil port connection zone can be eliminated after some design
modifications.
Key words: fatigue analysis, Wöhler curves, Goodman diagrams, hydraulic
cylinders, endurance limit
1 Introduction
There are two objectives of this paper. First objective is to present an numerical
algorithm which makes possible to adopt different loading schemes of hydraulic
cylinders to specific Wöhler curves characterizing fatigue resistance of given material.
Uniaxial loading case is studied in order to confirm relation between Goodman and
Wöhler curves parameters. The second target is to present calculations of hydraulic
cylinders investigated under E.C. project ”PROHIPP” and to propose some solution of
the crack problem in oil port area, in order to eliminate oil penetration in oil port
connection zone.
It is well known, that majority of fatigue tests are made for symmetric or nearly
symmetric load, when stress ratio
1max
min
max
−===S
S
p
pR mix (1)
Number of codes accept input data only for such kind of symmetric load. In
practice majority of structures, for instance hydraulic cylinders, work under much more
complex cyclic load characterized by different R values. In particular some specific
laboratory tests for hydraulic cylinders are made for 0=R , when the stresses changes
from 0 to some specific, maximal value. In this case the external pressure is applied to
the cylinder and then the pressure is removed. So the idea of equivalent amplitude
stress is introduced in section 2 in order to find out number of cycles to failure for
loads 1−≠R in situations, when test data are provided only for values 1−=R .
Number of cycles in such tests depends on fatigue resistance of the weakest
point of the cylinder. An example of such points are oil ports, where the welding
residual stresses, local shear forces and forces due to oil penetration in the connection
gaps lead to fatigue cracks causing final destruction.
Two kinds of numerical tests are performed. At the beginning standard fatigue
tests on workpiece shown in figure 2 are simulated (section 3). Goodman and Wöhler
curves and idea of equivalent amplitude stress are used in order to calculate number of
cycles to reach the fatigue limit of specimens with non-symmetric ( 1−≠R ) load.
Next, in section 4, the hydraulic cylinders fatigue problem was considered. Oil
port typical deformations and design modifications possible are shown in figure 12. It
can be observed, that the gap between oil port and cylinder in the oil port connection
zone grows up with increasing oil pressure. Also experiments (figure 12) confirm the
crack sensitivity of the weld in this connection zone. Authors propose the improvement
of this bad situation by using special washer or glue (as it is shown in figure 15) in
order to eliminate excessive gap between oil port and cylinder surfaces. Such washer or
glue prevents oil penetration thus eliminating the possibility of premature fatigue crack
in neighboring welds.
The washer or glue material should be high temperature resistant – due to
welding process of oil ports.
2 The idea of equivalent amplitude stress calculations for different stress ratio
The objective of this section is to develop the algorithm of calculation of the
amplitude stress 1−=Rae
S which will be equivalent to given value 1−≠Ra
S . The
assumption is made, that such amplitude stress 1−=Rae
S will give the same number of
cycles to fatigue failure as it is for given 1−≠Ra
S . This assumption is based on
Goodman and Wöhler curves dependency (figure 1). Next the amplitude stress 1−≠Ra
S
can be obtained from finite element analysis of specific structure at hand loaded by
arbitrary, non-symmetric load, 1−≠R .
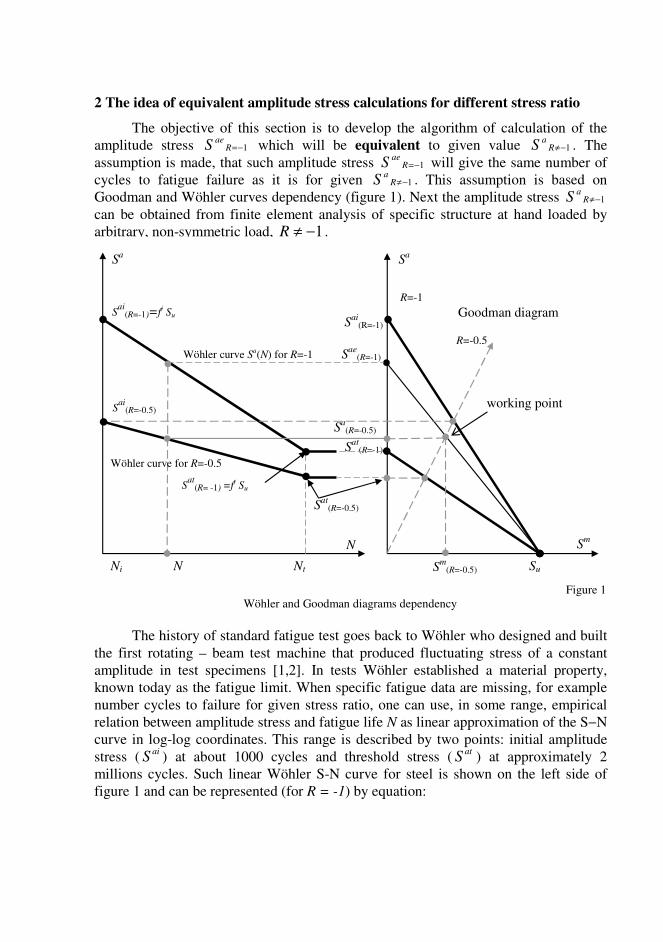
The history of standard fatigue test goes back to Wöhler who designed and built
the first rotating – beam test machine that produced fluctuating stress of a constant
amplitude in test specimens [1,2]. In tests Wöhler established a material property,
known today as the fatigue limit. When specific fatigue data are missing, for example
number cycles to failure for given stress ratio, one can use, in some range, empirical
relation between amplitude stress and fatigue life N as linear approximation of the S−N
curve in log-log coordinates. This range is described by two points: initial amplitude
stress (ai
S ) at about 1000 cycles and threshold stress (at
S ) at approximately 2
millions cycles. Such linear Wöhler S-N curve for steel is shown on the left side of
figure 1 and can be represented (for R = -1) by equation:
Figure 1
Wöhler and Goodman diagrams dependency
R=-1
Sm
Su
Sat
(R=-1)
Sa(R=-0.5)
Sm
(R=-0.5)
working point
Goodman diagram S
ai(R=-1)
Sae
(R=-1)
N
Ni Nt
Sa
N
Wöhler curve Sa(N) for R=-1
R=-0.5
Wöhler curve for R=-0.5
Sat
(R=-0.5)
Sat
(R= -1) =ft Su
Sai
(R=-1)=fi Su
Sai
(R=-0.5)
Sa
( ) ( ) [ ] ( ) )log()log()log()log()log(
)log()log(1
11
10)(
aiRi
it
aiR
atR
SNNNN
SS
a NS−=
−=−=+−
−
−
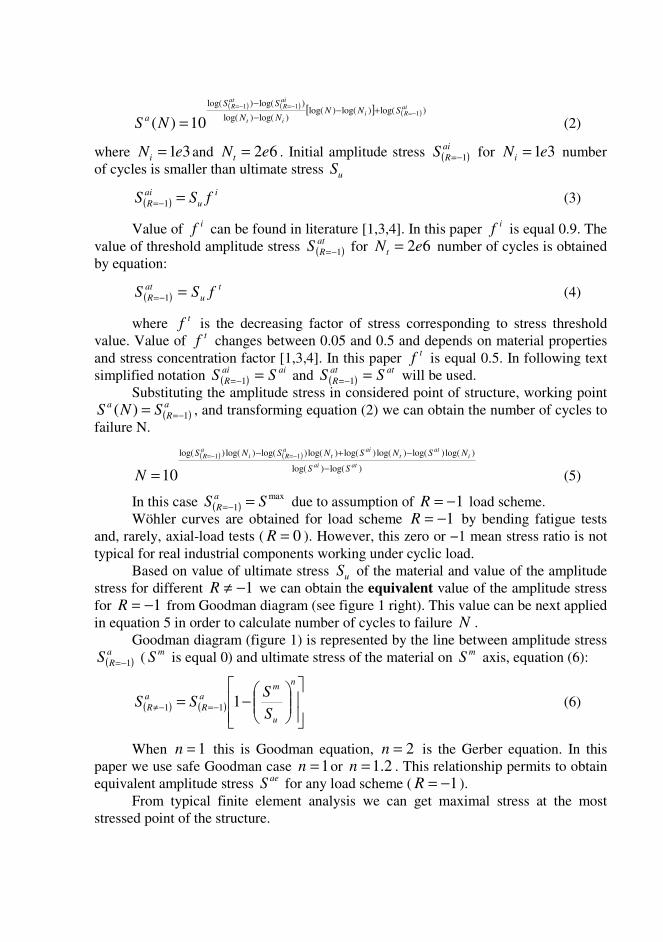
= (2)
where 31eNi = and 62eNt = . Initial amplitude stress ( )ai
RS 1−= for 31eNi = number
of cycles is smaller than ultimate stress uS
( )i
u
ai
R fSS =−= 1 (3)
Value of if can be found in literature [1,3,4]. In this paper
if is equal 0.9. The
value of threshold amplitude stress ( )at
RS 1−= for 62eNt = number of cycles is obtained
by equation:
( )t
u
at
R fSS =−= 1 (4)
where tf is the decreasing factor of stress corresponding to stress threshold
value. Value of tf changes between 0.05 and 0.5 and depends on material properties
and stress concentration factor [1,3,4]. In this paper tf is equal 0.5. In following text
simplified notation ( )aiai
R SS =−= 1 and ( )
atat
R SS =−= 1 will be used.
Substituting the amplitude stress in considered point of structure, working point
( )a
R
aSNS 1)(
−== , and transforming equation (2) we can obtain the number of cycles to
failure N.
( ) ( )
)log()log(
)log()log()log()log()log()log()log()log( 11
10atai
iat
tai
taRi
aR
SS
NSNSNSNS
N−
−+− −=−=
= (5)
In this case ( )max
1 SSa
R =−=
due to assumption of 1−=R load scheme.
Wöhler curves are obtained for load scheme 1−=R by bending fatigue tests
and, rarely, axial-load tests ( 0=R ). However, this zero or −1 mean stress ratio is not
typical for real industrial components working under cyclic load.
Based on value of ultimate stress uS of the material and value of the amplitude
stress for different 1−≠R we can obtain the equivalent value of the amplitude stress
for 1−=R from Goodman diagram (see figure 1 right). This value can be next applied
in equation 5 in order to calculate number of cycles to failure N .
Goodman diagram (figure 1) is represented by the line between amplitude stress
( )a
RS 1−= (
mS is equal 0) and ultimate stress of the material on
mS axis, equation (6):
( ) ( )
−=
−=−≠
n
u
ma
R
a
RS
SSS 111 (6)
When 1=n this is Goodman equation, 2=n is the Gerber equation. In this
paper we use safe Goodman case 1=n or 2.1=n . This relationship permits to obtain
equivalent amplitude stress ae
S for any load scheme ( 1−=R ).
From typical finite element analysis we can get maximal stress at the most
stressed point of the structure.
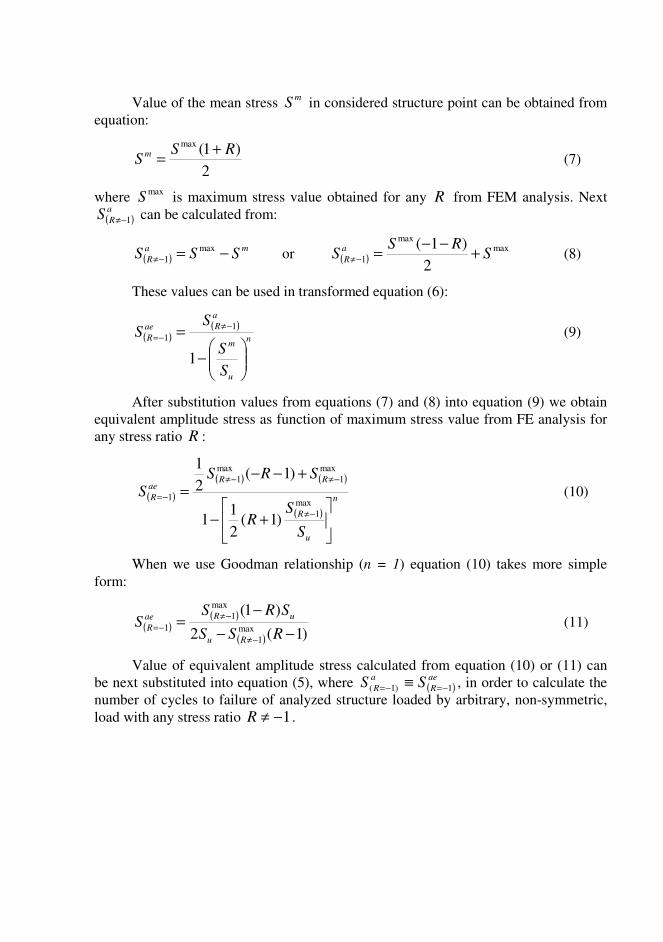
Value of the mean stress m
S in considered structure point can be obtained from
equation:
2
)1(maxRS
Sm +
= (7)
where max
S is maximum stress value obtained for any R from FEM analysis. Next
( )a
RS 1−≠ can be calculated from:
( )ma
R SSS −=−≠
max
1 or ( )max
max
12
)1(S
RSS
a
R +−−
=−≠
(8)
These values can be used in transformed equation (6):
( )( )
n
u
m
a
Rae
R
S
S
SS
−
=−≠
−=
1
1
1 (9)
After substitution values from equations (7) and (8) into equation (9) we obtain
equivalent amplitude stress as function of maximum stress value from FE analysis for
any stress ratio R :
( )
( ) ( )
( )
n
u
R
RRae
R
S
SR
SRS
S
+−
+−−
=
−≠
−≠−≠
−=max
1
max
1
max
1
1
)1(2
11
)1(2
1
(10)
When we use Goodman relationship (n = 1) equation (10) takes more simple
form:
( )( )
( ) )1(2
)1(max
1
max
1
1−−
−=
−≠
−≠
−=RSS
SRSS
Ru
uRae
R (11)
Value of equivalent amplitude stress calculated from equation (10) or (11) can
be next substituted into equation (5), where ( )ae
R
a
R SS 1)1( −=−=≡ , in order to calculate the
number of cycles to failure of analyzed structure loaded by arbitrary, non-symmetric,
load with any stress ratio 1−≠R .
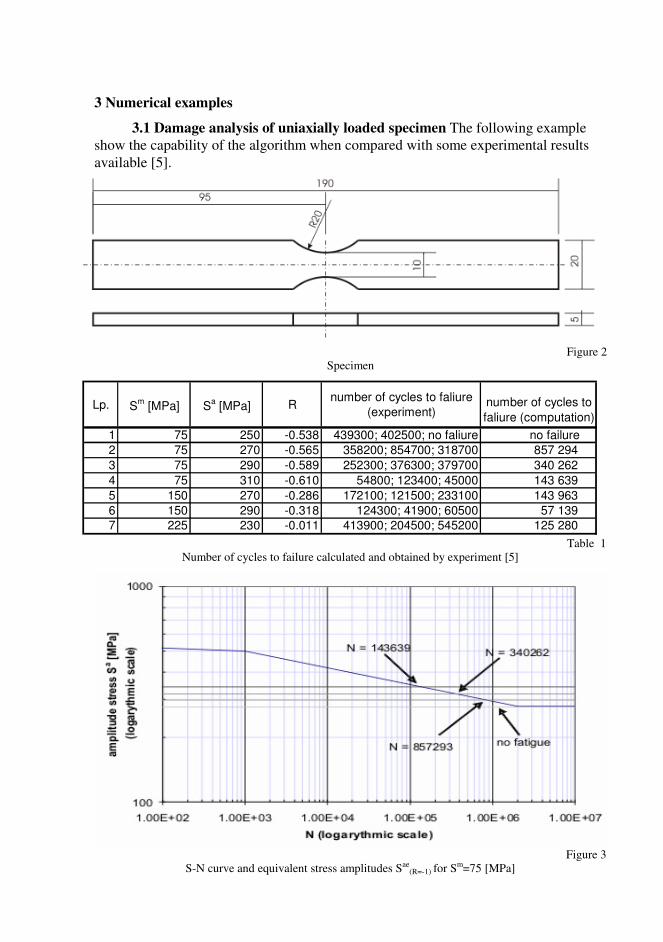
3 Numerical examples
3.1 Damage analysis of uniaxially loaded specimen The following example
show the capability of the algorithm when compared with some experimental results
available [5].
Figure 2
Specimen
Table 1
Number of cycles to failure calculated and obtained by experiment [5]
Figure 3
S-N curve and equivalent stress amplitudes Sae(R=-1) for Sm=75 [MPa]
Lp. Sm
[MPa] Sa [MPa] R
number of cycles to faliure
(experiment)number of cycles to
faliure (computation)
1 75 250 -0.538 439300; 402500; no faliure no failure
2 75 270 -0.565 358200; 854700; 318700 857 294
3 75 290 -0.589 252300; 376300; 379700 340 262
4 75 310 -0.610 54800; 123400; 45000 143 639
5 150 270 -0.286 172100; 121500; 233100 143 963
6 150 290 -0.318 124300; 41900; 60500 57 139
7 225 230 -0.011 413900; 204500; 545200 125 280
Uneasily loaded specimen (figure 2) was analyzed experimentally in [5]. The
geometrical dimensions are shown in figure 2. The length of the specimen is 0.019[m].
Material of the specimen is 10HNAP steel, parameters are as follows: density ρ = 7800
[kg/m3], Young modulus E =2.10e+11 [Pa], Poisson ratio ν =0.3, yield stress Re = 414
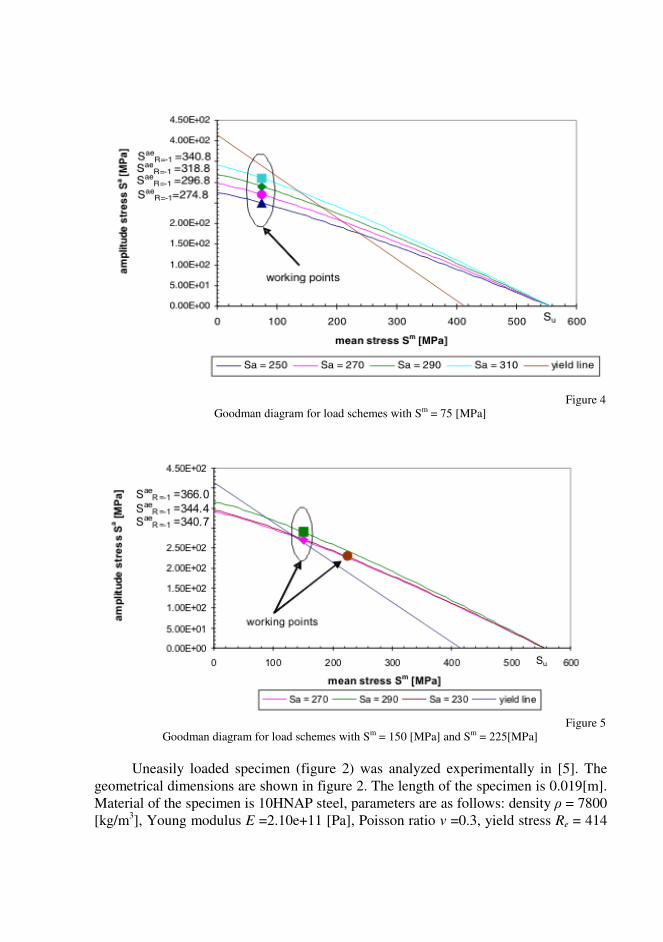
Figure 4
Goodman diagram for load schemes with Sm = 75 [MPa]
Figure 5
Goodman diagram for load schemes with Sm = 150 [MPa] and Sm = 225[MPa]
[MPa] and ultimate stress Su = 556 [MPa]. Exponent factor n in equation (6) is
assumed as 1.2. Three different value of mean stress were considered: 75, 150 and 225
[MPa]. In case of m
S = 75[MPa] four different stress amplitudes were assumed: a
S =
250, 270, 290, and 310 [MPa], in case of m
S = 150 [MPa] stress amplitudes are a
S =
270 and 290 [MPa] and in case of m
S = 225 [MPa] stress amplitude is equal 230
[MPa] [5].
First case: m
S =75 [MPa]
Four values of amplitude stress a
S were analyzed: a
S = 250, 270, 290, and 310
[MPa]. Maximum and minimum stresses ),( minmax SS are: (325,-175); (345,-195);
(365,-215); (385,-235) respectively. Working points and equivalent amplitude stresses
for 1−=R are presented in figure 4. Number of cycles to failure (obtained from
equation (5)) are in table 1 (see figure 3). Taking into consideration very large range of
experimental life of specimen, obtained predicted life of specimens are mostly located
in experiment range.
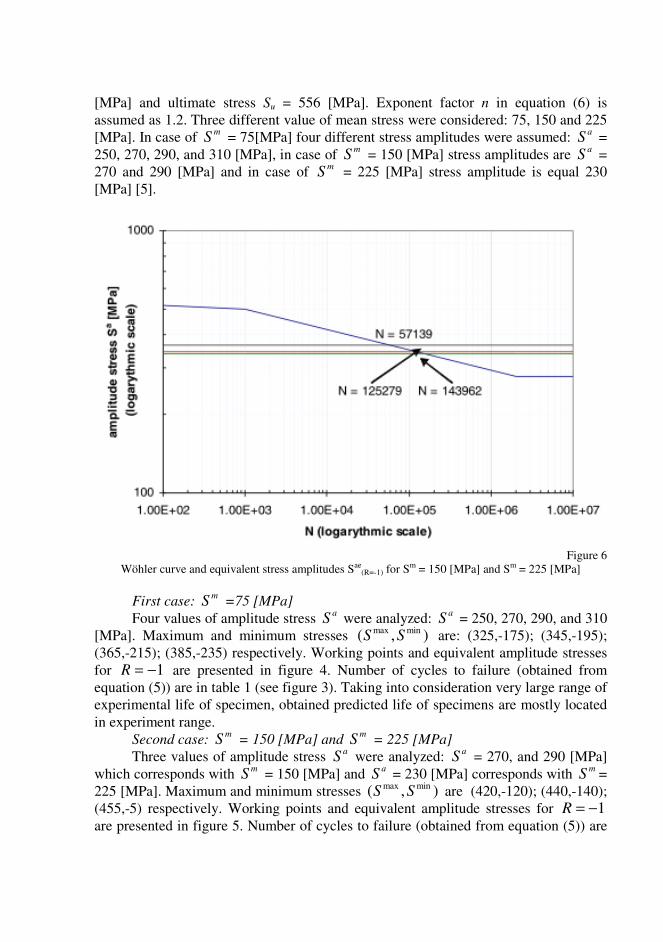
Second case: m
S = 150 [MPa] and m
S = 225 [MPa]
Three values of amplitude stress a
S were analyzed: a
S = 270, and 290 [MPa]
which corresponds with m
S = 150 [MPa] and a
S = 230 [MPa] corresponds with m
S =
225 [MPa]. Maximum and minimum stresses ),( minmax SS are (420,-120); (440,-140);
(455,-5) respectively. Working points and equivalent amplitude stresses for 1−=R
are presented in figure 5. Number of cycles to failure (obtained from equation (5)) are
Figure 6
Wöhler curve and equivalent stress amplitudes Sae(R=-1) for Sm = 150 [MPa] and Sm = 225 [MPa]
in table 1 (see figure 6). I this case range of experimental data is very large. Calculated
values of number of cycles to failure are close to experimental data, except m
S = 225
[MPa]. Here a larger value of exponent n in equation (6) might be used.
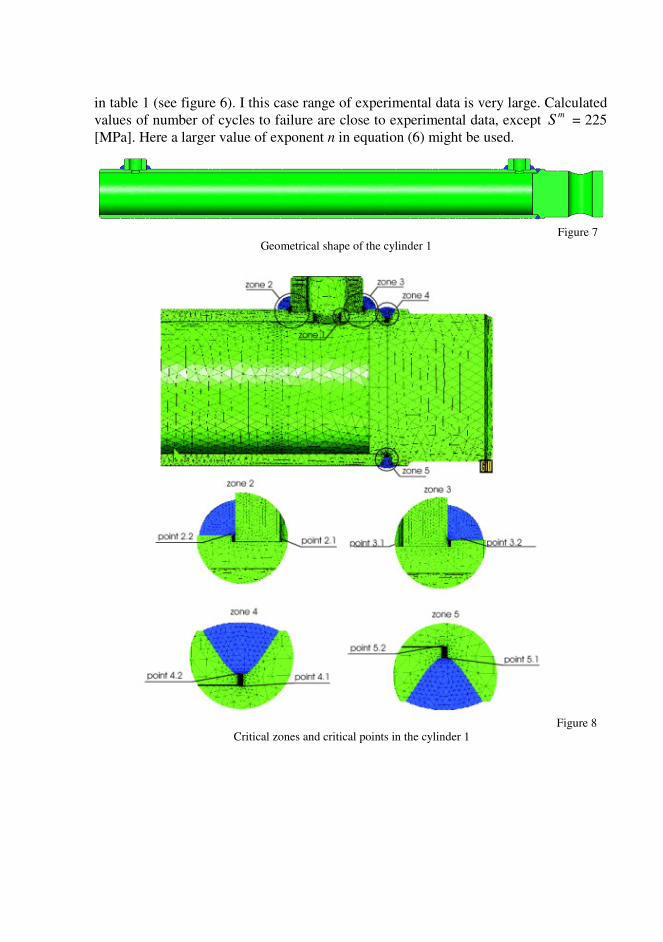
Figure 7
Geometrical shape of the cylinder 1
Figure 8
Critical zones and critical points in the cylinder 1
4 Hydraulic cylinder design, oil ports fatigue and possible design modifications
4.1 Fatigue analysis of hydraulic cylinder 1 Cylinder shown in figure 7 was
tested.
The cylinder has two oil ports. The material of the specimen is steel St52.
Material data: density ρ = 7800 [kg/m3], Young modulus E =2.10e+11 [Pa], Poisson
ratio ν =0.3, initial flow stress Re = 350 [MPa], saturation flow stress Su = 520 [MPa].
Inner pressure 30 ± 0.08 [MPa]. Stress ratio maxmin / ppR = is equal 0.
Initial and threshold amplitude stress for steel St52 and 1−=R are equal:
( ) [MPa] 4689.01 ==−= u
at
R SS and ( ) [MPa] 23445.01 ==−= u
at
R SS .
Five critical zones determined in the numerical experiment are shown in figure
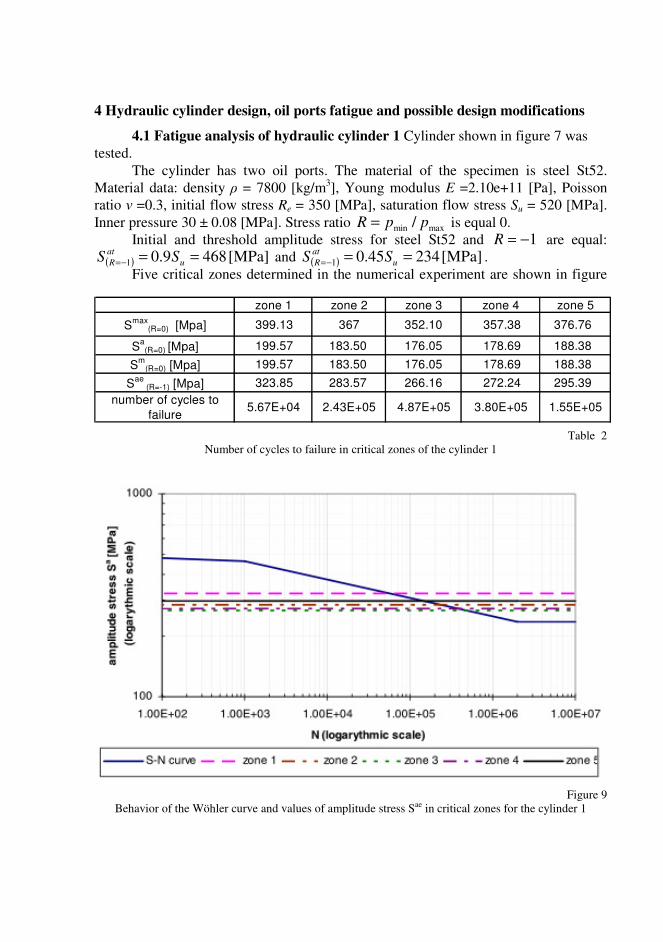
Figure 9
Behavior of the Wöhler curve and values of amplitude stress Sae in critical zones for the cylinder 1
Table 2
Number of cycles to failure in critical zones of the cylinder 1
zone 1 zone 2 zone 3 zone 4 zone 5
Smax
(R=0) [Mpa] 399.13 367 352.10 357.38 376.76
Sa
(R=0) [Mpa] 199.57 183.50 176.05 178.69 188.38
Sm
(R=0) [Mpa] 199.57 183.50 176.05 178.69 188.38
Sae
(R=-1) [Mpa] 323.85 283.57 266.16 272.24 295.39
number of cycles to
failure5.67E+04 2.43E+05 4.87E+05 3.80E+05 1.55E+05
8. Number of cycles to failure (see figure 9) is obtained as intersection of adopted to
fully symmetrical load scheme )1( −=R stress amplitude with classical Wöhler curve.
Values of maximal, amplitude and mean stress in each of the zones and number of
cycles to failure are shown in table 2.
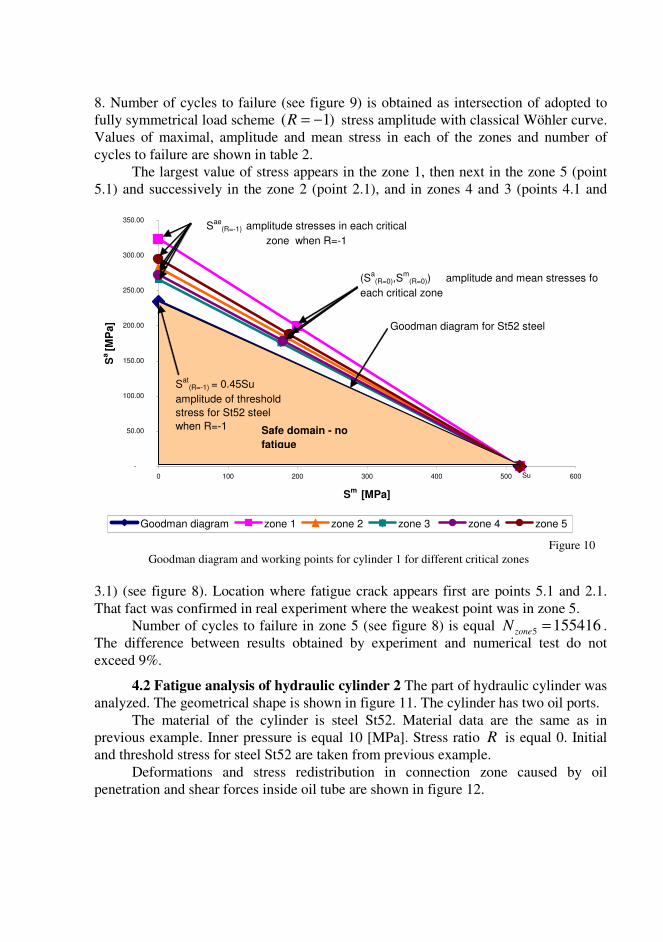
The largest value of stress appears in the zone 1, then next in the zone 5 (point
5.1) and successively in the zone 2 (point 2.1), and in zones 4 and 3 (points 4.1 and
3.1) (see figure 8). Location where fatigue crack appears first are points 5.1 and 2.1.
That fact was confirmed in real experiment where the weakest point was in zone 5.
Number of cycles to failure in zone 5 (see figure 8) is equal 1554165 =zoneN .
The difference between results obtained by experiment and numerical test do not
exceed 9%.
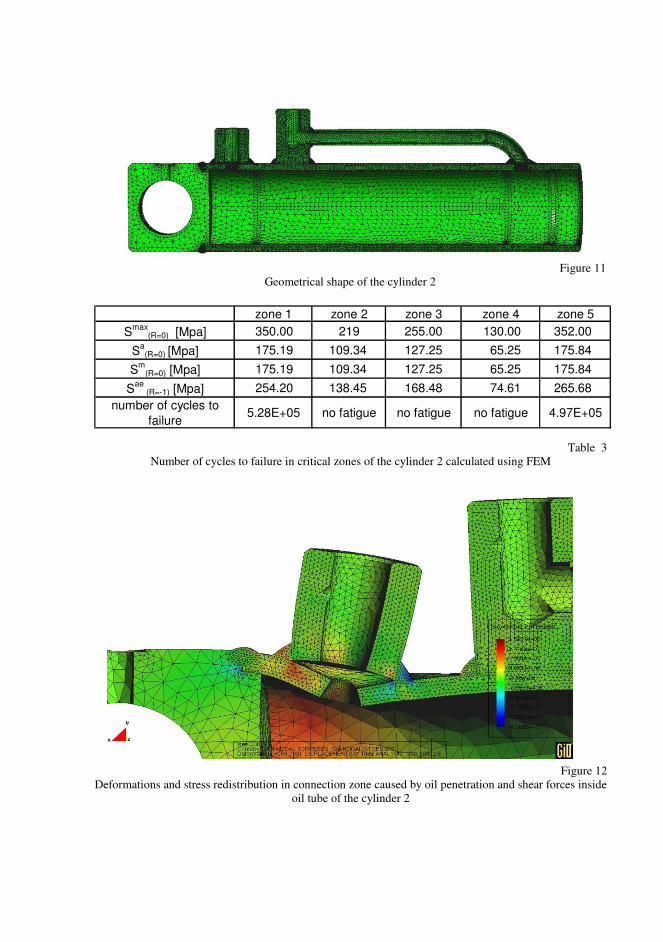
4.2 Fatigue analysis of hydraulic cylinder 2 The part of hydraulic cylinder was
analyzed. The geometrical shape is shown in figure 11. The cylinder has two oil ports.
The material of the cylinder is steel St52. Material data are the same as in
previous example. Inner pressure is equal 10 [MPa]. Stress ratio R is equal 0. Initial
and threshold stress for steel St52 are taken from previous example.
Deformations and stress redistribution in connection zone caused by oil
penetration and shear forces inside oil tube are shown in figure 12.
Figure 10
Goodman diagram and working points for cylinder 1 for different critical zones
-
50.00
100.00
150.00
200.00
250.00
300.00
350.00
0 100 200 300 400 500 600
Sm
[MPa]
Sa [M
Pa]
Goodman diagram zone 1 zone 2 zone 3 zone 4 zone 5
Su
(Sa(R=0),S
m(R=0)) amplitude and mean stresses for working points in
each critical zone
Goodman diagram for St52 steel
Sae
(R=-1) amplitude stresses in each critical
zone when R=-1
Sat
(R=-1) = 0.45Su
amplitude of threshold
stress for St52 steel
when R=-1 Safe domain - no
fatigue
a
Figure 11
Geometrical shape of the cylinder 2
Figure 12
Deformations and stress redistribution in connection zone caused by oil penetration and shear forces inside
oil tube of the cylinder 2
Table 3
Number of cycles to failure in critical zones of the cylinder 2 calculated using FEM
zone 1 zone 2 zone 3 zone 4 zone 5
Smax
(R=0) [Mpa] 350.00 219 255.00 130.00 352.00
Sa
(R=0) [Mpa] 175.19 109.34 127.25 65.25 175.84
Sm
(R=0) [Mpa] 175.19 109.34 127.25 65.25 175.84
Sae
(R=-1) [Mpa] 254.20 138.45 168.48 74.61 265.68
number of cycles to
failure5.28E+05 no fatigue no fatigue no fatigue 4.97E+05
Values of the maximal stresses, amplitude and mean stresses for 0=R and
1−=R , and number cycles to failure calculated using FEM in each zones are shown
in table 3. Values of the maximal stresses in zone 1 and zone 5 are almost the same.
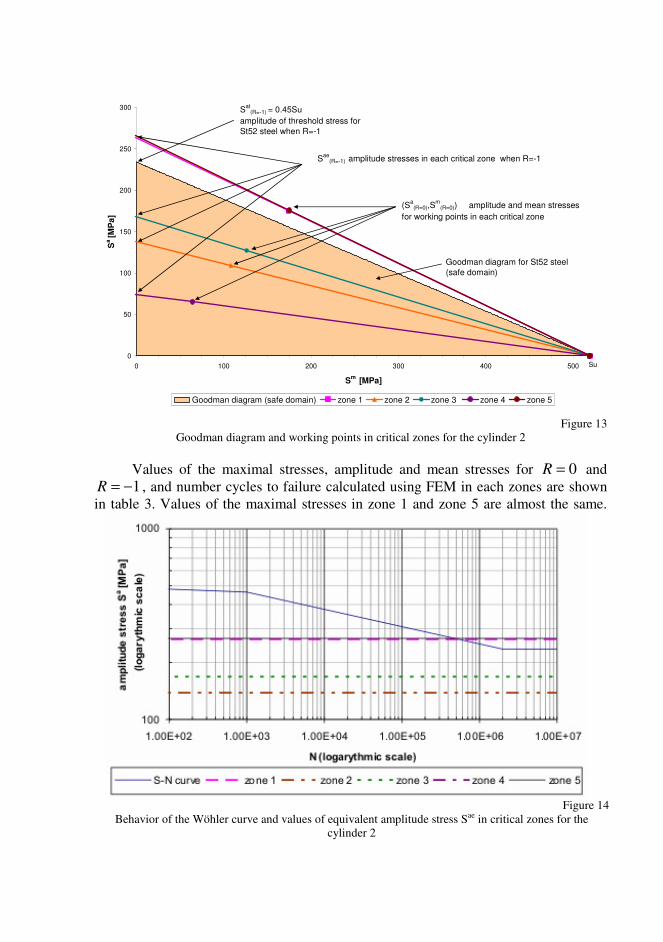
Figure 13
Goodman diagram and working points in critical zones for the cylinder 2
Figure 14
Behavior of the Wöhler curve and values of equivalent amplitude stress Sae in critical zones for the
cylinder 2
0
50
100
150
200
250
300
0 100 200 300 400 500
Sm
[MPa]
Sa
[MP
a]
Goodman diagram (safe domain) zone 1 zone 2 zone 3 zone 4 zone 5
Su
(Sa
(R=0),Sm
(R=0)) amplitude and mean stresses
for working points in each critical zone
Goodman diagram for St52 steel
(safe domain)
Sae
(R=-1) amplitude stresses in each critical zone when R=-1
Sat
(R=-1) = 0.45Su
amplitude of threshold stress for
St52 steel when R=-1
These two working points (zone 1 and zone 5) are located above the Goodman
diagram, other points are lying below the Goodman diagram in safe area (see figure
13). Fatigue crack will appear in zones 1 and 5. Cracks will not appear in other zones.
Number of cycles to failure in zone 1 and zone 5 obtained as intersection of the
equivalent amplitude stress for 1−=R with Wöhler curve are shown in table 3 and in
figure 14.
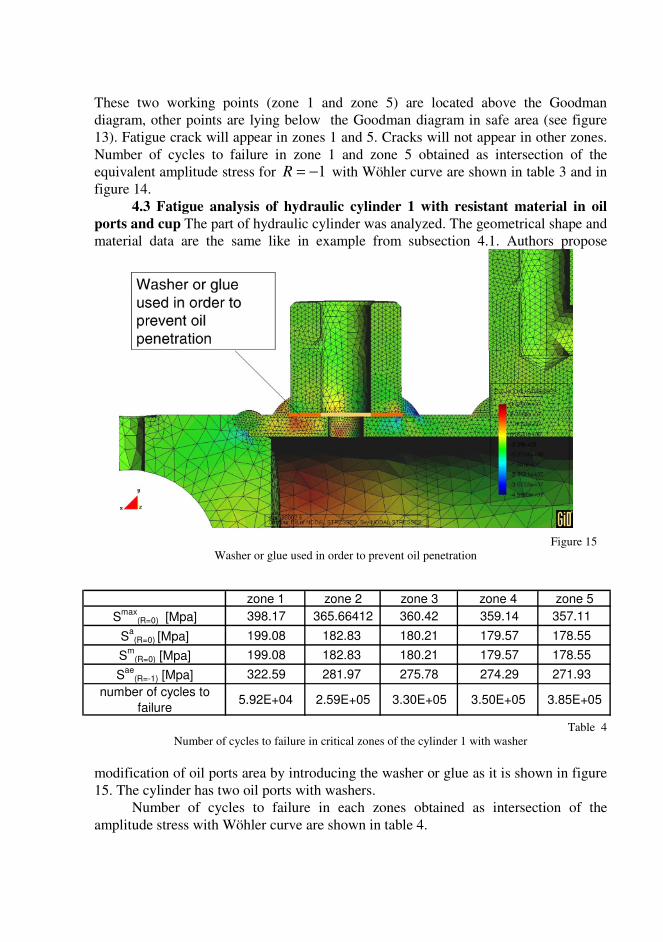
4.3 Fatigue analysis of hydraulic cylinder 1 with resistant material in oil
ports and cup The part of hydraulic cylinder was analyzed. The geometrical shape and
material data are the same like in example from subsection 4.1. Authors propose
modification of oil ports area by introducing the washer or glue as it is shown in figure
15. The cylinder has two oil ports with washers.
Number of cycles to failure in each zones obtained as intersection of the
amplitude stress with Wöhler curve are shown in table 4.
Figure 15
Washer or glue used in order to prevent oil penetration
Table 4
Number of cycles to failure in critical zones of the cylinder 1 with washer
zone 1 zone 2 zone 3 zone 4 zone 5
Smax
(R=0) [Mpa] 398.17 365.66412 360.42 359.14 357.11
Sa
(R=0) [Mpa] 199.08 182.83 180.21 179.57 178.55
Sm
(R=0) [Mpa] 199.08 182.83 180.21 179.57 178.55
Sae
(R=-1) [Mpa] 322.59 281.97 275.78 274.29 271.93
number of cycles to
failure5.92E+04 2.59E+05 3.30E+05 3.50E+05 3.85E+05
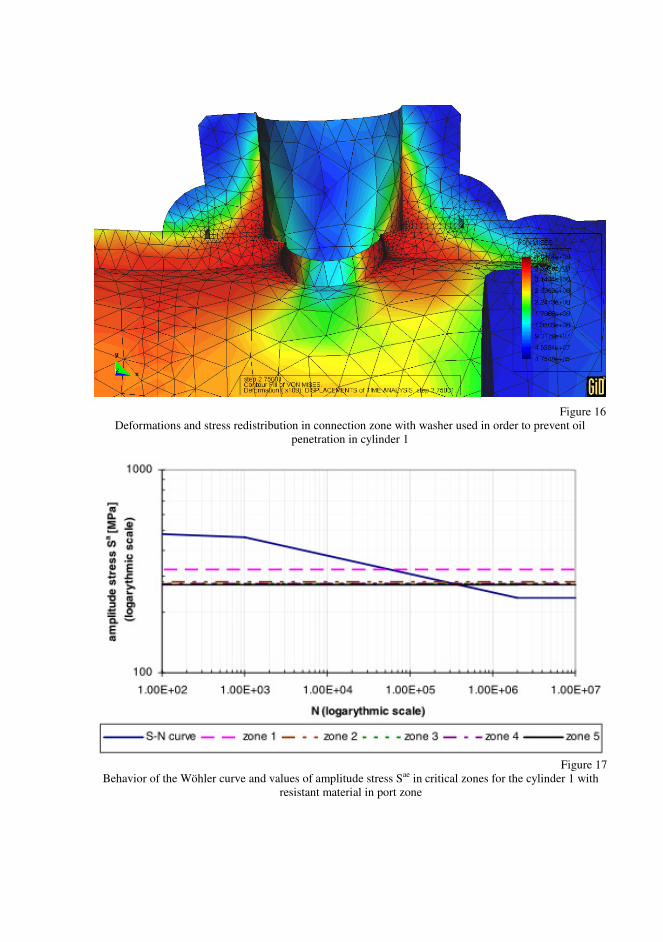
Figure 16
Deformations and stress redistribution in connection zone with washer used in order to prevent oil
penetration in cylinder 1
Figure 17
Behavior of the Wöhler curve and values of amplitude stress Sae in critical zones for the cylinder 1 with
resistant material in port zone
a
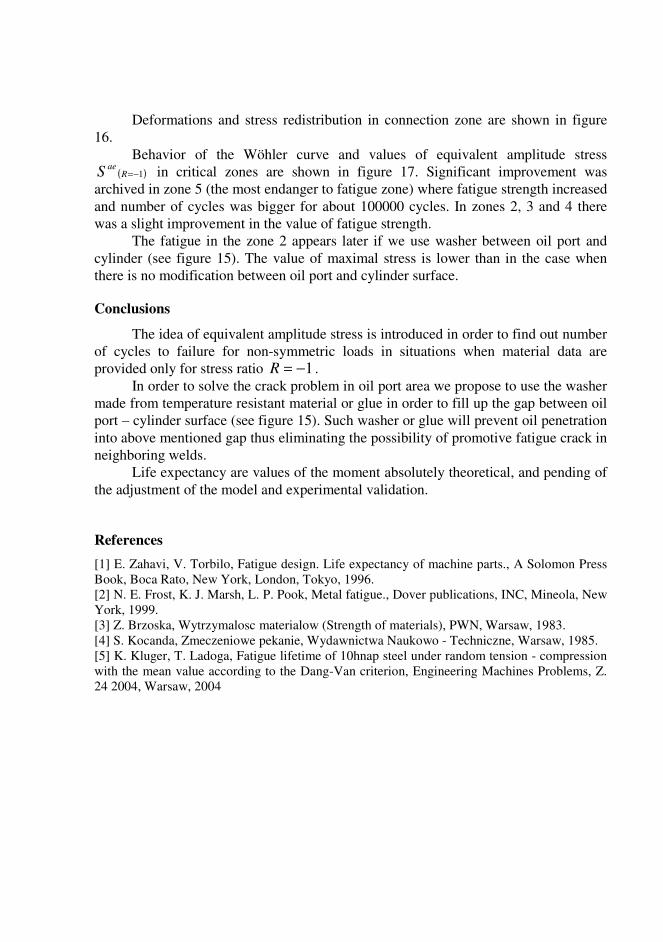
Deformations and stress redistribution in connection zone are shown in figure
16.
Behavior of the Wöhler curve and values of equivalent amplitude stress
( )1−=Rae
S in critical zones are shown in figure 17. Significant improvement was
archived in zone 5 (the most endanger to fatigue zone) where fatigue strength increased
and number of cycles was bigger for about 100000 cycles. In zones 2, 3 and 4 there
was a slight improvement in the value of fatigue strength.
The fatigue in the zone 2 appears later if we use washer between oil port and
cylinder (see figure 15). The value of maximal stress is lower than in the case when
there is no modification between oil port and cylinder surface.
Conclusions
The idea of equivalent amplitude stress is introduced in order to find out number
of cycles to failure for non-symmetric loads in situations when material data are
provided only for stress ratio 1−=R .
In order to solve the crack problem in oil port area we propose to use the washer
made from temperature resistant material or glue in order to fill up the gap between oil
port – cylinder surface (see figure 15). Such washer or glue will prevent oil penetration
into above mentioned gap thus eliminating the possibility of promotive fatigue crack in
neighboring welds.
Life expectancy are values of the moment absolutely theoretical, and pending of
the adjustment of the model and experimental validation.
References
[1] E. Zahavi, V. Torbilo, Fatigue design. Life expectancy of machine parts., A Solomon Press
Book, Boca Rato, New York, London, Tokyo, 1996.
[2] N. E. Frost, K. J. Marsh, L. P. Pook, Metal fatigue., Dover publications, INC, Mineola, New
York, 1999.
[3] Z. Brzoska, Wytrzymalosc materialow (Strength of materials), PWN, Warsaw, 1983.
[4] S. Kocanda, Zmeczeniowe pekanie, Wydawnictwa Naukowo - Techniczne, Warsaw, 1985.
[5] K. Kluger, T. Ladoga, Fatigue lifetime of 10hnap steel under random tension - compression
with the mean value according to the Dang-Van criterion, Engineering Machines Problems, Z.
24 2004, Warsaw, 2004
Acknowledgement
"PROHIPP" project is partially funded by the E.C. inside the sixth framework
programme, priority 3 NMP FP62002-NMP-2-SME, Research area 3.4.3.1.5: Support
to the development of new knowledged based added value products and services in
traditionally less RTD intensive industries.
We thanks the financial contribution of the E.C. and we state that the article
reflects only the personal opinion of the authors.
Authors are indebted to the Roquet SA and to CIMNE for providing
experimental data and numerical code COMET used in these calculations.
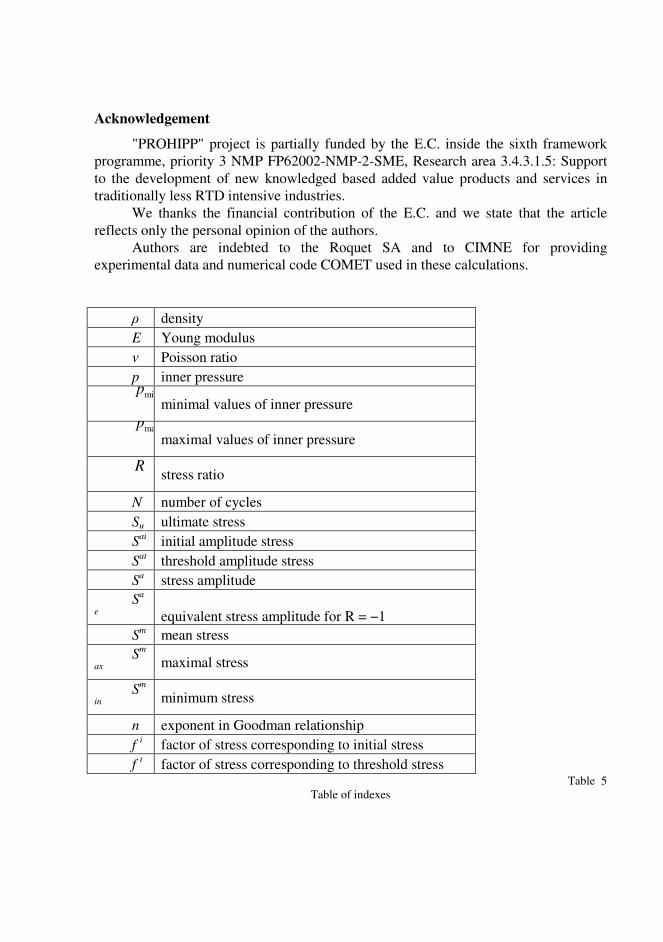
ρ density
E Young modulus
ν Poisson ratio
p inner pressure minp
minimal values of inner pressure
maxp
maximal values of inner pressure
R
stress ratio
N number of cycles
Su ultimate stress
Sai initial amplitude stress
Sat threshold amplitude stress
Sa stress amplitude
Sa
e equivalent stress amplitude for R = −1
Sm mean stress
Sm
ax
maximal stress
Sm
in
minimum stress
n exponent in Goodman relationship
f i factor of stress corresponding to initial stress
f t
factor of stress corresponding to threshold stress Table 5
Table of indexes

Submitted to Physico-Mathematical Modeling and Informational Technologies
2.11.2005r.