Embed Size (px)
Citation preview
consulting group
The Essentials of Portfolio ConstructionPortfolio construction is a disciplined, personalized process. In constructing a portfolio, the individual risk and return characteristics of the underlying investments must be considered along with your unique needs, goals and risk considerations.
APRIL 2010
1. Throughout this paper, references to “investment manager” and “manager” may also apply to a mutual fund.
2. For definitions of key terms used in this paper, please see the Glossary on page 8.
This paper dissects the portfolio construction process, providing insights on successful practices. If you have not done so already, you can work with your Financial Advisor or Private Wealth Advisor to construct a portfolio based on these insights. Or, he/she can help you evaluate your existing portfolio to ensure you are appropriately allocated according to your personal and financial situation.
introduction: A Brief History
It is generally believed that the evolution of portfolio construction began in 1952 with the publication of Harry Markowitz’s thesis, Portfolio Selection. This piece introduced the world to Modern Portfolio Theory and provided a framework aimed at maximizing returns at a given level of volatility, defined as the standard deviation of returns.
2 The essenTials of PorTfolio ConsTruCTion
In 1964, William Sharpe expanded on Markowitz’s work with the Capital Asset Pricing Model, which introduced alpha, the excess return of the asset relative to the return of the benchmark index, and beta, the risk of the asset relative to the market.
In the 1980s, two other major changes occurred. First, A.G. Becker introduced the concept of investment style. Historically, portfolio managers had been measured against the market as a whole, or even against the investor’s own expectations. Following Becker’s contribution, portfolio investment managers were grouped according to investment style (e.g., active v. passive, growth v. value, or small cap v. large cap).
Second, in 1986, a paper by Gary Brinson, L. Randolph Hood and Gilbert Beebower,
Determinants of Portfolio Performance, concluded that asset allocation is the primary determinant of variation in returns. This research significantly influenced institutional investors, who found that they could tailor their commensurate levels of risk and return by varying the level of investment in the various asset classes.
Today, the amalgamation of these theories forms the basis for the investment consulting process.
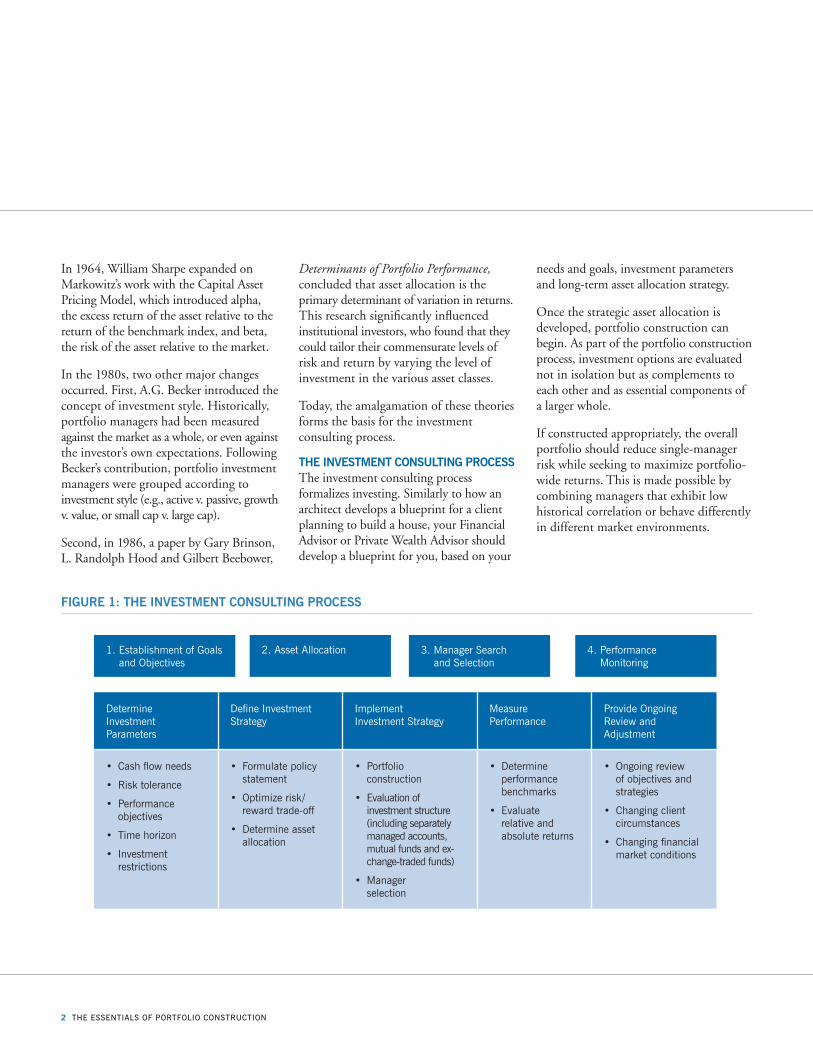
tHe investment consulting processThe investment consulting process formalizes investing. Similarly to how an architect develops a blueprint for a client planning to build a house, your Financial Advisor or Private Wealth Advisor should develop a blueprint for you, based on your
needs and goals, investment parameters and long-term asset allocation strategy.
Once the strategic asset allocation is developed, portfolio construction can begin. As part of the portfolio construction process, investment options are evaluated not in isolation but as complements to each other and as essential components of a larger whole.
If constructed appropriately, the overall portfolio should reduce single-manager risk while seeking to maximize portfolio-wide returns. This is made possible by combining managers that exhibit low historical correlation or behave differently in different market environments.
Determine Investment Parameters
Define Investment Strategy
Implement Investment Strategy
Measure Performance
Provide Ongoing Review and Adjustment
• Cash flow needs
• Risk tolerance
• Performance objectives
• Time horizon
• Investment restrictions
• Formulate policy statement
• Optimize risk/ reward trade-off
• Determine asset allocation
• Portfolio construction
• Evaluation of investment structure (including separately managed accounts, mutual funds and ex-change-traded funds)
• Manager selection
• Determine performance benchmarks
• Evaluate relative and absolute returns
• Ongoing review of objectives and strategies
• Changing client circumstances
• Changing financial market conditions
1. Establishment of Goals and Objectives
2. Asset Allocation 3. Manager Search and Selection
4. Performance Monitoring
figure 1: tHe investment consulting process
The essenTials of PorTfolio ConsTruCTion 3
investment decision mAking—Avoiding tHe pitfAllsA disciplined portfolio construction process can help you meet your goals while striking a balance between risk and return. Sound portfolio construction should maintain and enhance your strategic asset allocation strategy and help you avoid the pitfalls (outlined below) that often prevent investors from reaching their goals:
Selecting the “hot-dot” managerIt is tempting to sort a performance report and select the investment manager that has the strongest performance numbers. However, experience and empirical data indicate that top-percentile performance is unstable over time and typically the result of style or market capitalization exposure or even outsized or disproportionate risk taking. Remember: “If it seems too good to be true, it probably is.”
Failing to identify the source of the manager’s returnsOut-performance is often the result of an investment manager actively trying to beat a benchmark through individual security concentration or relative overweighting or underweighting of industry, sector, style or market capitalization. Risk can lead to reward, but it is not guaranteed. To prevent an unpleasant surprise in the future, be sure that you understand the source of the manager’s outperformance.
Choosing managers with overlapping exposuresIf you select multiple managers that have outperformed in the recent three-, five- or seven-year time period, without considering which investment style(s) (e.g., growth v. value) was/were in favor during that period, you may end up with an allocation to multiple managers
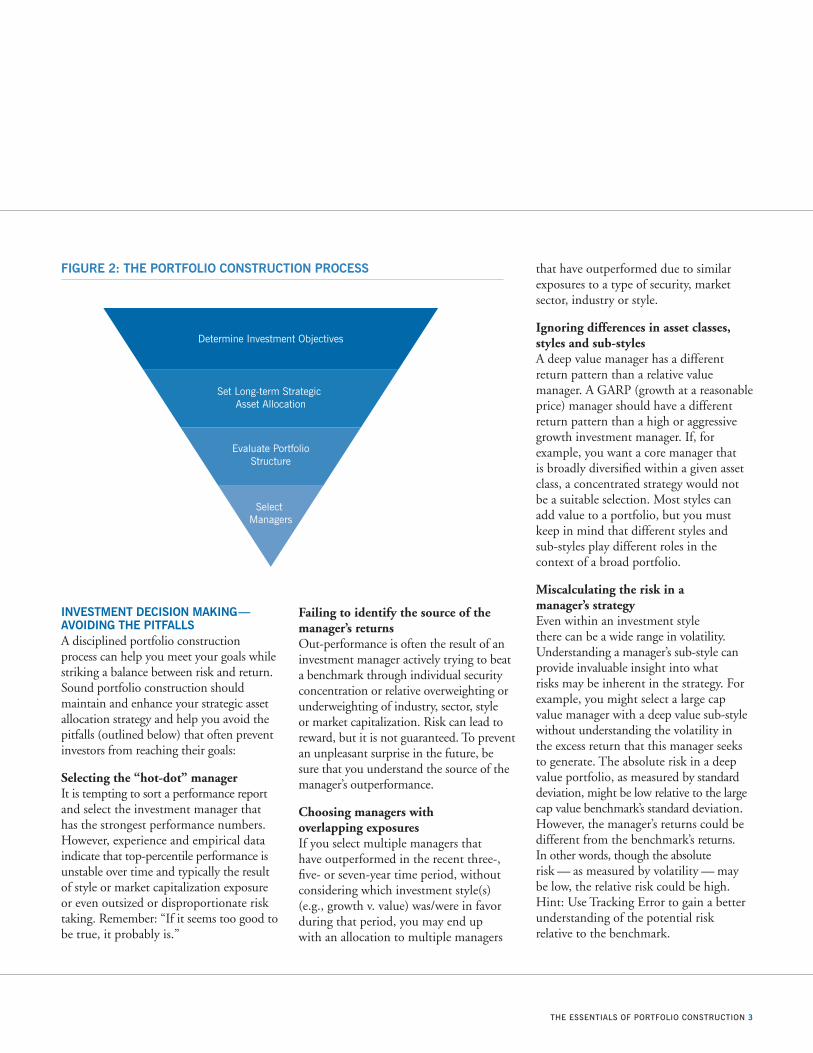
figure 2: tHe portfolio construction process
Determine Investment Objectives
Set Long-term Strategic Asset Allocation
Evaluate PortfolioStructure
Select Managers
that have outperformed due to similar exposures to a type of security, market sector, industry or style.
Ignoring differences in asset classes, styles and sub-stylesA deep value manager has a different return pattern than a relative value manager. A GARP (growth at a reasonable price) manager should have a different return pattern than a high or aggressive growth investment manager. If, for example, you want a core manager that is broadly diversified within a given asset class, a concentrated strategy would not be a suitable selection. Most styles can add value to a portfolio, but you must keep in mind that different styles and sub-styles play different roles in the context of a broad portfolio.
Miscalculating the risk in a manager’s strategyEven within an investment style there can be a wide range in volatility. Understanding a manager’s sub-style can provide invaluable insight into what risks may be inherent in the strategy. For example, you might select a large cap value manager with a deep value sub-style without understanding the volatility in the excess return that this manager seeks to generate. The absolute risk in a deep value portfolio, as measured by standard deviation, might be low relative to the large cap value benchmark’s standard deviation. However, the manager’s returns could be different from the benchmark’s returns. In other words, though the absolute risk — as measured by volatility — may be low, the relative risk could be high. Hint: Use Tracking Error to gain a better understanding of the potential risk relative to the benchmark.
4 The essenTials of PorTfolio ConsTruCTion
Evaluating risk using standard deviation aloneStandard deviation is typically used to measure risk; however, standard deviation rarely reflects the true overall potential risk in a portfolio and should never be used as the sole determinant of risk. While standard deviation aids in measuring the historical volatility of returns in a portfolio and in assessing how portfolio returns have fluctuated relative to the mean or to other investments, it is not as effective for shorter measurement periods (i.e., fewer than five years of monthly or quarterly returns). This is because historical standard deviation does not reveal the strategy’s underlying holdings, industry, style or market capitalization concentration. Furthermore, standard deviation is typically highly correlated to market volatility, making it difficult to isolate individual strategy risk from general market risk.
Misconstruing good manager selection for good portfolio constructionThere are significant shortcomings in the all-too-common methodology of “constructing” a portfolio simply by selecting “good” managers for each asset class. Notably, the overlap and correlations between and among managers of different styles can create unintended exposures or overweights. For example, the combination of a mid cap value manager with a tilt toward larger cap stocks and a large cap manager with an overweight to mid cap stocks would most likely create an overexposure to the mid/large cap sectors. Thus, greater emphasis should be placed on evaluating the combination of investments to better understand whether the blended exposure corresponds with the intended asset allocation as set forth in your initial blueprint.
implementAtionOnce your investment strategy and asset allocation — your blueprint — have been developed, portfolio construction can commence. The first step is to understand which approach best suits your needs (and personality). Historically, many financial professionals have recommended that their clients rely exclusively on active investment management for their portfolios. However, this method may not be most appropriate for you.
Your Financial Advisor or Private Wealth Advisor can help you understand all of your options — from active to passive investing, to a core/satellite approach.
Step 1: Implementation Approach: Active, Passive or Core/SatelliteOne option is to utilize active management for each asset class within your portfolio. The benefits could include enhanced returns, reduced volatility and/or access to less efficient and more illiquid markets and securities. However, with active management, you take the risk of underperformance — at higher costs.
In a fully passive framework, you would invest exclusively in vehicles such as index funds and/or exchange-traded funds. The benefits to this approach may include lower costs, reduced single-manager risk and low style risk. However a passive-only approach foregoes the opportunity for adding value above and beyond the benchmark (i.e., alpha). Essentially, you are relying on the asset allocation strategy to do all the work.
A core/satellite approach combines elements of active and passive investing. It assumes that in the most efficient asset classes (i.e., asset classes in which it is
harder to gain a competitive advantage; about which information is more readily available; and in which stocks are more liquid, more heavily traded, etc.) you would be better served utilizing a passive, cost-effective, tax-efficient solution (the core), while in the less efficient asset classes you would be better served utilizing investment managers that actively attempt to generate alpha (satellite).
After working with your Financial Advisor or Private Wealth Advisor to select the most appropriate approach for you, it may be tempting to start comparing and contrasting investment options to fulfill the allocation. However, there are other issues to consider.
Step 2: The Role of Asset Classes and Styles Whether you have chosen an active, a passive or a core/satellite approach to constructing your portfolio, the degree of risk that will be taken in each asset class must be considered. This will help you narrow down the choices of manager candidates for each asset class. For example, if you are seeking to fulfill the large cap growth category, you must decide whether you want to invest in an aggressive choice, such as a high-growth manager, which offers the opportunity to deliver significant alpha, or a more conservative choice, such as a GARP (Growth At a Reasonable Price) manager that runs a more diversified portfolio. In other words, with the guidance of your Financial Advisor or Private Wealth Advisor, you must determine the role that each asset class and style will play within the context of your overall portfolio—before selecting the investment option that will fulfill that asset class or style.
The essenTials of PorTfolio ConsTruCTion 5
Step 3: Manager SelectionAfter narrowing down your list to a few suitable candidates per asset class, each of the managers needs to be analyzed. Managers are typically classified by asset class and style, but these categorizations do not facilitate a full understanding of the specializations and other characteristics of the managers.
To differentiate one manager from another, your Financial Advisor or Private Wealth Advisor and you should consider the nuances. For example:
•Inwhichsectors,geographicregions,etc., has the strategy been overweight or underweight?
•Howdoesthestrategy’sallocationto larger cap stocks compare to its allocation to smaller cap stocks?
•Whatdothevariousportfoliocharacteristics (e.g., price-to-earnings, market capitalization or dividend yield) say about the strategy’s risk/reward tradeoff?
The managers’ statistics must be compared to each other as well as to the relevant benchmarks over various time periods. The goal is to select the manager that is most appropriate for the particular asset class, based on its risk factors and historical returns, as well as its holdings relative to other managers in the portfolio. This process should be repeated for each asset class.
The following is the process for choosing an appropriate manager within the portfolio construction framework:
1. Qualitative Research and Due Diligence
2. Evaluation of Portfolio Characteristics
3. Modern Portfolio Theory Statistical Analysis
4. Returns-Based Style Analysis
5. Validation of Manager Blend
1. Qualitative research and Due DiligenceThe first step in the manager selection process addresses four key areas:
A. People: Integrity & Stability
B. Philosophy: Consistency & Focus
C. Process: Accountability & Risk Management
D. Performance: Consistency & Risk/Reward Analysis
2. evaluation of Portfolio CharacteristicsThe second step in the manager selection process is a holdings-based investigation of the manager’s portfolio. The characteristics considered include:
A. Number of Holdings
B. Turnover Rate
C. Security and Sector Weightings
D. Earnings Per Share (“EPS”) and EPS Growth
E. Sales and Sales Growth
F. Dividend Yield
G. Valuations (Price to Earnings, Price to Sales, Price to Book, etc.)
H. Market Capitalization
This fundamental analysis allows for a better perspective on the absolute and relative risks that the manager is taking and how these risks compare to those taken by its competitors. However, there are drawbacks to relying on this type of
analysis alone. Firstly, holdings-based information typically represents a single point in time, so it may neglect historical trends. Secondly, coverage may be limited on certain individual securities, such as fixed income and foreign offerings.
To use this approach effectively, one must be cognizant of its benefits as well as its shortcomings. The analysis is best conducted as a complement to the analysis conducted in step three of the manager selection process.
3. Modern Portfolio Theory statistical analysisAs described in the introduction of this paper, Markowitz and Sharpe developed Modern Portfolio Theory, which provided a framework for seeking to maximize returns at a given level of volatility. The focus of this analysis should be on the historical relative and absolute risk in the manager’s track record—across multiple time frames and diverse market environments. The key Modern Portfolio Theory statistics are:
A. Standard Deviation
B. Upside and Downside Capture Ratios
C. Beta
D. Alpha
E. Correlation
F. R-Squared
G. Information Ratio
H. Tracking Error
I. Cumulative and Rolling-Period Returns
6 The essenTials of PorTfolio ConsTruCTion
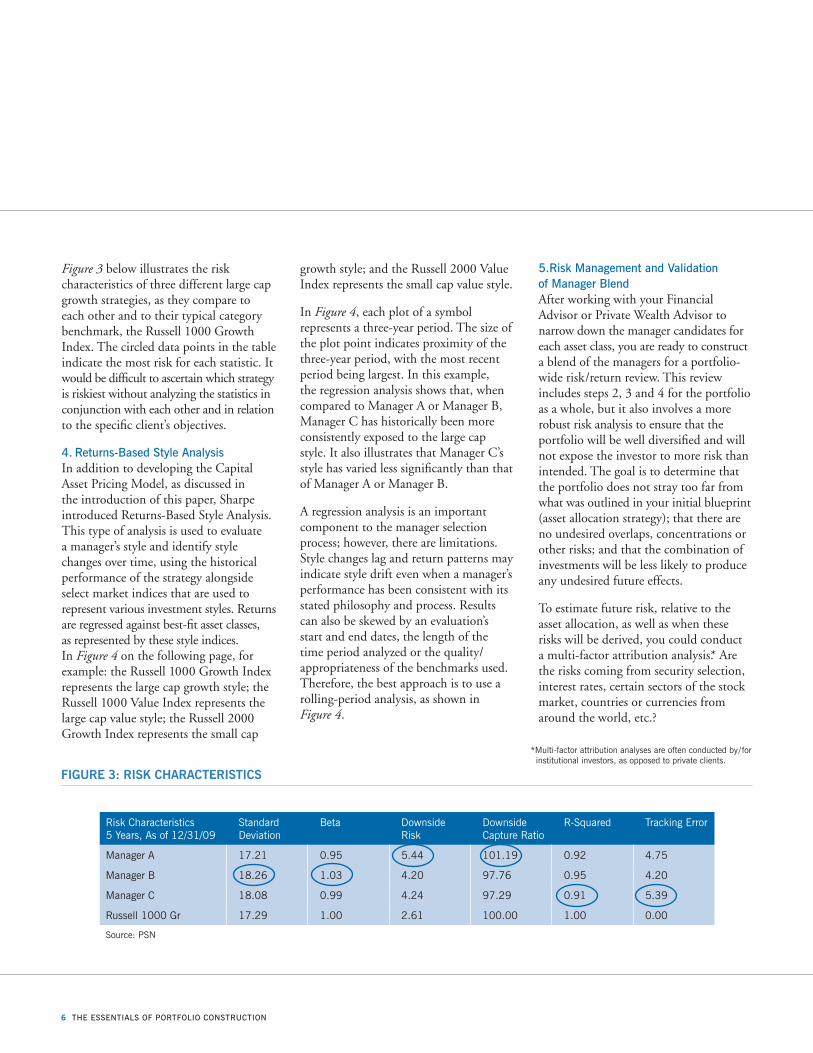
Figure 3 below illustrates the risk characteristics of three different large cap growth strategies, as they compare to each other and to their typical category benchmark, the Russell 1000 Growth Index. The circled data points in the table indicate the most risk for each statistic. It would be difficult to ascertain which strategy is riskiest without analyzing the statistics in conjunction with each other and in relation to the specific client’s objectives.
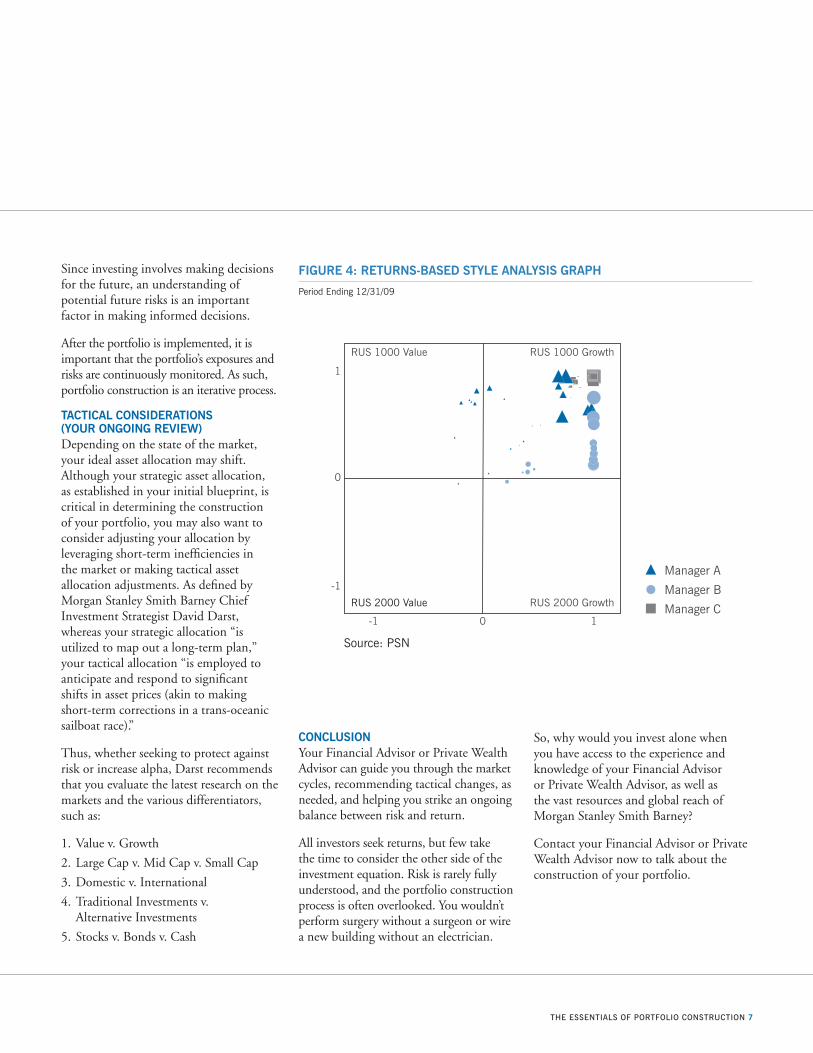
4. returns-Based style analysisIn addition to developing the Capital Asset Pricing Model, as discussed in the introduction of this paper, Sharpe introduced Returns-Based Style Analysis. This type of analysis is used to evaluate a manager’s style and identify style changes over time, using the historical performance of the strategy alongside select market indices that are used to represent various investment styles. Returns are regressed against best-fit asset classes, as represented by these style indices. In Figure 4 on the following page, for example: the Russell 1000 Growth Index represents the large cap growth style; the Russell 1000 Value Index represents the large cap value style; the Russell 2000 Growth Index represents the small cap
growth style; and the Russell 2000 Value Index represents the small cap value style.
In Figure 4, each plot of a symbol represents a three-year period. The size of the plot point indicates proximity of the three-year period, with the most recent period being largest. In this example, the regression analysis shows that, when compared to Manager A or Manager B, Manager C has historically been more consistently exposed to the large cap style. It also illustrates that Manager C’s style has varied less significantly than that of Manager A or Manager B.
A regression analysis is an important component to the manager selection process; however, there are limitations. Style changes lag and return patterns may indicate style drift even when a manager’s performance has been consistent with its stated philosophy and process. Results can also be skewed by an evaluation’s start and end dates, the length of the time period analyzed or the quality/appropriateness of the benchmarks used. Therefore, the best approach is to use a rolling-period analysis, as shown in Figure 4.
5. risk Management and Validation of Manager BlendAfter working with your Financial Advisor or Private Wealth Advisor to narrow down the manager candidates for each asset class, you are ready to construct a blend of the managers for a portfolio-wide risk/return review. This review includes steps 2, 3 and 4 for the portfolio as a whole, but it also involves a more robust risk analysis to ensure that the portfolio will be well diversified and will not expose the investor to more risk than intended. The goal is to determine that the portfolio does not stray too far from what was outlined in your initial blueprint (asset allocation strategy); that there are no undesired overlaps, concentrations or other risks; and that the combination of investments will be less likely to produce any undesired future effects.
To estimate future risk, relative to the asset allocation, as well as when these risks will be derived, you could conduct a multi-factor attribution analysis.* Are the risks coming from security selection, interest rates, certain sectors of the stock market, countries or currencies from around the world, etc.?
figure 3: risk cHArActeristics
Risk Characteristics5 Years, As of 12/31/09
Standard Deviation
Beta Downside Risk
Downside Capture Ratio
R-Squared Tracking Error
Manager A 17.21 0.95 5.44 101.19 0.92 4.75
Manager B 18.26 1.03 4.20 97.76 0.95 4.20
Manager C 18.08 0.99 4.24 97.29 0.91 5.39
Russell 1000 Gr 17.29 1.00 2.61 100.00 1.00 0.00
Source: PSN
*Multi-factor attribution analyses are often conducted by/ for institutional investors, as opposed to private clients.
The essenTials of PorTfolio ConsTruCTion 7
Since investing involves making decisions for the future, an understanding of potential future risks is an important factor in making informed decisions.
After the portfolio is implemented, it is important that the portfolio’s exposures and risks are continuously monitored. As such, portfolio construction is an iterative process.
tActicAl considerAtions (your ongoing review)Depending on the state of the market, your ideal asset allocation may shift. Although your strategic asset allocation, as established in your initial blueprint, is critical in determining the construction of your portfolio, you may also want to consider adjusting your allocation by leveraging short-term inefficiencies in the market or making tactical asset allocation adjustments. As defined by Morgan Stanley Smith Barney Chief Investment Strategist David Darst, whereas your strategic allocation “is utilized to map out a long-term plan,” your tactical allocation “is employed to anticipate and respond to significant shifts in asset prices (akin to making short-term corrections in a trans-oceanic sailboat race).”
Thus, whether seeking to protect against risk or increase alpha, Darst recommends that you evaluate the latest research on the markets and the various differentiators, such as:
1. Value v. Growth
2. Large Cap v. Mid Cap v. Small Cap
3. Domestic v. International
4. Traditional Investments v. Alternative Investments
5. Stocks v. Bonds v. Cash
figure 4: returns-BAsed style AnAlysis grApH
Period Ending 12/31/09
RUS 1000 Value
1
-1
-1 10
0
RUS 2000 Value RUS 2000 Growth
Manager A
Manager B
Manager C
RUS 1000 Growth
Source: PSN
conclusionYour Financial Advisor or Private Wealth Advisor can guide you through the market cycles, recommending tactical changes, as needed, and helping you strike an ongoing balance between risk and return.
All investors seek returns, but few take the time to consider the other side of the investment equation. Risk is rarely fully understood, and the portfolio construction process is often overlooked. You wouldn’t perform surgery without a surgeon or wire a new building without an electrician.
So, why would you invest alone when you have access to the experience and knowledge of your Financial Advisor or Private Wealth Advisor, as well as the vast resources and global reach of Morgan Stanley Smith Barney?
Contact your Financial Advisor or Private Wealth Advisor now to talk about the construction of your portfolio.
8 The essenTials of PorTfolio ConsTruCTion
glossAryValue Investing: The strategy of selecting stocks that trade for less than their intrinsic value. Value investors actively seek stocks of companies with sound financial statements that they believe the market has undervalued. They believe the market always overreacts to good and bad news, causing stock price movements that do not correspond with long-term fundamentals. The result is an opportunity for value investors to profit by taking a position on an inflated/deflated price and selling off when the price is later corrected by the market. Typically, these investors select stocks with lower-than-average price-to-book or price-to-earnings ratios and/or high dividend yields.
Deep Value: Deep-value managers generally seek companies that are selling at considerably reduced valuations, often trading at a discount to book value. One deep-value approach includes contrarian investing, through which managers look for companies they believe are inappropriately undervalued by the market because they are currently out of favor.
Relative Value: Relative-value managers generally analyze companies’ valuations relative to the market, industry and historical norms to determine a stock’s “fair value.” These managers typically maintain broader market exposure than traditional and deep-value managers.
Growth Investing: The strategy of selecting stocks deemed to have good growth potential. In most cases, a growth stock is defined as a company with earnings that are expected to grow at an average rate above that of its industry or the overall market.
GARP: Growth-At-A-Reasonable-Price managers look for companies that exhibit sustainable earnings growth and trade at reasonable valuations. While these managers place more emphasis on earnings growth than market-oriented managers, they place more emphasis on valuations than traditional growth managers.
Cumulative Return: Expressed as a percentage return; represents the percentage change in the value of an investment portfolio between two points in time and includes dividends, interest and capital gains.
Rolling-Period Returns: A technique that allows investors to see longer-term trends by displaying compound annual returns for a series of shorter specific time periods over a long time horizon.
Regression (Style) Analysis: Evaluating a manager’s style and identifying style changes over time, using the historical performance of the strategy alongside select market indices that are used to represent various investment styles. Returns are regressed against best-fit asset classes, as represented by these style indices.
Standard Deviation: Used to measure volatility, or risk, indicating the extent to which an investment’s return deviates from the expected normal return. A volatile investment would have a high standard deviation. Standard deviation is a useful historical measure of the variability of return earned by an investment portfolio. In performance measurement, it is generally assumed that a larger standard deviation implies that greater risk was taken to achieve the return.
Capture Ratio: A measure of how a manager has performed relative to a market index during specific periods when the index produced either positive (upside) or negative (downside) returns. Capture ratio is calculated by dividing the manager’s annualized performance return for the intervals of time during the measurement period when the index was positive/negative by the index’s positive/negative returns over the same intervals. A percentage of less than 100% indicates that the manager “captured” less performance than the index, while a percentage greater than 100% indicates that the manager captured more performance than the index. For example, if the annualized performance of an index during “up” markets (when its return was positive) is 20.8% and the annualized performance of the manager during the same period is 16.8%, then the manager’s upside capture ratio is 16.8%/20.8%=80.7%, meaning the manager “captured” 80.7% of the upside performance of the index. Stated another way, the manager in this example performed almost 20% worse than the market during up periods.
Beta: The measure of an asset’s risk in relation to the market (for example, the S&P 500 Index) or to an alternative benchmark. Roughly speaking, a security with a beta of 1.5 will move, on average, 1.5 times the market return. More precisely, that stock’s excess return (over and above a short-term money market rate) is expected to move 1.5 times the market excess return. According to asset pricing theory, beta represents the type of risk (systematic risk) that cannot be diversified away. When using beta, there are a number of issues to be aware of: (1) the beta may change over time; (2) the

The essenTials of PorTfolio ConsTruCTion 9
beta may be different depending on the direction of the market (e.g., the beta may be greater for down moves in the market than up moves); (3) the estimated beta will be biased if the security does not frequently trade; and (4) the beta is not necessarily a complete measure of risk (you may need multiple betas).
Alpha: The synonym of “value added,” alpha is the incremental return from a manager when the market is stationary. In other words, it is the extra expected return due to nonmarket factors. This risk-adjusted measurement takes into account the performance of the market as a whole as well as the volatility of a manager. A positive alpha indicates that a selected portfolio has produced above-expected returns at a given level of risk, while a negative alpha indicates the portfolio has produced below-expected returns.
Correlation Coefficient (r): A measure of the degree of correlation between two quantities or variables, such as the rates
of return on stocks and bonds. A negative coefficient of correlation indicates an inverse or negative relationship, whereas a positive value indicates a direct or positive relationship. The range of values is from -1 through +1. A zero (0) value indicates that no correlation exists. Correlation coefficients are useful in asset class identification and portfolio diversification.
R-Squared: A statistical measure representing the percentage of a fund’s or security’s movements, explained by movements in a benchmark index.
Information Ratio: Usually used to measure a manager’s performance against a benchmark, the ratio of expected return to risk, as measured by standard deviation.
Tracking Error: A measurement of the standard deviation of the difference between a selected market index and a manager’s quarterly returns. For example, a manager selects an index as a benchmark for comparison against his /her portfolio.
Each quarter generates new returns for the manager and the selected index. The returns for the manager are then compared to the indices to determine the amount of excess return, producing a tracking error. A low tracking error indicates that the manager is tracking the selected index closely or has roughly the same returns as the index.
Multi-Factor Attribution Analysis: May be used to explain the risk characteristics and performance of a portfolio of securities. Through the use of advanced statistical techniques and software, one can attribute the return or the risk in a portfolio to various factors. This type of analysis is most often performed relative to an index. Factors typically used include macroeconomic data points (e.g., levels of interest rates or oil prices), fundamental characteristics (e.g., dividend yield, price-to-earnings ratio, etc.), sector weights and country weights.

10

11
This article has been prepared for informational purposes only. it does not provide individually tailored investment advice. it has been prepared without regard to the individual financial circumstances and objectives of persons who receive it. Morgan Stanley Smith Barney recommends that investors independently evaluate particular investments and strategies, and encourages investors to seek the advice of a financial advisor or Private Wealth advisor. The appropriateness of a particular investment or strategy will depend on an investor’s individual circumstances and objectives.
historical data shown represents past performance and does not guarantee comparable future results. The index returns shown are for comparative purposes only and do not represent the performance of any specific investment. Index performance does not reflect the impact of any taxes, transaction costs, management fees or other expenses that may be associated with certain investments. The indexes are unmanaged and an investor cannot invest directly in an index.
Asset allocation and diversification do not guarantee a profit or protect against a loss.
The information and statistical data contained herein have been obtained from sources that are believed to be reliable but in no way are guaranteed by Morgan stanley smith Barney as to accuracy or completeness.
Morgan stanley smith Barney does not render advice on tax and tax accounting matters to clients. This material was not intended or written to be used, and it cannot be used by any taxpayer, for the purpose of avoiding penalties that may be imposed on the taxpayer under u.s. federal laws. Morgan stanley Smith Barney and its representatives do not provide tax or legal advice. For the resolution of specific tax or legal questions, professional advice should be obtained from an attorney, accountant or tax advisor.
exchange-traded funds (“etfs”)An investment in an ETF involves risks similar to those of investing in a broadly based portfolio of equity securities traded on an exchange in the relevant securities market, such as market fluctuations caused by such factors as economic and political developments, changes in interest rates and perceived trends in stock prices. The investment return and principal value of ETF investments will fluctuate, so that an investor’s ETF shares, if or when sold, may be worth more or less than the original cost.

investments and services offered through Morgan stanley smith Barney llC. Member siPC.
© 2010 Morgan stanley smith Barney
NY C
S6232928 0
4/1
0
GP09-0
410
9P-N
12/0
9C
S24043 C
LF# 4
30
00