Embed Size (px)
Citation preview

The Future of Washington’s Forests and Forestry Industries:Practical applications of FIA data
April 4, 2007Bruce Lippke and Ara Erickson
Rural Technology InitiativeCollege of Forest Resources University of Washington
Today’s Presentation
• Future of Washington Forests and Forestry Industries study Background Key points
• Use of FIA data Forest land conversion Timber supply

Future of Washington’s Forests and Forestry
Industries
Competitive Position Study
Land Conversion Study and Cascade Foothills Forestry
Viability
Timber Supply Study
Economic Contribution Study
State Granted Lands Return on
Investment Study
Analyze the competitive position of
Washington’s forests products industry
Legislature Scope of Work
Update the 1992 Timber Supply Study
Evaluate the economic contribution of the
forest products industry
A
B
C
Assess the trends and dynamics that
commercial and residential
development play in the conversion of the state’s forests to non-
forestry uses
D
Recommend policy changes E
Assess the expected rate of return from
state granted lands F
Analyze and recommend policies
and programs to assist Cascade foothills area
landowners and communities in developing and implementing
innovative approaches to retaining traditional
forestry
G

Eastside Issues
1. Forest health
2. Increased fire risk
3. Declining timber harvest and
processing infrastructure

Mortality by MPB in ponderosa and lodgepole pine in eastern Washington from 1979-2004 (tallied 1980-2005)
0
500,000
1,000,000
1,500,000
2,000,000
2,500,000
3,000,000
3,500,000
4,000,000
4,500,000
1979 1984 1989 1994 1999 2004
Year
To
tal
Mo
rtal
ity
(# t
rees
)
0.0
2.0
4.0
6.0
8.0
10.0
12.0
Mo
rtal
ity/
acre
(T
rees
/Acr
e)
# Trees killed by MPB # Trees/acre killed by MPB
1979-1999 Mortality Rate = 2.2 TPA
Latest inventory
2000+ Mortality Rate 8.4 TPA

Impact on Fire Hazard of Thinning to BA 45Fire Ris k
0
100000
200000
300000
400000
500000
600000
700000
1995 2000 2005 2010 2015 2020 2025 2030 2035 2040 2045 2050
Ye ar
Acr
es
High Moderate Low
Westside Issues
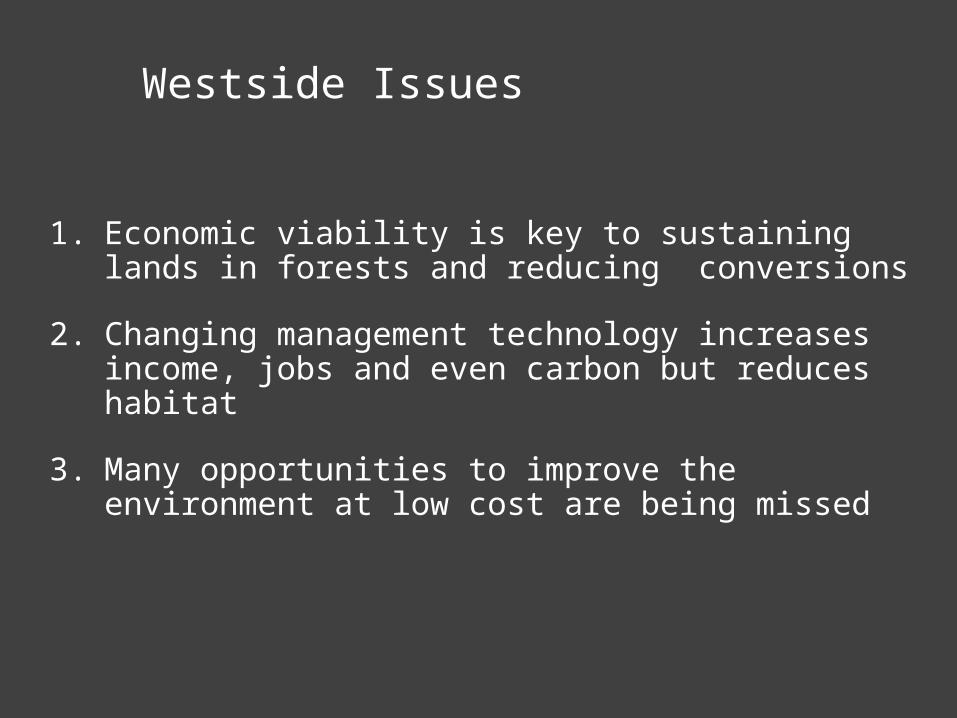
1. Economic viability is key to sustaining lands in forests and reducing conversions
2. Changing management technology increases income, jobs and even carbon but reduces habitat
3. Many opportunities to improve the environment at low cost are being missed

No Harvest: TPA-170, QMD-16.8
Plant & Harvest: TPA-358, QMD-9.7
Plant Veg Control & Harvest: TPA-346, QMD-11.0
Plant Thin & Harvest: TPA-168, QMD-12.1
BioPath Short: TPA OS-31, QMD OS-26
BioPath Long(retention):
TPA OS-14, QMD OS-29
Sample Westside Management Treatments
from No Harvest to BioPathways @100 years (medium site)

Buffer canopy cover @ 110yrsnever more than 17% open stands outside of stability zone

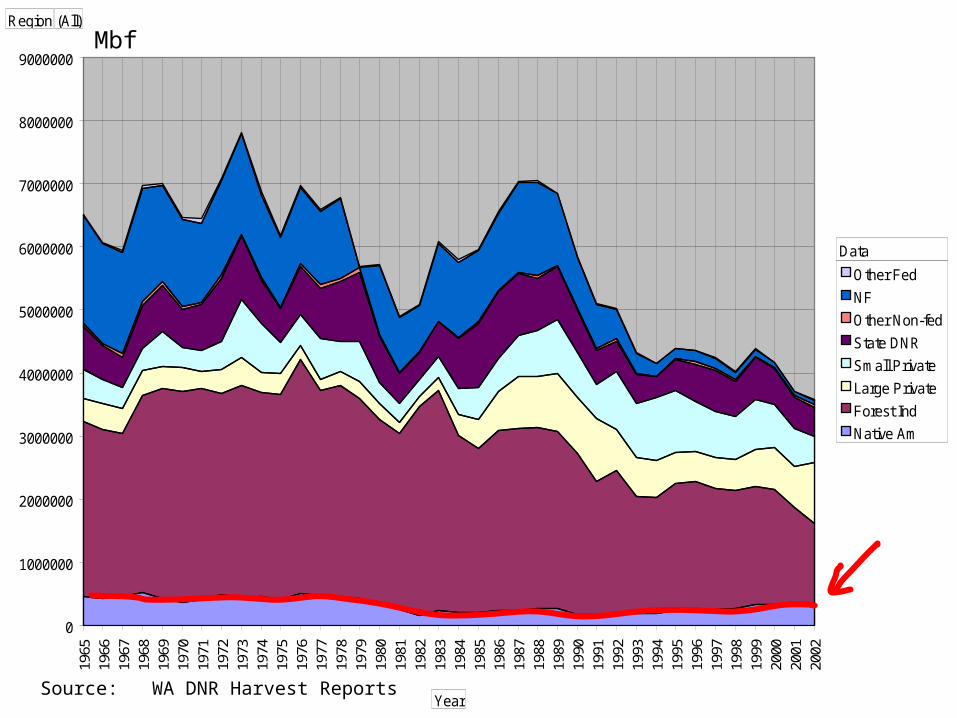
Washington’s Forest Sector Today
• During past 15 years the industry was forced to adjust to new harvest levels as result of federal changes, HCPs, ESA and other regulations.
• Primarily a commodity production business model
• Produces lumber and newsprint

0
1000000
2000000
3000000
4000000
5000000
6000000
7000000
8000000
9000000
1965
1966
1967
1968
1969
1970
1971
1972
1973
1974
1975
1976
1977
1978
1979
1980
1981
1982
1983
1984
1985
1986
1987
1988
1989
1990
1991
1992
1993
1994
1995
1996
1997
1998
1999
2000
2001
2002
Other Fed
NF
Other Non-fed
State DNR
Small Private
Large Private
Forest Ind
Native Am
Region (All)
Year
Data
Source: WA DNR Harvest Reports
Mbf


Effective Tax Rates on Private Timber RevenueGross Revenue from Timber: $10,080 (80 acres)Net Revenue: $8,568Revenue after State taxes: $7,959
After Tax Income Bracket Rate Revenue
• Less than $30,650: 21.0% $6,765
• Less than $74,200: 30.3% $5,969• Less than $154,800: 33.1% $5,730• Less than $336,550: 37.8% $5,332• More than $336,550: 39.6% $5,173
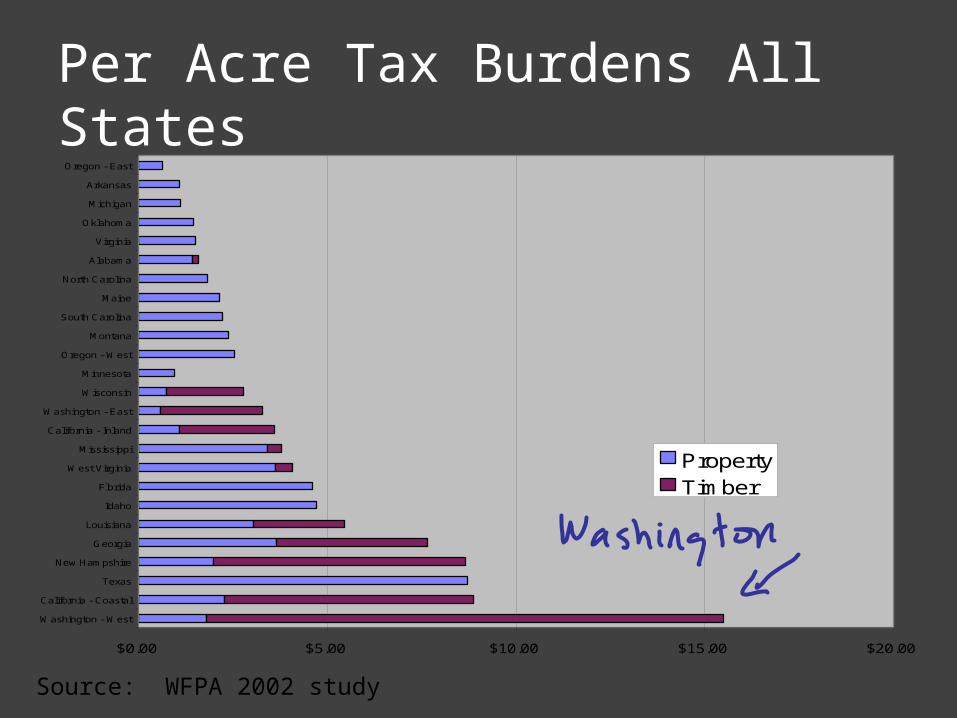
Per Acre Tax Burdens All States
Source: WFPA 2002 study
$0.00 $5.00 $10.00 $15.00 $20.00
Washington - West
California - Coastal
Texas
New Hampshire
Georgia
Louisiana
Idaho
Florida
West Virginia
Mississippi
California - Inland
Washington - East
Wisconsin
Minnesota
Oregon - West
Montana
South Carolina
Maine
North Carolina
Alabama
Virginia
Oklahoma
Michigan
Arkansas
Oregon - East
PropertyTimber
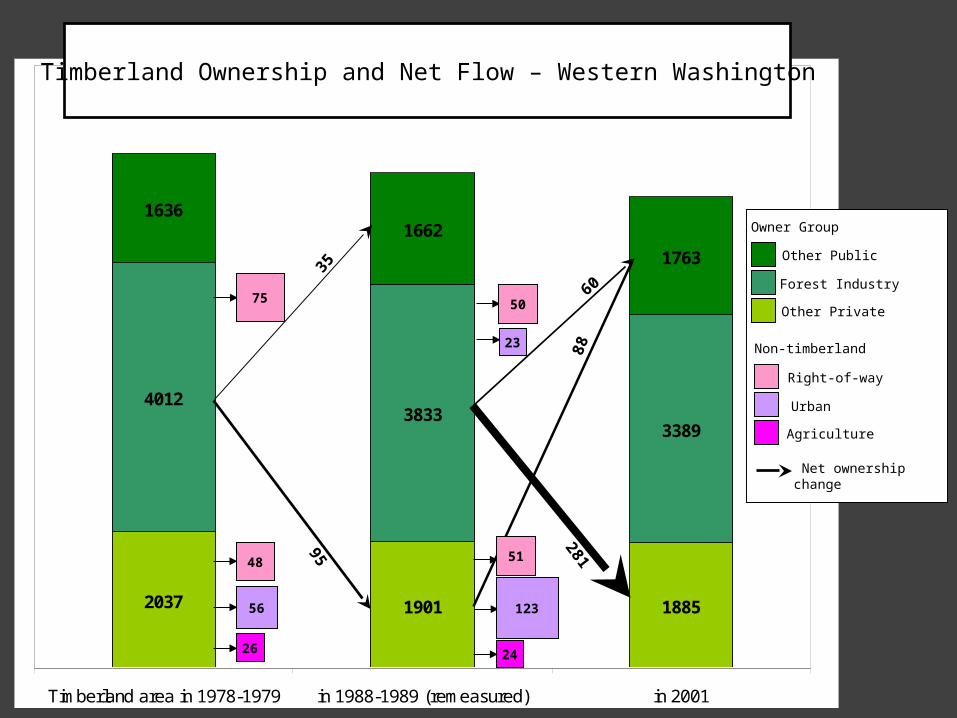
2037 1901 1885
40123833
3389
16361662
1763
Timberland area in 1978-1979 in 1988-1989 (remeasured) in 2001
35
95
60
281
88
Other Public
Forest Industry
Other Private
Owner Group
Net ownership change
Timberland Ownership and Net Flow – Western Washington
75
48
56
26
51
123
24
50
23 Non-timberland
Right-of-way
Urban
Agriculture

2037 1901 1885
40123833
3389
16361662
1763
Timberland area in 1978-1979 in 1988-1989 (remeasured) in 2001
35
95
60
281
88
3
5
52
75
7
48
56
26
In/Out of FIA Inventory
National Forest
Reserve
Other Public
Forest Industry
Other Private
Owner Group
Net ownership change
754
25
12
6
51
123
24
Timberland Ownership and Net Flow – Western Washington
(+78)
(-7)
(-119)
50
236
Non-timberland
Right-of-way
Urban
Agriculture
Christmas Tree Farm
17
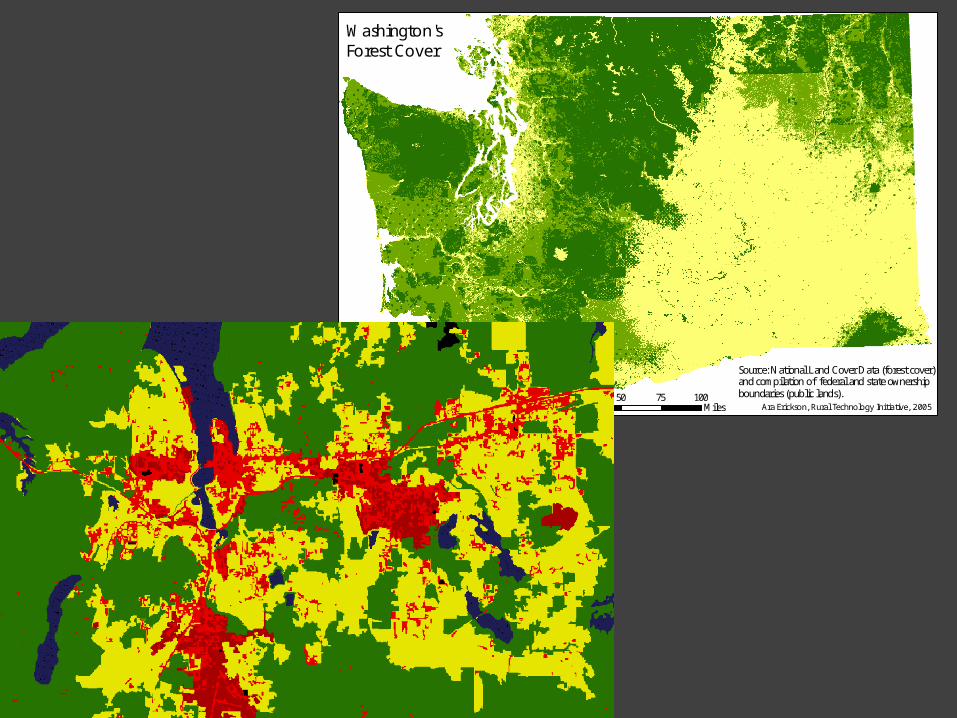
ÆPublic Forest Land
Private Forest Land
Source: National Land Cover Data (forest cover)and compilation of federal and state ownership boundaries (public lands).0 25 50 75 10012.5
Miles Ara Erickson, Rural Technology Initiative, 2005
Washington's Forest Cover

Timber Supply and FIA Inventory
• FIA points provide tree list measurements
• Challenges Location, density, privacy, time
• Solution Update current state from past
inventory and additional data

To start…
• Stratify FIA points• Sum acreage• Choose representative stand• Grow representative stand• Produce volume yield streams• Calculate available volumes


Measurement and Data Improvement Alternatives
• FIA ground survey plots are too sparse to provide information on sensitive areas.
• LiDAR and related systems could provide more accurate information on a timely basis at a competitive price.
• The information collected would be of value to a broader range of users to share costs.
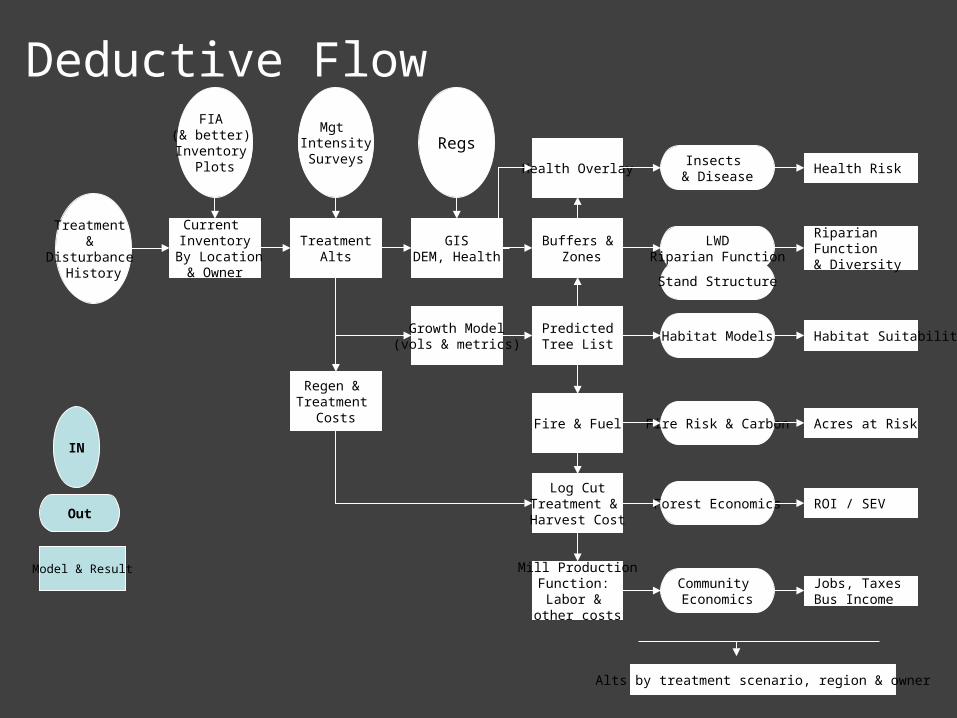
Deductive Flow
Stand Structure
Health OverlayInsects
& Disease
LWDRiparian Function
Habitat Models
Fire Risk & Carbon
Forest Economics
Community Economics
Regen & Treatment
Costs
Buffers & Zones
PredictedTree List
Fire & Fuel
Log CutTreatment & Harvest Cost
Mill ProductionFunction: Labor &
other costs
Jobs, TaxesBus Income
Growth Model(vols & metrics)
GISDEM, Health
TreatmentAlts
Current Inventory
By Location& Owner
Alts by treatment scenario, region & owner
RegsMgt
IntensitySurveys
FIA (& better) Inventory
Plots
Treatment &
Disturbance History
Acres at Risk
Habitat Suitability
Riparian Function& Diversity
ROI / SEV
Health Risk
Model & Result
Out
IN
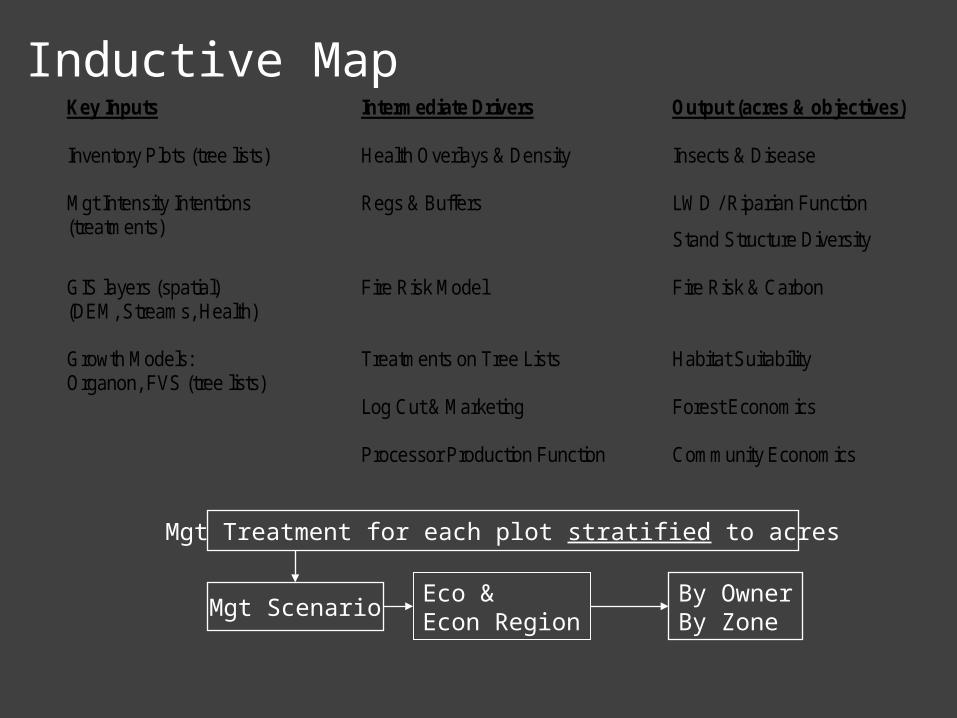
Mgt Treatment for each plot stratified to acres
Mgt ScenarioEco & Econ Region
By OwnerBy Zone
Key Inputs Intermediate Drivers Output (acres & objectives) Inventory Plots (tree lists) Health Overlays & Density Insects & Disease Mgt Intensity Intentions (treatments)
Regs & Buffers LWD / Riparian Function
Stand Structure Diversity GIS layers (spatial) (DEM, Streams, Health)
Fire Risk Model Fire Risk & Carbon
Growth Models: Organon, FVS (tree lists)
Treatments on Tree Lists Habitat Suitability
Log Cut & Marketing Forest Economics Processor Production Function Community Economics
Inductive Map
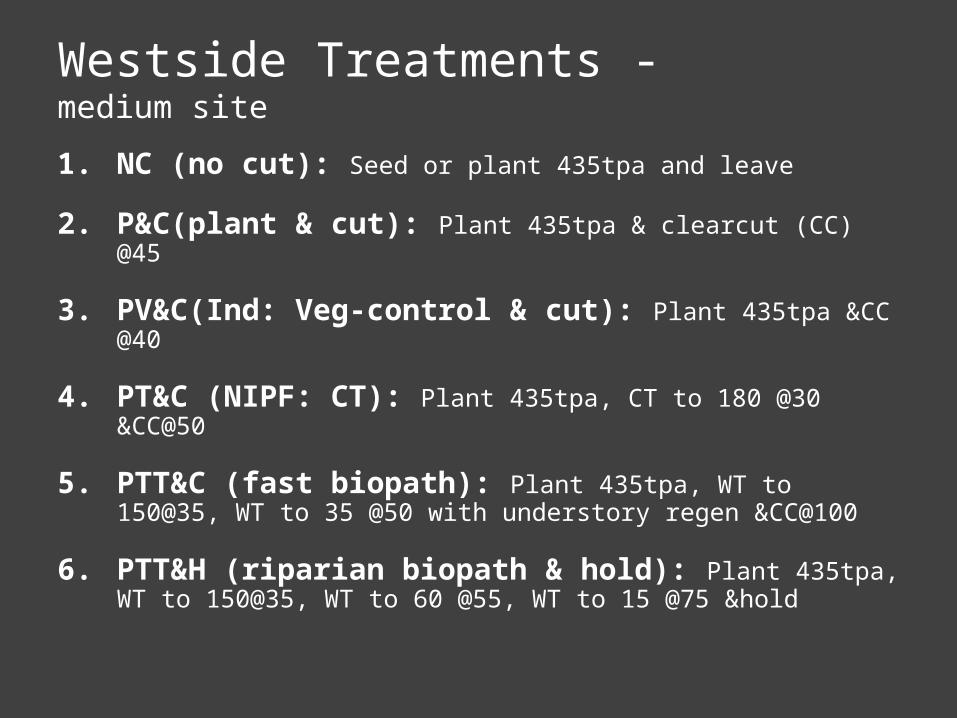
Westside Treatments - medium site
1. NC (no cut): Seed or plant 435tpa and leave
2. P&C(plant & cut): Plant 435tpa & clearcut (CC) @45
3. PV&C(Ind: Veg-control & cut): Plant 435tpa &CC @40
4. PT&C (NIPF: CT): Plant 435tpa, CT to 180 @30 &CC@50
5. PTT&C (fast biopath): Plant 435tpa, WT to 150@35, WT to 35 @50 with understory regen &CC@100
6. PTT&H (riparian biopath & hold): Plant 435tpa, WT to 150@35, WT to 60 @55, WT to 15 @75 &hold

NA: TPA-170, QMD-16.8
PC: TPA-358, QMD-9.7
PVC: TPA-346, QMD-11.0
PTC: TPA-168, QMD-12.1
PTTC: TPA All-262, TPA OS-31, QMD All-13.4, QMD OS-25.8
PTTH: TPA All-110, TPA OS-14, QMD All-12.9 QMD OS-29.1

SEV by Management Scenario for Douglas-fir Moderate Site
-$739.25
$1,015
$1,996
$887
$502 $477
-$1,000.00
-$500.00
$0.00
$500.00
$1,000.00
$1,500.00
$2,000.00
$2,500.00
No Harvest Plant &Harvest
Plant, VC,Harvest
Plant, CT,Harvest
Shortbio LongBio
Management Scenario
SE
V (
$/ac
)
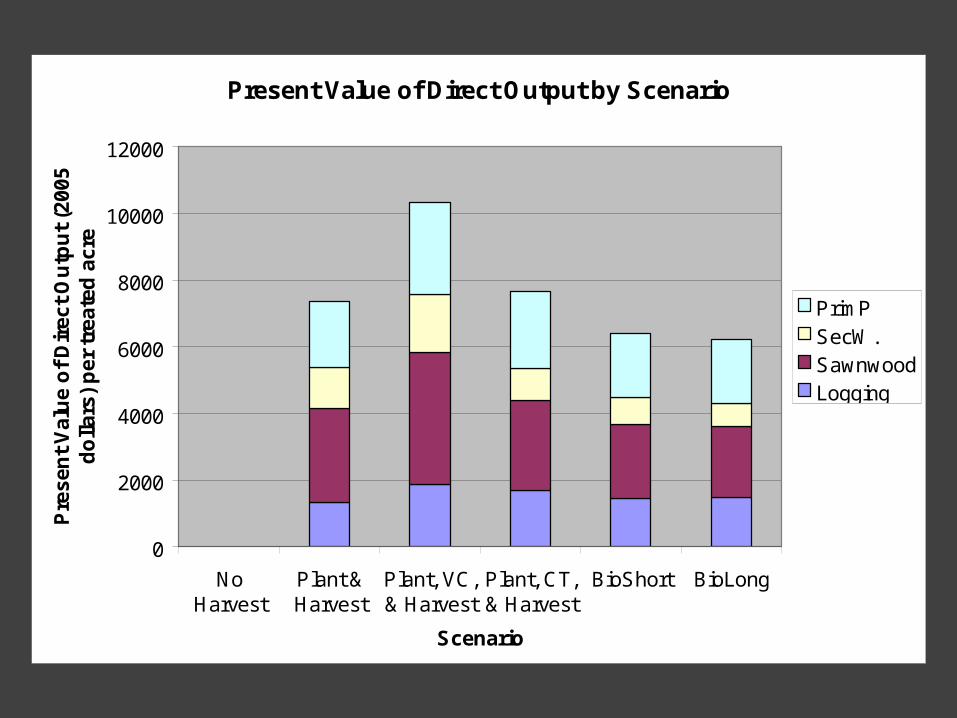
Present Value of Direct Output by Scenario
0
2000
4000
6000
8000
10000
12000
NoHarvest
Plant &Harvest
Plant, VC,& Harvest
Plant, CT,& Harvest
BioShort BioLong
Scenario
Pre
sen
t V
alu
e o
f D
ire
ct O
utp
ut
(200
5
do
llars
) p
er t
reat
ed
ac
re
PrimP SecW.SawnwoodLogging
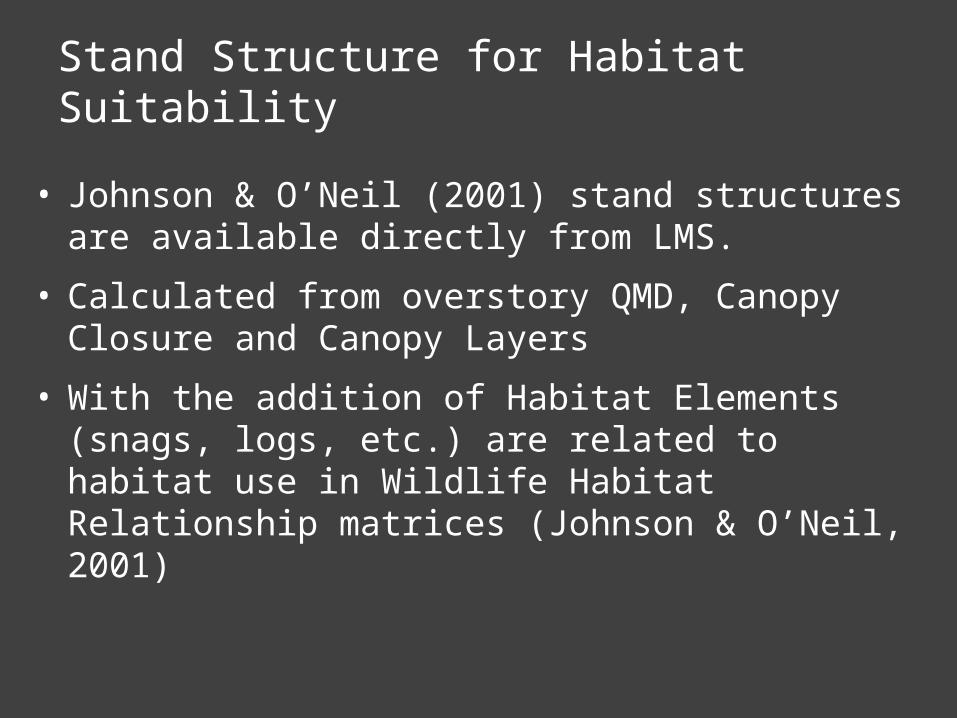
Stand Structure for Habitat Suitability
• Johnson & O’Neil (2001) stand structures are available directly from LMS.
• Calculated from overstory QMD, Canopy Closure and Canopy Layers
• With the addition of Habitat Elements (snags, logs, etc.) are related to habitat use in Wildlife Habitat Relationship matrices (Johnson & O’Neil, 2001)

Stand Structures for “Traditional” Treatments
J ohnson & Oneil Structural Stage Classes J ohnson & Oneil Structural Stage ClassesGrass-Forb SI Small-Multi-Closed SESeedling-Single-Open SI Medium-Single-Closed SESeedling-Single-Moderate SI Medium-Multi-Moderate SESeedling-Multi-Open SI Medium-Multi-Closed SESeedling-Multi-Moderate SI Large-Single-Closed SESapling-Pole-Single-Open SI Large-Multi-Closed SESapling-Pole-Multi-Open SI Medium-Single-Open URSapling-Pole-Multi-Moderate SI Medium-Single-Moderate URSmall-Single-Open SI Medium-Multi-Open URSmall-Multi-Open SI Large-Single-Open URSeedling-Single-Closed SE Large-Single-Moderate URSeedling-Multi-Closed SE Large-Multi-Open URSapling-Pole-Single-Moderate SE Large-Milti-Moderate URSapling-Pole-Single-Closed SE Giant-Single-Open URSapling-Pole-Multi-Closed SE Giant-Single-Moderate OGSmall-Single-Moderate SE Giant-Single-Closed OGSmall-Single-Closed SE Giant-Multi-Open OGSmall-Multi-Moderate SE Giant-Multi-Moderate OG
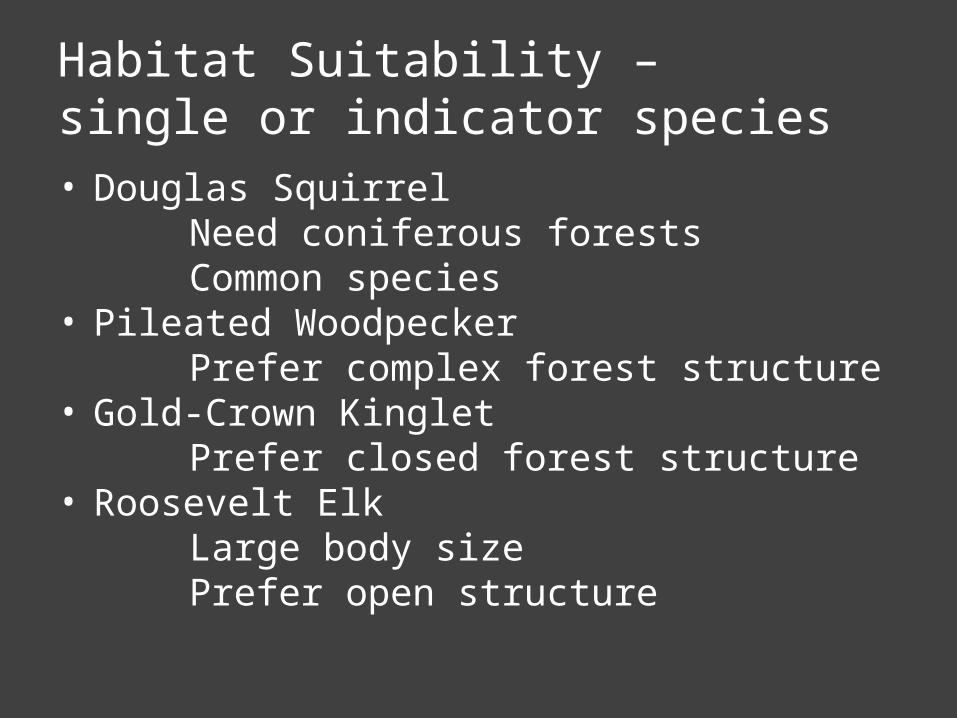
Habitat Suitability –single or indicator species• Douglas Squirrel
Need coniferous forestsCommon species
• Pileated WoodpeckerPrefer complex forest structure
• Gold-Crown KingletPrefer closed forest structure
• Roosevelt ElkLarge body sizePrefer open structure

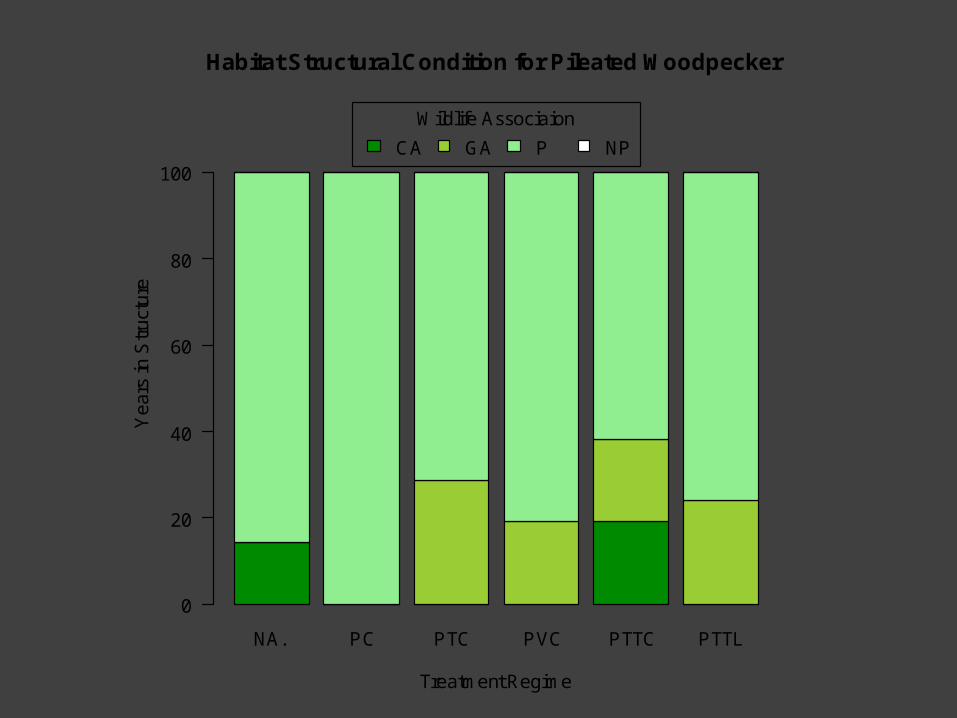
NP: Not Present –
Species does not occur
P: Present –
Occasional use
GA: Generally Associated –
Supportive role for viability
CA: Closely Associated – Essential needs
Legend

NA. PC PTC PVC PTTC PTTL
Habitat Structural Condition for Douglas' Squirrel
Treatment Regime
Ye
ars
in S
tru
ctu
re
0
20
40
60
80
100
Wildlife Associaion
CA GA P NP
NA. PC PTC PVC PTTC PTTL
Habitat Structural Condition for Pileated Woodpecker
Treatment Regime
Ye
ars
in S
tru
ctu
re
0
20
40
60
80
100
Wildlife Associaion
CA GA P NP

NA. PC PTC PVC PTTC PTTL
Habitat Structural Condition for Golden-Crowned Kinglet
Treatment Regime
Ye
ars
in S
tru
ctu
re
0
20
40
60
80
100
Wildlife Associaion
CA GA P NP

NA. PC PTC PVC PTTC PTTL
Habitat Structural Condition for Roosevelt Elk
Treatment Regime
Ye
ars
in S
tru
ctu
re
0
20
40
60
80
100
Wildlife Associaion
CA GA P NP

NA PC PTC PVC PTTC PTTL
Pileated Woodpecker 14.3 0.0 28.6 19.0 38.1 23.8
Douglas' Squirrel 71.4 33.3 38.1 19.0 66.7 71.4
Golden-Crown Kinglet 85.7 61.9 57.1 57.1 76.2 81.0
Roosevelt Elk 100 100 100 100 100 100
Percentages of suitable habitat conditions within 100 year time horizon for 4 wildlife species under different management regimes

TPA and QMD for Trees > 6" DBH
0
5
10
15
20
25
30
35
40
0 100 200 300 400 500 600 700 800
TPA
QM
D
Young
Old
Nest

Percent Time in DFC Target by Scenario
0%
5%
10%
15%
20%
25%
30%
35%
40%
45%
NoHarvest
Plant &Harvest
Plant, VC,& Harvest
Plant, CT,& Harvest
BioShort BioLong
Scenario
Pe
rce
nt
Tim
e in
DF
C T
arg
et

Forest, Product, Emissions, Displacement & Substitution Carbon by Component
-100
0
100
200
300
400
500
600
700
800
Year
Met
ric
Tons
Per
Hec
tare
Stem Root Crown Litter Dead Chips Lumber HarvEmis ManufEmis Displacement Substitution
Forestwith Products
with Substitution
Forest Carbon by Component
-100
0
100
200
300
400
500
600
700
800
Year
Metr
ic T
on
s P
er
Hecta
re
Stem Root Crown Litter Snags
Carbon Pools in: Forest, products & energy displacement, & fossil intensive substitutes
Carbon pools in unharvested forest, for stem, roots, crown, litter, and dead wood
CORRIM
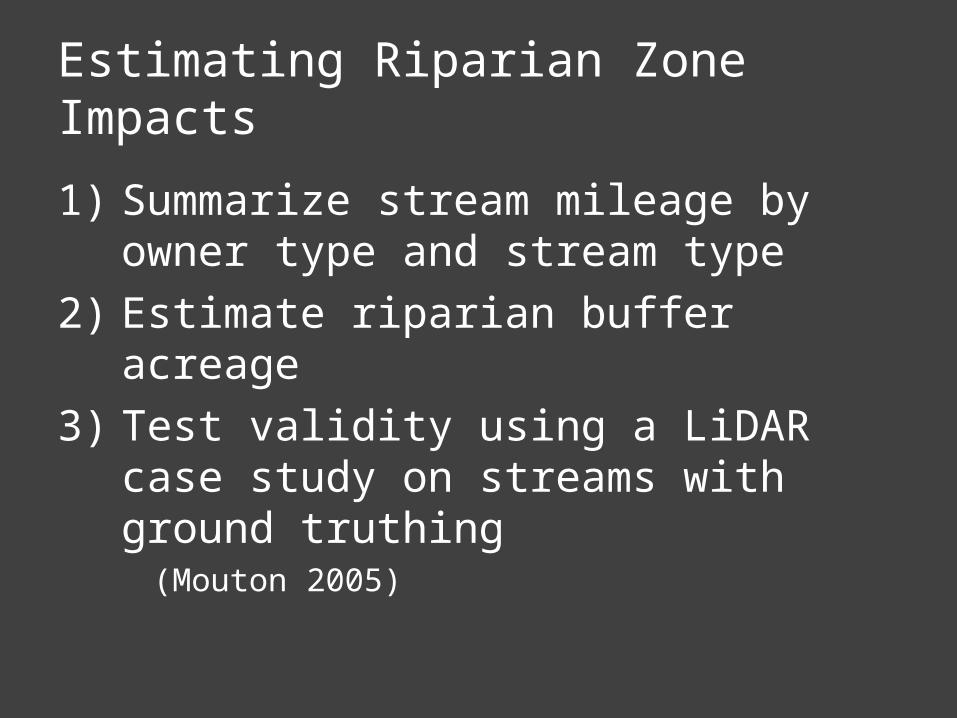
Estimating Riparian Zone Impacts
1) Summarize stream mileage by owner type and stream type
2) Estimate riparian buffer acreage3) Test validity using a LiDAR case
study on streams with ground truthing
(Mouton 2005)

142-ha of buffers142-ha of buffers
21% of Study Area21% of Study Area
324-ha of buffers324-ha of buffers
41% of Study Area41% of Study Area
DNR Hydro Layer vs. LiDAR DEMDNR Hydro Layer vs. LiDAR DEM
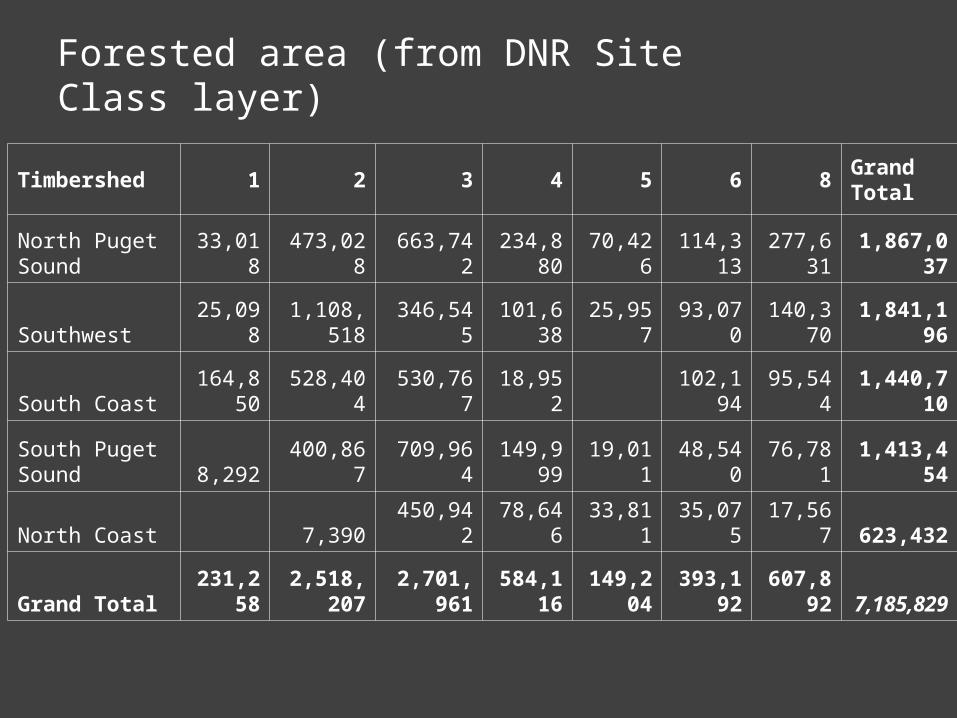
Forested area (from DNR Site Class layer)
Timbershed 1 2 3 4 5 6 8Grand Total
North Puget Sound 33,018 473,028 663,742 234,880 70,426 114,313 277,631 1,867,037
Southwest 25,098 1,108,518 346,545 101,638 25,957 93,070 140,370 1,841,196
South Coast 164,850 528,404 530,767 18,952 102,194 95,544 1,440,710
South Puget Sound 8,292 400,867 709,964 149,999 19,011 48,540 76,781 1,413,454
North Coast 7,390 450,942 78,646 33,811 35,075 17,567 623,432
Grand Total 231,258 2,518,207 2,701,961 584,116 149,204 393,192 607,892 7,185,829

Stream Mileage
Timbershed S F N Grand Total
Southwest 1,764 3,692 11,061 16,517
South Coast 1,091 4,351 8,815 14,257
North Puget Sound 1,606 3,475 4,671 9,752
South Puget Sound 818 2,525 3,128 6,471
North Coast 434 1,707 2,650 4,792
Grand Total 5,714 15,751 30,325 51, 789
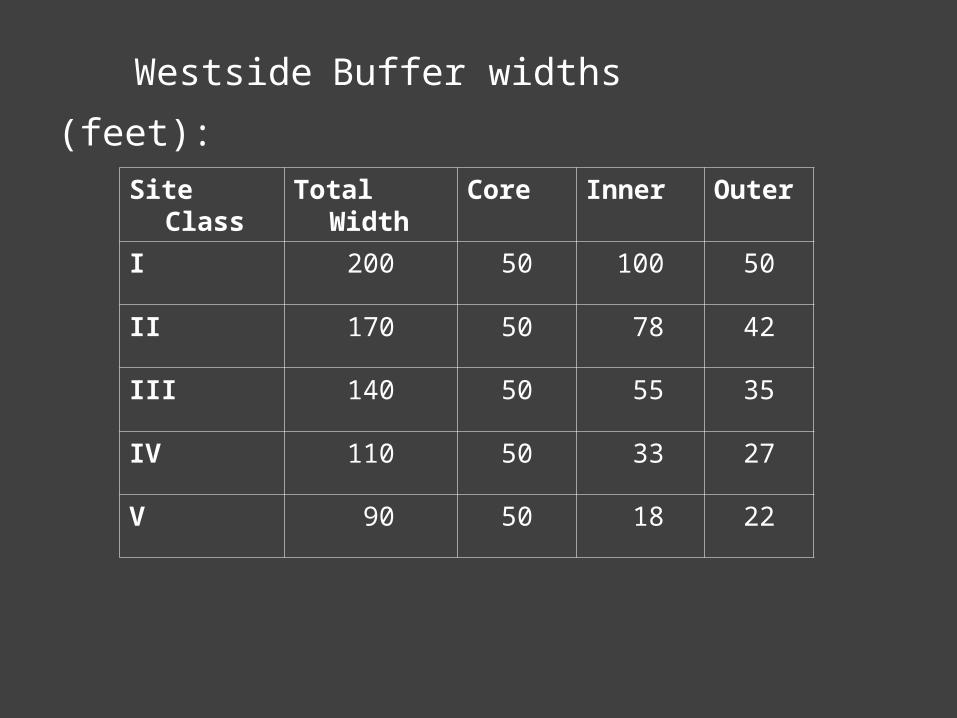
Westside Buffer widths (feet):
Site Class Total Width Core Inner Outer
I 200 50 100 50
II 170 50 78 42
III 140 50 55 35
IV 110 50 33 27
V 90 50 18 22

Buffers as a percent of timberland on a county basis
3.00.50.50.91.1Island
3.40.40.60.91.4San Juan
6.91.61.12.22.0Pierce
7.11.31.12.32.4Thurston
7.11.41.22.22.3Whatcom
7.12.21.21.91.9Skamania
7.40.91.52.52.5Kitsap
7.70.91.32.82.6Snohomish
8.31.91.32.72.3Skagit
8.41.61.53.02.4King
9.31.11.83.43.1Mason
9.91.61.63.82.9Clark
10.72.41.93.03.4Jefferson
11.92.12.33.53.9Clallam
12.13.81.53.82.9Cowlitz
12.13.71.63.73.1Lewis
14.52.72.55.04.3Grays Harbor
15.24.22.25.13.6Wahkiakum
16.65.02.55.14.1Pacific
Grand TotalNOUTERINNERCORECounty
3.00.50.50.91.1Island
3.40.40.60.91.4San Juan
6.91.61.12.22.0Pierce
7.11.31.12.32.4Thurston
7.11.41.22.22.3Whatcom
7.12.21.21.91.9Skamania
7.40.91.52.52.5Kitsap
7.70.91.32.82.6Snohomish
8.31.91.32.72.3Skagit
8.41.61.53.02.4King
9.31.11.83.43.1Mason
9.91.61.63.82.9Clark
10.72.41.93.03.4Jefferson
11.92.12.33.53.9Clallam
12.13.81.53.82.9Cowlitz
12.13.71.63.73.1Lewis
14.52.72.55.04.3Grays Harbor
15.24.22.25.13.6Wahkiakum
16.65.02.55.14.1Pacific
Grand TotalNINNERCORECounty

Buffer area as a percent of forested area: total for westside private
CORE INNER OUTER
N Total
3.0% 3.4% 1.7% 2.4% 10.5%

Buffer Acreage
10.5% of total area
Timbershed CORE INNER OUTER N Grand Total
South Coast 60,583 72,444 36,103 49,976 219,106
Southwest 55,074 69,137 29,861 62,994 217,066
North Puget Sound 42,884 46,754 23,304 24,606 137,549
South Puget Sound 34,771 36,161 19,016 17,930 107,877
North Coast 23,297 20,452 13,343 13,963 71,055
Grand Total 216,609 244,948 121,626 169,469 752,652

Estimated Economic Impact: Lewis County Case Study
• Age class distribution is nearly uniform – cut & thin on 50 yr rotation
• Harvest 30 mbf/acre @ $396 net, thin 10 mbf @ $313• Estimate lost harvest revenue in buffers not
including leave tree requirement• Not including road or planning costs or impact of
more fragmented access• Compute for NIPF and Industry lands on F and Np
streams• Buffer acres derived from GIS and Hydrological
models in ArcGIS on 10 meter DEM for PIPs

Western Washington Industrial Management Intensity Forecast Comparison 1990-2006
0%
10%
20%
30%
40%
50%
60%
70%
80%
90%
100%
Natl Regen Plant Herb Fert Gen all PCT all CT PCT/CT No Mgmt
Treatment
Per
cen
t
1990 Forecast 2006 Forecast

Average Annual Available Timber Volumes: Industry Forests Historic Harvest Volumes (5-Yr) and Projected Inventory (10-Yr)
0
1,000
2,000
3,000
4,000
5,000
6,000
1965-1968
1969-1973
1974-1978
1979-1983
1984-1988
1989-1993
1994-1999
1999-2003
2004-2013
2014-2023
2024-2033
2034-2043
2044-2053
2054-2063
Harvest Interval
Mil
lio
n B
oar
d F
eet Historic Projected
Sources: DNR Timber Harvest Report 2002, FIA age-class data, UW/WFPA Management intensities Survey, Chambers 1980 DNR RPT 41.

Average Annual Available Timber Volumes: Industry Forests Historic Harvest Volumes (5-Yr) and Projected Inventory (10-Yr)
w&wo Industry Conversions
0
1,000
2,000
3,000
4,000
5,000
6,000
1965-1968
1969-1973
1974-1978
1979-1983
1984-1988
1989-1993
1994-1999
1999-2003
2004-2013
2014-2023
2024-2033
2034-2043
2044-2053
2054-2063
Harvest Interval
Mil
lio
n B
oar
d F
eet
Industry Ind w/Conversion
Source: Gray et al. 2005. PNW-RB-246
Historic Projected

Identified Issues from Assessment
• NW Environmental Forum developed recommendations for DNR
• www.nwenvironmentalforum.org• www.ruraltech.org/projects/fwf
Study overview Progress reports Streaming videos of presentations


![KERANGAS [(Tropical) Heath Forests, (tropische) Heidewälder]](https://img.pdfslide.tips/doc/110x75/55204d7d49795902118cd32e/kerangas-tropical-heath-forests-tropische-heidewaelder.jpg)