Embed Size (px)
Citation preview
The GEMS Project, Geological Mapping of Sensitive Environments in Yemen, Tunisia, Lebanon, and France.
An interim report illustrated on the French tidal flats.
Jean-Paul Deroin(1), Jean Chorowicz(2), Mohamad Khawlie(3), Chadi Abdallah(3), Ismail Al-Ganad(4), Paul Benoit(5), Rania Bou Kheir(3), Benoît Deffontaines (1), Damien Dhont(6), Jürgen Heckes (7), Noamen Rebai(8), Florian Tereygeol(9)
(1) Université Paris -Est, 5 boulevard Descartes 77454 Marne la Vallée cedex France, [email protected]
(2) Université Pierre et Marie Curie, Paris, France. (3) National Center for Remote Sensing, Beirut, Lebanon
(4) Yemen Geological Survey and Mineral Resources Board, Sana’a, Yemen (5) Université Paris 1-Sorbonne, Paris, France
(6) Université de Pau et des Pays de l’Adour, Pau, France (7) Deutsches Bergbau-Museum, Bochum, Germany
(8) ENIT, Tunis, Tunisia (9) CNRS, CEA, Saclay, France
Abstract After the launch of ALOS in January 2006, the first data acquired in the frame of the GEMS Project, pilot project of ALOS Data European Node (ADEN) have been delivered in mid-2007 only. Mainly ALOS PALSAR data are concerned. Some optical data are more difficult to obtain, particularly with the optical sensors AVNIR-2 and PRISM onboard ALOS. SAR data from the ESA’s sensors ASAR and ERS have been also ordered and received. The scientific teams are working on each site. Some theses are in progress. In 2006 and 2007, Lebanon and Yemen test sites have been difficult to investigate in the field due to internal difficulties. Two sites have been preferentially studied during the first months of the project, namely the French tidal flats and the rocky desert of Yemen. Tunisia and Lebanon test sites are expected to be revisited in 2008. Keywords: ALOS, Radar, Optical, Global Change, Geological Mapping, Natural Hazards, Geoarcheology, Tidal Flats.
1. INTRODUCTION The main objective of the GEMS Project ‘Geological Mapping of Sensitive Environments’ is to assess ALOS data from PALSAR, PRISM, and AVNIR-2 sensors in combination with other sets of archive data, for a better understanding of the geomorphological and geological setting of sites, which are environmentally sensitive. The selected areas correspond to key sectors for the scientific teams involved in the GEMS Project. The main issues deal with geological hazards (Lebanon, Tunisia), coastal erosion and sedimentation (France), mining activity (Yemen, Tunisia) and more generally land monitoring (all sites concerned).
Our sites are covered by a great variety of data. Landsat MSS, TM, ETM+, and SRTM have been systematically used and are not indicated in Table I. Field data are already available and new missions are dedicated to updating, especially for the Tunisian and French test sites, which are strongly mobile environments.
Table 1. Data used for each site. Data acquired Other data Remarks
YEMEN 1 PSR, 1 ASAR, 1 AVNIR-2
1 Quick-Bird 1 SPOT 5 1. SIR-C/X-SAR
TUNISIA - 4 ASTER 2 SIR-C/X-SAR
No PALSAR available
LEBANON - 1 Ikonos No PRISM available
FRANCE Veys 1 ASAR, 1 ERS2
FRANCE MSM - 4 SPOT 1 JERS-OPS
No PALSAR available. AVNIR-2 ordered
2. GENERAL OVERVIEW OF THE PROJECT 2.1. The Yemen test site During the pre-Islamic period and until the 9th century AC, the Jabali area was mined for silver. In the early 1980’s, the site was rediscovered by the French Geological Survey (BRGM) using also data from the archaeologists . From 2004 onwards, archaeological and geological investigations have been carried out [1]. The
last mission has been done in March 2006, including archaeological field investigations (topography, mapping of archaeological remains, slags and ceramics sampling, etc.), geomorphological and geological mapping and sampling, and field geophysics (magnetometry), supported by GPS measurements and satellite imagery as well. As the site is characterized by a tabular morphology and a large number of roughness ‘reg’ types, the rocky desert, the place is particularly suitable for experimenting radar remote sensing. Details of the research in progress are given in Deroin, Al-Ganad and Al-Thari, this symposium. Using Jabali as a test area, we have evaluated different types of remote sensing data [2]. At a large-scale, remote sensing data have been used for drawing new geological maps of the area. Landsat ETM+, Landsat TM, ASTER and Spot panchromatic and supermode data have been widely interpreted for distinguishing lithologies either in the Proterozoic substrate or in the sedimentary cover, mainly Jurassic to Cretaceous in age. Cenozoic events are represented by two phases of volcanism, first at about 30Ma, constituting large traps in the Sana’a region, second during the Quaternary, forming basaltic volcanoes aligned along faults linked with the opening of the Red Sea and the Afar tectonics. These two magmatic phases expose different types of rocks, the spectral characteristics of which could be studied with multispectral imagery. Recent deposits are also identified such as deflation reg, alluvial deposits, colluvions, sand dunes, etc. The mineralization of Jabali is put in light when using ETM+ band No.3, i.e., the red range of the electromagnetic spectrum. This is clearly explained by the alteration halo of iron oxides concentrated around the deposit and linked with (de)dolomitization phenomena. A very useful image is that obtained by Quick-Bird with 0.67m ground pixel size. Dolomites can be easily identified by their spectral response and their texture as well. Except the methodological radar investigation using PALSAR data, ALOS optical data will also be analyzed in order to evaluate the potential of the multispectral (AVNIR-2) and stereoscopic (PRISM) imagery compared to that of multispectral and high spatial resolution imageries. Particularly, the interest of the high resolution (10m) in multispectral imagery has to be confronted to the very high resolution of Quick-Bird data (0.67m) and other classical data such as Spot panchromatic (10m), ASTER (15m), and Landsat ETM+/TM (15m/panchromatic and 30m/multispectral).
2.2. The Tunisia test site The Zone of Chotts, region of the Presaharian Tunisia, has been selected. As early as 1994, the Chott El Fedjaj, the easternmost chott of Tunisia, was chosen as key area within the “Sahara supersite” of G.G.Schaber, principal investigator for the SIR-C/X-SAR mission. Then, the
simultaneously acquired L (1.25 GHz), C (5.3 GHz) and X (9.6 GHz) have been explored. The relatively low incident angle of the main datatake (24°) revealed to be particularly suitable for studying the flat areas of the chotts. for carrying out both radar remote sensing investigations and in situ measurements and modelling of the land surface parameters, namely the roughness and the dielectric properties of the soil and rock surfaces [3]. Geomorphological and geological aspects (type of fold, link between large-scale structures and the chotts, etc.) are also deeply studied to better understand the evolution of those very fragile environments (hydrological aspects, phosphate mining, etc.). A chronicle of a dozen of ASTER data acquired in 2003 is also used for the mapping of that area, the evolution of which is seasonaly dependent. 2.3. The Lebanon test site Recent studies on climatic changes in the Mediterranean region show a tendency to increasing aridity, which in turn speeds up surficial processes such as water erosion and mass movements. They are responsible for important environmental casualties, including cultivation, degradation of urban areas, shortage in water and desertification. Mass movements in the Mediterranean countries are responsible each year for important casualties and economic losses. Lebanon is one of these typical Mediterranean countries that are characterized by low rain fall amounts but of irregular and high intensity. Moreover, our test site shows scarce vegetation cover, sedimentary rocks mainly carbonates and marls, and significant active uplifting and sismicity. Water soil erosion and mass movements are severe issues that affect the country’s economy. For instance, mass movements have caused 8 to 12 millions euros losses each year [4]. However, until now the studies are scarce and there is no precise evaluation of the magnitude of these processes. It is then important to map, follow-up and predict the evolution of a situation that is considered alarming. Lebanon is a good example for developing a methodological research concerning the mapping of natural hazards in the perspective of sustainable development, and survey of the natural and human environments [5]. The main objective of the assessment of ALOS data for this issue is to evaluate PRISM data for fine digital elevation model generation. We expect to compare the result with very high spatial resolution imagery provided by Ikonos. Unfortunately, right now (end October 2007) no PRISM data are usable on the test site selected in the Mount Lebanon (Akkoura earth flow). Moreover, the unexpected state of war did not permit us to carry out the field mission planned in July 2006. A new field mission has to be planned in 2008. The GPS network set up by one of us (Dr C.Abdallah) has strongly suffered, particularly when installations and nearby under investigation was concerned by bombing… 2.4. The French test site The French test site corresponds to the Normandy coastal
area and particularly to two large tidal flats, the famous Baie du Mont Saint-Michel and the smaller Baie des Veys. The mapping of the intertidal domain has recently been taken into account by the French Geological Survey. Sediments of the megatidal prism and meandering channels are the most important features to be mapped [6, 7]. They suffer a considerable change in time and space. In France, the geological mapping of the Baie du Mont Saint-Michel [6] represented the first achievement of a new sedimentological chart, including more than 30 classes. The lithological units have been correlated on long distance using remote-sensing data, especially SPOT and JERS-OPS ones [8]. Detailed topographic studies are also in progress [9]. ALOS data are expected to contribute to the mapping of the tidal flats, the interest of those data deeply depending from the day and time of acquisition, stronger the ebb tide, larger the tidal flat. The Baie des Veys is particularly sensitive to pollution caused by millions of tons of oil and waste dumped into English Channel waters, each year comparable to what would have come from a catastrophic oil spill! In spite of the global sea level rising, it has been also the last West European place for creating polders in the early 1970’s. The mapping of this bay, between the famous Landing areas of Utah Beach to the West and Omaha Beach to the East, reveals the close link between sedimentology of the tidal flat and the human activity, particularly the oister and mussel farming. This activity traps the finer elements
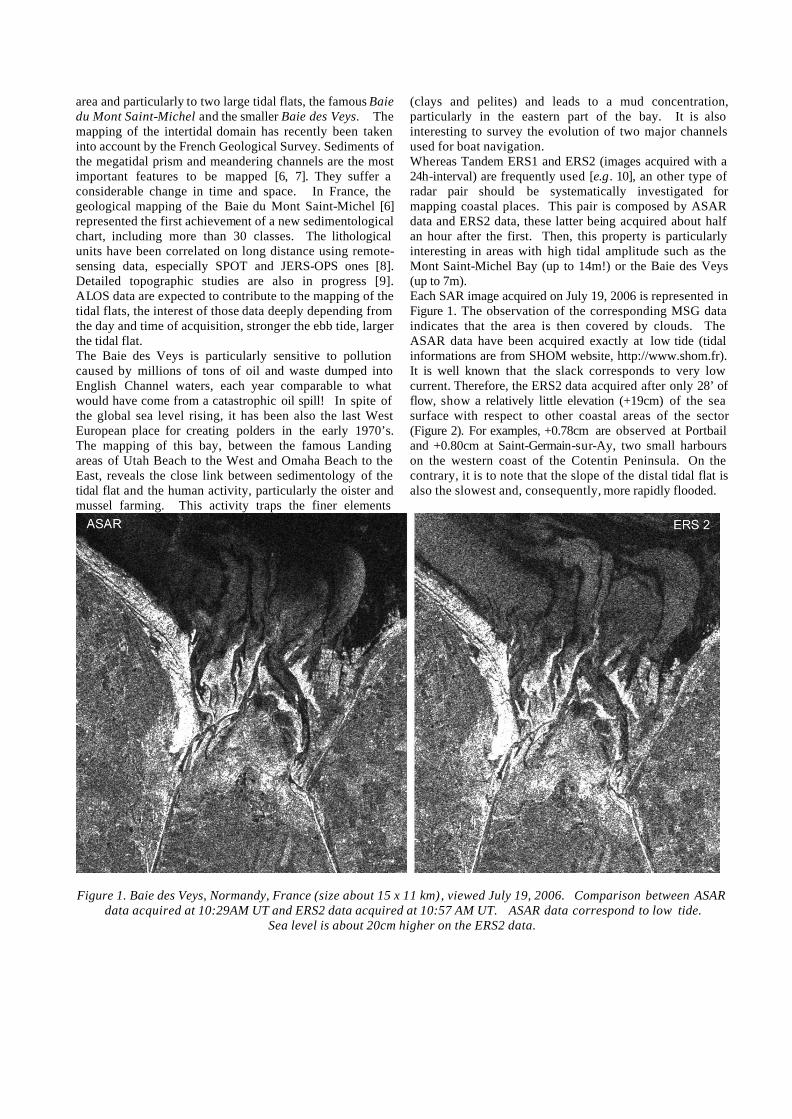
(clays and pelites) and leads to a mud concentration, particularly in the eastern part of the bay. It is also interesting to survey the evolution of two major channels used for boat navigation. Whereas Tandem ERS1 and ERS2 (images acquired with a 24h-interval) are frequently used [e.g. 10], an other type of radar pair should be systematically investigated for mapping coastal places. This pair is composed by ASAR data and ERS2 data, these latter being acquired about half an hour after the first. Then, this property is particularly interesting in areas with high tidal amplitude such as the Mont Saint-Michel Bay (up to 14m!) or the Baie des Veys (up to 7m). Each SAR image acquired on July 19, 2006 is represented in Figure 1. The observation of the corresponding MSG data indicates that the area is then covered by clouds. The ASAR data have been acquired exactly at low tide (tidal informations are from SHOM website, http://www.shom.fr). It is well known that the slack corresponds to very low current. Therefore, the ERS2 data acquired after only 28’ of flow, show a relatively little elevation (+19cm) of the sea surface with respect to other coastal areas of the sector (Figure 2). For examples, +0.78cm are observed at Portbail and +0.80cm at Saint-Germain-sur-Ay, two small harbours on the western coast of the Cotentin Peninsula. On the contrary, it is to note that the slope of the distal tidal flat is also the slowest and, consequently, more rapidly flooded.
Figure 1. Baie des Veys, Normandy, France (size about 15 x 11 km), viewed July 19, 2006. Comparison between ASAR
data acquired at 10:29AM UT and ERS2 data acquired at 10:57 AM UT. ASAR data correspond to low tide. Sea level is about 20cm higher on the ERS2 data.
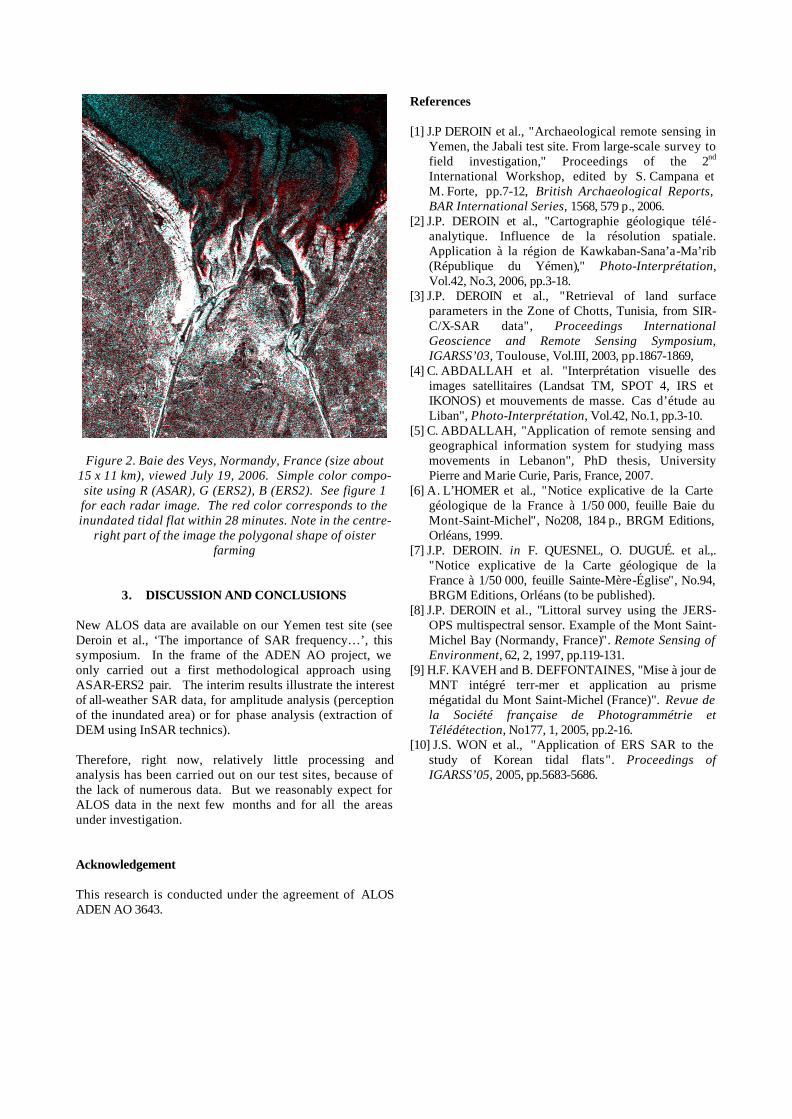
Figure 2. Baie des Veys, Normandy, France (size about 15 x 11 km), viewed July 19, 2006. Simple color compo-site using R (ASAR), G (ERS2), B (ERS2). See figure 1 for each radar image. The red color corresponds to the inundated tidal flat within 28 minutes. Note in the centre-
right part of the image the polygonal shape of oister farming
3. DISCUSSION AND CONCLUSIONS New ALOS data are available on our Yemen test site (see Deroin et al., ‘The importance of SAR frequency…’, this symposium. In the frame of the ADEN AO project, we only carried out a first methodological approach using ASAR-ERS2 pair. The interim results illustrate the interest of all-weather SAR data, for amplitude analysis (perception of the inundated area) or for phase analysis (extraction of DEM using InSAR technics). Therefore, right now, relatively little processing and analysis has been carried out on our test sites, because of the lack of numerous data. But we reasonably expect for ALOS data in the next few months and for all the areas under investigation. Acknowledgement This research is conducted under the agreement of ALOS ADEN AO 3643.
References [1] J.P DEROIN et al., "Archaeological remote sensing in
Yemen, the Jabali test site. From large-scale survey to field investigation," Proceedings of the 2nd International Workshop, edited by S. Campana et M. Forte, pp.7-12, British Archaeological Reports, BAR International Series, 1568, 579 p., 2006.
[2] J.P. DEROIN et al., "Cartographie géologique télé-analytique. Influence de la résolution spatiale. Application à la région de Kawkaban-Sana’a-Ma’rib (République du Yémen)," Photo-Interprétation, Vol.42, No.3, 2006, pp.3-18.
[3] J.P. DEROIN et al., "Retrieval of land surface parameters in the Zone of Chotts, Tunisia, from SIR-C/X-SAR data", Proceedings International Geoscience and Remote Sensing Symposium, IGARSS’03, Toulouse, Vol.III, 2003, pp.1867-1869,
[4] C. ABDALLAH et al. "Interprétation visuelle des images satellitaires (Landsat TM, SPOT 4, IRS et IKONOS) et mouvements de masse. Cas d’étude au Liban", Photo-Interprétation, Vol.42, No.1, pp.3-10.
[5] C. ABDALLAH, "Application of remote sensing and geographical information system for studying mass movements in Lebanon", PhD thesis, University Pierre and Marie Curie, Paris, France, 2007.
[6] A. L’HOMER et al., "Notice explicative de la Carte géologique de la France à 1/50 000, feuille Baie du Mont-Saint-Michel", No208, 184 p., BRGM Editions, Orléans, 1999.
[7] J.P. DEROIN. in F. QUESNEL, O. DUGUÉ. et al.,. "Notice explicative de la Carte géologique de la France à 1/50 000, feuille Sainte-Mère-Église", No.94, BRGM Editions, Orléans (to be published).
[8] J.P. DEROIN et al., "Littoral survey using the JERS-OPS multispectral sensor. Example of the Mont Saint-Michel Bay (Normandy, France)". Remote Sensing of Environment, 62, 2, 1997, pp.119-131.
[9] H.F. KAVEH and B. DEFFONTAINES, "Mise à jour de MNT intégré terr-mer et application au prisme mégatidal du Mont Saint-Michel (France)". Revue de la Société française de Photogrammétrie et Télédétection, No177, 1, 2005, pp.2-16.
[10] J.S. WON et al., "Application of ERS SAR to the study of Korean tidal flats". Proceedings of IGARSS’05, 2005, pp.5683-5686.