Embed Size (px)
Citation preview
The impact of ART for HIV on TB
Brian Williams
South African Centre for Epidemiological Modelling and Analysis

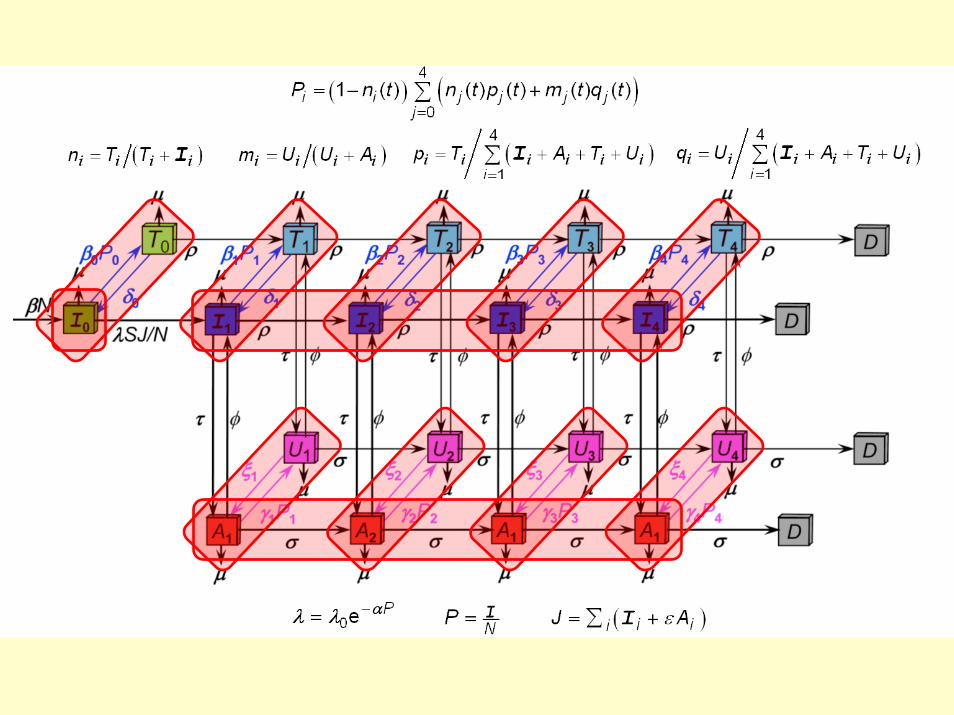
Basic model

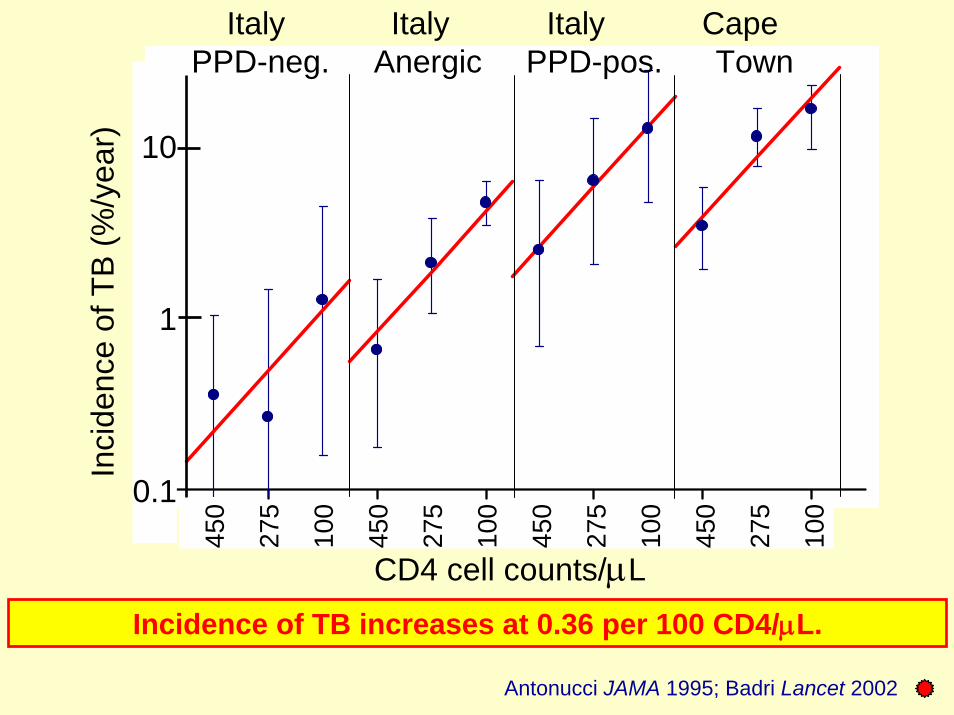
Increase of TB with decline in CD4
10
1
0.1
450
275
100
450
275
100
450
275
100
450
275
100
Italy Italy Italy CapePPD-neg. Anergic PPD-pos. Town
CD4 cell counts/μL
Inci
denc
e of
TB
(%/y
ear)
Incidence of TB increases at 0.36 per 100 CD4/μL.
Antonucci JAMA 1995; Badri Lancet 2002
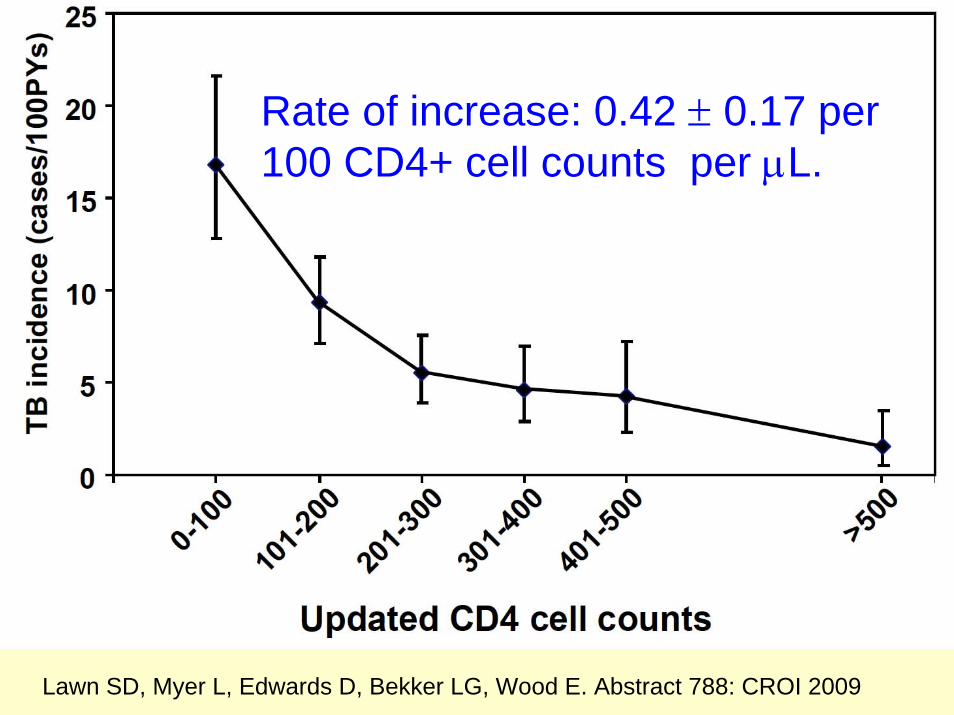
Lawn SD, Myer L, Edwards D, Bekker LG, Wood E. Abstract 788: CROI 2009
Rate of increase: 0.42 ± 0.17 per 100 CD4+ cell counts per μL.
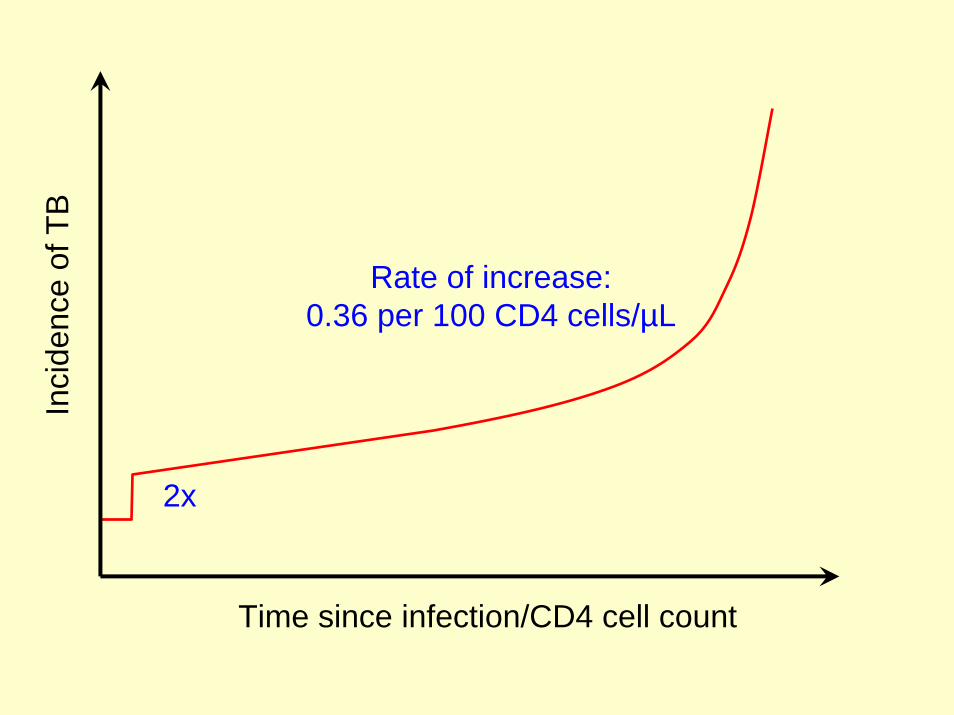
Time since infection/CD4 cell count
Inci
denc
e of
TB
2x
Rate of increase:0.36 per 100 CD4 cells/µL
Decrease of Disease Duration with Increase in
Incidence
9.4
1.11.11.0
5.9
2.2
0
2
4
6
8
10
1991-1994 1995-1997 1998-1999
Ann
ual i
ncid
ence
(%)
. HIV- HIV+
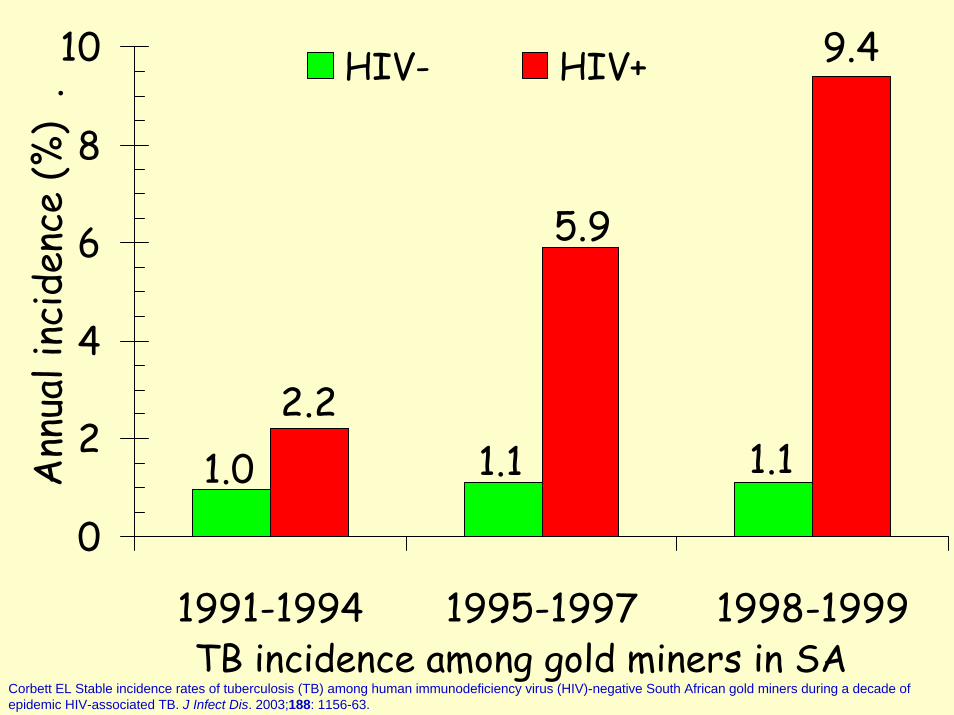
TB incidence among gold miners in SACorbett EL Stable incidence rates of tuberculosis (TB) among human immunodeficiency virus (HIV)-negative South African gold miners during a decade of epidemic HIV-associated TB. J Infect Dis. 2003;188: 1156-63.
0 0
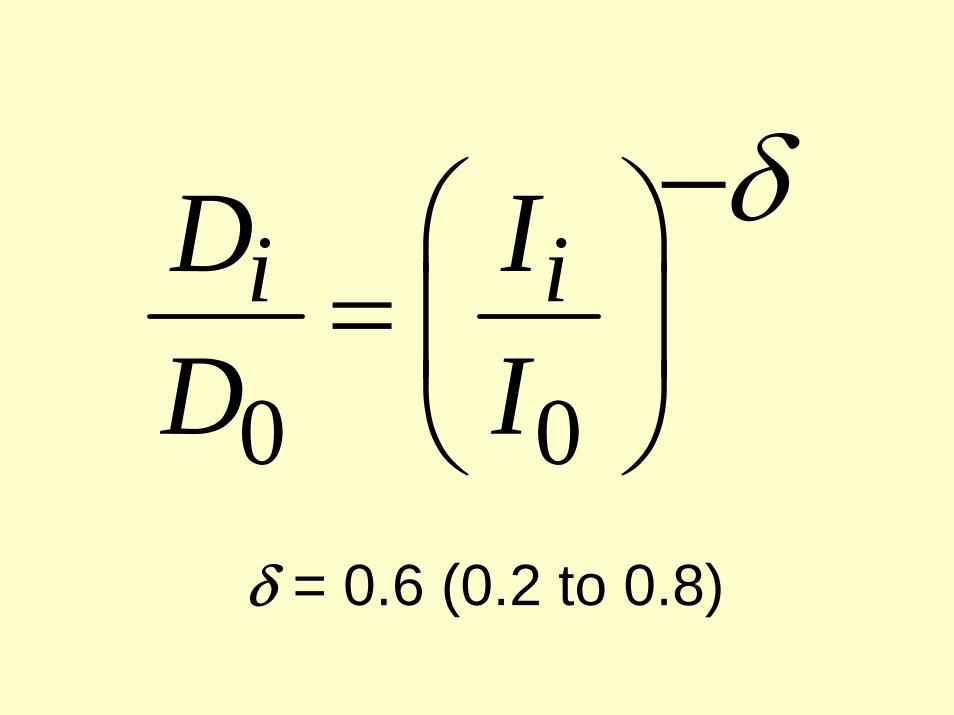
i iD ID I
δ⎛ ⎞= ⎜ ⎟
⎝ ⎠
−
δ = 0.6 (0.2 to 0.8)
To fix δ we used the model for South Africa to find the value of δ that fits the average disease duration ratio for South Africa
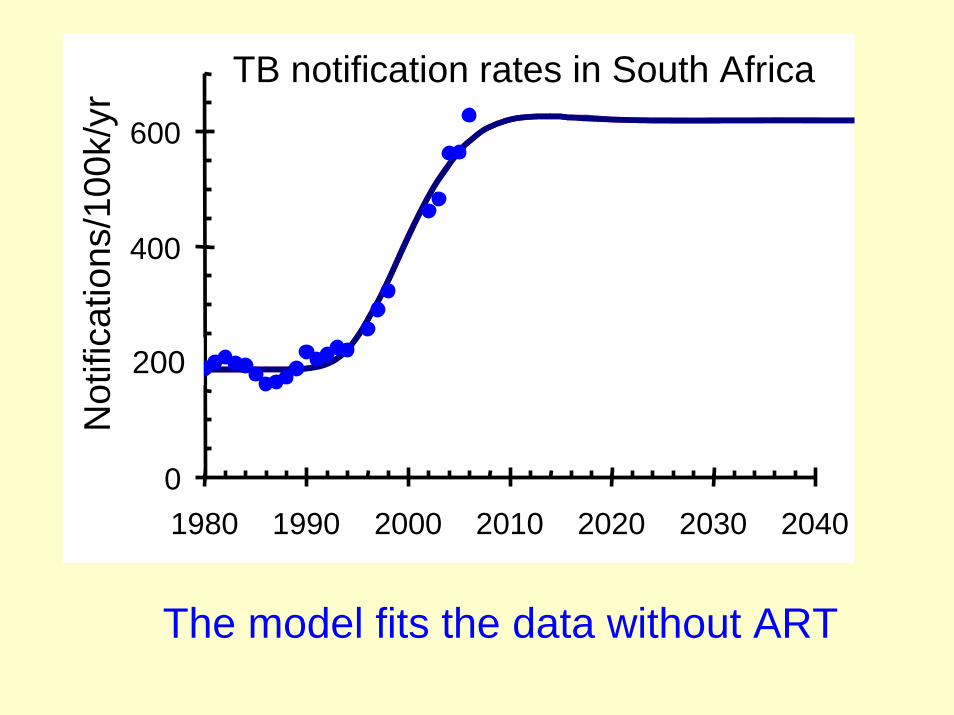
The model fits the data without ART
TB notification rates in South Africa
0
200
400
600
1980 1990 2000 2010 2020 2030 2040
Not
ifica
tions
/yr
200
Not
ifica
tions
/100
k/yr
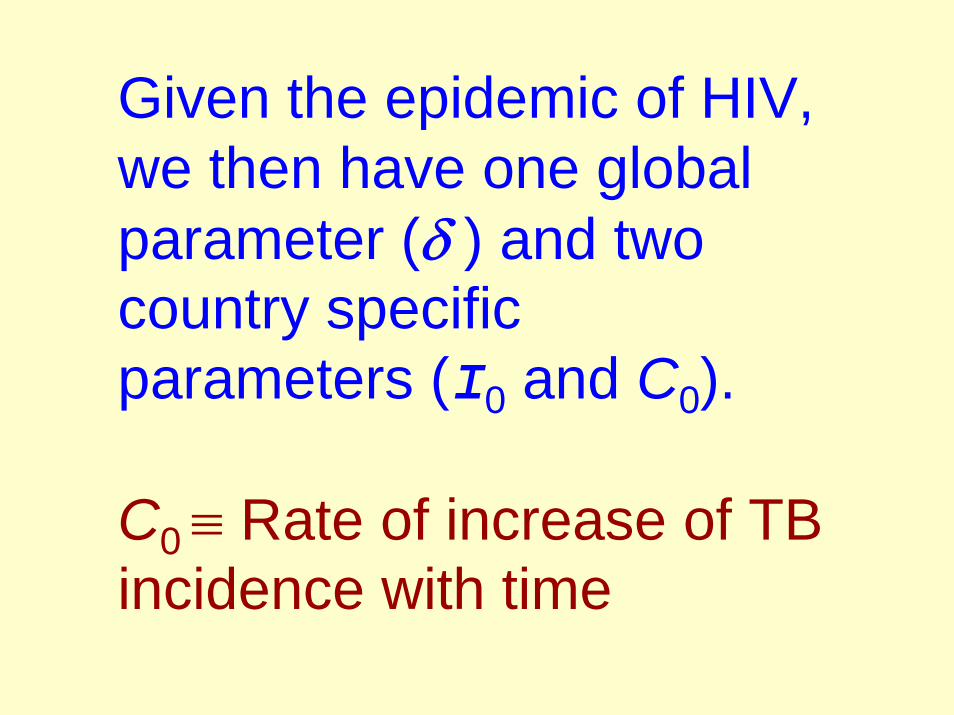
Given the epidemic of HIV, we then have one global parameter (δ ) and two country specific parameters (I0 and C0).
C0 ≡ Rate of increase of TB incidence with time
0
200
400
600
1980 1990 2000 2010 2020 2030 2040 2050
Not
ifica
tions
/100
k/yr
0
200
400
600
1980 1990 2000 2010 2020 2030 2040 2050
Not
ifica
tions
/100
k/yr
0
200
400
600
1980 1990 2000 2010 2020 2030 2040 2050
Not
ifica
tions
/100
k/yr
0
200
400
600
1980 1990 2000 2010 2020 2030 2040 2050
Not
ifica
tions
/100
k/yr
0
200
400
600
1980 1990 2000 2010 2020 2030 2040 2050
Not
ifica
tions
/100
k/yr
0
200
400
600
1980 1990 2000 2010 2020 2030 2040 2050
Not
ifica
tions
/100
k/yr
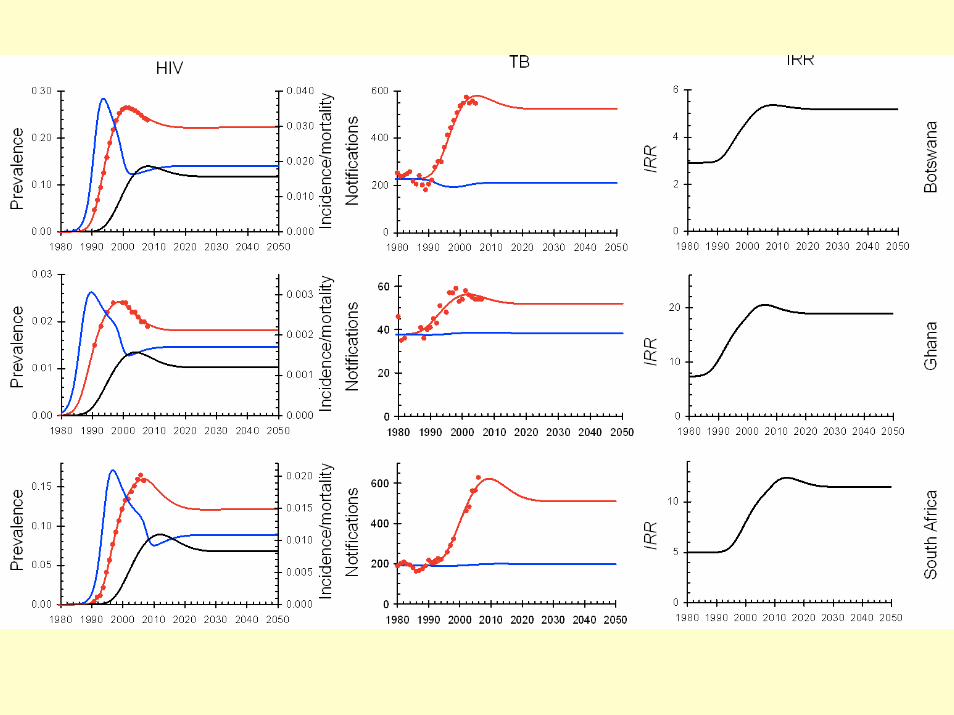
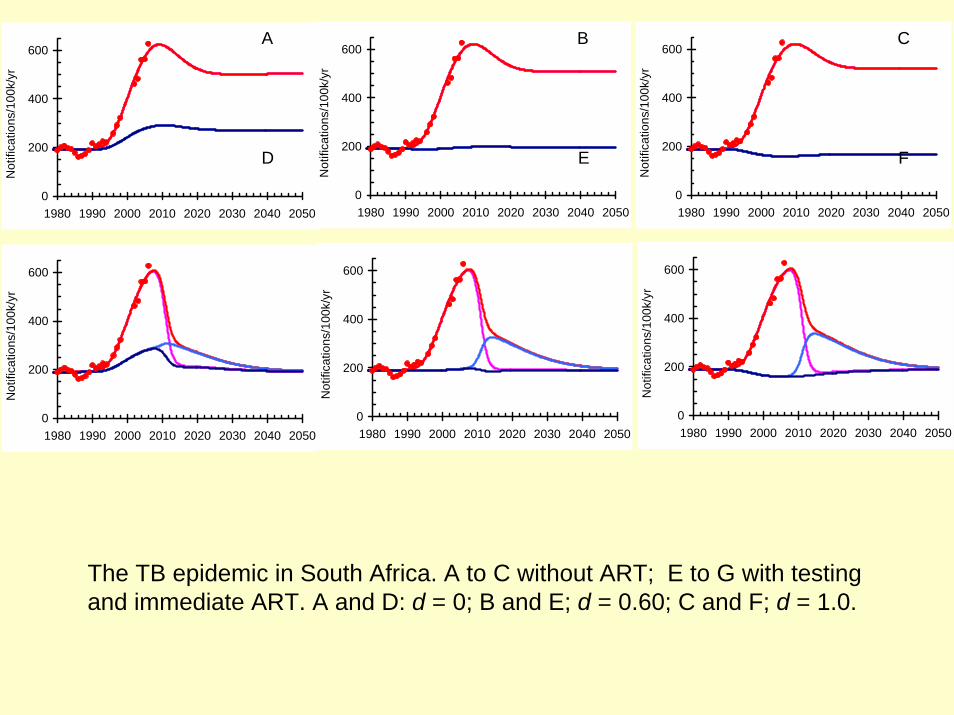
A B C D E F
The TB epidemic in South Africa. A to C without ART; E to G with testing and immediate ART. A and D: d = 0; B and E; d = 0.60; C and F; d = 1.0.
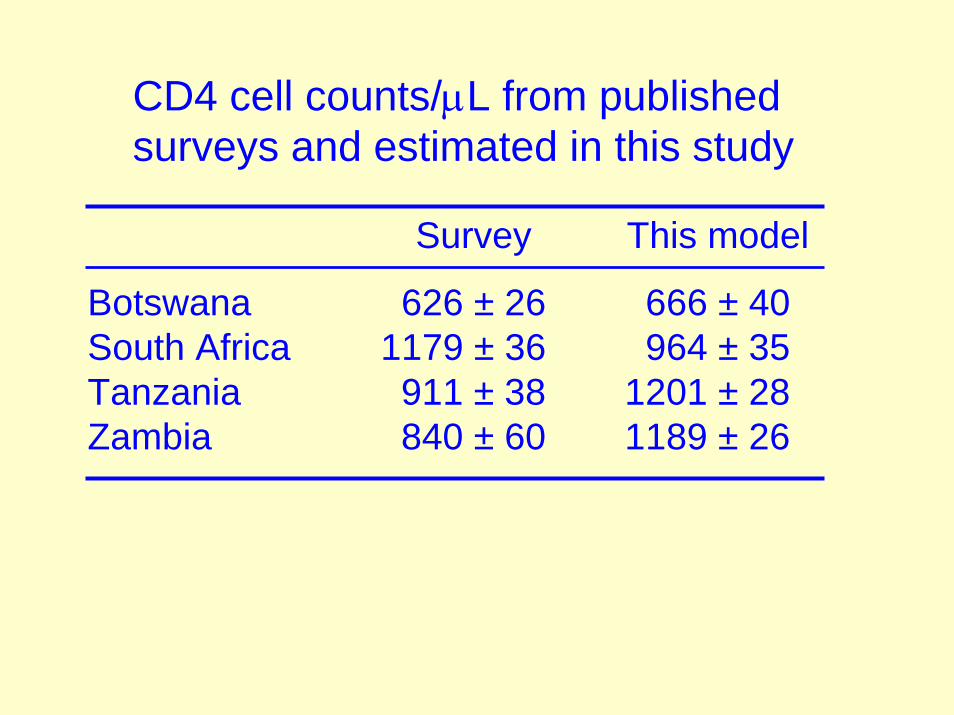
CD4 cell counts/μL from published surveys and estimated in this study
Survey This model
Botswana 626 ± 26 666 ± 40South Africa 1179 ± 36 964 ± 35Tanzania 911 ± 38 1201 ± 28Zambia 840 ± 60 1189 ± 26
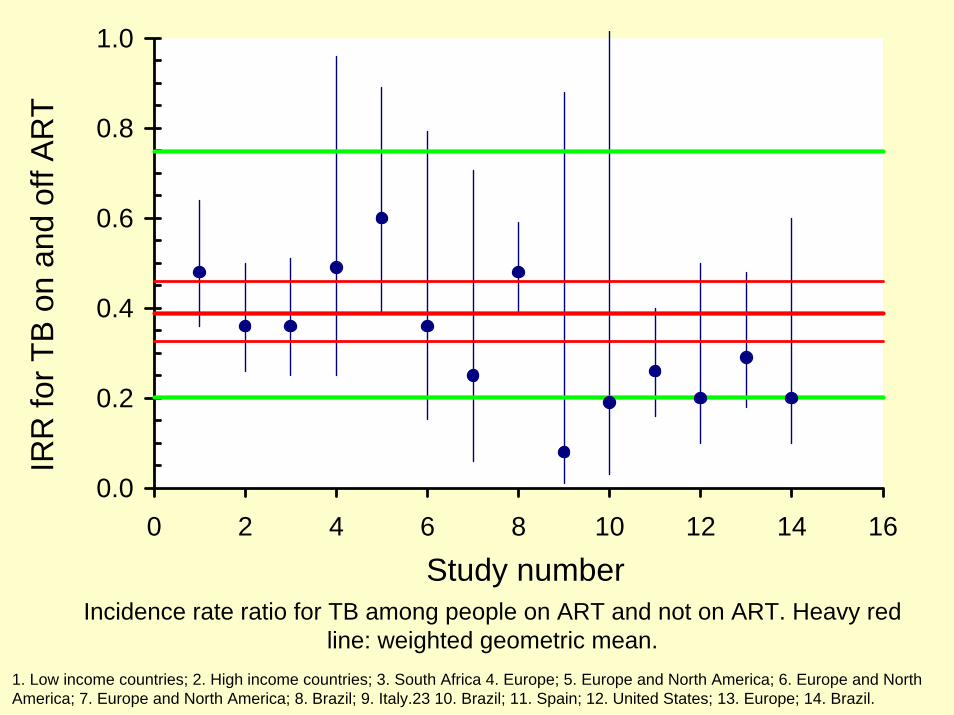
Reduction in TB when on ART
Study number
IRR
for T
B o
n an
d of
f AR
T
0.0
0.2
0.4
0.6
0.8
1.0
0 2 4 6 8 10 12 14 16
Incidence rate ratio for TB among people on ART and not on ART. Heavy red line: weighted geometric mean.
1. Low income countries; 2. High income countries; 3. South Africa 4. Europe; 5. Europe and North America; 6. Europe and North America; 7. Europe and North America; 8. Brazil; 9. Italy.23 10. Brazil; 11. Spain; 12. United States; 13. Europe; 14. Brazil.
0
200
400
600
1980 1990 2000 2010 2020 2030 2040
Not
ifica
tions
/yr
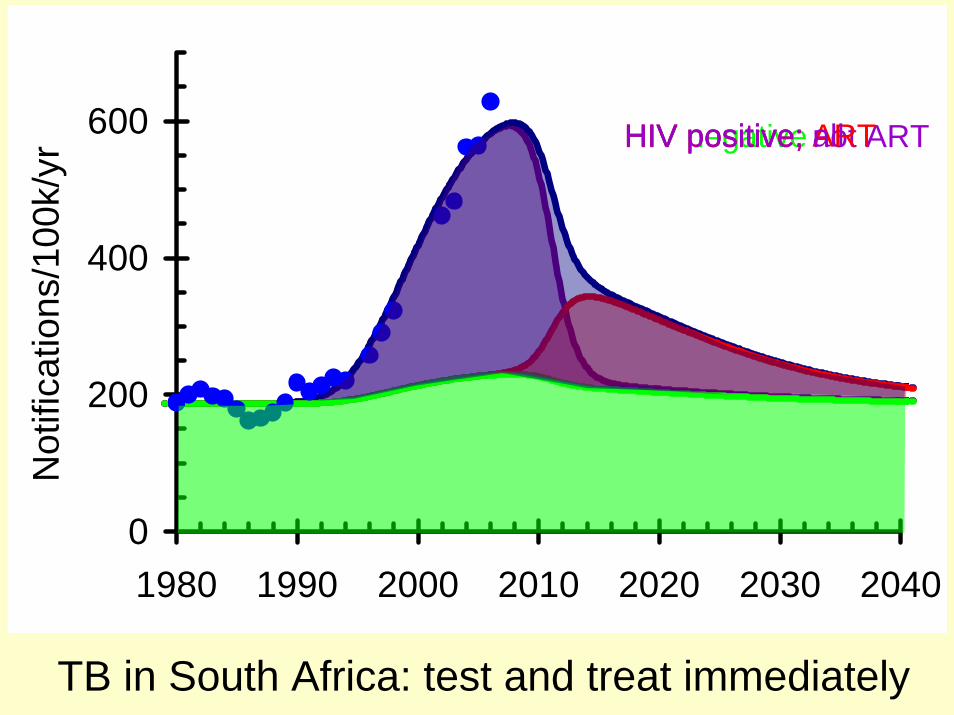
South Africa
HIV negativeHIV positive; not ARTHIV positive; ARTHIV positive; all
Not
ifica
tions
/100
k/yr
TB in South Africa: test and treat immediately
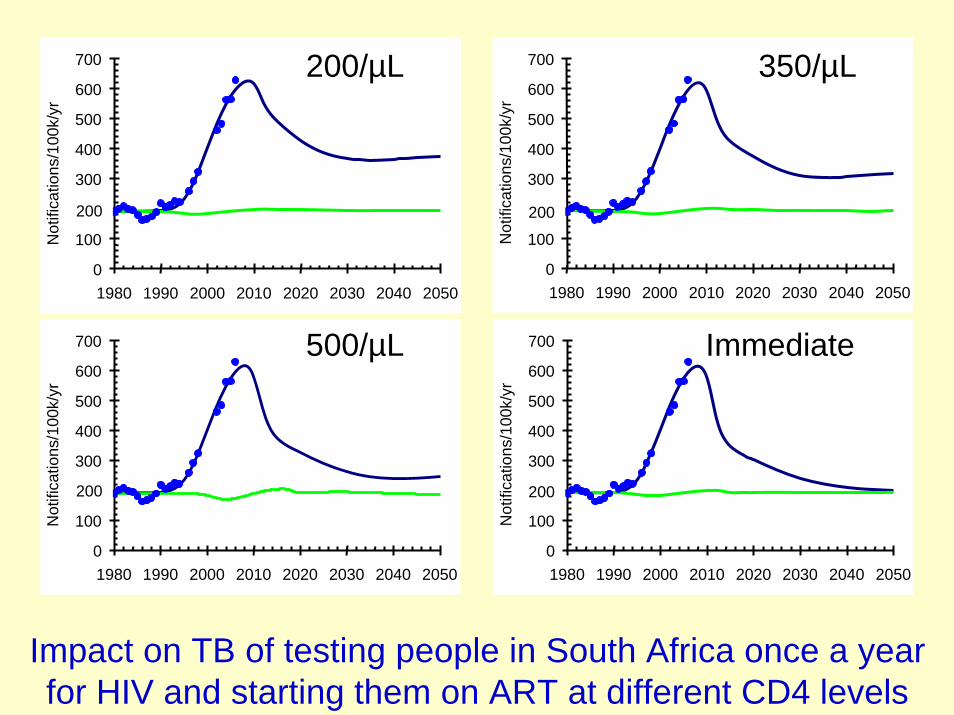
Impact on TB of testing people in South Africa once a year for HIV and starting them on ART at different CD4 levels
0
100
200
300
400
500
600
700
1980 1990 2000 2010 2020 2030 2040 2050
Not
ifica
tions
/100
k/yr
200
200/µL
0
100
200
300
400
500
600
700
1980 1990 2000 2010 2020 2030 2040 2050
Not
ifica
tions
/100
k/yr
200
350/µL
0
100
200
300
400
500
600
700
1980 1990 2000 2010 2020 2030 2040 2050
Not
ifica
tions
/100
k/yr
200
500/µL
0
100
200
300
400
500
600
700
1980 1990 2000 2010 2020 2030 2040 2050
Not
ifica
tions
/100
k/yr
200
Immediate
0
100
200
300
400
500
02468101214161820
100/μL200/μL
350/μL
500/μL
10 5 1
Time since seroconversion (years)
Inci
denc
e of
HIV
+TB
/100
k/ye
ar
2
2015
2050
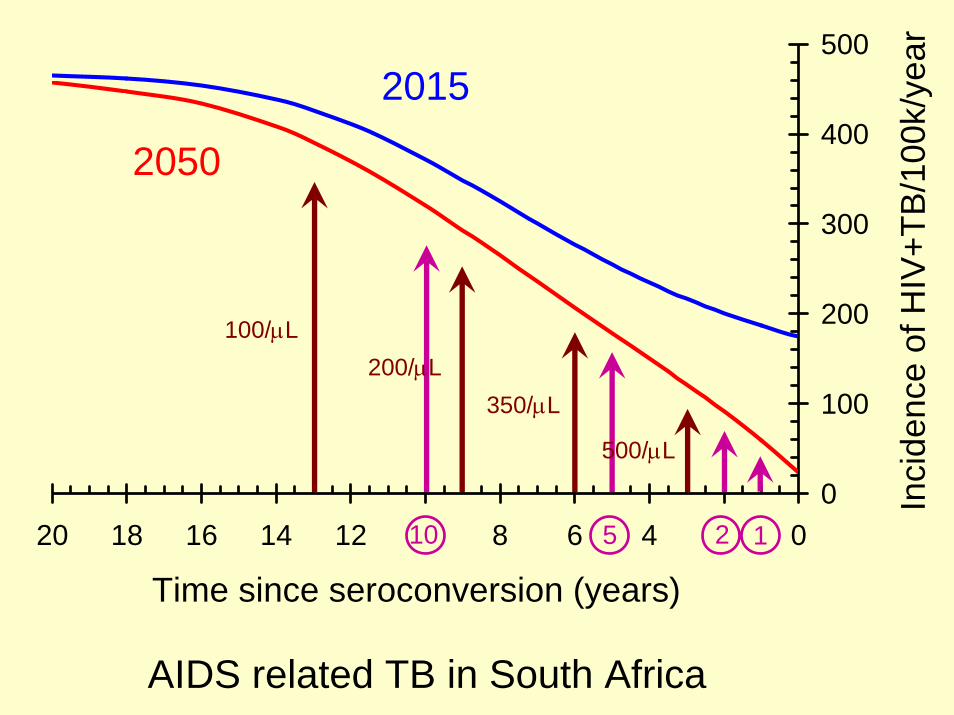
AIDS related TB in South Africa
Predicted and observed CD4+ cell counts
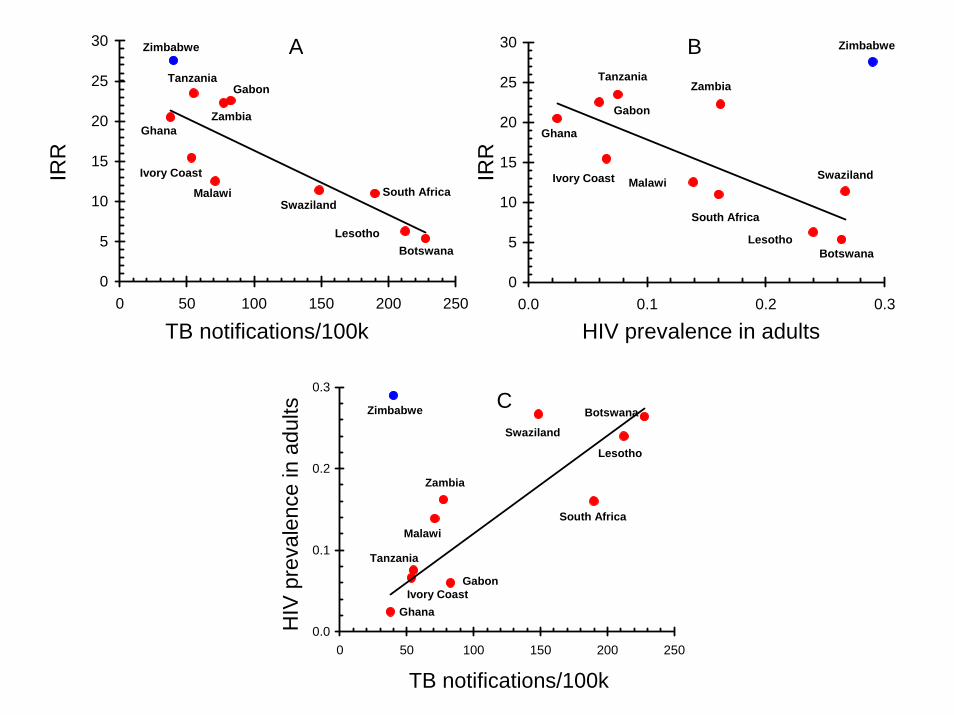
IR
R
IR
R
TB notifications/100k HIV prevalence in adults
Zambia
SwazilandSouth Africa
Tanzania
Malawi
Lesotho
Ghana
Gabon
Botswana
Ivory Coast
Zimbabwe
0
5
10
15
20
25
30
0 50 100 150 200 250
Zambia
Swaziland
South Africa
Tanzania
Malawi
Lesotho
Ghana
Gabon
Botswana
Ivory Coast
Zimbabwe
0
5
10
15
20
25
30
0.0 0.1 0.2 0.3
A B
H
IV p
reva
lenc
e in
adu
lts
TB notifications/100k
Ivory Coast
Botswana
Gabon
Ghana
Lesotho
Malawi
Tanzania
South Africa
Swaziland
Zambia
Zimbabwe
0.0
0.1
0.2
0.3
0 50 100 150 200 250
C
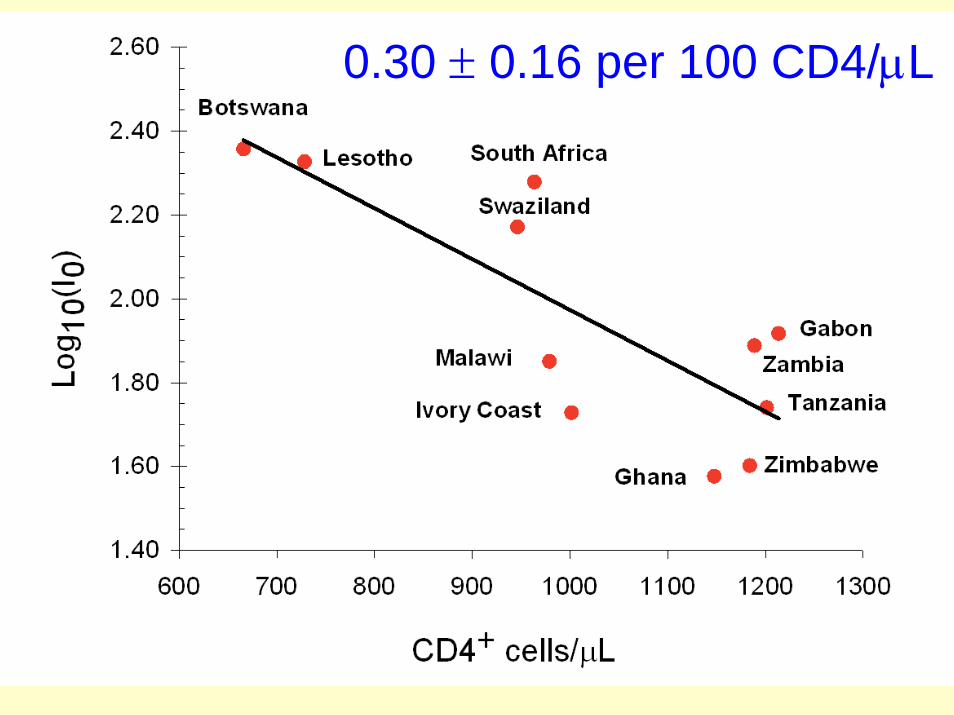
0.30 ± 0.16 per 100 CD4/μL
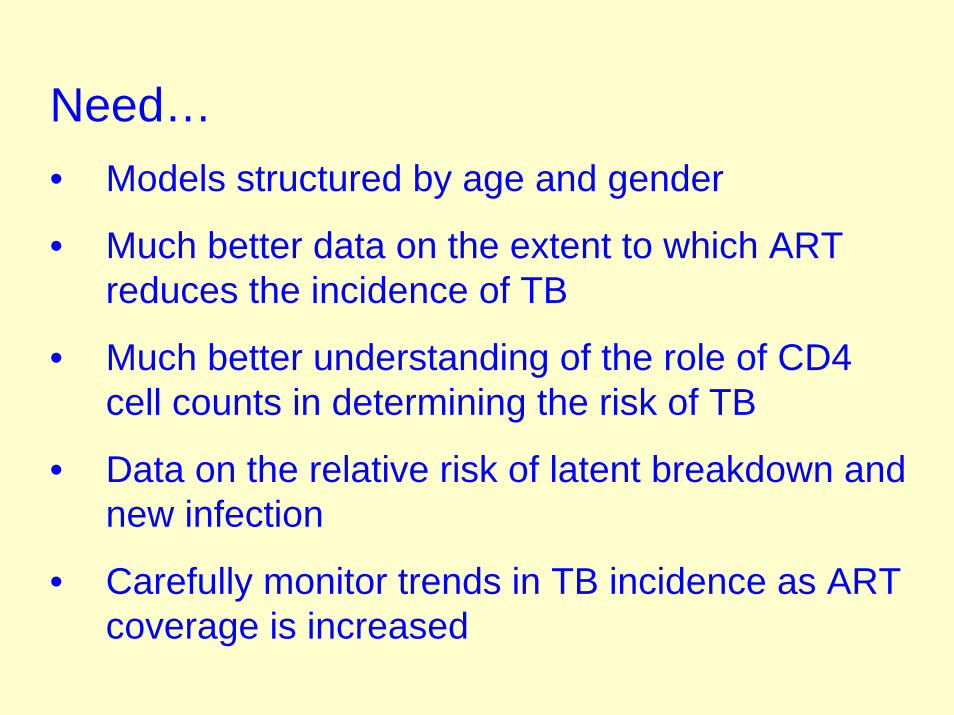
Need…• Models structured by age and gender
• Much better data on the extent to which ART reduces the incidence of TB
• Much better understanding of the role of CD4 cell counts in determining the risk of TB
• Data on the relative risk of latent breakdown and new infection
• Carefully monitor trends in TB incidence as ART coverage is increased

Thank you
Time to death (years)
CD
4 ce
ll co
unts
0.00
0.05
0.10
0.15
050
010
0015
0020
0025
00
0
10
0 10 20 30
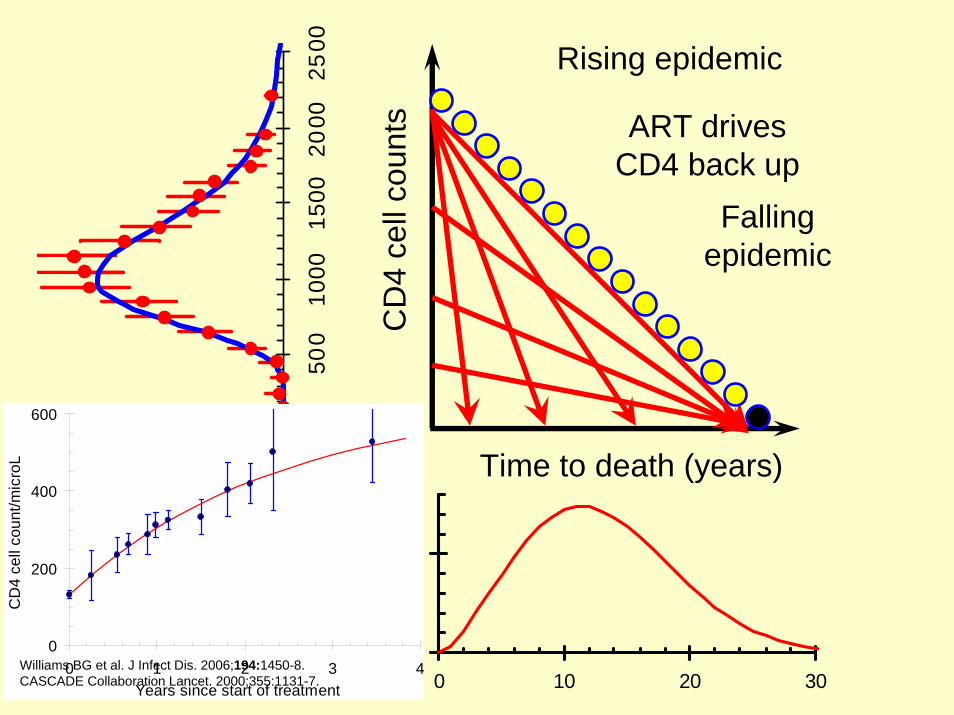
ART drives CD4 back up
0
200
400
600
0 1 2 3 4Years since start of treatment
CD
4 ce
ll co
unt/m
icro
L
Williams BG et al. J Infect Dis. 2006;194:1450-8.CASCADE Collaboration Lancet. 2000;355:1131-7.
Falling epidemic
Rising epidemic
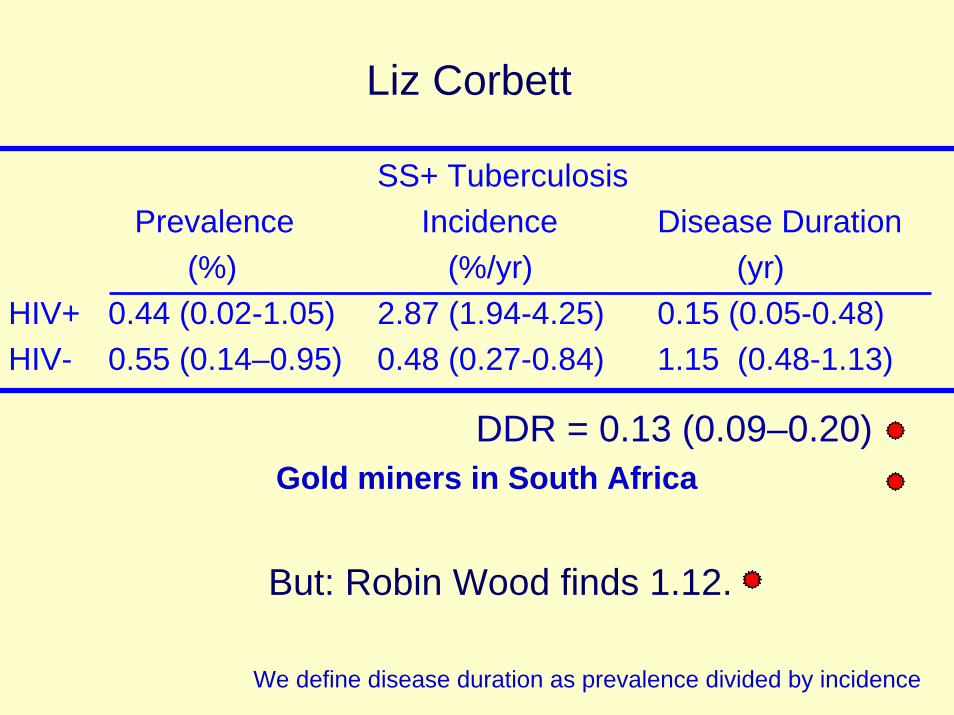
SS+ TuberculosisPrevalence Incidence Disease Duration
(%) (%/yr) (yr)HIV+ 0.44 (0.02-1.05) 2.87 (1.94-4.25) 0.15 (0.05-0.48)HIV- 0.55 (0.14–0.95) 0.48 (0.27-0.84) 1.15 (0.48-1.13)
DDR = 0.13 (0.09–0.20)Gold miners in South Africa
We define disease duration as prevalence divided by incidence
But: Robin Wood finds 1.12.
Liz Corbett
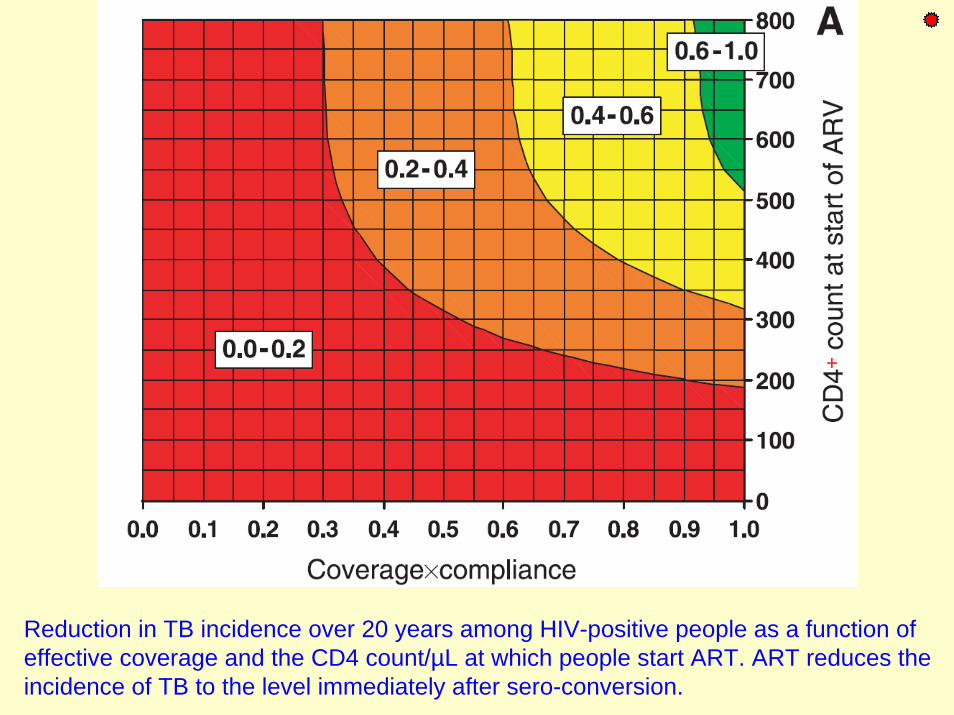
Reduction in TB incidence over 20 years among HIV-positive people as a function of effective coverage and the CD4 count/µL at which people start ART. ART reduces the incidence of TB to the level immediately after sero-conversion.
0
100
200
300
400
1980 1990 2000 2010 2020 2030 2040
Not
ifica
tions
/yr
Angola
0
20
40
60
80
100
120
140
1980 1990 2000 2010 2020 2030 2040
Odd
s ra
tio
Angola
0.00
0.01
0.02
0.03
1980 1990 2000 2010 2020 2030 20400.000
0.001
0.002
0.003
Prev
alen
ce
Inci
denc
e an
d m
orta
lity/
yr
Angola
0.00
0.10
0.20
0.30
1980 1990 2000 2010 2020 2030 20400.000
0.010
0.020
0.030
0.040
0.050
Prev
alen
ce
Inci
denc
e an
d m
orta
lity/
yr
Botswana
0
100
200
300
400
500
600
700
1980 1990 2000 2010 2020 2030 2040
Not
ifica
tions
/yr
Botswana
0
5
10
1980 1990 2000 2010 2020 2030 2040
Odd
s ra
tio
Botswana
0.00
0.01
0.02
0.03
0.04
0.05
0.06
0.07
1980 1990 2000 2010 2020 2030 20400.0000.0010.0020.0030.0040.0050.0060.0070.008
Prev
alen
ce
Inci
denc
e an
d m
orta
lity/
yrGabon
0
100
200
300
1980 1990 2000 2010 2020 2030 2040
Not
ifica
tions
/yr
Gabon
0
5
10
15
20
25
30
1980 1990 2000 2010 2020 2030 2040
Odd
s ra
tio
Gabon
0.00
0.01
0.02
0.03
1980 1990 2000 2010 2020 2030 20400.000
0.001
0.002
0.003
0.004
Prev
alen
ce
Inci
denc
e an
d m
orta
lity/
yr
Ghana 1
0
10
20
30
40
50
60
70
1980 1990 2000 2010 2020 2030 2040
Not
ifica
tions
/yr
Ghana 1
0
5
10
15
20
25
1980 1990 2000 2010 2020 2030 2040O
dds
ratio
Ghana 1
0.00
0.02
0.04
0.06
0.08
1980 1990 2000 2010 2020 2030 20400.000
0.005
0.010
Prev
alen
ce
Inci
denc
e an
d m
orta
lity/
yr
Ivory Coast
0
20
40
60
80
100
120
1980 1990 2000 2010 2020 2030 2040
Not
ifica
tions
/yr
Ivory Coast
0
5
10
15
20
1980 1990 2000 2010 2020 2030 2040
Odd
s ra
tio
Ivory Coast
0.00
0.10
0.20
0.30
1980 1990 2000 2010 2020 2030 20400.000
0.010
0.020
0.030
0.040
0.050
Prev
alen
ce
Inci
denc
e an
d m
orta
lity/
yr
Lesotho
0
100
200
300
400
500
600
700
1980 1990 2000 2010 2020 2030 2040
Not
ifica
tions
/yr
Lesotho
0
5
10
1980 1990 2000 2010 2020 2030 2040
Odd
s ra
tio
Lesotho
0.00
0.05
0.10
0.15
1980 1990 2000 2010 2020 2030 20400.000
0.010
0.020
Prev
alen
ce
Inci
denc
e an
d m
orta
lity/
yr
Malawi 1
0
50
100
150
200
250
1980 1990 2000 2010 2020 2030 2040
Not
ifica
tions
/yr
Malawi 1
0
5
10
15
1980 1990 2000 2010 2020 2030 2040
Odd
s ra
tio
Malawi 1
0
100
200
300
400
1980 1990 2000 2010 2020 2030 2040
Not
ifica
tions
/yr
Angola
0
20
40
60
80
100
120
140
1980 1990 2000 2010 2020 2030 2040
Odd
s ra
tio
Angola
0.00
0.01
0.02
0.03
1980 1990 2000 2010 2020 2030 20400.000
0.001
0.002
0.003
Prev
alen
ce
Inci
denc
e an
d m
orta
lity/
yr
Angola
0.00
0.10
0.20
0.30
1980 1990 2000 2010 2020 2030 20400.000
0.010
0.020
0.030
0.040
0.050
Prev
alen
ce
Inci
denc
e an
d m
orta
lity/
yr
Botswana
0
100
200
300
400
500
600
700
1980 1990 2000 2010 2020 2030 2040
Not
ifica
tions
/yr
Botswana
0
5
10
1980 1990 2000 2010 2020 2030 2040
Odd
s ra
tio
Botswana
0.00
0.01
0.02
0.03
0.04
0.05
0.06
0.07
1980 1990 2000 2010 2020 2030 20400.0000.0010.0020.0030.0040.0050.0060.0070.008
Prev
alen
ce
Inci
denc
e an
d m
orta
lity/
yr
Gabon
0
100
200
300
1980 1990 2000 2010 2020 2030 2040
Not
ifica
tions
/yr
Gabon
0
5
10
15
20
25
30
1980 1990 2000 2010 2020 2030 2040
Odd
s ra
tio
Gabon
0.00
0.01
0.02
0.03
1980 1990 2000 2010 2020 2030 20400.000
0.001
0.002
0.003
0.004
Prev
alen
ce
Inci
denc
e an
d m
orta
lity/
yr
Ghana 1
0
10
20
30
40
50
60
70
1980 1990 2000 2010 2020 2030 2040
Not
ifica
tions
/yr
Ghana 1
0
5
10
15
20
25
1980 1990 2000 2010 2020 2030 2040
Odd
s ra
tio
Ghana 1
0.00
0.02
0.04
0.06
0.08
1980 1990 2000 2010 2020 2030 20400.000
0.005
0.010
Prev
alen
ce
Inci
denc
e an
d m
orta
lity/
yr
Ivory Coast
0
20
40
60
80
100
120
1980 1990 2000 2010 2020 2030 2040
Not
ifica
tions
/yr
Ivory Coast
0
5
10
15
20
1980 1990 2000 2010 2020 2030 2040
Odd
s ra
tio
Ivory Coast
0.00
0.10
0.20
0.30
1980 1990 2000 2010 2020 2030 20400.000
0.010
0.020
0.030
0.040
0.050
Prev
alen
ce
Inci
denc
e an
d m
orta
lity/
yr
Lesotho
0
100
200
300
400
500
600
700
1980 1990 2000 2010 2020 2030 2040
Not
ifica
tions
/yr
Lesotho
0
5
10
1980 1990 2000 2010 2020 2030 2040
Odd
s ra
tio
Lesotho
0.00
0.05
0.10
0.15
1980 1990 2000 2010 2020 2030 20400.000
0.010
0.020
Prev
alen
ce
Inci
denc
e an
d m
orta
lity/
yr
Malawi 1
0
50
100
150
200
250
1980 1990 2000 2010 2020 2030 2040
Not
ifica
tions
/yr
Malawi 1
0
5
10
15
1980 1990 2000 2010 2020 2030 2040
Odd
s ra
tio
Malawi 1
0.00
0.02
0.04
0.06
0.08
1980 1990 2000 2010 2020 2030 20400.000
0.005
0.010
0.015
Pre
vale
nce
Inci
denc
e an
d m
orta
lity/
yr
Tanzania
0
50
100
150
200
1980 1990 2000 2010 2020 2030 2040
Not
ifica
tions
/yr
Tanzania
0
5
10
15
20
25
30
1980 1990 2000 2010 2020 2030 2040
Odd
s ra
tio
Tanzania
0.00
0.05
0.10
0.15
0.20
1980 1990 2000 2010 2020 2030 20400.000
0.010
0.020
0.030
0.040
Pre
vale
nce
Inci
denc
e an
d m
orta
lity/
yr
Zambia
0
100
200
300
400
500
600
1980 1990 2000 2010 2020 2030 2040
Not
ifica
tions
/yr
Zambia
0
5
10
15
20
1980 1990 2000 2010 2020 2030 2040
Odd
s ra
tio
Zambia
0.00
0.05
0.10
0.15
0.20
0.25
0.30
0.35
1980 1990 2000 2010 2020 2030 20400.000
0.010
0.020
0.030
0.040
0.050
Prev
alen
ce
Inci
denc
e an
d m
orta
lity/
yr
Zimbabwe
0
100
200
300
400
500
1980 1990 2000 2010 2020 2030 2040
Not
ifica
tions
/yr
Zimbabwe
0
5
10
15
20
25
30
1980 1990 2000 2010 2020 2030 2040
Odd
s ra
tio
Zimbabwe
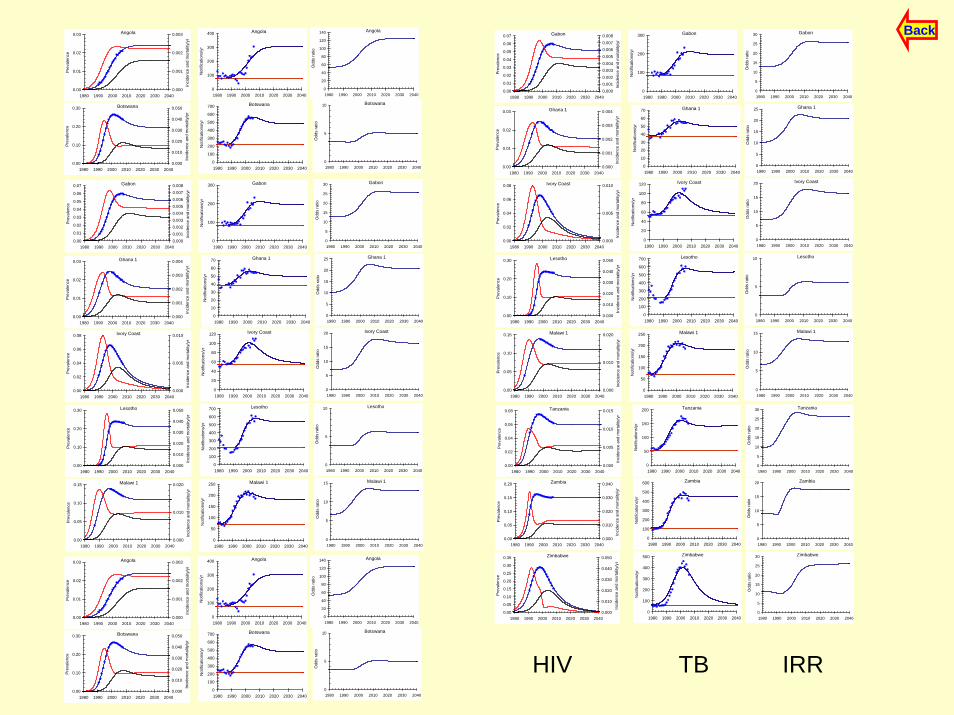
HIV TB IRR
Back