Embed Size (px)
Citation preview
econstor www.econstor.eu
Der Open-Access-Publikationsserver der ZBW – Leibniz-Informationszentrum WirtschaftThe Open Access Publication Server of the ZBW – Leibniz Information Centre for Economics
Standard-Nutzungsbedingungen:
Die Dokumente auf EconStor dürfen zu eigenen wissenschaftlichenZwecken und zum Privatgebrauch gespeichert und kopiert werden.
Sie dürfen die Dokumente nicht für öffentliche oder kommerzielleZwecke vervielfältigen, öffentlich ausstellen, öffentlich zugänglichmachen, vertreiben oder anderweitig nutzen.
Sofern die Verfasser die Dokumente unter Open-Content-Lizenzen(insbesondere CC-Lizenzen) zur Verfügung gestellt haben sollten,gelten abweichend von diesen Nutzungsbedingungen die in der dortgenannten Lizenz gewährten Nutzungsrechte.
Terms of use:
Documents in EconStor may be saved and copied for yourpersonal and scholarly purposes.
You are not to copy documents for public or commercialpurposes, to exhibit the documents publicly, to make thempublicly available on the internet, or to distribute or otherwiseuse the documents in public.
If the documents have been made available under an OpenContent Licence (especially Creative Commons Licences), youmay exercise further usage rights as specified in the indicatedlicence.
zbw Leibniz-Informationszentrum WirtschaftLeibniz Information Centre for Economics
van den Berg, Gerard J.; Pinger, Pia R.; Schoch, Johannes
Working Paper
Instrumental variable estimation of the causal effectof hunger early in life on health later in life
Working Paper, IFAU - Institute for Evaluation of Labour Market and Education Policy, No.2012:6
Provided in Cooperation with:IFAU - Institute for Evaluation of Labour Market and Education Policy,Uppsala
Suggested Citation: van den Berg, Gerard J.; Pinger, Pia R.; Schoch, Johannes (2012) :Instrumental variable estimation of the causal effect of hunger early in life on health later inlife, Working Paper, IFAU - Institute for Evaluation of Labour Market and Education Policy, No.2012:6
This Version is available at:http://hdl.handle.net/10419/82276
Instrumental variable estimation of the causal effect of hunger early in life
on health later in life
Gerard J. van den Berg Pia R. Pinger
Johannes Schoch
WORKING PAPER 2012:6

The Institute for Labour Market Policy Evaluation (IFAU) is a research institute under the Swedish Ministry of Employment, situated in Uppsala. IFAU’s objective is to promote, support and carry out scientific evaluations. The assignment includes: the effects of labour market policies, studies of the functioning of the labour market, the labour market effects of educational policies and the labour market effects of social insurance policies. IFAU shall also disseminate its results so that they become acces-sible to different interested parties in Sweden and abroad. IFAU also provides funding for research projects within its areas of interest. The deadline for applications is October 1 each year. Since the researchers at IFAU are mainly economists, researchers from other disciplines are encouraged to apply for funding. IFAU is run by a Director-General. The institute has a scientific council, consisting of a chairman, the Director-General and five other members. Among other things, the scientific council proposes a decision for the allocation of research grants. A reference group including representatives for employer organizations and trade unions, as well as the ministries and authorities concerned is also connected to the institute. Postal address: P.O. Box 513, 751 20 Uppsala Visiting address: Kyrkogårdsgatan 6, Uppsala Phone: +46 18 471 70 70 Fax: +46 18 471 70 71 [email protected] www.ifau.se Papers published in the Working Paper Series should, according to the IFAU policy, have been discussed at seminars held at IFAU and at least one other academic forum, and have been read by one external and one internal referee. They need not, however, have undergone the standard scrutiny for publication in a scientific journal. The purpose of the Working Paper Series is to provide a factual basis for public policy and the public policy discussion. ISSN 1651-1166
Instrumental variable estimation of the
causal effect of hunger early in life on health
later in life
Gerard J. van den Berg∗
Pia R. Pinger†
Johannes Schoch‡
March 24, 2012
AbstractNumerous studies have evaluated the effect of nutrition early in life on health muchlater in life by comparing individuals born during a famine to others. Nutritionalintake is typically unobserved and endogenous, whereas famines arguably provideexogenous variation in the provision of nutrition. However, living through a famineearly in life does not necessarily imply a lack of nutrition during that age interval,and vice versa, and in this sense the observed difference at most provides a quali-tative assessment of the average causal effect of a nutritional shortage, which is theparameter of interest. In this paper we estimate this average causal effect on healthoutcomes later in life, by applying instrumental variable estimation, using data withself-reported periods of hunger earlier in life, with famines as instruments. The datacontain samples from European countries and include birth cohorts exposed to variousfamines in the 20th century. We use two-sample IV estimation to deal with imperfectrecollection of conditions at very early stages of life. The estimated average causaleffects often exceed famine effects by a factor three.
∗Alexander von Humboldt Professor of Econometrics and Empirical Economics, University ofMannheim; IFAU-Uppsala, VU University Amsterdam; IZA. Address: Department of Economics, Uni-versity of Mannheim, L7, 3–5, 68131 Mannheim, Germany.
†University of Mannheim, ZEW, IZA.‡University of Mannheim.
Keywords: Nutrition, famine, ageing, developmental origins, height, blood pressure, obesity, two-sample IV. JEL codes: I12, J11, C21, C26.
Acknowledgements: We thank Alberto Abadie as well as Bo Honore and other participants in aworkshop in Munich, September 2011, for useful comments. First circulated version: November 2011.This paper uses data from SHARELIFE release 1 and SHARE release 2.5.0. The SHARE data collectionhas been primarily funded by the European Commission. See www.share-project.org for the full list offunding institutions.
1
1 Introduction
During the past decade, the effect of early-life conditions on health outcomes late in life
has become a focal point of research in economics, demography, epidemiology, biology,
and related fields.1 Empirical studies use non-experimental data of real-life individuals and
typically relate indicators of early-life conditions to outcomes of the same individuals at
high ages. A major concern is that (a) observed conditions in the parents’ household early
in life, including conditions in utero as captured by birthweight, and (b) outcomes later in
life, are jointly dependent on unobserved confounders. To be able to detect causal effects,
one needs to observe exogenous variation in the early-life conditions, and relate this to
outcomes later in life. Moreover, this variation should only affect high-age health by way
of the individual early-life conditions and not through secular or cohort-specific changes
in society after the early-life period of interest. As a result, candidate indicators are often
not some unique characteristic of the newborn individual or his family or household, but
rather a temporary state of the macro environment into which the child is born. In that
case they are also called contextual variables.
In the literature, the most frequently used indicator is whether the individual has been
exposed to a famine at a specific childhood age, notably in utero. Lumey, Stein and Susser
(2011) provide an excellent overview. The underlying idea is that in many households birth
in a famine involves nutritional shortages, in terms of quality and/or quantity of nutrition.
Birth outside of a famine is expected to involve better nutritional conditions. A negative
association between birth during a famine and a favorable health outcome later in life is
interpreted as evidence for a causal effect of early-life conditions on that health outcome.2
Studies have detected associations with adult height, schizophrenia, mortality, fertility,
hospitalization, next generation birthweight and even gene expression. Interestingly, a few
studies have also reported associations between exposure to a famine at the onset of puberty
and late-life health outcomes. For example, Sparen et al. (2004) find that boys who had
been exposed around age 9 to the Leningrad siege famine of 1941 have higher rates of
cardiovascular morbidity and mortality much later in life. Oppers (1963) finds an effect of
the Dutch Hunger Winter famine exposure at ages 7-14 on adult height.3
1For overviews, see e.g. Pollitt, Rose and Kaufman (2005), Barker (2007), Lawlor (2008) and Almondand Currie (2011).
2Note that also this requires that the composition of newborns is not systematically different betweenfamine-born and non-famine born, in terms of unobserved characteristics of the newborns.
3Many qualitative results from the famine-based studies are in agreement to those in studies using othercontextual indicators of conditions around birth, such as business cycles and seasons. See e.g. Van denBerg and Lindeboom (2012) for an overview. Van den Berg et al. (2010) use immigrant siblings to studythe effect of economic conditions at later childhood ages, and they find a significant effect on adult height.They also survey other studies concerning later childhood ages.
2
However, exposure to a famine is not equivalent to exposure to a nutritional shortage.
During a famine, a fraction of all households does not face food shortages, for example
because the household belongs to the ruling or wealthy class, or because it is self-sufficient
in terms of food, or, in a war context, because it is allied to those responsible for the cause
of the famine. Similarly, in non-famine eras, a fraction of households faces food shortages
because of poverty. This means that the comparison of famine-born individuals to non-
famine-born individuals does not provide a quantitative estimate of the average causal
effect of nutritional shortages around birth. Most likely, the latter effect is under-estimated
in absolute value by such a comparison.
To advance on this, it is necessary to observe the nutritional status in the households
at the time interval in which the child is in utero or at the childhood age of interest. But
this is almost impossible given that the study outcomes concern health at high ages. To
observe these outcomes, the individuals in the data need to have been born a long time
ago. This means that the critical period of interest necessarily occurred say before 1950.
At the time, data on household conditions were not systematically collected. Moreover,
for some of the sample, the critical period must have occurred during a famine. During
famines, data are typically not collected, as societies are in a state of disruption.
In this paper we deal with these problems by using self-reported retrospective data on
the individual occurrence of a period of severe hunger at certain childhood ages. Specifi-
cally, we relate these data to the occurrence of famines at those ages and to health outcomes
of the same individuals later in life, and we use Instrumental Variable (IV) estimation tech-
niques to estimate average causal effects of nutritional shortages during certain childhood
ages on health outcomes later in life. In terms of the IV treatment evaluation literature,
our instrumental variable is the exposure to a famine early in life, our treatment is the
experience of a nutritional shortage early in life, and our outcome is health at high ages.
With heterogeneous effects, the IV estimation provides so-called local average treatment
effects (LATE; see Imbens and Angrist, 1994).
Our approach is novel. We are the first to use the occurrence of famines to obtain an
estimate of average causal effects of nutritional shortages during specific childhood ages on
health later in life. Notice that IV is generally not applicable in studies of long-run effects
of early-life conditions, because of non-observability of household conditions early in life.
This is not specific for famines as early-life indicators but also applies to other contextual
indicators such as business cycles, seasons, weather, and infant mortality rates. As a by-
product, our study provides estimates of the strength of the association between a famine
and an actual hunger episode. In terms of the IV treatment evaluation literature, we look
at “compliance” to the instrument.
Our individual data are from the Survey of Health, Aging, and Retirement in Europe
3
(SHARE), a European longitudinal survey based on a random sample of individuals aged
50+. The most recent available (third) wave asks respondents for retrospective accounts
of specific aspects of their lives. The birth cohorts in the data include cohorts that were
exposed to the famines in the Netherlands, Germany, or Greece, in various time intervals
in the 1940s. These are the three famines in the countries participating in SHARE in its
observation window.4 Their origins are well-established in the literature, and they have
been used to study long-run effects (see the literature discussion in Section 2). Notice that
evidence based on multiple famines is less sensitive to culture or cohort-specific conditions.
Strictly speaking, it is the cause of the famine that is the ultimate instrumental variable,
instead of the famine itself. After all, any period or era in which many people are hungry
may be called a famine. What matters for the study of long run effects is that the famine
is an exogenous event with no long-run impact apart from the effect running through
household-specific nutritional conditions. This is more likely if the famine is due to an
external intervention in society and if the famine is short and is not anticipated. The three
famines in our data satisfy these requirements, as they are all due to trade blockades in
combination with government rule by foreign occupying forces.
Nutritional shortages that only took place in utero will not be reported as episodes of
hunger early in life. Even with a perfect recollection of past periods of hunger (e.g. if the
individual obtained this information from his or her parents), a spell in utero will only be
reported if it stretches past the day of birth. More in general, recall of a period of severe
hunger may be more difficult if this period took place around birth. Indeed, in our data,
the reporting of hunger during a famine is low if the age during the famine was close to
zero. We deal with this by using two-sample IV (2SIV) estimation. This method has been
developed by Angrist and Krueger (1992) and Arellano and Meghir (1992); see Ridder and
Moffitt (2007) for an integrated overview. Intuitively, when we consider long-run effects
of nutritional shortages for newborns, we relate famines around birth to health later in
life, but we may use a sample of older children to estimate the connection between famine
exposure and nutritional shortage. This requires the assumption that the latter connection
is the same for all children. This is not innocuous. As we shall see, there is evidence of
special food support for young children during famines that was not available for older
children. In that case, our estimates provide a lower bound for the average causal effect.
The SHARE data have established a high reputation in terms of quality, and by now
many studies have been published using these data (see e.g. Borsch-Supan et al., 2008).
Our particular empirical analysis faces two data design limitations. First, for our purposes,
the sample is not large. The number of respondents per country is around 1500. However,
4Barring famines that affected only a few respondents, like the German 1916/18 famine; see Van denBerg and Pinger (2011). Our analysis restricts attention to births in 1920-1955.
4
to be exposed to a famine at a specific age, the respondent needs to have been a child
(or in utero) in one of three countries in a birth cohort interval with a length equal to
the famine, where the famine duration ranges from a few months to at most a few years.
Secondly, the survey questions concerning the period of severe hunger ask for an interval
in terms of full calendar years. In each analysis we therefore need to define and align three
different intervals early in life: the relevant age interval in which nutritional shortage may
cause long-run effects; the calendar time interval for which the individual reports severe
hunger, and the calendar time interval in which the famine took place. Inevitably, we have
to make several shortcuts, and it is important to address the sensitivity of the results with
respect to this. In fact, given the relatively small sample size, moderate changes in the
definitions of these intervals only affect the status of few respondents, and the results are
often insensitive to this.
Since we aim to estimate a causal effect of nutritional shortages in general, the rele-
vance of our findings should stretch beyond famine-stricken societies. Child hunger is not
only prevalent in many parts of the developing world, but also in industrialized countries.
“Feeding America” reports that even in the US 11.9 million citizens regularly suffer from
hunger. From these, around a third are children under the age of 18. Undernutrition is
essentially an economic problem that can be mitigated by public policy. From an economic
point of view, it matters to find out at which age of the children exposure to nutritional
shortages is most detrimental in the long run. This helps to address which policy measures
are most efficient and cost-effective in preventing adult health problems.
The paper proceeds as follows. In Section 2 we review the explanatory frameworks to
understand the long-run effects. Section 3 describes the three famines in our observation
window and summarizes the evidence obtained so far for those famines. In Section 4 we
describe our data. Section 5 formally presents the econometric methods. Here we also
examine selectivity issues associated with the famines. Section 6 presents our results. We
do not only study effects of adverse conditions around birth but we also identify whether
periods in early adolescence are critical with respect to nutritional shocks. We also consider
the strength of the association between famines and actual nutritional shortages. This is
of importance for the empirical literature in which the three famines have been used as
indicators of early-life conditions. In Section 6 we also carry out placebo estimations using
cohorts from countries that were not affected by famines. We also use cohorts from other
countries (Belgium, France and Italy) as control cohorts, as an additional way to verify
that the effects of hunger do not reflect the effects due to exposure to World War II and
its aftermath. Section 7 concludes.
5
2 Explanatory frameworks for causal long-run effects
of conditions early in life
2.1 Conditions around birth
Most explanations for long-run effects of nutritional conditions around birth build on
Barker’s fetal origins or fetal programming hypothesis (see e.g. Barker, 1994). Effects of
fetal undernutrition on metabolic adaptation in utero may affect the phenotype such that
the risk of cardiovascular disease later in life is increased (Hales and Barker, 1992, Bateson,
2001, Gluckman and Hanson, 2004). Underlying this model is the idea that several critical
periods early in life influence the development of humans. During these periods, developing
systems modify their settings in response to social and biological cues (Kuzawa and Quinn,
2009). This includes durable epigenetic changes that modify gene expressions.
Along this way, adverse conditions are known to influence inflammation, measured in
terms of interleukin-6 production, in adolescence and adulthood, plausibly through changes
in gene expressions (see e.g. Morozink et al., 2010). An episode of hunger early in life
may thus engender a proinflammatory phenotype. Over time, this takes an allostatic toll
on the body, resulting in a higher risk of chronic diseases later in life (Morozink et al.,
2010, Miller and Chen, 2010, Miller et al., 2009, Zhang et al., 2006, Cole et al., 2010),
notably cardiovascular diseases, diabetes and hypertension. Yet, such mechanisms should
be seen as a predictive adaptive response to the future environment (Gluckman and Hanson,
2004, Cole et al., 2010). The long-run effects of reduced nutrition in utero are stronger if
the affected individuals are exposed to a much more favorable environment in childhood
(Schulz, 2010).
Of course, severely adverse nutritional conditions may also directly affect the build-up
of organs and other body parts. This involves the postneonatal period but also puberty
(see e.g. the survey by Cameron and Demerath, 2002).
The above causal pathways are all biological after the initial nutritional shortage. How-
ever, non-biological mechanisms are also possible. An episode of hunger may lead to a
permanent change in the role of food in the household. After such an episode, adults may
cook more greasy food or force their children to finish their plates by any means (see e.g.
Hamelin, Habicht and Beaudry, 1999, for changes in household behaviors in response to
food insecurity). This may cause adverse long-run health outcomes of the children. Also, an
episode of hunger may induce fights for resources and thus a higher level of stress, changing
within-household relationships and leading to a prolonged exposure to a higher stress level
(Hadley and Patil, 2006, Whitaker, Phillips and Orzol, 2006).
6
2.2 Conditions in later childhood
Recently, interest has increased in long-run effects of nutritional conditions after birth.
Gluckman, Hanson and Pinal (2005) and Barker (2007) give overviews of the underlying
medical mechanisms. Particular attention has been given to the onset of puberty as a
sensitive period. As documented and surveyed by Marshall and Tanner (1986), Gasser et
al. (1994), and Zemel (2002), the earliest manifestation of puberty concerns the so-called
“fat spurt” around age 9-10. In this spurt, the body collects resources in anticipation of the
adolescent growth spurt. Sparen et al. (2004) argue that nutritional distortions and stress
at this stage may lead to a permanent disruption of blood pressure regulation, leading
to long-run cardiovascular health problems. Other studies have related the calcium intake
around age 9 to adult height.
A nutritional shortage may also have an instantaneous adverse effect on schooling de-
cisions and outcomes (see e.g. Jyoti, Frongillo and Jones, 2005) and thus affect health
outcomes via realized education or adult socioeconomic status (Leigh, 1983). Lastly, ad-
verse conditions may affect children positively by inducing more responsible behavior. For
example, Elder (1999) investigates the impact of the Great Depression on children born in
1920-1921 and finds that the experience of economic hardship around the age of 10 led to
more resilience and psychological strength.
3 The famines in European countries in the 1940s
3.1 The Dutch famine
The Dutch famine has been studied for decades as a cause of adverse living conditions.
Therefore, the following account can be brief. The relevant literature starts with contempo-
raneous studies, notably Dols and Van Arcken (1946), who provide a detailed description
of the famine and report data on rations and agricultural production, and Banning (1946),
who focuses on public health issues.
Prior to World War II, food standards had been high in the Netherlands, both in terms
of caloric value as well as composition of the diet. There were no notable disruptions in
food availability during the first years of the occupation of the Netherlands, which started
in May, 1940. In September 1944, parts of the South of the country were liberated, and
the London-based Dutch Government in exile called out a railroad strike in the occupied
parts of the Netherlands in order to support Operation Market Garden and in order to
display its authority over the occupied nation. As a reaction, the occupying forces initiated
an embargo that prohibited any food transports to the densely populated western part of
the country, i.e. the provinces of North and South Holland and Utrecht. This sanction, in
7
combination with the early onset of the harsh winter of 1944/45, the freezing of waterways,
and the generally bad state of transport infrastructure effectively closed off the western
part of the country from any imports of food, fuel, medication etc. This triggered the Dutch
“hungerwinter”. Individuals had to live on rations as low as 500 kcal per day. For school
children, average rations amounted to 664 kcal in the first quarter of 1945. The situation
lasted until the end of the occupation which coincided with the end of World War II (early
May 1945). Immediately, rations rose to 2,400 kcal per day. Following most of the literature
on the Dutch famine, we take November 1944 to be the onset of the famine spell. This is
later than the onset of the strike in mid-September 1944.5
The excess death rate in the first half of 1945 over the rate in 1944 amounts to 269
percent for men and 173 percent for women (Dols and Van Arcken, 1946). Banning (1946)
reports a higher incidence of tuberculosis and hunger oedema and an increased infant
mortality rate. Inhabitants of large cities were struck hardest by the famine. However,
Banning (1946) notes that in small towns mortality rates rose to a level almost as high as
those in large cities. Special aid was targeted at starving children and young adults by the
“Inter-Church Council”, an organization formed of different clerical associations (first, the
focus was on children aged 5 to 16; the inclusion of children aged 3 to 5 followed later on).
Help was provided in the form of additional food rations but in addition, effort was taken
to send adversely affected children to districts where the food situation was somewhat
better. Reports on the activities of the council yield information about the situation of
the children in the famine-struck areas: Banning (1946) mentions that of the potential
candidate children examined, 29% had been severely undernourished, while 31% suffered
moderate undernourishment. About 27% of the children displayed a weight loss of about
10% of their weight.
Studies based on the Dutch famine indicate significant long-run effects on adult mor-
bidity.6 The overview in Painter, Roseboom and Bleker (2005) lists long-run effects on
the risk of cardiovascular diseases, obesity, breast cancer, cholesterol levels, diabetes, and
self-perceived health. See also the survey in Lumey, Stein and Susser (2011) for effects of
prenatal famine in particular. Lumey et al. (2007) find effects on anthropometric measures
indicative of the reposition of fat, dermatoglyphic characteristics and a modest relationship
with blood pressure. An elevated risk of schizophrenia at adult ages after prenatal expo-
sure has been found for both genders (e.g. Susser and Lin, 1992). Susser and Stein (1994)
find that adult stature is susceptible to the postnatal but not the prenatal environment.
5For school children, official rations dropped below 1,200 kcal in early November 1944 and to 1,000 kcalat the end of November 1944 (Dols and Van Arcken, 1946). On average, caloric consumption amounted to1,073 kcal in the last quarter of 1944 (Dols and Van Arcken, 1946).
6Recall that in this section we only cite studies based on the famines we consider in our empiricalanalysis. Results based on other famines are discussed in the overview studies listed in Section 1.
8
Oppers (1963) finds a negative effect of the Dutch Hunger Winter famine exposure at ages
7-14 on adult height among men. In a landmark study, Heijmans et al. (2008) show that
individuals who were exposed to the famine in the early stages of pregnancy had, 60 years
later, less DNA methylation of a certain imprinted gene, compared with their unexposed
same-sex siblings. The gene is the insulin-like growth factor II, which is a key factor in
human growth and development. Their study provides strong empirical evidence for the
epigenetic pathway discussed in Subsection 2.1 above.
3.2 The Greek famine
At the end of April 1941, Greece surrendered to Axis forces and was subsequently divided
into 13 different zones occupied by Germany, Italy, and Bulgaria.7 These areas were isolated
from each other and the transfer of goods and individuals was often close to impossible. The
famine was triggered by a naval blockade of the Allies which made it impossible to supply
foodstuffs to Greece. Despite being an agricultural country, Greece heavily relied on food
imports (Hionidou, 2006, mentions that in 1939, over 20 percent of the wheat consumption
had been imported). In addition, the blockade prohibited fishing at sea.8 The food situation
quickly deteriorated. While the caloric value of the rations allocated by the occupiers in
the Athens area had already been below any subsistence level in July 1941 (600 kcal), the
rations were cut even further such that they amounted to only 320 kcal in November 1941
(Neelsen and Stratmann, 2011). The regions of Greater Athens and Piraeus were affected
most severely. Mortality rates suggest that there was a general positive correlation between
the famine’s severity and the degree of urbanization. Furthermore, Hionidou (2006) notes
that society was very unequally affected by the famine during this period; the low social
classes suffered the most from deprivation, which can be attributed to the fact that soon
after the rationing system had been superimposed by the occupiers, black market activity
flourished with prices beyond the levels an ordinary worker could ever afford. The winter
1941/42 marked the maximum of the famine period in terms of fatalities.
The blockade was formally called off in February 1942. As of then, the Red Cross
provided assistance targeted mostly at young children in Athens (Neelsen and Stratmann,
2011). At the end of March 1942, shipments by the “Joint Relief Commission” under
Swedish command arrived. Subsequently, the situation in most parts of Greece improved.
Hionidou (2006) reports declines in excess mortality from April 1942 onwards, even though
in urban areas mortality remained high longer. We define the Greek famine to run from May
7This subsection relies heavily on Hionidou (2006) and Valaoras (1946).8In the sense that the famine was caused by an external intervention in society, and in the sense that
a large fraction of the excess mortality during the famines was due to starvation, the famines discussed inthis section are “modern famines” in the terminology of O’Grada (2009).
9
1941 until and including June 1942. The ending date is somewhat later than in Hionidou
(2006) and somewhat earlier than in Neelsen and Stratmann (2011).
Valaoras (1946) reports death rates for Athens to have been six times higher than un-
der usual circumstances. Both Valaoras (1946) and Hionidou (2006) state that the largest
fraction of the excess mortality during the famine is attributable to starvation, whereas epi-
demics and infectious diseases are of minor importance. Of special interest for our present
study are the figures cited in Valaoras (1946) on the situation of children and adolescents.
The results of surveys conducted during the famine and shortly afterwards found children
aged 4 to 14 to be massively underweight, while babies and young children up to age 4 had
almost normal weight. Moreover, growth retardation was found among many children 8 to
14 years old.
Neelsen and Stratmann (2011) consider long-run effects of the Greek famine on eco-
nomic outcomes. They find effects of exposure during infancy on the attained level of
education and on prime-aged labor market outcomes. Effects of exposure in utero are very
small.
3.3 The German famine
After World War II, Germany faced various structural problems that led to the catastrophic
situation we label the German Famine. Specifically, (i) many cities and much of the industry
and transportation infrastructure were destroyed by Allied bombardments, (ii) millions
of citizens and military had died, (iii) factories were dismantled and shipped off to the
occupying powers, (iv) the agricultural land in the East which had been a major provider
of food had been lost to Poland and the Soviet Union, (v) about 10 million refugees from the
lost lands in the East had fled to the new German mainland, and (vi) Germany was divided
into 4 occupation zones that were administered separately. Inter-zone trade was difficult
because of political and bureaucratic barriers and because of a lack of transportation
means. See Klatt (1950), Farquharson (1985), Trittel (1990), Hausser and Maugg (2009)
and Reichardt and Zierenberg (2009) for overviews.
Before World War II, estimated daily caloric consumption amounted to about 3000 kcal,
while during the war, civilians used foodstuffs of about 2500 kcal per day (Klatt, 1950). At
the end of the war (European Theater) in May 1945, nutritional conditions deteriorated
to levels far below those before or during the war. For May 1945, Trittel (1990) reports an
average caloric ration of only 1200 kcal. After May 1945, these values decreased further.
For example, in the British-administered Ruhrgebiet, only approximately 600 kcal per
person was assigned in June 1945. The situation further deteriorated during the so-called
“Hungerwinter” of 1946-47, which was an unusually cold winter. From mid-December 1946,
10
the distribution of food collapsed in many areas. Until March 1947, real average daily caloric
intake was around 800 kcal per day for some cities in the Ruhrgebiet. The crop of 1947
failed to meet the demand of the starving population, so the period of hunger lasted until
the spring of 1948, when a combination of foreign help and political reforms managed
to improve nutritional conditions. Conditions improved spectacularly with the currency
reform in June 1948. We therefore define the famine to last from June 1945 until June
1948.
As usual, the severity of the famine exhibits regional variation on top of the above-
mentioned temporal variation (see Willenborg, 1979, and the references above). Notably,
the different occupation zones were affected differentially, mostly due to differences in the
policies of the occupying powers. For example, the average daily food intake of a standard
consumer in 1946 is estimated to equal 1610, 1430, 1535, and 1340 kcal in the US, the Soviet,
the British, and the French zone, respectively, while the corresponding official food rations
equaled 1330, 1083, 1050, and 900 kcal, respectively (see Cornides, 1948, and Echternkamp,
2003).
Apart from excess deaths due to starvation, sources imply that the famine also exerted
additional adverse effects on the population. For instance, Klatt (1950) reports cases of
retarded growth of children in the Ruhrgebiet and a weight deficit among children of about
20 percent of the normal weight. The deficit was most pronounced for children above age
10. In a study of undernutrition in the city of Wuppertal, Dean (1951) analyzes birth
registers of a local hospital and reports reduced birth weights for the years of the famine
with the greatest decline for the year of 1945.
Jurges (2011) analyzes the effect of birth during the German famine on educational
attainment and occupation in the labor market in 1970. He finds strong evidence that
these outcomes are particularly adverse for those born in the winter of 1945/46. This
suggests that an indirect causal pathway from early-life conditions through education and
occupation to health later in life may be possible. Some epidemiological studies consider
cohort-specific adult health outcomes without focusing a priori on famine cohorts. Notably,
Hermanussen, Danker-Hopfe and Weber (2001) use data on male conscripts; they observe
that the 1946 cohort stands out in terms of low obesity at age 19 even though the average
weight is not much lower than for the surrounding cohorts. To a small extent, this also
applies to the cohorts born during World War II. It is possible that this is because these
cohorts faced childhood conditions that were less out of tune with conditions in utero
than the cohorts later in the German famine (recall the discussion in Subsection 2.1). In
this sense, individuals born in World War II may face less adverse long-run effects than
those born in the 1946/47 “Hungerwinter”. Onland-Moret et al. (2005) use large samples
of women from a large range of European countries. They report the average height by
11
country and by 5-year birth cohorts. The average height among women born in Germany
in 1945-49 is much lower than that in the surrounding 5-year cohorts. For Greece and the
Netherlands no such patterns are found, which is not surprising in the light of the fact that
the famine spells in those countries spanned only a small part of a 5-year interval.
4 Data
For the empirical analysis we use the Survey of Health, Aging, and Retirement in Eu-
rope (SHARE), a pan-European multidisciplinary and longitudinal data set on individuals
aged 50 and over. By 2011, three waves of SHARE have been made available. The first
two waves provide information on health, socioeconomic status, family characteristics and
well-being. The third wave (called SHARELIFE), collected in 2008 and 2009, provides de-
tailed life-cycle histories of individuals for specific thematic fields, such as employment or
accommodation.9 To date, this is the most recently available wave. Additional waves are
under construction.
Sample construction We use 5,750 individuals of the cohorts born 1920 to 1955, who
lived in Germany, the Netherlands or Greece during their youth. This excludes foreign cit-
izens as well as individuals who, due to physical and cognitive limitations, were unable to
complete the interview themselves.10 We also exclude individuals with missing information
in the outcome variables, the hunger variable or covariates. Furthermore, we lose observa-
tions where individuals deceased (≈ 3.5%) and or left the survey between waves 1 and 3
(≈ 25%). Sample attrition is high in SHARE. We treat these observations as missing at
random, keeping in mind that even if attrition was somehow related to health performance,
this would make our estimates more conservative.
One exceptional feature of SHARE is that respondents were asked whether they had
ever experienced periods of hunger in their lives and if so, in which year of their life this
period began and in which year it ended. The survey question reads “Looking back at your
life, was there a distinct period during which you suffered from hunger?”. Although this
question alludes to an unhappy period of life, nonresponse is very small and amounts to less
than 0.5%. However, the information may be prone to recall bias, since it is self-reported
and dates back many years.11 Moreover, recall bias is likely to by systematically higher if
9For general information on SHARE and SHARELIFE, see Borsch-Supan et al. (2008) and Schroder(2011).
10We drop the full proxy interviews but keep assisted interview information. Moreover, we employ thiscriterion only for the interviews yielding the outcome measures and the undernutrition indicator.
11Also, only one period of hunger can be reported, such that individuals are likely to choose the period
12
a period of severe hunger took place around birth. At the extreme, nutritional shortages
that only took place in utero can not be reported as episodes of hunger.
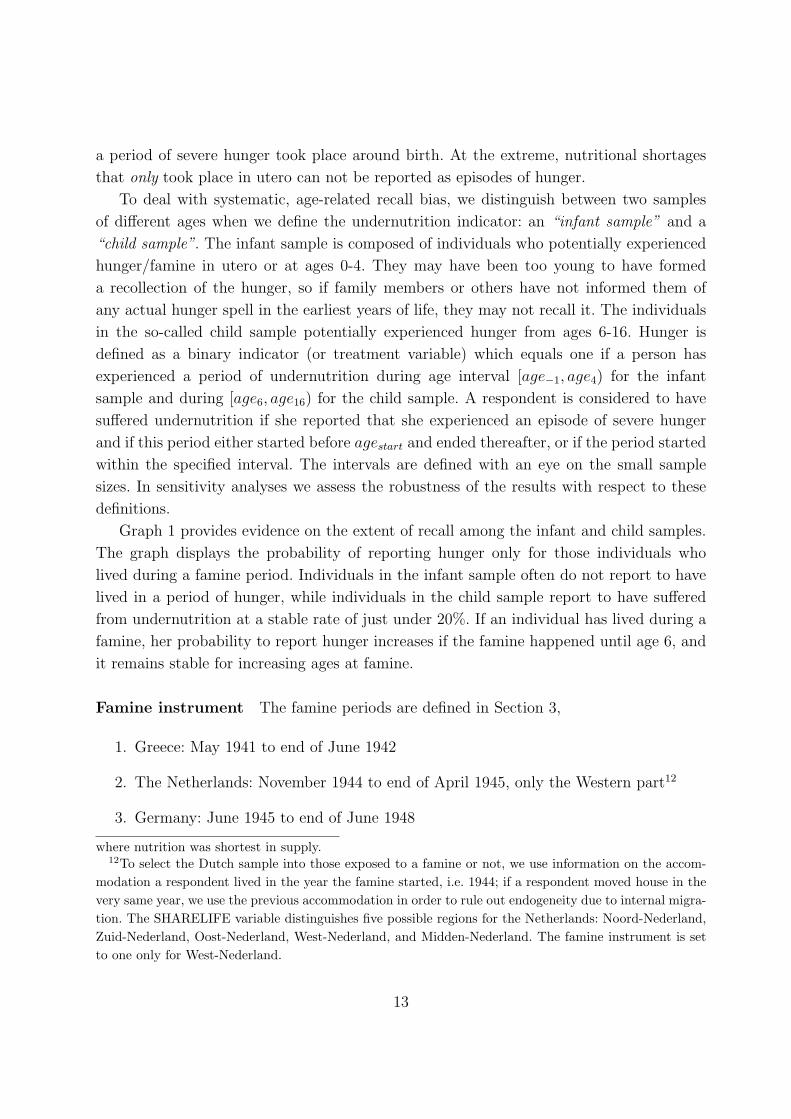
To deal with systematic, age-related recall bias, we distinguish between two samples
of different ages when we define the undernutrition indicator: an “infant sample” and a
“child sample”. The infant sample is composed of individuals who potentially experienced
hunger/famine in utero or at ages 0-4. They may have been too young to have formed
a recollection of the hunger, so if family members or others have not informed them of
any actual hunger spell in the earliest years of life, they may not recall it. The individuals
in the so-called child sample potentially experienced hunger from ages 6-16. Hunger is
defined as a binary indicator (or treatment variable) which equals one if a person has
experienced a period of undernutrition during age interval [age−1, age4) for the infant
sample and during [age6, age16) for the child sample. A respondent is considered to have
suffered undernutrition if she reported that she experienced an episode of severe hunger
and if this period either started before agestart and ended thereafter, or if the period started
within the specified interval. The intervals are defined with an eye on the small sample
sizes. In sensitivity analyses we assess the robustness of the results with respect to these
definitions.
Graph 1 provides evidence on the extent of recall among the infant and child samples.
The graph displays the probability of reporting hunger only for those individuals who
lived during a famine period. Individuals in the infant sample often do not report to have
lived in a period of hunger, while individuals in the child sample report to have suffered
from undernutrition at a stable rate of just under 20%. If an individual has lived during a
famine, her probability to report hunger increases if the famine happened until age 6, and
it remains stable for increasing ages at famine.
Famine instrument The famine periods are defined in Section 3,
1. Greece: May 1941 to end of June 1942
2. The Netherlands: November 1944 to end of April 1945, only the Western part12
3. Germany: June 1945 to end of June 1948
where nutrition was shortest in supply.12To select the Dutch sample into those exposed to a famine or not, we use information on the accom-
modation a respondent lived in the year the famine started, i.e. 1944; if a respondent moved house in thevery same year, we use the previous accommodation in order to rule out endogeneity due to internal migra-tion. The SHARELIFE variable distinguishes five possible regions for the Netherlands: Noord-Nederland,Zuid-Nederland, Oost-Nederland, West-Nederland, and Midden-Nederland. The famine instrument is setto one only for West-Nederland.
13
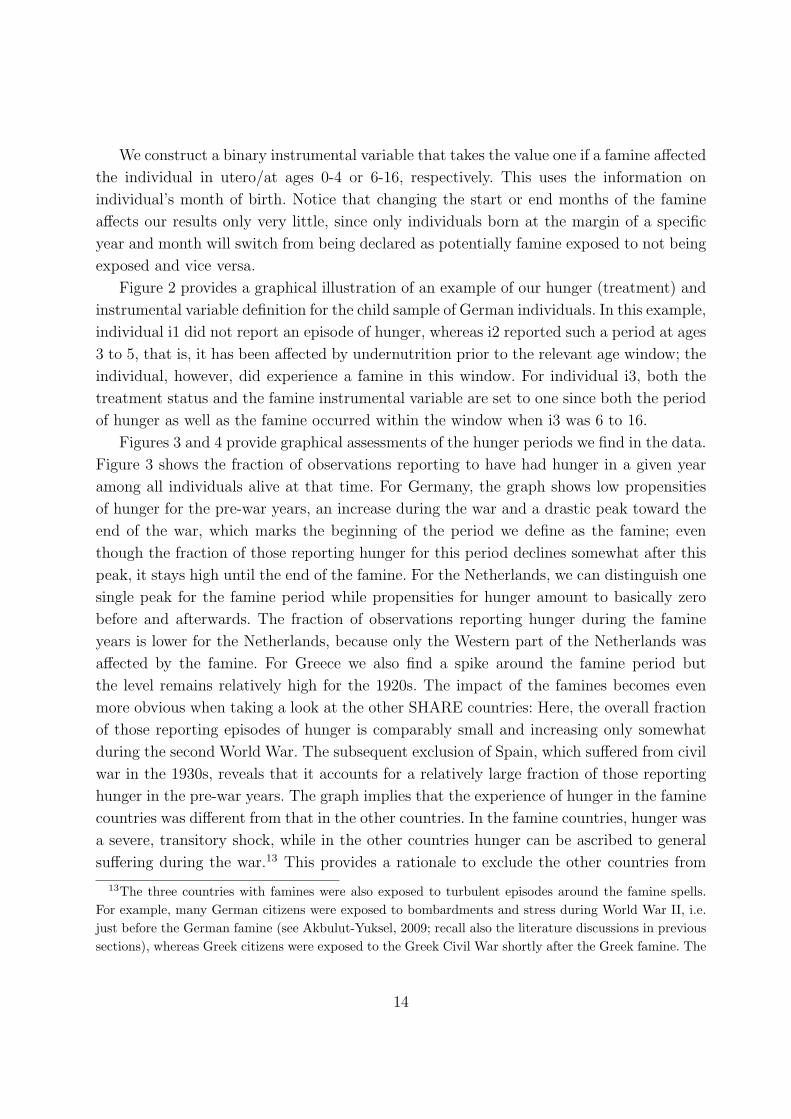
We construct a binary instrumental variable that takes the value one if a famine affected
the individual in utero/at ages 0-4 or 6-16, respectively. This uses the information on
individual’s month of birth. Notice that changing the start or end months of the famine
affects our results only very little, since only individuals born at the margin of a specific
year and month will switch from being declared as potentially famine exposed to not being
exposed and vice versa.
Figure 2 provides a graphical illustration of an example of our hunger (treatment) and
instrumental variable definition for the child sample of German individuals. In this example,
individual i1 did not report an episode of hunger, whereas i2 reported such a period at ages
3 to 5, that is, it has been affected by undernutrition prior to the relevant age window; the
individual, however, did experience a famine in this window. For individual i3, both the
treatment status and the famine instrumental variable are set to one since both the period
of hunger as well as the famine occurred within the window when i3 was 6 to 16.
Figures 3 and 4 provide graphical assessments of the hunger periods we find in the data.
Figure 3 shows the fraction of observations reporting to have had hunger in a given year
among all individuals alive at that time. For Germany, the graph shows low propensities
of hunger for the pre-war years, an increase during the war and a drastic peak toward the
end of the war, which marks the beginning of the period we define as the famine; even
though the fraction of those reporting hunger for this period declines somewhat after this
peak, it stays high until the end of the famine. For the Netherlands, we can distinguish one
single peak for the famine period while propensities for hunger amount to basically zero
before and afterwards. The fraction of observations reporting hunger during the famine
years is lower for the Netherlands, because only the Western part of the Netherlands was
affected by the famine. For Greece we also find a spike around the famine period but
the level remains relatively high for the 1920s. The impact of the famines becomes even
more obvious when taking a look at the other SHARE countries: Here, the overall fraction
of those reporting episodes of hunger is comparably small and increasing only somewhat
during the second World War. The subsequent exclusion of Spain, which suffered from civil
war in the 1930s, reveals that it accounts for a relatively large fraction of those reporting
hunger in the pre-war years. The graph implies that the experience of hunger in the famine
countries was different from that in the other countries. In the famine countries, hunger was
a severe, transitory shock, while in the other countries hunger can be ascribed to general
suffering during the war.13 This provides a rationale to exclude the other countries from
13The three countries with famines were also exposed to turbulent episodes around the famine spells.For example, many German citizens were exposed to bombardments and stress during World War II, i.e.just before the German famine (see Akbulut-Yuksel, 2009; recall also the literature discussions in previoussections), whereas Greek citizens were exposed to the Greek Civil War shortly after the Greek famine. The
14
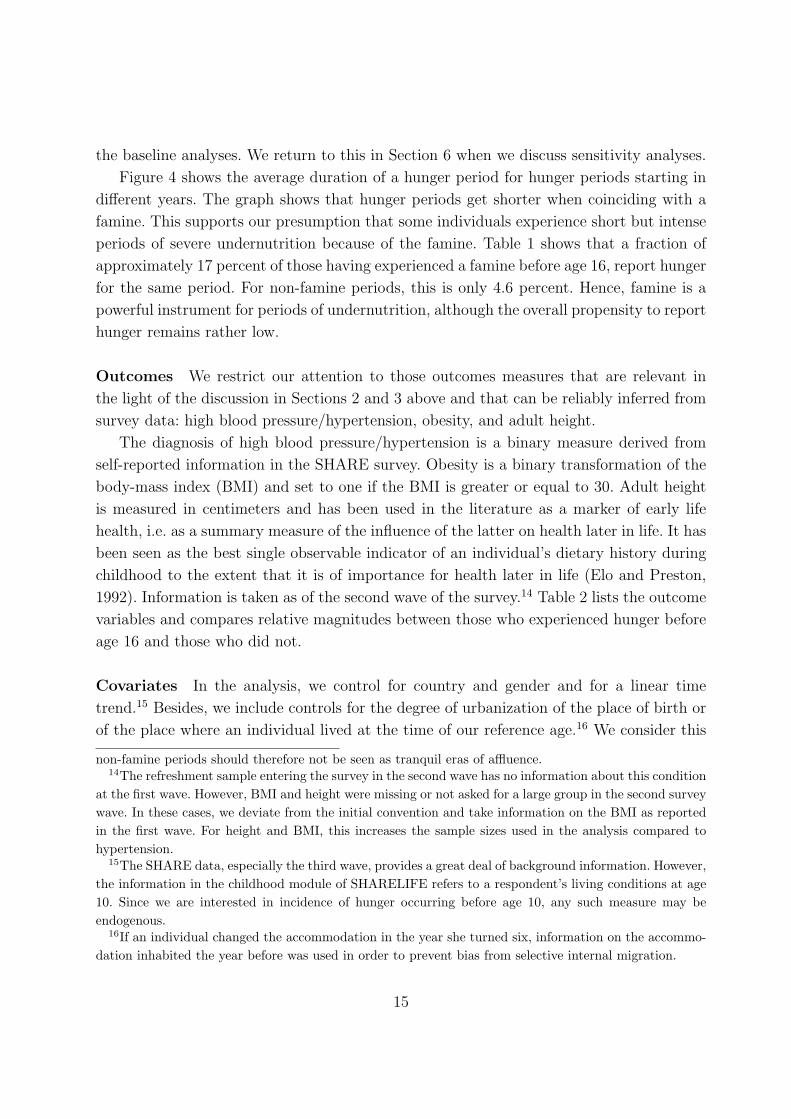
the baseline analyses. We return to this in Section 6 when we discuss sensitivity analyses.
Figure 4 shows the average duration of a hunger period for hunger periods starting in
different years. The graph shows that hunger periods get shorter when coinciding with a
famine. This supports our presumption that some individuals experience short but intense
periods of severe undernutrition because of the famine. Table 1 shows that a fraction of
approximately 17 percent of those having experienced a famine before age 16, report hunger
for the same period. For non-famine periods, this is only 4.6 percent. Hence, famine is a
powerful instrument for periods of undernutrition, although the overall propensity to report
hunger remains rather low.
Outcomes We restrict our attention to those outcomes measures that are relevant in
the light of the discussion in Sections 2 and 3 above and that can be reliably inferred from
survey data: high blood pressure/hypertension, obesity, and adult height.
The diagnosis of high blood pressure/hypertension is a binary measure derived from
self-reported information in the SHARE survey. Obesity is a binary transformation of the
body-mass index (BMI) and set to one if the BMI is greater or equal to 30. Adult height
is measured in centimeters and has been used in the literature as a marker of early life
health, i.e. as a summary measure of the influence of the latter on health later in life. It has
been seen as the best single observable indicator of an individual’s dietary history during
childhood to the extent that it is of importance for health later in life (Elo and Preston,
1992). Information is taken as of the second wave of the survey.14 Table 2 lists the outcome
variables and compares relative magnitudes between those who experienced hunger before
age 16 and those who did not.
Covariates In the analysis, we control for country and gender and for a linear time
trend.15 Besides, we include controls for the degree of urbanization of the place of birth or
of the place where an individual lived at the time of our reference age.16 We consider this
non-famine periods should therefore not be seen as tranquil eras of affluence.14The refreshment sample entering the survey in the second wave has no information about this condition
at the first wave. However, BMI and height were missing or not asked for a large group in the second surveywave. In these cases, we deviate from the initial convention and take information on the BMI as reportedin the first wave. For height and BMI, this increases the sample sizes used in the analysis compared tohypertension.
15The SHARE data, especially the third wave, provides a great deal of background information. However,the information in the childhood module of SHARELIFE refers to a respondent’s living conditions at age10. Since we are interested in incidence of hunger occurring before age 10, any such measure may beendogenous.
16If an individual changed the accommodation in the year she turned six, information on the accommo-dation inhabited the year before was used in order to prevent bias from selective internal migration.
15
information as a proxy for socio-economic background. Table 2 provides basic summary
statistics for the overall sample, for the subsample of respondents who reported an incidence
of hunger sometime before age 16, and for the subgroup which never reported an incidence
of hunger.
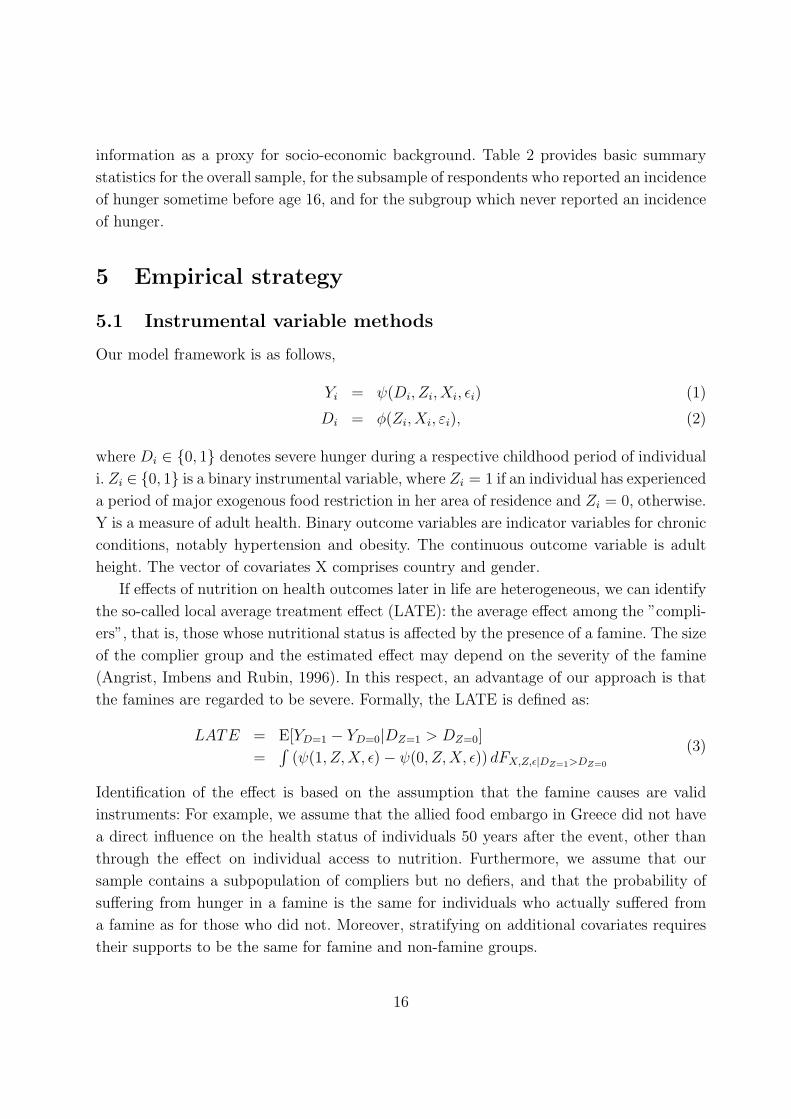
5 Empirical strategy
5.1 Instrumental variable methods
Our model framework is as follows,
Yi = ψ(Di, Zi, Xi, εi) (1)
Di = φ(Zi, Xi, εi), (2)
where Di ∈ {0, 1} denotes severe hunger during a respective childhood period of individual
i. Zi ∈ {0, 1} is a binary instrumental variable, where Zi = 1 if an individual has experienced
a period of major exogenous food restriction in her area of residence and Zi = 0, otherwise.
Y is a measure of adult health. Binary outcome variables are indicator variables for chronic
conditions, notably hypertension and obesity. The continuous outcome variable is adult
height. The vector of covariates X comprises country and gender.
If effects of nutrition on health outcomes later in life are heterogeneous, we can identify
the so-called local average treatment effect (LATE): the average effect among the ”compli-
ers”, that is, those whose nutritional status is affected by the presence of a famine. The size
of the complier group and the estimated effect may depend on the severity of the famine
(Angrist, Imbens and Rubin, 1996). In this respect, an advantage of our approach is that
the famines are regarded to be severe. Formally, the LATE is defined as:
LATE = E[YD=1 − YD=0|DZ=1 > DZ=0]
=∫
(ψ(1, Z,X, ε)− ψ(0, Z,X, ε)) dFX,Z,ε|DZ=1>DZ=0
(3)
Identification of the effect is based on the assumption that the famine causes are valid
instruments: For example, we assume that the allied food embargo in Greece did not have
a direct influence on the health status of individuals 50 years after the event, other than
through the effect on individual access to nutrition. Furthermore, we assume that our
sample contains a subpopulation of compliers but no defiers, and that the probability of
suffering from hunger in a famine is the same for individuals who actually suffered from
a famine as for those who did not. Moreover, stratifying on additional covariates requires
their supports to be the same for famine and non-famine groups.
16
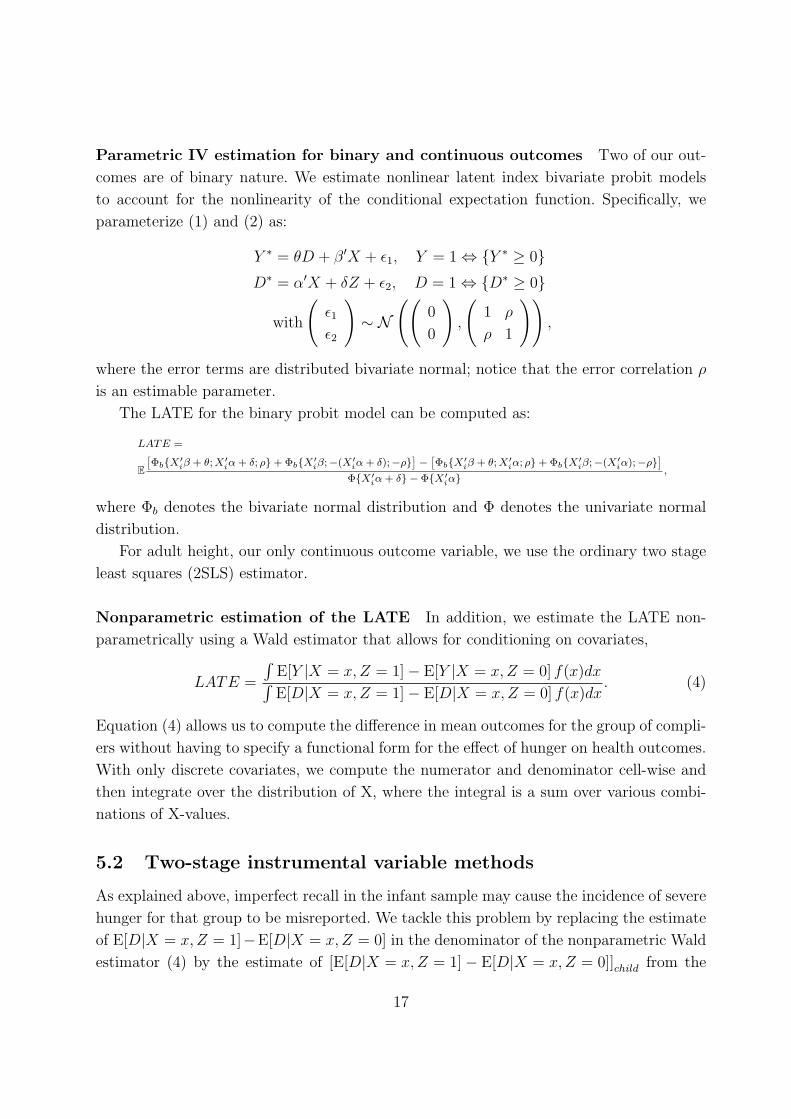
Parametric IV estimation for binary and continuous outcomes Two of our out-
comes are of binary nature. We estimate nonlinear latent index bivariate probit models
to account for the nonlinearity of the conditional expectation function. Specifically, we
parameterize (1) and (2) as:
Y ∗ = θD + β′X + ε1, Y = 1 ⇔ {Y ∗ ≥ 0}D∗ = α′X + δZ + ε2, D = 1 ⇔ {D∗ ≥ 0}
with
(ε1
ε2
)∼ N
((0
0
),
(1 ρ
ρ 1
)),
where the error terms are distributed bivariate normal; notice that the error correlation ρ
is an estimable parameter.
The LATE for the binary probit model can be computed as:
LATE =
E[Φb{X′
iβ + θ; X′iα + δ; ρ}+ Φb{X′
iβ;−(X′iα + δ);−ρ}]− [
Φb{X′iβ + θ; X′
iα; ρ}+ Φb{X′iβ;−(X′
iα);−ρ}]
Φ{X′iα + δ} − Φ{X′
iα},
where Φb denotes the bivariate normal distribution and Φ denotes the univariate normal
distribution.
For adult height, our only continuous outcome variable, we use the ordinary two stage
least squares (2SLS) estimator.
Nonparametric estimation of the LATE In addition, we estimate the LATE non-
parametrically using a Wald estimator that allows for conditioning on covariates,
LATE =
∫E[Y |X = x, Z = 1]− E[Y |X = x, Z = 0] f(x)dx∫E[D|X = x, Z = 1]− E[D|X = x, Z = 0] f(x)dx
. (4)
Equation (4) allows us to compute the difference in mean outcomes for the group of compli-
ers without having to specify a functional form for the effect of hunger on health outcomes.
With only discrete covariates, we compute the numerator and denominator cell-wise and
then integrate over the distribution of X, where the integral is a sum over various combi-
nations of X-values.
5.2 Two-stage instrumental variable methods
As explained above, imperfect recall in the infant sample may cause the incidence of severe
hunger for that group to be misreported. We tackle this problem by replacing the estimate
of E[D|X = x, Z = 1]−E[D|X = x, Z = 0] in the denominator of the nonparametric Wald
estimator (4) by the estimate of [E[D|X = x, Z = 1]− E[D|X = x, Z = 0]]child from the
17
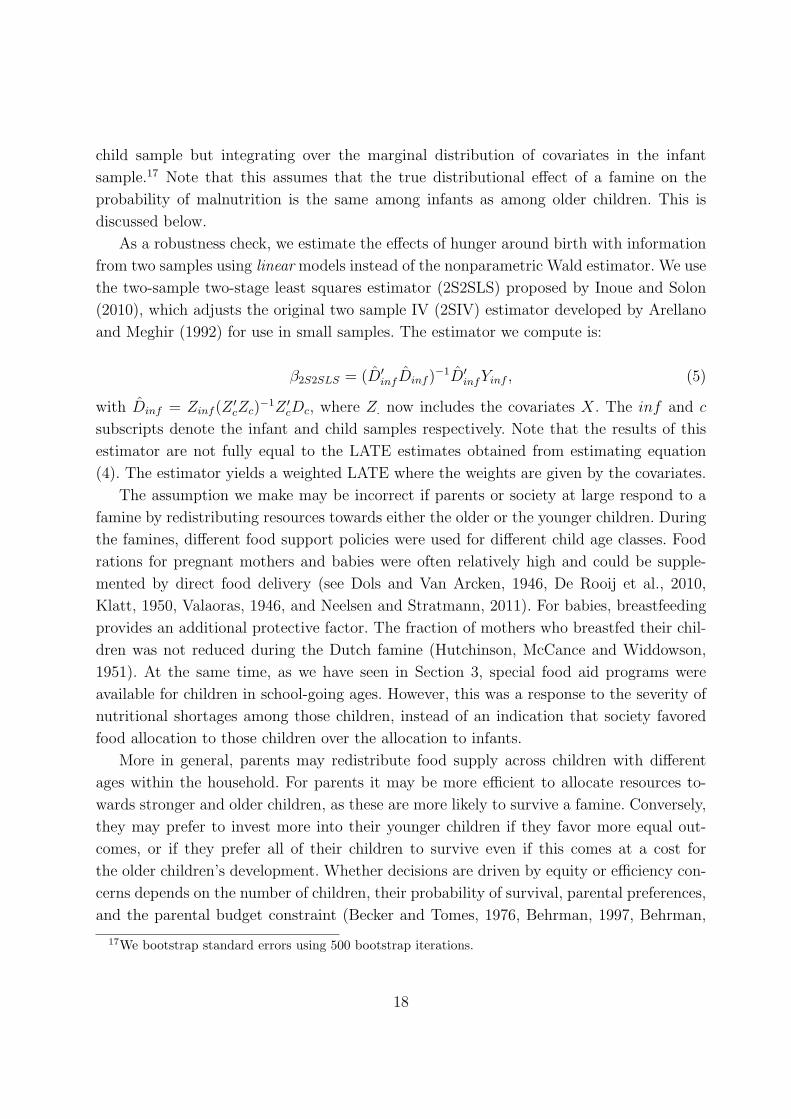
child sample but integrating over the marginal distribution of covariates in the infant
sample.17 Note that this assumes that the true distributional effect of a famine on the
probability of malnutrition is the same among infants as among older children. This is
discussed below.
As a robustness check, we estimate the effects of hunger around birth with information
from two samples using linear models instead of the nonparametric Wald estimator. We use
the two-sample two-stage least squares estimator (2S2SLS) proposed by Inoue and Solon
(2010), which adjusts the original two sample IV (2SIV) estimator developed by Arellano
and Meghir (1992) for use in small samples. The estimator we compute is:
β2S2SLS = (D′infDinf )
−1D′infYinf , (5)
with Dinf = Zinf (Z′cZc)
−1Z ′cDc, where Z. now includes the covariates X. The inf and c
subscripts denote the infant and child samples respectively. Note that the results of this
estimator are not fully equal to the LATE estimates obtained from estimating equation
(4). The estimator yields a weighted LATE where the weights are given by the covariates.
The assumption we make may be incorrect if parents or society at large respond to a
famine by redistributing resources towards either the older or the younger children. During
the famines, different food support policies were used for different child age classes. Food
rations for pregnant mothers and babies were often relatively high and could be supple-
mented by direct food delivery (see Dols and Van Arcken, 1946, De Rooij et al., 2010,
Klatt, 1950, Valaoras, 1946, and Neelsen and Stratmann, 2011). For babies, breastfeeding
provides an additional protective factor. The fraction of mothers who breastfed their chil-
dren was not reduced during the Dutch famine (Hutchinson, McCance and Widdowson,
1951). At the same time, as we have seen in Section 3, special food aid programs were
available for children in school-going ages. However, this was a response to the severity of
nutritional shortages among those children, instead of an indication that society favored
food allocation to those children over the allocation to infants.
More in general, parents may redistribute food supply across children with different
ages within the household. For parents it may be more efficient to allocate resources to-
wards stronger and older children, as these are more likely to survive a famine. Conversely,
they may prefer to invest more into their younger children if they favor more equal out-
comes, or if they prefer all of their children to survive even if this comes at a cost for
the older children’s development. Whether decisions are driven by equity or efficiency con-
cerns depends on the number of children, their probability of survival, parental preferences,
and the parental budget constraint (Becker and Tomes, 1976, Behrman, 1997, Behrman,
17We bootstrap standard errors using 500 bootstrap iterations.
18
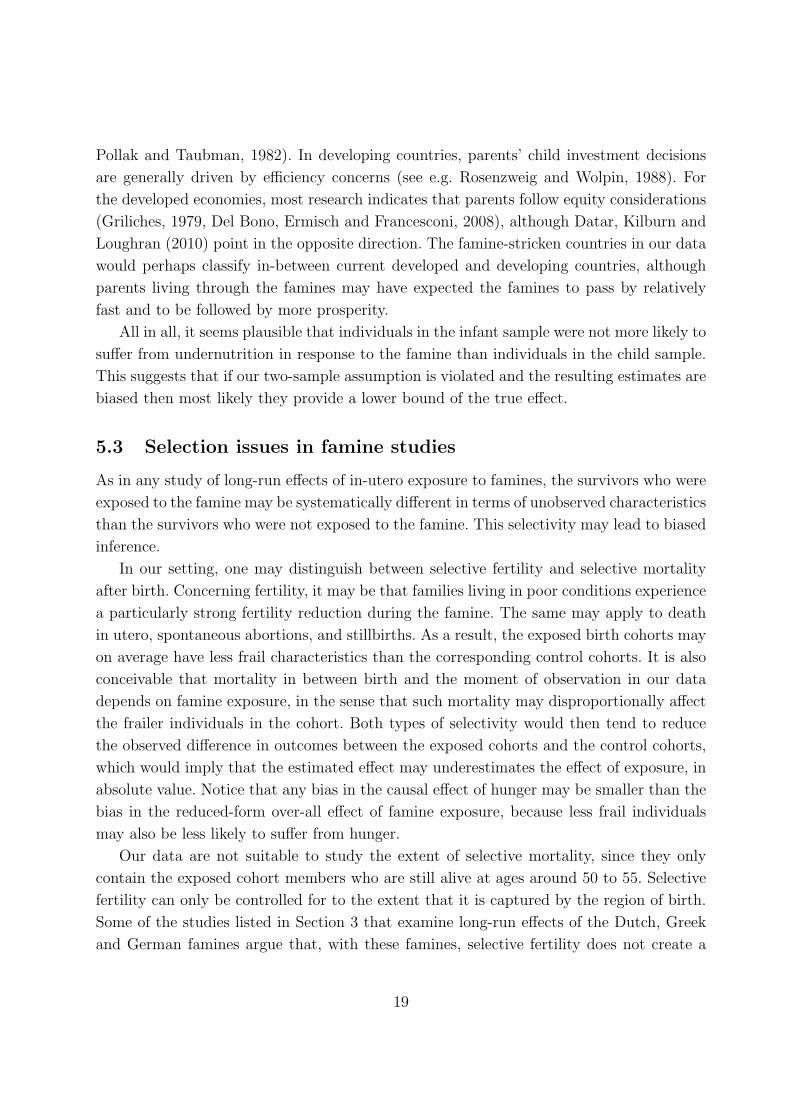
Pollak and Taubman, 1982). In developing countries, parents’ child investment decisions
are generally driven by efficiency concerns (see e.g. Rosenzweig and Wolpin, 1988). For
the developed economies, most research indicates that parents follow equity considerations
(Griliches, 1979, Del Bono, Ermisch and Francesconi, 2008), although Datar, Kilburn and
Loughran (2010) point in the opposite direction. The famine-stricken countries in our data
would perhaps classify in-between current developed and developing countries, although
parents living through the famines may have expected the famines to pass by relatively
fast and to be followed by more prosperity.
All in all, it seems plausible that individuals in the infant sample were not more likely to
suffer from undernutrition in response to the famine than individuals in the child sample.
This suggests that if our two-sample assumption is violated and the resulting estimates are
biased then most likely they provide a lower bound of the true effect.
5.3 Selection issues in famine studies
As in any study of long-run effects of in-utero exposure to famines, the survivors who were
exposed to the famine may be systematically different in terms of unobserved characteristics
than the survivors who were not exposed to the famine. This selectivity may lead to biased
inference.
In our setting, one may distinguish between selective fertility and selective mortality
after birth. Concerning fertility, it may be that families living in poor conditions experience
a particularly strong fertility reduction during the famine. The same may apply to death
in utero, spontaneous abortions, and stillbirths. As a result, the exposed birth cohorts may
on average have less frail characteristics than the corresponding control cohorts. It is also
conceivable that mortality in between birth and the moment of observation in our data
depends on famine exposure, in the sense that such mortality may disproportionally affect
the frailer individuals in the cohort. Both types of selectivity would then tend to reduce
the observed difference in outcomes between the exposed cohorts and the control cohorts,
which would imply that the estimated effect may underestimates the effect of exposure, in
absolute value. Notice that any bias in the causal effect of hunger may be smaller than the
bias in the reduced-form over-all effect of famine exposure, because less frail individuals
may also be less likely to suffer from hunger.
Our data are not suitable to study the extent of selective mortality, since they only
contain the exposed cohort members who are still alive at ages around 50 to 55. Selective
fertility can only be controlled for to the extent that it is captured by the region of birth.
Some of the studies listed in Section 3 that examine long-run effects of the Dutch, Greek
and German famines argue that, with these famines, selective fertility does not create a
19
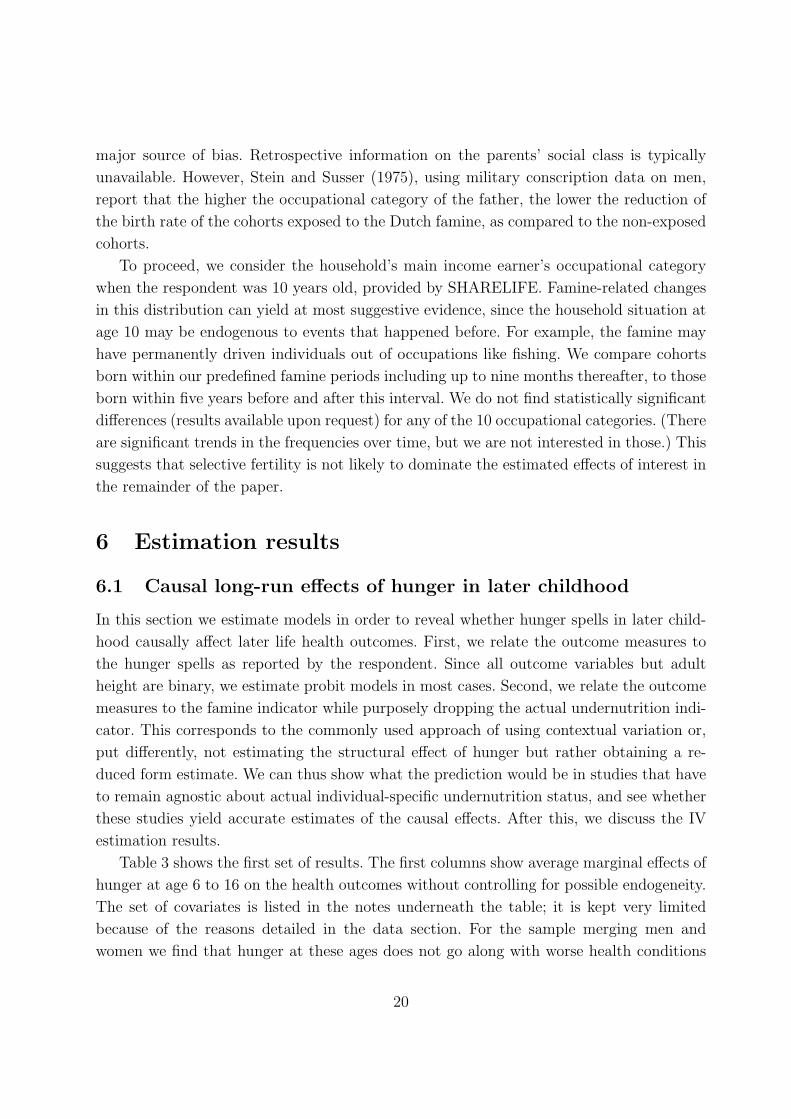
major source of bias. Retrospective information on the parents’ social class is typically
unavailable. However, Stein and Susser (1975), using military conscription data on men,
report that the higher the occupational category of the father, the lower the reduction of
the birth rate of the cohorts exposed to the Dutch famine, as compared to the non-exposed
cohorts.
To proceed, we consider the household’s main income earner’s occupational category
when the respondent was 10 years old, provided by SHARELIFE. Famine-related changes
in this distribution can yield at most suggestive evidence, since the household situation at
age 10 may be endogenous to events that happened before. For example, the famine may
have permanently driven individuals out of occupations like fishing. We compare cohorts
born within our predefined famine periods including up to nine months thereafter, to those
born within five years before and after this interval. We do not find statistically significant
differences (results available upon request) for any of the 10 occupational categories. (There
are significant trends in the frequencies over time, but we are not interested in those.) This
suggests that selective fertility is not likely to dominate the estimated effects of interest in
the remainder of the paper.
6 Estimation results
6.1 Causal long-run effects of hunger in later childhood
In this section we estimate models in order to reveal whether hunger spells in later child-
hood causally affect later life health outcomes. First, we relate the outcome measures to
the hunger spells as reported by the respondent. Since all outcome variables but adult
height are binary, we estimate probit models in most cases. Second, we relate the outcome
measures to the famine indicator while purposely dropping the actual undernutrition indi-
cator. This corresponds to the commonly used approach of using contextual variation or,
put differently, not estimating the structural effect of hunger but rather obtaining a re-
duced form estimate. We can thus show what the prediction would be in studies that have
to remain agnostic about actual individual-specific undernutrition status, and see whether
these studies yield accurate estimates of the causal effects. After this, we discuss the IV
estimation results.
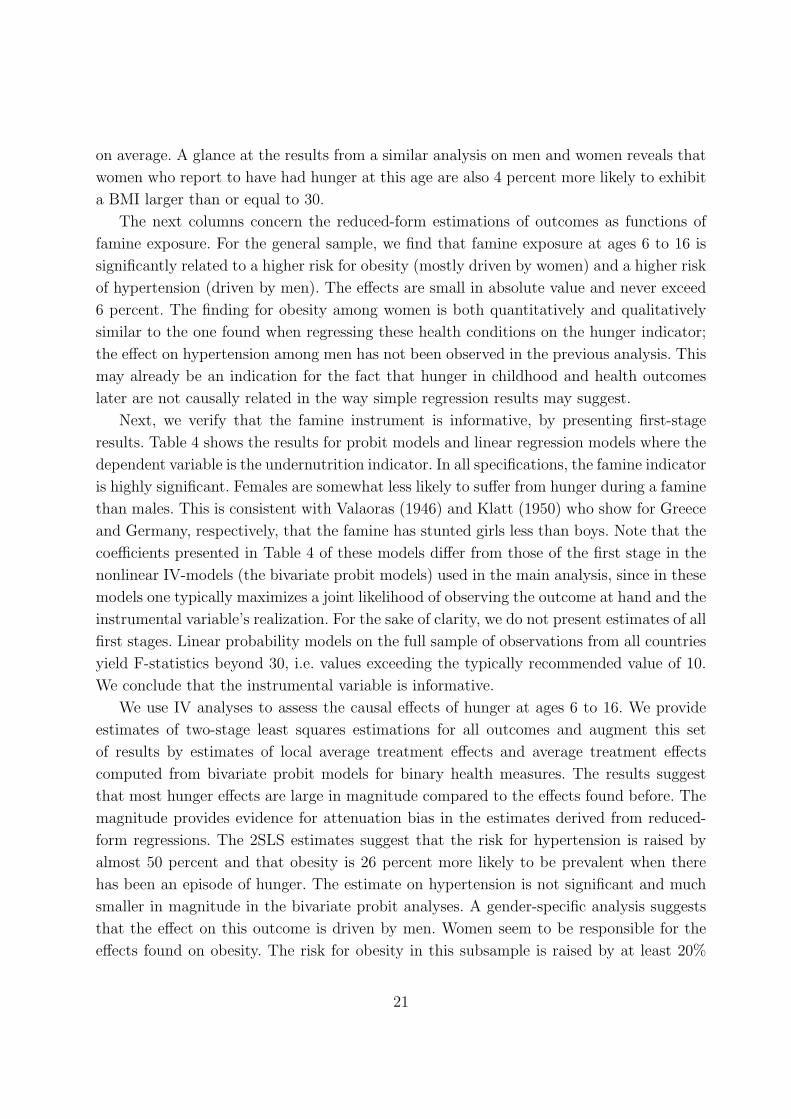
Table 3 shows the first set of results. The first columns show average marginal effects of
hunger at age 6 to 16 on the health outcomes without controlling for possible endogeneity.
The set of covariates is listed in the notes underneath the table; it is kept very limited
because of the reasons detailed in the data section. For the sample merging men and
women we find that hunger at these ages does not go along with worse health conditions
20
on average. A glance at the results from a similar analysis on men and women reveals that
women who report to have had hunger at this age are also 4 percent more likely to exhibit
a BMI larger than or equal to 30.
The next columns concern the reduced-form estimations of outcomes as functions of
famine exposure. For the general sample, we find that famine exposure at ages 6 to 16 is
significantly related to a higher risk for obesity (mostly driven by women) and a higher risk
of hypertension (driven by men). The effects are small in absolute value and never exceed
6 percent. The finding for obesity among women is both quantitatively and qualitatively
similar to the one found when regressing these health conditions on the hunger indicator;
the effect on hypertension among men has not been observed in the previous analysis. This
may already be an indication for the fact that hunger in childhood and health outcomes
later are not causally related in the way simple regression results may suggest.
Next, we verify that the famine instrument is informative, by presenting first-stage
results. Table 4 shows the results for probit models and linear regression models where the
dependent variable is the undernutrition indicator. In all specifications, the famine indicator
is highly significant. Females are somewhat less likely to suffer from hunger during a famine
than males. This is consistent with Valaoras (1946) and Klatt (1950) who show for Greece
and Germany, respectively, that the famine has stunted girls less than boys. Note that the
coefficients presented in Table 4 of these models differ from those of the first stage in the
nonlinear IV-models (the bivariate probit models) used in the main analysis, since in these
models one typically maximizes a joint likelihood of observing the outcome at hand and the
instrumental variable’s realization. For the sake of clarity, we do not present estimates of all
first stages. Linear probability models on the full sample of observations from all countries
yield F-statistics beyond 30, i.e. values exceeding the typically recommended value of 10.
We conclude that the instrumental variable is informative.
We use IV analyses to assess the causal effects of hunger at ages 6 to 16. We provide
estimates of two-stage least squares estimations for all outcomes and augment this set
of results by estimates of local average treatment effects and average treatment effects
computed from bivariate probit models for binary health measures. The results suggest
that most hunger effects are large in magnitude compared to the effects found before. The
magnitude provides evidence for attenuation bias in the estimates derived from reduced-
form regressions. The 2SLS estimates suggest that the risk for hypertension is raised by
almost 50 percent and that obesity is 26 percent more likely to be prevalent when there
has been an episode of hunger. The estimate on hypertension is not significant and much
smaller in magnitude in the bivariate probit analyses. A gender-specific analysis suggests
that the effect on this outcome is driven by men. Women seem to be responsible for the
effects found on obesity. The risk for obesity in this subsample is raised by at least 20%
21
when employing the conservative measure derived after bivariate probit models; this means
an increase of 15 percentage points relative to the effect measured via the common approach
using contextual famine exposure only. Some of the estimates are nonsensical and seem to
have been affected by the various functional form assumptions that we have employed.
We test the robustness of the above results by replacing the binary famine instrument
with the length of famine exposure within the defined age interval in months; we rescale
this variable by dividing by twelve. We should note that we use this reformulation of the
instrument to account for a further dimension of the famine exposure, namely severity.
The validity of this proxy is, however, debatable. The length of exposure in our opinion
is only an inferior way of including this aspect in our analysis, but it is probably the only
one. Estimating the same models as before with the new instrument produces effects as
depicted in Table 5. The results remain unchanged in almost every respect. We still find
a positive effect of hunger on female obesity throughout all models. In the subsample of
men, hypertension appears to be significantly affected only when using linear models.
As we have documented in the descriptive statistics presented above, individuals who
report experiences of hunger are on average older than those who do not. This could affect
the estimated health effects. We have computed the same set of results presented above
after dropping cohorts born after 1945 from the sample; doing so approximately balances
the average age between both groups. On the other hand, one should keep in mind that the
older cohorts remaining in the sample may to a greater extent be a dynamically selected
sample. The results of this analysis suggest that the effects on hypertension among men
and on obesity among women are robust and even enhanced (the LATEs and ATEs on
hypertension computed after bivariate probit models are highly significant). The other IV
estimates largely remain unchanged by this modification.
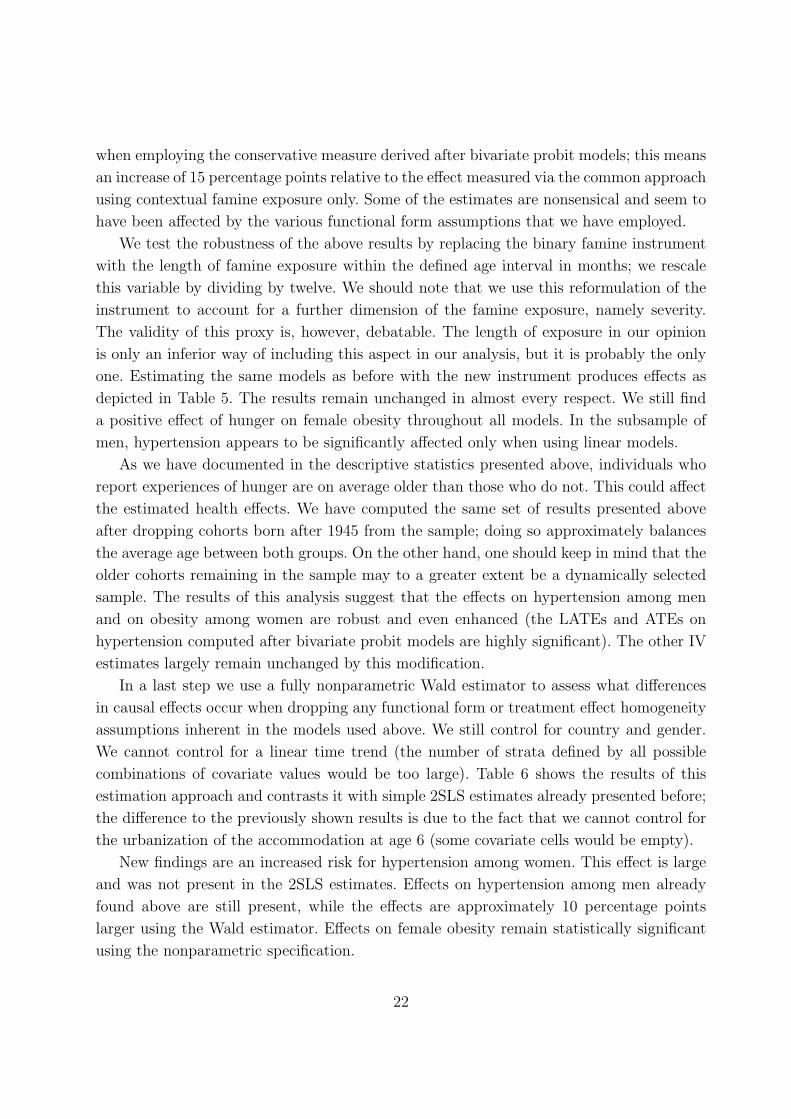
In a last step we use a fully nonparametric Wald estimator to assess what differences
in causal effects occur when dropping any functional form or treatment effect homogeneity
assumptions inherent in the models used above. We still control for country and gender.
We cannot control for a linear time trend (the number of strata defined by all possible
combinations of covariate values would be too large). Table 6 shows the results of this
estimation approach and contrasts it with simple 2SLS estimates already presented before;
the difference to the previously shown results is due to the fact that we cannot control for
the urbanization of the accommodation at age 6 (some covariate cells would be empty).
New findings are an increased risk for hypertension among women. This effect is large
and was not present in the 2SLS estimates. Effects on hypertension among men already
found above are still present, while the effects are approximately 10 percentage points
larger using the Wald estimator. Effects on female obesity remain statistically significant
using the nonparametric specification.
22
We also notice that the Wald estimator gives large and significantly negative effects of
hunger in this age interval on adult height, for both men and women. These effects are not
present in the parametric results. They may be due to the parametric assumptions used in
2SLS, or it may be due to the omission of a time trend when using the Wald estimator. We
may address the latter to some extent using the following ad-hoc approach. In a first step,
height is regressed on a time trend. The residuals are then used as the dependent variable
in regressions using the Wald estimator. As expected, doing so reduces the effects on adult
height.
We have seen above that bivariate probit models produced relatively small point es-
timates. The Wald estimator, however, shows effects that resemble the comparably large
2SLS coefficients. This suggests that attenuation bias in reduced form coefficients of a
contextual famine indicator is large; the effects of hunger on hypertension among men
(obesity among women) computed via 2SLS models reported in Table 6 are 25 (44) per-
centage points larger than comparable reduced form estimates from linear models.18 In
relative terms, the causal effects exceed the reduced form estimates by a factor of about 3
and 8 in the case of the effects of hunger on hypertension among men and obesity among
women, respectively.
In order to see what difference balancing the average age in the hunger and non-hunger
groups makes, we again dropped cohorts born after 1945 and performed an analogous
analysis. The effects show similar patterns as documented when using the whole sample.
6.2 Causal long-run effects of hunger around birth
The analysis so far has used retrospective information on hunger experiences in childhood.
The self-reported nature of this information precludes an analogous approach when ana-
lyzing hunger effects in the very first years of life. We thus proceed as detailed above by
estimating hunger propensities conditional on background factors for the first years of life
by using information on the famines’ impact on cohorts born earlier. We report findings
for famine exposure in the first four years of life and pool this information with poten-
tial exposure in utero. Gestation is defined to begin nine months before birth. We require
gestation and the famine period to overlap more than two months in order to preclude
additional noise. For Dutch individuals we take the region of the accommodation at birth
as a criterion for famine exposure and set it to one when this accommodation was located
in the Western part of the Netherlands.
18The reduced form estimates reported in Table 3 are not fully comparable to the effects in 2SLS models,since they are computed after probit models, i.e. under the assumption of non-linearity. The reduced formestimates implied by linear specifications are, as displayed here, slightly larger than those from non-linearmodels. They amount to 13 percent for hypertension among men and 6 percent for obesity among women.
23
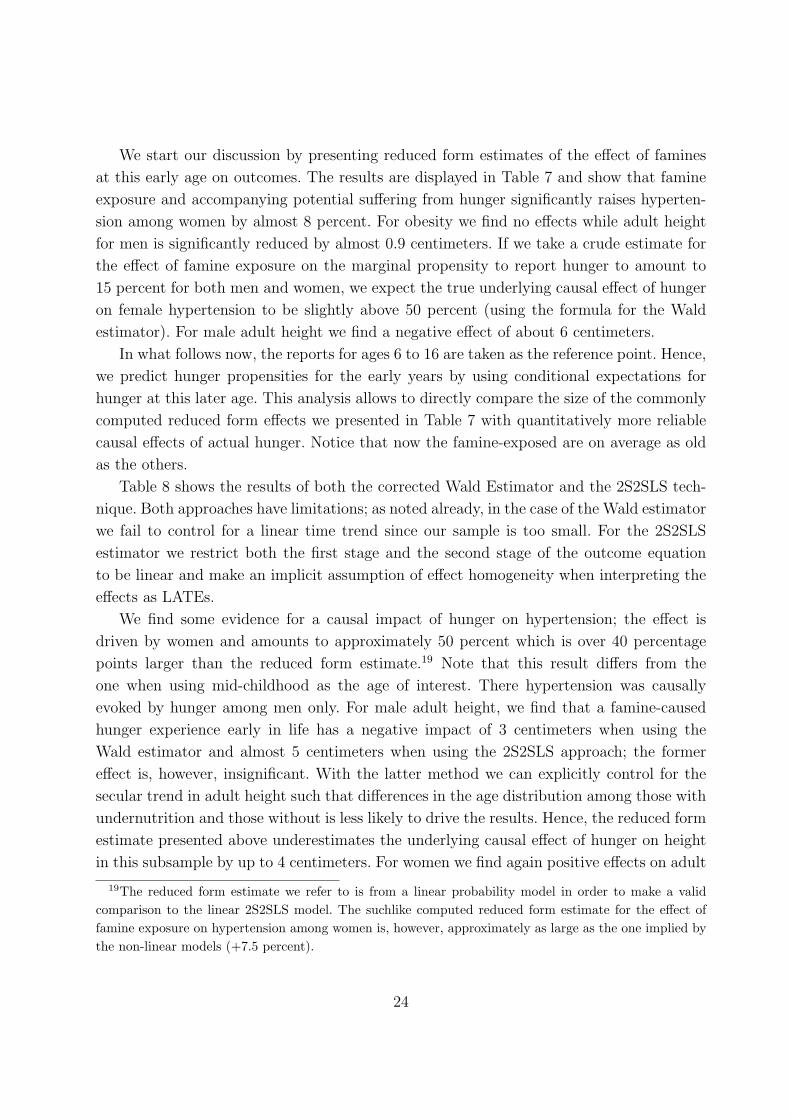
We start our discussion by presenting reduced form estimates of the effect of famines
at this early age on outcomes. The results are displayed in Table 7 and show that famine
exposure and accompanying potential suffering from hunger significantly raises hyperten-
sion among women by almost 8 percent. For obesity we find no effects while adult height
for men is significantly reduced by almost 0.9 centimeters. If we take a crude estimate for
the effect of famine exposure on the marginal propensity to report hunger to amount to
15 percent for both men and women, we expect the true underlying causal effect of hunger
on female hypertension to be slightly above 50 percent (using the formula for the Wald
estimator). For male adult height we find a negative effect of about 6 centimeters.
In what follows now, the reports for ages 6 to 16 are taken as the reference point. Hence,
we predict hunger propensities for the early years by using conditional expectations for
hunger at this later age. This analysis allows to directly compare the size of the commonly
computed reduced form effects we presented in Table 7 with quantitatively more reliable
causal effects of actual hunger. Notice that now the famine-exposed are on average as old
as the others.
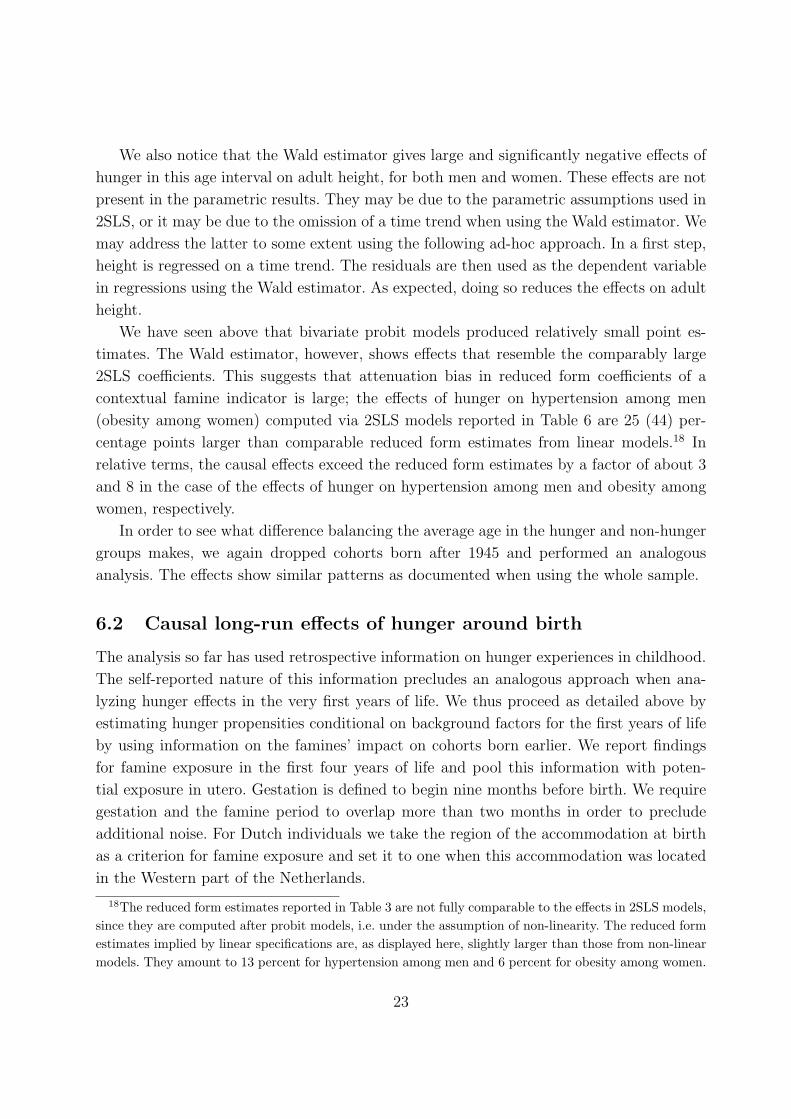
Table 8 shows the results of both the corrected Wald Estimator and the 2S2SLS tech-
nique. Both approaches have limitations; as noted already, in the case of the Wald estimator
we fail to control for a linear time trend since our sample is too small. For the 2S2SLS
estimator we restrict both the first stage and the second stage of the outcome equation
to be linear and make an implicit assumption of effect homogeneity when interpreting the
effects as LATEs.
We find some evidence for a causal impact of hunger on hypertension; the effect is
driven by women and amounts to approximately 50 percent which is over 40 percentage
points larger than the reduced form estimate.19 Note that this result differs from the
one when using mid-childhood as the age of interest. There hypertension was causally
evoked by hunger among men only. For male adult height, we find that a famine-caused
hunger experience early in life has a negative impact of 3 centimeters when using the
Wald estimator and almost 5 centimeters when using the 2S2SLS approach; the former
effect is, however, insignificant. With the latter method we can explicitly control for the
secular trend in adult height such that differences in the age distribution among those with
undernutrition and those without is less likely to drive the results. Hence, the reduced form
estimate presented above underestimates the underlying causal effect of hunger on height
in this subsample by up to 4 centimeters. For women we find again positive effects on adult
19The reduced form estimate we refer to is from a linear probability model in order to make a validcomparison to the linear 2S2SLS model. The suchlike computed reduced form estimate for the effect offamine exposure on hypertension among women is, however, approximately as large as the one implied bythe non-linear models (+7.5 percent).
24
height which are, however, not significant.
We analyze the relevance of a secular growth in adult height and neglecting it when using
the Wald estimator further by the above introduced approach of detrending height. Using
this method we still find that hunger in very early childhood significantly reduces male
adult height by over 3.3 centimeters. For women we still find a positive but insignificant
effect.
Using data from other countries Recall that the famines we consider took place
around the time of World War II and its aftermath. To examine whether the estimated
effects reflect the effect of the turbulences around the war instead of the famine, we perform
a placebo test and a sensitivity analysis. In the placebo test, we select Belgium, France,
and Italy as “clones” for the Netherlands, Germany, and Greece, respectively, and pretend
that each of these countries was exposed to a famine in the same period as its companion
country. We select SHARE samples for these countries analogous to the description in
Section 4. We first estimate a first stage, i.e. the effect of pseudo famine exposure on the
probability to report hunger for ages 6 to 16. These turn out to be statistically significant;
however, the size of the effects is less than half the size we find in the original analysis. As
noted in Section 4, this may reflect the effect of World War II and its aftermath in Belgium,
France and Italy. Next, we estimate placebo reduced-form relationships of pseudo famine
exposure on health outcomes for both ages 6 to 16 and in utero to age 4. These results
(available upon request) provide no significant evidence along the lines of the patterns we
found in the main analyses. Clearly, this confirms that we identify causal effects of hunger,
in the main analyses in this section.
To proceed, we add Belgium, Italy and France as famine-free countries to the sample
from the Netherlands, Greece and Germany, and we perform reduced-form estimations on
this extended sample. Since these countries also experienced turbulent conditions around
World War II, we would expect the reduced-form impacts of the famine to lose size and
precision compared to the baseline results, if the baseline results were driven by these
turbulences rather than by the famine. It turns out that for all means and purposes, the
results are the same as in the original analysis, for either age interval. If anything, the
estimates slightly gain in precision, which can be attributed to the increase in the sample
size. This confirms that the results are not driven by exposure early in life to adverse
non-famine conditions.
Additional sensitivity analyses In addition to the sensitivity analyses discussed so
far, we performed a range of estimations to assess the robustness of the results with re-
spect to a number of assumptions and decisions concerning the operationalization of the
25
key variables. This concerns, first of all, the precise starting and ending dates of each of the
famines. For example, for Germany, one may argue that May 1945 should be included in the
famine period. Secondly, we may vary the age intervals within which early-life conditions
are assumed to extern their influence. For example, we may exclude in utero from the age
interval that merges in utero with age 0-4. or we may exclude age 4 from these intervals,
or consider the age interval 7-15 instead of 6-16. Moreover, we may drop our measure of
urbanization at the reference age from the covariates in order to see whether results are
sensitive to this change. Concerning the outcome measures, we may trim extreme values. It
turns out that all results are insensitive with respect to such changes (results are available
upon request). The “in utero” age interval for exposure (using the recording of hunger in
the birth year) does not give a sufficient number of exposed individuals for a meaningful
analysis. Finally, we perform separate estimations by country. It turns out that the esti-
mates are imprecise, with large standard errors and point estimates that are insignificantly
different from zero with sometimes counter-intuitive signs (results available upon request).
This confirms that the current samples by country are too small for meaningful analyses.
Notice also that results by country are more sensitive to effects of cohort-specific events.
7 Conclusions
This paper investigates the causal effect of undernutrition in infancy and childhood on
adult health outcomes using instrumental variable estimation. We deal with the problem of
selective recall and systematic underreporting of hunger periods in utero or infancy by using
two-sample IV estimation. Specifically, we estimate the probability to report hunger when
exposed to a famine around birth by examining the observed association between hunger
and famine at teenage ages. To this end, we adjust the nonparametric Wald estimator for
estimation on data from two different samples. We bootstrap the standard errors.
Our results indicate that the effects of undernutrition on adult health are heterogeneous
by gender. For women aged 6-16 we find that undernutrition leads to substantially higher
levels of obesity risk and blood pressure at high ages. Men also face a higher level of
blood pressure at high ages. For both men and women aged 6-16, the nonparametric Wald
estimator produces an average adult-height effect of undernutrition of about 6 cm. However,
the estimator does not take account of the secular time trend in height, and it is likely that
the estimates over-estimate the actual height reduction due to undernutrition.
If restricted in nutritional supply in the interval from in utero until age 4, women are
estimated to be almost 42 percentage points more likely to suffer from hypertension in
their mid-sixties. For men who suffered from low nutrition in infancy, we find a negative
height effect of more than 3 cm. This effect remains after controlling for trends in height
26
over time.
What distinguishes our results from the literature on contextual famine effects is that
we are the first to use the occurrence of famines to obtain an estimate of the average causal
effect of nutritional shortages during childhood on health later in life. We can thus compare
the reduced-form famine effects that are usually reported in the literature with the causal
effects of undernutrition. Our estimated reduced-form famine effects are in accordance to
those in the reduced-form studies of the long run effects of exposure to the famines that we
consider (those studies were discussed in Section 3). However, in many cases, our estimated
causal effects are at least a few times larger than our reduced-form famine effects. This
emphasizes the importance of nutrition in early childhood - over and above the findings
and statements in the famine literature.
The difference between contextual and causal effects is related to the rate of “com-
pliance” to the famine. In our study, the fraction of “compliers” is close to 20%. To the
extent that reduced-form studies implicitly assume perfect compliance, this assumption
seems untenable even for shocks as severe as the famines used in this study.20
The analyses in this paper are restricted by some notable data limitations. First, the
samples are small. Admittedly, the full SHARE data cover many European countries and
include over 20,000 elderly respondents, but we only use the subsamples from the three
countries with famines. Within these, the subsets of individuals who were exposed to
famines during childhood are of even smaller size, because the famines had a duration of at
most a few years. This implies, among other things, that we can only examine exposures
within age intervals of say 4 years, since otherwise the numbers of “treated” and “controls”
are insufficient for reliable inference. Another data limitation is that the individual spells
of severe nutritional shortages are only measured in full calendar years. Inevitably, then,
the assignment rules for the actual treatment status are open to debate. Fortunately, the
results are not sensitive to moderate changes in these rules, and in general, the results
are in agreement to the findings in the reduced-form literature where famine exposure is
directly related to health outcomes later in life.
Nevertheless, the data limitations rule out the analysis of a number of interesting is-
sues. This concerns, first of all, the connection between the timing of the spell of nu-
tritional shortage and the age of the child. The famine literature distinguishes between
different reduced-form effects at different stages of pregnancy, for different outcomes. More
in general, the developmental origins literature finds that long-run reduced-form effects of
20Some of the reduced-form studies do explicitly acknowledge the difference between famines or episodeswith reduced food availability on the one hand and nutritional shortages early in life on the other, andthey carefully define the parameter of interest to be the over-all ”intention to treat” effect. See for exampleAlmond and Mazumder (2011) and Lumey, Stein and Susser (2011) for excellent expositions.
27
conditions in utero and right after birth are larger than those at subsequent ages. The size
of the effects may be non-monotonous during the pre-puberty and puberty ages. Our data
do not enable us to go into such details. A second issue concerns the temporal and spatial
variation in the strength of the famine instrument. Contextual information can be used to
create an indicator of famine severity. For example, one may use official food rations per
region and month. However, the meaning of a ration size depends on the country, since in
some countries charities and the informal sector are more important than in others. As we
have seen, the sample sizes are too small to allow for meaningful estimation by country,
and on top of that, the temporal connection between a famine and the observed spell of
nutritional shortage is insufficiently tight to exploit fine temporal contextual variations.
The present study may therefore motivate the construction or usage of data sets that are
larger and/or more focused on specific spatial areas, where ideally, such data sets would
have more elaborate retrospective information on childhood episodes of hunger.
28
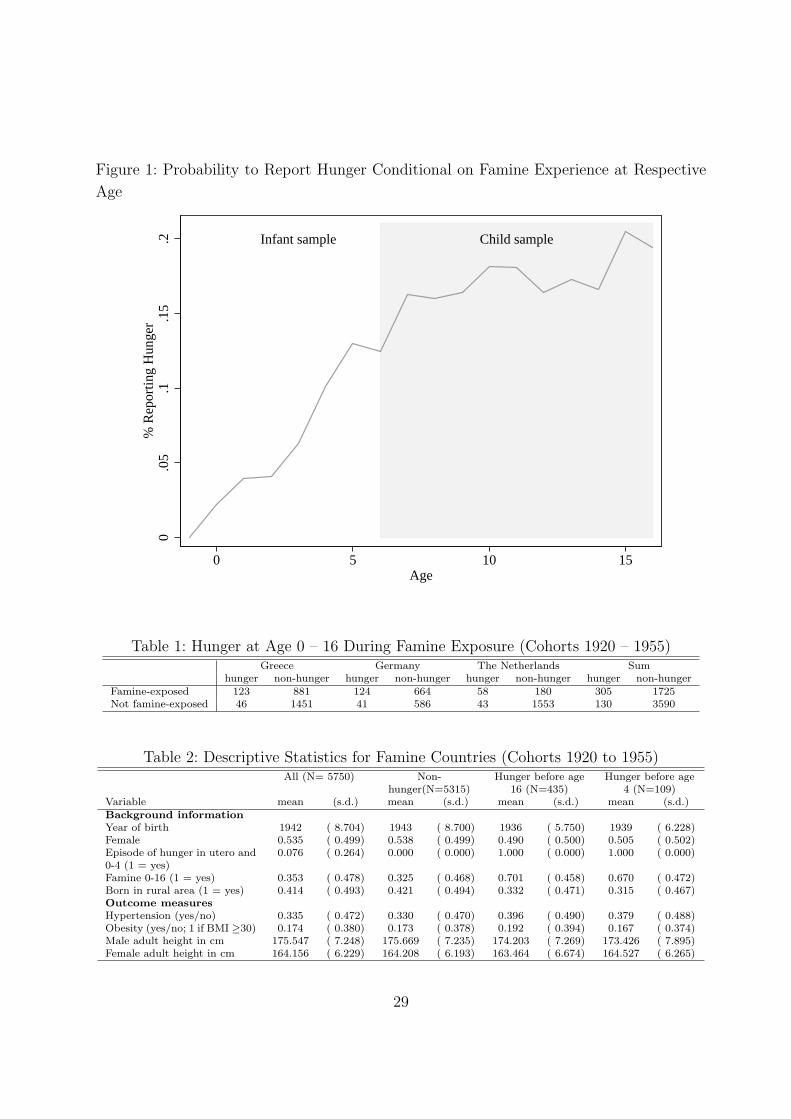
Figure 1: Probability to Report Hunger Conditional on Famine Experience at Respective
Age
Infant sample Child sample
0.0
5.1
.15
.2%
Rep
ortin
g H
unge
r
0 5 10 15Age
Table 1: Hunger at Age 0 – 16 During Famine Exposure (Cohorts 1920 – 1955)Greece Germany The Netherlands Sum
hunger non-hunger hunger non-hunger hunger non-hunger hunger non-hungerFamine-exposed 123 881 124 664 58 180 305 1725Not famine-exposed 46 1451 41 586 43 1553 130 3590
Table 2: Descriptive Statistics for Famine Countries (Cohorts 1920 to 1955)All (N= 5750) Non-
hunger(N=5315)Hunger before age
16 (N=435)Hunger before age
4 (N=109)Variable mean (s.d.) mean (s.d.) mean (s.d.) mean (s.d.)Background informationYear of birth 1942 ( 8.704) 1943 ( 8.700) 1936 ( 5.750) 1939 ( 6.228)Female 0.535 ( 0.499) 0.538 ( 0.499) 0.490 ( 0.500) 0.505 ( 0.502)Episode of hunger in utero and0-4 (1 = yes)
0.076 ( 0.264) 0.000 ( 0.000) 1.000 ( 0.000) 1.000 ( 0.000)
Famine 0-16 (1 = yes) 0.353 ( 0.478) 0.325 ( 0.468) 0.701 ( 0.458) 0.670 ( 0.472)Born in rural area (1 = yes) 0.414 ( 0.493) 0.421 ( 0.494) 0.332 ( 0.471) 0.315 ( 0.467)Outcome measuresHypertension (yes/no) 0.335 ( 0.472) 0.330 ( 0.470) 0.396 ( 0.490) 0.379 ( 0.488)Obesity (yes/no; 1 if BMI ≥30) 0.174 ( 0.380) 0.173 ( 0.378) 0.192 ( 0.394) 0.167 ( 0.374)Male adult height in cm 175.547 ( 7.248) 175.669 ( 7.235) 174.203 ( 7.269) 173.426 ( 7.895)Female adult height in cm 164.156 ( 6.229) 164.208 ( 6.193) 163.464 ( 6.674) 164.527 ( 6.265)
29
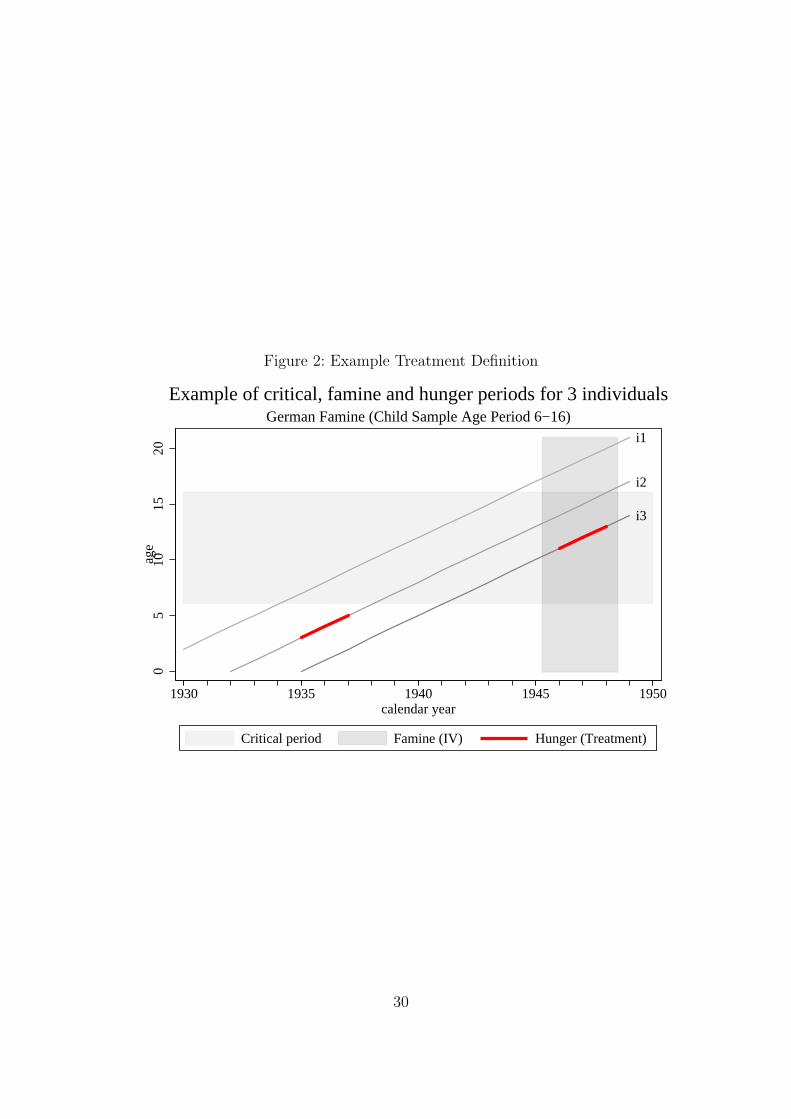
Figure 2: Example Treatment Definition
i2
i3
i1
05
1015
20ag
e
1930 1935 1940 1945 1950calendar year
Critical period Famine (IV) Hunger (Treatment)
German Famine (Child Sample Age Period 6−16)
Example of critical, famine and hunger periods for 3 individuals
30
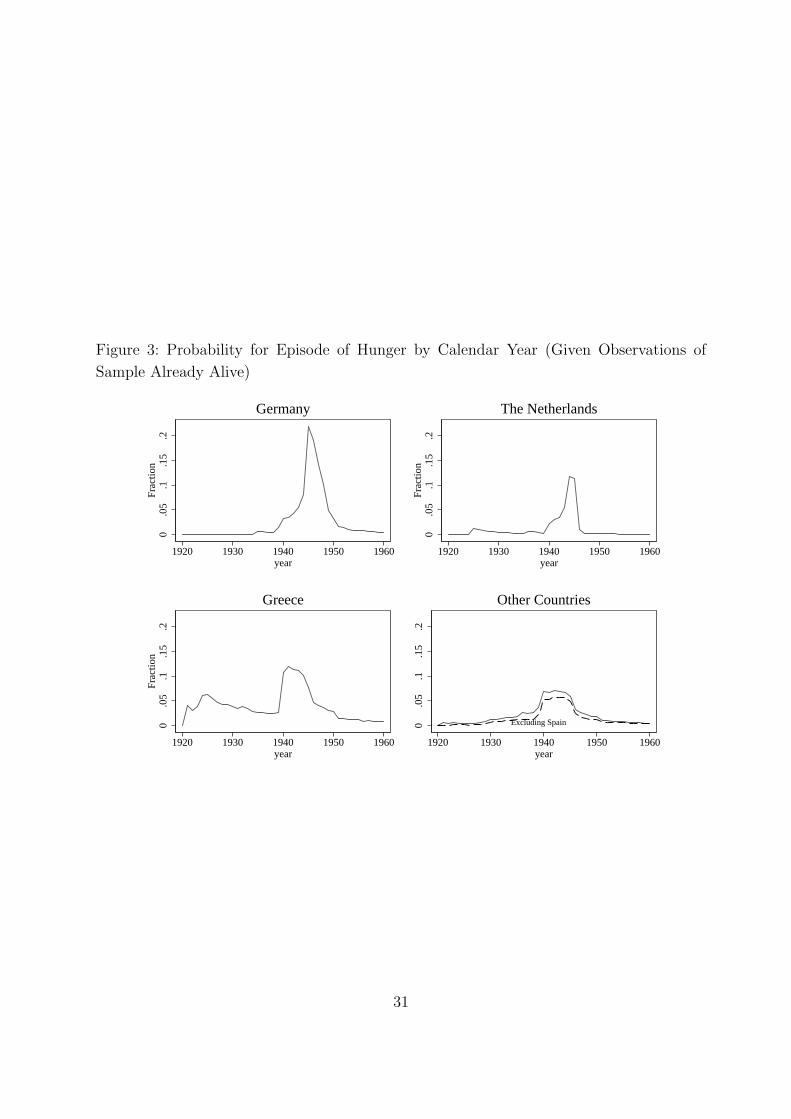
Figure 3: Probability for Episode of Hunger by Calendar Year (Given Observations of
Sample Already Alive)
0.0
5.1
.15
.2Fr
actio
n
1920 1930 1940 1950 1960year
Germany0
.05
.1.1
5.2
Frac
tion
1920 1930 1940 1950 1960year
The Netherlands
0.0
5.1
.15
.2Fr
actio
n
1920 1930 1940 1950 1960year
Greece
Excluding Spain0.0
5.1
.15
.2
1920 1930 1940 1950 1960year
Other Countries
31
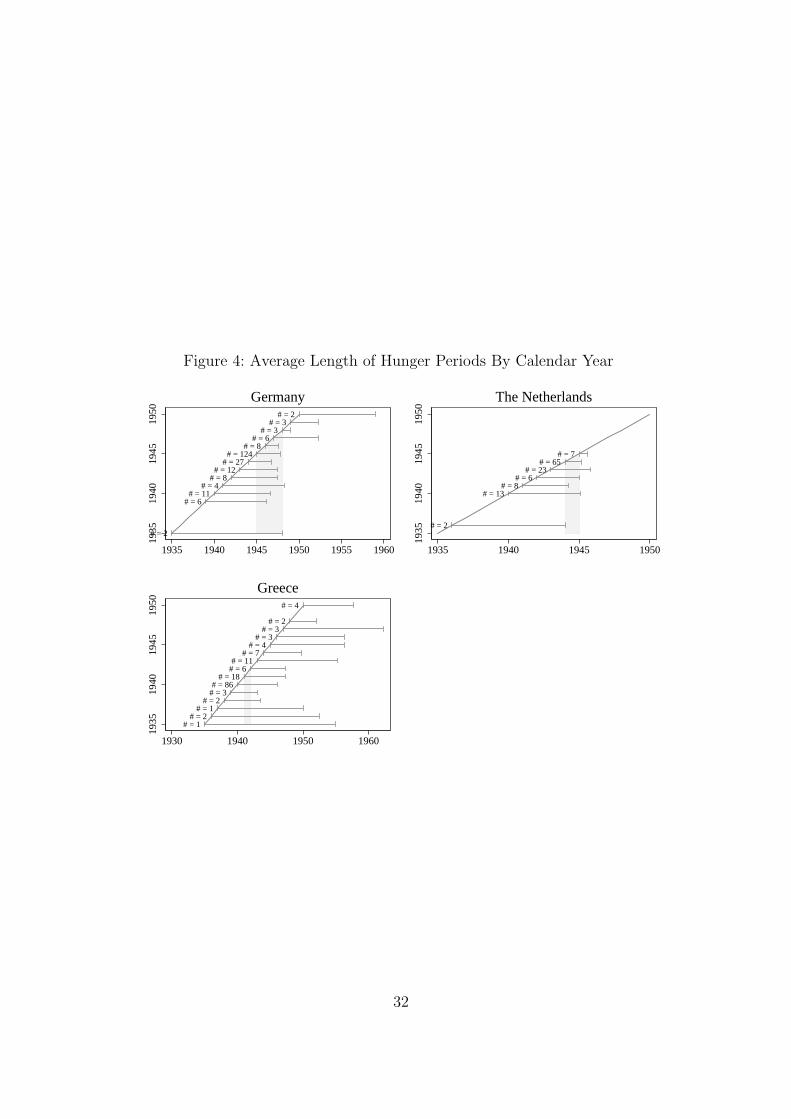
Figure 4: Average Length of Hunger Periods By Calendar Year
# = 2
# = 6# = 11
# = 4# = 8
# = 12# = 27
# = 124# = 8
# = 6# = 3
# = 3# = 2
1935
1940
1945
1950
1935 1940 1945 1950 1955 1960
Germany
# = 2
# = 13# = 8
# = 6# = 23
# = 65# = 7
1935
1940
1945
1950
1935 1940 1945 1950
The Netherlands
# = 1# = 2
# = 1# = 2
# = 3# = 86
# = 18# = 6# = 11
# = 7# = 4
# = 3# = 3
# = 2
# = 4
1935
1940
1945
1950
1930 1940 1950 1960
Greece
32
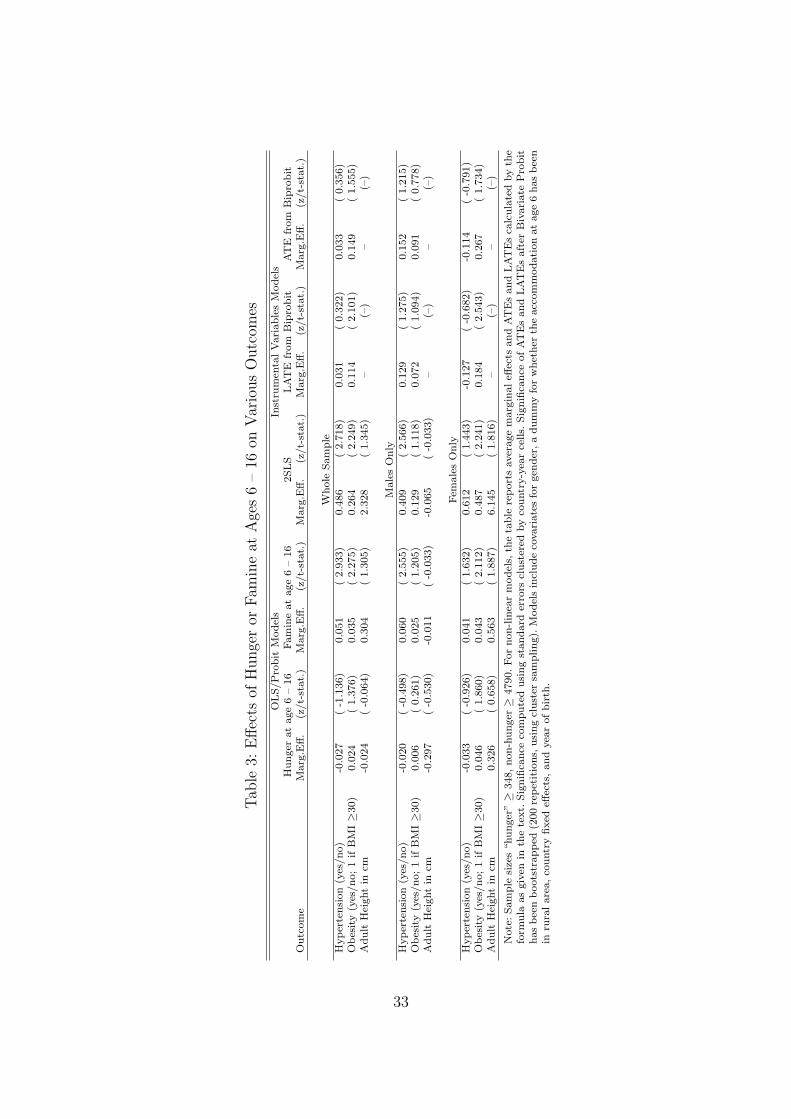
Tab
le3:
Effec
tsof
Hunge
ror
Fam
ine
atA
ges
6–
16on
Var
ious
Outc
omes
OLS/P
robit
Model
sIn
stru
men
talV
ari
able
sM
odel
sH
unger
at
age
6–
16
Fam
ine
at
age
6–
16
2SLS
LA
TE
from
Bip
robit
AT
Efr
om
Bip
robit
Outc
om
eM
arg
.Eff.
(z/t-
stat.
)M
arg
.Eff.
(z/t-
stat.
)M
arg
.Eff.
(z/t-
stat.
)M
arg
.Eff.
(z/t-
stat.
)M
arg
.Eff.
(z/t-
stat.
)
Whole
Sam
ple
Hyper
tensi
on
(yes
/no)
-0.0
27
(-1
.136)
0.0
51
(2.9
33)
0.4
86
(2.7
18)
0.0
31
(0.3
22)
0.0
33
(0.3
56)
Obes
ity
(yes
/no;1
ifB
MI≥3
0)
0.0
24
(1.3
76)
0.0
35
(2.2
75)
0.2
64
(2.2
49)
0.1
14
(2.1
01)
0.1
49
(1.5
55)
Adult
Hei
ght
incm
-0.0
24
(-0
.064)
0.3
04
(1.3
05)
2.3
28
(1.3
45)
–(–
)–
(–)
Male
sO
nly
Hyper
tensi
on
(yes
/no)
-0.0
20
(-0
.498)
0.0
60
(2.5
55)
0.4
09
(2.5
66)
0.1
29
(1.2
75)
0.1
52
(1.2
15)
Obes
ity
(yes
/no;1
ifB
MI≥3
0)
0.0
06
(0.2
61)
0.0
25
(1.2
05)
0.1
29
(1.1
18)
0.0
72
(1.0
94)
0.0
91
(0.7
78)
Adult
Hei
ght
incm
-0.2
97
(-0
.530)
-0.0
11
(-0
.033)
-0.0
65
(-0
.033)
–(–
)–
(–)
Fem
ale
sO
nly
Hyper
tensi
on
(yes
/no)
-0.0
33
(-0
.926)
0.0
41
(1.6
32)
0.6
12
(1.4
43)
-0.1
27
(-0
.682)
-0.1
14
(-0
.791)
Obes
ity
(yes
/no;1
ifB
MI≥3
0)
0.0
46
(1.8
60)
0.0
43
(2.1
12)
0.4
87
(2.2
41)
0.1
84
(2.5
43)
0.2
67
(1.7
34)
Adult
Hei
ght
incm
0.3
26
(0.6
58)
0.5
63
(1.8
87)
6.1
45
(1.8
16)
–(–
)–
(–)
Note
:Sam
ple
size
s“hunger
”≥
348,non-h
unger≥
4790.For
non-lin
ear
model
s,th
eta
ble
report
saver
age
marg
inaleff
ects
and
AT
Es
and
LA
TE
sca
lcula
ted
by
the
form
ula
as
giv
enin
the
text.
Sig
nifi
cance
com
pute
dusi
ng
standard
erro
rscl
ust
ered
by
countr
y-y
ear
cells.
Sig
nifi
cance
ofAT
Es
and
LAT
Es
aft
erB
ivari
ate
Pro
bit
has
bee
nboots
trapped
(200
repet
itio
ns,
usi
ng
clust
ersa
mpling).
Model
sin
clude
covari
ate
sfo
rgen
der
,a
dum
my
for
whet
her
the
acc
om
modati
on
at
age
6has
bee
nin
rura
lare
a,co
untr
yfixed
effec
ts,and
yea
rofbir
th.
33
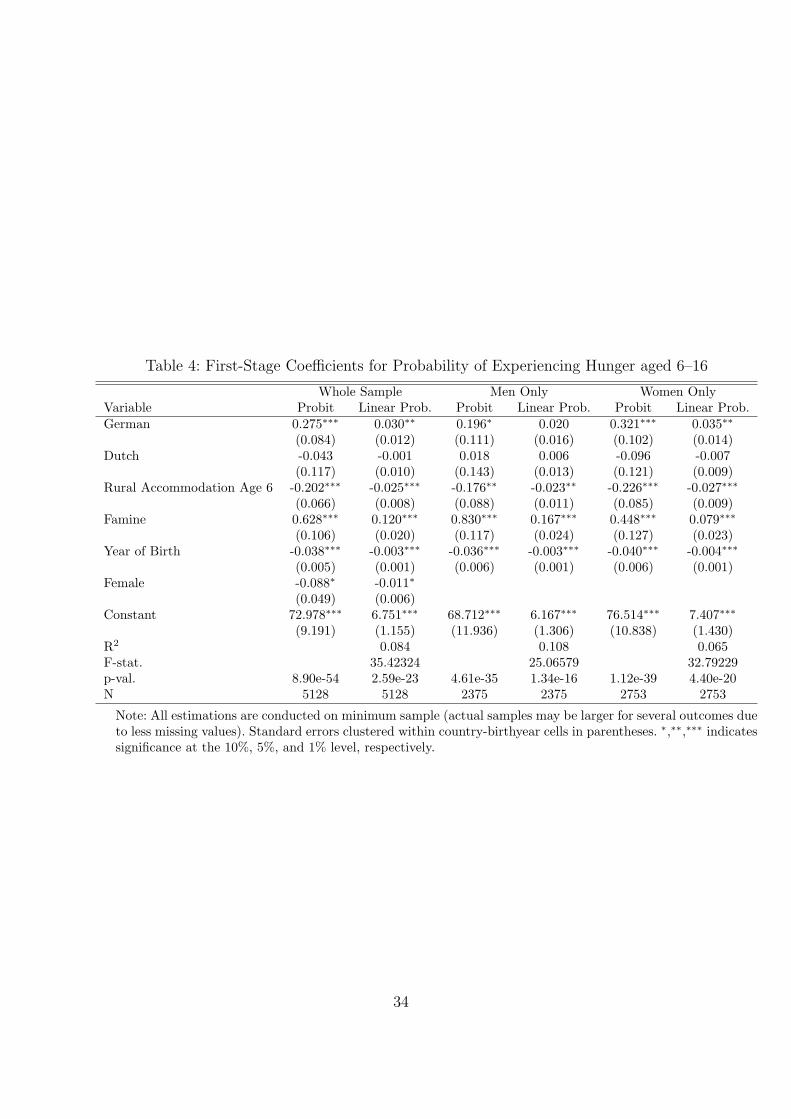
Table 4: First-Stage Coefficients for Probability of Experiencing Hunger aged 6–16
Whole Sample Men Only Women OnlyVariable Probit Linear Prob. Probit Linear Prob. Probit Linear Prob.German 0.275∗∗∗ 0.030∗∗ 0.196∗ 0.020 0.321∗∗∗ 0.035∗∗
(0.084) (0.012) (0.111) (0.016) (0.102) (0.014)Dutch -0.043 -0.001 0.018 0.006 -0.096 -0.007
(0.117) (0.010) (0.143) (0.013) (0.121) (0.009)Rural Accommodation Age 6 -0.202∗∗∗ -0.025∗∗∗ -0.176∗∗ -0.023∗∗ -0.226∗∗∗ -0.027∗∗∗
(0.066) (0.008) (0.088) (0.011) (0.085) (0.009)Famine 0.628∗∗∗ 0.120∗∗∗ 0.830∗∗∗ 0.167∗∗∗ 0.448∗∗∗ 0.079∗∗∗
(0.106) (0.020) (0.117) (0.024) (0.127) (0.023)Year of Birth -0.038∗∗∗ -0.003∗∗∗ -0.036∗∗∗ -0.003∗∗∗ -0.040∗∗∗ -0.004∗∗∗
(0.005) (0.001) (0.006) (0.001) (0.006) (0.001)Female -0.088∗ -0.011∗
(0.049) (0.006)Constant 72.978∗∗∗ 6.751∗∗∗ 68.712∗∗∗ 6.167∗∗∗ 76.514∗∗∗ 7.407∗∗∗
(9.191) (1.155) (11.936) (1.306) (10.838) (1.430)R2 0.084 0.108 0.065F-stat. 35.42324 25.06579 32.79229p-val. 8.90e-54 2.59e-23 4.61e-35 1.34e-16 1.12e-39 4.40e-20N 5128 5128 2375 2375 2753 2753
Note: All estimations are conducted on minimum sample (actual samples may be larger for several outcomes dueto less missing values). Standard errors clustered within country-birthyear cells in parentheses. ∗,∗∗,∗∗∗ indicatessignificance at the 10%, 5%, and 1% level, respectively.
34
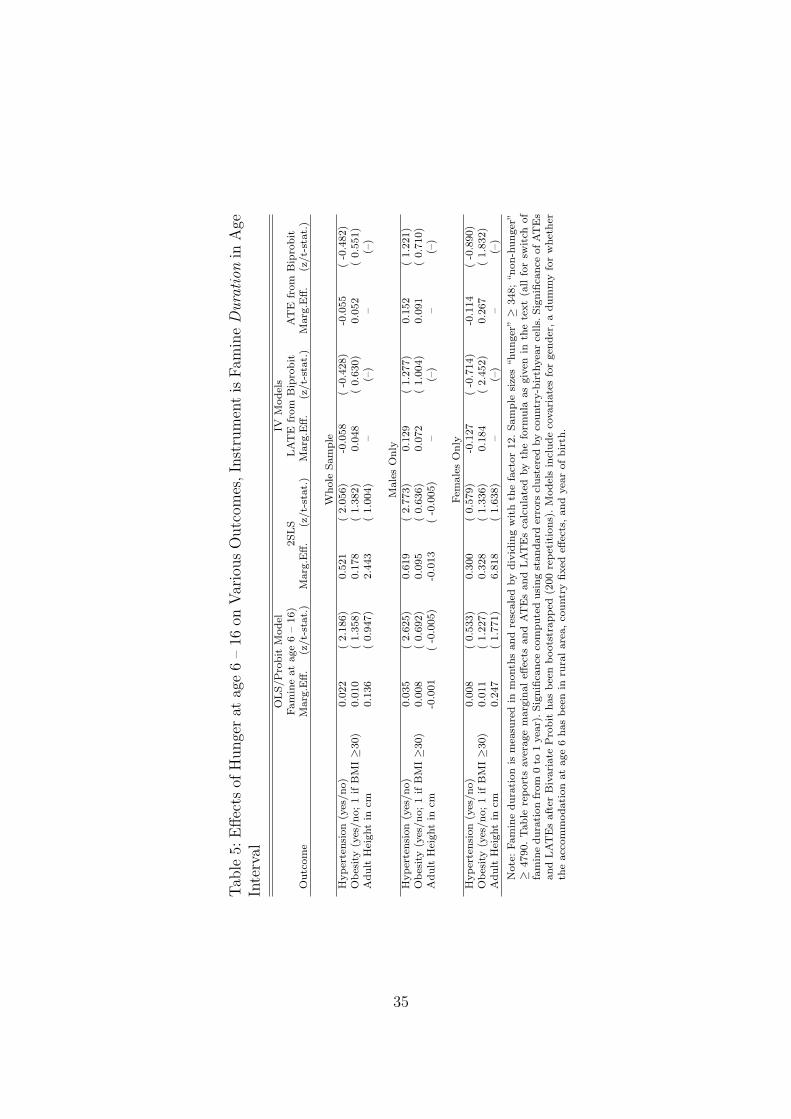
Tab
le5:
Effec
tsof
Hunge
rat
age
6–
16on
Var
ious
Outc
omes
,In
stru
men
tis
Fam
ine
Dura
tion
inA
geIn
terv
al
OLS/P
robit
Model
IVM
odel
sFam
ine
at
age
6–
16)
2SLS
LA
TE
from
Bip
robit
AT
Efr
om
Bip
robit
Outc
om
eM
arg
.Eff.
(z/t-
stat.
)M
arg
.Eff.
(z/t-
stat.
)M
arg
.Eff.
(z/t-
stat.
)M
arg
.Eff.
(z/t-
stat.
)
Whole
Sam
ple
Hyper
tensi
on
(yes
/no)
0.0
22
(2.1
86)
0.5
21
(2.0
56)
-0.0
58
(-0
.428)
-0.0
55
(-0
.482)
Obes
ity
(yes
/no;1
ifB
MI≥3
0)
0.0
10
(1.3
58)
0.1
78
(1.3
82)
0.0
48
(0.6
30)
0.0
52
(0.5
51)
Adult
Hei
ght
incm
0.1
36
(0.9
47)
2.4
43
(1.0
04)
–(–
)–
(–)
Male
sO
nly
Hyper
tensi
on
(yes
/no)
0.0
35
(2.6
25)
0.6
19
(2.7
73)
0.1
29
(1.2
77)
0.1
52
(1.2
21)
Obes
ity
(yes
/no;1
ifB
MI≥3
0)
0.0
08
(0.6
92)
0.0
95
(0.6
36)
0.0
72
(1.0
04)
0.0
91
(0.7
10)
Adult
Hei
ght
incm
-0.0
01
(-0
.005)
-0.0
13
(-0
.005)
–(–
)–
(–)
Fem
ale
sO
nly
Hyper
tensi
on
(yes
/no)
0.0
08
(0.5
33)
0.3
00
(0.5
79)
-0.1
27
(-0
.714)
-0.1
14
(-0
.890)
Obes
ity
(yes
/no;1
ifB
MI≥3
0)
0.0
11
(1.2
27)
0.3
28
(1.3
36)
0.1
84
(2.4
52)
0.2
67
(1.8
32)
Adult
Hei
ght
incm
0.2
47
(1.7
71)
6.8
18
(1.6
38)
–(–
)–
(–)
Note
:Fam
ine
dura
tion
ism
easu
red
inm
onth
sand
resc
ale
dby
div
idin
gw
ith
the
fact
or
12.Sam
ple
size
s“hunger
”≥
348;“non-h
unger
”≥
4790.Table
report
saver
age
marg
inaleff
ects
and
AT
Es
and
LAT
Es
calc
ula
ted
by
the
form
ula
as
giv
enin
the
text
(all
for
swit
chof
fam
ine
dura
tion
from
0to
1yea
r).Sig
nifi
cance
com
pute
dusi
ng
standard
erro
rscl
ust
ered
by
countr
y-b
irth
yea
rce
lls.
Sig
nifi
cance
ofA
TE
sand
LAT
Es
aft
erB
ivari
ate
Pro
bit
has
bee
nboots
trapped
(200
repet
itio
ns)
.M
odel
sin
clude
covari
ate
sfo
rgen
der
,a
dum
my
for
whet
her
the
acc
om
modati
on
at
age
6has
bee
nin
rura
lare
a,co
untr
yfixed
effec
ts,and
yea
rofbir
th.
35
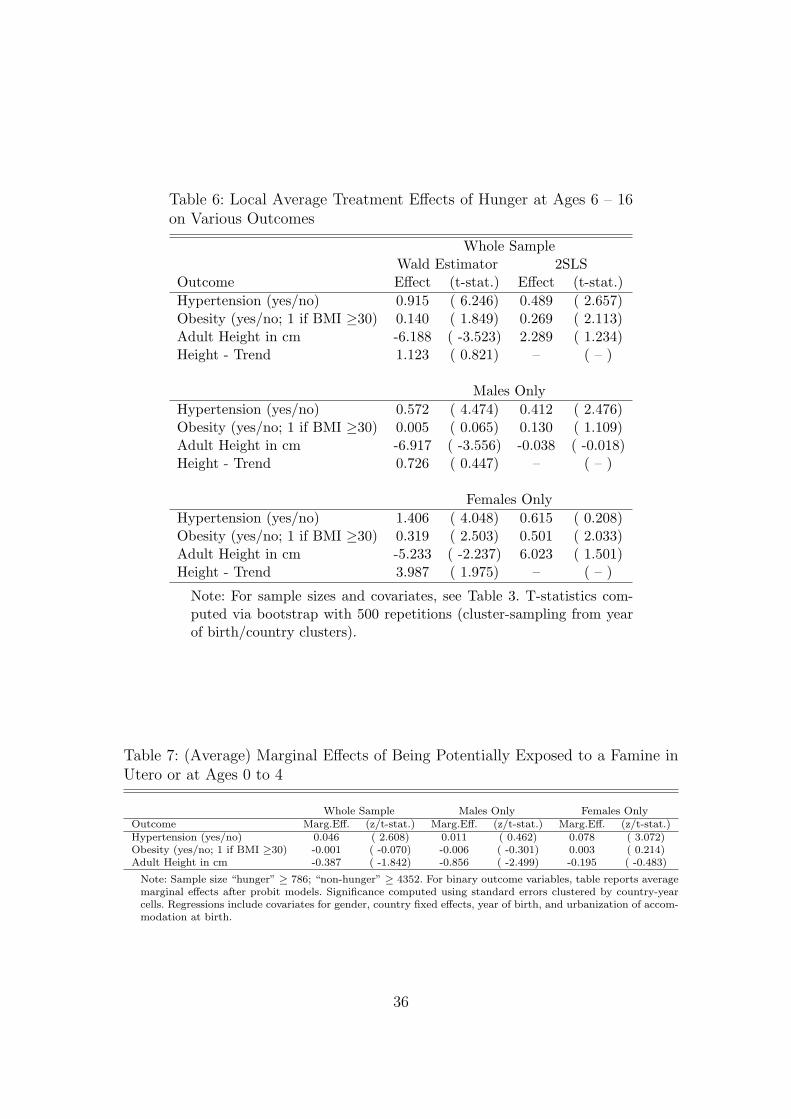
Table 6: Local Average Treatment Effects of Hunger at Ages 6 – 16on Various Outcomes
Whole SampleWald Estimator 2SLS
Outcome Effect (t-stat.) Effect (t-stat.)Hypertension (yes/no) 0.915 ( 6.246) 0.489 ( 2.657)Obesity (yes/no; 1 if BMI ≥30) 0.140 ( 1.849) 0.269 ( 2.113)Adult Height in cm -6.188 ( -3.523) 2.289 ( 1.234)Height - Trend 1.123 ( 0.821) – ( – )
Males OnlyHypertension (yes/no) 0.572 ( 4.474) 0.412 ( 2.476)Obesity (yes/no; 1 if BMI ≥30) 0.005 ( 0.065) 0.130 ( 1.109)Adult Height in cm -6.917 ( -3.556) -0.038 ( -0.018)Height - Trend 0.726 ( 0.447) – ( – )
Females OnlyHypertension (yes/no) 1.406 ( 4.048) 0.615 ( 0.208)Obesity (yes/no; 1 if BMI ≥30) 0.319 ( 2.503) 0.501 ( 2.033)Adult Height in cm -5.233 ( -2.237) 6.023 ( 1.501)Height - Trend 3.987 ( 1.975) – ( – )
Note: For sample sizes and covariates, see Table 3. T-statistics com-puted via bootstrap with 500 repetitions (cluster-sampling from yearof birth/country clusters).
Table 7: (Average) Marginal Effects of Being Potentially Exposed to a Famine inUtero or at Ages 0 to 4
Whole Sample Males Only Females OnlyOutcome Marg.Eff. (z/t-stat.) Marg.Eff. (z/t-stat.) Marg.Eff. (z/t-stat.)Hypertension (yes/no) 0.046 ( 2.608) 0.011 ( 0.462) 0.078 ( 3.072)Obesity (yes/no; 1 if BMI ≥30) -0.001 ( -0.070) -0.006 ( -0.301) 0.003 ( 0.214)Adult Height in cm -0.387 ( -1.842) -0.856 ( -2.499) -0.195 ( -0.483)
Note: Sample size “hunger” ≥ 786; “non-hunger” ≥ 4352. For binary outcome variables, table reports averagemarginal effects after probit models. Significance computed using standard errors clustered by country-yearcells. Regressions include covariates for gender, country fixed effects, year of birth, and urbanization of accom-modation at birth.
36
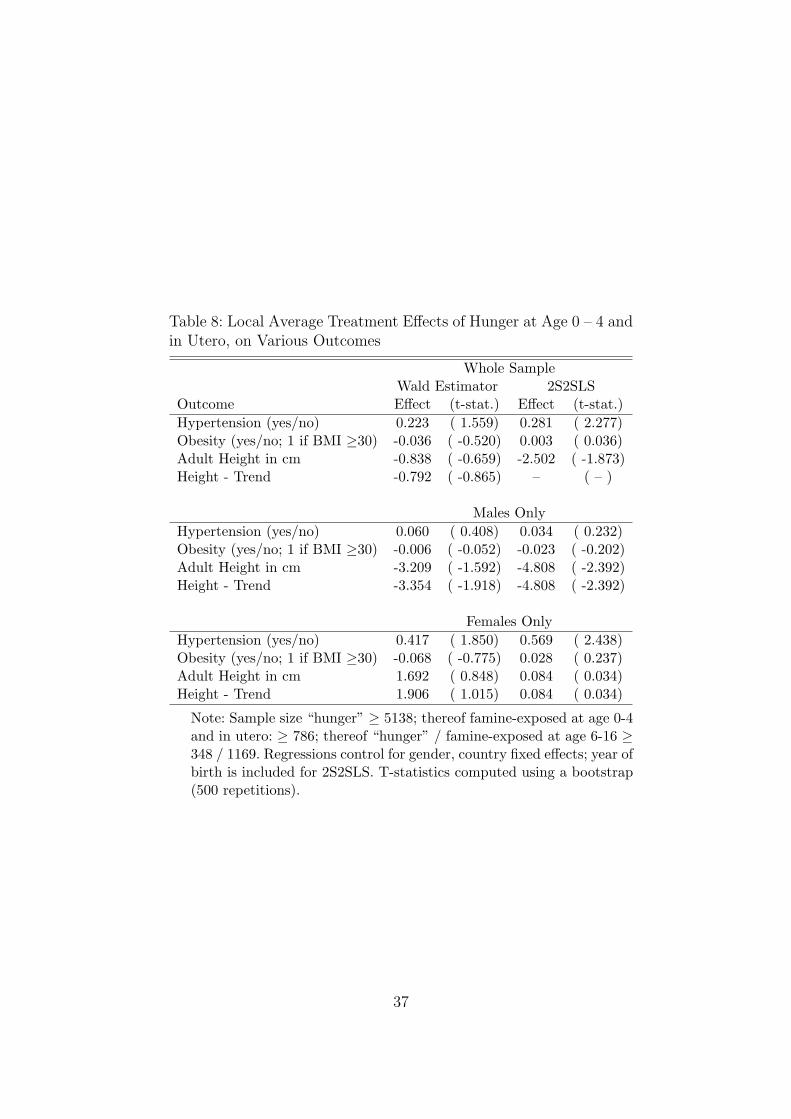
Table 8: Local Average Treatment Effects of Hunger at Age 0 – 4 andin Utero, on Various Outcomes
Whole SampleWald Estimator 2S2SLS
Outcome Effect (t-stat.) Effect (t-stat.)Hypertension (yes/no) 0.223 ( 1.559) 0.281 ( 2.277)Obesity (yes/no; 1 if BMI ≥30) -0.036 ( -0.520) 0.003 ( 0.036)Adult Height in cm -0.838 ( -0.659) -2.502 ( -1.873)Height - Trend -0.792 ( -0.865) – ( – )
Males OnlyHypertension (yes/no) 0.060 ( 0.408) 0.034 ( 0.232)Obesity (yes/no; 1 if BMI ≥30) -0.006 ( -0.052) -0.023 ( -0.202)Adult Height in cm -3.209 ( -1.592) -4.808 ( -2.392)Height - Trend -3.354 ( -1.918) -4.808 ( -2.392)
Females OnlyHypertension (yes/no) 0.417 ( 1.850) 0.569 ( 2.438)Obesity (yes/no; 1 if BMI ≥30) -0.068 ( -0.775) 0.028 ( 0.237)Adult Height in cm 1.692 ( 0.848) 0.084 ( 0.034)Height - Trend 1.906 ( 1.015) 0.084 ( 0.034)
Note: Sample size “hunger” ≥ 5138; thereof famine-exposed at age 0-4and in utero: ≥ 786; thereof “hunger” / famine-exposed at age 6-16 ≥348 / 1169. Regressions control for gender, country fixed effects; year ofbirth is included for 2S2SLS. T-statistics computed using a bootstrap(500 repetitions).
37
References
Akbulut-Yuksel, M. (2009). Children of war: the long-run effects of large-scale physical
destruction and warfare on children. Working paper, IZA Bonn.
Almond, D. and Currie, J. (2011). Killing me softly: The fetal origins hypothesis. Journal
of Economic Perspectives, 25(3): 153–172.
Almond, D. and Mazumder, B. (2011). Health capital and the prenatal environment: the
effect of Ramadan observance during pregnancy. American Economic Journal: Applied
Economics, 3(4): 56–85.
Angrist, J.D., Krueger, A.B. (1992). The effect of age at school entry on educational
attainment: An application of instrumental variables with moments from two samples.
Journal of the American Statistical Association, 87: 328–336.
Angrist, J.D., Imbens, G.W., and Rubin, D.B. (1996). Identification of causal effects using
instrumental variables. Journal of the American Statistical Association, 91(434): 444–
455.
Arellano, M., Meghir, C. (1992). Female labour supply and on-the-job-search: An empirical
model estimated using complementary data sets. Review of Economic Studies, 59, 537–
557.
Banning, C. (1946). Food shortage and public health, first half of 1945. Annals of the
American Academy of Political and Social Science, 245: 93–110.
Barker, D.J.P. (1994). Mothers, Babies, and Disease in Later Life. London: British Medical
Journal Publishing Group.
Barker, D. (2007). The origins of the developmental origins theory, Journal of Internal
Medicine 261: 412–417.
Bateson, P. (2001). Fetal experience and good adult design. International Journal of Epi-
demiology, 30: 928–934.
Becker, G.S. and Tomes, N. (1976). Child endowments and the quantity and quality of
children. Journal of Political Economy, 84(4): 143–162.
Behrman, J.R. and Pollak, R.A. and Taubman, P. (1982). Parental preferences and provi-
sion for progeny. Journal of Political Economy, 90(1): 52–73.
Behrman, J.R. (1997). Intrahousehold distribution and the family. Handbook of Population
and Family Economics, 1: 125–187.
38
Borsch-Supan, A., Brugiavini, A., Jurges, H., Kapteyn, A., Mackenbach, J., Siegrist, J., et
al. (2008). Health, ageing and retirement in Europe (2004-2007). Starting the longitudi-
nal dimension. Mannheim Research Institute for the Economics of Aging (MEA).
Cameron, N. and Demerath, E. W. (2002). Critical periods in human growth and their
relationship to diseases of aging. Yearbook of Physical Anthropology, 45: 159–184.
Cole, S.W., Hawkley, L.C., Arevalo, J.M.G., Cacioppo, J.T. (2010). Transcript origin anal-
ysis identifies antigen-presenting cells as primary targets of socially regulated gene ex-
pression in leukocytes. Proceedings of the National Academy of Sciences of the USA,
108: 3080–3085.
Cornides, W. (1948). Wirtschaftsstatistik der deutschen Besatzungszonen 1945-1948 in
Verbindung mit der deutschen Produktionsstatistik der Vorkriegszeit. Verlag Europa-
Archiv, Oberursel.
Datar, A., Kilburn, M.R. and Loughran, D.S. (2010). Endowments and parental invest-
ments in infancy and early childhood. Demography, 47(1): 145–162.
Dean, R. F.A. (1951). The size of the baby at birth and the yield of breast milk. In Medical
Research Council Special Report Series No. 275: Studies of Undernutrition, Wuppertal
1946-9, by Members of the Department of Experimental Medicine, Cambridge, and As-
sociated Workers, chapter XXVIII, pages 346–378. His Majesty’s Stationary Office.
Del Bono, E. and Ermisch, J. and Francesconi, M. (2008). Intrafamily resource allocations:
a dynamic model of birth weight. Working paper, IZA Bonn.
De Rooij, S.R., Wouters, H., Yonker, J.E., Painter, R.C. and Roseboom, T.J. (2010). Pre-
natal undernutrition and cognitive function in late adulthood, PNAS 107(39): 16881–
16886.
Dols, M.J.L. and Van Arcken, D.J.A.M. (1946). Food supply and nutrition in the Nether-
lands during and immediately after World War II. The Milbank Memorial Fund Quar-
terly, 24(4): 319–358.
Echternkamp, J. (2003). Nach dem Krieg – Alltagsnot, Neuorientierung und die Last der
Vergangenheit 1945–1949. Pendo Verlag Zurich.
Elder, G. (1999). Children of the Great Depression: Social Change in Life Experience..
Boulder: Westview Press.
Elo, I.T., and Preston, S.H. (1992). Effects of early-life conditions on adult mortality: a
review, Population Index, 58: 186–212.
Farquharson, J. (1985). The Western Allies and the Politics of Food – Agrarian Manage-
ment in Postwar Germany. Berg Publishers Ltd.
39
Gasser, T., Ziegler, P., Largo, R.H., Molinari, L., and Prader, A. (1994). A longitudinal
study of lean and fat areas at the arm. Annals of Human Biology, 21(4): 303–14.
Gluckman, P.D., and Hanson, M.A. (2004). Living with the past: evolution, development,
and patterns of disease. Science 305: 1733–1736.
Gluckman, P.D., Hanson, M.A., and Pinal, C. (2005). The developmental origins of adult
disease. Maternal and Child Nutrition, 1: 130–141.
Griliches, Z. (1979). Sibling models and data in economics: beginnings of a survey Journal
of Political Economy, 87(5): 37–64.
Hadley, C. and Patil, C. (2006). Food insecurity in rural Tanzania is associated with
maternal anxiety and depression. American Journal of Human Biology, 18(3): 359–368.
Hales, C.N., and Barker, D.J. (1992). Type 2 (non-insulin-dependent) diabetes mellitus:
the thrifty phenotype hypothesis. Diabetologia 35(7): 595–601.
Hamelin, A., Habicht, J., and Beaudry, M. (1999). Food insecurity: consequences for the
household and broader social implications. The Journal of Nutrition, 129(2): 525.
Hausser, A. and Maugg, G. (2009). Hungerwinter. Deutschlands humanitare Katastrophe
1946/47, Berlin: Prophylaen.
Heijmans, B. T., Tobi, E. W., Stein, A. D., Putter, H., Blauw, G. J., Susser, E. S., et al.
(2008). Persistent epigenetic differences associated with prenatal exposure to famine in
humans. Proceedings of the National Academy of Sciences of the USA, 105(44): 17046–
17049.
Hermanussen, M., Danker-Hopfe, H., Weber, G.W. (2001). Body weight and the shape
of the natural distribution of weight, in very large samples of German, Austrian and
Norwegian conscripts. International Journal of Obesity, 25: 1550–1553.
Hionidou, V. (2006). Famine and Death in Occupied Greece, 1941-1944. Cambridge Uni-
versity Press.
Hutchinson, A.O. and McCance, R. A. and Widdowson, E. M. (1951). Studies of under-
nutrition, Wuppertal 1946-9. XXVIII Size of Baby at Birth and Yield of Breast Milk..
His Majesty’s Stationary Office, London.
Imbens, G.W., and Angrist, J.D. (1994). Identification and estimation of local average
treatment effects. Econometrica, 62(2): 467–475.
Inoue, A., and Solon, G. (2010). Two-sample instrumental variables estimators. Review of
Economics and Statistics, 92(3): 557–561.
Jurges, H. (2011). Collateral damage: Educational attainment and labor market outcomes
among German war and post-war cohorts. Working paper, University of Wuppertal.
40
Jyoti, D., Frongillo, E., and Jones, S. (2005). Food insecurity affects school children’s
academic performance, weight gain, and social skills. The Journal of Nutrition, 135(12):
2831.
Klatt, W. (1950). Food and farming in Germany: I. food and nutrition. International
Affairs, 26(1): 45–58.
Kuzawa, C., and Quinn, E.A. (2009). Developmental origins of adult function and health:
evolutionary hypotheses. Annual Review of Anthropology 38: 131–147.
Lawlor, D.A. (2008). The developmental origins of health and disease: where do we go
from here?, Epidemiology 19: 206–208.
Leigh, J. (1983). Direct and indirect effects of education on health. Social Science &
Medicine, 17(4): 227–234.
Lumey, L.H., Stein, A.D., Kahn, H.S., Van der Pal-de Bruin, K.M., Blauw, G.J., Zybert,
P.A. et al. (2007). Cohort profile: the Dutch Hunger Winter Families Study. Interna-
tional Journal of Epidemiology, 36: 1196–1204.
Lumey, L.H., Stein, A.D., and Susser, E. (2011). Prenatal famine and adult health. Annual
Review of Public Health, 32: 24.1–24.26.
Marshall, W., and Tanner, J.M. (1986). Puberty. In: F. Falkner and J.M. Tanner, eds.,
Human Growth. A Comprehensive Treatise. Part 2. Postnatal Growth Neurobiology.
New York: Plenum Press.
Miller, G.E., Chen, E., Fok, A.K., Walker, H., Lim, A., Nicholls, E.F., et al. (2009). Low
early-life social class leaves a biological residue manifest by decreased glucocorticoid and
increased proinflammatory signaling. Proceedings of the National Academy of Sciences
of the USA, 106: 14716–14721.
Miller, G.E., and Chen, E. (2010). Harsh family climate in early life presages the emergence
of a proinflammatory phenotype in adolescence. Psychological Science 21: 848–856.
Morozink, J.A., Friedman, E.M., Coe, C.L., and Ryff, C.D. (2010). Socioeconomic and psy-
chosocial predictors of interleukin-6 in the MIDUS national sample. Health Psychology
29(6): 626–635.
Neelsen, S. and Stratmann, T. (2011). Effects of prenatal and early life malnutrition:
Evidence from the Greek famine. Journal of Health Economics, 30(3): 479–488.
O’Grada, C. (2009). Famine: A Short History. Princeton: Princeton University Press.
Onland-Moret, N.C., Peeters, P.H., Van Gils, C.H., Clavel-Chapelon, F., Key, T., Tjønneland,
A., et al. (2005). Age at menarche in relation to adult height: the EPIC study. American
Journal of Epidemiology, 162: 623–632.
41
Oppers, V.M. (1963). Analyse van de acceleratie van de menselijke lengtegroei door bepal-
ing van het tijdstip van de groeifasen. PhD thesis, University of Amsterdam, Amsterdam.
Painter, R.C., Roseboom, T.J., and Bleker, O.P. (2005). Prenatal exposure to the Dutch
Famine and disease in later life: an overview. Reproductive Toxicology, 20: 345–352.
Pollitt, R.A., K.M. Rose and J.S. Kaufman (2005). Evaluating the evidence for models
of life course socioeconomic factors and cardiovascular outcomes: A systematic review,
BMC Public Health 5(7): 1–13.
Rasmussen, K. (2001). The fetal origins hypothesis: challenges and opportunities for ma-
ternal and child nutrition. Annual Review of Nutrition, 21(1): 73–95.
Reichardt, S. and Zierenberg, M. (2009). Damals nach dem Krieg. Eine Geschichte Deutsch-
lands 1945 bis 1949. Munchen: Goldmann.
Ridder, G. and Moffitt, R. (2007). The econometrics of data combination, in: J.J. Heck-
man and E.E. Leamer (eds.), Handbook of Econometrics, Volume 6, North-Holland,
Amsterdam.
Rosenzweig, M. R. and Wolpin, K.I. (1988). Heterogeneity, intrafamily distribution, and
child health. Journal of Human Resources, 23(4): 437–461.
Schroder, M. (2011). Retrospective Data Collection in the Survey of Health, Ageing and
Retirement in Europe – SHARELIFE Methodology. Mannheim Research Institute for
the Economics of Ageing (MEA).
Schulz, L.C. (2010). The Dutch Hunger Winter and the developmental origins of health and
disease. Proceedings of the National Academy of Sciences of the USA, 107: 16757–16758.
Sparen, P., Vagero, D., Shestov, D.B., Plavinskaja, S., Parfenova, N., Hoptiar, V., et
al. (2004). Long term mortality after severe starvation during the siege of Leningrad:
prospective cohort study. British Medical Journal, 328: 11–15.
Stein, Z. and Susser, M., T.P. (1975). Fertility, fecundity, famine: food rations in the Dutch
famine 1944/5 have a causal relation to fertility, and probably to fecundity. Human
Biology, 47(1): 131–154.
Susser, E.S., and Lin, S.P. (1992). Schizophrenia after prenatal exposure to the Dutch
Hunger Winter of 1944-45. Archives of General Psychiatry, 49: 983–988.
Susser, M., and Stein, Z. (1994). Timing in prenatal nutrition: A reprise of the Dutch
famine study. Nutrition Reviews, 52: 84–94.
Trittel, G. J. (1990). Hunger und Politik – Die Ernahrungskrise in der Bizone (1945–1949).
Campus Verlag. in German only.
42
Valaoras, V.G. (1946). Effects of famine on the population of Greece. The Milbank Memo-
rial Fund Quarterly, 24: 215–235.
Van den Berg, G.J., Lundborg, P., Nystedt, P., and Rooth, D. (2010). Critical Periods Dur-
ing Childhood and Adolescence: A Study of Adult Height Among Immigrant Siblings.
Working paper, IZA Bonn.
Van den Berg, G.J. and Pinger, P.R. (2011). A validation study of intergenerational effects
of early-life conditions on offsprings economic and health outcomes potentially driven by
epigenetic imprinting: Evidence from the German famine of 1916-1918. Working paper,
University of Mannheim.
Van den Berg, G.J. and Lindeboom, M. (2012). Aging: conditions early in life and health
and mortality at advanced ages, in: A. Culyer, ed., Encyclopedia of Health Economics,
Elsevier, Amsterdam.
Whitaker, R., Phillips, S., and Orzol, S. (2006). Food insecurity and the risks of depres-
sion and anxiety in mothers and behavior problems in their preschool-aged children.
Pediatrics, 118(3): e859-e868.
Willenborg, K.-H. (1979). Uberleben nach dem Zusammenbruch – die Not der Besiegten.
In: Weber, J., ed., Geschichte der Bundesrepublik Deutschland, Band1: Auf dem Wege
zur Republik 1945–1947. Schoningh.
Zemel, B. (2002). Body composition during growth and development. In: N. Cameron, ed.,
Human Growth and Development. St. Louis: Academic Press.
Zhang, T.Y., Bagot, R., Parent, C., Nesbitt, C., Bredy, T.W., Caldji, C., et al. (2006). Ma-
ternal programming of defensive responses through sustained effects on gene expression.
Biological Psychology, 73(1): 72–89.
43
Publication series published by IFAU – latest issues
Rapporter/Reports
2012:1 Lundin Martin and Jonas Thelander ”Ner och upp – decentralisering och centralisering inom svensk arbetsmarknadspolitik 1995–2010”
2012:2 Edmark Karin, Che-Yuan Liang, Eva Mörk and Håkan Selin ”Jobbskatteavdraget”
2012:3 Jönsson Lisa and Peter Skogman Thoursie ”Kan privatisering av arbetslivs- inriktad rehabilitering öka återgång i arbete?”
2012:4 Lundin Martin and PerOla Öberg ”Politiska förhållanden och användningen av expertkunskaper i kommunala beslutsprocesser”
2012:5 Fredriksson Peter, Hessel Oosterbeek and Björn Öckert ”Långsiktiga effekter av mindre klasser”
2012:6 Liljeberg Linus, Anna Sjögren and Johan Vikström ”Leder nystartsjobben till högre sysselsättning?”
Working papers
2012:1 Edmark Karin, Che-Yuan Liang, Eva Mörk and Håkan Selin ”Evaluation of the Swedish earned income tax credit”
2012:2 Jönsson Lisa and Peter Skogman Thoursie “Does privatisation of vocational rehabili-tation improve labour market opportunities? Evidence from a field experiment in Sweden”
2012:3 Johansson Per and Martin Nilsson “Should sickness insurance and health care be administrated by the same jurisdiction? An empirical analysis
2012:4 Lundin Martin and PerOla Öberg “Towards reason: political disputes, public attention and the use of expert knowledge in policymaking”
2012:5 Fredriksson Peter, Björn Öckert and Hessel Oosterbeek “Long-term effects of class size”
2012:6 van den Berg Gerard J, Pia R. Pinger and Johannes Schoch “Instrumental variable estimation of the causal effect of hunger early in life on health later in life”
Dissertation series 2011:1 Hensvik Lena “The effects of markets, managers and peers on worker outcomes”