Embed Size (px)
Citation preview
The Modern Power Grid,Eskom’s 765KV Super Grid & Planning Strategies
Presenters: Gavin Bruce & Ronald MaraisCo-author: Dr Dzevad Muftic
Eskom South Africa
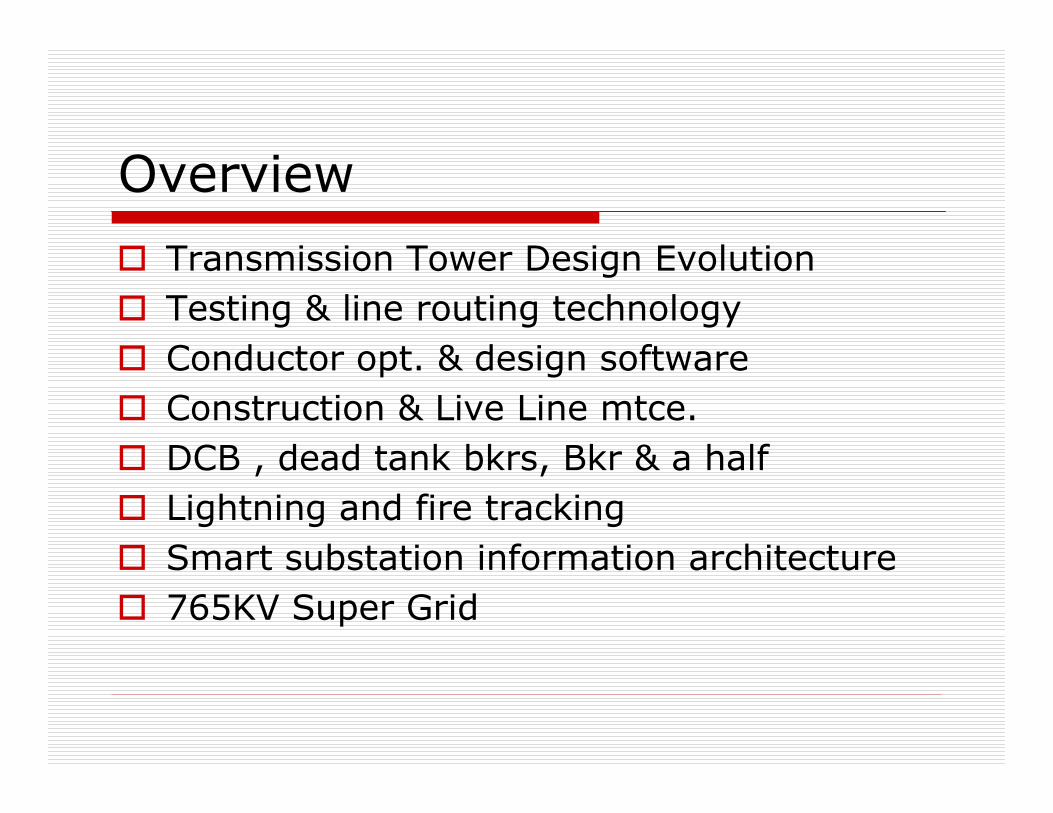
Overview
� Transmission Tower Design Evolution
� Testing & line routing technology
� Conductor opt. & design software
� Construction & Live Line mtce.
� DCB , dead tank bkrs, Bkr & a half
� Lightning and fire tracking
� Smart substation information architecture
� 765KV Super Grid
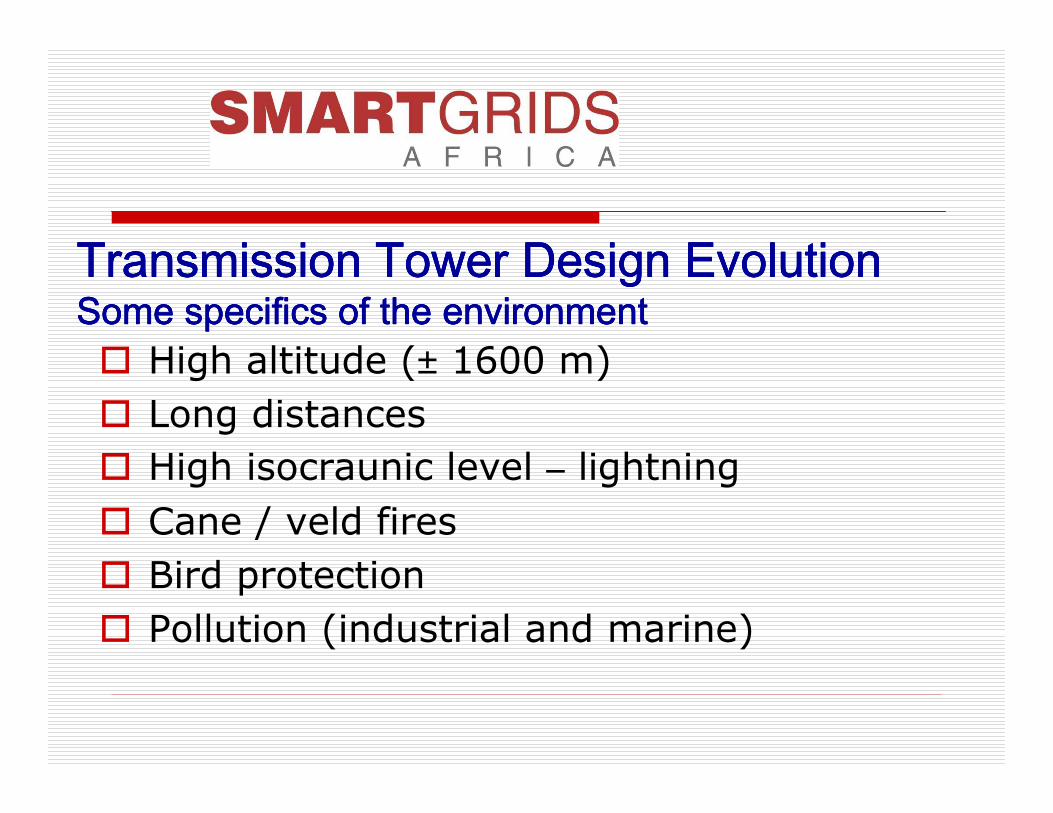
Transmission Tower Design EvolutionTransmission Tower Design EvolutionTransmission Tower Design EvolutionTransmission Tower Design EvolutionSome specifics of the environmentSome specifics of the environmentSome specifics of the environmentSome specifics of the environment� High altitude (± 1600 m)
� Long distances
� High isocraunic level – lightning
� Cane / veld fires
� Bird protection
� Pollution (industrial and marine)
+
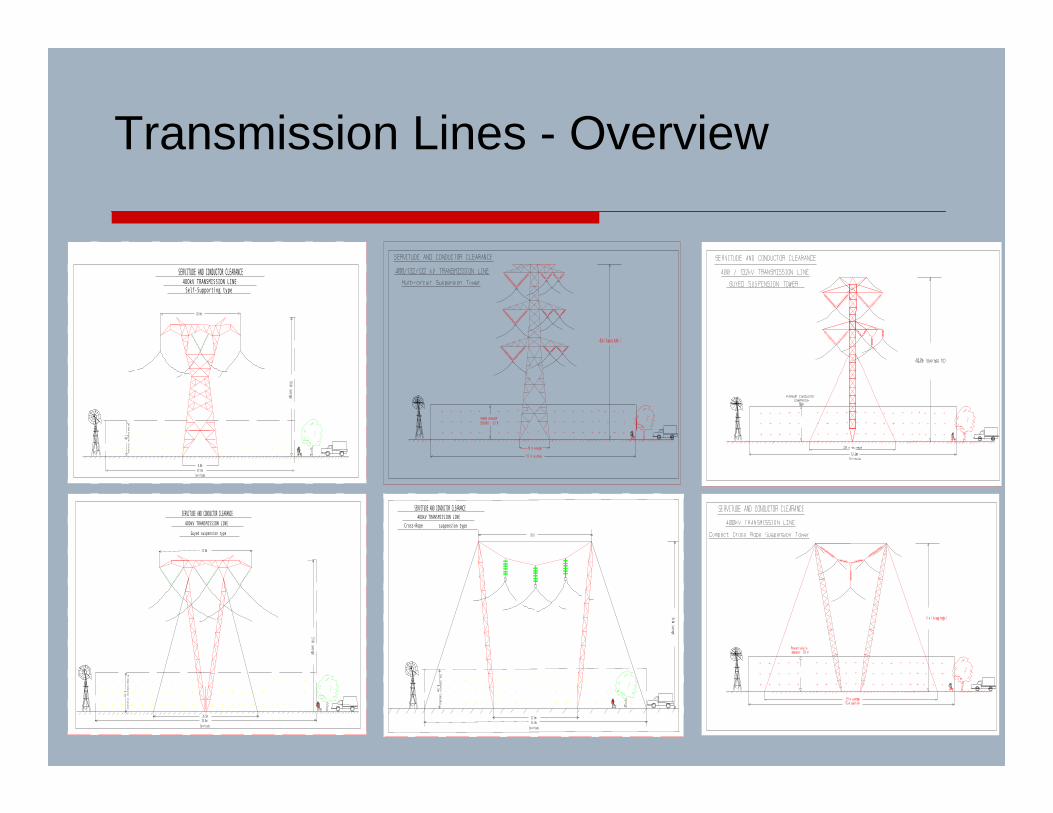
Minimum Conductor clearance
SERVITUDE AND CONDUCTOR CLEARANCE400kV TRANSMISSION LINE
47.0m
7.8m++ +
++ + +
++ +
+
+ + +
+ + +
+ + +
+ + +
++
+ +++
+ + + + +
++ + +
+ + + +
+ + ++
+
Servitude
30.0m (average)
20.0m
+
8.8m
++
+
Self-Supporting type
+
Minimum Conductor clearance
++ +
++ + +
++ +
+
+ +
+ + +
+ + +
8.5m
V
V
V
V
V
V
+ + + ++++
+ + + + ++
+ ++
+
+ + + + + + +
++ +
+ ++
++
+ ++
+
++
+ +
+ +
SERVITUDE AND CONDUCTOR CLEARANCE
400kV TRANSMISSION LINE
Guyed suspension type
26.0m
Servitude
55.0m V
33.0m (average)
23.0mV V
+ ++
+++
+ + + + +
++
++ +
+ +
+
++
++
+
++
+
++
+
+ + +
++ +
+ ++
++
+
++
+
++
+
+ +
++
++
SERVITUDE AND CONDUCTOR CLEARANCE
suspension typeCross-Rope
+
+
400kV TRANSMISSION LINE
8.5m
Min. Conductor clearance
Servitude
21.0m
55.0m
28.0
V
V
V
V
V
V
V
V
36.0m (average)
+ ++
Transmission Lines - Overview
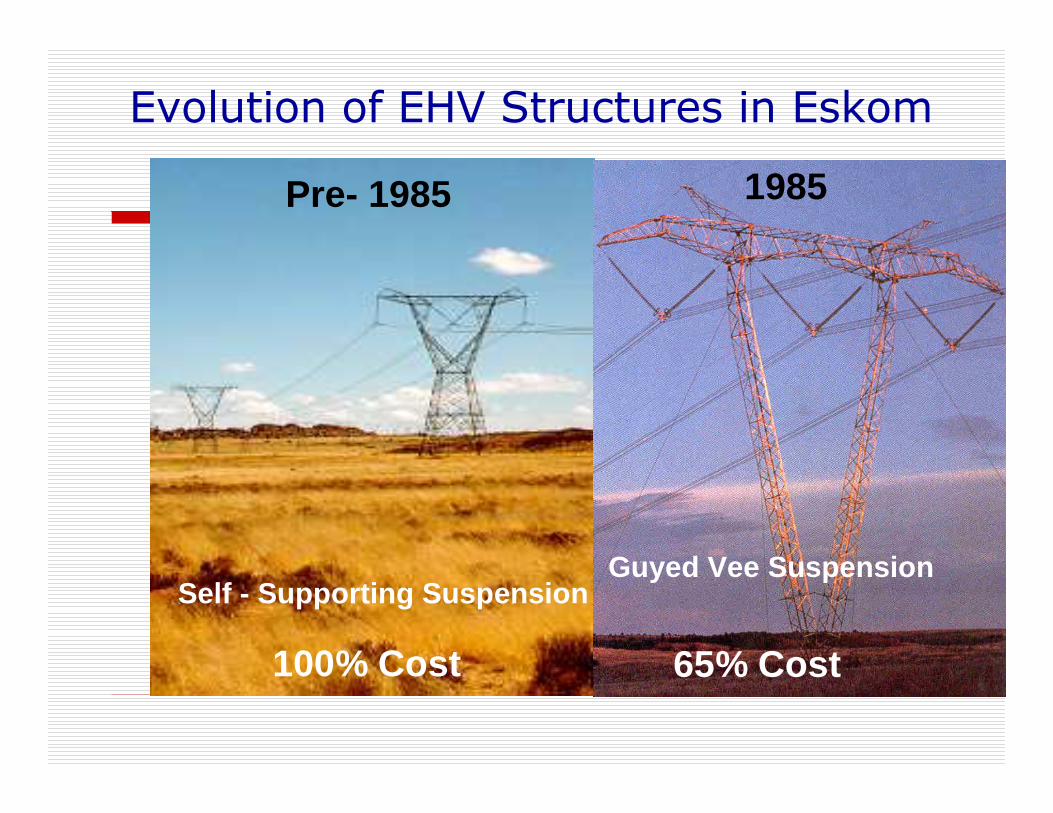
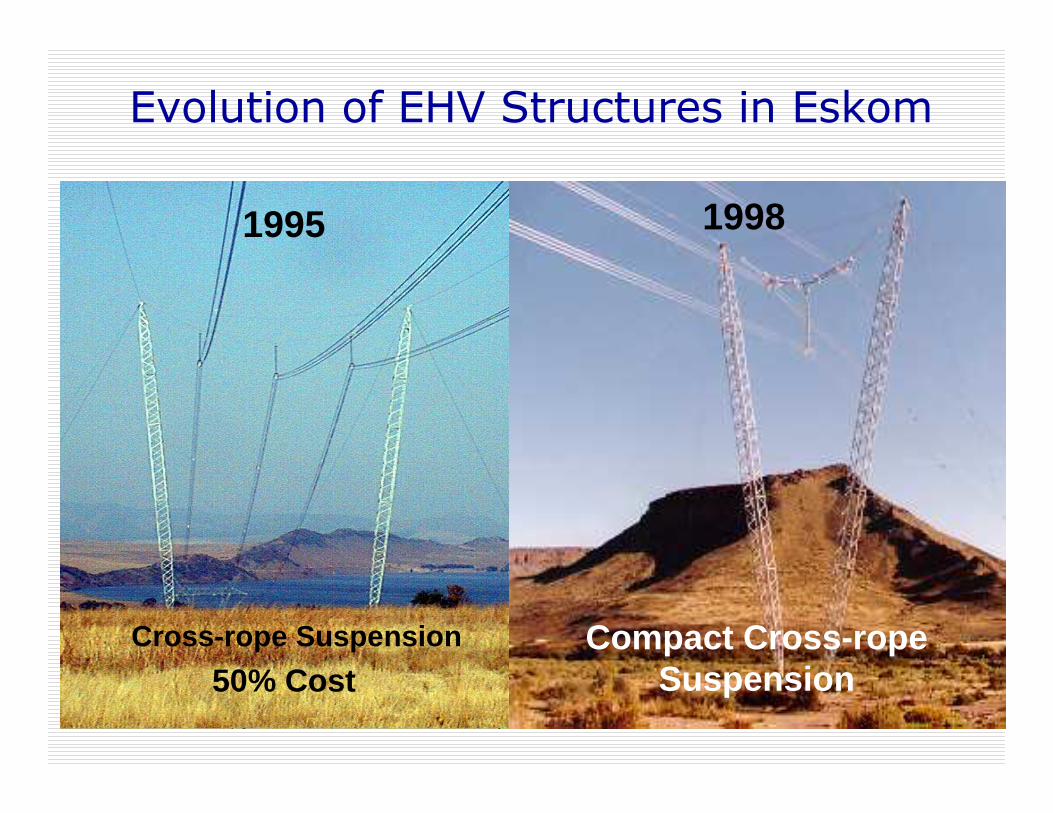
Evolution of EHV Structures in Eskom
100% Cost
Self - Supporting Suspension
Pre- 1985 1985
65% Cost
Guyed Vee Suspension
Evolution of EHV Structures in Eskom
50% CostCross-rope Suspension
1995
50% Cost
Cross-rope Suspension
1998
Compact Cross-rope Suspension
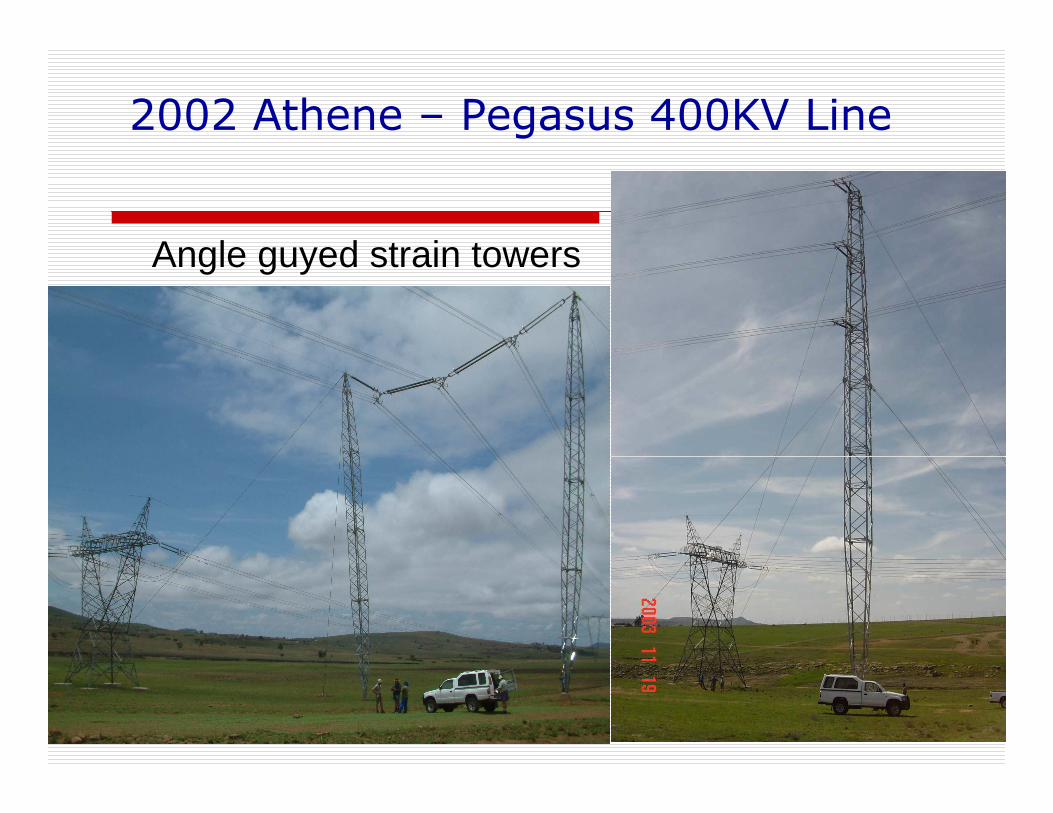
2002 Athene – Pegasus 400KV Line
Angle guyed strain towers
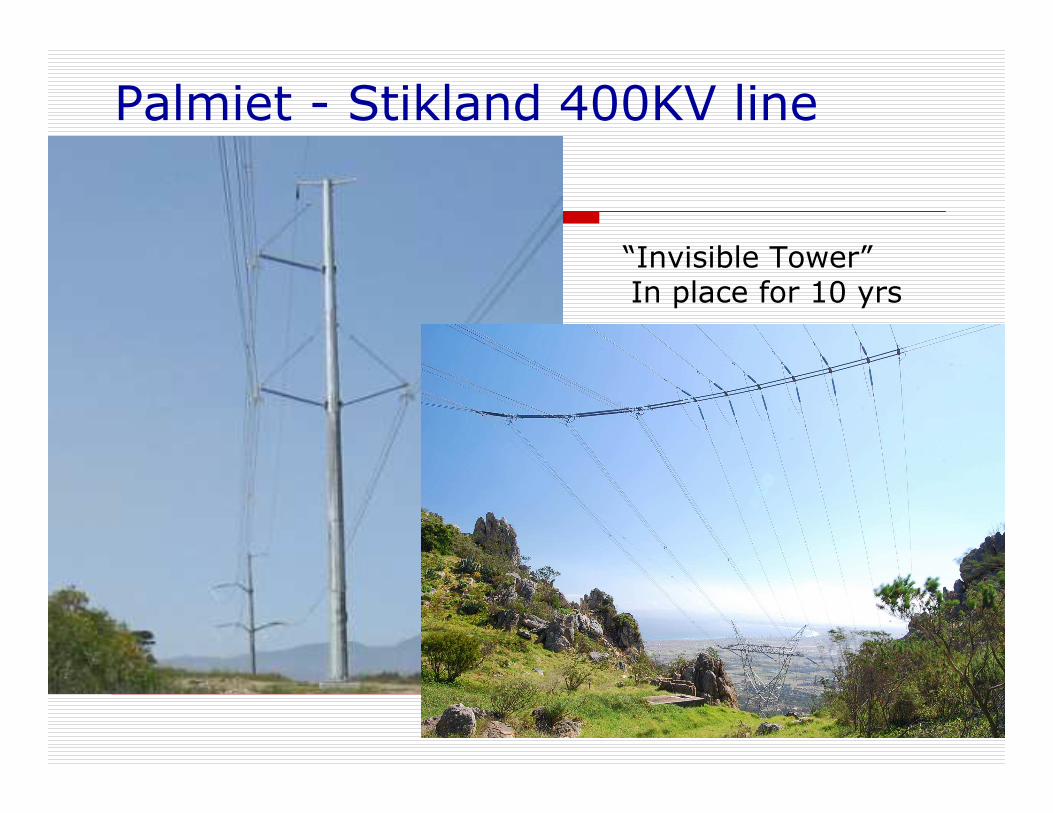
Palmiet - Stikland 400KV line
“Invisible Tower”In place for 10 yrs
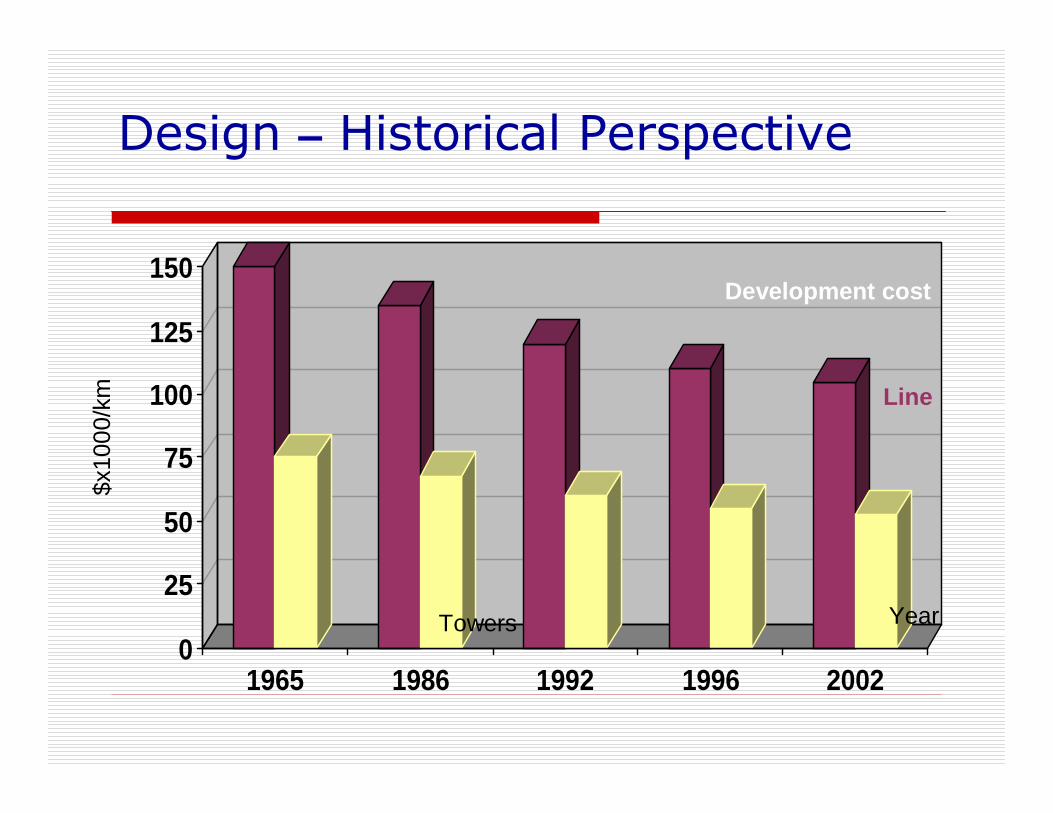
Design – Historical Perspective
0
25
50
75
100
125
150
1965 1986 1992 1996 2002
Line
Development cost
Towers
$x10
00/k
m
Year
� Testing at high altitudes & industrial & marine pollution test sites
� Full scale testing to prove design before going into application - to minimise risk
� Improved confidence level – no failure to date from poor design
Testing facilities - motives
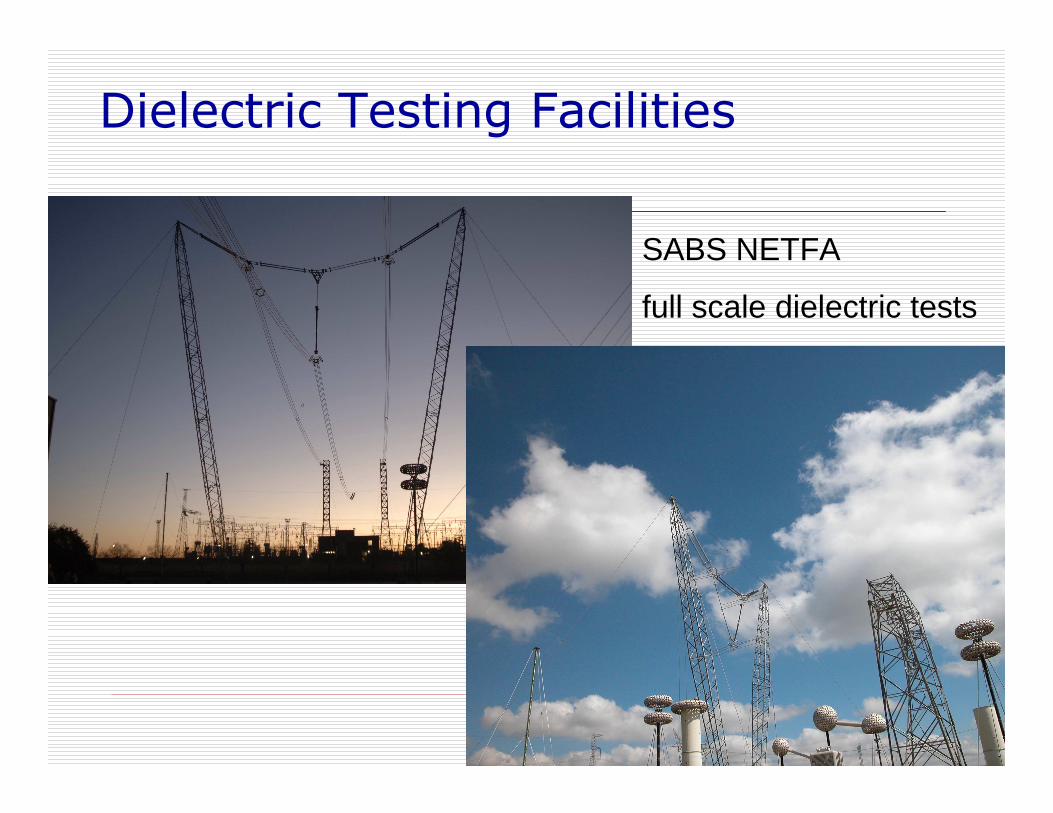
Dielectric Testing Facilities
SABS NETFA
full scale dielectric tests
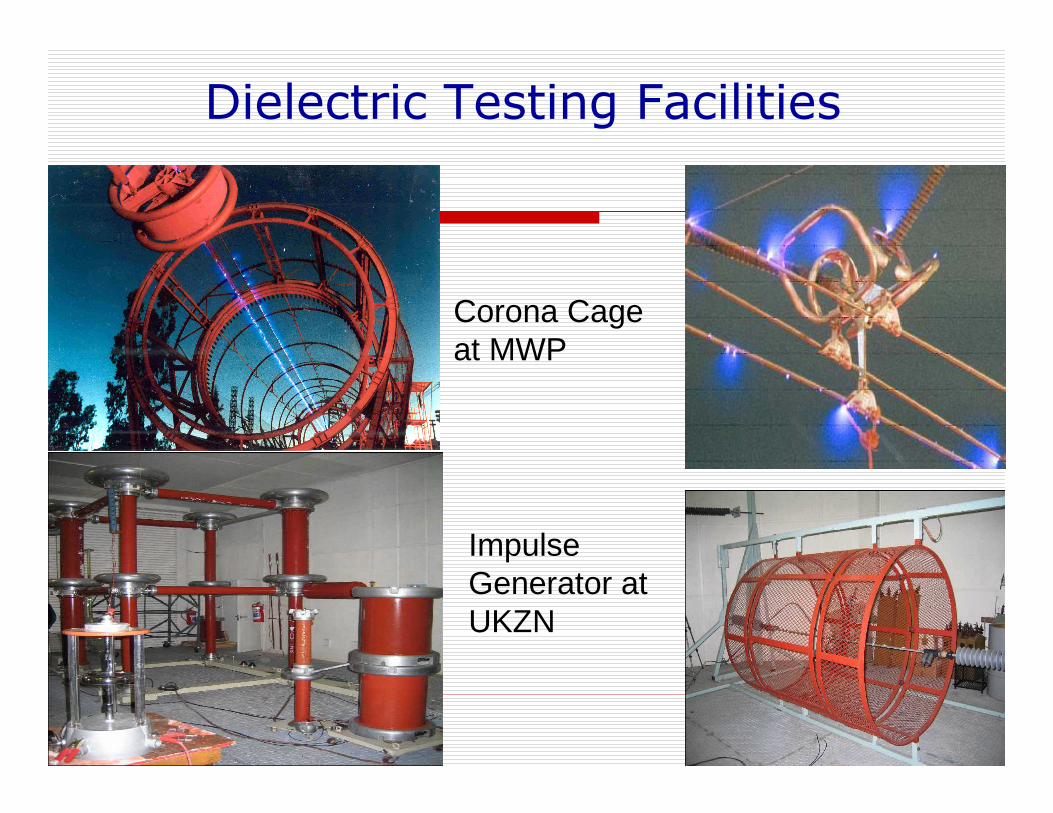
Dielectric Testing Facilities
Corona Cageat MWP
ImpulseGenerator atUKZN
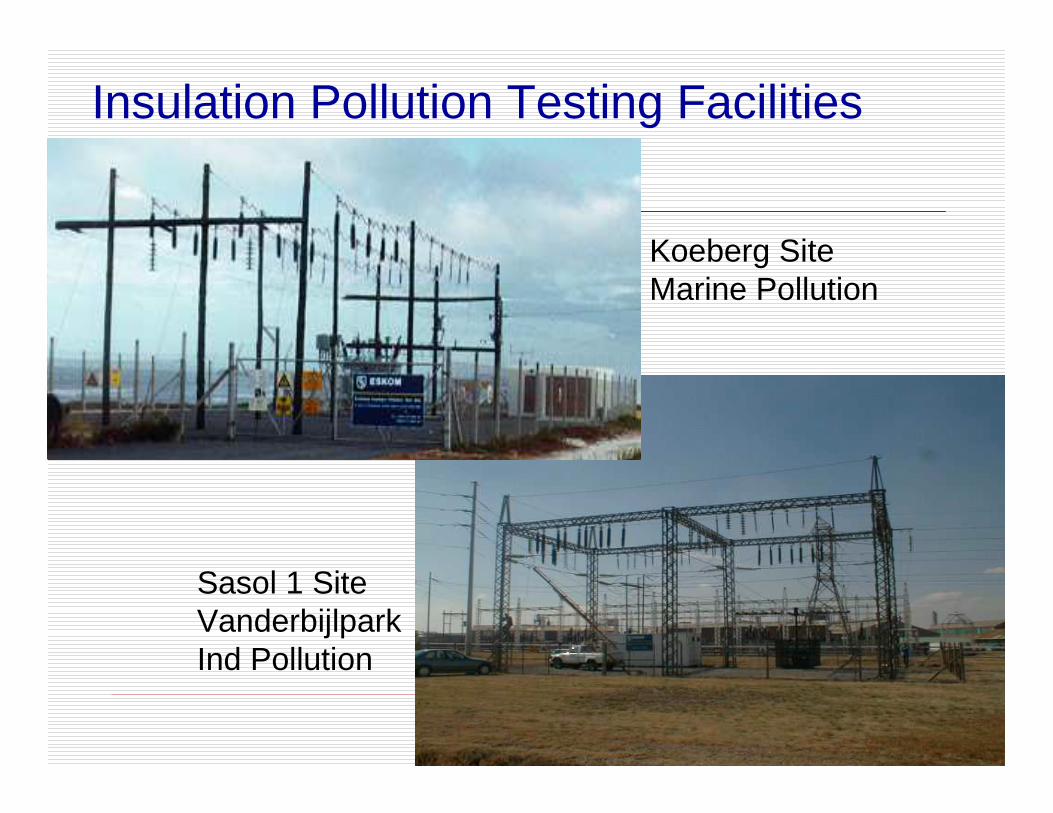
Insulation Pollution Testing Facilities
Koeberg SiteMarine Pollution
Sasol 1 SiteVanderbijlparkInd Pollution
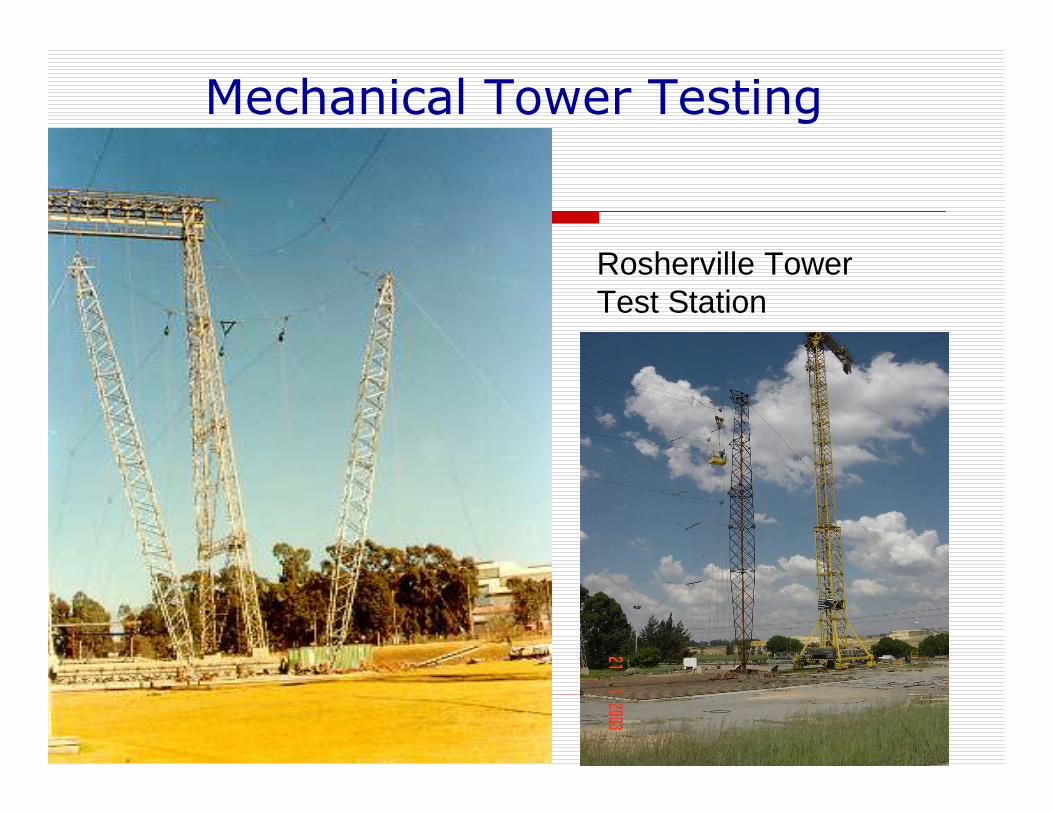
Mechanical Tower Testing
Rosherville TowerTest Station
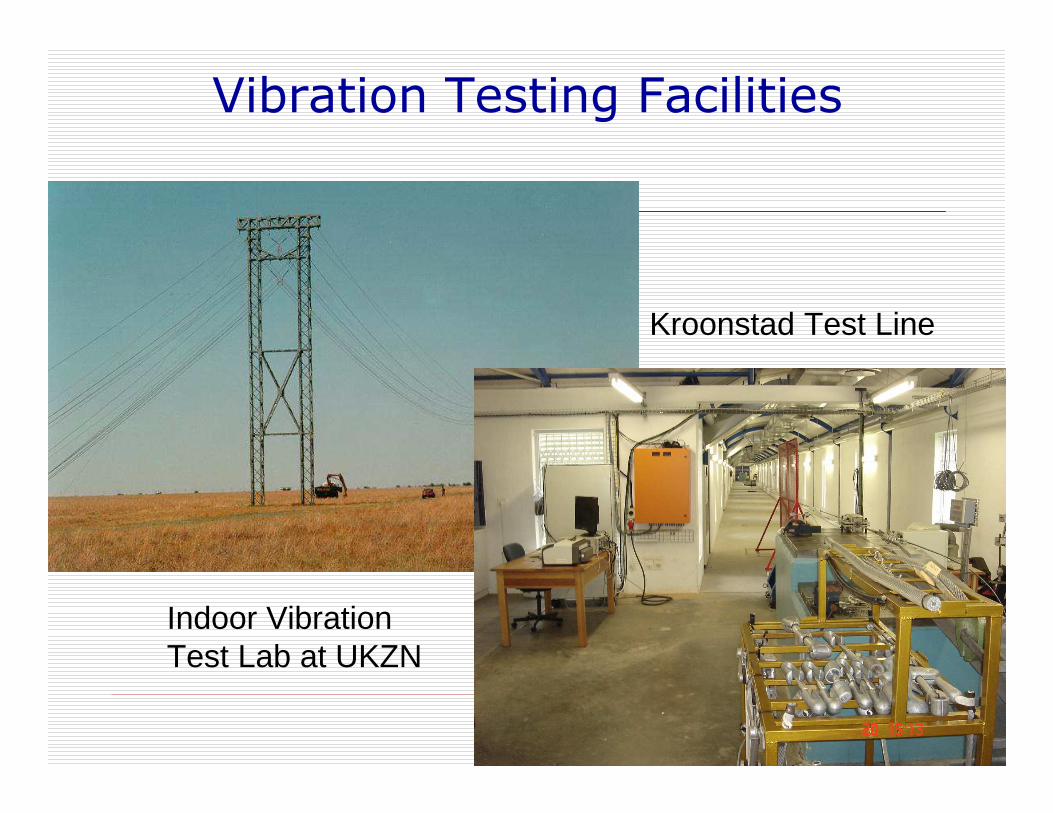
Vibration Testing Facilities
Kroonstad Test Line
Indoor VibrationTest Lab at UKZN
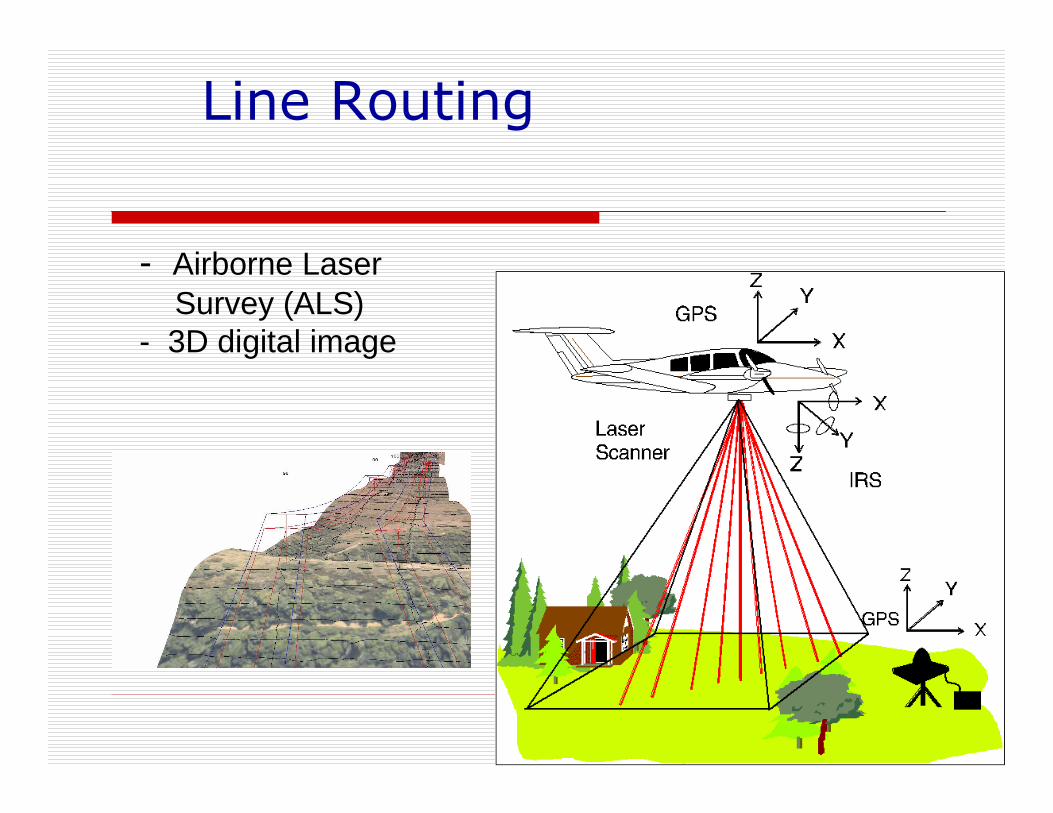
- Airborne LaserSurvey (ALS)
- 3D digital image
Line Routing
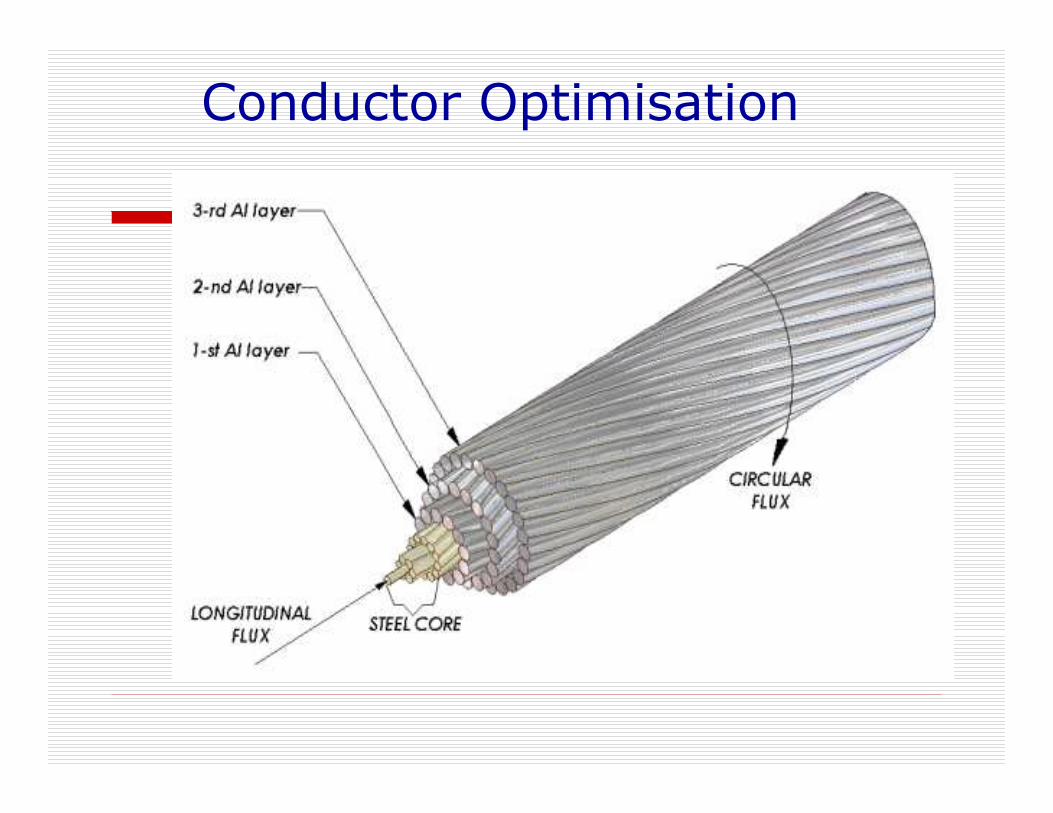
Conductor Optimisation
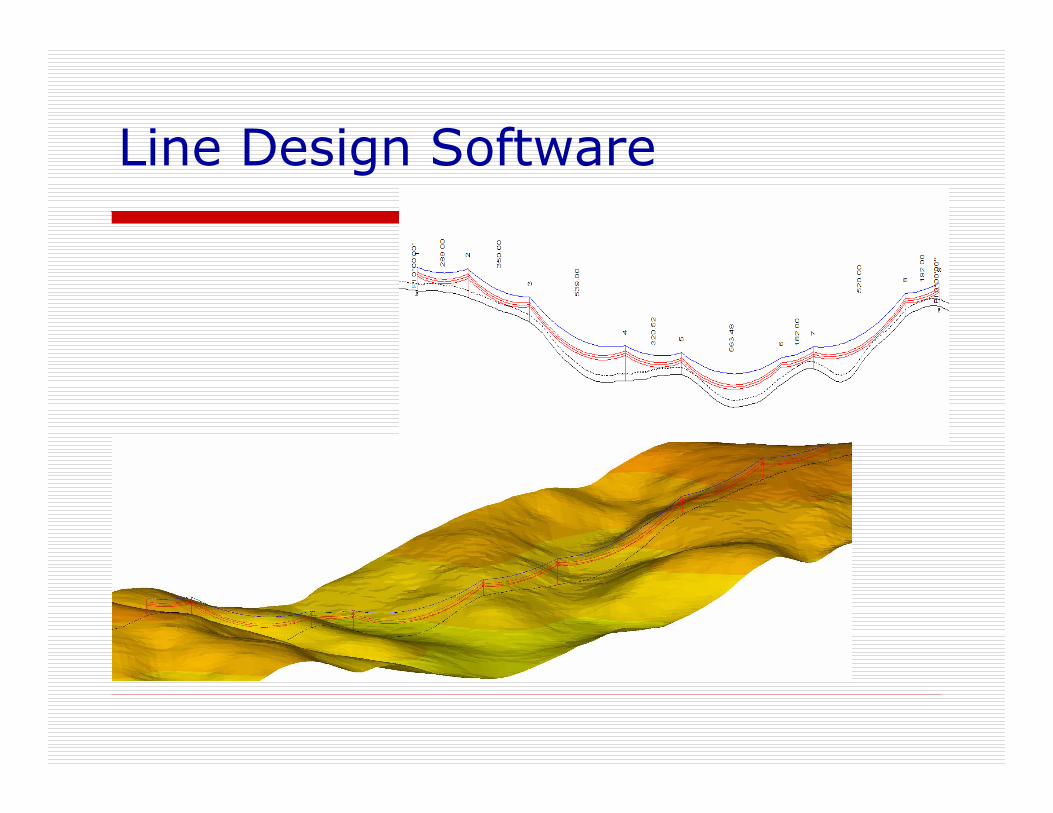
Line Design Software
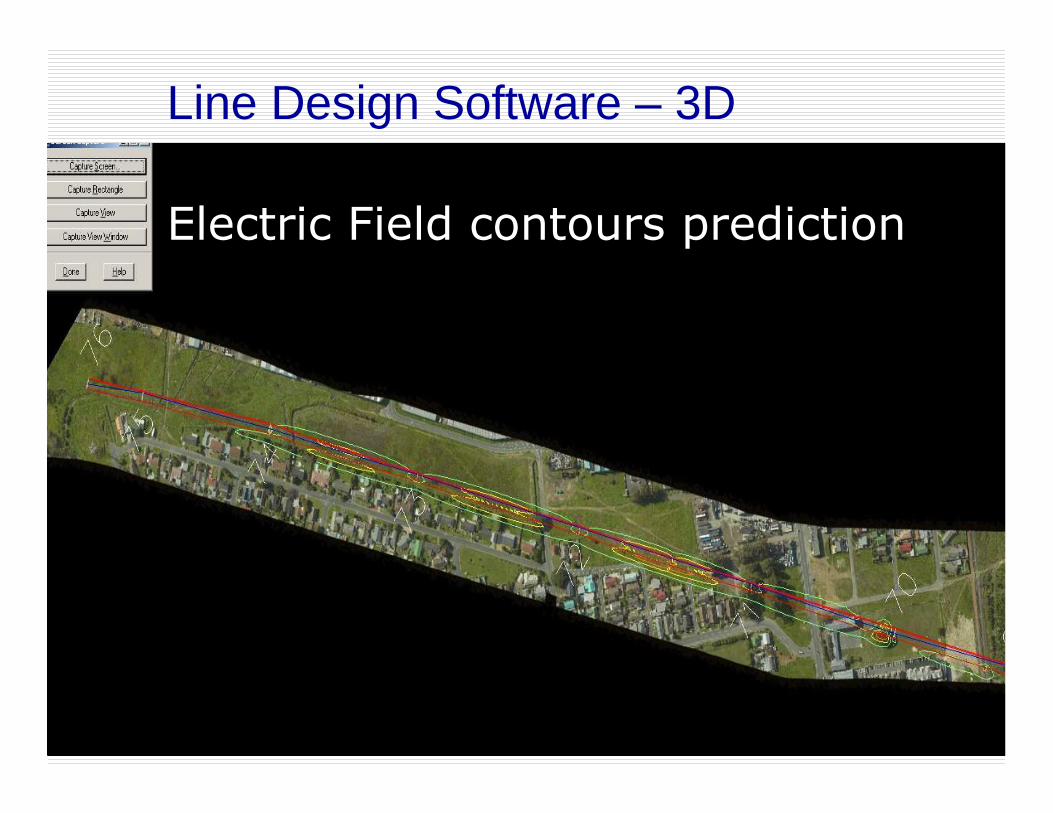
Electric Field contours prediction
Line Design Software – 3D
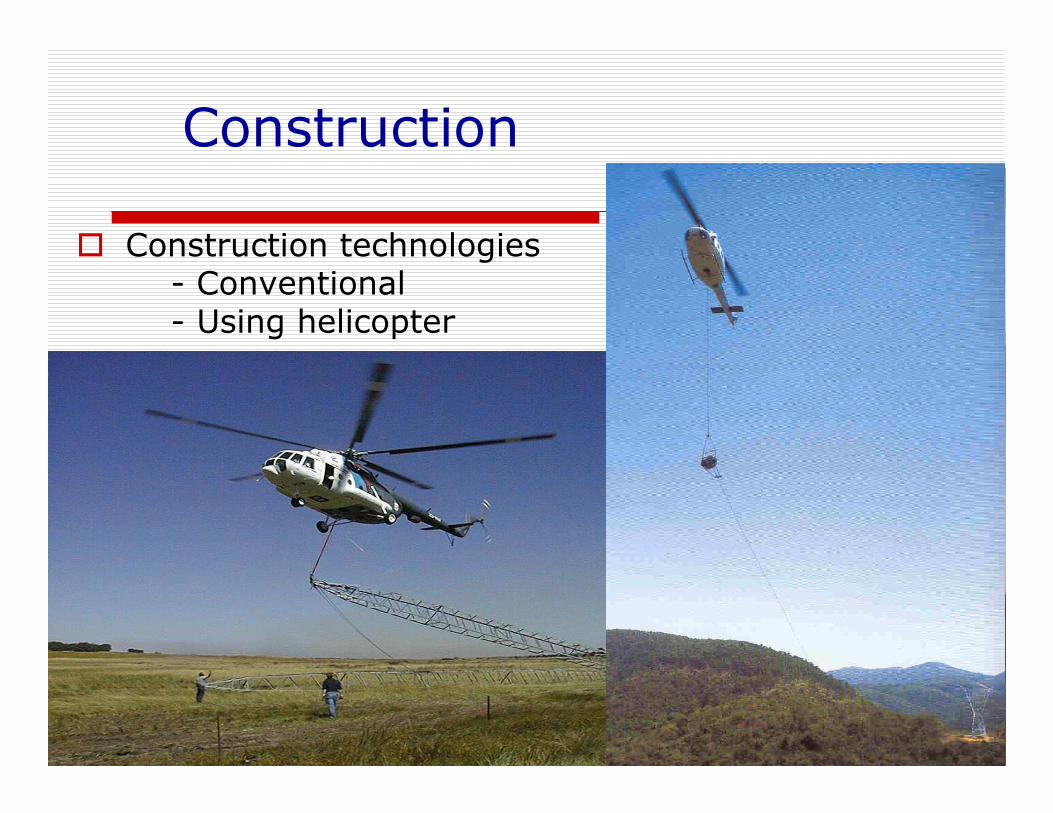
Construction
� Construction technologies- Conventional- Using helicopter
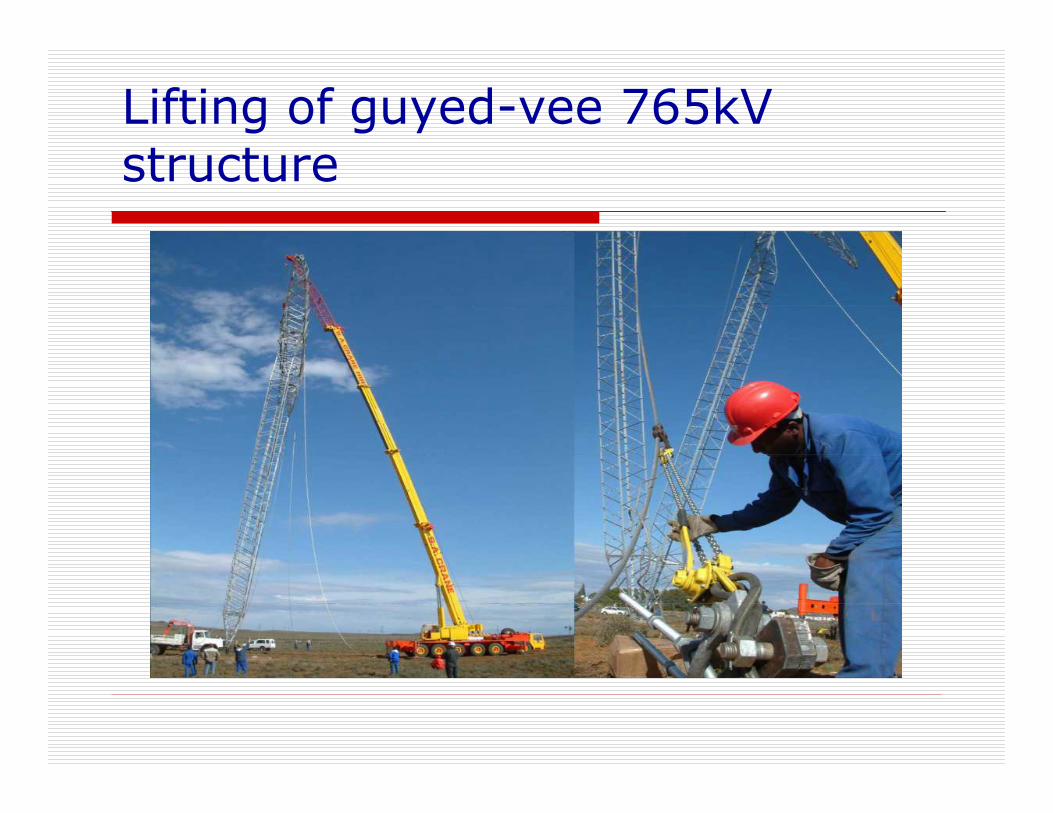
Lifting of guyed-vee 765kV structure
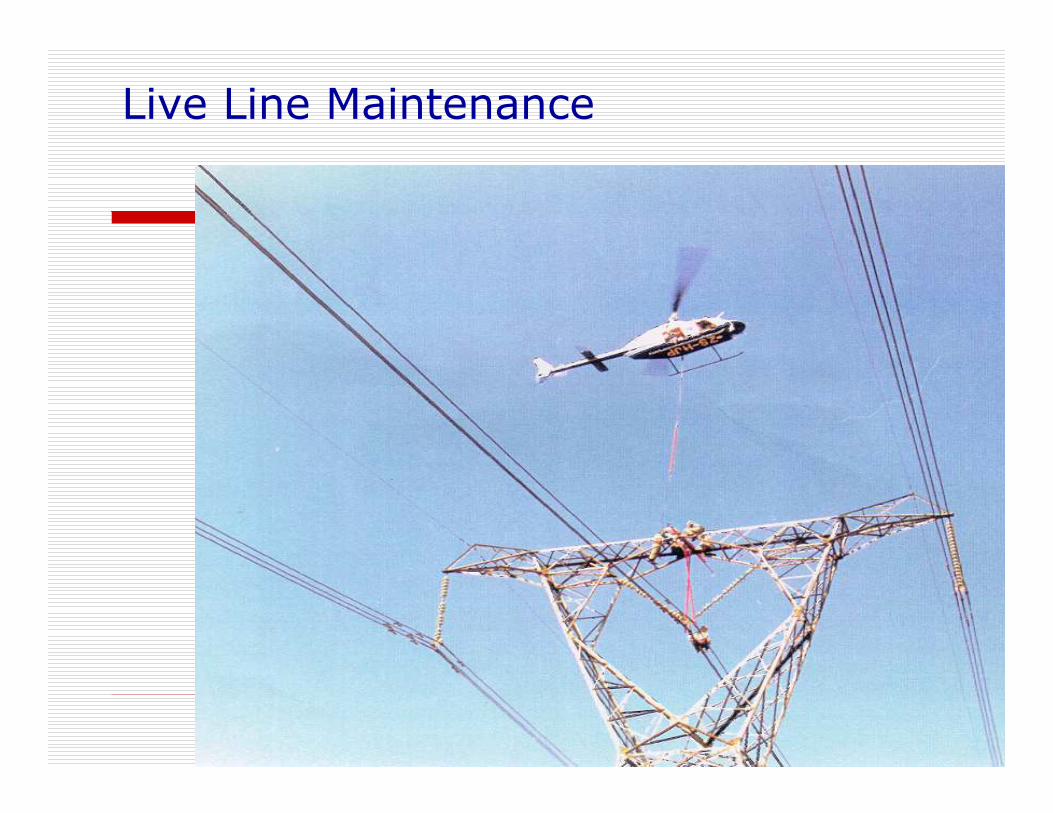
Live Line Maintenance
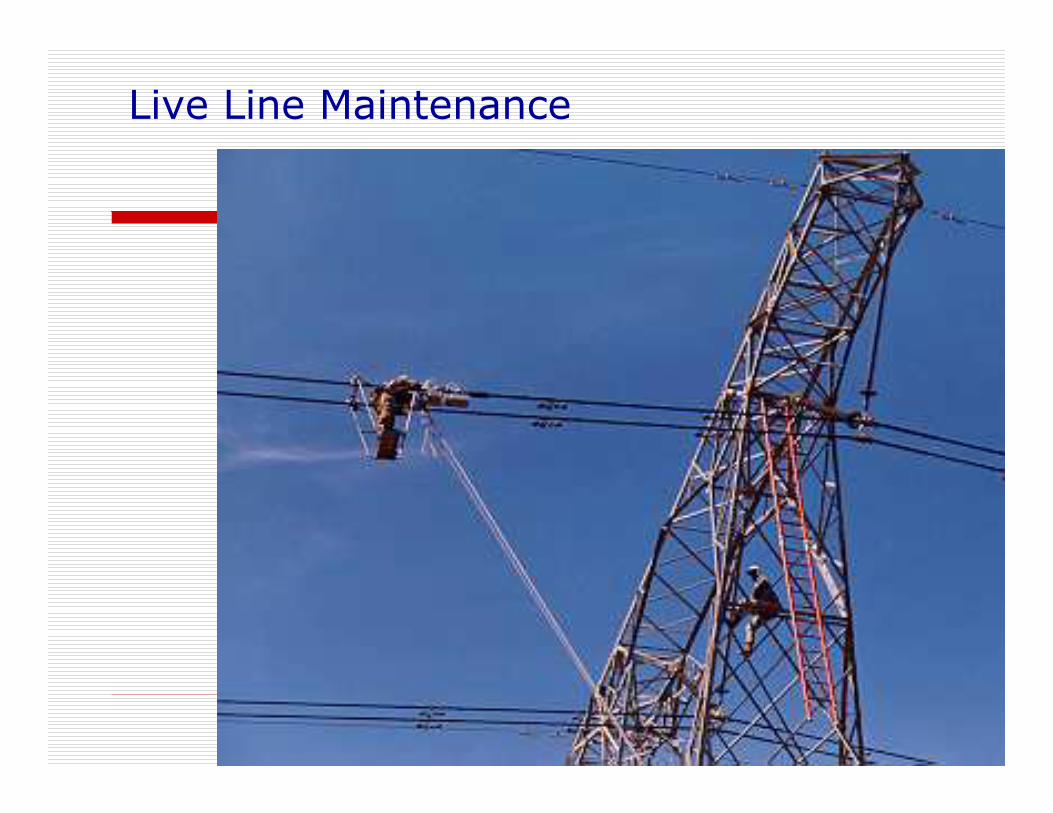
Live Line Maintenance
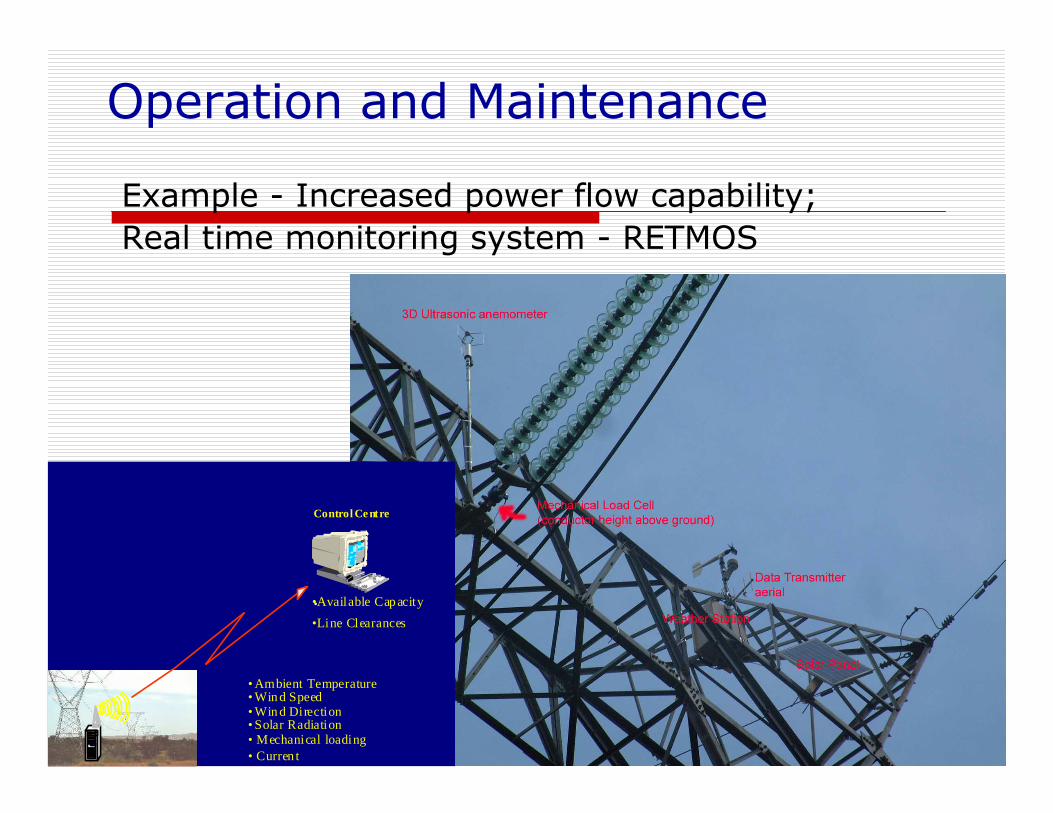
Operation and Maintenance
Example - Increased power flow capability;
Real time monitoring system - RETMOS
Ambient Temperature•• Wind Speed• Wind Direction• Solar Radiation• Mechanical loading• Curren t
Control Ce ntre
••Available Capacity
•Line Clearances
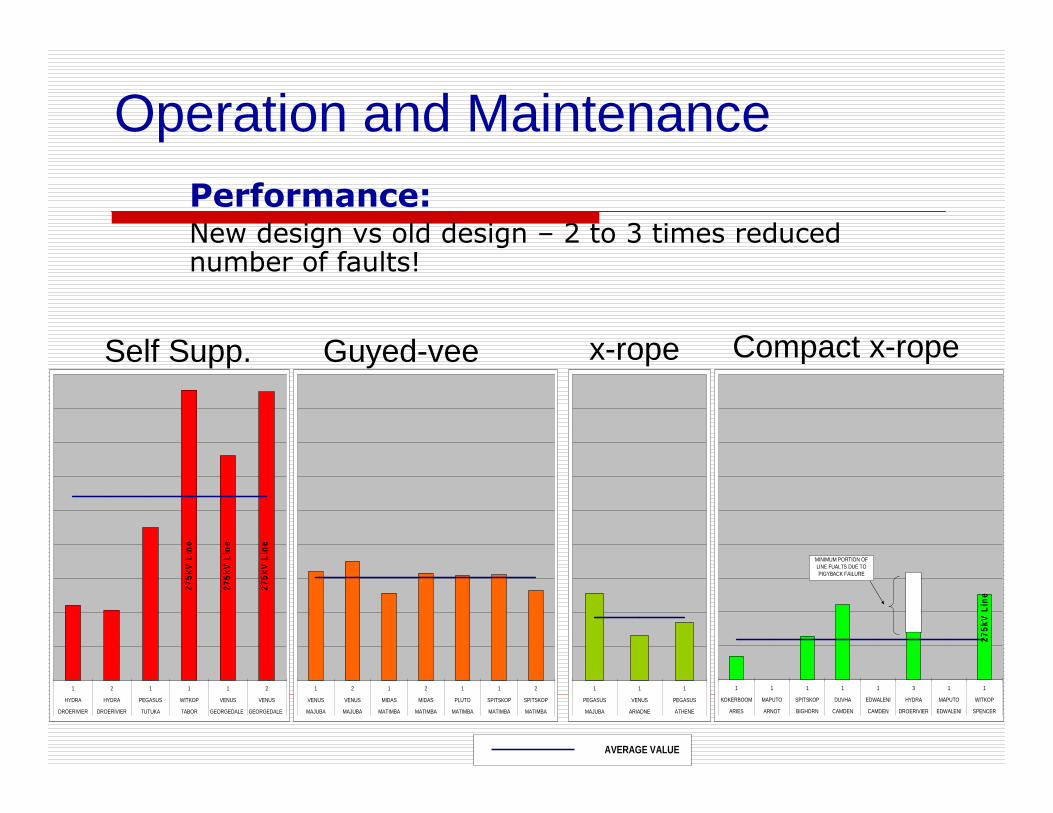
Operation and MaintenancePerformance:New design vs old design – 2 to 3 times reduced number of faults!
1 2 1 1 1 2
HYDRA HYDRA PEGASUS WITKOP VENUS VENUS
DROERIVIER DROERIVIER TUTUKA TABOR GEORGEDALE GEORGEDALE
1 2 1 2 1 1 2
VENUS VENUS MIDAS MIDAS PLUTO SPITSKOP SPITSKOP
MAJUBA MAJUBA MATIMBA MATIMBA MATIMBA MATIMBA MATIMBA
1 1 1
PEGASUS VENUS PEGASUS
MAJUBA ARIADNE ATHENE
1 1 1 1 1 3 1 1
KOKERBOOM MAPUTO SPITSKOP DUVHA EDWALENI HYDRA MAPUTO WITKOP
ARIES ARNOT BIGHORN CAMDEN CAMDEN DROERIVIER EDWALENI SPENCER
AVERAGE VALUE
275k
V L
ine
275k
V L
ine
275k
V L
ine
275k
V L
ine
MINIMUM PORTION OF LINE FUALTS DUE TO PIGYBACK FAILURE
Self Supp. Guyed-vee x-rope Compact x-rope
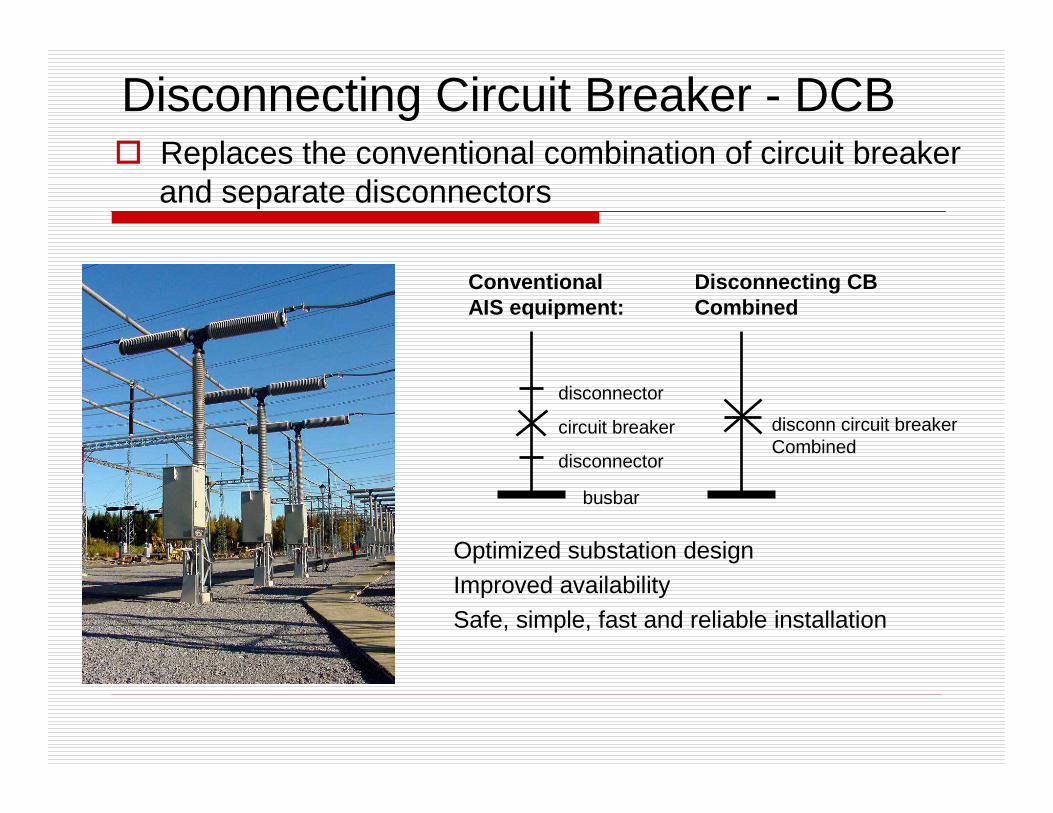
� Replaces the conventional combination of circuit breakerand separate disconnectors
ConventionalAIS equipment:
circuit breaker
disconnector
disconnector
busbar
disconn circuit breakerCombined
Disconnecting CBCombined
Optimized substation design
Improved availability
Safe, simple, fast and reliable installation
Disconnecting Circuit Breaker - DCB
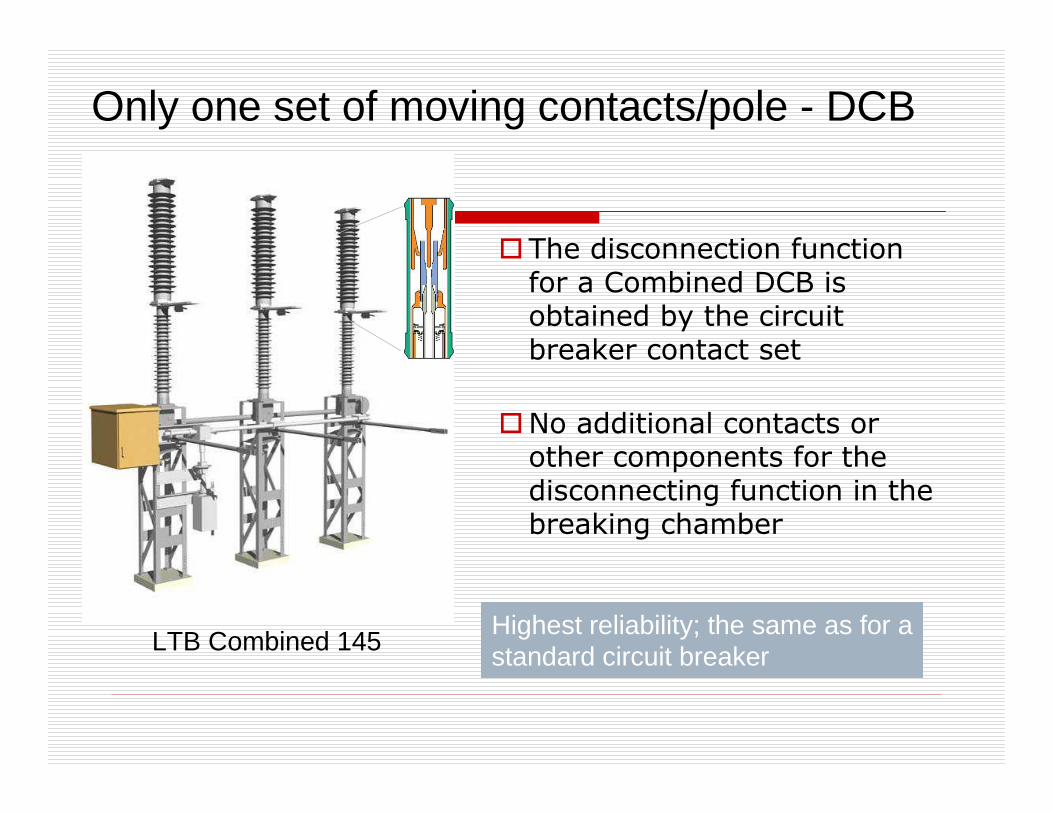
Only one set of moving contacts/pole - DCB
LTB Combined 145
�The disconnection function for a Combined DCB is obtained by the circuit breaker contact set
�No additional contacts or other components for the disconnecting function in the breaking chamber
Highest reliability; the same as for a standard circuit breaker
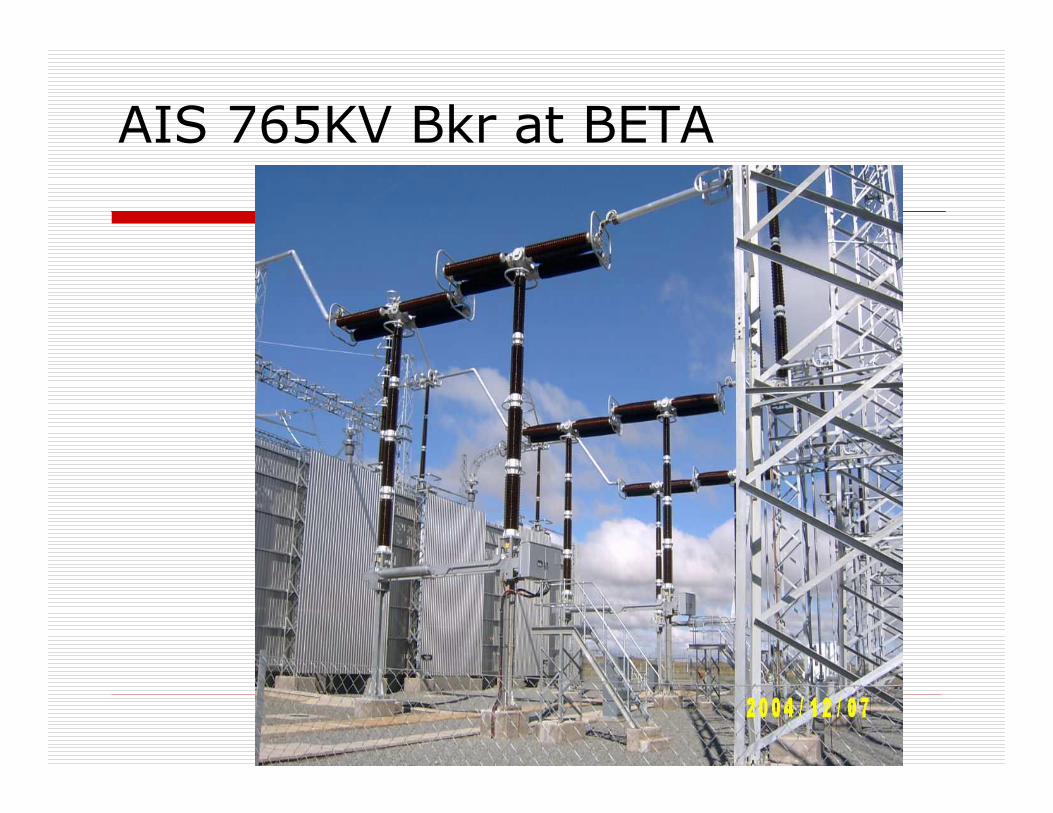
AIS 765KV Bkr at BETA
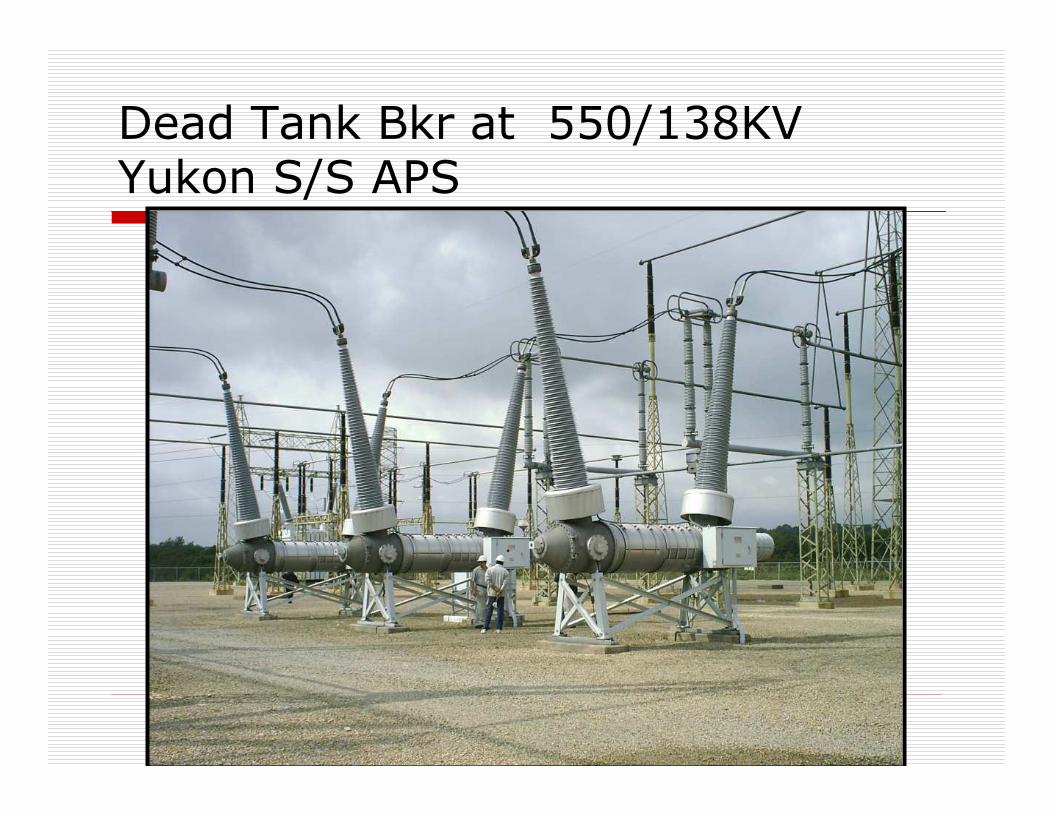
Dead Tank Bkr at 550/138KV Yukon S/S APS
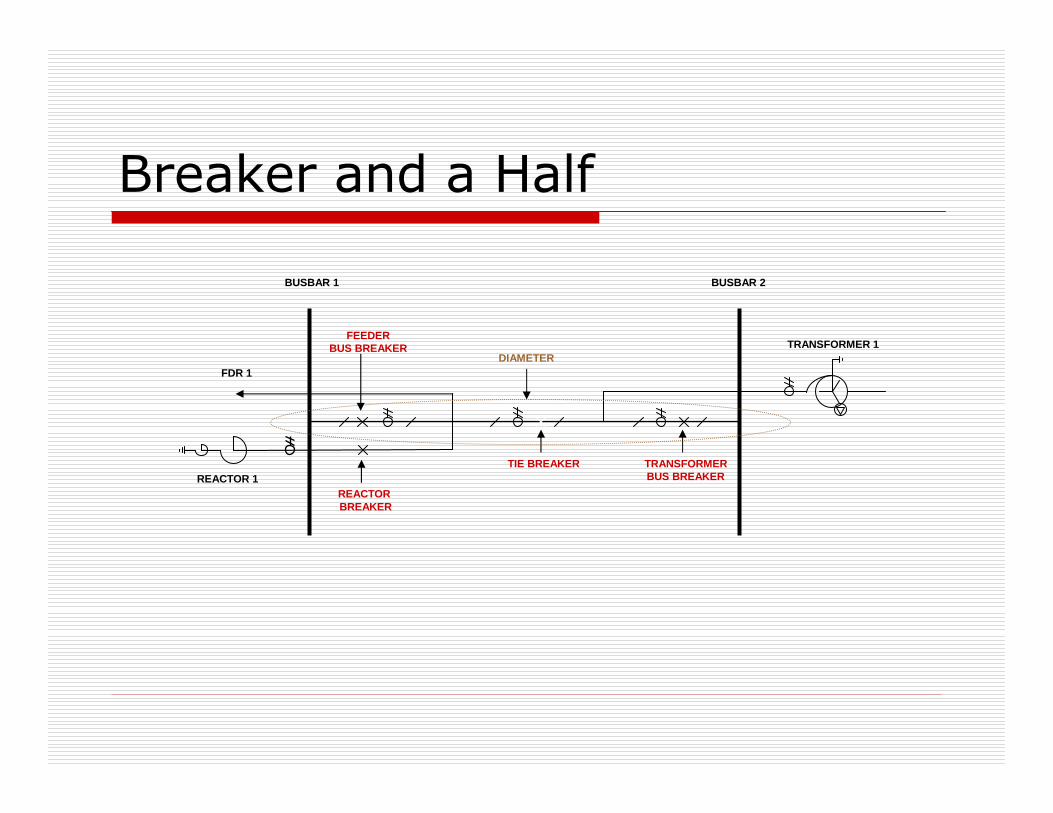
Breaker and a Half
REACTOR 1
FDR 1
TRANSFORMER 1
TIE BREAKER
BUSBAR 1 BUSBAR 2
DIAMETER
TRANSFORMERBUS BREAKER
FEEDERBUS BREAKER
REACTORBREAKER
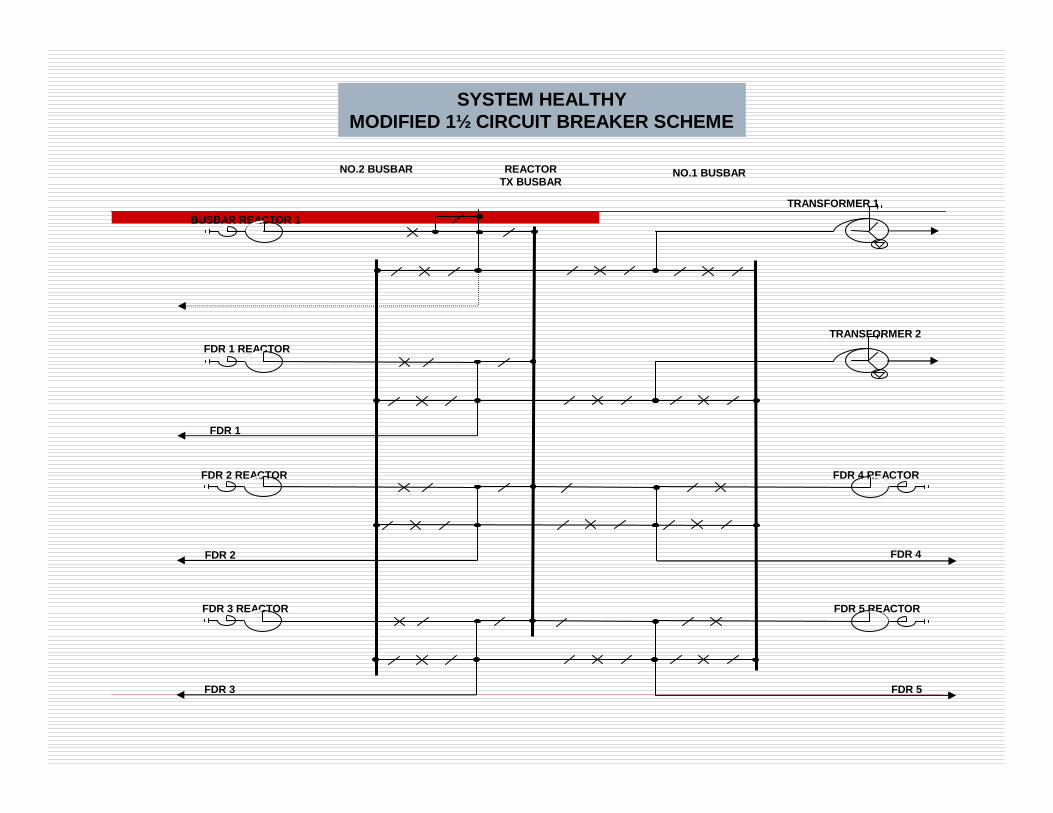
SYSTEM HEALTHYMODIFIED 1½ CIRCUIT BREAKER SCHEME
REACTORTX BUSBAR
NO.1 BUSBARNO.2 BUSBAR
BUSBAR REACTOR 1
TRANSFORMER 1
FDR 1
FDR 1 REACTORTRANSFORMER 2
FDR 2 FDR 4
FDR 2 REACTOR FDR 4 REACTOR
FDR 3 FDR 5
FDR 3 REACTOR FDR 5 REACTOR
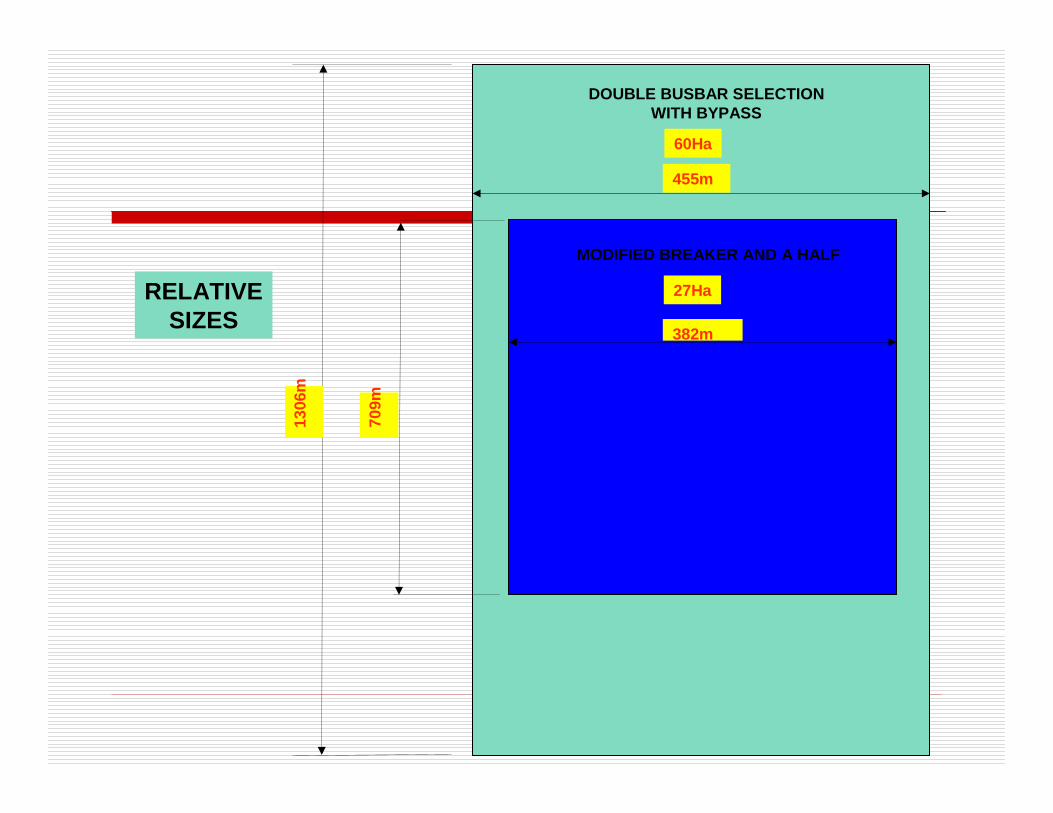
DOUBLE BUSBAR SELECTIONWITH BYPASS
MODIFIED BREAKER AND A HALF
709m
382m
1306
m
455m
60Ha
27HaRELATIVESIZES
ADVANTAGES OF MODIFIED 1½CIRCUIT BREAKER
� Busbar fault does not cause circuit interruption
� Power flow is automatically redirected
� Can carry out maintenance on all circuit breakers without removing circuit from service (not only feeders as in double bus selection with bypass)
� Initially many single lines, cannot afford to lose circuits due to busbar faults (as will be the case with double bus selection)
� Transmitting large blocks of power
� High level of flexibility
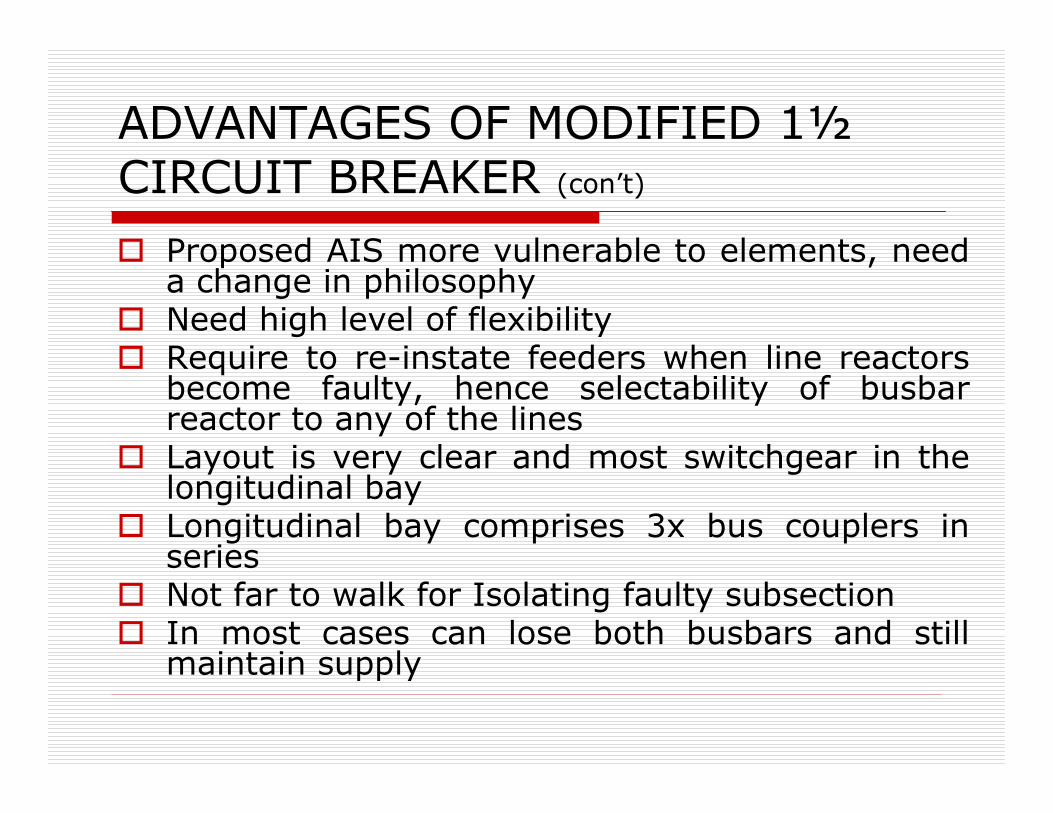
ADVANTAGES OF MODIFIED 1½CIRCUIT BREAKER (con’t)
� Proposed AIS more vulnerable to elements, need a change in philosophy
� Need high level of flexibility� Require to re-instate feeders when line reactors
become faulty, hence selectability of busbar reactor to any of the lines
� Layout is very clear and most switchgear in the longitudinal bay
� Longitudinal bay comprises 3x bus couplers in series
� Not far to walk for Isolating faulty subsection� In most cases can lose both busbars and still
maintain supply
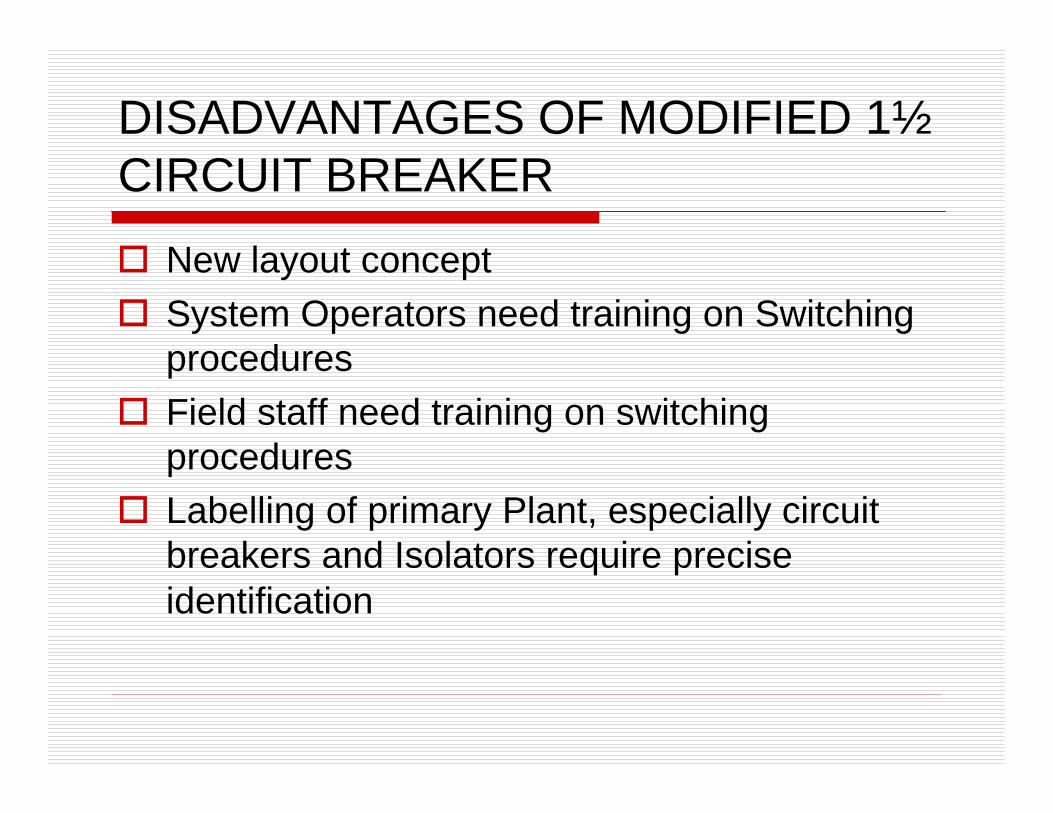
DISADVANTAGES OF MODIFIED 1½CIRCUIT BREAKER
� New layout concept
� System Operators need training on Switching procedures
� Field staff need training on switching procedures
� Labelling of primary Plant, especially circuit breakers and Isolators require precise identification
Remote sensing of fires(Active Fire Information System - AFIS)
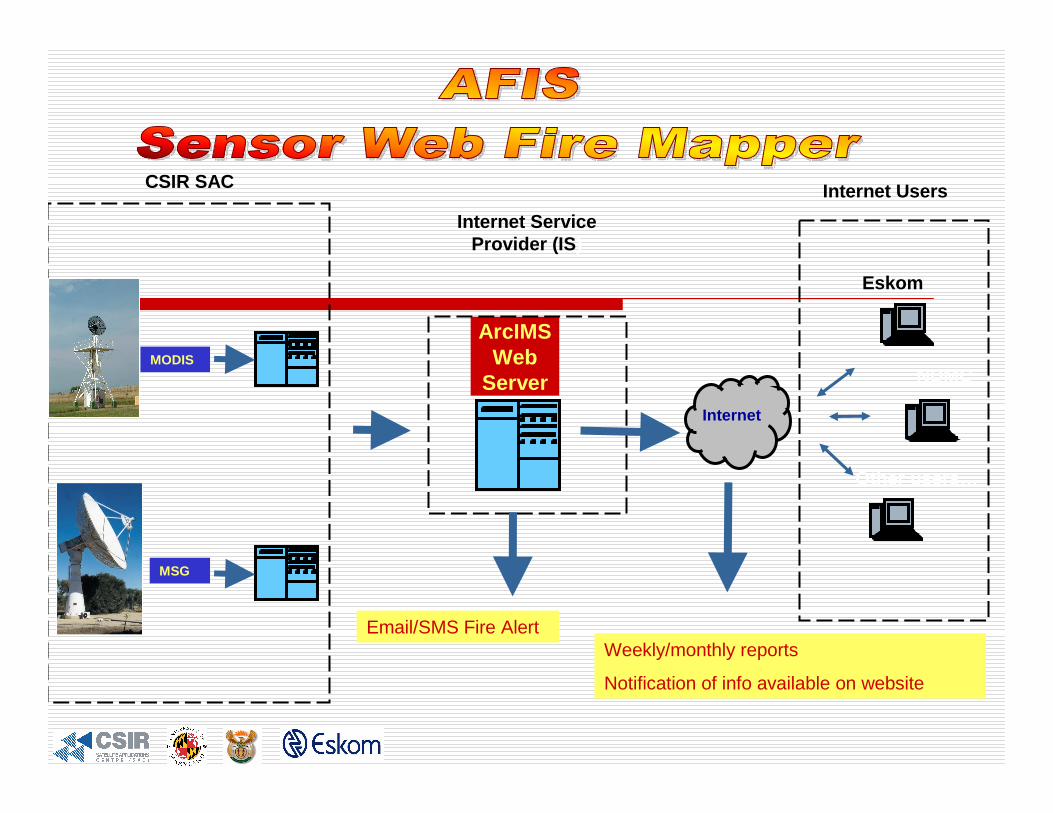
CSIR SAC
ArcIMSWeb
ServerInternet
Internet Users
MODIS
MSG
Internet Service Provider (IS )
Other users…
NDMC
Eskom
Email/SMS Fire AlertWeekly/monthly reports
Notification of info available on website
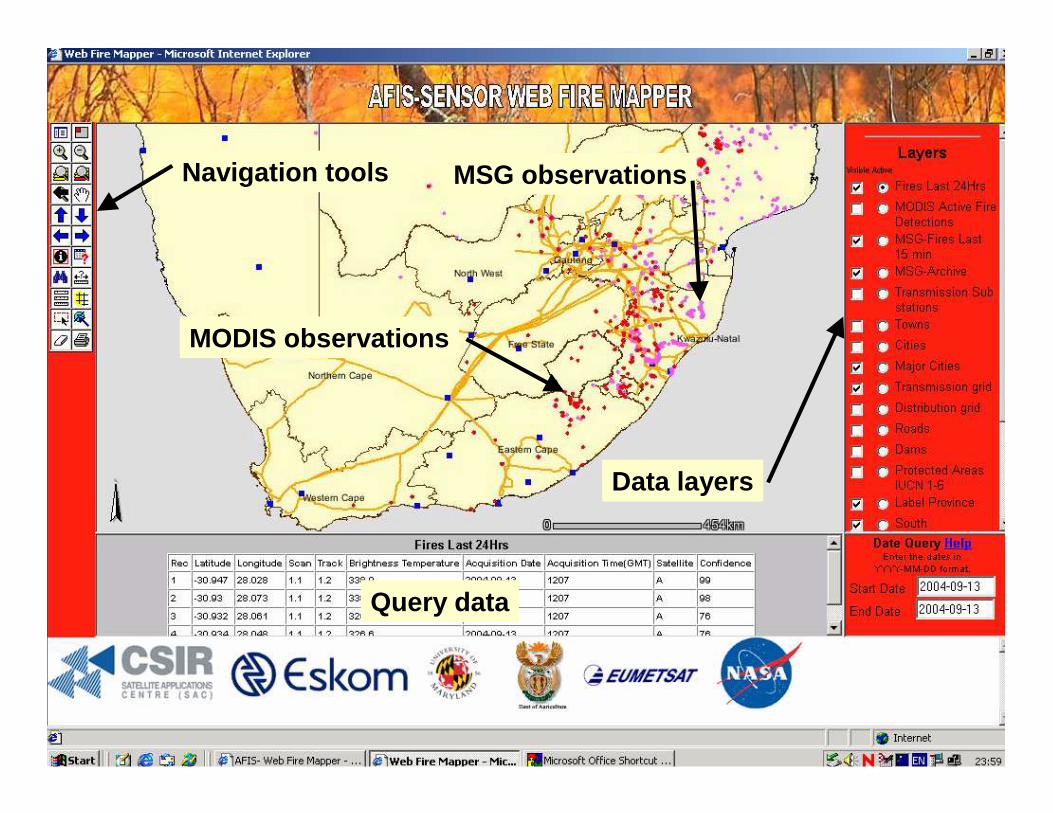
Query data
Navigation tools
MODIS observations
MSG observations
Data layers
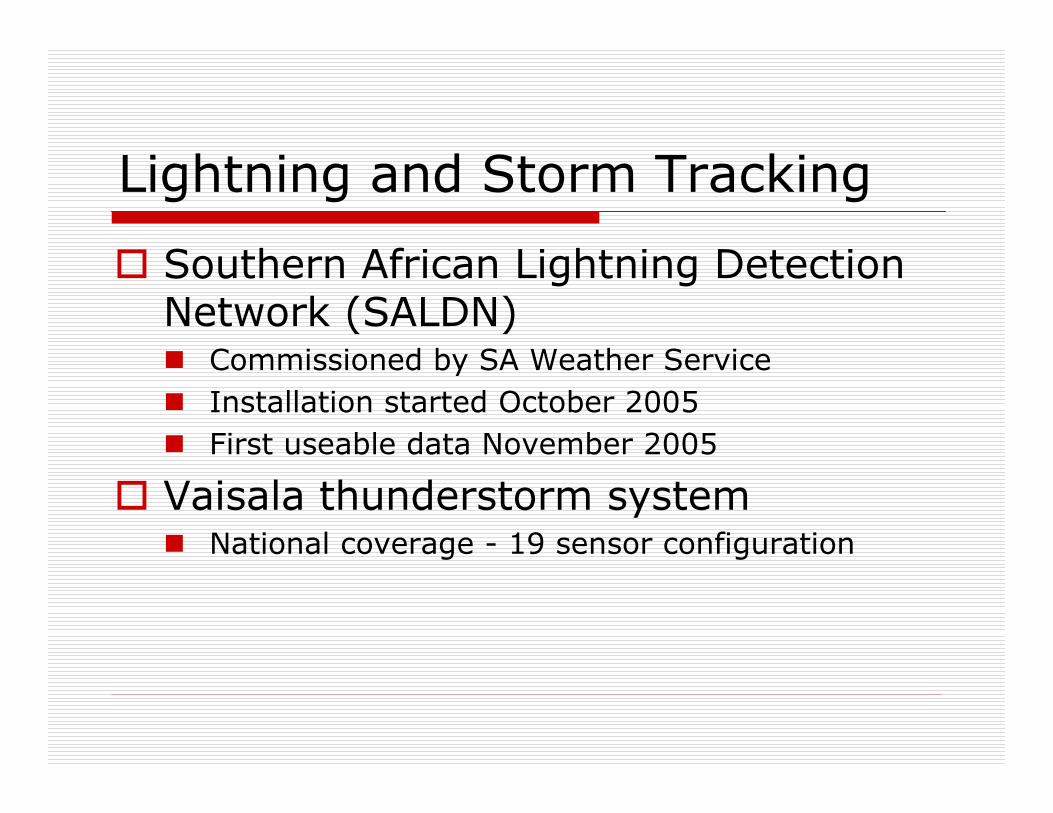
Lightning and Storm Tracking
� Southern African Lightning Detection Network (SALDN)� Commissioned by SA Weather Service
� Installation started October 2005
� First useable data November 2005
� Vaisala thunderstorm system� National coverage - 19 sensor configuration
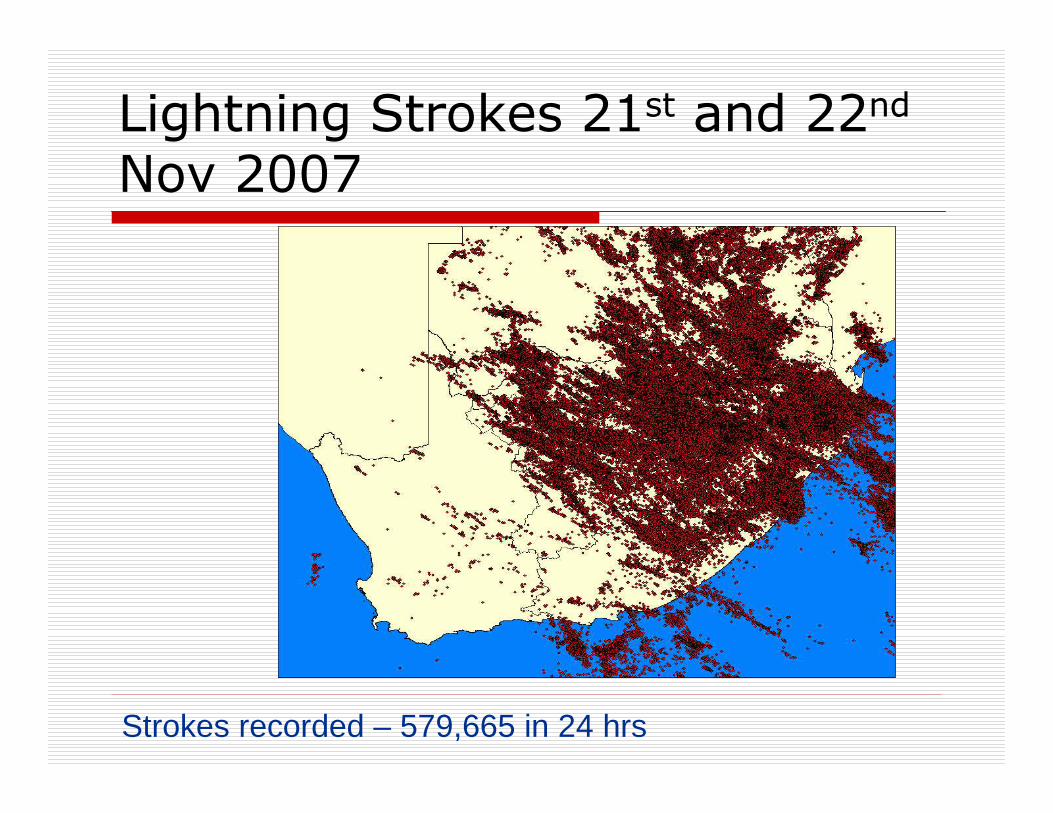
Lightning Strokes 21st and 22nd
Nov 2007
Strokes recorded – 579,665 in 24 hrs
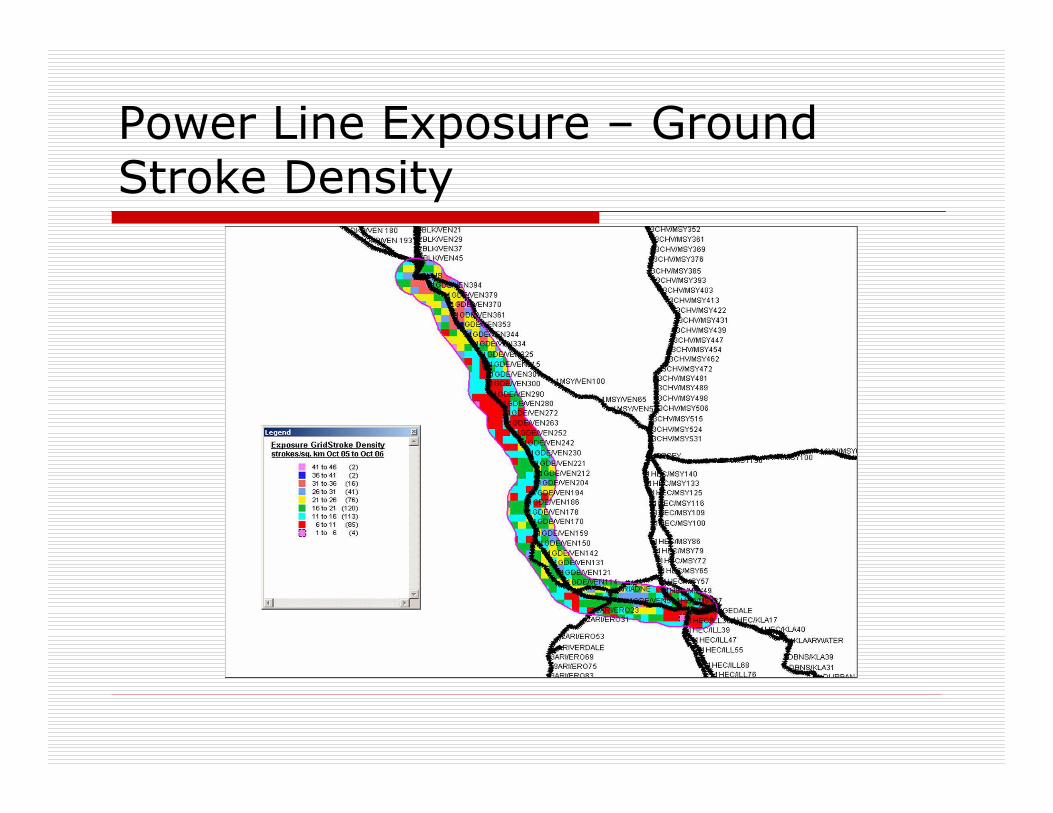
Power Line Exposure – Ground Stroke Density
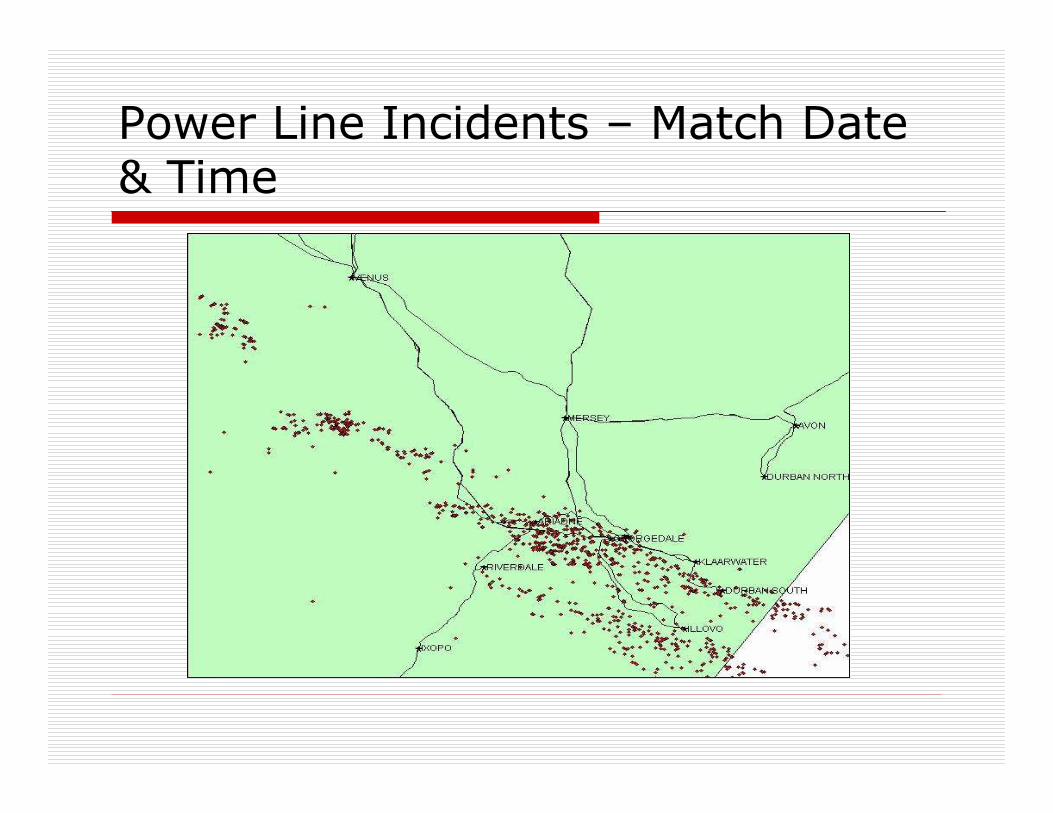
Power Line Incidents – Match Date & Time
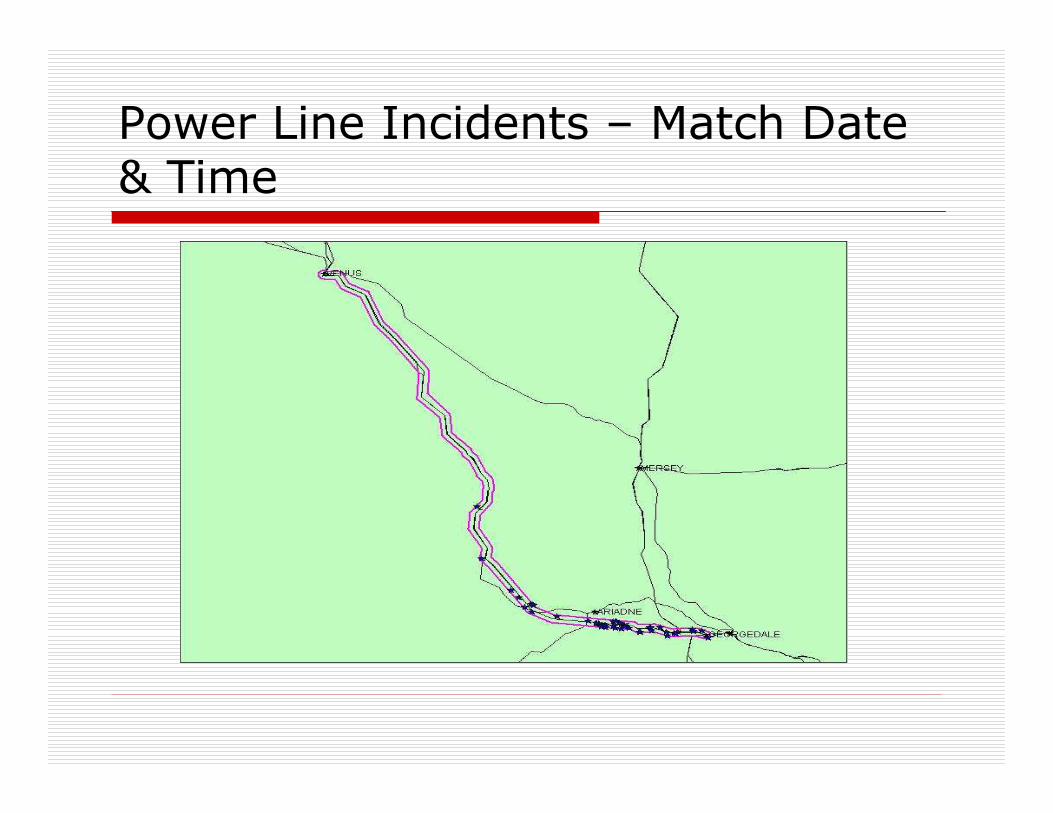
Power Line Incidents – Match Date & Time
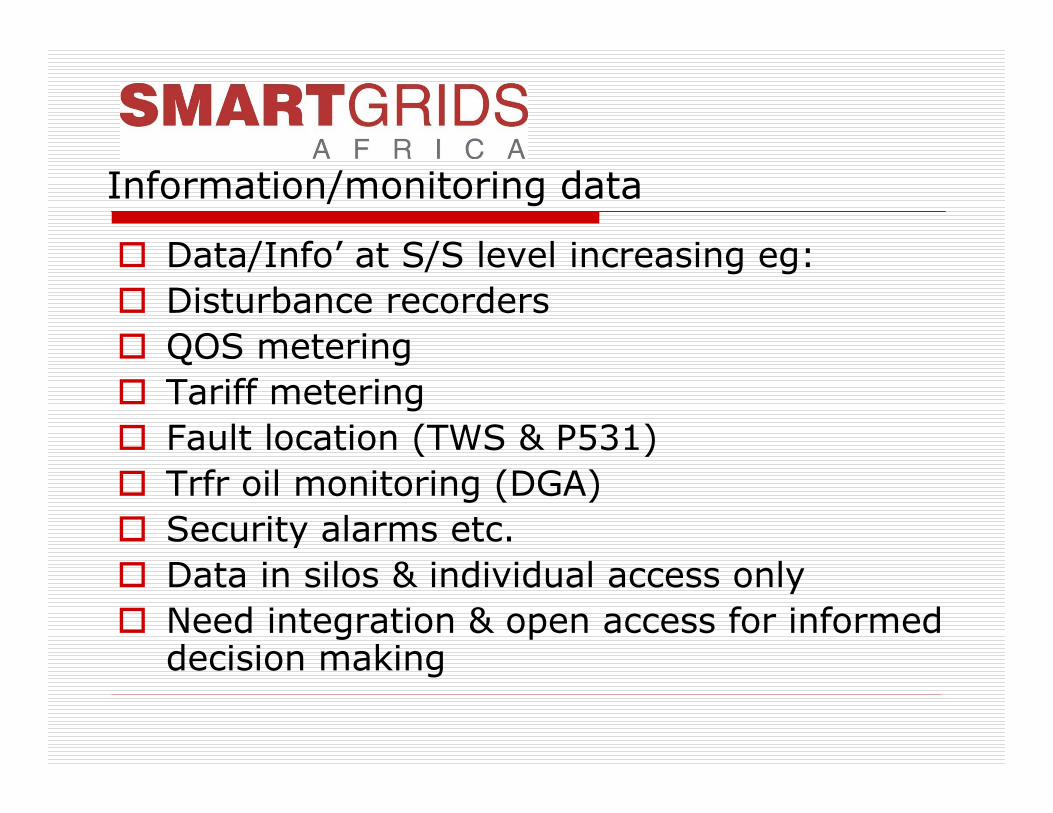
Information/monitoring data
� Data/Info’ at S/S level increasing eg:
� Disturbance recorders
� QOS metering
� Tariff metering
� Fault location (TWS & P531)
� Trfr oil monitoring (DGA)
� Security alarms etc.
� Data in silos & individual access only
� Need integration & open access for informed decision making
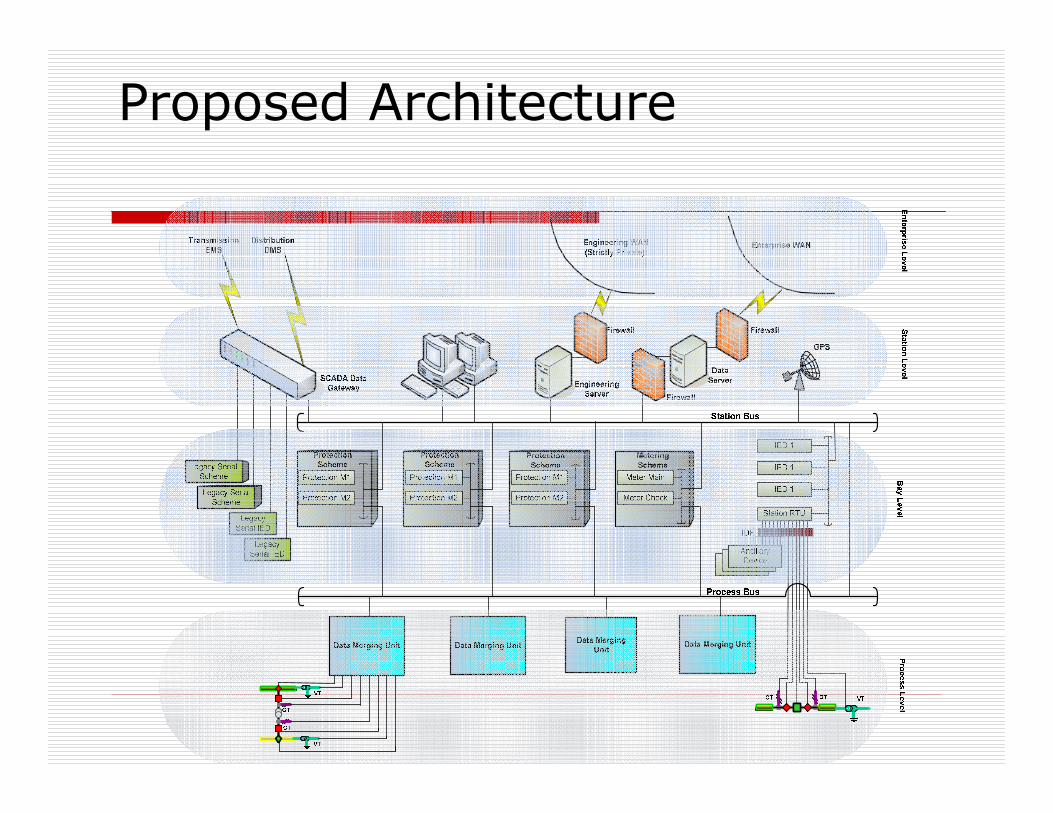
Proposed Architecture
Super Grid &
Planning Strategies for
the future
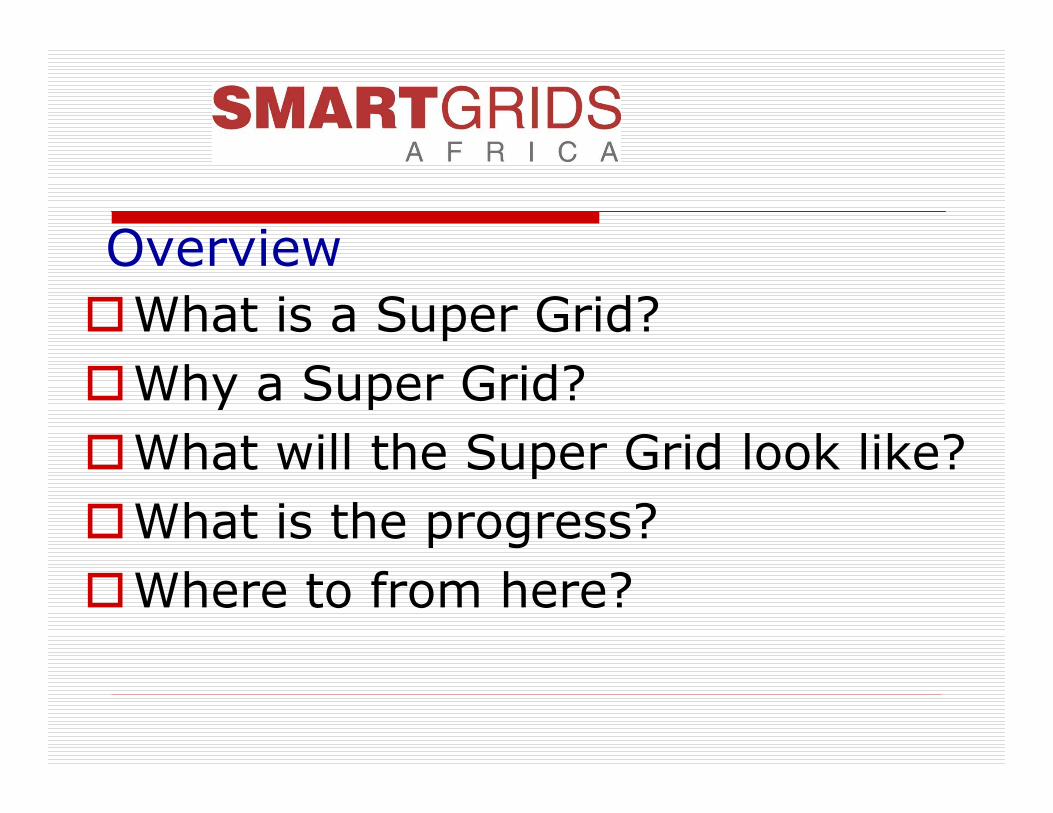
Overview
�What is a Super Grid?
�Why a Super Grid?
�What will the Super Grid look like?
�What is the progress?
�Where to from here?
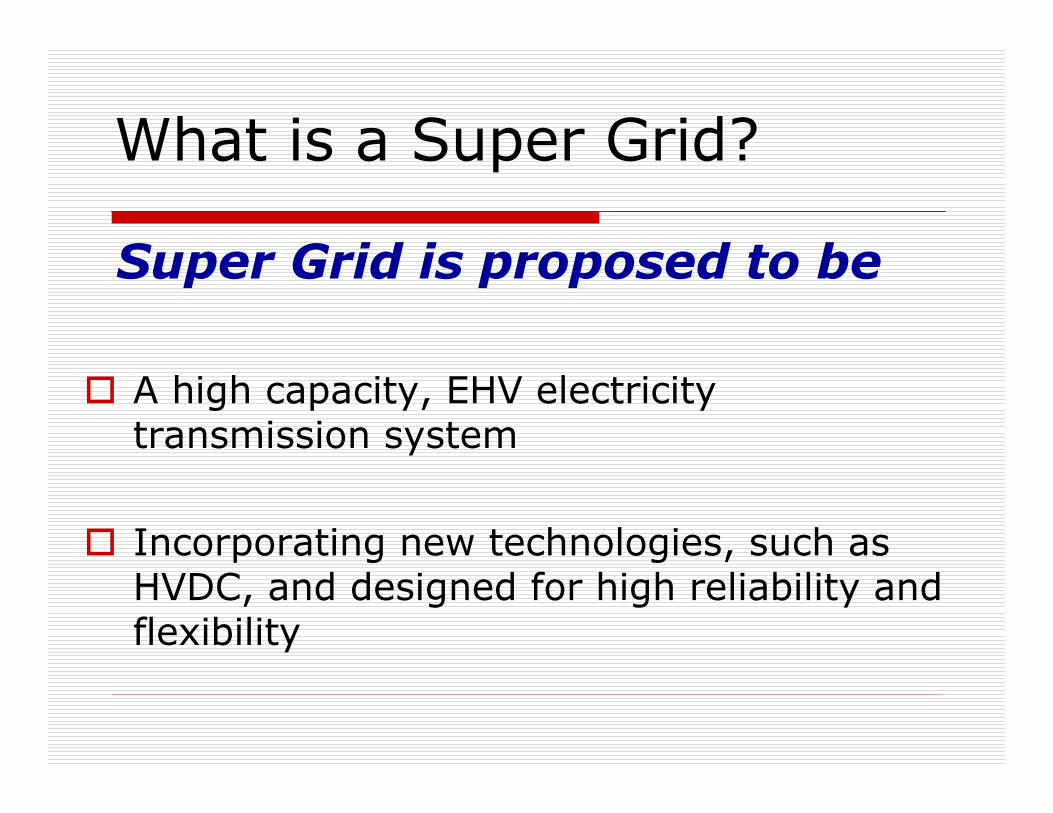
What is a Super Grid?
Super Grid is proposed to be
� A high capacity, EHV electricity transmission system
� Incorporating new technologies, such as HVDC, and designed for high reliability and flexibility
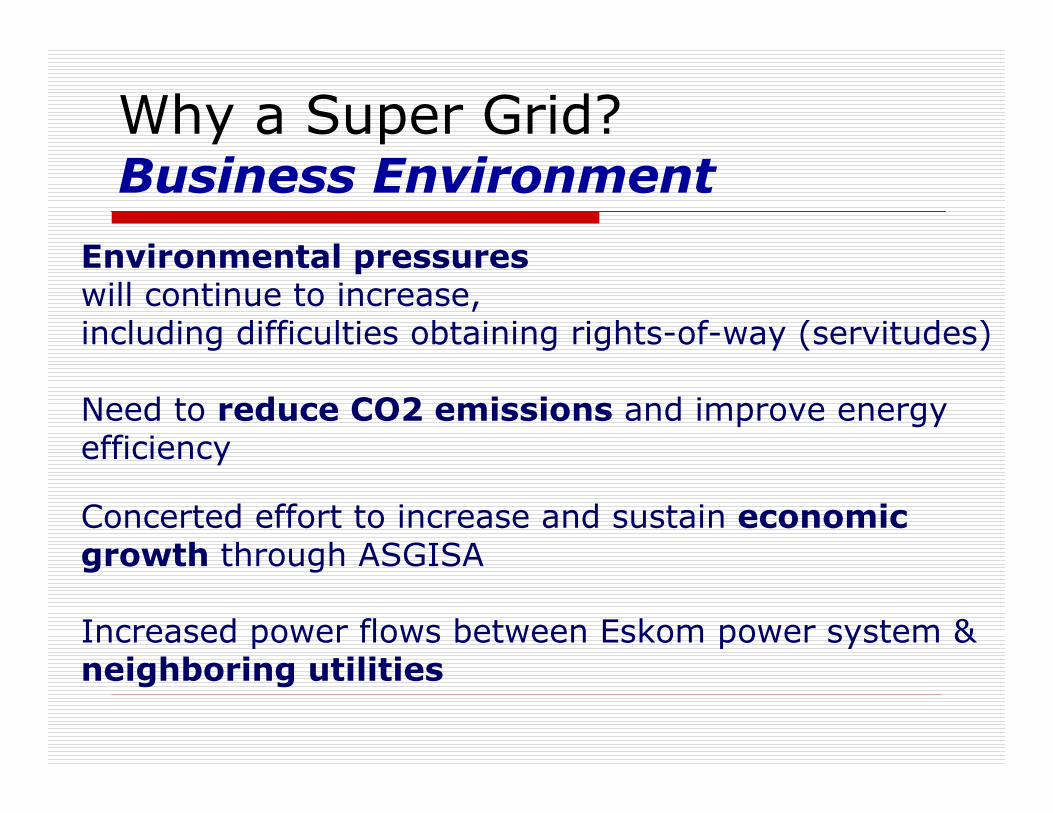
Why a Super Grid?Business Environment
Environmental pressureswill continue to increase, including difficulties obtaining rights-of-way (servitudes)
Need to reduce CO2 emissions and improve energy efficiency
Concerted effort to increase and sustain economic growth through ASGISA
Increased power flows between Eskom power system & neighboring utilities
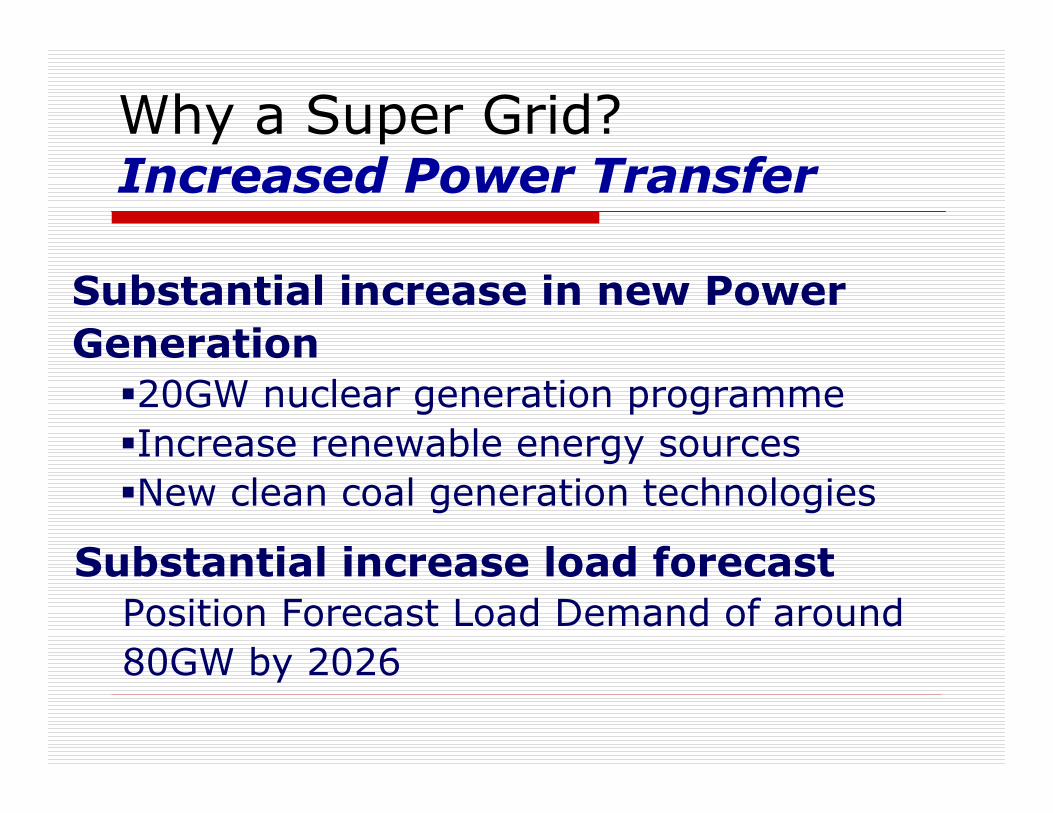
Why a Super Grid?Increased Power Transfer
Substantial increase in new Power
Generation
�20GW nuclear generation programme
�Increase renewable energy sources
�New clean coal generation technologies
Substantial increase load forecast
Position Forecast Load Demand of around
80GW by 2026
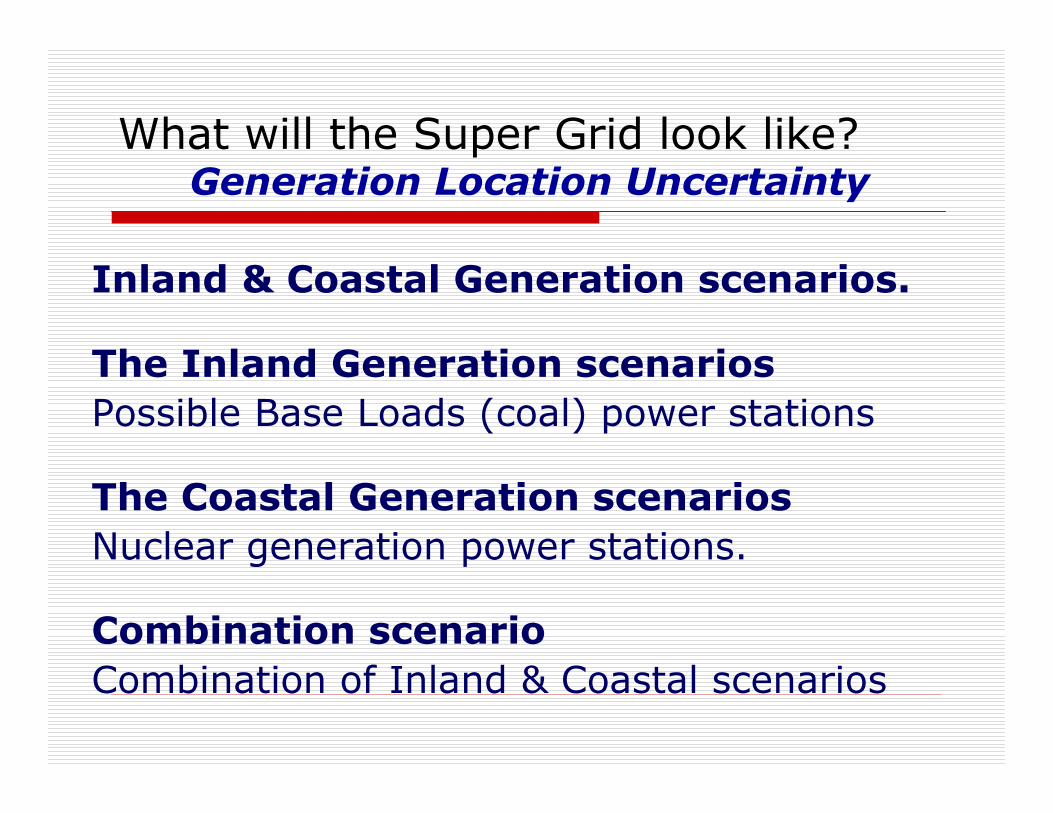
What will the Super Grid look like?Generation Location Uncertainty
Inland & Coastal Generation scenarios.
The Inland Generation scenarios
Possible Base Loads (coal) power stations
The Coastal Generation scenarios
Nuclear generation power stations.
Combination scenario
Combination of Inland & Coastal scenarios
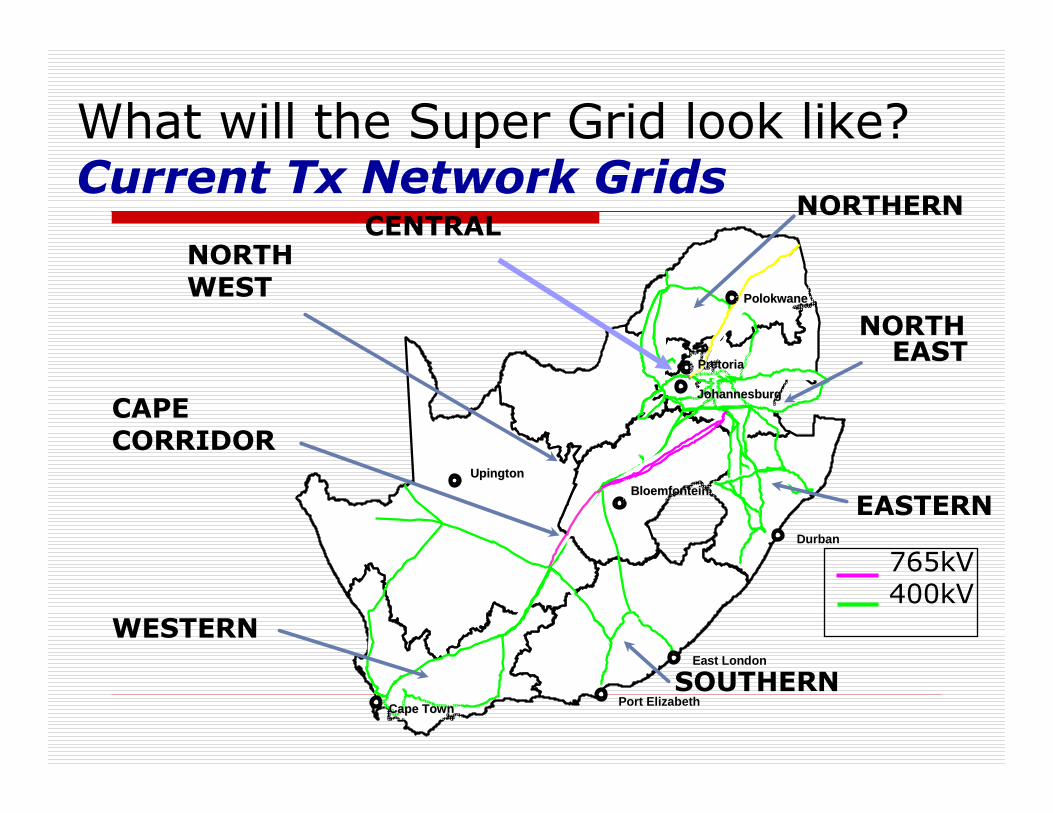
What will the Super Grid look like?Current Tx Network Grids
East LondonEast London
Port ElizabethPort Elizabeth
DurbanDurban
BloemfonteinBloemfonteinUpingtonUpington
JohannesburgJohannesburg
PretoriaPretoria
PolokwanePolokwane
Cape TownCape Town
CENTRAL
765kV400kV
CAPECORRIDOR
NORTHWEST
WESTERN
SOUTHERN
EASTERN
NORTH EAST
NORTHERN
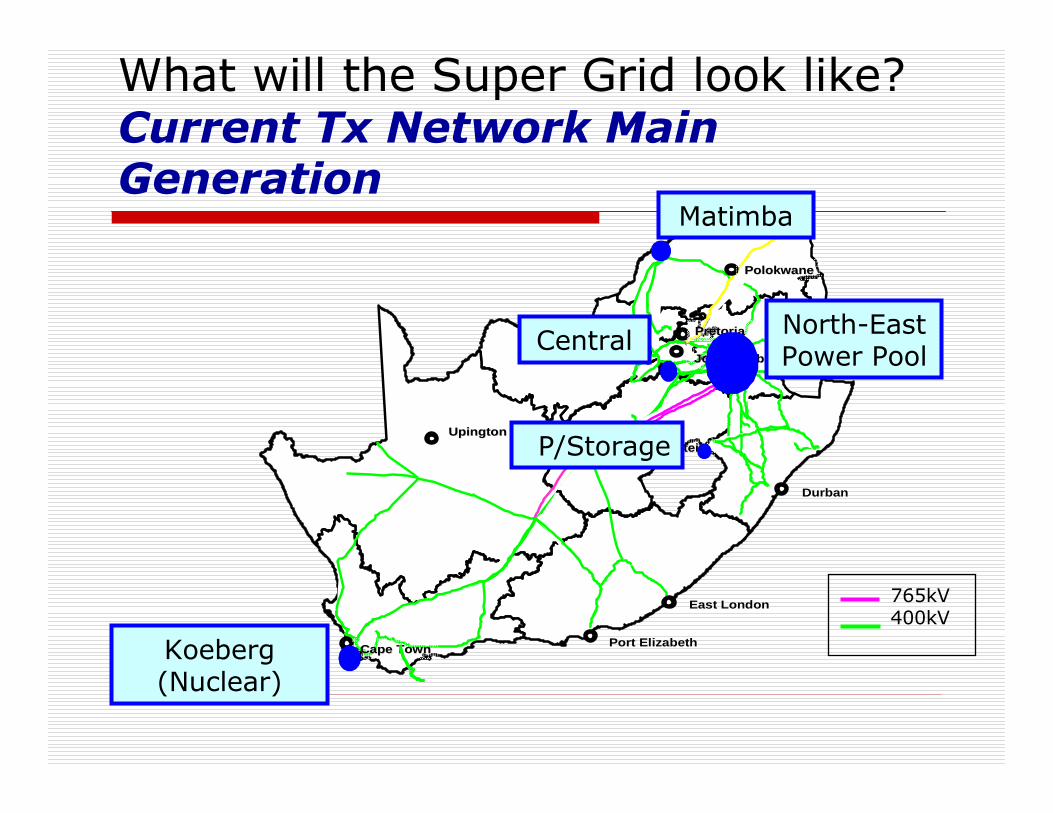
What will the Super Grid look like?Current Tx Network Main Generation
East LondonEast London
Port ElizabethPort Elizabeth
DurbanDurban
BloemfonteinBloemfonteinUpingtonUpington
JohannesburgJohannesburg
PretoriaPretoria
PolokwanePolokwane
Cape TownCape Town
765kV400kV
CentralNorth-East Power Pool
Matimba
P/Storage
Koeberg (Nuclear)
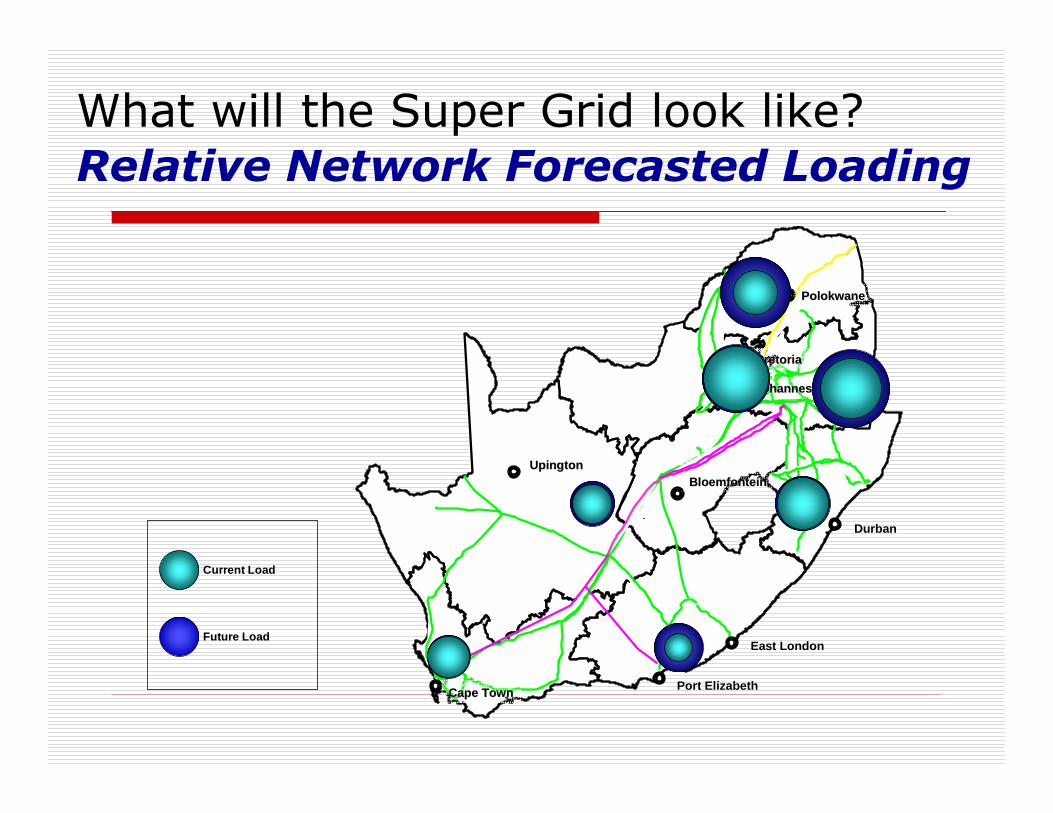
What will the Super Grid look like?Relative Network Forecasted Loading
East LondonEast London
Port ElizabethPort Elizabeth
DurbanDurban
BloemfonteinBloemfonteinUpingtonUpington
JohannesburgJohannesburg
PretoriaPretoria
PolokwanePolokwane
Cape TownCape Town
Current Load
Future Load
What will the Super Grid look like?Current Tx Network Power Flows
East LondonEast London
Port ElizabethPort Elizabeth
DurbanDurban
BloemfonteinBloemfonteinUpingtonUpington
JohannesburgJohannesburg
PretoriaPretoria
PolokwanePolokwane
Cape TownCape Town
765kV400kV
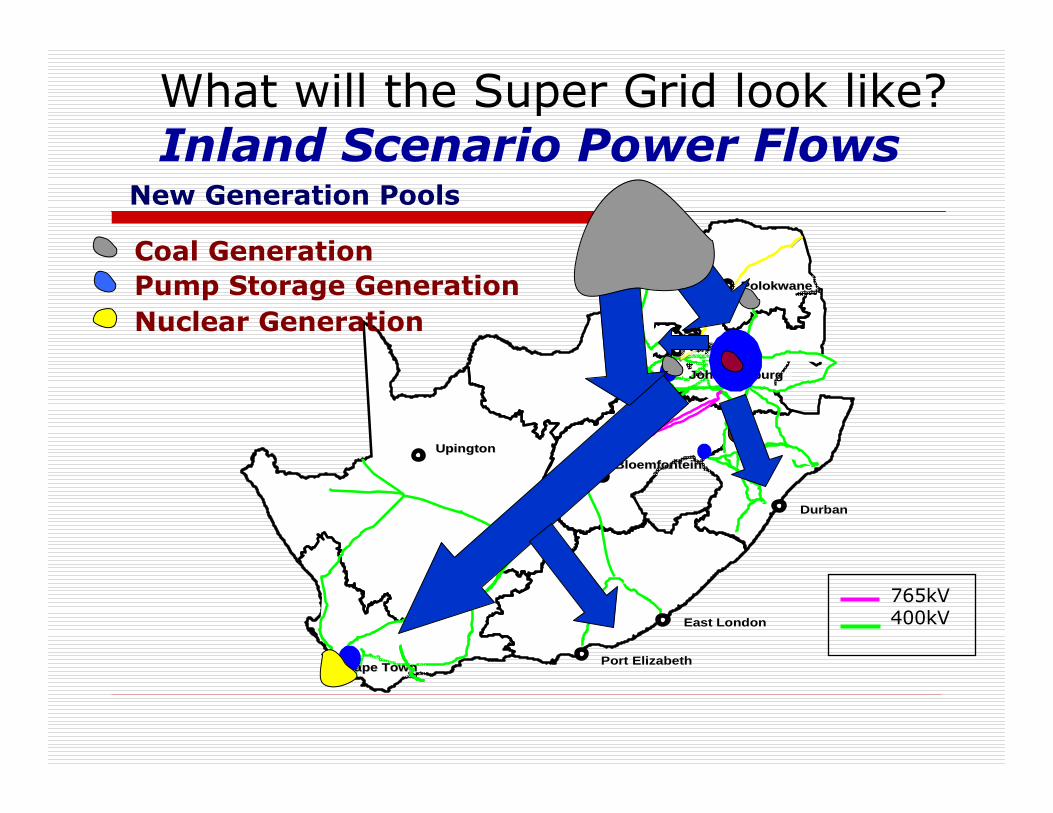
What will the Super Grid look like?Inland Scenario Power Flows
East LondonEast London
Port ElizabethPort Elizabeth
DurbanDurban
BloemfonteinBloemfonteinUpingtonUpington
JohannesburgJohannesburg
PretoriaPretoria
PolokwanePolokwane
Cape TownCape Town
765kV400kV
Coal Generation
Pump Storage Generation
Nuclear Generation
New Generation Pools
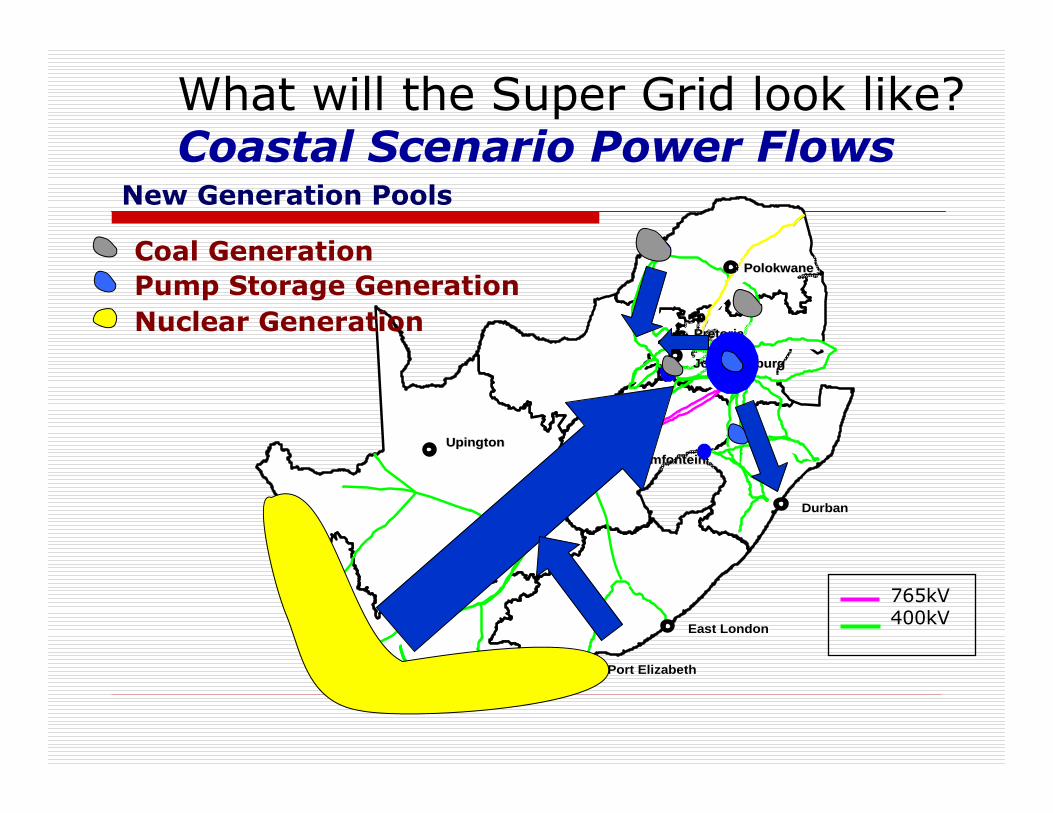
What will the Super Grid look like?Coastal Scenario Power Flows
East LondonEast London
Port ElizabethPort Elizabeth
DurbanDurban
BloemfonteinBloemfonteinUpingtonUpington
JohannesburgJohannesburg
PretoriaPretoria
PolokwanePolokwane
Cape TownCape Town
765kV400kV
Coal Generation
Pump Storage Generation
Nuclear Generation
New Generation Pools
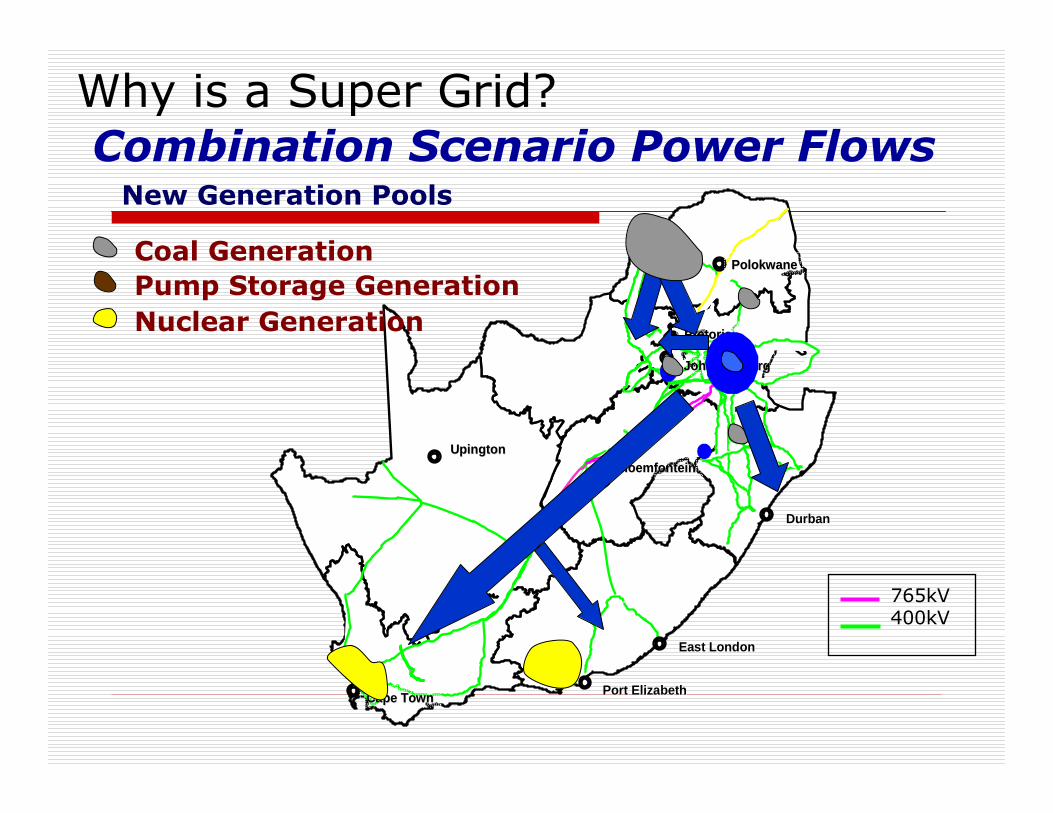
Why is a Super Grid? Combination Scenario Power Flows
East LondonEast London
Port ElizabethPort Elizabeth
DurbanDurban
BloemfonteinBloemfonteinUpingtonUpington
JohannesburgJohannesburg
PretoriaPretoria
PolokwanePolokwane
Cape TownCape Town
765kV400kV
Coal Generation
Pump Storage Generation
Nuclear Generation
New Generation Pools
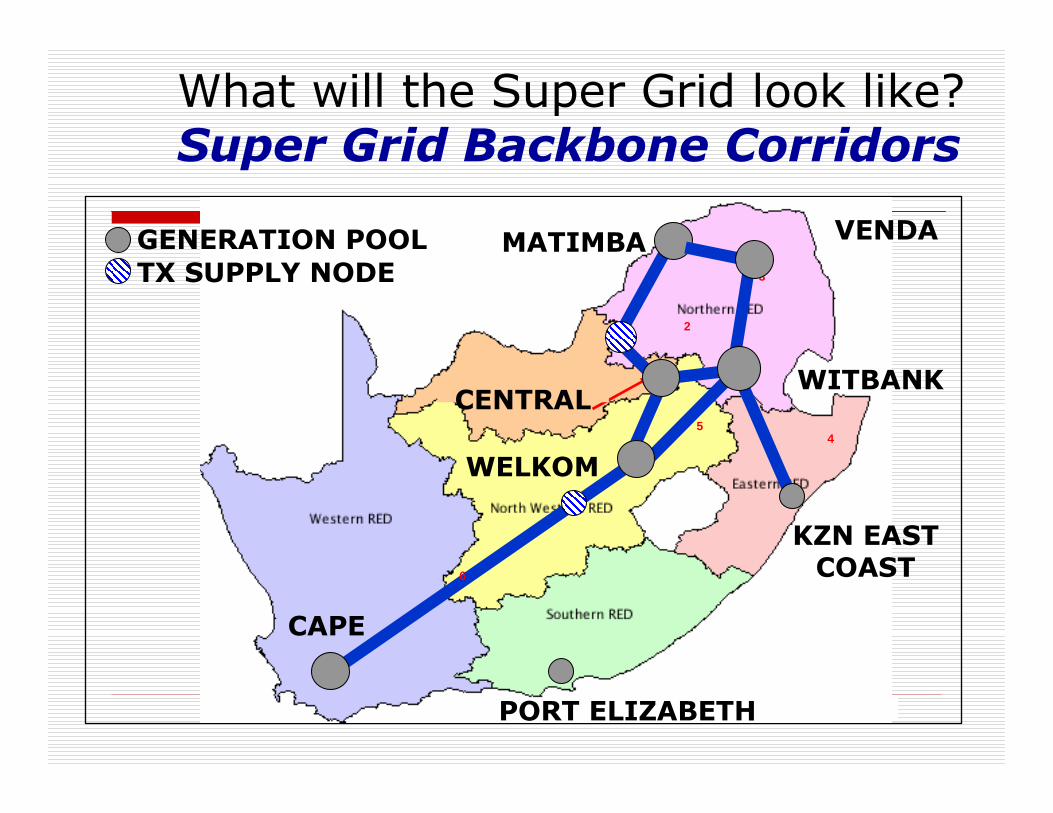
What will the Super Grid look like?Super Grid Backbone Corridors
MATIMBA VENDA
WITBANK
KZN EAST COAST
CAPE
WELKOM
GENERATION POOL
TX SUPPLY NODE
PORT ELIZABETH
1
2
3
45
6
CENTRAL
What will the Super Grid look like?Major Regional Corridors - North
MATIMBA
LOWVELD
JHB CENTRAL
PRETORIA
RUSTENBURG
JHB NORTH
POLOKWANE
GENERATION POOL
TX SUPPLY NODE
KLERKSDORP
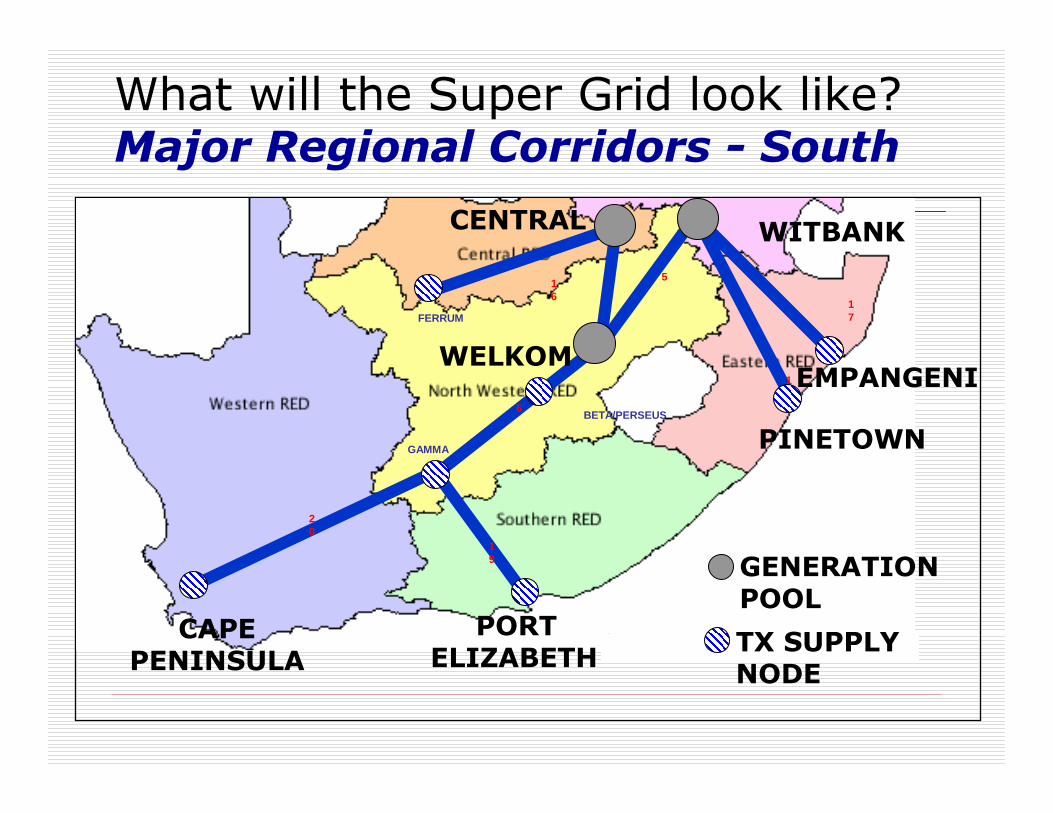
What will the Super Grid look like?Major Regional Corridors - South
CAPE PENINSULA
PORT ELIZABETH
PINETOWN
EMPANGENI
WITBANKCENTRAL
GAMMA
BETA/PERSEUS
WELKOM
FERRUM
20
16
17
18
19
6
5
GENERATION POOL
TX SUPPLY NODE
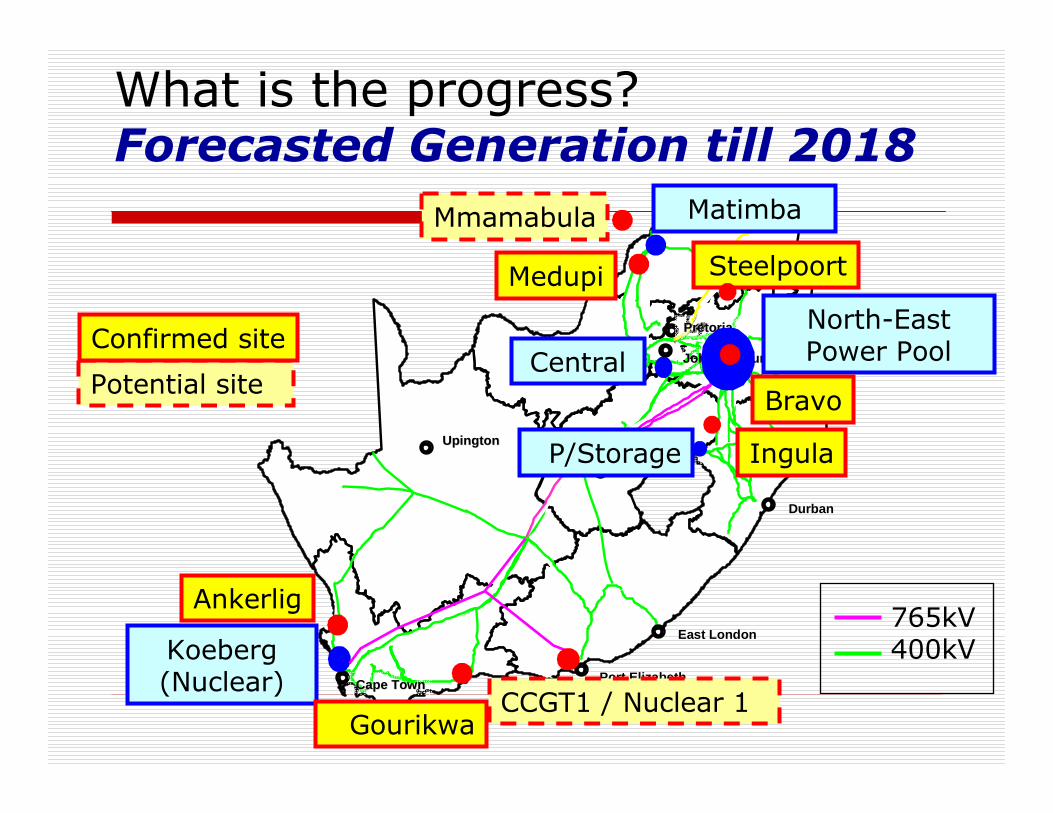
What is the progress?Forecasted Generation till 2018
East LondonEast London
Port ElizabethPort Elizabeth
DurbanDurban
BloemfonteinBloemfonteinUpingtonUpington
JohannesburgJohannesburg
PretoriaPretoria
PolokwanePolokwane
Cape TownCape Town
765kV400kV
Central
North-East Power Pool
Matimba
P/Storage
Koeberg (Nuclear)
Ingula
Bravo
Mmamabula
Medupi
Ankerlig
Gourikwa
Potential site
Confirmed site
Steelpoort
CCGT1 / Nuclear 1
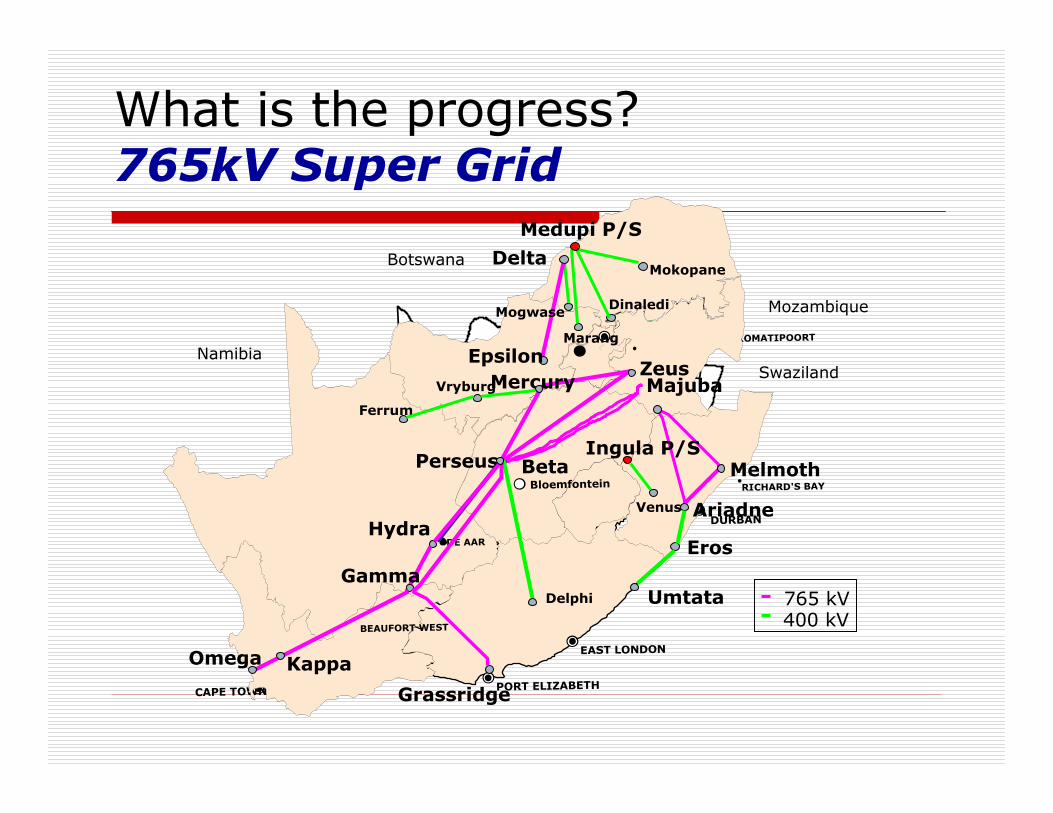
What is the progress? 765kV Super Grid
East LondonEast London
Port ElizabethPort Elizabeth
DurbanDurban
BloemfonteinBloemfonteinUpingtonUpington
JohannesburgJohannesburg
PretoriaPretoria
PolokwanePolokwane
Cape TownCape Town
BLOEMFONTEIN
DE AAR
KOMATIPOORT
RICHARD'S BAY
WITBANK
Namibia
Botswana
Mozambique
Swaziland
CAPE TOWN
DURBAN
EAST LONDON
PORT ELIZABETH
PRETORIA
DE AAR
765 kV400 kV
BEAUFORT WEST
Bloemfontein
Medupi P/S
Marang
Dinaledi
MokopaneDelta
Epsilon
Mogwase
Ferrum
Vryburg
Delphi
Mercury
Perseus
Hydra
Gamma
Omega
Grassridge
Beta
Kappa
MajubaZeus
Eros
Ariadne
Melmoth
Umtata
Ingula P/S
Venus
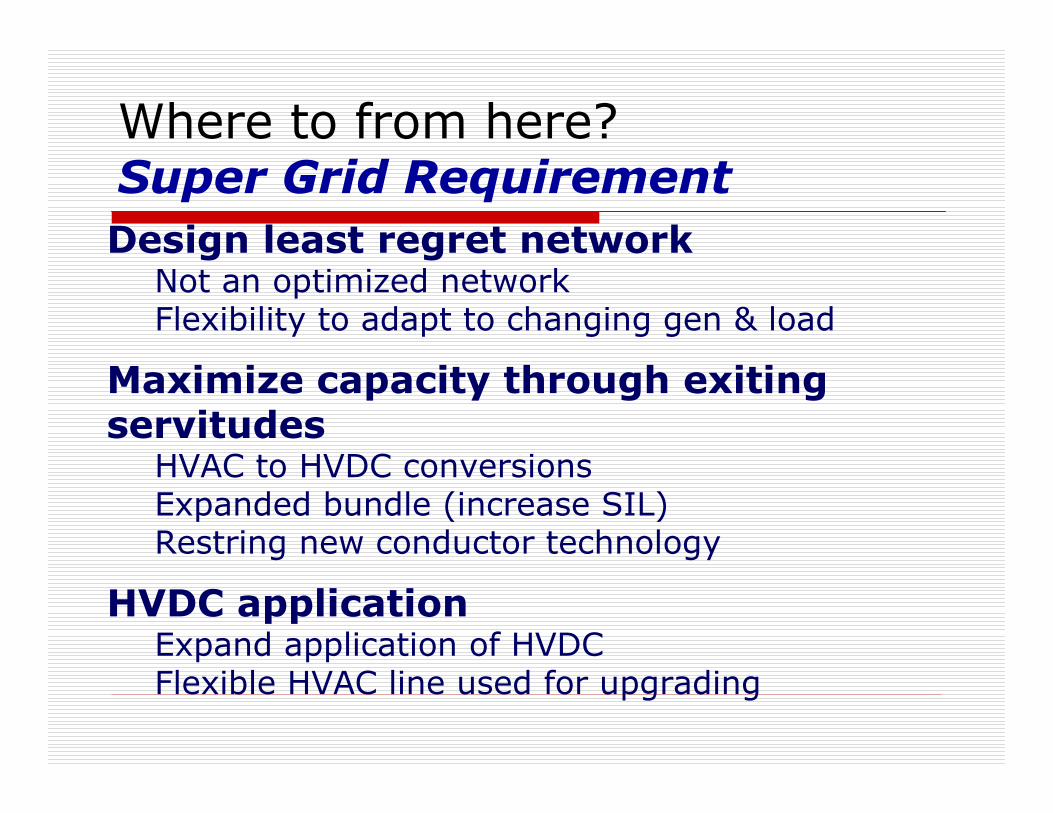
Where to from here? Super Grid Requirement
Design least regret networkNot an optimized networkFlexibility to adapt to changing gen & load
Maximize capacity through exiting servitudes
HVAC to HVDC conversionsExpanded bundle (increase SIL)Restring new conductor technology
HVDC applicationExpand application of HVDCFlexible HVAC line used for upgrading
Acknowledgements
� Dr Dzevad Muftic ,Consultant,TAP� Gavin Bruce, Eskom Transmission
(Acting) General Manager Services� Ronald Marais, Eskom Transmission
Strategic Grid Planning Manager
Tel +27 11 871 3496Fax +27 11 871 2508
ESKOM SOUTH AFRICAwebsite: www.eskom.co.za
THANK YOU !THANK YOU !
QUESTIONS ?QUESTIONS ?


![Grid Computing의다양한적용사례 · 2004-09-10 · World Wide Grid is Growing [4] Part I : the Grid 1. “Grid is Global Infrastructure” Grid Computing은분산된컴퓨터,](https://img.pdfslide.tips/doc/110x75/5ea7406767f1675ce51910f3/grid-computingeoee-2004-09-10-world-wide-grid-is-growing-4.jpg)