Embed Size (px)
Citation preview

The National Recovery Plan
2011-2014
BAILE ÁTHA CLIATH
ARNA FHOILSIÚ AG OIFIG AN tSOLÁTHAIR Le ceannach díreach ón
OIFIG DHÍOLTA FOILSEACHÁN RIALTAIS, TEACH SUN ALLIANCE, SRÁID THEACH LAIGHEAN, BAILE ÁTHA CLIATH 2,
nó tríd an bpost ó FOILSEACHÁIN RIALTAIS, AN RANNÓG POST-TRÁCHTA,
AONAD 20 PÁIRC MIONDÍOLA COIS LOCHA, CLÁR CHLAINNE MHUIRIS, CONTAE MHAIGH EO (Teil: 01 – 6476834 nó 1890 213434; Fax 094 - 9378964 nó 01 – 6476843)
nó trí aon díoltóir leabhar. __________
DUBLIN
PUBLISHED BY THE STATIONERY OFFICE To be purchased directly from the
GOVERNMENT PUBLICATIONS SALE OFFICE SUN ALLIANCE HOUSE, MOLESWORTH STREET, DUBLIN 2,
or by mail order from GOVERNMENT PUBLICATIONS, POSTAL TRADE SECTION,
UNIT 20 LAKESIDE RETAIL PARK, CLAREMORRIS, CO. MAYO (Tel: 01 – 6476834 or 1890 213434; Fax: 094 - 9378964 or 01 – 6476843)
or through any bookseller.
(Prn. A10/1705) Price €15.00 1

2
Overview and Summary ....................................................................................................... 5 Chapter 1 Economic Policy........................................................................................... 14
1.1 The Economy in 2010 .................................................................................................... 14 1.2 Budgetary Adjustment ................................................................................................... 16 1.3 Achieving Economic Recovery......................................................................................... 19 1.4 The Economic Outlook, 2011-2014.................................................................................. 24
Chapter 2 Strategy for Competitiveness, Growth and Employment ............................... 29 2.1 Overview – the Strategy for Economic Recovery............................................................... 29 2.2 Restoring Cost Competitiveness ...................................................................................... 31 2.3 Removing Barriers to Employment Creation and Disincentives to Work............................... 35 2.4 Re-orienting Activation Measures .................................................................................... 38 2.5 Enterprise Policy - Investment, Exports and Sectoral Performance ..................................... 40 2.6 Conclusion: Anticipated Medium-term Outcomes .............................................................. 51
Chapter 3 General Expenditure Context ...................................................................... 53 3.1 Introduction.................................................................................................................. 53 3.2 Why We Must Reduce Expenditure.................................................................................. 55 3.3 Composition of Expenditure............................................................................................ 57 3.4 Strategy and Principles for Expenditure Reductions 2011-2014 .......................................... 58 3.5 Budget Reform.............................................................................................................. 59
Chapter 4 Current Expenditure Measures.................................................................... 61 4.1 Introduction.................................................................................................................. 61 4.2 Public Service Pay Costs................................................................................................. 63 4.3 Reforming Institutions and Service Delivery ..................................................................... 65 4.4 Redeployment ............................................................................................................... 66 4.5 Public Service Transformation......................................................................................... 67 4.6 Public Service Sectoral Reform........................................................................................ 68 4.7 Public Service Pension Reforms....................................................................................... 71 4.8 Social Protection Expenditures ........................................................................................ 74 4.9 Other Programme Expenditures ...................................................................................... 76 4.10 Savings from Reducing the Costs of Public Administration ................................................. 78 4.11 Debt Interest Costs and Debt Management...................................................................... 80
Chapter 5 Public Capital Investment ........................................................................... 82 5.1 Overview ...................................................................................................................... 82 5.2 Role of Capital Investment in the Economy ...................................................................... 84 5.3 NPRF Approach to Infrastructure Investment ................................................................... 86 5.4 Investment by Commercial State Bodies .......................................................................... 87
Chapter 6 Taxation Measures ...................................................................................... 89 6.1 Introduction.................................................................................................................. 89 6.2 Approach ...................................................................................................................... 89
3
6.3 Objective ...................................................................................................................... 90 6.4 Income Tax................................................................................................................... 91 6.5 Pensions Tax Expenditures ............................................................................................. 93 6.6 General Tax Expenditures............................................................................................... 95 6.7 Value Added Tax and Indirect Tax .................................................................................. 97 6.8 Financing Local Services................................................................................................. 98 6.9 Carbon Tax ................................................................................................................... 99 6.10 Capital Taxation ........................................................................................................... 99 6.11 Corporation Tax.......................................................................................................... 100 6.12 Small and Medium Enterprises ..................................................................................... 101 6.13 Impact of the Main Income Tax changes ...................................................................... 101
Annexes 1-11.................................................................................................................... 104
4

Overview and Summary
This Plan provides a blueprint for a return to sustainable growth in our economy. It sets out in detail
the measures that will be taken to put our public finances in order. It identifies the areas of economic
activity which will provide growth and employment in the next phase of our economic development. It
specifies the reforms the Government will implement to accelerate growth in those key sectors.
Reducing the budget deficit will not, by itself, solve our economic difficulties. We must build on our
strong export performance by improving our competitiveness. We must enhance our productive
capacity by maintaining investment in key infrastructure projects and in education. We must remove
barriers to employment and ensure that those who have lost their jobs are retrained and are ready to
take up employment as the labour market recovers. This Plan sets out the key reform measures the
Government will take to return our economy to a sustainable medium-term economic growth path.
The Plan will help dispel uncertainty and reinforce the confidence of consumers, businesses and of the
international community. The tax and expenditure measures contained in this Plan will negatively
affect the living standards of citizens in the short-term. But postponing these measures will lead to
greater burdens in the future for those who can least bear them, and will jeopardise our prospects of
returning to sustainable growth and full employment.
Over the last two and a half years, we have responded promptly to the deterioration in the public
finances. In five separate adjustment packages, savings and revenue-raising of around €14.6 billion
on a full year basis have already been achieved. As a result our public finances have stabilised with an
underlying deficit of 11.7% of GDP in 2010 compared with an implied uncorrected deficit of 20% of
GDP. Notwithstanding the size of the adjustment, our economy has performed better this year than
had been forecast at the end of 2009, with GDP growth expected to be marginally positive as opposed
to a contraction of 1.3% which had been predicted this time last year.
Unfortunately, lower than expected medium-term economic growth prospects as well as higher debt
interest costs arising from the bank rescue have required us to revise our budgetary targets. To
achieve a deficit of below 3% of GDP by 2014, the Government has concluded that an overall saving
of €15 billion is required. The European Commission acknowledges that this is the appropriate target
based on the growth projections we have set for the period of the Plan.
5
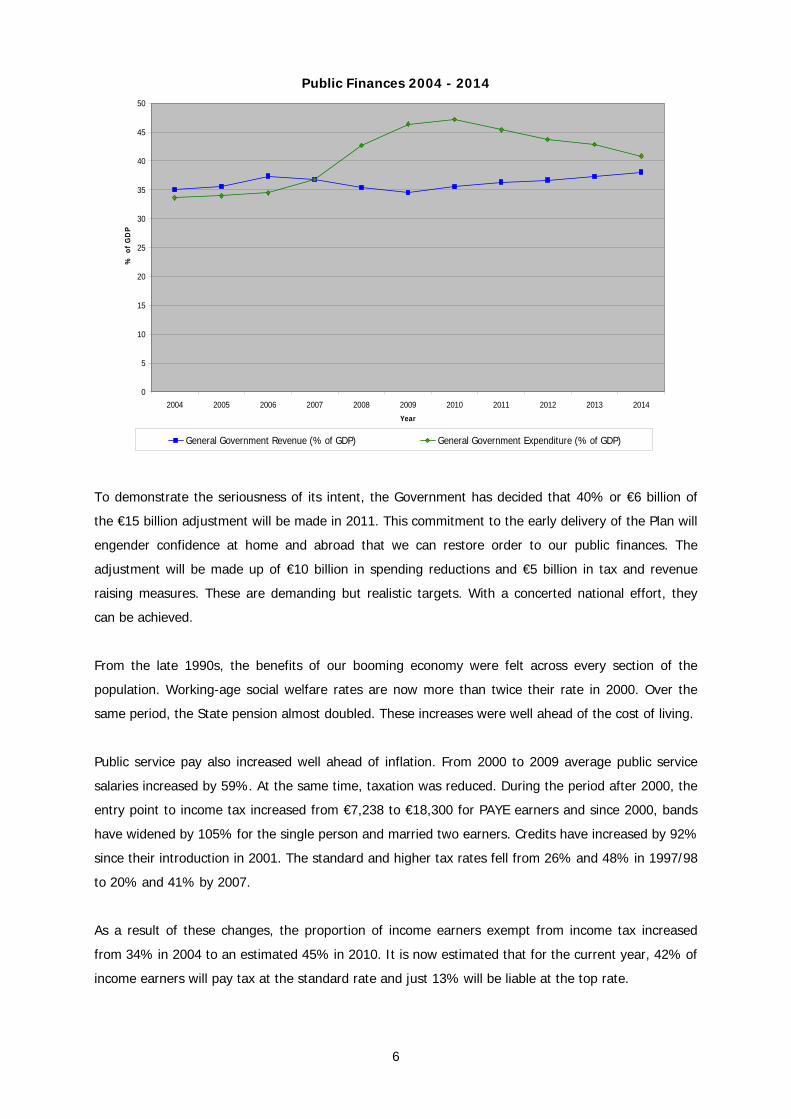
Public Finances 2004 - 2014
0
5
10
15
20
25
30
35
40
45
50
2004 2005 2006 2007 2008 2009 2010 2011 2012 2013 2014
Year
% o
f G
DP
General Government Revenue (% of GDP) General Government Expenditure (% of GDP)
To demonstrate the seriousness of its intent, the Government has decided that 40% or €6 billion of
the €15 billion adjustment will be made in 2011. This commitment to the early delivery of the Plan will
engender confidence at home and abroad that we can restore order to our public finances. The
adjustment will be made up of €10 billion in spending reductions and €5 billion in tax and revenue
raising measures. These are demanding but realistic targets. With a concerted national effort, they
can be achieved.
From the late 1990s, the benefits of our booming economy were felt across every section of the
population. Working-age social welfare rates are now more than twice their rate in 2000. Over the
same period, the State pension almost doubled. These increases were well ahead of the cost of living.
Public service pay also increased well ahead of inflation. From 2000 to 2009 average public service
salaries increased by 59%. At the same time, taxation was reduced. During the period after 2000, the
entry point to income tax increased from €7,238 to €18,300 for PAYE earners and since 2000, bands
have widened by 105% for the single person and married two earners. Credits have increased by 92%
since their introduction in 2001. The standard and higher tax rates fell from 26% and 48% in 1997/98
to 20% and 41% by 2007.
As a result of these changes, the proportion of income earners exempt from income tax increased
from 34% in 2004 to an estimated 45% in 2010. It is now estimated that for the current year, 42% of
income earners will pay tax at the standard rate and just 13% will be liable at the top rate.
6
The substantial reductions in tax and increases in welfare were made possible by the very high level
of property-related tax receipts taken in by the Exchequer during the boom years. The property boom
also swelled VAT and other receipts. In 2007, capital taxes and stamp duty yielded €6.7 billion. This
year, that figure is expected to fall to as low as €1.6 billion. In these dramatically changed
circumstances, it is clear the State can no longer afford the current levels of social provision and
personal taxation.
The effect of the spending reductions for 2011 detailed in this plan will be to bring us back to working
age social welfare rates slightly above 2007 levels. The income tax measures, outlined in Chapter 6,
will bring us back to levels prevalent as recently as 2006.
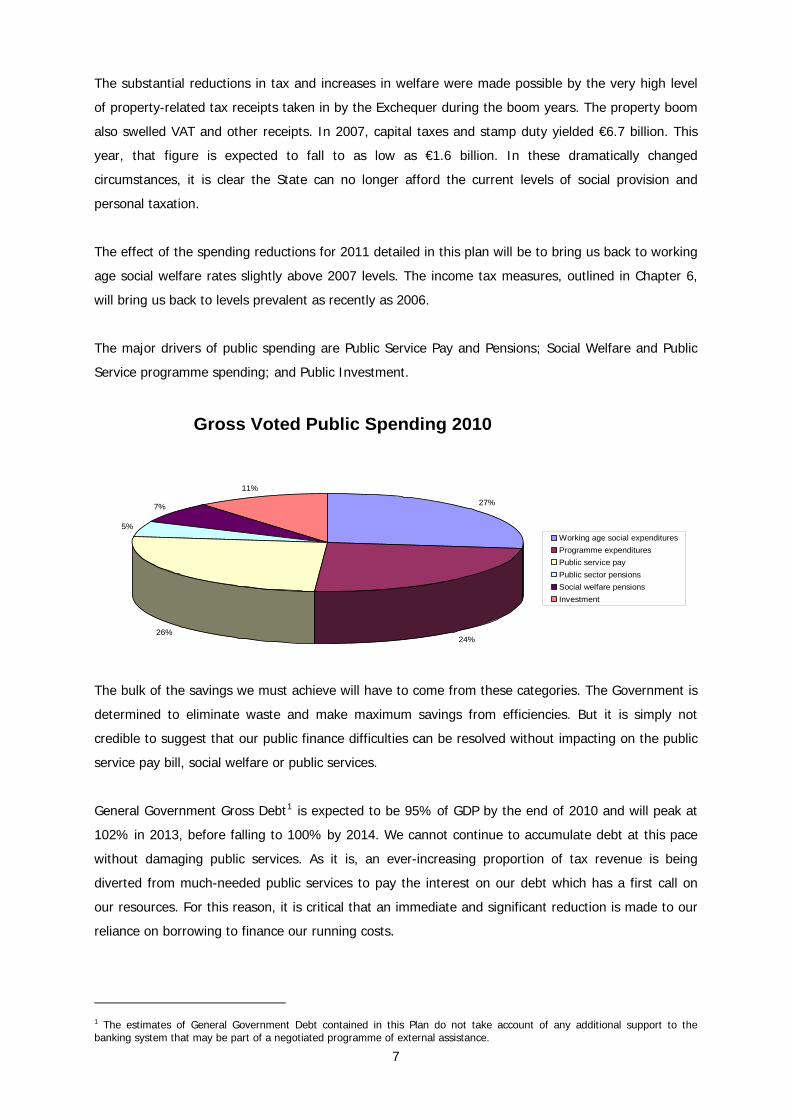
The major drivers of public spending are Public Service Pay and Pensions; Social Welfare and Public
Service programme spending; and Public Investment.
Gross Voted Public Spending 2010
27%
24%26%
5%
7%
11%
Working age social expendituresProgramme expendituresPublic service payPublic sector pensionsSocial welfare pensionsInvestment
The bulk of the savings we must achieve will have to come from these categories. The Government is
determined to eliminate waste and make maximum savings from efficiencies. But it is simply not
credible to suggest that our public finance difficulties can be resolved without impacting on the public
service pay bill, social welfare or public services.
General Government Gross Debt1 is expected to be 95% of GDP by the end of 2010 and will peak at
102% in 2013, before falling to 100% by 2014. We cannot continue to accumulate debt at this pace
without damaging public services. As it is, an ever-increasing proportion of tax revenue is being
diverted from much-needed public services to pay the interest on our debt which has a first call on
our resources. For this reason, it is critical that an immediate and significant reduction is made to our
reliance on borrowing to finance our running costs.
1 The estimates of General Government Debt contained in this Plan do not take account of any additional support to the banking system that may be part of a negotiated programme of external assistance.
7
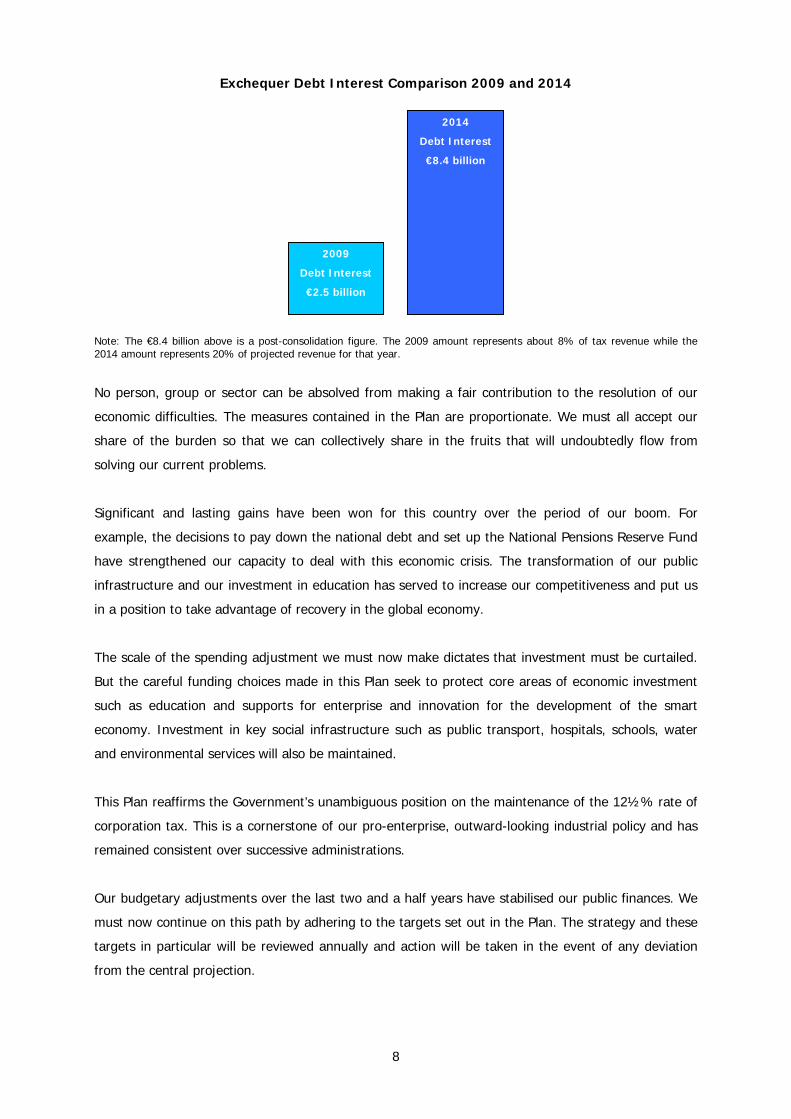
Exchequer Debt Interest Comparison 2009 and 2014
2014
Debt Interest
€8.4 billion
€2.5 billion
2009
Debt Interest
Note: The €8.4 billion above is a post-consolidation figure. The 2009 amount represents about 8% of tax revenue while the 2014 amount represents 20% of projected revenue for that year.
No person, group or sector can be absolved from making a fair contribution to the resolution of our
economic difficulties. The measures contained in the Plan are proportionate. We must all accept our
share of the burden so that we can collectively share in the fruits that will undoubtedly flow from
solving our current problems.
Significant and lasting gains have been won for this country over the period of our boom. For
example, the decisions to pay down the national debt and set up the National Pensions Reserve Fund
have strengthened our capacity to deal with this economic crisis. The transformation of our public
infrastructure and our investment in education has served to increase our competitiveness and put us
in a position to take advantage of recovery in the global economy.
The scale of the spending adjustment we must now make dictates that investment must be curtailed.
But the careful funding choices made in this Plan seek to protect core areas of economic investment
such as education and supports for enterprise and innovation for the development of the smart
economy. Investment in key social infrastructure such as public transport, hospitals, schools, water
and environmental services will also be maintained.
This Plan reaffirms the Government’s unambiguous position on the maintenance of the 12½% rate of
corporation tax. This is a cornerstone of our pro-enterprise, outward-looking industrial policy and has
remained consistent over successive administrations.
Our budgetary adjustments over the last two and a half years have stabilised our public finances. We
must now continue on this path by adhering to the targets set out in the Plan. The strategy and these
targets in particular will be reviewed annually and action will be taken in the event of any deviation
from the central projection.
8
This Plan is based on the information available up to mid-November 2010. The figures referred to in
the document may change as a result of policy decisions taken by Government after publication.
Macroeconomic Principles and Outlook (Chapter 1)
While the budgetary adjustment required is substantial, the prospects for a return to growth are
favourable. Ireland is a small, open economy and export performance during the recession has been
markedly robust.
The vitality and dynamism of our economy depends on the health of our export sector which in turn
stimulates domestic demand and creates jobs. The strategy underpinning this Plan will stimulate
broadly-based export-led growth to increase output, to return to sustainable employment creation and
to assist recovery in the domestic economy.
Many of the essential conditions for a resumption of export-led growth are in place: our road network
and our public transport system have been transformed; we have one of the best educated
workforces in the world; and our tax system supports enterprise and innovation. This Plan sets out the
measures we will take to increase productivity and rebuild our competitiveness.
The current account of the balance of payments is expected to return to surplus in 2011 and record a
steadily rising surplus over the following three years. This means that from next year the economy as
a whole will no longer be borrowing from the rest of the world.
Macroeconomic Outlook 2011–14
The reforms set out in this Plan will lead to a more stable macroeconomic position:
Real GDP will grow by an average of 2¾% in the years from 2011 to 2014;
From 13½% in 2010, unemployment will fall below 10% in 2014.
Budget Strategy (Chapter 1)
Approximately two thirds of the budgetary adjustment (€10 billion) will be achieved through
expenditure savings and one third (€5 billion) through revenue-raising measures. Within the
expenditure saving of €10 billion, current expenditure will be reduced by €7 billion and capital
investment by €3 billion.
Budget Strategy 2011–14
The Plan will correct budgetary imbalances:
€15 billion budgetary correction over 4 years;
€10 billion in public expenditure, €5 billion in tax and revenue raising;
40% or €6 billion will be front-loaded in 2011;
Deficit will be reduced to 9.1% of GDP in 2011 and to below 3% by 2014; and
Debt to GDP ratio will peak at 102% in 2013 and will fall to 100% by 2014.
9

Strategy for Competitiveness, Growth and Employment (Chapter 2)
Government policy must support the private sector by removing potential structural impediments to
competitiveness and employment creation, and by pursuing appropriate sectoral policies to encourage
export growth and a recovery of domestic demand.
At present, the level of the minimum wage is out of step with an economy where GNP has fallen by
19%. Other labour market regulations are preventing job creation – especially in sectors where
unemployment among younger and less-skilled workers is most prevalent. Decisive reform is required.
Welfare and labour market policies must reward work and provide a pathway to employment,
education and training opportunities for those who have lost their jobs. Reforms in this area, along
with measures to enhance competitiveness, are pivotal to growth in our economy.
Competitiveness, Growth and Employment
The Government will:
Reduce the minimum wage by €1 to €7.65;
Reform welfare system to incentivise work and eliminate unemployment traps;
Complete a review to eliminate anomalies in Registered Employment Agreements
(REAs) and Employment Regulation Orders (EROs) within three months; and
Reinvigorate activation policies to ensure that unemployed people can make a swift
return to work.
Cost competitiveness:
Promote rigorous competition in the professions and measures to reduce legal costs;
Take decisive actions to reduce waste and energy costs faced by businesses
including the development of Smart Grids and renewable energy;
Enhance availability of technological infrastructure, in particular next generation
broadband networks;
Lead efforts to reduce office rents in both the private and public sectors; and
Increase efficiency in public administration to reduce the costs for the private sector.
Sectoral Policies:
Implement sector-specific measures to assist an increase in exports as well as an
increase in domestic demand.
Support innovation through the innovation fund, other enterprise supports and the
tax system, and encourage small business development.
Expenditure Measures (Chapters 3, 4 & 5)
The job of Government is to create the conditions in which enterprise can flourish and jobs can be
created. The most important of these conditions is sound public finances. Since 2007, our national
income (GNP) has fallen by 15% and our tax revenues have reduced from over €47 billion to €31.5
10
billion and are now back to 2003 levels. In these circumstances, the current level of public spending is
unaffordable. It must be returned to a sustainable level relative to the size of the economy.
The bulk of the savings will have to come from the major drivers of spending including Public Service
Pay and Pensions, Social Welfare, Public Services including student supports, free or subsidised
medical care and treatment and Public Investment.
The expenditure measures contained in this Plan are designed not only to return public spending to a
sustainable level but also to protect those most in need and facilitate economic recovery. Careful
choices have been made to target scarce resources at those most in need, to protect enterprise and
to promote competitiveness. Investment in education, innovation and enterprise has been maintained.
The targets set for a reduction in public service staff levels together with the full implementation of
the Croke Park Agreement will create a more efficient and effective public service, a crucial
component of competitiveness that will deliver better services to the citizens at a lower cost.
Capital spending must be reduced. But these reductions of €3 billion by 2014 must be considered in
the context of the very substantial investment over the past decade which has transformed our road
network, our public transport system, our educational institutions and our cultural, sport and tourist
facilities. In the current lower cost environment, better value can be achieved from a lower level of
capital investment creating a high level of capacity in the economy and delivering important social
infrastructure.
Expenditure Savings
Government will:
Reduce current expenditure by €7 billion by 2014, bringing spending back to 2007
levels;
Reduce the cost of the public sector pay and pensions bill, social welfare, and public
service programmes;
Achieve savings in social welfare expenditure of €2.8 billion by 2014 through a
combination of enhanced control measures, labour activation, structural reform
measures, a fall in the Live Register, and, if necessary, further rate reductions;
Cut public service staff numbers by 24,750 over 2008 levels, back to levels last seen
in 2005;
Reduce the public sector pay bill by about €1.2 billion between 2010 and 2014;
Make more effective use of staffing resources with redeployment of staff within and
across sectors of the public service to meet priority needs;
Reform work practices to provide more efficient public services with scarcer
resources;
Introduce a reformed pension scheme for new entrants to the public service and
reduce their pay by 10%;
11

Introduce a pension deduction for public service pensioners to yield €100 million in
savings;
Reduce non-pay and non-social welfare spending by €3 billion over the period;
Increase the student contribution to the costs of third level education;
Introduce water metering by 2014; and
Reform and update the existing budget system beginning in Budget 2011.
Taxation Measures (Chapter 6)
While the bulk of the budgetary adjustment is on the expenditure side, taxation must also play a role
in bridging the gap between the State’s income and expenditure. Revenue-raising measures will
contribute one third of the overall budgetary adjustment. The tax system must be capable of raising
the resources necessary to pay for essential public services in a manner that does not unduly impede
economic development. The Government remains committed to the 12½% corporation tax rate: it will
not be increased under any circumstances.
In 2010, it is estimated that 45% of taxpayers will pay no income tax. This is not sustainable. A
fundamental principle of the reform outlined in this Plan is that all taxpayers must contribute
according to their means. Those who can pay most will pay most but no group can be sheltered.
The measures contained in this Plan will broaden the tax base by bringing more taxpayers into the tax
net, abolishing or curtailing a range of tax exemptions and reliefs, and introducing a new site value
tax. These changes will bring us back to an income tax structure last seen in 2006. Approximately one
third of the revenue raised will come from indirect tax, capital tax and other charges; one third from
direct income tax; and the final third from tax expenditures.
This Plan contains a set of measures which will increase Government revenues over the next four
years by just over €5 billion or approximately 3% of GDP in 2010 terms. Approximately 40% of the
policy measures will be front-loaded into 2011, resulting in substantial structural reform of the income
tax system.
Revenue measures
Government will:
Maintain the 12½% corporation tax rate; this will not change;
Raise €5 billion over the period of the Plan - 40% of measures will be front-loaded;
Raise €1.9 billion through income tax changes;
Implement pension-related tax changes to yield €700 million, with €240 million in tax savings
on the public service pension-related deduction;
Abolish/curtail a range of tax expenditures yielding €755 million;
Increase the standard rate of VAT from 21% to 22% in 2013, with a further increase to 23%
in 2014. These changes will yield €620 million;
12

Introduce a Site Value Tax to fund essential locally-delivered services. This will yield €530
million;
Increase the price of carbon gradually from €15 to €30 per tonne, yielding €330 million;
Reform Capital Acquisitions Tax and Capital Gains Tax to yield an additional €145 million;
Transform the Business Expansion Scheme (BES) into a new Business Investment Targeting
Employment Scheme (BITES).
Conclusion
Our economy is beginning to recover. There will be a small increase in GDP this year. Given the 7.6%
decline recorded in 2009 that in itself is remarkable. The impact of our improved competitiveness can
already be seen in our healthy export figures. Both our foreign owned and indigenous exporting
companies have been extremely resilient throughout the downturn. Even in the difficult trading
circumstances of this year, they have increased their market share.
This Plan will enable us to build upon the many positive aspects of our economy so that we can return
to a sustainable medium-term growth path. The measures it contains will:
remove barriers to growth;
boost our competitiveness; and
restore order to our public finances.
Detailed policy measures identified in the Plan will build on our strengths and develop other sectors to
provide a balanced economy and employment for our citizens. Our future prosperity rests upon the
implementation of this Plan over the next four years.
13
Chapter 1 Economic Policy
Key Messages
The economy is expected to stabilise this year before expanding at an annual average
rate of 2¾% between 2011 and 2014.
A €15 billion package of measures is required to restore order to the public finances
by 2014.
This package will comprise two thirds expenditure and one third revenue measures.
The adjustment will weigh on domestic demand, but its overall effect will be
mitigated by the economy’s high propensity to import and by the positive impact of
budgetary adjustments on competitiveness and confidence.
Ireland is a small, open economy in which long-term sustainable growth depends on
the health of its internationally trading sectors.
The conditions for sustainable export-led growth are in place - good infrastructure,
high-quality human capital, a favourable taxation environment and available credit for
viable businesses.
The Plan sets out policies to assist a resumption of output and employment growth,
including structural reforms to enhance labour market flexibility and cost
competitiveness.
Export-led growth will foster recovery in the domestically trading sectors.
Growth in GDP is expected to bring the unemployment rate down below 10% by
2014.
The balance of payments (BoP) is expected to return to surplus in 2011 and the
surplus will steadily increase over the following three years. This means that the
economy as a whole will no longer be borrowing from the rest of the world.
1.1 The Economy in 2010
1.1.1 Current Position
The economy is emerging from recession. The level of GDP in 2010 will be some 11% below and the
level of GNP some 15% below their respective levels of 2007 in real terms. Employment has fallen by
about 13% from its peak of 2007 while the unemployment rate has risen from 4.6% to 13.5%. A
downturn of this size is without precedent in Ireland’s recorded economic history and has few modern
parallels at an international level. It follows annual average growth of 7.3% and 6.6% in GDP and
GNP respectively, and a cumulative increase of over 900,000 of the numbers at work, between 1994
and 2007.
The recession was due in part to the effects of a steep economic downturn in our main trading
partners and a deep global financial crisis. But it was exacerbated by the collapse of the domestic
property market and construction industry and the associated banking crisis at home. As such, the
14
severity of the recession may be attributed to the combination of excessive credit expansion, rapid
property price inflation and disproportionate growth in construction output in the earlier 2000s.
The crisis has had a severe impact on the public finances. Tax receipts in 2010 will be around 33%
lower than in 2007, the steepness of the fall reflecting the over-dependence on property and
construction-related revenue sources during the boom years. At the same time, net current spending
has continued to rise because of the upward pressure exerted by a much increased Live Register, a
mounting debt interest burden and falling receipts from sources such as PRSI. As a result, the public
finances have deteriorated rapidly and a structural gap between spending and revenue has opened up
which will not be closed by a cyclical recovery in the economy (see Annex 1).
Recent data suggest that economic recovery is slowly taking shape. It is now expected that GDP will
record a very small increase this year on the back of strong export growth. Exports in turn are being
driven by improvements in competitiveness and a strengthening of international markets. Conditions
in the labour market are also beginning to stabilise as indicated by the flattening of the unemployment
rate and recent declines in the monthly Live Register. However, domestic demand remains weak as
households and businesses continue to repair their balance sheets following a period of excessive debt
accumulation.
1.1.2 Budgetary Outlook for 2010
Introduction
In early November, the Department of Finance published an Information Note on the economic and
budgetary outlook, based on detailed technical analysis and containing an assessment of future
economic conditions. Further information on the economic and budgetary outlook can be found in that
Note which is available on the Department’s website at www.finance.gov.ie. Additional economic data,
including a comparison of the Department’s forecasts with those of other organisations, a discussion
of risks, and sensitivity analysis associated with this Plan are set out in Annex 2.
The Budget Deficit
The latest Exchequer figures indicate that the Government will achieve its objective of stabilising the
underlying budget deficit in 2010. Net voted current expenditure was €37.2 billion for the period
January to October 2010, 2.7% below profile. Tax receipts for the same period amounted to €24.7
billion or 1% above profile. November will be a key month for tax receipts. However, tax revenue for
the year as a whole is currently expected to amount to €31.5 billion, some €450 million above the
level forecast in last December’s Budget.
Taking account of the likely evolution of Government spending in the final months of the year, and
excluding the impact of the bank support measures, the General Government deficit in 2010 is now
expected to be 11.7% of GDP, in line with the Budget 2010 target of 11.6%.
15
Public Debt
Due to the strong performance of the economy through much of the 1990s and early 2000s, debt
ratios fell dramatically. As a result, the General Government Gross Debt to GDP ratio had fallen to just
25% by end-2007. The underlying position was even stronger at that point: the net debt to GDP ratio
was just 14%.
By end-2009 however, reflecting the large deficits recorded in the intervening period, and other
factors, General Government Gross Debt had reached 66% of GDP. It is currently estimated that the
ratio will be 95% of GDP at end-2010. The main reason for the very large increase this year is that
the capital support – some €31 billion – being provided to a number of institutions within the banking
sector in 2010 is classified within the General Government Gross Debt measure. When account is
taken of the value of assets in the National Pensions Reserve Fund (NPRF) and of Exchequer cash
balances, the position is a good deal more favourable. The net debt measure that results from these
adjustments is estimated at 69% of GDP at the end of 2010.
1.2 Budgetary Adjustment
1.2.1 Rationale for Adjustment
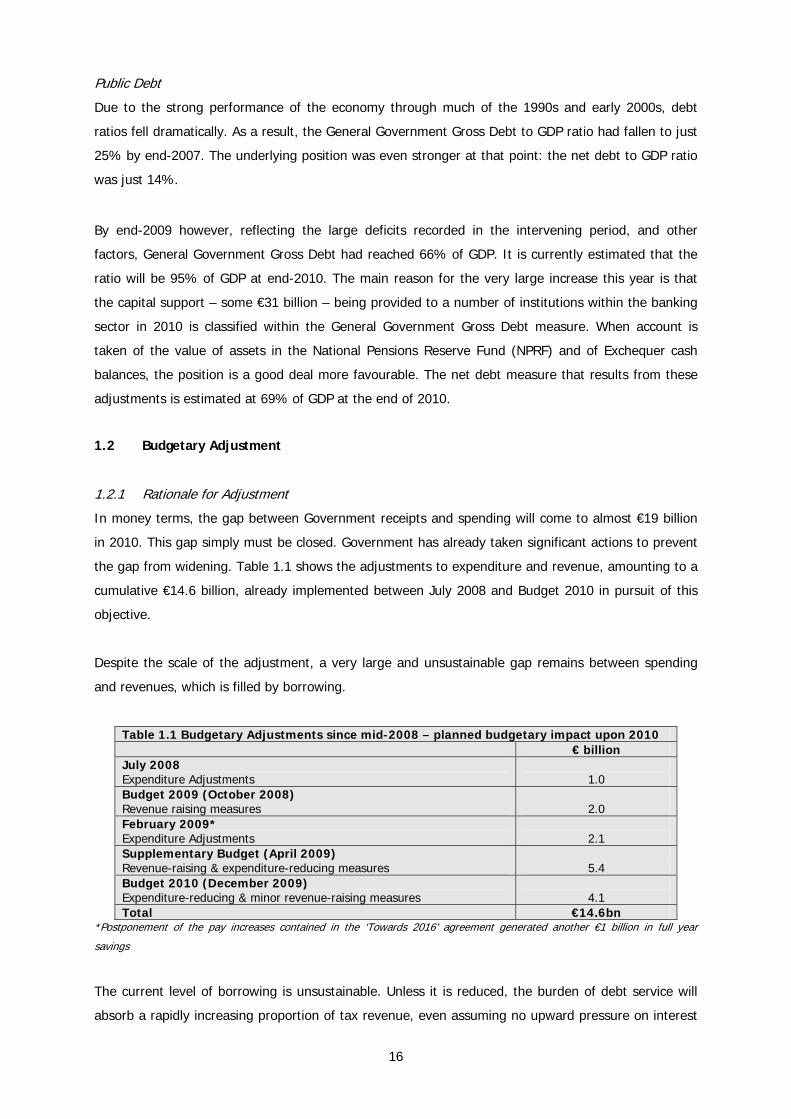
In money terms, the gap between Government receipts and spending will come to almost €19 billion
in 2010. This gap simply must be closed. Government has already taken significant actions to prevent
the gap from widening. Table 1.1 shows the adjustments to expenditure and revenue, amounting to a
cumulative €14.6 billion, already implemented between July 2008 and Budget 2010 in pursuit of this
objective.
Despite the scale of the adjustment, a very large and unsustainable gap remains between spending
and revenues, which is filled by borrowing.
Table 1.1 Budgetary Adjustments since mid-2008 – planned budgetary impact upon 2010 € billion July 2008 Expenditure Adjustments
1.0
Budget 2009 (October 2008) Revenue raising measures
2.0
February 2009* Expenditure Adjustments
2.1
Supplementary Budget (April 2009) Revenue-raising & expenditure-reducing measures
5.4
Budget 2010 (December 2009) Expenditure-reducing & minor revenue-raising measures
4.1
Total €14.6bn *Postponement of the pay increases contained in the ‘Towards 2016’ agreement generated another €1 billion in full year
savings
The current level of borrowing is unsustainable. Unless it is reduced, the burden of debt service will
absorb a rapidly increasing proportion of tax revenue, even assuming no upward pressure on interest
16
rates. More pertinently, as recent developments in the international bond markets have shown,
persisting with the current scale of borrowing will result in interest rates remaining at unaffordable
levels. Moving towards a balanced budget therefore is a prerequisite for future economic growth.
Tackling the deficit now is essential in order to engender international confidence in our ability to
meet our commitments.
1.2.2 Scale of adjustment required
Ireland’s membership of the eurozone obliges us to adhere to the Stability and Growth Pact and bring
the General Government deficit back below 3% of GDP. Budget 2010 assumed an adjustment package
of €7.5 billion over a four-year period would be required to reach this target by 2014, the target year
agreed with our European partners. It is now estimated that an adjustment of some €15 billion will be
necessary to reach this target.
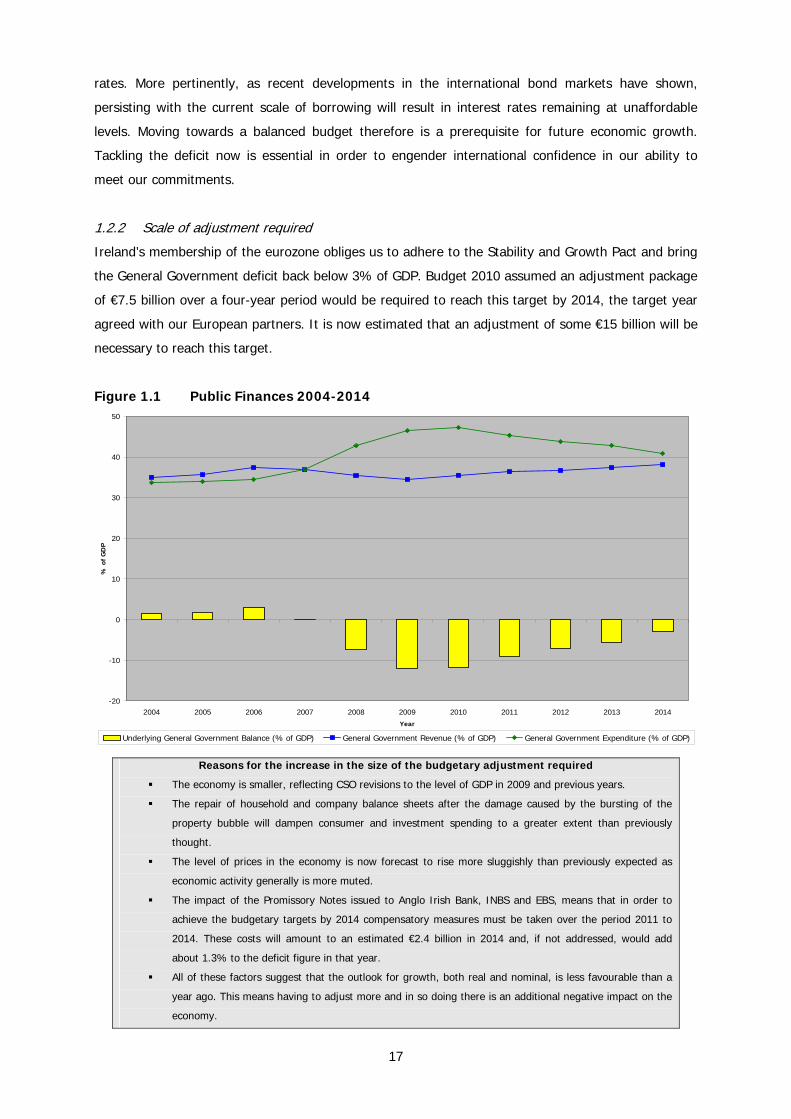
Figure 1.1 Public Finances 2004-2014
-20
-10
0
10
20
30
40
50
2004 2005 2006 2007 2008 2009 2010 2011 2012 2013 2014
Year
% o
f G
DP
Underlying General Government Balance (% of GDP) General Government Revenue (% of GDP) General Government Expenditure (% of GDP)
Reasons for the increase in the size of the budgetary adjustment required
The economy is smaller, reflecting CSO revisions to the level of GDP in 2009 and previous years.
The repair of household and company balance sheets after the damage caused by the bursting of the
property bubble will dampen consumer and investment spending to a greater extent than previously
thought.
The level of prices in the economy is now forecast to rise more sluggishly than previously expected as
economic activity generally is more muted.
The impact of the Promissory Notes issued to Anglo Irish Bank, INBS and EBS, means that in order to
achieve the budgetary targets by 2014 compensatory measures must be taken over the period 2011 to
2014. These costs will amount to an estimated €2.4 billion in 2014 and, if not addressed, would add
about 1.3% to the deficit figure in that year.
All of these factors suggest that the outlook for growth, both real and nominal, is less favourable than a
year ago. This means having to adjust more and in so doing there is an additional negative impact on the
economy.
17
1.2.3 The Composition of the Budgetary Adjustment
It is clear that an adjustment of the magnitude required cannot be achieved by exclusive reliance on
either tax increases or expenditure cuts. If taxes were raised by €15 billion over the next four years,
the burden of taxation would increase to the point where competitiveness was hugely impaired and
the economy’s capacity to generate growth in output and employment seriously damaged. Conversely,
if the entire burden of the €15 billion reduction were to fall on Government spending, the impact on
public services and social welfare provision would be unacceptable.
It follows that the adjustments to be made must comprise a mix of revenue-raising and expenditure-
reducing measures. In determining the appropriate balance between the two, the Government has
been guided by the lessons of our past as well as the experience of other countries that have found
themselves in similar circumstances. The international evidence, analysed by organisations such as
the IMF, the EU Commission and the OECD, suggests that budgetary adjustments are more successful
in reducing deficits and stabilising debt ratios when they rely more on reducing expenditure than
increasing taxes.
This is consistent with our own experience of the late 1980s. The unsuccessful attempts at restoring
order to the public finances in the early part of that decade leaned heavily on tax increases, while the
successful budgetary adjustment of the late 1980s relied more on controlling expenditure and, insofar
as it included tax measures, concentrated on widening the base rather than increasing rates of tax.
Of the €14.6 billion of budgetary adjustments that have already been undertaken since 2008 just
under two-thirds have fallen on the expenditure side with the remainder comprising revenue-raising
measures. Similar proportions will apply to the adjustments planned for the next four years: of the
€15 billion overall adjustment to be made, €10 billion will be composed of expenditure reductions and
€5 billion will comprise revenue-raising measures. Drawing on the experience of the 1980s, the
proposed revenue-raising measures will concentrate on broadening the base as part of the reform of
the tax system that was signalled in Budget 2010.
The effect of the adjustment will be to raise the overall ratio of tax (including receipts from PRSI, the
Health Levy and the National Training Fund Levy) to GDP by about 3% points between 2010 and
2014. This will still leave the ratio slightly below the level it was at in the late 1990s, a period during
which the economy last experienced balanced export-led growth.
Table 1.2 below shows the General Government Deficits in each of the years 2011-2014, arising out of
an overall adjustment package of €15 billion. Achieving these budget targets is predicated on
implementing the expenditure and taxation adjustments set out later in this document. Chapters 3 to
5 detail the required current and capital expenditure adjustments on a sector by sector basis. Chapter
6 sets out the individual revenue-raising measures which are necessary to generate an additional €5
billion in revenue.
18

Table 1.2 – Forecast General Government Deficits and end-year Gross Debt Levels
2011 2012 2013 2014
General Government Deficit (% of GDP) 9.1% 7.0% 5.5% 2.8%
Total Consolidation2 (Full-Year Impacts) €6.0bn €3.6bn €3.1bn €3.1bn
Expenditure €3.9bn €2.1bn €2.0bn €2.0bn
o Current €2.1bn €1.7bn €1.6bn €1.6bn
o Capital €1.8bn €0.4bn €0.4bn €0.4bn
Taxation €1.4bn €1.5bn €1.1bn €1.1bn
Other €0.7bn
General Government Gross Debt (% of GDP) 100% 101% 102% 100%
Rounding may affect totals
Implementing a package of budgetary adjustments totalling €15 billion over the next four years in the
manner outlined above and a gradual unwinding of Exchequer cash balances is expected to result in
the General Government Gross Debt peaking in 2013 at 102% of GDP before falling to 100% of GDP
by 2014.
The stabilisation and subsequent reduction of the ratio of debt to GDP is dependent, among other
things, on the growth rate of nominal GDP and the average interest rate on the debt. The sensitivity
of the ratio to these variables is explored in Annex 3.
1.3 Achieving Economic Recovery
1.3.1 Growth in an Open Regional Economy
Ireland is an open regional economy. Its openness is most obvious in terms of the importance of
international trade: exports and imports of goods and services are equal to 175% of GDP. But there
are other dimensions of Ireland’s openness that are no less significant. One is its dependence on
international capital flows, including flows of foreign direct investment from abroad. Another is the
elasticity of its labour supply: the capacity for its labour force to be augmented by immigration and
depleted by emigration.
Ireland’s openness means that the economy here interacts widely and deeply with the rest of the
world and is sensitive to changes in world economic conditions, while its size means that the domestic
market is too small to provide the basis for long run sustainable growth. Long term growth in a small
open economy therefore is a function of the export base, the collection of enterprises that are
involved in the production of goods and services for international markets.
2 Total consolidation sums to more than €15 billion in Table 1.2 due to inclusion of non-recurring once-off items that impact in 2011 only. The full year impacts of expenditure and revenue measures are taken into account in the figures. 19

The enterprises that make up these internationally trading sectors generate output and employment
directly, but they also generate output and employment indirectly in Ireland through their demand for
buildings, machinery, components, raw materials and a wide range of service inputs. On top of that,
the internationally trading sector together with the local firms that supply it, create a multiplier effect
throughout the wider economy, as the people employed in these sectors spend their wages and
salaries.
The vitality and dynamism of the Irish economy therefore depends ultimately on the vitality and
dynamism of its internationally trading sector. This, in turn, depends on the competitiveness of the
enterprises that go to make up the sector, that is, on their ability to win, retain and expand their
share of the international markets which they serve. It also depends on Ireland’s attractiveness as a
location for the establishment of new exporting activities.
Long-term sustainable growth in the Irish economy is export-led. This is not to say that domestic
demand is unimportant. On the contrary, balanced economic growth is attained when consumption
and investment, as well as exports, are expanding at a healthy pace. Indeed, strong gains in
employment typically require solid growth in domestic demand. This is because the sectors that serve
domestic demand, like retailing and construction, tend to be more labour intensive than the exporting
sectors. There are notable exceptions to this pattern. Tourism, for example, is an important exporting
sector that is relatively labour intensive.
In their recent analysis of the causes of the swift reversal of our economic fortunes, Klaus Regling and
Max Watson3 conclude that in the period leading up to the current crisis, the share of construction
sector in the economy became excessive and as our competitiveness deteriorated significantly, Ireland
lost market shares in international trade. At the height of the building boom in 2007, the construction
sector directly accounted for 13% of total employment, compared with an average of just over 7% for
the 1990s. The appetite of a rampant building industry for labour and other resources put upward
pressure on the economy’s cost structure and contributed to the deterioration in the competitiveness
of the internationally trading sectors.
The Irish economy did enjoy sustained balanced export-led growth as recently as the 1990s. Between
1993 and 2000, exports expanded at almost 18% per annum, driving average annual GDP growth of
9%, a cumulative increase of half-a-million people in employment, a cumulative rise in living
standards of about 80%, and all in the context of maintaining a healthy balance of payments position
and achieving a substantial government budget surplus.
The formula for achieving the kind of balanced sustainable growth in output and employment that is
appropriate to a small open economy, therefore, is not elusive. We discovered and applied that
formula in the 1990s and we can do so again. 3 A Preliminary Report on the Sources of Ireland’s Banking Crisis by Klaus Regling and Max Watson – Published May 2010.
20

1.3.2 Economic Policy Principles
Although Government has only a marginal presence in the production of internationally traded goods
and services, it plays a vital part in creating the conditions in which the sector can grow and prosper.
Equally important, Government is responsible for creating an environment that makes Ireland an
attractive place in which to live and work.
The most important of these conditions and the one for which the Government has the clearest and
most direct responsibility is sound public finances. Unsustainable public finances undermine the
framework for economic prosperity through at least three channels: (i) the upward pressure on
interest rates and the consequent increase in the price of credit; (ii) the uncertainty created about the
future course of taxes and the continued provision of essential public services, and (iii) the
reputational damage to the country and its institutions. The restoration of sound public finances must
be the cornerstone of any economic plan.
The measures taken to restore sound public finances must observe certain principles and must have
regard to the nature of the Irish economy. A key principle is that the measures be fair and be seen to
be fair in order to maintain the highest degree of social cohesion. In deciding on the measures to be
taken to restore sustainability to the public finances, the government has attempted to spread the
burden of adjustment as equitably as possible.
Over the past two years, the combination of tax and social welfare changes has reflected that spirit of
fairness. Analysis of the distributive impact4 shows that the net impact of these changes has been
progressive, with higher income groups carrying a larger burden than those on modest incomes. In
real terms, the reduction in the cost of living has also helped to maintain living standards.
A number of other considerations have informed the Government’s approach to framing the budgetary
measures and the broader economic policy initiatives detailed later in this Plan:
The need to boost competitiveness. This has, for example, influenced the composition of
budgetary adjustment as between spending and revenue-raising and the emphasis in raising
revenue on widening the base rather than raising tax rates.
The need to enhance the economy’s productive capacity. The government has sought to make
the bulk of the necessary spending reductions on the current side. In doing so it has ensured
that sufficient funds are available to press ahead with key infrastructural projects and to
maintain high levels of spending on education.
The need to take a long-term view. At the core of our fiscal problem is a large structural
deficit, the measures to eliminate which have to be structural in nature. These measures must
be permanent in their impact and selected on the grounds of their appropriateness over the
medium to long run. Charting our way out of our current difficulties requires long-term
4 Carried out by the Social Inclusion Unit in the then Department of Social and Family Affairs.
21
planning. The proposals for reform of the budgetary process, outlined in Chapter 3, are
intended to create a framework in which fiscal policy decisions are informed by a medium to
long-term perspective.
The need for credibility. This Plan must be credible, both to Irish citizens and to international
markets. To that end, the Plan is based on a set of economic forecasts which the Government
believes to be prudent, and sets out the policy measures which it is proposed to take at a level
of detail designed to dispel uncertainty to the greatest degree possible.
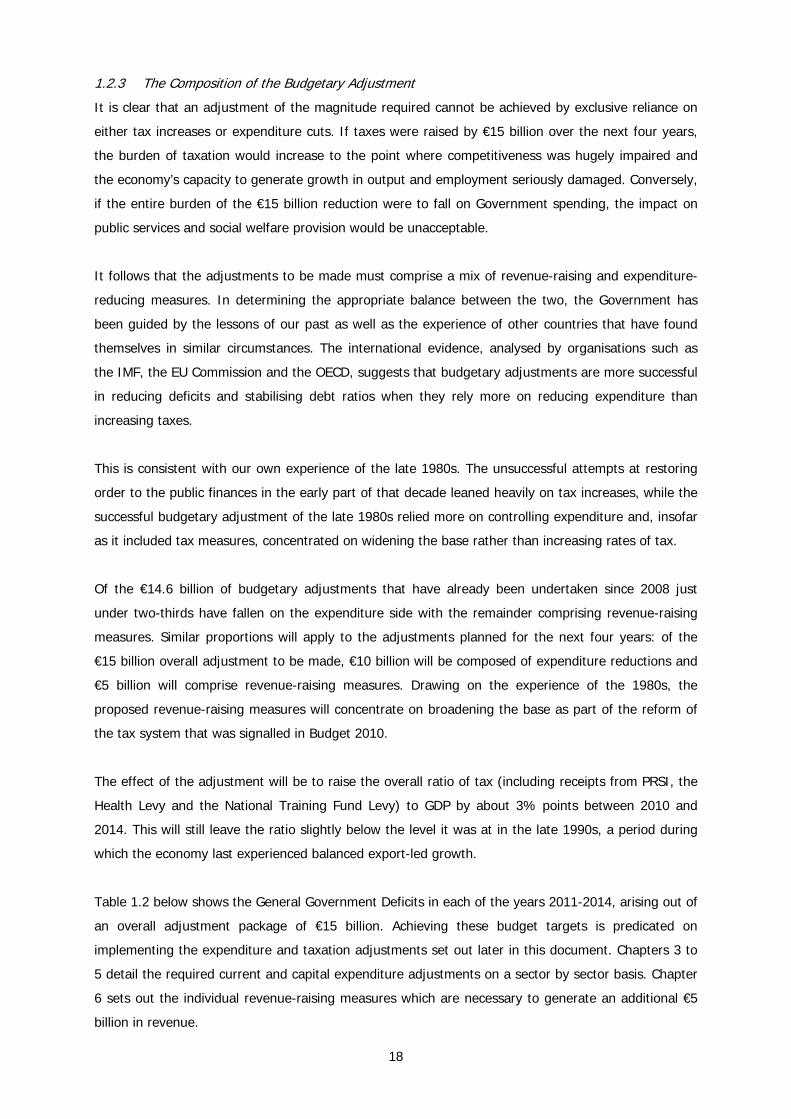
1.3.3 Strategy for growth
Figure 1.2 illustrates the anticipated path to economic recovery set out in this chapter. The process of
recovery is founded on a number of essential conditions – which are either in place, or are being
pursued actively - coupled with a range of specific policy actions detailed in Chapter 2. These
measures will assist export recovery through enhanced competitiveness and sector-specific initiatives.
Export growth will in turn deliver high value employment and act to stimulate the domestically trading
sectors of the economy. The measures contained in Chapter 2 will also directly assist in job creation in
the local economy by removing barriers to employment and disincentives to work. These
developments will in turn boost consumption and, over time, reduce unemployment and lead to
further employment gains.
Figure 1.2 Summary Steps to Economic Recovery
Consumption
improves
Exports recover
1. Horizontal Measures (a) Labour market reform (b) Steps to reduce costs (c) Public administration improvements 2. Specific sectoral initiatives
Employmentgains,
tax revenue increases,
unemployment falls
Credit availability
Infrastructure Human Cap
Favourable Taxation
Sustainable public finances
Employment increases Unemployment stabilises
Essential conditions
Anticipated outcomes
Policies for growth
22

Restoring competitiveness and retuning sectoral policy to grow exports and assist locally trading firms
is the necessary first step on the path to economic recovery. This is Government’s core strategy for
tackling unemployment.
1.3.4 Essential Conditions for Growth
Our experience shows that economic growth and sustainable jobs are generated by the private sector
in the main. But Government plays an important role in creating the framework conditions to enable
growth. The budgetary adjustment measures set out in this Plan can deliver sustainable public
finances. Other essential inputs from Government include:
the provision of appropriate economic and social infrastructure;
investment in human capital;
ensuring adequate credit availability; and
tax polices which are favourable to entrepreneurship, investment and work.
Across these areas, conditions for growth are either already in place, or policies to achieve them are
being pursued.
Essential Conditions for Growth
Physical infrastructure Improvements to our stock of economic and social infrastructure over the past decade or so are a visible legacy of the economic expansion of that period. In the years between 1997 and 2007 annual public capital allocations were quadrupled. This investment expanded capacity across a range of sectors and addressed the infrastructure deficit that had previously constrained the Irish economy. The current stock of infrastructure, which will be augmented by a substantial ongoing programme of public investment over the next four years, leaves the economy well-equipped to return to export-led growth. Capital investment will continue to support employment by providing a significant level of direct job supports to IDA Ireland and Enterprise Ireland. These supports will be maintained so that the Government will offer considerable direct assistance to the enterprise sector alongside measures to improve competitiveness. Available human capital As with the stock of physical infrastructure, the quality of Ireland’s human capital puts us in a strong position for a return to economic growth. The country continues to have a skilled and flexible labour force whose educational profile displays a number of 2positive characteristics. The 25-34 year old age cohort, for example, has a higher level of formal qualification than the OECD average, while the proportion of the population aged 20-24 with at least an upper second-level education is the highest in the EU15 (see figure 1.3) Amongst those who have become unemployed a large number have significant levels of skill and experience and a history of achievement across a range of sectors. Credit availability for business An overriding objective of the Government’s banking policy is to ensure that viable businesses, especially Small and Medium Enterprises (SMEs), can access the credit they need. To this end a Code of Conduct on SME Lending was introduced for the first time last year. The Code requires banks to deal fairly and transparently with their business customers. In addition, the Credit Review Office (CRO), set up under the NAMA legislation, provides a review mechanism for SMEs who have had credit refused, withdrawn, or offered on unreasonable conditions. In his latest quarterly report, Mr. John Trethowan of the CRO notes that the lending situation for SMEs is improving and that the recapitalisation strategy for the two largest banks (Bank of Ireland and Allied Irish Bank) is achieving its objective.
23
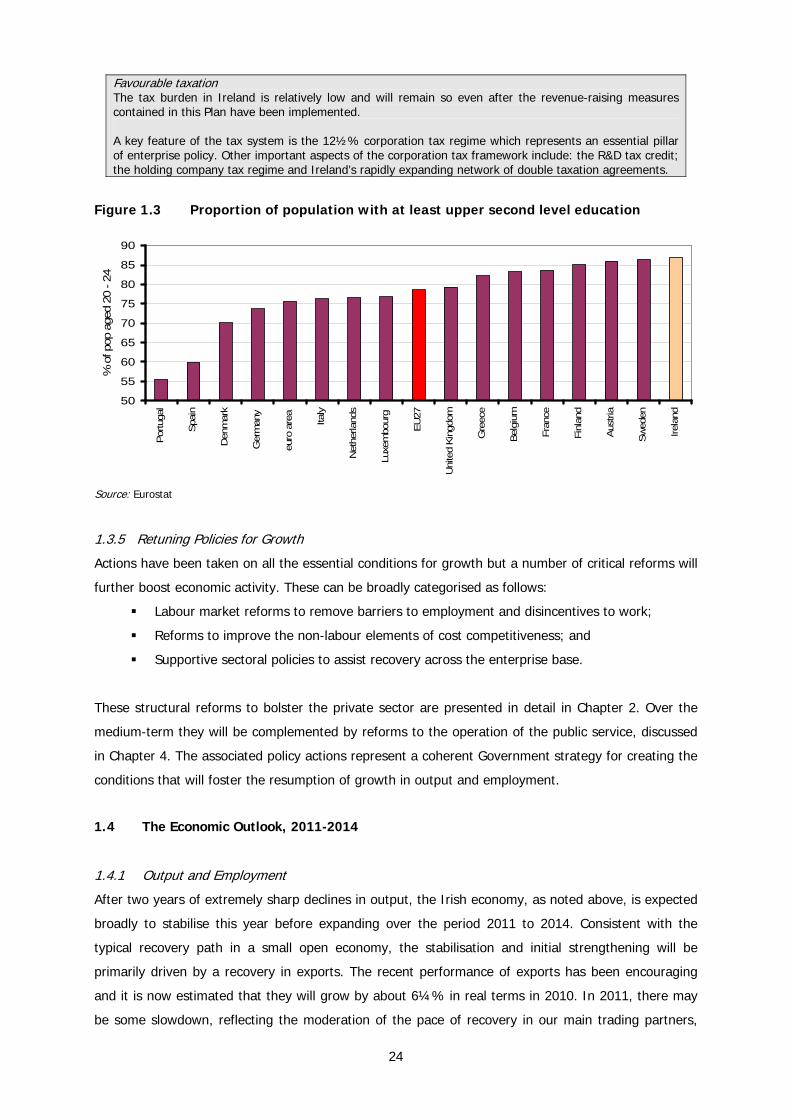
Favourable taxation The tax burden in Ireland is relatively low and will remain so even after the revenue-raising measures contained in this Plan have been implemented. A key feature of the tax system is the 12½% corporation tax regime which represents an essential pillar of enterprise policy. Other important aspects of the corporation tax framework include: the R&D tax credit; the holding company tax regime and Ireland’s rapidly expanding network of double taxation agreements.
Figure 1.3 Proportion of population with at least upper second level education
50
55
60
65
70
75
80
85
90
Portu
gal
Spai
n
Den
mar
k
Ger
man
y
euro
are
a
Italy
Net
herla
nds
Luxe
mbo
urg
EU27
Uni
ted
Kin
gdom
Gre
ece
Belg
ium
Fran
ce
Finl
and
Aus
tria
Swed
en
Irela
nd
% o
f pop
age
d 20
- 24
Source: Eurostat
1.3.5 Retuning Policies for Growth
Actions have been taken on all the essential conditions for growth but a number of critical reforms will
further boost economic activity. These can be broadly categorised as follows:
Labour market reforms to remove barriers to employment and disincentives to work;
Reforms to improve the non-labour elements of cost competitiveness; and
Supportive sectoral policies to assist recovery across the enterprise base.
These structural reforms to bolster the private sector are presented in detail in Chapter 2. Over the
medium-term they will be complemented by reforms to the operation of the public service, discussed
in Chapter 4. The associated policy actions represent a coherent Government strategy for creating the
conditions that will foster the resumption of growth in output and employment.
1.4 The Economic Outlook, 2011-2014
1.4.1 Output and Employment
After two years of extremely sharp declines in output, the Irish economy, as noted above, is expected
broadly to stabilise this year before expanding over the period 2011 to 2014. Consistent with the
typical recovery path in a small open economy, the stabilisation and initial strengthening will be
primarily driven by a recovery in exports. The recent performance of exports has been encouraging
and it is now estimated that they will grow by about 6¼% in real terms in 2010. In 2011, there may
be some slowdown, reflecting the moderation of the pace of recovery in our main trading partners,
24
but taking the 2011-2014 period as a whole, exports can be expected to increase at a healthy pace as
the competitiveness of Irish producers improves further and demand continues to grow in our
overseas markets.
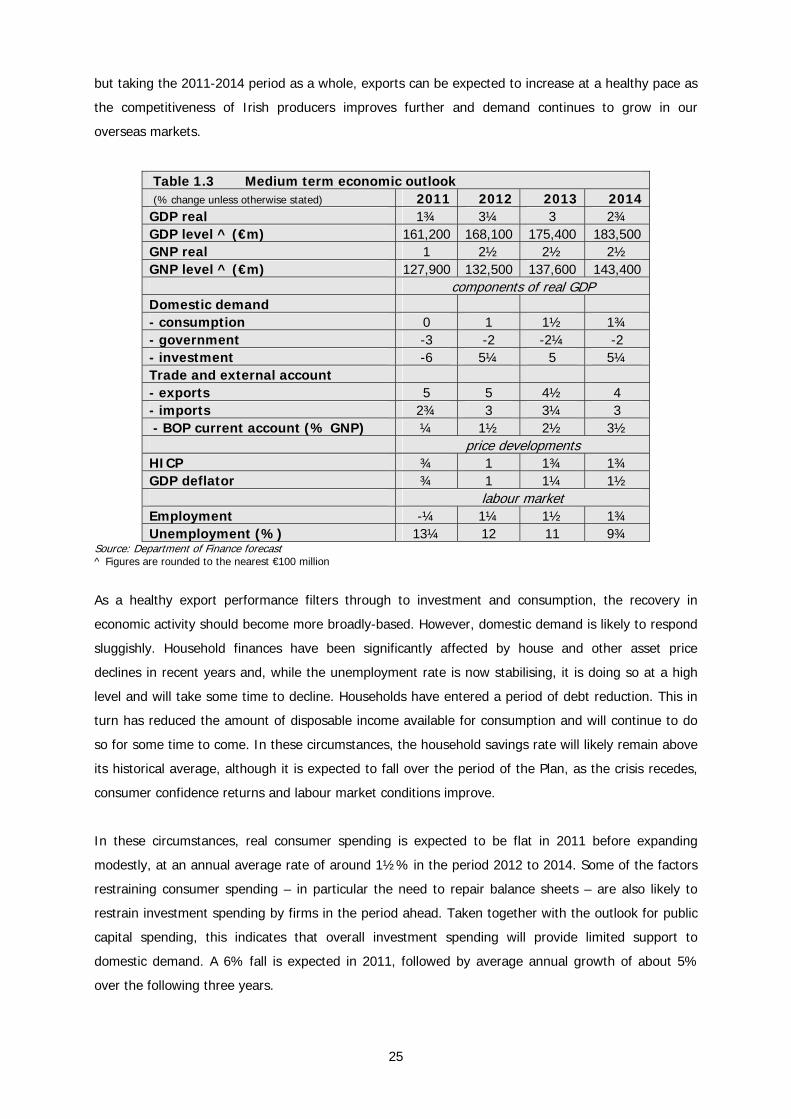
Table 1.3 Medium term economic outlook (% change unless otherwise stated) 2011 2012 2013 2014 GDP real 1¾ 3¼ 3 2¾ GDP level ^ (€m) 161,200 168,100 175,400 183,500 GNP real 1 2½ 2½ 2½ GNP level ^ (€m) 127,900 132,500 137,600 143,400 components of real GDP Domestic demand - consumption 0 1 1½ 1¾ - government -3 -2 -2¼ -2 - investment -6 5¼ 5 5¼ Trade and external account - exports 5 5 4½ 4 - imports 2¾ 3 3¼ 3 - BOP current account (% GNP) ¼ 1½ 2½ 3½ price developments HICP ¾ 1 1¾ 1¾ GDP deflator ¾ 1 1¼ 1½ labour market Employment -¼ 1¼ 1½ 1¾ Unemployment (%) 13¼ 12 11 9¾
Source: Department of Finance forecast ^ Figures are rounded to the nearest €100 million
As a healthy export performance filters through to investment and consumption, the recovery in
economic activity should become more broadly-based. However, domestic demand is likely to respond
sluggishly. Household finances have been significantly affected by house and other asset price
declines in recent years and, while the unemployment rate is now stabilising, it is doing so at a high
level and will take some time to decline. Households have entered a period of debt reduction. This in
turn has reduced the amount of disposable income available for consumption and will continue to do
so for some time to come. In these circumstances, the household savings rate will likely remain above
its historical average, although it is expected to fall over the period of the Plan, as the crisis recedes,
consumer confidence returns and labour market conditions improve.
In these circumstances, real consumer spending is expected to be flat in 2011 before expanding
modestly, at an annual average rate of around 1½% in the period 2012 to 2014. Some of the factors
restraining consumer spending – in particular the need to repair balance sheets – are also likely to
restrain investment spending by firms in the period ahead. Taken together with the outlook for public
capital spending, this indicates that overall investment spending will provide limited support to
domestic demand. A 6% fall is expected in 2011, followed by average annual growth of about 5%
over the following three years.
25
Real GDP is forecast to increase by an average of almost 2¾% in the years 2011 to 2014, with real
GNP growing by an average of just over 2% over this period. Growth in 2011 however will be
considerably below the average for the period as a whole. This moderate expansion in output is
expected to be accompanied by the resumption of employment growth, starting in 2012 and
averaging about 1½% a year between 2012 and 2014, generating a cumulative increase of about
90,000 over this period. This is consistent with a steady decline in the unemployment rate which is
expected to have fallen below 10% by 2014.
Reflecting the moderate pace of output growth, the amount of spare capacity in the economy and the
likelihood that external pressures on prices will be modest, low rates of inflation are projected.
Consumer price inflation should be contained at less than 1% in 2011 and is forecast to average
1½% in the years 2012 through 2014. The GDP deflator, which provides the most comprehensive
measure of inflation in the economy, is expected to increase at a somewhat slower rate. Inflation, by
either measure, is expected to be lower than in our main trading partners over the period of the Plan,
reflecting and assisting the process of competitiveness improvement.
This economic outlook summarised above takes account of the €15 billion budgetary adjustment
package planned for 2011-2014. It also takes account of the favourable impact on output and
employment expected to accrue from the proposed structural reforms to bolster labour market
flexibility and cost competitiveness contained in Chapter 2.
1.4.2 The Impact of Fiscal Consolidation in an Open Economy
Budgetary adjustment will clearly have a negative impact on household disposable income, thereby
lowering personal consumption. However, the impact of the adjustment on consumption is unlikely to
be one-for-one. This reflects the current elevated level of household savings. Figures from the Central
Statistics Office (CSO) put the savings rate at over 12% in 2009, and Department of Finance
estimates point to a broadly similar rate for this year. Households have increased their savings for a
number of reasons: uncertainty regarding future income prospects has motivated an increase in
precautionary savings while the decline in net household wealth (or more precisely the ratio of net
wealth to disposable income) has prompted debt deleveraging within the household sector, a
phenomenon which is expected to decline over the period of the Plan.
Budgetary adjustment can potentially play a positive role in reducing precautionary savings by
creating greater certainty about the prospects for household disposable income. In particular,
permanent, targeted and well-designed budgetary adjustment measures can reasonably be expected
to have a favourable effect on confidence, so that the impact on consumer spending of lower
disposable income may be partly offset by a decline in the savings rate. In relation to specific
measures, as noted earlier, the available evidence suggests that reductions in current spending have a
smaller negative impact on economic activity than cuts in productive capital spending or tax increases.
26

The available evidence also indicates that, when taxes need to be raised, measures that broaden the
tax base are preferable to increases in tax rates.
The openness of the Irish economy must also be borne in mind in assessing the effect of budgetary
adjustment. In the first instance, the import content of spending in Ireland is relatively high. In other
words, we import a large share of what we consume. Thus, while domestic demand will clearly decline
because of the budgetary adjustments that need to be made, the consequent decline in imports will
mean that the impact on GDP will be significantly less than it would otherwise be.
At the same time, the budgetary adjustment will contribute to improving the economy’s
competitiveness by putting downward pressure on the domestic cost base. This will have a positive
effect on export performance which will provide some measure of offset to the dampening effect of
fiscal correction on overall economic activity.
1.4.3 Savings, the Balance of Payments and the Banking System
The current account of the balance of payments is a measure of the extent to which the economy as a
whole is lending to or borrowing from the rest of the world. An important aspect of the behaviour of
the Irish economy over the past few years relates to the balance of payments. Since 2008 there has
been a sharp fall in the balance of payments current account deficit, which amounted to almost 6% of
GDP in 2008, but which is estimated to have declined to 1.4% of GDP in 2010. What this signifies is a
major reduction in the rate at which Ireland (public and private sectors together) has been borrowing
from abroad.
Given an underlying government budget deficit of 11.7% of GDP, the small current account deficit in
2010 indicates that the private sector is now running a very large financial surplus, equivalent to over
10% of GDP. This surplus reflects the combination of the steep fall in investment and the sharp
increase in savings that has occurred in the recession.
The increase in savings is especially evident in the household sector where the savings rate, according
to the CSO, rose from less than 4% in 2008 to over 12% in 2009. This increase in savings has been
used to rebuild household balance sheets. In part this has been achieved by the repayment of debt.
Already, the value of outstanding loans to households has been reduced by about 10% from its
January 2008 peak of €154 billion to €139 billion in September 2010.
27
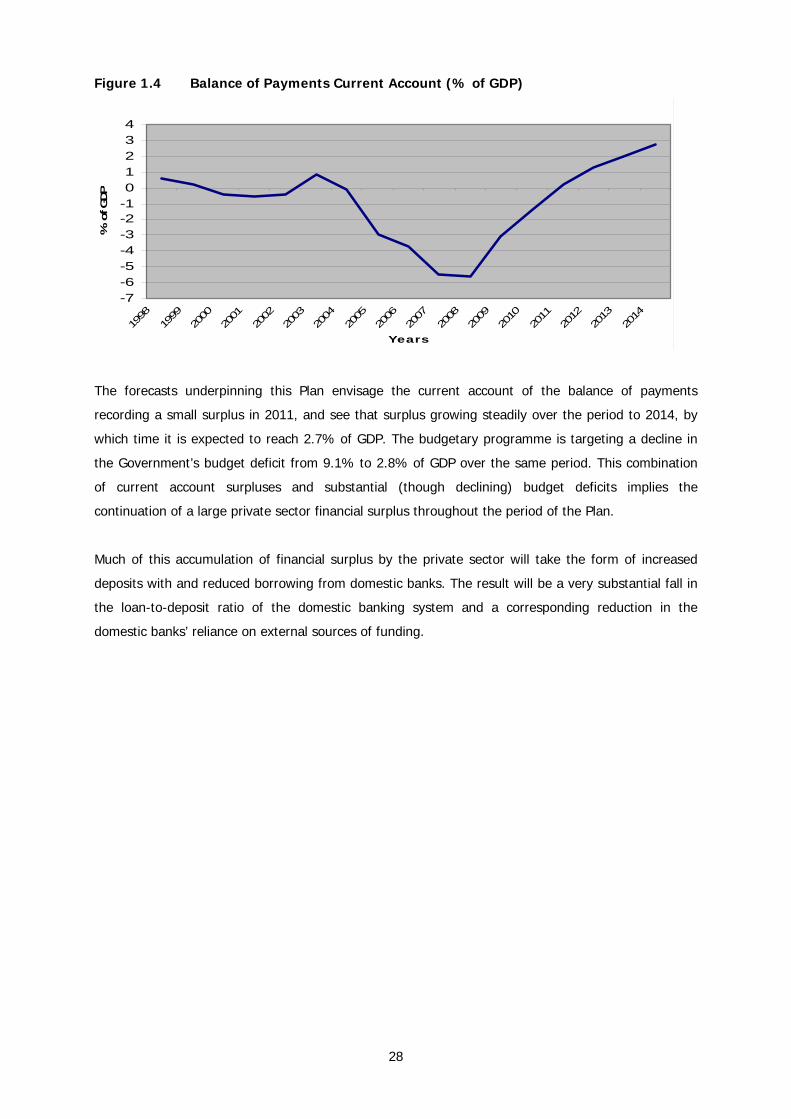
Figure 1.4 Balance of Payments Current Account (% of GDP)
-7-6-5-4-3-2-101234
1998
1999
2000
2001
2002
2003
2004
2005
2006
2007
2008
2009
2010
2011
2012
2013
2014
Years
% o
f GDP
The forecasts underpinning this Plan envisage the current account of the balance of payments
recording a small surplus in 2011, and see that surplus growing steadily over the period to 2014, by
which time it is expected to reach 2.7% of GDP. The budgetary programme is targeting a decline in
the Government’s budget deficit from 9.1% to 2.8% of GDP over the same period. This combination
of current account surpluses and substantial (though declining) budget deficits implies the
continuation of a large private sector financial surplus throughout the period of the Plan.
Much of this accumulation of financial surplus by the private sector will take the form of increased
deposits with and reduced borrowing from domestic banks. The result will be a very substantial fall in
the loan-to-deposit ratio of the domestic banking system and a corresponding reduction in the
domestic banks’ reliance on external sources of funding.
28

Chapter 2 Strategy for Competitiveness, Growth and Employment
Key Messages
Export led growth will fuel domestic recovery.
Policy will foster the considerable growth potential of the Irish economy.
Cost competitiveness will be improved through a series of specific measures in the
waste, energy, transport, telecommunications, professional services and public
administration sectors.
Barriers to employment creation will be removed.
o The level of the National Minimum Wage will be reduced by €1 an hour.
o The Minister for Enterprise, Trade and Innovation will complete a review to
eliminate anomalies in the framework REA and ERO agreements within three
months.
Welfare and labour market policies will be overhauled so that work is rewarded and
those seeking work have a pathway to work, education and training.
2.1 Overview – the Strategy for Economic Recovery
Competitiveness is the key to a return to economic growth and a resumption of sustainable
employment creation. We have made progress over the last two years. But more needs to be done.
This means reducing costs and improving productivity in all sectors.
The job of Government is to support the private sector by removing structural impediments to
competitiveness and employment creation and securing the conditions for growth. But the
Government must also pursue appropriate sectoral policies to foster export growth and a recovery of
domestic demand. This Chapter sets out the key reforms in each of these important areas.
For a regional, open economy such as ours, sustained export growth will be a critical step on the path
to economic recovery. Labour market reform and competitiveness measures in this Plan will assist this
process and will help foster employment creation in domestically trading sectors such as retail and
hospitality.
The prospects for a return to enterprise-led growth are improved by the modern nature of Ireland’s
export base as illustrated in Figure 2.1. The high proportion of exports from high-tech sectors5
indicates that the Irish economy has already established a strong base which can act as a platform for
further advancement to a more knowledge intensive period of growth.
5 It should be noted that high-tech sectors may include manufacturing activities with low tech processes. Nonetheless the graph is a useful indicator of the comparative modernity of Ireland’s export base.
29

Figure 2.1 High-tech exports as a proportion of total
0
10
20
30
40
50
60
Pol
and
Bulga
ria
Rom
ania
Latv
ia
Lith
uani
a
Slo
veni
a
Spa
in
Slo
vakia
Gre
ece
Italy
Belgium
Por
tuga
l
Est
onia
Aus
tria
Cze
ch R
epub
lic
Den
mar
k
Swed
en
Ger
man
y
EU27
Fran
ce
Finl
and
Net
herla
nds
Hun
gary
Cyp
rus
UK
Irela
nd
Luxe
mbo
urg
Malta
per c
ent o
f tot
al
Source: Eurostat
Enterprise Policy – Driving the Smart Economy Agenda
Alongside the sector specific policy supports set out in section 2.5, a number of cross-cutting issues
relevant to enterprise policy warrant some discussion.
This Plan builds on, and is consistent with, Building Ireland’s Smart Economy, the framework for
sustainable economic recovery published in December 2008. This framework identified five action
areas as the basis for the Government’s response to the crisis:
securing the enterprise economy and restoring competitiveness;
building the Ideas Economy;
enhancing the environment and securing energy supplies;
investing in critical infrastructure; and
providing efficient and effective public services and smart regulation.
It placed particular emphasis on increasing productivity across all sectors of the economy as the basis
for sustainable improvements in living standards. It also stressed the role of knowledge and
innovation in driving productivity.
The Government has acted in all these areas to tackle short-term difficulties while laying the basis for
future recovery. It has
introduced supports for business, through short term measures such as the Enterprise
Stabilisation Fund and the Employment Subsidy Scheme, while ensuring large gains in
international competitiveness;
begun to re-position Ireland as a Global Innovation Hub based on the work of the Innovation
Taskforce, particularly through the establishment of Innovation Fund Ireland;
sustained high levels of capital investment to support economic activity during the last two
years, completed the inter-urban motorways and delivered new projects at reduced cost; and
provided funding for R&D and commercialisation and for renewable energy including ocean
energy and biomass.
30

The Government recently launched a new strategy – Trading and Investing in a Smart Economy – to
integrate the promotion of overseas trade, tourism and investment. This strategy sets out cross-
sectoral priorities and targets, and a series of recommended actions that will ensure our trade,
tourism and investment sectors are well positioned to respond effectively to emerging opportunities as
the global economy recovers. The strategy focuses on specific sectors and markets and is expected to
deliver 150,000 direct and 150,000 indirect new jobs. We have also set ambitious targets for new FDI
investments, tourist numbers and exports.
The selected sectors include services, tourism, food, education, life sciences, software, Next
Generation Network-enabled sectors, green technology, construction and the built environment,
creativity and design, and technologies for an ageing population (‘silver technologies’).
Britain and the United States will continue to be our key markets. But there is considerable potential
to expand business with our Euro area partners, as well as in new and high potential growth markets
such as Brazil, China, India, Russia, Japan, and the Gulf States.
Positioning Ireland’s brand and reputation in new growth markets and reinforcing positive messages
about our brand and reputation in existing markets will support broadly based export-led economic
recovery.
2.2 Restoring Cost Competitiveness
Data on prices, costs and productivity point to a sustained improvement in competitiveness over 2009
and 2010. The fall in the euro exchange rate against the dollar and sterling in the first half of 2010,
and lower inflation in Ireland has assisted export performance6. But improvements have been slower
to materialise in some areas, principally in the locally trading sector of the economy. Table 2.1 shows
our ranking in a selection of key competitiveness indicators.
Table 2.1 Selected cost competitiveness indicators
Cost category Rank among countries benchmarked
Large energy user prices 6th / 14
Waste disposal costs 9th / 9
Water costs for industrial users 10th / 16
Mobile telephone costs (high usage) 5th / 13
Broadband low speeds (< 2mbps) 6th/24
Broadband medium speeds (2-12mbps) 11th/29
Broadband high speeds (12-32mbps) 10th/29
Prime industrial rental 11th / 13
Prime office space rental 8th / 13
Source: National Competitiveness Council, Eurostat and OECD
6 Central Bank (2010) Quarterly Economic Bulletin. Q4.
31
A number of areas require further action in order to boost competitiveness.
2.2.1 Waste, Energy and Transport
There has been a significant reduction in the cost of electricity for large users. For large energy users
we are sixth cheapest out of 14 countries benchmarked. For SMEs we are now close to the EU
average. A rebate of network charges to large energy users, combined with falling fuel prices and the
development of renewable energy assisted this process. The Energy Regulator has taken steps to
achieve efficiencies in network investment and operations. This has been matched by Government
policy actions including the introduction this year of a carbon windfall levy on generators. The full
opening up to competition of the supply and generation markets can be expected to have a positive
impact on prices. Government will also take further actions.
Action Points
The Commission for Energy Regulation will continue to impose rigorous efficiency
targets on the ESB, Bord Gáis and Eirgrid to drive efficiencies in the energy sector.
Capital investment programmes by the utility companies will be commensurate with
the infrastructure needs and energy demand of the Irish economy avoiding excess
capacity and extra cost.
The National Energy Efficiency Action Plan will be implemented in order to achieve a
national energy saving of 20% by 20207 including measures to assist SMEs to lower
electricity costs.
When it comes to waste management costs and treatment options, Ireland needs to improve its
performance.
Action Points
Major waste infrastructure will continue to be developed primarily by the private
sector while public investment in recycling infrastructure will be maintained - both
elements will expand capacity and assist competitiveness.
Levies will be used to drive waste modernisation in accordance with a sustainable
waste hierarchy, ensure compliance with EU legislation and create a revenue stream
for investment in support of waste policy objectives and enforcement.
Government will ensure greater competition for public transport routes following the
establishment of the National Transport Authority. This will have further positive
effects on competitiveness.
7 The Action Plan sets out a range of measures for achieving this saving including the National Retrofit Programme, supports to business for energy efficient technologies, a targeted energy reduction of 33% in the public service and the development of electric vehicles. 32
2.2.2 Telecommunications
Ireland compares favourably on international telephone costs and high use mobile packages as well as
low speed broadband. Over the past three years internet subscriptions have trebled and broadband
speeds have doubled. However the economic importance of this area demands continued progress
and further improvements in quality and reduction in cost will be needed.
It will be important to ensure a high standard of international connectivity and to enhance the IT
capacity of the network. Overall, the policy framework provides that investment in broadband
infrastructure is primarily a matter for the market. State intervention is aimed at improving our digital
skills, enhancing our international connectivity and addressing market failures where they exist.
Action Points
The regulatory regime will facilitate a collaborative approach to private investment.
The Next Generation Broadband Taskforce will work with industry to enhance the
business case for investment in NGN (Next Generation Network) delivery.
Appropriate State investment will be undertaken in cases of market failure.
The use of state infrastructure for the roll out of NGN networks will be maximised.
2.2.3 Professional Services
In general, the cost of services to businesses has fallen, but this is not uniform across all professions.
Although accounting costs have fallen, the cost of legal services remains high.
Action Points
Competition in the professions will be promoted and overseen by an independent
figure, reporting regularly to Government.
The Government will identify further ways to tackle increases in insurance costs,
building on achievements of the Personal Injuries Assessment Board.
All the restrictions on appropriately trained General Practitioners who wish to hold
GMS contracts will be abolished.
Provide for a more structured approach to mediation in the legal system and promote
further the use of Alternative Dispute Resolution taking into account
recommendations of the Law Reform Commission in its Final Report 2010 on the
subject.
A package of measures to reduce legal costs will be implemented, including
o increased use of tendering by the State;
o prioritising publication and enactment of the Legal Costs Bill; and
o additional proposals for legislation to reduce legal costs, drawing on the
recommendations of the Legal Costs Working Group and the Competition
Authority.
o Provide for increased use of arbitration and mediation.
33
2.2.4 Office Space/Property
The construction cost of prime industrial sites fell by 14% between 2008 and 2009. Notwithstanding
this reduction, costs in Ireland are still among the highest benchmarked by the NCC. The same applies
to industrial rental costs, though office rental costs are now relatively competitive with a reduction of
18% recorded in 2009. There is scope for further improvement in this area.
Action Points
The proposals of the Working Group on Transparency in Commercial Rent Reviews
will be implemented.
The Office of Public Works will lead a coordinated effort to reduce office rents by up
to 15% and review the efficiency of property arrangements across the public sector.
Proposals will be brought to Government for legislation to overhaul and streamline
the property revaluation process. The possibility of secondment of staff from local
authorities is being explored.
2.2.5 Efficiency in Public Administration
The Government charges for delivering services such as local government utilities and business
administration. In addition, companies incur indirect costs in complying with regulations (health and
safety, financial etc). Companies also incur costs in searching for business support services and in
accessing similar services from multiple State providers. The Government will take specific steps to
reduce the cost base for the private sector. This is part of the Public Sector Transformation
programme (including the Croke Park agreement mechanisms) outlined in Chapter 4. The efficiency
recommendations of the Local Government Efficiency Review Group will also play a role in
streamlining administration.
The Government will take the following steps to improve public administration for the benefit of
business customers:
Action points
The 15 day prompt payment rule will be extended beyond Government Departments
to the wider public sector. Over the duration of the plan, increases in government administrative charges8 will
be avoided, and the scope for reductions examined where possible.
The targeted 25% reduction of the regulatory burden on business will be achieved by
end-2011.
Local Authorities will be required to improve their efficiency, including through
implementing relevant recommendations of the Local Government Efficiency Group,
to reduce where possible, the level of rates charged to businesses.
8 This excludes levies payable by entities regulated by economic regulators e.g. ComReg, Commission for Energy Regulation,
Central Bank etc.
34
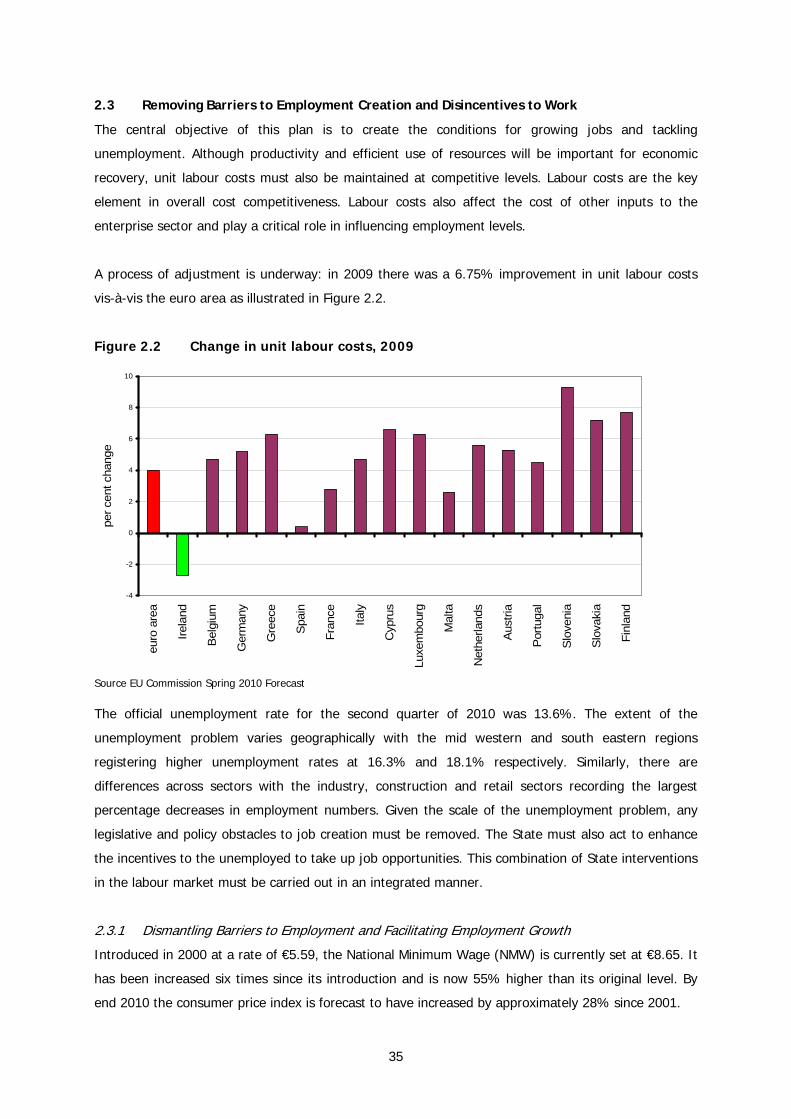
2.3 Removing Barriers to Employment Creation and Disincentives to Work
The central objective of this plan is to create the conditions for growing jobs and tackling
unemployment. Although productivity and efficient use of resources will be important for economic
recovery, unit labour costs must also be maintained at competitive levels. Labour costs are the key
element in overall cost competitiveness. Labour costs also affect the cost of other inputs to the
enterprise sector and play a critical role in influencing employment levels.
A process of adjustment is underway: in 2009 there was a 6.75% improvement in unit labour costs
vis-à-vis the euro area as illustrated in Figure 2.2.
Figure 2.2 Change in unit labour costs, 2009
-4
-2
0
2
4
6
8
10
euro
are
a
Irela
nd
Bel
gium
Ger
man
y
Gre
ece
Spa
in
Fran
ce
Italy
Cyp
rus
Luxe
mbo
urg
Mal
ta
Net
herla
nds
Aus
tria
Por
tuga
l
Slo
veni
a
Slo
vaki
a
Finl
and
per c
ent c
hang
e
Source EU Commission Spring 2010 Forecast The official unemployment rate for the second quarter of 2010 was 13.6%. The extent of the
unemployment problem varies geographically with the mid western and south eastern regions
registering higher unemployment rates at 16.3% and 18.1% respectively. Similarly, there are
differences across sectors with the industry, construction and retail sectors recording the largest
percentage decreases in employment numbers. Given the scale of the unemployment problem, any
legislative and policy obstacles to job creation must be removed. The State must also act to enhance
the incentives to the unemployed to take up job opportunities. This combination of State interventions
in the labour market must be carried out in an integrated manner.
2.3.1 Dismantling Barriers to Employment and Facilitating Employment Growth
Introduced in 2000 at a rate of €5.59, the National Minimum Wage (NMW) is currently set at €8.65. It
has been increased six times since its introduction and is now 55% higher than its original level. By
end 2010 the consumer price index is forecast to have increased by approximately 28% since 2001.
35

Our NMW is the second highest in absolute terms compared to other EU countries and is sixth when
expressed in purchasing power terms. As a percentage of the average gross monthly earnings, Ireland
has the sixth highest NMW.
The majority of minimum wage workers are employed in textiles, retailing, hotels, restaurants and
bars, and personal services. Employment in occupations covered by the NMW is typically dependant
on domestic demand and is likely to be sensitive to changes in the wage rate. Given the desirability of
growing employment in those sectors where significant jobs losses have occurred, and the importance
of encouraging recruitment of young people in particular, the level of the minimum wage has
significance beyond the numbers currently employed at that rate.
Where a NMW is imposed at a level higher than the equilibrium wage rate, unemployment will result.
Some workers will be willing to work for a wage lower than NMW but employers are restricted from
providing these job opportunities. Other negative effects include:
Acting as a barrier for younger9 and less skilled workers to enter the labour force and take up
jobs;
Preventing SME’s from adjusting wage costs downward in order to maintain viability and
improve competitiveness; and
Reducing the capacity of the services sector to generate additional activity and employment
through lower prices for consumers.
The NMW was introduced during a period of sustained economic growth and rapid wage increases.
Our circumstances have changed dramatically in the last three years. Price levels have reduced and
earnings have adjusted downwards to help to preserve jobs. A reduction in the minimum wage level –
as proposed by the OECD10 - can also be expected to remove a barrier to job creation. Therefore the
Government have decided to introduce legislation to reduce the rate of the minimum wage by €1 per
hour, or 12% to €7.6511.
Action point
The minimum wage will be reduced by €1 to €7.65.
The new rate will remain in the top tier of EU minimum wage rates.
Other regulated wage levels exist in certain sectors where employers and workers reach specific
agreements about pay and conditions of employment, either through Registered Employment
Agreements (REA’s) or Employment Regulation Orders (ERO’s), following consideration by Joint
9 According to CSO QNHS Quarter 2 2010, youth unemployment is 25.8% for the age group 20 to 24. 10 OECD (2009) Economic Survey – Ireland. 11 Proportionate reductions of 12% will also take place for minimum wage rates related to employees under 18 years of age and employees aged 18 or over in their first and second years of employment.
36
Labour Committees. The terms in each case are protected by legislation. These agreements apply
mainly to the agricultural, catering, construction and electrical contracting sectors. Pay rates are
typically above the NMW and in some cases incorporate significantly higher wage levels.
Both types of agreements constitute another form of labour market rigidity by preventing wage levels
from adjusting. This in turn affects the sustainability of existing jobs and may also prevent the
creation of new jobs, particularly for younger people disproportionately affected by the employment
crises who form part of the labour force for these sectors.
Consistent with a proposed reduction in the minimum wage, it is important that any barriers to
employment are removed in these regulated sectors given their significance for the traded sector of
the economy. There is also a need to ensure these agreements are fit-for-purpose in the current
economic climate. There is a strong case for removing anomalies and obsolete provisions, so as to
have a more streamlined, transparent and flexible model of wage setting.
Three particular aspects of these arrangements have been identified as potentially problematic from a
competitiveness and job creation perspective. These are:
o Specific cost-increasing conditions such as pay rates for Sunday working;
o Geographical divisions which can sometimes appear arbitrary; and
o Inflexibility in measures for adjusting agreements in line with broader labour market
developments.
These issues must be addressed in order to assist competitiveness and employment growth in these
important sectors.
Action Point
A review of the framework REA and ERO arrangements will be undertaken by the
Minister for Enterprise Trade and Innovation, to be finalised within three months.
2.3.2 Removing Disincentives to Work
Social policy must continue to protect the most vulnerable in society and provide supports to those in
unemployment. At the same time, our social protection system must not contain poverty traps and
must not discourage those who are unemployed from returning to work.
The jobseeker rate of social welfare payment almost doubled between 2001 and 2009 before being
reduced in Budget 2010 to €196 per week. This rate of increase has had implications for replacement
rates12 in the labour market which will also be impacted by the decision to reduce the minimum wage.
12 The replacement rates for given income levels measures the proportion of out of work benefits received when unemployed against take home pay if in work.
37
The persistence of high replacement rates can act as a major disincentive to work. Replacement rates
of the order of 70% can be considered to be a barrier to employment.
Analysis of estimated replacement rates for different earning levels and family types undertaken by
the Department of Finance in late 2009 revealed the following findings:
In general, single people face high replacement rates at the earnings level of the NMW, but
the issue does not arise for higher earning single people;
Couples where both are not working face high replacement rates at income levels up to the
average industrial wage;
Couples with children where both are not working have higher replacement rates again; and
One-parent families have low replacement rates except in cases where out-of-work income is
supplemented by earnings from the community employment scheme.
Rate reductions have been introduced for new jobseeker claimants under age 25 and without child
dependants. The Qualified Adult rates applicable were also reduced. These rate reductions have had a
significant downward impact on replacement rates for such claimants.
In some cases, the effects of the proposed changes to the minimum wage will be to increase
replacement rates. OECD analysis has pointed to a danger that the high rate of unemployment in
Ireland could be sustained owing to weaknesses in activation policy and high replacement rates for
those on below average wage levels13. Therefore, there is a need to strengthen activation measures
and to ensure that replacement rates are not acting as a barrier for any cohorts in unemployment.
Achieving the right balance between the level of the NMW, labour legislation, social welfare rates,
taxation and levels of activation is crucial to avoiding work disincentives.
High replacement rates need not necessarily give rise to high unemployment provided there is an
effective activation strategy in place. Given the current dynamics in the labour market however, high
replacements rates are viewed as a disincentive to work.
Action Points
Reform of the welfare system will reduce unemployment traps by incentivising
employment and discouraging a long term attachment to the social welfare system.
This will assist in removing disincentives to work and will be complemented by
strengthened activation measures.
2.4 Re-orienting Activation Measures
International evidence indicates that appropriate activation measures can increase the incentive to
work, reduce the number of long term unemployed and increase aggregate employment. In particular,
13 OECD (2009) Economic Survey of Ireland. 38

activation measures can help ensure that those at risk of long term unemployment14 are ready to avail
of employment opportunities when economic recovery takes hold. It is critical that the unemployed
are equipped with relevant skills and kept close to the labour market. There is a need for appropriate
upskilling or reskilling so that the labour market can access the skills it requires.
Elements of the Government’s Activation Policy
Increased levels of engagement with the unemployed
The National Employment Action Plan15 has increased substantially the number of
interviews provided for the unemployed.
Group interviews for the unemployed will be held after 3 months.
Training/work experience places
Significant numbers of additional places have been provided for education, training/work
experience for the unemployed since 2008.
The Work Placement Programme allows for up to 2,000 individuals to participate in work
for periods of up to 9 months while in receipt of social welfare payments.
Allocations from the Activation Fund (€20 million) and the European Globalisation Fund
were used in 2010 to provide additional options to help people back to employment.
Increased incentives for employers to create jobs
The Employers’ PRSI scheme to encourage employers to recruit people who are
unemployed was introduced in July 2010.
Increased incentives for the unemployed to progress
The targeted reductions in social welfare rates introduced in recent budgets have
incentivised those under 25 to participate in education, training or work.
Legislation has been put in place so that receipt of benefit payments will be conditional
on participation in the National Employment Action Plan.
The Government is improving the efficiency of activation structures by streamlining the Public
Employment Services. The Community Employment Scheme and the FÁS employment services are
being merged with the Department of Social Protection providing a single employment service for
jobseekers. This will facilitate central monitoring and control of conditionality measures.
14 This includes former employees in declining sectors such as manufacturing and construction. 15 The Irish National Employment Action Plan was adopted by Government in response to the European Employment Guidelines. The Plan includes a commitment to a more systematic engagement of the Employment Services with the unemployed. Implementation of this commitment commenced in September, 1998.
39
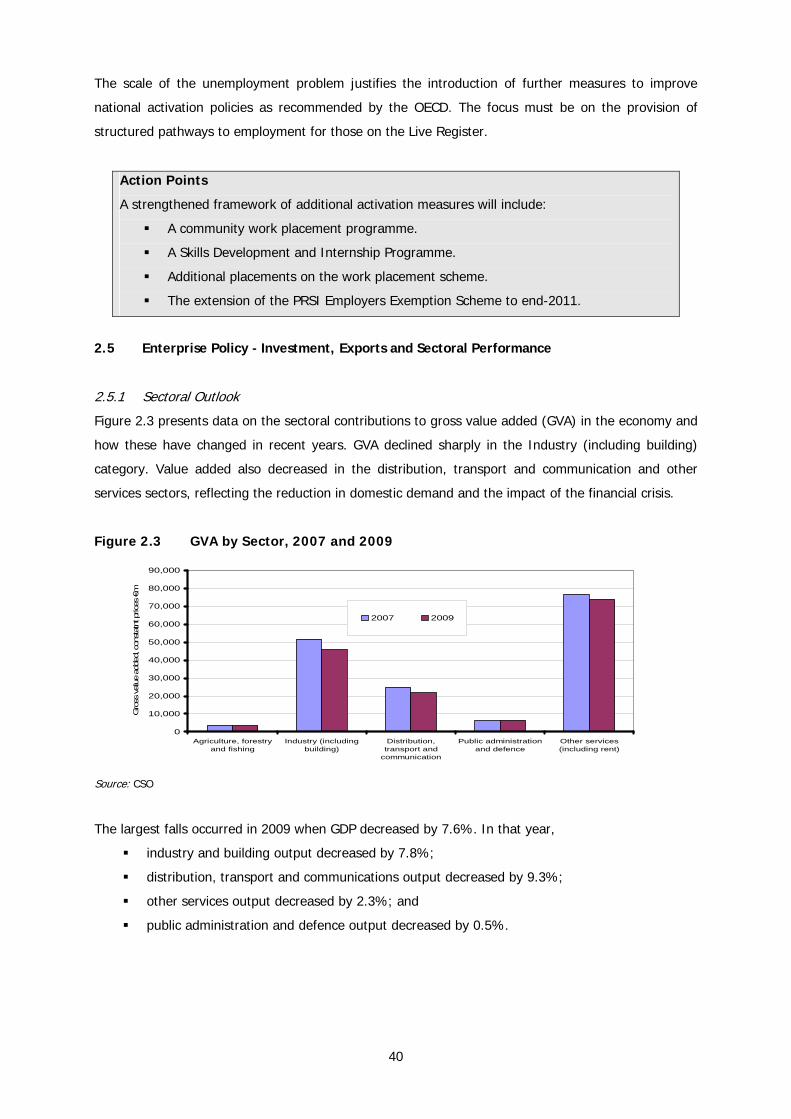
The scale of the unemployment problem justifies the introduction of further measures to improve
national activation policies as recommended by the OECD. The focus must be on the provision of
structured pathways to employment for those on the Live Register.
Action Points
A strengthened framework of additional activation measures will include:
A community work placement programme.
A Skills Development and Internship Programme.
Additional placements on the work placement scheme.
The extension of the PRSI Employers Exemption Scheme to end-2011.
2.5 Enterprise Policy - Investment, Exports and Sectoral Performance
2.5.1 Sectoral Outlook
Figure 2.3 presents data on the sectoral contributions to gross value added (GVA) in the economy and
how these have changed in recent years. GVA declined sharply in the Industry (including building)
category. Value added also decreased in the distribution, transport and communication and other
services sectors, reflecting the reduction in domestic demand and the impact of the financial crisis.
Figure 2.3 GVA by Sector, 2007 and 2009
0
10,000
20,000
30,000
40,000
50,000
60,000
70,000
80,000
90,000
Agriculture, forestryand fishing
Industry (includingbuilding)
Distribution,transport and
communication
Public administrationand defence
Other services(including rent)
Gro
ss value
add
ed, c
onstat
nt p
rices
€m
2007 2009
Source: CSO
The largest falls occurred in 2009 when GDP decreased by 7.6%. In that year,
industry and building output decreased by 7.8%;
distribution, transport and communications output decreased by 9.3%;
other services output decreased by 2.3%; and
public administration and defence output decreased by 0.5%.
40
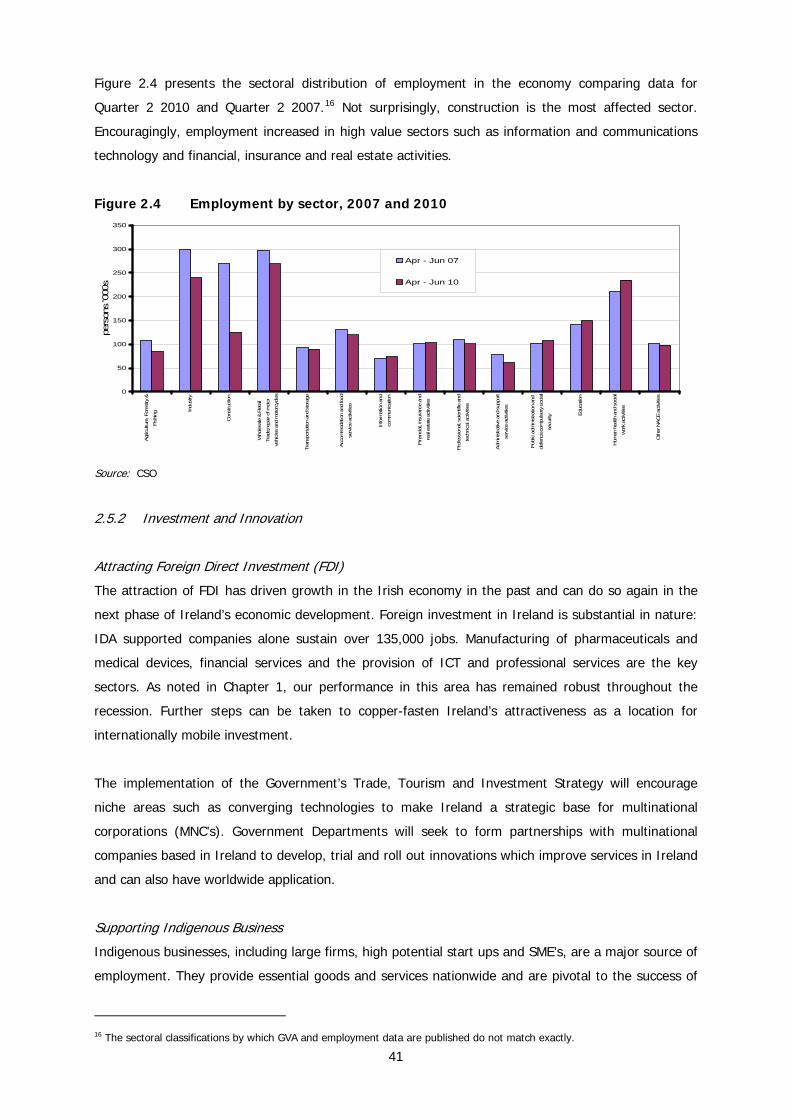
Figure 2.4 presents the sectoral distribution of employment in the economy comparing data for
Quarter 2 2010 and Quarter 2 2007.16 Not surprisingly, construction is the most affected sector.
Encouragingly, employment increased in high value sectors such as information and communications
technology and financial, insurance and real estate activities.
Figure 2.4 Employment by sector, 2007 and 2010
0
50
100
150
200
250
300
350
Agr
icul
ture
, For
estry
&
Fish
ing In
dust
ry
Con
stru
ctio
n
Who
lesa
le &
Ret
ail
Trad
e;re
pair
of m
otor
vehi
cles
and
mot
orcy
cles
Tran
spor
tatio
n an
d st
orag
e
Acco
mm
odat
ion
and
food
serv
ice
activ
ities
Info
rmat
ion
and
com
mun
icat
ion
Fina
ncia
l, insu
ranc
e an
d
real
est
ate
activ
ities
Pro
fess
iona
l, sc
ient
ific
and
tech
nica
l act
ivities
Adm
inistra
tive
and
supp
ort
serv
ice
activ
ities
Public a
dministra
tion
and
defe
nce;
com
pulsor
y so
cial
secu
rity Ed
ucat
ion
Hum
an h
ealth
and
soc
ial
wor
k ac
tivities
Oth
er N
ACE
activ
ities
pers
ons
'000
s
Apr - Jun 07
Apr - Jun 10
Source: CSO
2.5.2 Investment and Innovation
Attracting Foreign Direct Investment (FDI)
The attraction of FDI has driven growth in the Irish economy in the past and can do so again in the
next phase of Ireland’s economic development. Foreign investment in Ireland is substantial in nature:
IDA supported companies alone sustain over 135,000 jobs. Manufacturing of pharmaceuticals and
medical devices, financial services and the provision of ICT and professional services are the key
sectors. As noted in Chapter 1, our performance in this area has remained robust throughout the
recession. Further steps can be taken to copper-fasten Ireland’s attractiveness as a location for
internationally mobile investment.
The implementation of the Government’s Trade, Tourism and Investment Strategy will encourage
niche areas such as converging technologies to make Ireland a strategic base for multinational
corporations (MNC’s). Government Departments will seek to form partnerships with multinational
companies based in Ireland to develop, trial and roll out innovations which improve services in Ireland
and can also have worldwide application.
Supporting Indigenous Business
Indigenous businesses, including large firms, high potential start ups and SME’s, are a major source of
employment. They provide essential goods and services nationwide and are pivotal to the success of
16 The sectoral classifications by which GVA and employment data are published do not match exactly.
41
larger enterprises. They are also successful exporters in their own right. The range of competitiveness
measures and labour market reforms outlined earlier will assist these firms through these difficult
times and lead ultimately to growth. A number of further steps will be taken to encourage small
business development.
Action Points
The Business Expansion Scheme will be overhauled and improved. Full details are
contained in Chapter 6.
Enterprise agencies will work with SMEs to improve performance, productivity and
competitiveness, assist them in developing exports in new and existing markets,
help them to access public procurement opportunities and help firms develop a
greater online presence.
Core R&D supports and the innovation voucher system will continue to help small
firms acquire cost-effective R&D and to move up the value-chain.
The Government will investigate the potential for providing access to vacant or
under-utilised public property for entrepreneurs or business start-ups to use as
incubation centres.
The Government is undertaking an overhaul of bankruptcy legislation.
The 15 day prompt payment rule will be extended beyond Government Departments
to the wider public sector.
Making Ireland a Global Innovation Hub
The Innovation Taskforce reported in March 2010 with recommendations to make Ireland a Global
Innovation Hub. The aim is to make Ireland:
The best place in Europe to turn research and knowledge into products and services;
The best place in Europe to start and grow an innovative company;
The best place to relocate or expand and scale an SME; and
The best place in Europe for research-intensive multinationals to collaborate with each other
and with clusters of small companies.
In support of these goals, a number of important recommendations made by the innovation taskforce
will be delivered.
Action Points
Innovation Fund Ireland will attract international venture capital fund managers to
Ireland, making their expertise, experience and network available to our
enterprises.
IDA will introduce the European Accelerator Programme to attract fast growing
firms to locate their European HQ in Ireland.
42
Enterprise Ireland (EI) will introduce a new approach to providing seed capital and
other supports to innovative start-ups.
EI will assist Irish firms to maximise export potential through programmes for
CEOs, mentoring and trade missions and will launch a campaign to attract overseas
entrepreneurs to locate in Ireland.
The ‘Silvertech’ initiative will be introduced and the HSE will work closely with
multinational companies in Ireland on the introduction of new technology for
healthcare.
Embedding Science, Technology and Innovation
Ireland has built a strong science base, and has joined Finland, Germany and the US in the world’s top
twenty countries for scientific output. Two thirds of Ireland’s R&D is in the private sector, creating
new product and service innovations that will drive exports, growth, and jobs. In 2009, nearly half of
IDA investments were in research, development and innovation - activities that are central to
productivity and new business development in Ireland’s multinational sector. Indigenous enterprises
continue to embrace R&D. Even during the downturn, these enterprises have proven they can grow
exports and create employment. Productive, high calibre research, undertaken by highly skilled
research teams working closely with industry partners will continue to be a core investment priority for
Government. This new competitive advantage will be one of the key drivers of Ireland’s economic
recovery. But there must be a greater focus on the commercialisation of research outputs. Only world-
class research projects should be supported and researchers need not necessarily be engaged across
all disciplines. In sectors where we cannot be world leaders, the focus should move to technology
transfer and utilisation of research elsewhere.
Action Points
Research investments will be concentrated in areas where Ireland will secure the
greatest economic and social returns.
The number of industry led research competence centres will be doubled to ensure
that industry drives the research agendas.
IDA and EI will foster research, development and innovation in companies to boost
productivity, exports, growth and jobs.
Ireland has built a reputation as a country where enterprise can partner effectively
with third level institutions. This will be developed at all levels ranging from SFI
funded fundamental research centres (CSET’s and SRCs) to EI Innovation
Partnerships and Innovation Voucher programmes.
Fostering the Green Economy
The fast-growing Green Economy is an area where Ireland has huge potential for growth. The High
Level Report on the Green Economy highlighted the growth and jobs potential in the following areas:
Energy export potential
43
Green IFSC
Water management
Ireland as a test-bed location and research hub
Potential for convergence of ICT and energy management systems
The National Retrofit Programme has also provided work for the construction sector. There is scope to
exploit the potential of over 250 companies (including high potential start ups) in the CleanTech
sector. The Finance Act 2010 also contained measures to support the development of the Green
Economy. Further steps in this regard include:
Investing €4.5 billion in our transmission distribution and international interconnection grids to
develop our renewable resources.
Developing Ireland as a centre of new Smart Grid technology using our advantage in a flexible
grid infrastructure and as a location for energy ICT companies.
Identification of skills needs to capitalise on the green economy and design of appropriate
courses and training to deliver these skills.
The publication by Government of the Green Public Procurement Plan.
Exploiting the potential of green financial services.
2.5.3 Strategy for Manufacturing and Agri-food Export Growth
Manufacturing growth was a key driver of Ireland’s economic expansion in the 1990s and into the last
decade. Although changes in the cost environment have posed challenges for manufacturing
industries, the constituent sectors can re-position themselves by moving up the value chain, exploiting
new market opportunities, including those in the BRIC countries, diversifying into market niches, and
consolidating activities to achieve efficiencies.
In 2009, manufacturing exports amounted to some €84 billion17 and represented 56% of all exports
by value. Recent data show an increase of 12.8% in merchandise exports (broadly equivalent to
manufacturing) in Quarter 3 2010 compared to the same period in 2009. This can be attributed to
growth in Ireland’s main trading partners and improvements in our competitiveness. The agri-food
sector performed particularly well.
The broad ‘Life Sciences’ sector encompasses chemicals, pharmaceutical and medical devices
companies and is a key exporting sector. Total exports for the sector account for 57% of the value of
all Irish goods exports18. Eight out of the world’s top ten pharmaceutical companies have
manufacturing operations in Ireland. Growth in this sector has driven Ireland’s positive export
performance during the recession. Ireland has a strong reputation in this area underpinned by core
engineering skills and expertise in designing and constructing state-of-the-art manufacturing facilities.
The industry has responded to the challenges of international competition and downward cost
17 CSO (2010) External Trade July and August 2010 18 CSO External Trade Data, Forfas calculations
44
pressures by enhancing productivity and seeking to cut costs. Broad conditions remain positive for this
sector in terms of the available workforce supports from the enterprise agencies and the solid
international reputation in terms of regulatory compliance. The measures relating to cost
competitiveness set out in previous sections, particularly the reductions in energy costs, will assist this
sector in over-coming medium-term challenges.
The ICT manufacturing sector in Ireland accounts for approximately 7% of manufacturing exports.
The sector has experienced a decline in output over the last two years and some multinationals have
moved their manufacturing activities to lower cost locations. At the same time, a number of these
companies have increased their services operations here. The concentration of leading ICT companies
remains high for a country of Ireland’s size and there are good prospects for recovery. The success of
the IDA in attracting R&D projects to existing manufacturing sites will help anchor manufacturers and
shift activities in Ireland further up the value chain. The tax environment remains favourable for
inward investment and an improvement in cost competitiveness will also support medium term
growth.
Action Points
Government will
Provide significant funding through IDA Ireland, EI and Science Foundation Ireland,
along with other R&D supports relevant to the sector.
Deliver the Health Information Bill which will speed up ethical review of health
research trials and investigations.
Invest in R&D industry/third level sector collaboration.
2.5.4 Strategy for Services Export Growth
The services sector has been one of the success stories of the Irish economy over the past decade. In
2000, this sector accounted for just 21% of total exports. By 2009, services exports were valued at
€66.6 billion and represented 44% of total exports by value19. The ESRI forecasts that services will
make up 70% of total exports by 202520. Although exports of indigenous services are growing, there
is scope to accelerate growth.
Along with the sectors discussed below, opportunities for the internationalisation of traditional services
areas will be exploited. For instance the Government will implement the International Education
Strategy and Action Plan to improve Ireland’s competitive position as a centre for international
education.
This financial services sector covers international banking, funds management, shared services,
investment management and insurance. Financial services exports accounted for 20% of total services
19 CSO (2010) Services exports and imports 2008 and 2009 20 As cited in National Competitiveness Council (2009) Driving Export Growth – Statement on Sectoral Competitiveness. 45

exports in 200921 with the IFSC playing an important role. Many leading international financial
services firms have operations here. Although financial services exports decreased by 7.2% in value in
200822, employment figures have remained steady in the sector with a small decline in the numbers
employed in international banking offset by growth in the international insurance industry. Recent
data show a strong export performance by the financial services sector. The Government has taken a
number of steps to support the sector in recent years including measures in the Finance Act 2010 to
improve the competitiveness of the international funds industry and to encourage Islamic finance
products. Future options for the sector will be identified through a Strategy Review by the IFSC
Clearing House Group, to be published early in 2011.
The digital economy is a key part of the Smart Economy. It involves the rollout of an extensive Next
Generation Network and also the fostering of cloud computing services and its attendant new
applications.
Ireland is host to many of the world leaders in software such as Yahoo, Microsoft and Oracle, some of
whom have located R&D centres here. Although such multinational companies account for the
majority of software exports from Ireland, indigenous companies have grown in significance. Irish
companies now account for €1 billion of total software exports of approximately €23 billion23. These
firms have developed strengths in the e-learning, financial services and telecommunications
applications.
The sector is an important source of high value jobs in the economy and while it is undergoing a
period of consolidation (as companies seek to aggregate their activities in regional headquarters and
to minimise their cost base) exports of Irish-based grew strongly in Quarter 3 of 2010.
Opportunities exist for indigenous software companies in traditional sectors (e-learning, financial
services), tailored software solutions and hosted/managed services. The games software sector is also
an emerging area of opportunity and there is scope to build on Ireland’s growing reputation as a
prime location for the industry, potentially through the introduction of specific supports. The
underlying conditions for multinational companies remain positive with continual improvement in the
R&D infrastructure.
Government has invested in an Exemplar Network that will act as a test bed for indigenous and
international R&D into the next generation of data management.
The Government is determined to maintain Ireland as a manufacturing as well as a services economy,
and our improving cost competitiveness, particularly in energy cost, will assist this.
21 CSO Service imports and exports bulletin. Forfas Calculations, CAGR between 2000 -2009 22 NCC (2009) Getting Fit Again 23 Department of Enterprise, Trade and Innovation (2010) Trading and Investing in a Smart Economy.
46
Action Points
Government will:
Provide direct supports for R&D and other business activities through the enterprise
development agencies.
Roll out 100 megabit connectivity to second level schools.
Continue the roll-out of the National Broadband Scheme.
Develop the use of ICT as an enabler of energy efficiency, which is a key area of
growth.
Working with relevant industry partners will help SME’s to better exploit the
opportunities of global online markets by helping them create their first website and
upskilling their capacity in online sales.
Continue the modernisation of financial regulation according to best international
practice.
Develop Ireland as a centre for Green Data Centres and establish an International
Content Services Centre.
Explore the potential of green financial services.
Complete a strategy review by the IFSC Clearing House Group 2011.
2.5.5 Key Sectors for Growth
This section deals with key labour-intensive sectors that will provide increased job opportunities as the
economy recovers. These sectors will particularly benefit from the combined impact of the reduction in
the NMW, the review of REA’s and ERO’s and increased cost competitiveness.
Agri-Food Industry
Exports by this sector amounted to approximately €7 billion in 2009, representing half of all exports by
indigenously-owned firms. Sub components of the sector include meats, dairy products, prepared
foods and drinks. The sector is highly labour intensive and is a vital part of the rural economy. 2009
was a disappointing year for agriculture with a decline in outputs and income but the sector’s
performance has improved in 2010. During the first five months, the value of exports was more than
8% higher than a year earlier, at almost €3 billion. The rate of recovery has accelerated as the year
has progressed. Exports grew by 14% in the third quarter. Export prospects for the major agri-food
product categories for 2010 are generally positive, as better market prices and a more stable
economic picture across Ireland’s key markets underpin trade.
Food Harvest 2020 and Bord Bia’s Pathways to Growth strategy set out a roadmap for the sector and
provide the framework for boosting competitiveness and increasing employment. The Food Harvest
committee concluded we can grow our primary output by one-third, and our value added and exports
by around 40%. This ambition is partly driven by the expected growth in global food markets and
partly by our own strategic advantages as a food and drinks producer.
47
Future policy must be focussed on areas where competitive advantage can be achieved. The sector
must become more innovative by investing in research, providing what the consumer wants, applying
lean manufacturing techniques and ensuring we have the scale at every level to maximise our cost
competitiveness. There must also be a focus on environmental sustainability, while continuing to
support and develop primary production. We must build on our green image and market the
environmental sustainability of our food production systems.
The ending of milk quotas in 2015 provides a unique opportunity for a step change in the scale of our
dairy sector, with a 50% increase in milk output envisaged by 2020. Growing demand for seafood
(including aquaculture) can be leveraged by developing non traditional species, improving quality and
developing value added products from foreign landings for high value EU and niche markets.
Consumer preferences for environmental sustainability and high quality can be exploited to increase
prepared food and drink exports. Increased product differentiation and the use of genetic advances to
boost productivity can contribute to growth in the beef and other meats sectors.
Along with measures to grow specific sub sectors, the energy cost competitiveness measures and the
actions to improve wage flexibility outlined earlier in this chapter will increase profitability and
employment in this sector which is particularly exposed to adverse exchange rate movements. Capital
investment programmes will, where permissible, be targeted at producers with the best potential to
achieve growth and competitiveness and at young farmers with relevant qualifications and robust
business plans. Further consolidation and rationalisation is needed to generate the economies of scale
and efficiencies necessary to increase commercial strength relative to other international competitors.
An Agri Research Advisory Group will be established to bring a greater industry focus to the design of
research programmes which will reflect priority areas identified in Harvest 2020.The agriculture and
forestry sector can also play a significant role in the development of renewable energy, for example,
biomass. The potential of other technologies such as anaerobic digestion is also being appraised.
Action Points
Government will:
Implement the key recommendations of Food Harvest 2020.
Reconfigure the milk quota scheme.
Promote lean manufacturing in the agri-food sector.
Provide direct capital supports for marketing and processing.
Support the consolidation and restructuring needed to enhance competition in the sector.
Tourism and Travel
Tourism has been a key sector for the Irish economy attracting foreign revenue and acting as an
important driver of regional development. It contributes approximately 6% of all services exports and
48

is relatively labour intensive, providing opportunities across a range of skills levels. Tourism generates
direct income in sub-sectors such as accommodation and catering. It also has a positive impact on
other sectors such as transport and retail. In recent years, visitor numbers have declined from 7.8
million in 2008 to 6.9 million in 2009, a fall of almost 12%.
But conditions in the industry are favourable: recent World Economic Forum benchmarking ranked
Ireland among the best performing countries for hotel rooms per capita, attitudes toward tourists and
sports stadium capacity. Convention Centre Dublin is a pivotal attraction for business tourism – a
growing market segment which can yield a high economic return.
The tourism marketing budget of €44 million for 2010 will maintain Ireland’s visibility in overseas
markets and keeps the level and value of marketing investment constant in real terms. Additional
measures to boost performance in this sector include the expansion of practical business supports for
tourism enterprises, the extension of the employment subsidy scheme to hotels and the launch of a
€4 million domestic tourism marketing scheme.
A return to growth in tourism numbers is dependent on a recovery in external markets. But measures
to improve the quality and diversity of the tourism product and our competitiveness will position the
sector to take advantage of that recovery. Capital funding for the tourism sector will be focussed on
completing the upgrade of major tourist attractions, developing a small number of key iconic
attractions, improving infrastructure for recreational cycling, walking and water based activities and
heritage attractions. Investment will also be made in cultural projects, historic properties and national
monuments. Competitiveness measures such as reducing the minimum wage, increasing wage
flexibility (through a review of ERO’s) and more competition in locally traded services will improve the
cost base and viability.
Future opportunities include the development of cultural tourism, ecotourism, outdoor activities and
business/conference tourism. There are also opportunities for growth in new markets such as the Asia
Pacific countries, South Africa and the Gulf states. It is planned to increase visitor numbers to 8 million
by 201524. Achieving this target will expand employment in the tourism sector.
Action Points
Government will:
Liberalise visa restrictions for visitors from long haul source markets.
Invest in enhancing the visitor experience through quality tourism product (including
attractions and infrastructure).
Leverage existing cultural resources (the online Census and genealogical records,
Aviva Stadium, Convention Centre Dublin etc) to raise Ireland's profile while
24 Department of Enterprise, Trade and Investment (2010) Trading and Investing in a Smart Economy
49

maintaining investment in overseas marketing.
Improve and facilitate tourism travel around Ireland.
Work with stakeholders to augment access routes.
Retail and Wholesale
The retail sector is a major source of employment. Job losses, income reductions and higher
precautionary savings have led to a substantial decline in personal consumption over the last two
years. The paying down of household debt, uncertainty regarding job stability and the prospect of
potential reductions in incomes due to tax increases continues to dampen retail demand. But recent
CSO figures indicate that retail sales are stabilising and competitiveness has improved in the sector
over the last two years.
As competitiveness increases and exports grow, employment will stabilise and begin to recover. This,
together with the stabilisation of the public finances, will lead to greater certainty about future
economic prospects and will in turn boost consumer confidence and lower the savings ratio from its
currently elevated level. Higher consumption will increase employment in the retail sector.
Action Points
To support the retail sector, the Government will:
Remove barriers to recruitment through the reduction in the minimum wage.
Further improve the cost base through the measures to reduce input costs such as
energy and property as outlined earlier in this chapter.
Support an increase in consumption levels through measures to support the tourism
sector.
Enhance the efficiency of the sector through a reduction in transport times for
delivery of goods as a result of investment in a number of key strategic road projects
and road maintenance.
Construction
There has been a significant decline in employment in the construction sector caused by the severe
contraction in new home building.
Demand for office and commercial accommodation can be expected to remain subdued. Recent
analysis by the Department of Environment, Heritage and Local Government suggests that the
oversupply in the housing market may be more pronounced in rural areas and that the overhang may
be less significant in our cities. Pending the resolution of the housing adjustment, there may be a
greater prospect for housing demand in our major cities. Government will take measures to help
ensure the effective management and resolution of unfinished housing developments.
50
It is neither likely nor desirable that employment levels in the construction sector return to pre crisis
levels. Nevertheless, a certain level of capacity must be retained to ensure skills and expertise built
up in recent years are not lost for future activity. Incomes and employment growth in general will
facilitate a return to a more stable long term equilibrium level of construction activity above the
current level.
Action Points
Government will:
Protect employment in the sector through a review of REA’s.
Support job retention through energy efficiency activities e.g. the National Retrofit
Programme.
Consider providing commercial opportunities for utility companies through the
introduction of water metering.
Develop Ireland as an international construction services centre, from which
companies can compete for major construction contracts overseas.
2.5.6 Summary of Sectoral Considerations
Overall, Ireland must build on its strengths in ICT, health/life sciences, international financial services,
agri-food and other internationally traded services. We will position ourselves to take advantage of
emerging opportunities in green and cleantech technologies, marine and maritime industries, creative
industries and other services. Combined with competitiveness reforms, the growth in exports in the
manufacturing and services sectors previously discussed will boost domestic demand by creating
employment and higher incomes.
2.6 Conclusion: Anticipated Medium-term Outcomes
The Government’s strategy for an enterprise-led return to economic growth seeks to bolster the
private sector to promote all areas of economic activity.
Some of the measures detailed above will impact on living standards of individuals and their families
in the short-term. But these measures are essential if we are to bring the cost structure of the
economy to a sustainable level and ensure that we respond flexibly to improved trading conditions as
the recovery gains pace. In this way, existing jobs will be protected and new employment
opportunities created. Realising these objectives will generate wider benefits. The labour market
reforms contained in this chapter will have the effect of reducing unemployment and benefitting those
most severely affected by the downturn, thereby fulfilling our national and EU commitments to
combat social exclusion.
The measures detailed in this chapter will:
enhance competitiveness through lower costs, productivity growth and innovation;
support the growth of a successful, sustainable enterprise base;
51

spur faster output growth;
help to ensure that growth translates into gains in employment;
help to bring down unemployment; and
match those seeking work with suitable job opportunities more speedily so that spells of
unemployment are on average shorter.
The macroeconomic forecasts which underpin the plan envisage GDP growth averaging 2.7% between
2011 and 2014. This pace of growth is expected to lower unemployment from its current rate of
13.5% to about 9.8%. These forecasts are based on the assumption that all the measures set out
above are implemented and make some prudent allowance for the positive effects expected to flow
from them. It is possible that the effects of the measures will be greater than has been incorporated
in the forecasts.
52
Chapter 3 General Expenditure Context
Key Messages
Two thirds of the budgetary adjustment will fall on the expenditure side – €10 billion.
Reductions in current spending will amount to €2.1 billion in 2011.
Capital spending will be €1.8 billion lower.
Reductions are required in each of the three major areas of voted expenditure – the
public service pay and pensions bill, social welfare and programme expenditure over
the Plan period.
The adjustment must be viewed in the context of significant expenditure allocations
over the period 2000 to 2008.
The adjustments in 2011 and later years will be determined on the basis of a
coherent set of guiding principles for expenditure consolidation.
The Government will reform the existing budget process.
3.1 Introduction
Restoring stability to the public finances is the centrepiece of this Plan. The day-to-day costs of
running the State cannot be financed through borrowing on an indefinite basis. Reaching the
challenging target of reducing the deficit to below 3% of GDP by 2014 requires structural reform of
public spending and taxation. This Chapter provides an overview of the overall adjustment on the
spending side.
Given the fall in GNP and the impact on Government revenues, the State is no longer in a position to
afford the level of public services and social welfare rates of recent years. Because social welfare, pay
and programme spending each account for around one third of total expenditure, reductions in each
of these areas are unavoidable. These reductions will bring expenditure back to its 2007 level.
The planned expenditure element of the total budgetary adjustment is set out in Table 3.1 below.
Current expenditure will be approximately €7 billion lower by 2014 compared to the projections based
on existing policies, and capital expenditure €3 billion lower.
53
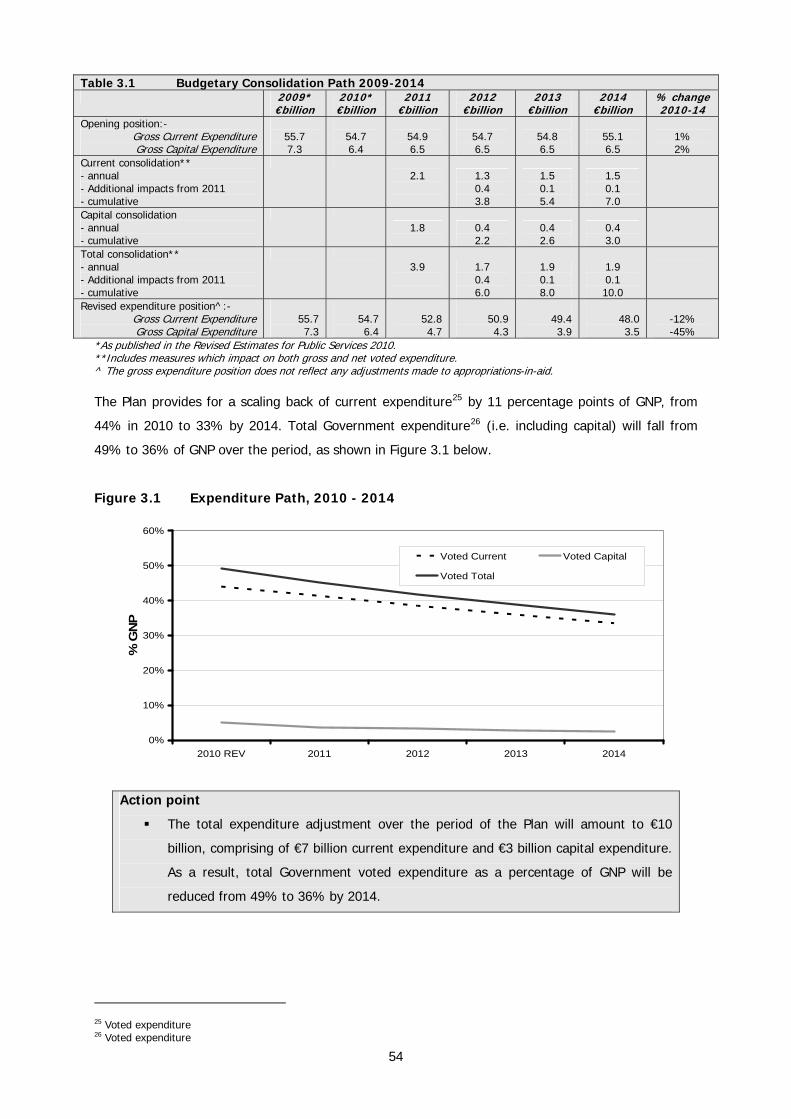
Table 3.1 Budgetary Consolidation Path 2009-2014 2009*
€billion 2010* €billion
2011 €billion
2012 €billion
2013 €billion
2014 €billion
% change 2010-14
Opening position:- Gross Current Expenditure Gross Capital Expenditure
55.7 7.3
54.7 6.4
54.9 6.5
54.7 6.5
54.8 6.5
55.1 6.5
1% 2%
Current consolidation** - annual - Additional impacts from 2011 - cumulative
2.1
1.3 0.4 3.8
1.5 0.1 5.4
1.5 0.1 7.0
Capital consolidation - annual - cumulative
1.8
0.4 2.2
0.4 2.6
0.4 3.0
Total consolidation** - annual - Additional impacts from 2011 - cumulative
3.9
1.7 0.4 6.0
1.9 0.1 8.0
1.9 0.1 10.0
Revised expenditure position^:- Gross Current Expenditure Gross Capital Expenditure
55.7 7.3
54.7 6.4
52.8 4.7
50.9 4.3
49.4 3.9
48.0 3.5
-12% -45%
*As published in the Revised Estimates for Public Services 2010. **Includes measures which impact on both gross and net voted expenditure. ^ The gross expenditure position does not reflect any adjustments made to appropriations-in-aid. The Plan provides for a scaling back of current expenditure25 by 11 percentage points of GNP, from
44% in 2010 to 33% by 2014. Total Government expenditure26 (i.e. including capital) will fall from
49% to 36% of GNP over the period, as shown in Figure 3.1 below.
Figure 3.1 Expenditure Path, 2010 - 2014
0%
10%
20%
30%
40%
50%
60%
2010 REV 2011 2012 2013 2014
% G
NP
Voted Current Voted Capital
Voted Total
Action point
The total expenditure adjustment over the period of the Plan will amount to €10
billion, comprising of €7 billion current expenditure and €3 billion capital expenditure.
As a result, total Government voted expenditure as a percentage of GNP will be
reduced from 49% to 36% by 2014.
25 Voted expenditure 26 Voted expenditure 54
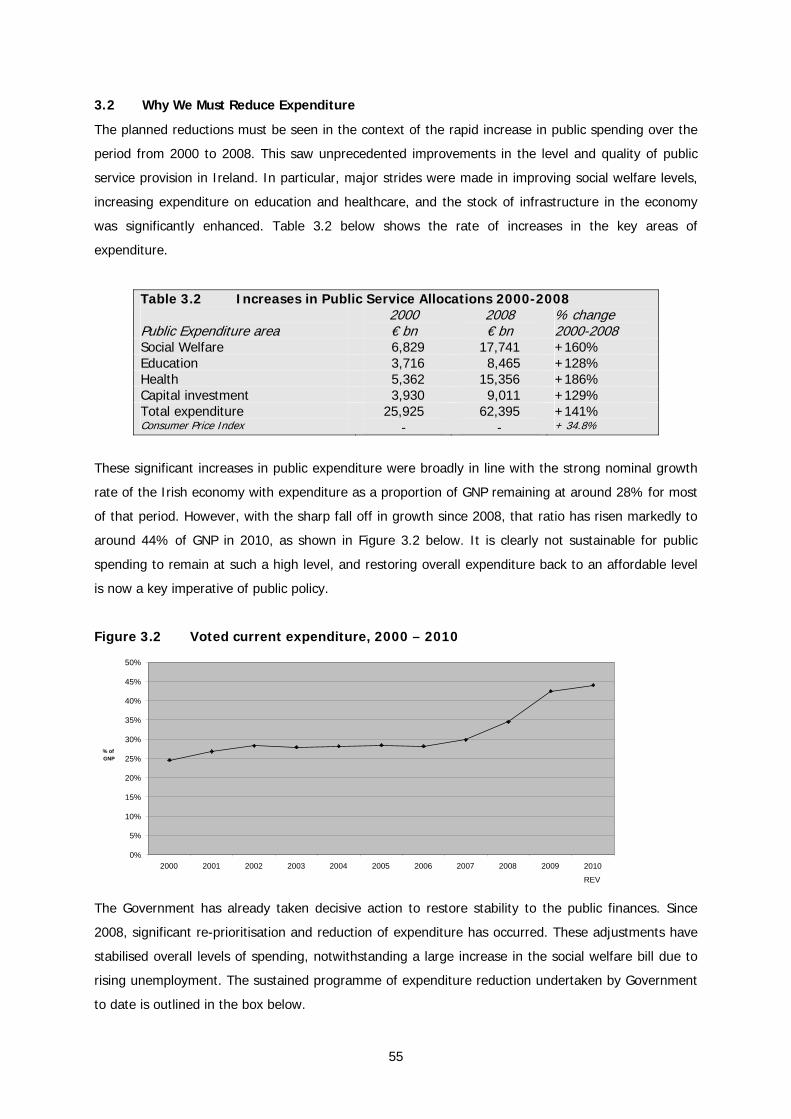
3.2 Why We Must Reduce Expenditure
The planned reductions must be seen in the context of the rapid increase in public spending over the
period from 2000 to 2008. This saw unprecedented improvements in the level and quality of public
service provision in Ireland. In particular, major strides were made in improving social welfare levels,
increasing expenditure on education and healthcare, and the stock of infrastructure in the economy
was significantly enhanced. Table 3.2 below shows the rate of increases in the key areas of
expenditure.
Table 3.2 Increases in Public Service Allocations 2000-2008 Public Expenditure area
2000 € bn
2008 € bn
% change 2000-2008
Social Welfare 6,829 17,741 +160% Education 3,716 8,465 +128% Health 5,362 15,356 +186% Capital investment 3,930 9,011 +129% Total expenditure Consumer Price Index
25,925 -
62,395 -
+141% + 34.8%
These significant increases in public expenditure were broadly in line with the strong nominal growth
rate of the Irish economy with expenditure as a proportion of GNP remaining at around 28% for most
of that period. However, with the sharp fall off in growth since 2008, that ratio has risen markedly to
around 44% of GNP in 2010, as shown in Figure 3.2 below. It is clearly not sustainable for public
spending to remain at such a high level, and restoring overall expenditure back to an affordable level
is now a key imperative of public policy.
Figure 3.2 Voted current expenditure, 2000 – 2010
50%
45%
40%
20%
25%
30%
35%
% of GNP
0%
5%
10%
15%
2000 2001 2002 2003 2004 2005 2006 2007 2008 2009 2010
REV
The Government has already taken decisive action to restore stability to the public finances. Since
2008, significant re-prioritisation and reduction of expenditure has occurred. These adjustments have
stabilised overall levels of spending, notwithstanding a large increase in the social welfare bill due to
rising unemployment. The sustained programme of expenditure reduction undertaken by Government
to date is outlined in the box below.
55
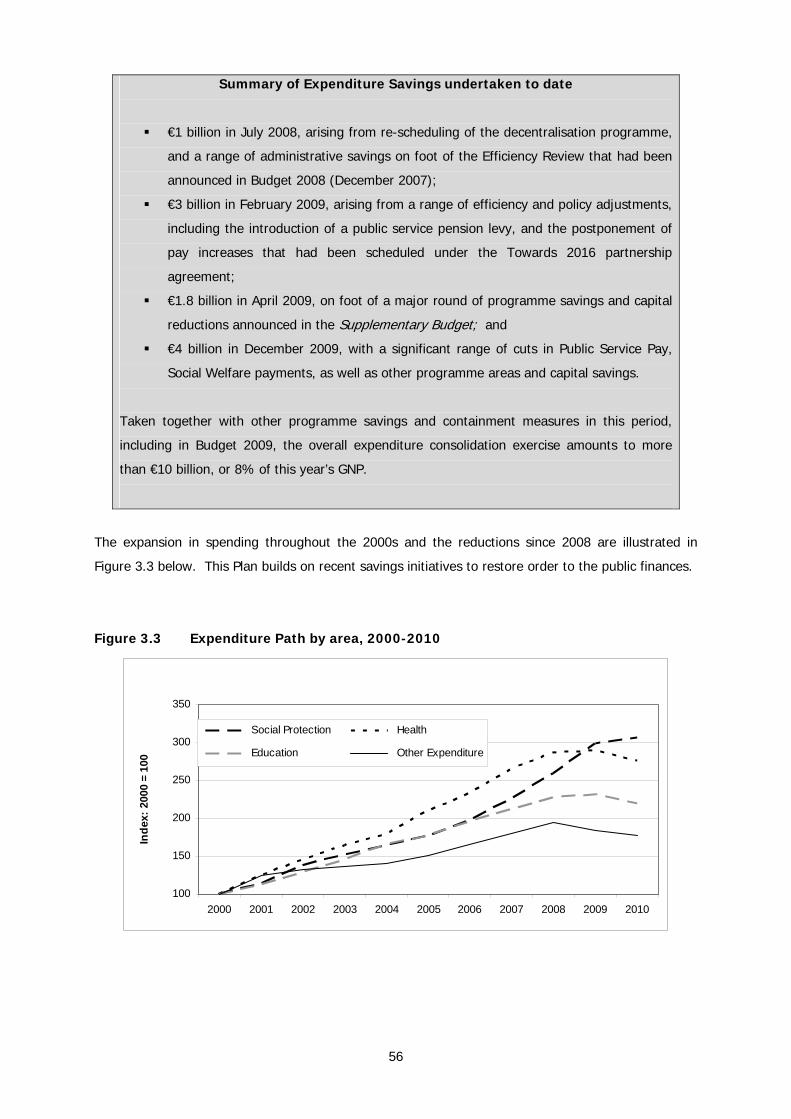
Summary of Expenditure Savings undertaken to date
€1 billion in July 2008, arising from re-scheduling of the decentralisation programme,
and a range of administrative savings on foot of the Efficiency Review that had been
announced in Budget 2008 (December 2007);
€3 billion in February 2009, arising from a range of efficiency and policy adjustments,
including the introduction of a public service pension levy, and the postponement of
pay increases that had been scheduled under the Towards 2016 partnership
agreement;
€1.8 billion in April 2009, on foot of a major round of programme savings and capital
reductions announced in the Supplementary Budget; and
€4 billion in December 2009, with a significant range of cuts in Public Service Pay,
Social Welfare payments, as well as other programme areas and capital savings.
Taken together with other programme savings and containment measures in this period,
including in Budget 2009, the overall expenditure consolidation exercise amounts to more
than €10 billion, or 8% of this year’s GNP.
The expansion in spending throughout the 2000s and the reductions since 2008 are illustrated in
Figure 3.3 below. This Plan builds on recent savings initiatives to restore order to the public finances.
Figure 3.3 Expenditure Path by area, 2000-2010
100
150
200
250
300
350
2000 2001 2002 2003 2004 2005 2006 2007 2008 2009 2010
Inde
x: 2
000
= 10
0
Social Protection Health
Education Other Expenditure
56
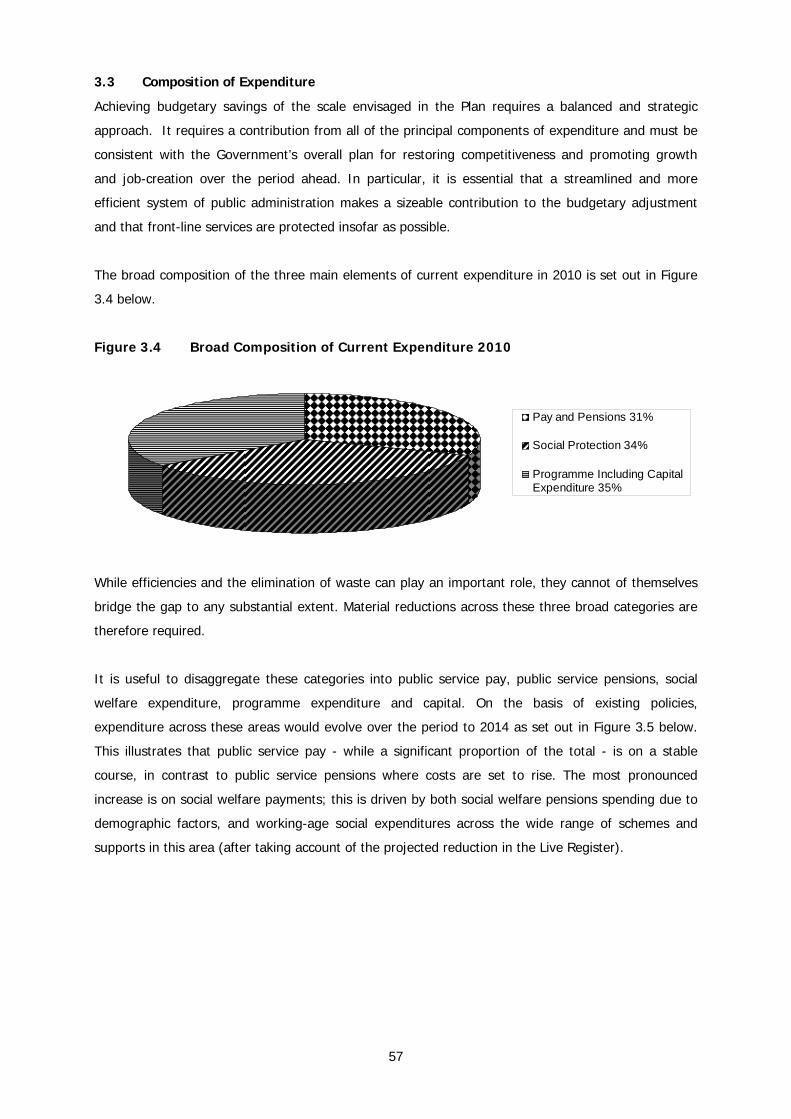
3.3 Composition of Expenditure
Achieving budgetary savings of the scale envisaged in the Plan requires a balanced and strategic
approach. It requires a contribution from all of the principal components of expenditure and must be
consistent with the Government’s overall plan for restoring competitiveness and promoting growth
and job-creation over the period ahead. In particular, it is essential that a streamlined and more
efficient system of public administration makes a sizeable contribution to the budgetary adjustment
and that front-line services are protected insofar as possible.
The broad composition of the three main elements of current expenditure in 2010 is set out in Figure
3.4 below.
Figure 3.4 Broad Composition of Current Expenditure 2010
Pay and Pensions 31%
Social Protection 34%
Programme Including CapitalExpenditure 35%
While efficiencies and the elimination of waste can play an important role, they cannot of themselves
bridge the gap to any substantial extent. Material reductions across these three broad categories are
therefore required.
It is useful to disaggregate these categories into public service pay, public service pensions, social
welfare expenditure, programme expenditure and capital. On the basis of existing policies,
expenditure across these areas would evolve over the period to 2014 as set out in Figure 3.5 below.
This illustrates that public service pay - while a significant proportion of the total - is on a stable
course, in contrast to public service pensions where costs are set to rise. The most pronounced
increase is on social welfare payments; this is driven by both social welfare pensions spending due to
demographic factors, and working-age social expenditures across the wide range of schemes and
supports in this area (after taking account of the projected reduction in the Live Register).
57
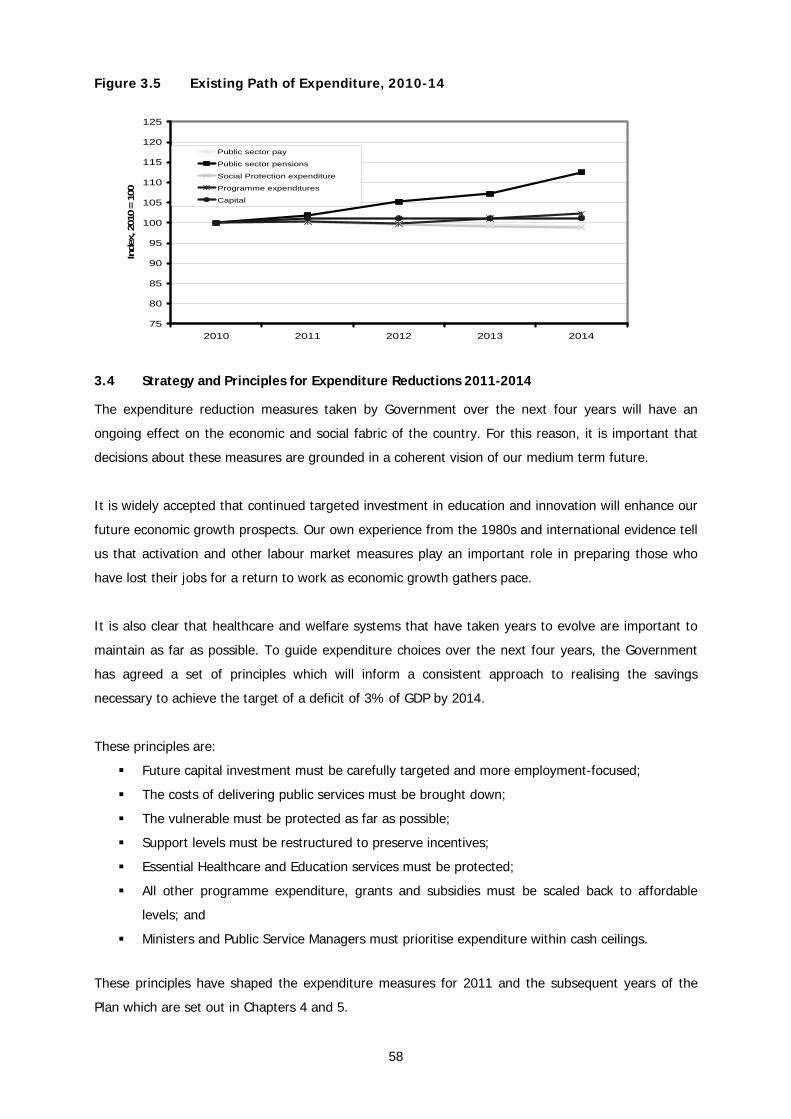
Figure 3.5 Existing Path of Expenditure, 2010-14
75
80
85
90
95
100
105
110
115
120
125
2010 2011 2012 2013 2014
Inde
x, 2
010
= 10
0
Public sector pay
Public sector pensions
Social Protection expenditure
Programme expenditures
Capital
3.4 Strategy and Principles for Expenditure Reductions 2011-2014
The expenditure reduction measures taken by Government over the next four years will have an
ongoing effect on the economic and social fabric of the country. For this reason, it is important that
decisions about these measures are grounded in a coherent vision of our medium term future.
It is widely accepted that continued targeted investment in education and innovation will enhance our
future economic growth prospects. Our own experience from the 1980s and international evidence tell
us that activation and other labour market measures play an important role in preparing those who
have lost their jobs for a return to work as economic growth gathers pace.
It is also clear that healthcare and welfare systems that have taken years to evolve are important to
maintain as far as possible. To guide expenditure choices over the next four years, the Government
has agreed a set of principles which will inform a consistent approach to realising the savings
necessary to achieve the target of a deficit of 3% of GDP by 2014.
These principles are:
Future capital investment must be carefully targeted and more employment-focused;
The costs of delivering public services must be brought down;
The vulnerable must be protected as far as possible;
Support levels must be restructured to preserve incentives;
Essential Healthcare and Education services must be protected;
All other programme expenditure, grants and subsidies must be scaled back to affordable
levels; and
Ministers and Public Service Managers must prioritise expenditure within cash ceilings.
These principles have shaped the expenditure measures for 2011 and the subsequent years of the
Plan which are set out in Chapters 4 and 5.
58
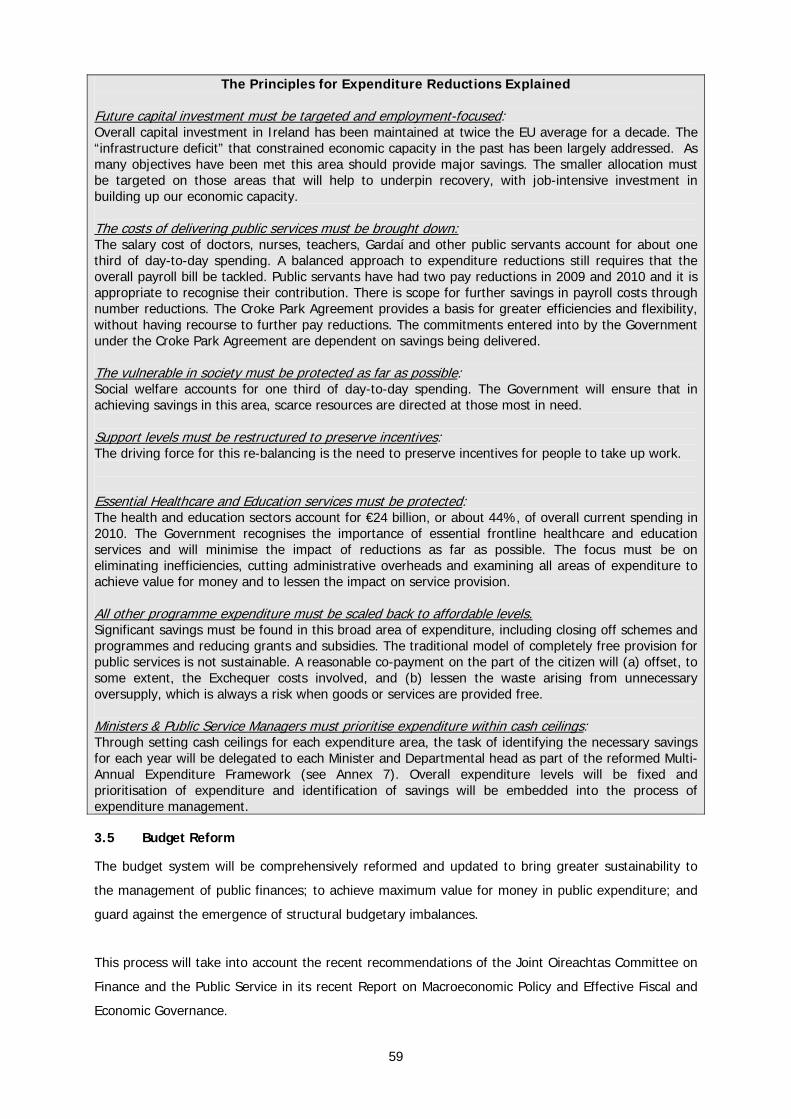
The Principles for Expenditure Reductions Explained Future capital investment must be targeted and employment-focused: Overall capital investment in Ireland has been maintained at twice the EU average for a decade. The “infrastructure deficit” that constrained economic capacity in the past has been largely addressed. As many objectives have been met this area should provide major savings. The smaller allocation must be targeted on those areas that will help to underpin recovery, with job-intensive investment in building up our economic capacity. The costs of delivering public services must be brought down: The salary cost of doctors, nurses, teachers, Gardaí and other public servants account for about one third of day-to-day spending. A balanced approach to expenditure reductions still requires that the overall payroll bill be tackled. Public servants have had two pay reductions in 2009 and 2010 and it is appropriate to recognise their contribution. There is scope for further savings in payroll costs through number reductions. The Croke Park Agreement provides a basis for greater efficiencies and flexibility, without having recourse to further pay reductions. The commitments entered into by the Government under the Croke Park Agreement are dependent on savings being delivered. The vulnerable in society must be protected as far as possible: Social welfare accounts for one third of day-to-day spending. The Government will ensure that in achieving savings in this area, scarce resources are directed at those most in need. Support levels must be restructured to preserve incentives: The driving force for this re-balancing is the need to preserve incentives for people to take up work. Essential Healthcare and Education services must be protected: The health and education sectors account for €24 billion, or about 44%, of overall current spending in 2010. The Government recognises the importance of essential frontline healthcare and education services and will minimise the impact of reductions as far as possible. The focus must be on eliminating inefficiencies, cutting administrative overheads and examining all areas of expenditure to achieve value for money and to lessen the impact on service provision. All other programme expenditure must be scaled back to affordable levels. Significant savings must be found in this broad area of expenditure, including closing off schemes and programmes and reducing grants and subsidies. The traditional model of completely free provision for public services is not sustainable. A reasonable co-payment on the part of the citizen will (a) offset, to some extent, the Exchequer costs involved, and (b) lessen the waste arising from unnecessary oversupply, which is always a risk when goods or services are provided free. Ministers & Public Service Managers must prioritise expenditure within cash ceilings: Through setting cash ceilings for each expenditure area, the task of identifying the necessary savings for each year will be delegated to each Minister and Departmental head as part of the reformed Multi-Annual Expenditure Framework (see Annex 7). Overall expenditure levels will be fixed and prioritisation of expenditure and identification of savings will be embedded into the process of expenditure management.
3.5 Budget Reform
The budget system will be comprehensively reformed and updated to bring greater sustainability to
the management of public finances; to achieve maximum value for money in public expenditure; and
guard against the emergence of structural budgetary imbalances.
This process will take into account the recent recommendations of the Joint Oireachtas Committee on
Finance and the Public Service in its recent Report on Macroeconomic Policy and Effective Fiscal and
Economic Governance.
59
A reformed Budget Formation Process taking account of agreed EU-wide coordination and surveillance
mechanism will be put in place. A budgetary timetable along the following lines is now being
considered:
December: annual Budget presented to Dáil Éireann, with detailed Estimates for the coming
year (year t+1).
Draft Stability Programme Update (SPU) projections prepared, together with proposed multi-
year Ministerial Current Expenditure Envelopes, for the later years t+2 to t+4.
January – April: refinement of the draft SPU projections and multi-year budgetary policy
objectives, taking account of the updated global and domestic economic outlook, and in the
light of commentary from the Budget Advisory Council (see below) and the relevant Dáil
Committee. In addition, the EU policy co-ordination processes culminate with the ‘Annual
Economic Summit’ (European Council) and its Conclusions.
April: The final Stability Programme Update for the years t+2 and beyond is prepared in light
of the perspectives received from the above policy inputs.
July: EU-wide budgetary surveillance, on the basis of SPU documents, would be completed.
September - December: Preparation of the December Budget and detailed Estimates for the
following year, t+2, is ongoing, in line with the overall parameters set out in April’s SPU
document.
Reformed arrangements will also include:
the extension of Performance Budgeting to identify more readily the results and impacts that
are expected to be delivered with public funds - details in this regard are provided in Annex 6;
new VFM rules to spotlight performance, and to assess whether spending programmes and
investment projects are delivering real benefits;
a Medium-Term Expenditure Framework with multi-annual ceilings on expenditure in each
area, to ensure that public expenditure is managed within fixed, sustainable limits and to
guide the planning and delivery of structural and policy reforms - further details in this regard
are set out in Annex 7;
a Budget Advisory Council to provide an independent commentary on the Government’s
budgetary planning, by means of assessing the appropriateness of the budgetary stance and
aggregate budgetary targets being adopted; and
a Fiscal Responsibility Law to put key reform measures on a statutory basis and to ensure that
the principle of keeping the public finances on a sustainable footing is binding in law.
Further operational aspects of these reform measures will be set out in the forthcoming 2011 Budget.
Action Point
The Government will reform and update the existing budgetary architecture, with
details to be announced in the 2011 Budget.
60

Chapter 4 Current Expenditure Measures
Key Messages
Savings of €7 billion will be made on current expenditure by 2014.
40% of the savings will be frontloaded in 2011 and will amount to over €2.1 billion in
2011 and over €2.7 billion in a full year.
Adjustments are required across all major categories of spending, namely:
- Public service pay bill (- €1.2 billion).
- Social Protection expenditure (- €2.8 billion).
- Other Programme expenditure (- €3 billion).
Further reduction of public service staff numbers for each sector to bring the overall
reduction to over 24,750 or 8% on end-2008 levels.
More effective use of staffing resources with redeployment of staff within and across
sectors of the public service to meet priority needs.
Reform work practices to provide more efficient public services with scarcer
resources.
Introduce a reformed pension scheme for new entrants to the public service and
reduce their pay by 10%.
Introduce a pension deduction for public service pensioners to yield €100 million in
savings.
Increase the student contribution to the costs of third level education;
Introduce water metering by 2014.
4.1 Introduction
The expenditure choices set out in this Chapter are designed not only to return public spending to a
sustainable level but to hasten economic recovery. For this reason, investment in education,
innovation and enterprise has been maintained. The targets set for a reduction in public service staff
levels will require a more efficient and effective public service that, together with the full
implementation of the Croke Park Agreement, will enhance our competitiveness and deliver better
services to citizens.
The measures contained in the Plan will reduce current expenditure to just over €48 billion by 2014,
some €7 billion less than had been projected. Table 4.1 sets out the trajectory of gross current
expenditure necessary to achieve the 2014 target which amounts to a reduction of 13% of 2010
spending. Expenditure savings of over €2 billion will be made in 2011 with somewhat lower annual
savings targets set for each of the years 2012, 2013 and 2014.
61
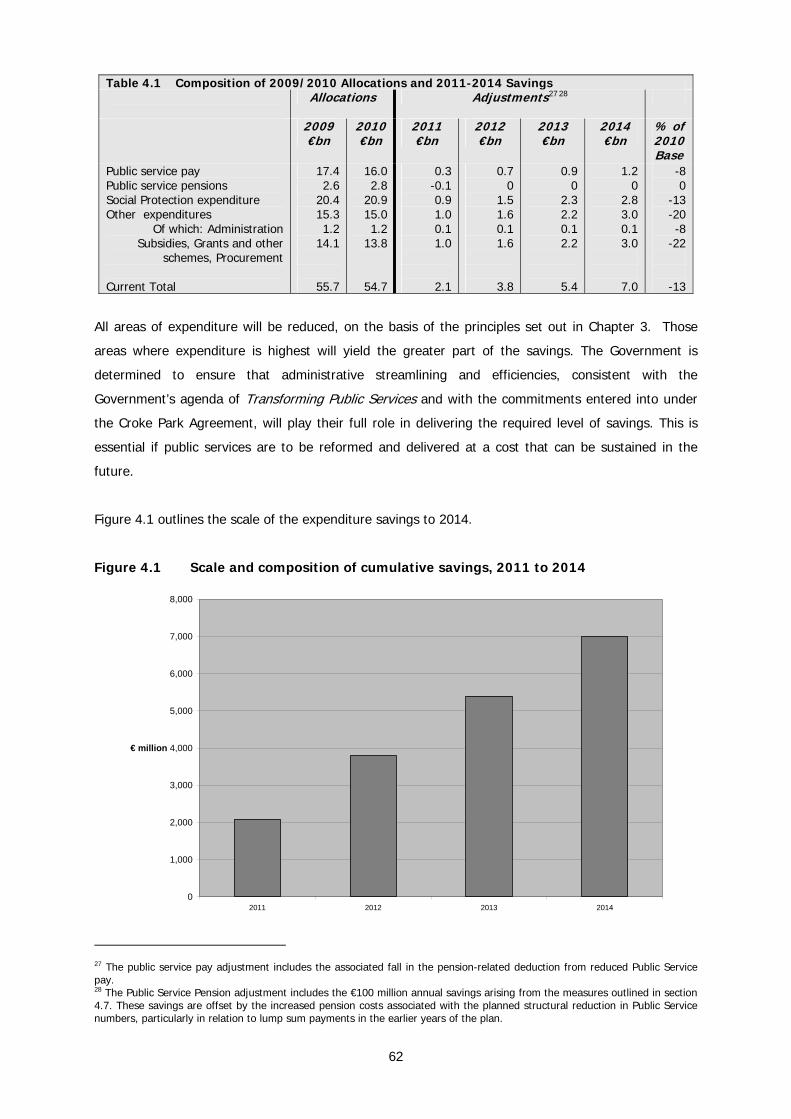
Table 4.1 Composition of 2009/2010 Allocations and 2011-2014 Savings
Allocations Adjustments27 28
2009 €bn
2010€bn
2011 €bn
2012 €bn
2013 €bn
2014 €bn
% of 2010 Base
Public service pay Public service pensions Social Protection expenditure Other expenditures
Of which: Administration Subsidies, Grants and other
schemes, Procurement Current Total
17.4 2.6
20.4 15.3 1.2
14.1
55.7
16.02.8
20.915.01.2
13.8
54.7
0.3 -0.1 0.9 1.0 0.1 1.0
2.1
0.7 0
1.5 1.6 0.1 1.6
3.8
0.9 0
2.3 2.2 0.1 2.2
5.4
1.2 0
2.8 3.0 0.1 3.0
7.0
-8 0
-13 -20 -8
-22
-13
All areas of expenditure will be reduced, on the basis of the principles set out in Chapter 3. Those
areas where expenditure is highest will yield the greater part of the savings. The Government is
determined to ensure that administrative streamlining and efficiencies, consistent with the
Government’s agenda of Transforming Public Services and with the commitments entered into under
the Croke Park Agreement, will play their full role in delivering the required level of savings. This is
essential if public services are to be reformed and delivered at a cost that can be sustained in the
future.
Figure 4.1 outlines the scale of the expenditure savings to 2014.
Figure 4.1 Scale and composition of cumulative savings, 2011 to 2014
0
1,000
2,000
3,000
4,000
5,000
6,000
7,000
8,000
2011 2012 2013 2014
€ million
27 The public service pay adjustment includes the associated fall in the pension-related deduction from reduced Public Service pay. 28 The Public Service Pension adjustment includes the €100 million annual savings arising from the measures outlined in section 4.7. These savings are offset by the increased pension costs associated with the planned structural reduction in Public Service numbers, particularly in relation to lump sum payments in the earlier years of the plan.
62

4.2 Public Service Pay Costs
The Public Service Pay Bill has been reduced by over €1.4 billion in gross terms in 2010 over the 2009
outturn and now stands at just over €16 billion as a result of the reductions in public service pay rates
and reduced staffing levels. Public service staff numbers have already been reduced by about 12,000
since peak levels at end-2008. This exceeds the targets adopted by Government in late 2009. In fact,
the existing end-2012 target of 307,400 (whole-time equivalents) has effectively been achieved by
end September 2010 (307,500) and will be comprehensively exceeded by end 2010 when the effects
of the H.S.E. scheme are taken into account.
On the basis of existing policies and projections, public service pay costs will continue to fall. Sector-
by-sector analysis indicates that, by continuing to build upon the control measures currently in force,
we can now achieve a target level of 294,700 staff numbers by end-2014. This will return the public
service to the numbers last seen in early 2006 and the public service pay bill to the level last seen in
2005. Table 4.2 sets out the planned position.
Table 4.2 Expenditure on Public Service Pay Bill29
2009
€bn
2010
€bn
2011
€bn
2012
€bn
2013
€bn
2014
€bn
%
change
2010-14
Opening Pay allocation 17.4 16.0 16.1 16.0 16.0 15.9 -1%
Consolidation measures, 2011-1430 0.4 0.7 1.0 1.2 -
Pay Expenditure Ceiling 17.4 16.0 15.7 15.3 15.0 14.7 -8%
The pay saving resulting from this reduction in numbers, coupled with a range of reforms and
efficiencies will amount to €1.2 billion savings by 2014. Table 4.3 below set out details by Government
sector. This gross pay saving will be offset by some increased pension costs in 2011 and 2012, as
discussed in the section 4.7 below. There will also be additional savings in the local authority sector,
not directly impacting upon the Exchequer.
Additional pay savings will be achieved through an immediate 10% reduction in the pay of all new
entrants to the public service leading to a further sustainable reduction in public service pay costs
over the medium term. In addition, all new entrants will start on the minimum point of the scale.
More generally, the Government has already taken action to reduce the pay of politicians and senior
public servants. In 2009 the Minister for Finance ordered a fresh review of top level public service
pay, to take account of the changed budgetary and economic circumstances, the changed private
sector pay environment and to compare pay against that of other countries of comparable scale,
29 This table presents the gross pay allocations and, as such, does not take account of the receipts of the pension-related deduction on Public Service remuneration, which is estimated to yield up to €1 billion in 2010. 30 Does not include the associated fall in the pension-related deduction from reduced Public Service pay.
63
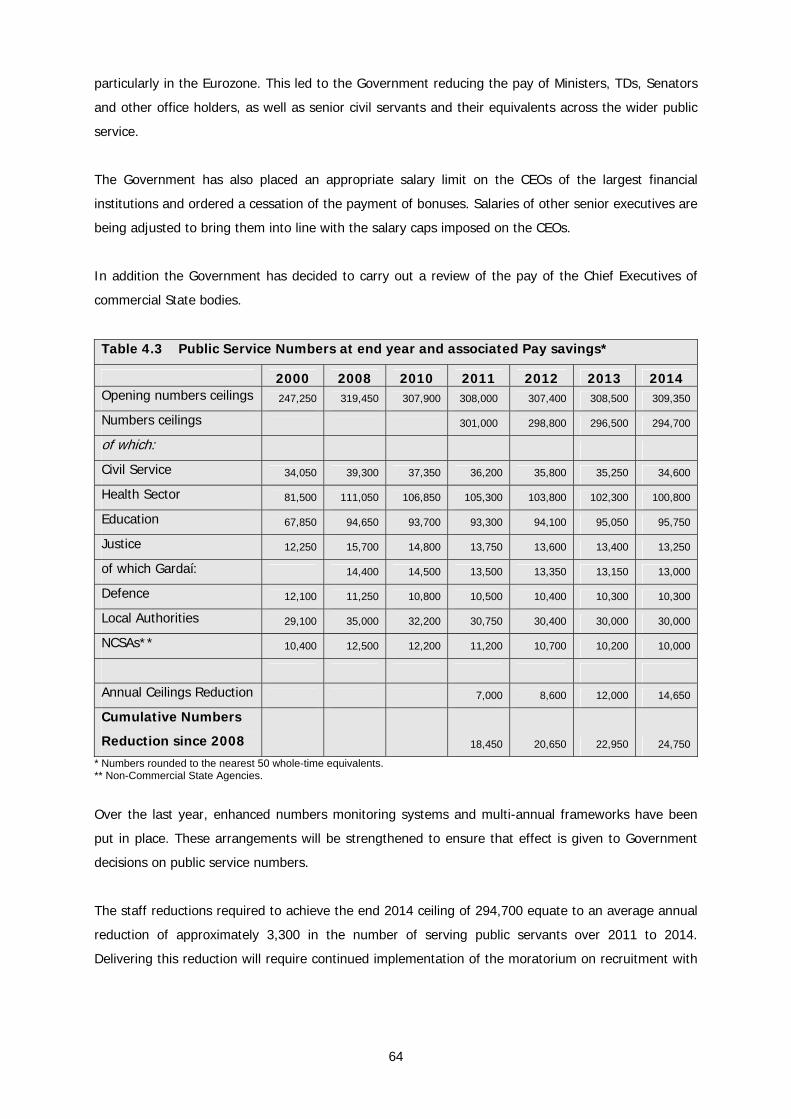
particularly in the Eurozone. This led to the Government reducing the pay of Ministers, TDs, Senators
and other office holders, as well as senior civil servants and their equivalents across the wider public
service.
The Government has also placed an appropriate salary limit on the CEOs of the largest financial
institutions and ordered a cessation of the payment of bonuses. Salaries of other senior executives are
being adjusted to bring them into line with the salary caps imposed on the CEOs.
In addition the Government has decided to carry out a review of the pay of the Chief Executives of
commercial State bodies.
Table 4.3 Public Service Numbers at end year and associated Pay savings*
2000 2008 2010 2011 2012 2013 2014 Opening numbers ceilings 247,250 319,450 307,900 308,000 307,400 308,500 309,350
Numbers ceilings 301,000 298,800 296,500 294,700
of which:
Civil Service 34,050 39,300 37,350 36,200 35,800 35,250 34,600
Health Sector 81,500 111,050 106,850 105,300 103,800 102,300 100,800
Education 67,850 94,650 93,700 93,300 94,100 95,050 95,750
Justice 12,250 15,700 14,800 13,750 13,600 13,400 13,250
of which Gardaí: 14,400 14,500 13,500 13,350 13,150 13,000
Defence 12,100 11,250 10,800 10,500 10,400 10,300 10,300
Local Authorities 29,100 35,000 32,200 30,750 30,400 30,000 30,000
NCSAs** 10,400 12,500 12,200 11,200 10,700 10,200 10,000
Annual Ceilings Reduction 7,000 8,600 12,000 14,650
Cumulative Numbers
Reduction since 2008 18,450 20,650 22,950 24,750
* Numbers rounded to the nearest 50 whole-time equivalents. ** Non-Commercial State Agencies.
Over the last year, enhanced numbers monitoring systems and multi-annual frameworks have been
put in place. These arrangements will be strengthened to ensure that effect is given to Government
decisions on public service numbers.
The staff reductions required to achieve the end 2014 ceiling of 294,700 equate to an average annual
reduction of approximately 3,300 in the number of serving public servants over 2011 to 2014.
Delivering this reduction will require continued implementation of the moratorium on recruitment with
64

exceptions being limited to all but a limited number of essential posts and the utilisation of
redeployment as the primary mechanism to fill posts which have been approved.31
The annual aggregate and sector ceilings outlined in Table 4.3 set out the minimum acceptable
reduction in staff numbers and should staff exits exceed projected levels, the savings target by 2014
will be frontloaded. There can be no question of recruitment of replacement staff in any sector, except
in the circumstances outlined above, until the reductions required to reach the end 2014 ceilings have
been exceeded. On this basis, the overall numbers reduction of 24,750, relative to end-2008,
represents a prudent basis for the delivery of numbers-based payroll savings. The Government
anticipates that accelerated numbers reductions may make a further contribution to the overall payroll
adjustment of €1.2 billion by 2014.
The reductions sought will bring Garda numbers back to 13,000, the level reached in 2006/2007. Civil
service numbers will go back to 34,600 or 2001 levels, and HSE numbers will return to 100,800, the
2005 level. Education numbers will increase over the period reflecting demographic pressures and in
line with Government commitments.
More generally, the savings arising from numbers reductions will need to be supplemented with
significant savings from efficiencies and greater flexibility realised through a whole range of reform
measures in accordance with the Croke Park Agreement. This will involve reductions in the costs of
overtime, allowances, staff substitution and temporary replacement, and special payments across the
public service. The National Recovery Plan has been prepared on the basis that the Croke Park
Agreement will make possible the delivery of tangible savings. The commitments entered into by the
Government under the Croke Park Agreement are dependent on savings being delivered.
4.3 Reforming Institutions and Service Delivery
This proposed reduction in numbers will drive major reforms in the way that the public service does its
business. The Public Service will be smaller, with fewer organisations and fewer staff operating from
a reduced number of locations with significantly reduced resources. Because of this, the Public
Service will have to be more efficient and effective. It will have to achieve greater productivity and
demonstrate greater flexibility. The performance of organisations and individuals will have to be better
managed and measured and there will have to be greater accountability for results. Staff mobility will
have to be maximised and organisations will have to be restructured so that public bodies and
individual public servants will be able to work together across sectoral, organisational and professional
boundaries more effectively.
The Government has set out a vision for an increasingly integrated Public Service which is leaner and
more effective, and focussed on the needs of the citizen. This vision must be realised throughout
31 In exceptional circumstances, critical and urgent business needs may necessitate recruitment to particular posts which cannot be filled though redeployment. In such cases, the organisation will be required to suppress a lower priority post.
65

every part of the Public Service through the implementation of Government’s Transforming Public
Services agenda which will be facilitated by the Croke Park Agreement. The commitments given by
the Government under the agreement are dependent on delivery of these efficiencies. Unions have
agreed that services can be restructured, work locations can change and that services to the public
can be offered over longer periods.
The reduction in numbers over the last two years has resulted in increased productivity across the
public service. The core concern of Government is to achieve sustainability in the cost of delivering
public services through a further targeted reduction in public service numbers. Revised work practices
and other major reform initiatives are essential to mitigate the impact on priority public services of
staff reductions and limited resources. More must be achieved by fewer staff with smaller budgets.
Croke Park Agreement
• Building on its Statement on Transforming Public Services, the Government has set out a vision for an increasingly integrated Public Service which is leaner and more effective, and focussed more on the needs of the citizen. The Public Service Agreement 2010-14 (the Croke Park Agreement) will facilitate co-operation with the actions which will have to be taken in every public service organisation to achieve the Transformation agenda.
• In the light of the serious state of the public finances, very significant steps have
already been taken over the last eighteen months to restrict the cost of the public service.
Pay Reduction
• By accepting the Croke Park Agreement, public servants have accepted the imposition of a pension levy and pay cuts resulting in an average combined reduction of 14% in pay. This has resulted in an estimated annual pay saving of €1.8 billion in net terms. The Agreement provides for an effective freeze in pay up to 2014.
Substantial Numbers Reductions
• As a result of the moratorium on recruitment and promotion and other cost savings mechanisms like the Incentivised Scheme of Early Retirement and the Incentivised Career Break Scheme, there has already been a reduction of about 12,000 in public service numbers since the end of 2008. Under the Croke Park Agreement, the public service unions have given commitments to co-operation with public service modernisation which will include work practice changes that will be necessary to sustain priority service levels with significantly reduced numbers. Industrial Peace
• Reform measures have been implemented with no substantial industrial unrest.
4.4 Redeployment
Without steps to mitigate their impacts, a substantial reduction of the numbers of public servants
would impact on the level and range of services delivered to the public. In this constrained
environment it is crucial that there is maximum flexibility in the deployment of staff.
The redeployment arrangements contained in the Croke Park Agreement will allow us to sustain
priority services which will include work practice changes that will be necessary to sustain priority
service levels with significantly reduced numbers. It will permit staff to be moved from activities which
are of lesser priority, or which have been rationalised, reconfigured, or restructured, to areas of
greater need.
66
Redeployment arrangements will apply in the Civil Service; in the Health and Education sectors; in
Non-Commercial State Agencies (NCSAs); and in Local Authorities. Redeployment can take place
within individual sectors or between these sectors. It will provide Departments and agencies with an
effective and efficient mechanism for reducing excess staff numbers and for acquiring additional staff
where appropriate, without the need to resort to outside recruitment. In addition substantial changes
will be required in work practices as provided for under the Croke Park Agreement.
4.5 Public Service Transformation
Delivery of the Government’s Transformation agenda will require tangible and measurable change
across all parts of the public service in a number of key areas.
4.5.1 Performance
The reduction in numbers will demand significant improvements in performance from all public
servants as we strive to maintain service levels with scarcer resources. Performance management and
development will be extended across all sectors of the Public Service. Existing systems will be
strengthened significantly to ensure that performance ratings reflect actual performance.
Performance management will be linked to disciplinary systems.
The proposed Performance Budgeting Initiative, as outlined at Section 3.5, will also be supportive of
the performance management agenda.
4.5.2 Service Delivery
Services to the citizen can be enhanced as staffing numbers reduce if the manner in which they are
delivered is reformed according to the following strategies that have proved successful outside the
public service. These include:
• moving to risk based compliance;
• filtering of applications;
• use of trust relationships to obtain data; and
• greater use of self-service including online facilities.
Progress in this area will underpin developments right across the eGovernment agenda.
4.5.3 Shared Services
Sharing of services by Public Service bodies will gather pace in this constrained budgetary
environment. A Head of Shared Services is being appointed and areas to be targeted include:
• human resource management;
• payroll;
• pensions administration; and
• financial management.
67

While some initial investment is required, this is an obvious area to deliver significant savings over the
lifetime of the Plan.
4.5.4 eGovernment
eGovernment has the potential to improve a whole range of Government services. The current
eGovernment Strategy focuses on improved delivery of information electronically, enhanced electronic
delivery of services, and better use of shared technology approaches. The eGovernment plans of
individual bodies are being developed in accordance with these recommendations.
Further phases of this strategy are being planned. These will address greater electronic integration
between public bodies, the online publication of public service data, online collaboration facilities for
citizens and businesses, and legal and administrative measures to enhance the take-up of electronic
services and self-service.
Further details are contained in Annex 9.
Action Points
Public Service Transformation
The reduction in public service staffing levels and scarcer resources will necessitate
significant reform in order to ensure that priority service levels to the citizen are
maintained.
These reforms can be achieved through the full implementation of the Transforming
Public Services agenda facilitated by the Croke Park Agreement.
Service delivery will be reformed, refined and simplified.
Greater use will be made of shared services to achieve efficiencies and improve
service delivery.
There will be substantial changes to the way in which public servants work to
increase productivity and sustain necessary public services. Performance
management and development will be extended across all sectors of the Public
Service and existing systems will be strengthened.
4.6 Public Service Sectoral Reform
4.6.1 Civil Service and State Agencies
The Civil Service and State Agencies are treated as related sectors for redeployment purposes,
allowing for flexible redeployment between them and other sectors as required.
In the Civil Service increased productivity will be secured from a reduced staff complement though
revised working practices, for example in the Prison Service, where all tasks in prisons and places of
detention will be reviewed with a view to delivering further staffing efficiencies. Productivity will be
68

improved by eliminating outdated working and attendance arrangements and by better managing
existing human resources and by better managing existing human resources across the Civil Service.
The Programme of State Agency rationalisation that commenced in 2008 will continue. In particular
there will be an emphasis on:
- reducing the number and range of agencies;
- redeploying staff to areas of greatest need;
- improving governance and performance arrangements; and
- sharing services.
Agencies will be required to reduce their running costs by 10%.
4.6.2 Health
The Health Service will be reformed to provide a greater range of services in community settings,
particularly through primary care teams and social care networks, and to provide such services on a
planned basis in the evenings and at weekends. This will lead to a reduction in the number of in-
patient beds and an increase in day case, outpatient and diagnostic capacity, which will provide faster
access to services at lower cost.
Planned services will be provided throughout the health system over an extended (8 a.m. to 8 p.m.)
day and over an extended week, while emergency services will continue to be available on a 24-hour
7-day basis. This will reduce the staffing and other resources required to ensure services are available
to the public at nights and weekends.
Staff will be redeployed within and across service locations in the publicly-funded health service, and
in the wider public service, as necessary. There will be a review of existing rostering arrangements, to
incorporate changes so that staff levels match service demand levels at all times and in all settings.
Health system management will centralise functional, transactional, support and other services at
national level including areas such as medical card and other scheme processing functions, payroll,
procurement and purchasing, Information and Communications Technology and Human Resource
Management.
Major change will be introduced in medical laboratory services and associated work practices.
Individual, professional and statutory accountability for management and comparable clinical grades
will be strengthened, and performance management will be introduced in the health service in 2011.
4.6.3 Local Government
Significant change is envisaged for the local government sector over the coming years, as set out in
the recommendations of the Local Government Efficiency Review. The redeployment arrangements
will support this restructuring of local government. Staff will be transferred from areas where demand
69

has declined, such as planning, to other hard-pressed parts of the local authority or the wider Public
Service. Service delivery will be changed to maximise efficiencies and savings will be achieved through
regional delivery, the use of shared services, aggregated procurement and online transactions, new
work practices and flexibility in working arrangements. Modernisation and standardisation of
employment conditions will drive productivity improvements, with the performance management
system linked to incremental progression and promotion.
4.6.4 Education
In the Education Sector, a comprehensive review and revision of the contracts for teachers and other
education staff (special needs assistants, staff in Vocational Education Committees, Institutes of
Technology and Universities) will identify and remove impediments to the provision of an effective
service. Teachers and academic staff will work an additional hour per week to provide for a wide
range of needs in the various institutions, with the Institutes in particular committed to flexible
delivery of new courses specifically aimed at the unemployed. Redeployment will take place at all
levels and will facilitate restructuring in the second and third level sectors. The substitution and
supervision roster for teachers in second level schools will be improved.
4.6.5 Policing and Defence
A more effective Garda rostering system will ensure that there are enough Gardaí to meet priority
policing demands. Civilianisation will maximise the availability of Gardaí for duties of a policing
character. Garda training of recruits and serving members will be tailored to meet the diverse needs of
a modern police service.
The overall organisation and structure of the Defence Forces is being reviewed. The Defence Forces
will cooperate with the flexible deployment/redeployment of personnel.
As public service payroll represents about one third of overall spending, there is significant scope to
make major savings. This is a key element of the overall consolidation strategy.
4.6.6 Prison Service
In light of the recent significant increase in the prison population, we are determined to ensure that
imprisonment is used only as a sanction of last resort. Prison has to be reserved for serious offenders.
In 2009 there were 4,800 cases where people were sent to prison for non-payment of fine. We have
introduced a number of measures to address this in the Fines Act 2010.
• With effect from January 2011, courts will have to take into account the capacity of a
person to pay a fine before deciding on the amount. So by law no person should be sent to
prison because they cannot afford to pay a fine.
• Later next year, as soon as the Courts Service have the necessary administrative
arrangements in place, measures will be brought into force which will allow for fines to be
70
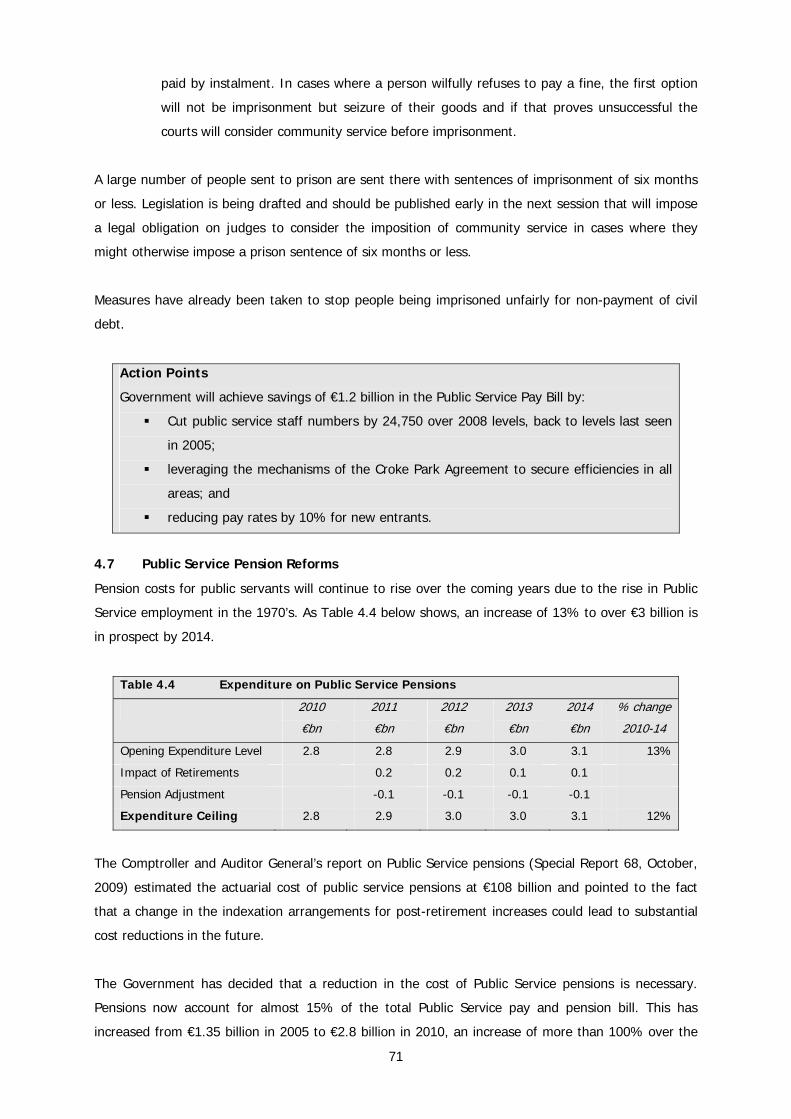
paid by instalment. In cases where a person wilfully refuses to pay a fine, the first option
will not be imprisonment but seizure of their goods and if that proves unsuccessful the
courts will consider community service before imprisonment.
A large number of people sent to prison are sent there with sentences of imprisonment of six months
or less. Legislation is being drafted and should be published early in the next session that will impose
a legal obligation on judges to consider the imposition of community service in cases where they
might otherwise impose a prison sentence of six months or less.
Measures have already been taken to stop people being imprisoned unfairly for non-payment of civil
debt.
Action Points
Government will achieve savings of €1.2 billion in the Public Service Pay Bill by:
Cut public service staff numbers by 24,750 over 2008 levels, back to levels last seen
in 2005;
leveraging the mechanisms of the Croke Park Agreement to secure efficiencies in all
areas; and
reducing pay rates by 10% for new entrants.
4.7 Public Service Pension Reforms
Pension costs for public servants will continue to rise over the coming years due to the rise in Public
Service employment in the 1970’s. As Table 4.4 below shows, an increase of 13% to over €3 billion is
in prospect by 2014.
Table 4.4 Expenditure on Public Service Pensions
2010
€bn
2011
€bn
2012
€bn
2013
€bn
2014
€bn
% change
2010-14
Opening Expenditure Level 2.8 2.8 2.9 3.0 3.1 13%
Impact of Retirements 0.2 0.2 0.1 0.1
Pension Adjustment -0.1 -0.1 -0.1 -0.1
Expenditure Ceiling 2.8 2.9 3.0 3.0 3.1 12%
The Comptroller and Auditor General’s report on Public Service pensions (Special Report 68, October,
2009) estimated the actuarial cost of public service pensions at €108 billion and pointed to the fact
that a change in the indexation arrangements for post-retirement increases could lead to substantial
cost reductions in the future.
The Government has decided that a reduction in the cost of Public Service pensions is necessary.
Pensions now account for almost 15% of the total Public Service pay and pension bill. This has
increased from €1.35 billion in 2005 to €2.8 billion in 2010, an increase of more than 100% over the
71

period. The Comptroller and Auditor General's (C&AG) 2010 report shows the number of Public
Service pensioners increased from 113,384 in 2008 to 123,954 in 2009; the report also estimates that
there are two Public Service pensioners for every five serving public servants.
Given the present budgetary constraints, the Government considers that it is appropriate that some
retired Public Service pensioners make a contribution to the required adjustment. There is a gap
between the burden being borne by those currently in Public Service employment and those who are
retired. The pension levy and the pay adjustment did not affect those in retirement. The Government
has also taken account of the general reduction in prices: the CPI is now at 2007 levels, whereas
Public Service pensioners received general round increases of 2% in June 2007, 2.5% in March 2008
and 2.5% in September 2008 – providing an increase in the real value of Public Service pensions.
The Government has therefore decided on a reduction of €100 million or about 4% in the annual cost
of Public Service pensions paid to some pensioners in 2011. The reduction will require legislation to be
passed before the end of the year.
In order to avoid a destabilising rate of retirements in 2011 and to manage the cost in both 2011 and
2012, the Government has decided to extend the "grace period" under which pensions are calculated
by reference to the pre-cut rates of public service pay to end-February 2012. This decision has been
taken into account in the pay and pensions figures presented.
The reduction will apply to existing Public Service pensioners, former office holders, retired members
of the Judiciary, and their survivors. For existing public service pensioners and those public servants
who retire before the ending of the ‘grace period’ at end-February 2012, the legislation will provide for
an average reduction of some 4% in pensions in line with the following rates and bands:
Annual Public Service Pension (€) Reduction Rate
First 12,000 0%
Between 12,001 and 24,000 6%
Between 24,001 and 60,000 9%
Balance above 60,001 12%
There is no change in public service pension scheme terms. Pensions will be calculated in the usual
way according to those terms. In the case of existing public service pensioners and those public
servants who retire before the ending of the ‘grace period’ at end-February 2012, there will be an
average reduction of some 4% in pensions with the application of the above rates. As those who
retire after this date are subject to the pay reduction of 7% on average, which will reduce the pension
and lump sum to be paid, the Government has decided that it would not be appropriate to also apply
the pension reduction to this group.
72

More generally, public service pensions must be comprehensively reformed so that future costs can be
managed in the context of sustainable public finances. In Budget 2010, the Minister for Finance
announced the introduction of a new single pension scheme for all new entrants to the Public Service
from 2011. This new scheme will reduce budgetary expenditure on Public Service pensions in the
longer-term.
This is another step in the reform of the Public Service pension system that has been underway for
some time:
• in 2004, the minimum pension age was increased from 60 to 65 years for new entrants to the
Public Service;
• in 2009, the pension-related deduction was introduced for all Public Servants in recognition of
the benefits provided under Public Service pension schemes; and
• no pension increases are being paid at present.
The main provisions for the new scheme decided by the Government are:
• raising the minimum pension age to 66 years initially and then linking it to the state pension
age - this is in step with the changes decided by the Government in the context of the recently
announced National Pensions Framework which increased the state pension age to 66 years in
2014, 67 in 2021, and 68 in 2028;
• a maximum retirement age of 70 years; and
• career average earnings rather than final salary will be used to calculate pension – a standard
accrual rate would be applied to pensionable pay so that a pension amount accrues each year,
this amount to be up-rated each year by the CPI so as to maintain its purchasing power.
Legislation will be published shortly facilitating the introduction of the new scheme in 2011.
The new pension scheme which will apply to new entrants from 2011 will use the CPI rather than, as
at present, a link to the pay of serving Public Servants to calculate increases for pensioners. This is a
major step towards achieving savings such as those identified in the Comptroller’s 2009 report. The
Public Service Agreement provides that use of the CPI for post-retirement increases for existing
pensioners and serving staff will be considered as part of the general discussions on pay and other
issues in spring 2011. The Government has agreed that no change will be applied to the present pay
parity arrangement for existing pensioners and serving staff during the lifetime of the Agreement, that
is, up to 2014. In view of the terms of the Croke Park Agreement, that arrangement will not give rise
to any increase in that period.
Action Points
In order to address the significant rise in public service pension costs in future years, the
Government will:
Secure a contribution from public service pensioners of €100 million in 2011.
73
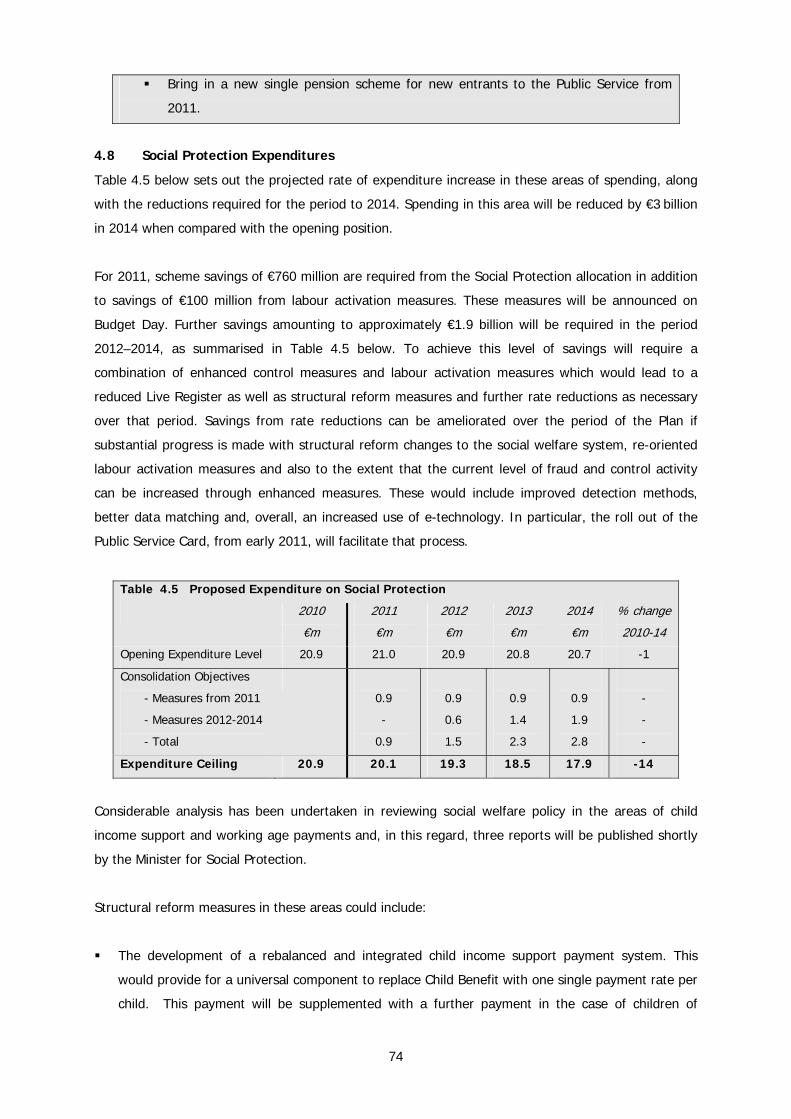
Bring in a new single pension scheme for new entrants to the Public Service from
2011.
4.8 Social Protection Expenditures
Table 4.5 below sets out the projected rate of expenditure increase in these areas of spending, along
with the reductions required for the period to 2014. Spending in this area will be reduced by €3 billion
in 2014 when compared with the opening position.
For 2011, scheme savings of €760 million are required from the Social Protection allocation in addition
to savings of €100 million from labour activation measures. These measures will be announced on
Budget Day. Further savings amounting to approximately €1.9 billion will be required in the period
2012–2014, as summarised in Table 4.5 below. To achieve this level of savings will require a
combination of enhanced control measures and labour activation measures which would lead to a
reduced Live Register as well as structural reform measures and further rate reductions as necessary
over that period. Savings from rate reductions can be ameliorated over the period of the Plan if
substantial progress is made with structural reform changes to the social welfare system, re-oriented
labour activation measures and also to the extent that the current level of fraud and control activity
can be increased through enhanced measures. These would include improved detection methods,
better data matching and, overall, an increased use of e-technology. In particular, the roll out of the
Public Service Card, from early 2011, will facilitate that process.
Table 4.5 Proposed Expenditure on Social Protection
2010
€m
2011
€m
2012
€m
2013
€m
2014
€m
% change
2010-14
Opening Expenditure Level 20.9 21.0 20.9 20.8 20.7 -1
Consolidation Objectives
- Measures from 2011
- Measures 2012-2014
- Total
0.9
-
0.9
0.9
0.6
1.5
0.9
1.4
2.3
0.9
1.9
2.8
-
-
-
Expenditure Ceiling 20.9 20.1 19.3 18.5 17.9 -14
Considerable analysis has been undertaken in reviewing social welfare policy in the areas of child
income support and working age payments and, in this regard, three reports will be published shortly
by the Minister for Social Protection.
Structural reform measures in these areas could include:
The development of a rebalanced and integrated child income support payment system. This
would provide for a universal component to replace Child Benefit with one single payment rate per
child. This payment will be supplemented with a further payment in the case of children of
74
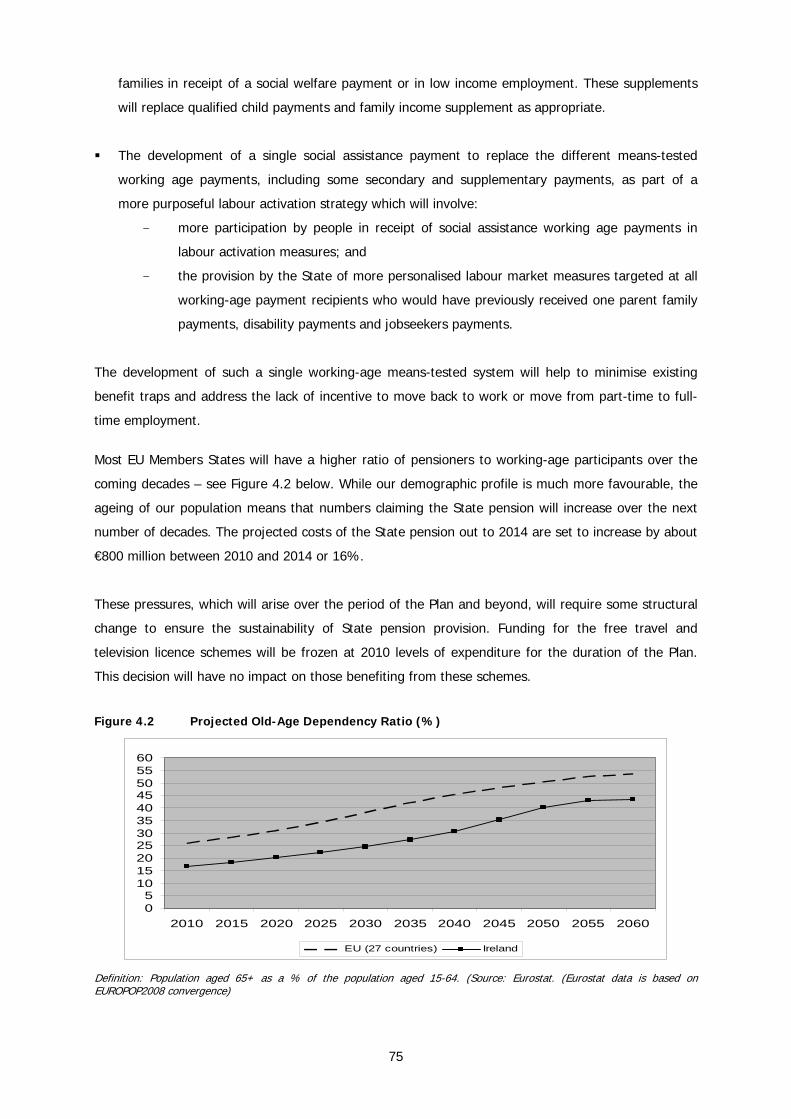
families in receipt of a social welfare payment or in low income employment. These supplements
will replace qualified child payments and family income supplement as appropriate.
The development of a single social assistance payment to replace the different means-tested
working age payments, including some secondary and supplementary payments, as part of a
more purposeful labour activation strategy which will involve:
- more participation by people in receipt of social assistance working age payments in
labour activation measures; and
- the provision by the State of more personalised labour market measures targeted at all
working-age payment recipients who would have previously received one parent family
payments, disability payments and jobseekers payments.
The development of such a single working-age means-tested system will help to minimise existing
benefit traps and address the lack of incentive to move back to work or move from part-time to full-
time employment.
Most EU Members States will have a higher ratio of pensioners to working-age participants over the
coming decades – see Figure 4.2 below. While our demographic profile is much more favourable, the
ageing of our population means that numbers claiming the State pension will increase over the next
number of decades. The projected costs of the State pension out to 2014 are set to increase by about
€800 million between 2010 and 2014 or 16%.
These pressures, which will arise over the period of the Plan and beyond, will require some structural
change to ensure the sustainability of State pension provision. Funding for the free travel and
television licence schemes will be frozen at 2010 levels of expenditure for the duration of the Plan.
This decision will have no impact on those benefiting from these schemes.
Figure 4.2 Projected Old-Age Dependency Ratio (%)
05
1015202530354045505560
2010 2015 2020 2025 2030 2035 2040 2045 2050 2055 2060
EU (27 countries) Ireland
Definition: Population aged 65+ as a % of the population aged 15-64. (Source: Eurostat. (Eurostat data is based on EUROPOP2008 convergence)
75

The Government published the National Pensions Framework in March, 2010. The Framework set out
a policy approach for the longer-term development of the pension system in Ireland taking account of
demographic changes, the fact that just over 50% of the workforce have private pension provision,
the need to provide an adequate income for retirees, and future budget sustainability.
To ensure sustainability, steps must be taken to reduce cost by increasing pension ages and
encouraging more saving for retirement. Elements of the new policy proposed in the National
Pensions Framework include the following:
• The age at which people qualify for the state pension will be increased - to 66 years in 2014, 67
in 2021, and 68 in 2028.
• A new supplementary pension scheme - using an "auto-enrolment" system - will be introduced to
provide additional retirement income for employees not already in a pension scheme.
Contributions to the new scheme will be made within a band of earnings, with earnings below and
above certain thresholds exempt. Employees earning above a certain income threshold will be
automatically enrolled in the new scheme with a contribution rate of 4% within a band of
earnings.
• The Government and the employer will support this saving by providing matching contributions.
The Government has made it clear that the introduction of the new supplementary pension scheme in
2014 will depend on economic conditions.
Work on the Framework is going ahead under the aegis of the Department of Social Protection and
considerable progress has already been made. While the Government will continue with this work, it is
clear that the pace of implementation must have regard to the economic and budgetary circumstances
facing Ireland.
Action Points
Social welfare expenditure will be €3 billion lower in 2014 compared to the opening position
in 2010.
Structural reform measures, re-orientated labour activation and enhanced control
measures will be required to reduce expenditure.
Rate reductions will be ameliorated if substantial progress is made with structural
reforms and labour activation measures.
4.9 Other Programme Expenditures
4.9.1 Proposed Savings for Other Areas
Seventy per cent of programme expenditures outside of Social Protection are on Health and
Education. Table 4.6 shows the multi-annual current expenditure for each of these areas (and for all
76
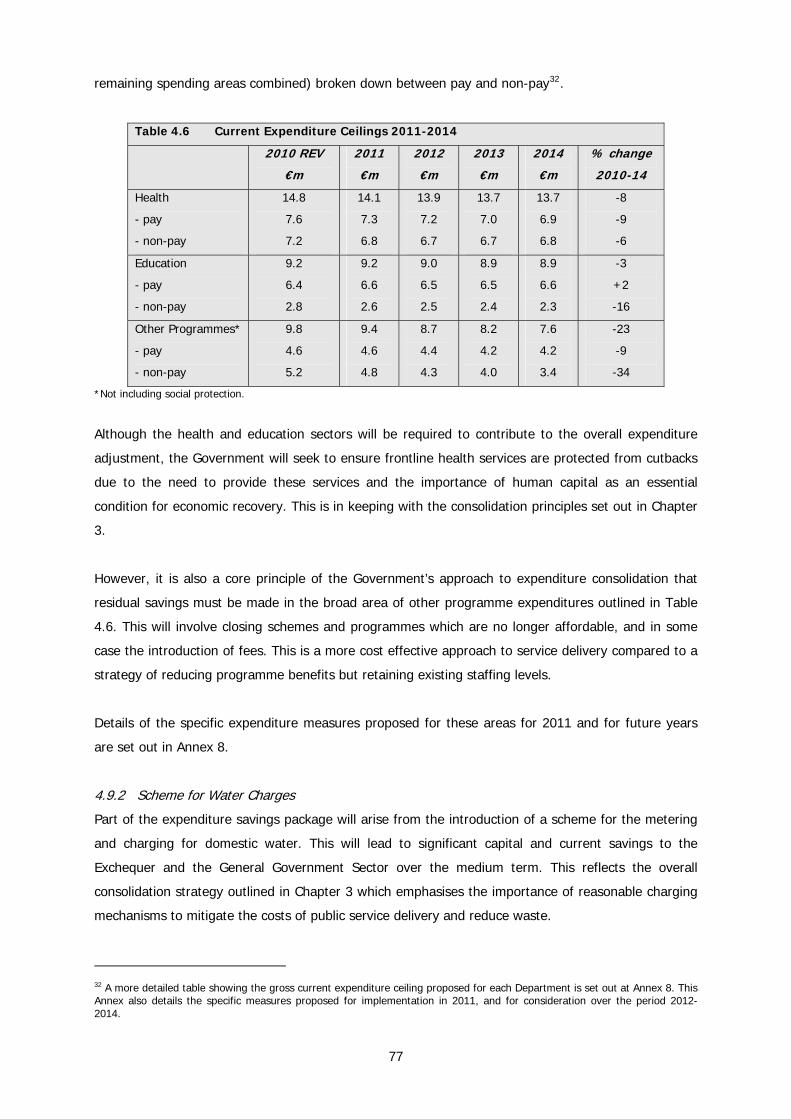
remaining spending areas combined) broken down between pay and non-pay32.
Table 4.6 Current Expenditure Ceilings 2011-2014
2010 REV
€m
2011
€m
2012
€m
2013
€m
2014
€m
% change
2010-14
Health
- pay
- non-pay
14.8
7.6
7.2
14.1
7.3
6.8
13.9
7.2
6.7
13.7
7.0
6.7
13.7
6.9
6.8
-8
-9
-6
Education
- pay
- non-pay
9.2
6.4
2.8
9.2
6.6
2.6
9.0
6.5
2.5
8.9
6.5
2.4
8.9
6.6
2.3
-3
+2
-16
Other Programmes*
- pay
- non-pay
9.8
4.6
5.2
9.4
4.6
4.8
8.7
4.4
4.3
8.2
4.2
4.0
7.6
4.2
3.4
-23
-9
-34
*Not including social protection.
Although the health and education sectors will be required to contribute to the overall expenditure
adjustment, the Government will seek to ensure frontline health services are protected from cutbacks
due to the need to provide these services and the importance of human capital as an essential
condition for economic recovery. This is in keeping with the consolidation principles set out in Chapter
3.
However, it is also a core principle of the Government’s approach to expenditure consolidation that
residual savings must be made in the broad area of other programme expenditures outlined in Table
4.6. This will involve closing schemes and programmes which are no longer affordable, and in some
case the introduction of fees. This is a more cost effective approach to service delivery compared to a
strategy of reducing programme benefits but retaining existing staffing levels.
Details of the specific expenditure measures proposed for these areas for 2011 and for future years
are set out in Annex 8.
4.9.2 Scheme for Water Charges
Part of the expenditure savings package will arise from the introduction of a scheme for the metering
and charging for domestic water. This will lead to significant capital and current savings to the
Exchequer and the General Government Sector over the medium term. This reflects the overall
consolidation strategy outlined in Chapter 3 which emphasises the importance of reasonable charging
mechanisms to mitigate the costs of public service delivery and reduce waste.
32 A more detailed table showing the gross current expenditure ceiling proposed for each Department is set out at Annex 8. This Annex also details the specific measures proposed for implementation in 2011, and for consideration over the period 2012-2014.
77

Charging for water will introduce a new revenue stream to meet costs at present funded by taxation.
The cost for the provision of water services to the domestic sector in 2008 was €590 million. The
proposed charging for this - less an adjustment for the cost of the proposed free allowances - will
improve the General Government position. The Exchequer also provided €508m in 2010 to fund
capital investment in water services.
It is intended that domestic water charges will cover local authorities’ operational costs. A proportion
of the capital cost of providing water services to the domestic sector will also be recovered through
the charge. Overall it is anticipated that these measures could lead to annual savings of up to €500
million per annum on operating costs with further significant capital savings arising on a graduated
basis the following years. These savings will arise as a result of the new revenue accruing from the
water charges.
In addition, savings will result from the incentive effects of the metering system which will reduce
demand to economically efficient levels over both the short and long term. It is estimated that the
value of the operational and capital savings that will accrue in this manner will be significant.
4.9.3 Third Level Education
The Government recognises the importance to society of widespread and equitable opportunities for
access to higher education and provides very substantial resources to this purpose.
As well as the wider benefits for society, higher education directly benefits its participants through
better lifetime earnings opportunities.
Over the period of the Plan, it is intended that a higher student contribution to the cost of higher
education will be made.
Action Point
Government will reduce non-pay expenditure across all programmes excluding social welfare
by 2014 through:
introducing a range of measures necessary to achieve cumulative savings of €3
billion;
introducing a scheme for the metering of the domestic sector with charging for
domestic water by 2014; and
increase the student contribution to the costs of higher education
4.10 Savings from Reducing the Costs of Public Administration
The reductions now required in public service levels generally, make it imperative that we
demonstrate a corresponding resolve to curtail unnecessary administrative costs. While there has
been some success over recent years in securing administrative efficiencies, the Government
78

considers that, in light of the Transforming Public Service agenda and of efficiencies calculated to
arise under the Croke Park Agreement, it is timely to seek a further significant contribution from this
source.
4.10.1 Payroll Savings
Section 4.2 above sets out the proposed savings to be realised from progressive, sustained reductions
in public service numbers. In total, these reductions are projected to lead to savings amounting to
€1.2 billion, including pension costs, by 2014. This includes reductions in pay-related administration
costs in the Health sector and in the Civil Service.
4.10.2 Non-pay Administrative Savings
Proportionate administrative savings should also be factored in for each year of the plan. These
savings will amount to €110 million a year by 2014, and include-
a general 10% reduction in operating costs of Non-Commercial State Agencies (NCSAs) from
2011;
savings in procurement costs across all areas of public administration; and
efficiencies in administration in the civil service and wider public service.
Taken together, the overall savings from the costs of delivering public services – both Pay and Non-
pay – will come to just under €1 billion a year by 2014. These are included in the programme savings
and payroll savings set out in the previous sections.
4.10.3 Procurement
The National Procurement Service (NPS - established in 2009) has among its objectives the
procurement of common goods and services across the Public Service, providing professional
procurement advice to the Public Service, assisting where appropriate with specialist procurement
being undertaken directly by Public Service bodies and integrating whole of Government policy issues
(e.g. SMEs, environment, sustainability) in public procurement policy and practice.
The NPS completed a major exercise to identify the areas of top procurement expenditure categories
across the public service. This analysis gives the NPS a clear focus on categories of procurement that
can be targeted for intervention. To date the NPS has launched major procurement campaigns in a
number of areas including energy (gas and electricity), stationery and office supplies, ICT
consumables, managed print services, vehicles, clothing and insurance.
The NPS will leverage the Public Service’s buying power to obtain better value for money. Last year,
savings of €27 million were achieved by public bodies with the support of the NPS. Savings of
approximately €40 million have been targeted in 2010. Procurement savings of the order of €50
million are proposed for 2011, rising to €65 million by 2014. The Government has decided to
strengthen and focus the current efforts in this area by the appointment of a Public Service-wide Head
79
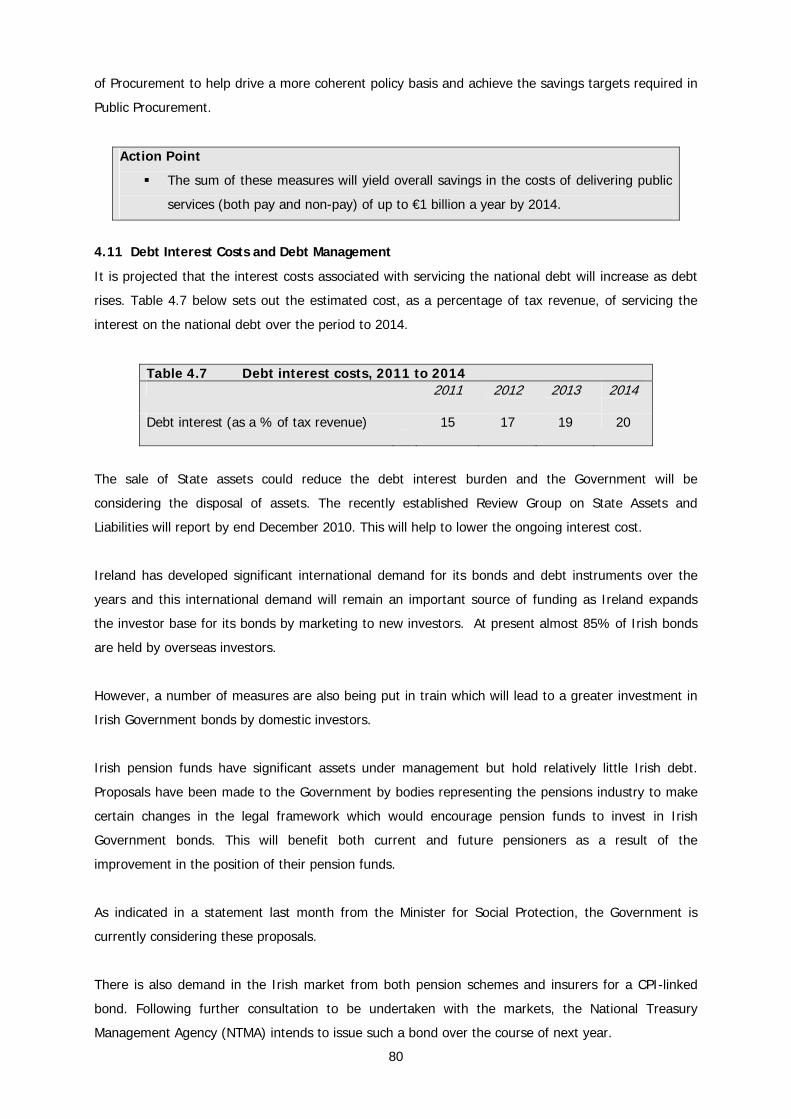
of Procurement to help drive a more coherent policy basis and achieve the savings targets required in
Public Procurement.
Action Point
The sum of these measures will yield overall savings in the costs of delivering public
services (both pay and non-pay) of up to €1 billion a year by 2014.
4.11 Debt Interest Costs and Debt Management
It is projected that the interest costs associated with servicing the national debt will increase as debt
rises. Table 4.7 below sets out the estimated cost, as a percentage of tax revenue, of servicing the
interest on the national debt over the period to 2014.
Table 4.7 Debt interest costs, 2011 to 2014 2011 2012
2013
2014
Debt interest (as a % of tax revenue)
15 17 19 20
The sale of State assets could reduce the debt interest burden and the Government will be
considering the disposal of assets. The recently established Review Group on State Assets and
Liabilities will report by end December 2010. This will help to lower the ongoing interest cost.
Ireland has developed significant international demand for its bonds and debt instruments over the
years and this international demand will remain an important source of funding as Ireland expands
the investor base for its bonds by marketing to new investors. At present almost 85% of Irish bonds
are held by overseas investors.
However, a number of measures are also being put in train which will lead to a greater investment in
Irish Government bonds by domestic investors.
Irish pension funds have significant assets under management but hold relatively little Irish debt.
Proposals have been made to the Government by bodies representing the pensions industry to make
certain changes in the legal framework which would encourage pension funds to invest in Irish
Government bonds. This will benefit both current and future pensioners as a result of the
improvement in the position of their pension funds.
As indicated in a statement last month from the Minister for Social Protection, the Government is
currently considering these proposals.
There is also demand in the Irish market from both pension schemes and insurers for a CPI-linked
bond. Following further consultation to be undertaken with the markets, the National Treasury
Management Agency (NTMA) intends to issue such a bond over the course of next year.
80

In the stressed conditions which have obtained in the bond markets in recent times, it has been
frequently suggested that the State use the resources of the National Pensions Reserve Fund to
support the Irish Government bond market. Such a step would be very beneficial to the markets and
would demonstrate the Government’s willingness to ensure the funding of the Exchequer’s needs.
Accordingly, legislation will be brought forward to enable the NTMA to deploy the resources of the
NPRF to support the Exchequer’s funding programme to the extent required. The NPRF’s holdings of
preference and ordinary shares in Bank of Ireland and Allied Irish Bank will not be affected by this
move.
It is also important that ordinary citizens be given the opportunity to invest in Ireland for the benefit
of the Irish State. Last year a new Solidarity Bond was announced for this very purpose which was
very successful and has raised €300 million since its launch last May. For some investors the
investment period of 10 years for the existing Solidarity Bond may be a disincentive. Accordingly, it is
intended to launch a new 4 year Solidarity Bond shortly with a similar structure to the 10 year bond. It
will pay a coupon each year and a bonus for those who hold the bond to maturity. Further details will
be announced by the NTMA in the near future.
The overall amount of funds raised from the retail savings products under the State Savings schemes
which are marketed for the most part through the post office network has reached a record €3 billion
so far this year. It is expected that those retail savings schemes will continue to perform strongly in
2011.
The Irish public can also avail of the other Government bonds in issue and the various brokers and
others through whom the public can purchase these bonds are urged to facilitate the public and to
charge reasonable fees.
The initiatives outlined above give an opportunity for the Irish public and pension funds to contribute
to funding the national debt. As a consequence of these measures it is expected that there will be a
significant increase in the domestic ownership of Irish Government debt in the near future.
81
Chapter 5 Public Capital Investment
Key Messages
There has been an unprecedented level of capital spending over the last ten years
which has upgraded the quantity and quality of physical infrastructure.
Planned capital investment must be reduced over the medium-term.
Annual public capital allocations over the period of the Plan will be progressively
reduced to reach an annual reduction of €3 billion by 2013. This is consistent with
the lower level of growth and demand in the economy.
Investment will continue in line with the principles set out in the Government’s
Infrastructure Investment Priorities report and will focus on:
- Strategic STI investment at the core of the Smart Economy;
- The Enterprise Development Agencies;
- Water services investment;
- Key strategic transport infrastructure;
- Education capital investment;
- Energy efficiency supports;
- Health capital investment;
- Essential investment in housing infrastructure, including important
regeneration projects; and
- Funding to boost the tourism sector.
The introduction of water metering by 2014 will start to reduce the level of public
capital funding required for water services.
The Government will identify the opportunity for infrastructure investment by the
NPRF and other private investors. An appropriate level of investment by the
Commercial State Bodies will also assist recovery.
5.1 Overview
Annual capital spending quadrupled between 1997 and 2008 and the infrastructure delivered
throughout the period represents a tangible legacy of the economic boom. The infrastructure deficit
which previously characterised the Irish economy has been significantly addressed. In particular, the
programme of investment has transformed the quality and quantity of the national road network and
we now have state-of-the-art motorway connections between Dublin and the main regional centres.
The expanded capacity levels achieved in infrastructure overall are likely to be sufficient to meet
anticipated demand over the medium term in most areas.
The progress registered in this area in recent years was achieved in the context of a much
strengthened public capital investment framework. Successive National Development Plans, the
82
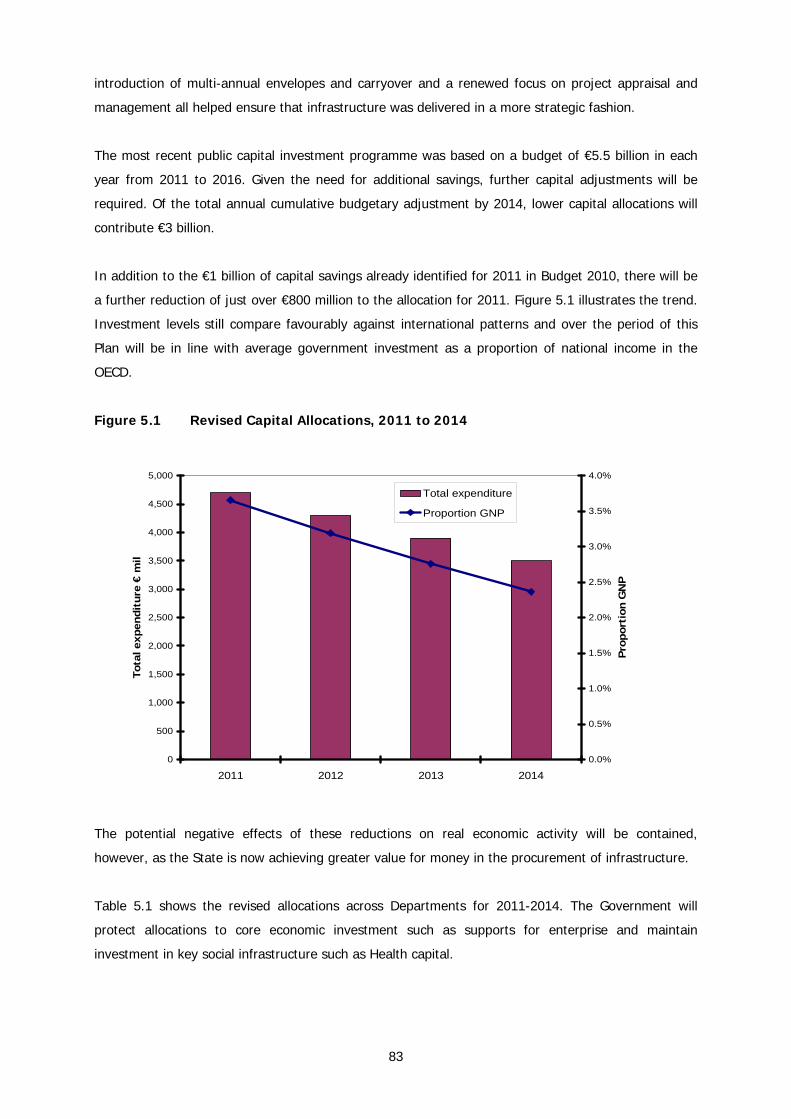
introduction of multi-annual envelopes and carryover and a renewed focus on project appraisal and
management all helped ensure that infrastructure was delivered in a more strategic fashion.
The most recent public capital investment programme was based on a budget of €5.5 billion in each
year from 2011 to 2016. Given the need for additional savings, further capital adjustments will be
required. Of the total annual cumulative budgetary adjustment by 2014, lower capital allocations will
contribute €3 billion.
In addition to the €1 billion of capital savings already identified for 2011 in Budget 2010, there will be
a further reduction of just over €800 million to the allocation for 2011. Figure 5.1 illustrates the trend.
Investment levels still compare favourably against international patterns and over the period of this
Plan will be in line with average government investment as a proportion of national income in the
OECD.
Figure 5.1 Revised Capital Allocations, 2011 to 2014
0
500
1,000
1,500
2,000
2,500
3,000
3,500
4,000
4,500
5,000
2011 2012 2013 2014
Tota
l exp
endi
ture
€ m
il
0.0%
0.5%
1.0%
1.5%
2.0%
2.5%
3.0%
3.5%
4.0%
Pro
por
tion
GN
P
Total expenditure
Proportion GNP
The potential negative effects of these reductions on real economic activity will be contained,
however, as the State is now achieving greater value for money in the procurement of infrastructure.
Table 5.1 shows the revised allocations across Departments for 2011-2014. The Government will
protect allocations to core economic investment such as supports for enterprise and maintain
investment in key social infrastructure such as Health capital.
83
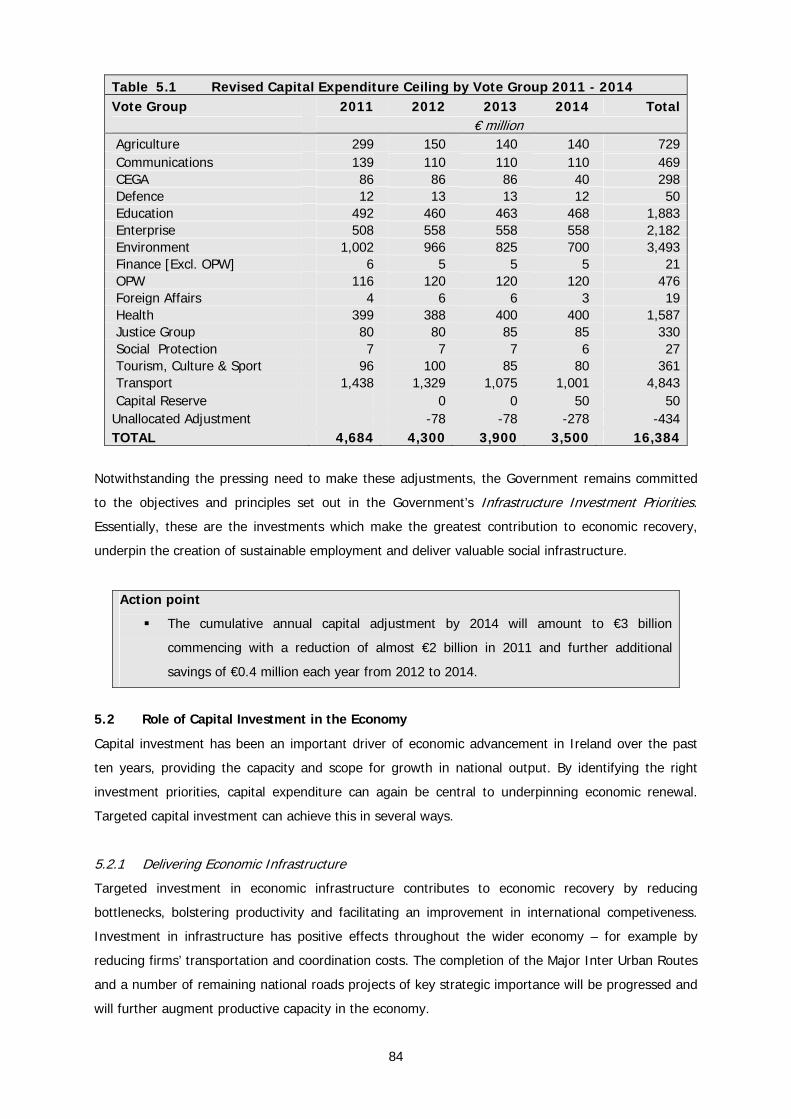
Table 5.1 Revised Capital Expenditure Ceiling by Vote Group 2011 - 2014 Vote Group 2011 2012 2013 2014 Total € million Agriculture 299 150 140 140 729 Communications 139 110 110 110 469 CEGA 86 86 86 40 298 Defence 12 13 13 12 50 Education 492 460 463 468 1,883 Enterprise 508 558 558 558 2,182 Environment 1,002 966 825 700 3,493 Finance [Excl. OPW] 6 5 5 5 21 OPW 116 120 120 120 476 Foreign Affairs 4 6 6 3 19 Health 399 388 400 400 1,587 Justice Group 80 80 85 85 330 Social Protection 7 7 7 6 27 Tourism, Culture & Sport 96 100 85 80 361 Transport 1,438 1,329 1,075 1,001 4,843 Capital Reserve 0 0 50 50Unallocated Adjustment -78 -78 -278 -434TOTAL 4,684 4,300 3,900 3,500 16,384
Notwithstanding the pressing need to make these adjustments, the Government remains committed
to the objectives and principles set out in the Government’s Infrastructure Investment Priorities.
Essentially, these are the investments which make the greatest contribution to economic recovery,
underpin the creation of sustainable employment and deliver valuable social infrastructure.
Action point
The cumulative annual capital adjustment by 2014 will amount to €3 billion
commencing with a reduction of almost €2 billion in 2011 and further additional
savings of €0.4 million each year from 2012 to 2014.
5.2 Role of Capital Investment in the Economy
Capital investment has been an important driver of economic advancement in Ireland over the past
ten years, providing the capacity and scope for growth in national output. By identifying the right
investment priorities, capital expenditure can again be central to underpinning economic renewal.
Targeted capital investment can achieve this in several ways.
5.2.1 Delivering Economic Infrastructure
Targeted investment in economic infrastructure contributes to economic recovery by reducing
bottlenecks, bolstering productivity and facilitating an improvement in international competiveness.
Investment in infrastructure has positive effects throughout the wider economy – for example by
reducing firms’ transportation and coordination costs. The completion of the Major Inter Urban Routes
and a number of remaining national roads projects of key strategic importance will be progressed and
will further augment productive capacity in the economy.
84

Further targeted investment in public transport has the potential to unlock productive capacity in the
economy and enhance national competitiveness. Such investment will also offer alternatives to car
transport, thereby reducing emissions and enabling the transport sector to cater for the demands
associated with longer term population and employment growth in a sustainable manner. Key
objectives of public transport investment will be to advance public transport projects like Metro North
and Dart Underground, as well as rail safety and traffic management programmes and continued
planning of future priorities.
Steps will also be taken to facilitate greater private sector investment in broadband capacity.
5.2.2 Supporting Employment
As discussed in Chapter 3, a guiding principle of the expenditure adjustments set out in this Plan is
that future capital investment must be targeted and employment-focused. The primary focus of
investment must be on creating the framework conditions in which the enterprise sector can thrive in
the medium to long-term. In this regard, public capital investment will have its greatest impact in
maintaining sufficient capacity in the economy and supporting productivity enhancements.
The programmes supported by Department of Enterprise, Trade and Innovation and its agencies will
be critical in achieving a return to economic growth through promoting the export potential of
enterprise in Ireland and advancing the Smart Economy Agenda. These agencies will be flexible and
adaptive to the needs of their client base while maintaining the highest standards in investment
project appraisal. In addition, future policy will focus heavily on commercialisation of research outputs.
Capital investment will therefore support direct job creation in world-class, export-oriented
enterprises.
There will also be a level of direct job creation during the delivery phase of valuable public
infrastructure. This will assist in retaining a level of employment and expertise in the construction
industry. In particular the National Retrofit Programme will give rise to a considerable level of jobs in
the construction sector on a nationwide basis.
5.2.3 Development of an Environmentally Sustainable Economy
This Plan provides for programmes of investment in water services, in waste infrastructure, in the
National Retrofit scheme and in certain research and development programmes which can assist in
the development of a low-carbon sustainable economy.
5.2.4 Investment in Water
Water services investment continues to be a key priority for Government and can deliver significant
returns. We intend to prioritise investment in this area to achieve and maintain compliance with
various requirements (including those arising from the implementation of the EU Water Framework
Directive), to address issues in relation to the condition of water infrastructure in key urban centres
85

and to meet future demand requirements. Policy in this area is also geared toward reducing the level
of water lost through leakages in the distribution network. It is intended that by 2014 this investment
will begin to be part funded by water charges.
Water billing for domestic customers will be made on the basis of metered charges. This will require a
nationwide project to install meters in domestic residences. The Department of Finance and the
Department of the Environment, Heritage and Local Government have been in discussions with the
NPRF regarding the funding of the domestic meter installation programme. The NPRF has agreed in
principle to fund this programme up to an amount of €550 million subject to certain pre-conditions
and in keeping with its commercial statutory remit. It is recognised by Government that a crucial
element of implementing this initiative will be the appointment of a Water Regulator.
The intended introduction of water charges by 2014 will start to reduce the level of general
government investment required and lead to significant capital expenditure savings.
5.2.5 Delivery of Important Social Infrastructure
The capital allocations set out in this Plan will allow the continued development of social
infrastructure, particularly through the delivery of key projects in the education and health sectors and
social housing (including regeneration). The stock of educational capital has been very significantly
upgraded by investment in school building and maintenance and expansion and upgrading of third
level facilities and research space. Demographic developments will exert further pressure on our stock
of schools over the coming years. A significant level of funding will be made available to the primary
and secondary schools programmes over the medium-term. Given falling land values and tender
prices, this funding will make it possible to meet demographic needs and provide for some
improvement to the stock of educational capital in real terms. Investment will also build on the
already substantial stock of higher education infrastructure.
This Plan provides for the continued modernisation of health facilities to ensure efficient delivery of
quality services in the face of demographic factors and a more stringent regulatory environment. All
future capital investment in this area will be consistent with broad policy goals in relation to
developing capacity in the primary community and continuing care areas and in modernising acute
facilities. A substantial level of funding will be maintained into the medium-term. Given the enhanced
opportunities for value for money, this will facilitate a considerable upgrade of infrastructure in real
terms.
5.3 NPRF Approach to Infrastructure Investment In May 2010, the NPRF Commission agreed to allocate 5% of the NPRF Discretionary portfolio to
infrastructure investment, an increase from the initial strategic allocation of 2%.
86
The sector’s typical investment characteristics of long duration assets with stable yield dominated
returns make it highly compatible with the cash flow requirements of a reserve fund such as the
NPRF.
The key attractions of the asset class are summarised below:
Long term horizon.
Stable cash flows.
Low volatility.
Potential for inflation linked returns.
Increased portfolio diversification.
Operating within the commercial mandate prescribed by its statutory remit, the preferred initial
approach of the NPRF is to invest up to €500 million alongside third party institutional investors in
infrastructure assets in Ireland. From a Government perspective, this approach offers social and
economic benefits that will accrue in Ireland from further investment in infrastructure.
Initially the NPRF envisages this investment will entail the purchase of existing assets and over the
medium term may include investing in new infrastructure. The NPRF has agreed to support the water
metering programme on commercial grounds. The Government believes that there are commercial
opportunities in the area of retro-fitting for the National Pensions Reserve Fund. Public transport
investments also represent an opportunity in this context.
Action point The Government will help identify public infrastructure investment opportunities for the
NPRF and other private investors.
5.4 Investment by Commercial State Bodies
Investment by a range of Commercial State Bodies in particular the State energy companies will also
enhance productivity and assist in the process of economic recovery.
In the years 2010 to 2014, capital investment by the ESB will be over €6 billion. This investment will
prioritise:
Reinforcement and modernisation of Distribution Networks .
Strengthening and adding capacity to the Transmission Network by Eirgrid.
Smart Grid, Smart Meter and Electric Vehicle infrastructure.
Renewable Power Generation.
Existing Renewable/ Energy Efficiency Initiatives.
87

Bórd Gáis will invest in the region of €1.3 billion which will target:
Extension of its transmission and distribution natural gas network.
Developing new renewable wind generation assets.
Continuing to build a vertically integrated energy business.
Increased activities in Research and Development.
Eirgrid will also make the substantial investment of €600 million in the East-West Interconnector
which is on schedule for completion by 2012.
As noted in Chapter 2, these investment plans will be continuously critically assessed in order to avoid
excess capacity and excessive cost.
Considering the progress made in overhauling the national stock of infrastructure in recent years and
the greatly enhanced value for money available in capital investment at present, a considerable level
of investment can be delivered while still making significant Exchequer savings over the course of this
Plan.
88
Chapter 6 Taxation Measures
KEY MESSAGES
Revenue measures will provide one third of the budgetary adjustment.
40% of total revenue measures will be adopted in 2011.
The income tax system is unsustainable if 45% of tax units pay no income tax.
Radical base broadening across the tax system is needed.
All taxpayers must contribute.
By overhauling tax expenditures, those that can afford to pay more will pay more.
Tax policy emphasis must be on sustainable structural reform.
Funding of local service provision must be addressed.
The Government will maintain the 12½% rate of corporation tax.
Supports for small and medium enterprises will be reformed.
6.1 Introduction
The primary function of the tax system is to provide the resources to finance public expenditure.
Taxation policy can also be used to incentivise growth, promote income and wealth redistribution and
address social and environmental concerns. An efficient tax system must seek to minimise compliance
costs and collection costs, while targeting tax avoidance and evasion.
The tax system of the future must be capable of raising the resources necessary to meet public
demands in a manner that does not unduly impede economic development and maximises our
economic growth potential. An economy that performs well also generates the resources necessary to
meet policy ambitions. Decisions on taxation must take account of their economic effects and, as far
as possible, must not weaken our ability to grow.
For this reason this Plan places two thirds of the required adjustment on expenditure (€10 billion) and
one third of the adjustment on extra revenue principally through taxation (€5 billion). It is broadly
accepted that this distribution of the burden of adjustments is less damaging to our future economic
prospects than if it were more heavily placed on taxation.33
6.2 Approach
In raising the revenue necessary to underpin the overall Plan, revenue stability is important. All the
measures must be credible; they must structurally reform aspects of the tax system and they must
minimise distortions or undue impediments to economic recovery.
33 “Macroeconomic Effects of Fiscal Consolidation” by Daniel Leigh, IMF, 2010.
89
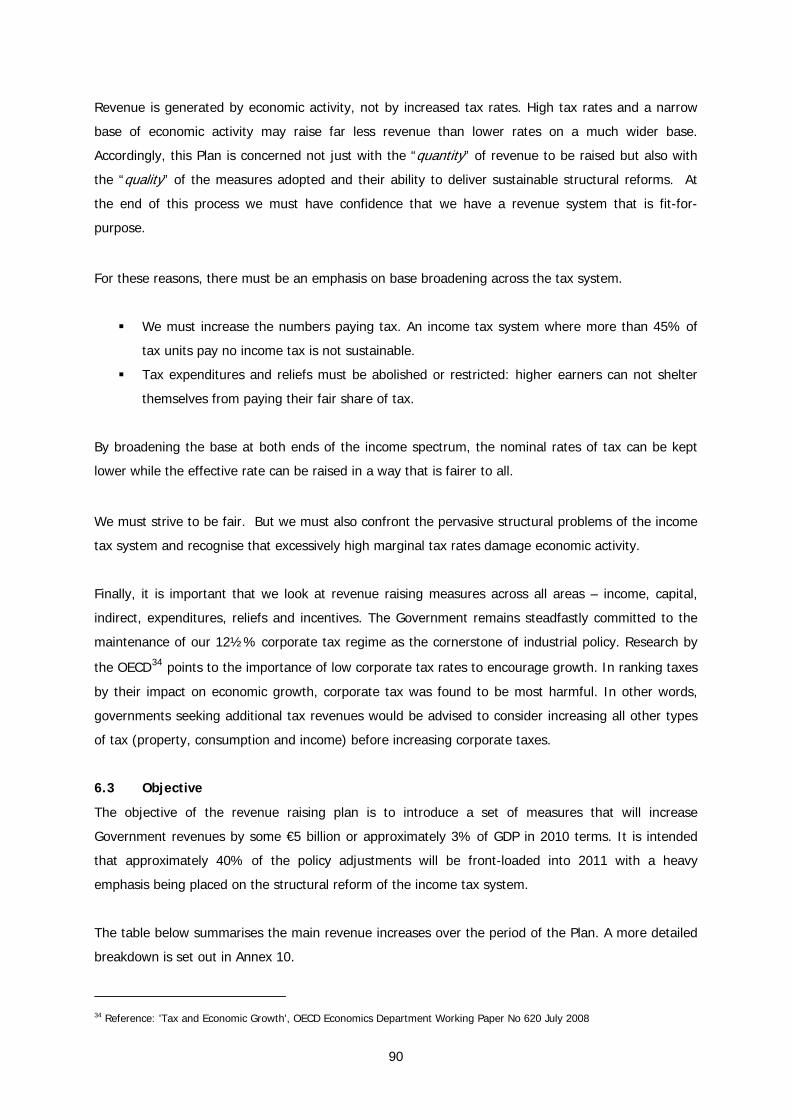
Revenue is generated by economic activity, not by increased tax rates. High tax rates and a narrow
base of economic activity may raise far less revenue than lower rates on a much wider base.
Accordingly, this Plan is concerned not just with the “quantity” of revenue to be raised but also with
the “quality” of the measures adopted and their ability to deliver sustainable structural reforms. At
the end of this process we must have confidence that we have a revenue system that is fit-for-
purpose.
For these reasons, there must be an emphasis on base broadening across the tax system.
We must increase the numbers paying tax. An income tax system where more than 45% of
tax units pay no income tax is not sustainable.
Tax expenditures and reliefs must be abolished or restricted: higher earners can not shelter
themselves from paying their fair share of tax.
By broadening the base at both ends of the income spectrum, the nominal rates of tax can be kept
lower while the effective rate can be raised in a way that is fairer to all.
We must strive to be fair. But we must also confront the pervasive structural problems of the income
tax system and recognise that excessively high marginal tax rates damage economic activity.
Finally, it is important that we look at revenue raising measures across all areas – income, capital,
indirect, expenditures, reliefs and incentives. The Government remains steadfastly committed to the
maintenance of our 12½% corporate tax regime as the cornerstone of industrial policy. Research by
the OECD34 points to the importance of low corporate tax rates to encourage growth. In ranking taxes
by their impact on economic growth, corporate tax was found to be most harmful. In other words,
governments seeking additional tax revenues would be advised to consider increasing all other types
of tax (property, consumption and income) before increasing corporate taxes.
6.3 Objective
The objective of the revenue raising plan is to introduce a set of measures that will increase
Government revenues by some €5 billion or approximately 3% of GDP in 2010 terms. It is intended
that approximately 40% of the policy adjustments will be front-loaded into 2011 with a heavy
emphasis being placed on the structural reform of the income tax system.
The table below summarises the main revenue increases over the period of the Plan. A more detailed
breakdown is set out in Annex 10.
34 Reference: 'Tax and Economic Growth', OECD Economics Department Working Paper No 620 July 2008
90
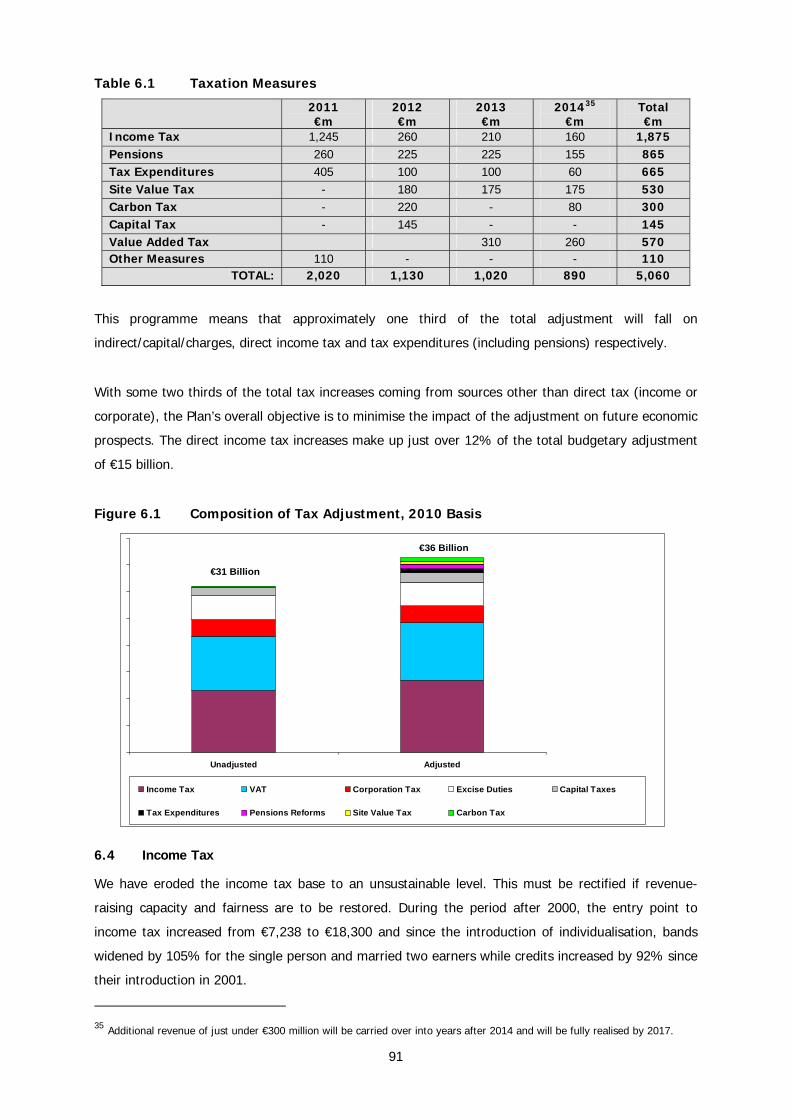
Table 6.1 Taxation Measures
2011 €m
2012 €m
2013 €m
201435 €m
Total €m
Income Tax 1,245 260 210 160 1,875 Pensions 260 225 225 155 865 Tax Expenditures 405 100 100 60 665 Site Value Tax - 180 175 175 530 Carbon Tax - 220 - 80 300 Capital Tax - 145 - - 145 Value Added Tax 310 260 570 Other Measures 110 - - - 110
TOTAL: 2,020 1,130 1,020 890 5,060
This programme means that approximately one third of the total adjustment will fall on
indirect/capital/charges, direct income tax and tax expenditures (including pensions) respectively.
With some two thirds of the total tax increases coming from sources other than direct tax (income or
corporate), the Plan’s overall objective is to minimise the impact of the adjustment on future economic
prospects. The direct income tax increases make up just over 12% of the total budgetary adjustment
of €15 billion.
Figure 6.1 Composition of Tax Adjustment, 2010 Basis
Unadjusted Adjusted
Income Tax VAT Corporation Tax Excise Duties Capital Taxes
Tax Expenditures Pensions Reforms Site Value Tax Carbon Tax
€31 Billion
€36 Billion
6.4 Income Tax
We have eroded the income tax base to an unsustainable level. This must be rectified if revenue-
raising capacity and fairness are to be restored. During the period after 2000, the entry point to
income tax increased from €7,238 to €18,300 and since the introduction of individualisation, bands
widened by 105% for the single person and married two earners while credits increased by 92% since
their introduction in 2001.
35 Additional revenue of just under €300 million will be carried over into years after 2014 and will be fully realised by 2017.
91
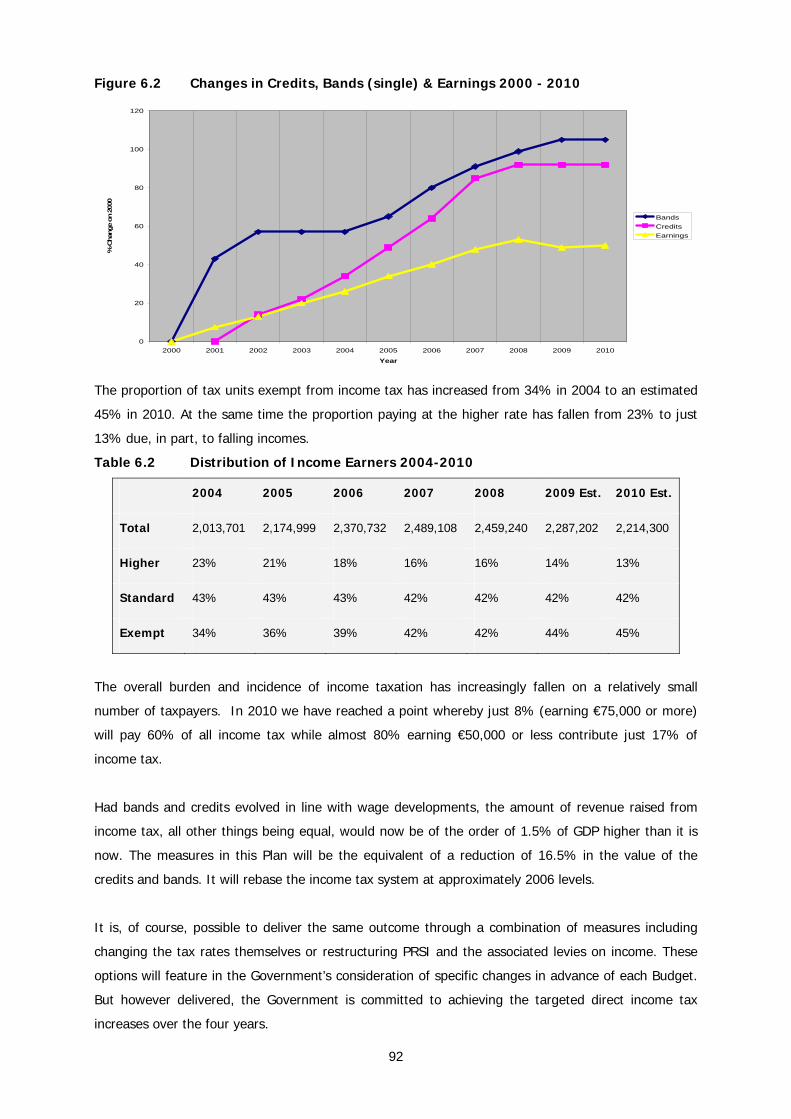
Figure 6.2 Changes in Credits, Bands (single) & Earnings 2000 - 2010
0
20
40
60
80
100
120
2000 2001 2002 2003 2004 2005 2006 2007 2008 2009 2010
Year
% C
hang
e on
200
0
BandsCreditsEarnings
The proportion of tax units exempt from income tax has increased from 34% in 2004 to an estimated
45% in 2010. At the same time the proportion paying at the higher rate has fallen from 23% to just
13% due, in part, to falling incomes.
Table 6.2 Distribution of Income Earners 2004-2010
2004 2005 2006 2007 2008 2009 Est. 2010 Est.
Total 2,013,701 2,174,999 2,370,732 2,489,108 2,459,240 2,287,202 2,214,300
Higher 23% 21% 18% 16% 16% 14% 13%
Standard 43% 43% 43% 42% 42% 42% 42%
Exempt 34% 36% 39% 42% 42% 44% 45%
The overall burden and incidence of income taxation has increasingly fallen on a relatively small
number of taxpayers. In 2010 we have reached a point whereby just 8% (earning €75,000 or more)
will pay 60% of all income tax while almost 80% earning €50,000 or less contribute just 17% of
income tax.
Had bands and credits evolved in line with wage developments, the amount of revenue raised from
income tax, all other things being equal, would now be of the order of 1.5% of GDP higher than it is
now. The measures in this Plan will be the equivalent of a reduction of 16.5% in the value of the
credits and bands. It will rebase the income tax system at approximately 2006 levels.
It is, of course, possible to deliver the same outcome through a combination of measures including
changing the tax rates themselves or restructuring PRSI and the associated levies on income. These
options will feature in the Government’s consideration of specific changes in advance of each Budget.
But however delivered, the Government is committed to achieving the targeted direct income tax
increases over the four years.
92

Over the course of this Plan it is intended fundamentally to reform the income tax system. The
merging of the income levy, the health levy and PRSI into a Universal Social Charge was signalled in
Budget 2010. The proposed wide scale abolition of reliefs and incentives (see below) will also facilitate
the progressive rationalisation of how we tax income by more clearly aligning the income base for
each charge. This will enable movement to a unitary income tax system and facilitate the closer
integration of tax and social welfare over the Plan period.
Action Points
Measures raising €1.9 billion equivalent to a reduction of 16.5% in the value of the
credits and bands will be delivered over the Plan period.
Fundamental reform of the income tax system and closer integration of tax and
welfare.
Approximately 65% of the total income tax adjustment to be delivered in 2011.
6.5 Pensions Tax Expenditures
The total gross tax cost of pension tax relief is just over €2.5 billion. Exemptions relating to PRSI and
the Health Levy cost an additional €250 million or so. Public discourse about the cost of pension tax
relief has been ill-informed and tends to distort the expectations of the savings that could be delivered
by adjusting these reliefs.
There are three significant elements in the estimates of the cost of tax and PRSI/Health Levy reliefs
for private pension provision as outlined in the Green Paper on Pensions. These are:
i. the estimated costs of tax relief on employee/self-employed/individual contributions to
pension savings (over €1 billion),
ii. the estimated cost of the tax exemption for employer contributions as Benefit–in–Kind (BIK)
in the hands of employees (about €500 million),
iii. the estimated cost of exempting from tax the accrued income and gains growth of pension
funds (about €1 billion).
Reducing income tax relief on pension contributions to the standard income tax rate would only
impact on employee/self-employed/individual contributions to pension savings and the full year saving
from this would amount to about €500 million. Abolishing tax relief on employee/individual
contributions would save the Exchequer about €1 billion in a full year. None of these reforms takes
account of the behavioural change which would likely result from tax changes of this magnitude.
The estimated cost of tax exemption on the accrued income and gains of pension funds is a “notional
or imputed” cost. It is in effect deferred income tax – the fund rolls up gross to provide a higher
pension value which is then taxed in the hands of the pensioners as the pension is paid. Imposing an
actual tax charge on pension fund growth would not yield anything like €1 billion and would effectively
reduce the pension in the hands of the pensioner and the tax take at that point. Furthermore,
93
removing the BIK exemption from employer contributions to occupational pension schemes would
remove the rationale for making those contributions in the first place from the point of view of the
employee.
It is not the case that only those on higher incomes benefit from pension relief. The bulk of
employee/individual pension contributions attract tax relief at the marginal or 41% tax rate. This is
reflected in the fact that individuals on gross earnings of not much over the average industrial wage
and contributing to a pension arrangement benefit from tax relief at 41%. Some studies have
suggested that the current tax arrangements are most beneficial to those on earnings of about
€45,000 per annum (Life Strategies, May 2008).
The abolition of employee PRSI and Health Levy relief would bring the treatment of pension
contributions in this area into line with the Income Levy treatment. Equity of the existing tax
arrangements could be improved by further downward adjustments to the annual earnings cap for
pension contribution purposes and to the maximum allowable lifetime limit for a tax-relieved pension
fund (the Standard Fund Threshold – SFT), both adjustments would impact on higher earners.
The Plan provides for the elimination of employee PRSI and Health Levy relief on pension
contributions in 2011. It also commits, among other changes in 2011, to reducing the annual earnings
cap for employee/personal pension contributions by almost 25% from €150,000 to €115,000 and to
reducing the SFT. These measures combined will yield approximately €200 million in a full year. Over
the following 3 years of the Plan the rate of income tax relief on pension contributions will be reduced
from 41% to 34% in 2012, to 27% in 2013 and 20% in 2014. This will yield an average additional
€165 million in each full year giving an overall cumulative reduction in pension tax expenditures of
€700 million. In addition, a consequential reduced rate of relief on the public service “pension-related
deduction” will yield a further €240 million in a full year.
The abolition of employee PRSI and Health Levy relief and the reduction to standard rate tax relief on
pension contributions may reduce saving for private pension provision. However, the Government is
committed to raising €700 million from this sector over the period of the Plan and is willing to engage
with the industry to examine alternatives to deliver this outcome. Pensions tax expenditures will be
kept under constant review to ensure that abusive tax sheltering does not take place.
Action Points
A €700 million full year reduction in pension tax expenditure and €240 million on
relief for the public service “pension-related deduction”.
Removal of PRSI and Health Levy relief on pension contributions in 2011.
Reduction in the annual earnings cap of 25% in 2011.
Phased standard rating of income tax relief over 2012, 2013 and 2014.
94
6.6 General Tax Expenditures
In the same way as there are unrealistic expectations about what pension tax expenditures can
contribute to budgetary correction there is a poor understanding of the scale of tax
expenditures/incentives generally. Commentators often conflate tax expenditures in general with
property based tax expenditures in particular and with those elements of revenue foregone that are
the fabric of the income tax system.
There is frequent reference to the OECD proposition that by 2005 the cost of “tax expenditures” had
become larger than the remaining income tax receipts. The figure published by the OECD put the
value of tax expenditures at €11.49 billion. An analysis of these figures shows that:
80% or €9.72 billion of all the tax expenditures relate to personal allowances/credits/bands,
pensions and savings;
Of the remainder, ‘interest relief’ at €350 million and some portion of the €980 million for
"social schemes" (urban/rural renewal etc) relate to property; and
This leaves a balance of approximately €440 million in miscellaneous tax
expenditures/incentives on the basis of the OECD estimate.
Most public commentary on this issue either misunderstands or ignores how these “expenditures” are
broken down. Indeed, the Commission on Taxation did not regard a very large part of these costs to
be tax expenditures, but rather part of the fabric of the income tax system (bands, allowances,
personal credits)36.
The tax costs associated with pensions and personal allowance/bands/credits, which make up 80% of
the estimated expenditures, have been addressed earlier.
Interest relief on residential mortgages was abolished in Budget 2010 with a gradual phasing out of
mortgage interest relief (MIR) up to end of 2017. Loans taken out on or after 1 January 2013 will not
qualify for MIR and the relief will be abolished completely for the tax year 2018 and subsequent tax
years. The full year saving will be €485 million. Any acceleration of the withdrawal of interest relief
would place unacceptable financial pressures on households with the highest risks of being in negative
equity. Any move in this direction would increase the risk of default. There will be no change to
current arrangements.
Budget 2006 announced the termination, subject to certain transitional provisions, of Urban Renewal;
Town Renewal; Rural Renewal; Accelerated Capital Allowances for Hotels; Capital Allowances for
Holiday Cottages; Student Accommodation; Multi-Storey Car Parks; Third-level Educational Buildings;
Sports Injuries Clinics; Park and Ride Facilities and General Rental Refurbishment Schemes.
36 Page 11, Commission on Taxation Report.
95

Transitional arrangements provided for an extension of the deadline to 31 July 2008 for projects
already in the pipeline where planning application conditions had been met. In addition, the amount
of capital allowances available would be reduced to 75% in 2007 and 50% in 2008. Since 2006, most
of the remaining property reliefs in the health and childcare areas have been abolished with similar
transitional arrangements.
Given the structure of these schemes there are ongoing legacy costs as investors use their capital
allowances. Those legacy costs will reduce with time as capital allowances are exhausted. The
restriction of reliefs measure introduced in 2007 (and further enhanced in 2010) also curtails the
ability of individuals to utilise these reliefs, thereby spreading the costs over a much longer period.
In current circumstances, it is no longer acceptable that measures abolished as far back as 2006
should continue to cost almost €400 million per annum. Accordingly, the Government is committed (in
line with the Revised Programme for Government) to the phased abolition of these legacy reliefs over
the period of the Plan.
As regards other tax expenditures, the Plan provides for the abolition of ten tax expenditures and the
curtailment of a further six in Budget 2011. Over the remainder of the period 2012-14 tax
expenditures will be kept under constant review with a view to further eliminating them from the tax
system.
The measures to be abolished in 2011 are:
1 Tax exemption for patent royalties.
2 The investment allowance for machinery and plant and for exploration expenditure.
3 Approved Share Options Scheme.
4 BIK exemption on employer provided childcare.
5 The accelerated allowance for capital expenditure on farm buildings for pollution control.
6 The tax exemption for payments to National Co-operative Farm Relief Services Ltd.
7 Income tax relief for rent paid for private rented accommodation.37
8 Income tax relief for trade union subscriptions.
9 Income Tax Age Credit (phased over 4 years).
10 Income Tax Age Exemptions (phased over 4 years).
These measures will yield an estimated €280 million in a full year.
37 Phase out on same timeline as MIR. 96
A further six expenditures will be curtailed or otherwise restricted as follows:
11 PRSI, Health and Income Levy charge on Approved Profit Sharing Schemes.
12 PRSI, Health and Income Levy charge on Approved Save-As-You-Earn Schemes.
13 PRSI, Health Levy charge for Unapproved Share Options.
14 PRSI, Health Levy charge for Share Awards.
15 Artist’s exemption from Income Tax (Restrict exemption to €40,000 earnings).
16 Ex-gratia termination and pension lump sum payments in excess of €200,000 to be taxed.
These measures will yield an estimated further €75 million in a full year.
Action Points
A €755 million full year reduction in general tax expenditures.
Some €355 million of income tax expenditures will be abolished/curtailed in 2011.
Legacy costs associated with property based incentives worth €400 million will be
phased out over the period of the Plan.
Expenditures will progressively be reviewed and removed from the system.
6.7 Value Added Tax and Indirect Tax
The level of indirect tax in Ireland is higher than average, with excise duties being especially high.
Notwithstanding this, it is accepted that increases in indirect tax are less economically damaging than
direct tax increases as they affect consumption rather than production.
Cross-border trade risks are now less than they may have been in the recent past. VAT rates have
increased across Europe in response to the current crisis with some 23 Member States now having
rates of 19% or more (including the UK who will be at 20% from 4 January 2011).
Accordingly, it is intended to increase the standard rate of VAT from 21% to 22% in 2013 with a
further increase to 23% in 2014. The lower rate on labour intensive services will be left unchanged as
any increase could harm employment. The Government will also examine further rebalancing of the
VAT system and zero rated VAT items within the context of wider and ongoing EU level consideration
of the matter.
In addition to this, a number of changes will be made to excise duties and licences in 2011 to the
value of €110 million.
Action Points
Standard rate of VAT to be increased by 1% in 2013.
A further 1% increase in the standard rate of VAT in 2014.
These VAT measures will increase yield by €620 million in a full year.
97
Zero rated VAT items to be reviewed as part of EU level consideration.
Miscellaneous 2011 excise measures amounting to €110 million in a full year.
6.8 Financing Local Services
One of the fundamental challenges we face is to put the funding of locally delivered services on a
sound financial footing, to improve accountability and to better align the cost of providing services
with the demand for such services.
The Plan commits to a funding platform for local Government on a phased basis. An interim Site Value
Tax will be introduced in 2012, applicable to all land other than agricultural land and land subject to
commercial rates. The interim measure will involve a fixed local service contribution of about €100 per
annum (€2 per week) which will raise €180 million from households. The final Site Value Tax will be
introduced in 2013 when valuations have been completed.
It is estimated that Site Value Tax will apply to 1.8 million households and zoned lands that would
equate to an estimated further 700,000 houses. At an average of just over €200 per dwelling (or site)
this would raises the €530 million full year amount targeted for the Plan period.
For full implementation of the tax, commercial rates will be moved to a site value basis also.
These measures will have significant implications for the financing of local authorities, including a
lower contribution from the Exchequer and from motor tax revenues.
The Government revised the vehicle registration tax and motor tax systems on cars to be based on
the CO2 emissions of the vehicle, rather than on engine size, with effect from 1 July 2008. This
change has been highly successful in encouraging people to purchase lower emissions cars. However,
the change in purchasing patterns, combined with other factors, is having an impact on revenue
yields, especially in the case of motor tax over the medium term.
During the Plan the current CO2 bands and rates structures will be examined in the light of the overall
reductions in CO2 emission levels being made by car manufacturers and the standards set
internationally with a view to adjusting the bands in line with technological advances on 1 January
2013.
Action Points
A Site Value Tax will be introduced in 2012 and completed by 2013
o An interim fixed “household charge” of €100 per annum in 2012.
o A full value-based addition will be introduced in 2013.
These measures will yield €530 million in a full year.
98
6.9 Carbon Tax
The economic and social implications of climate change are immense and it is the responsibility of
Governments everywhere to change behaviour to reduce our greenhouse gas emissions. The most
effective way to achieve this is to put a price on carbon. This will encourage innovation by
incentivising companies to bring low carbon products and services to the market. Accordingly, a
carbon tax was introduced at a rate of €15 per tonne in the 2010 Budget.
But changing behaviour takes time. It is important to reinforce and encourage behavioural change
through a gradual and progressive upward adjustment in the price penalty associated with the
consumption of carbon.
It is proposed that over the period of this Plan the price of carbon will be doubled to €30 per tonne
thereby contributing €330 million to the overall correction. This will entail a €10 per tonne increase in
2012 and a further €5 per tonne in 2014.
Carbon taxes will be a feature of economies across the world in the coming years. At a time when
national Budgets are under pressure, it makes sense to choose tax options that can have external
benefits such as reducing import dependency, reducing emissions and driving innovation.
A rate of €30 per tonne at the end of four years confirms Ireland’s commitment to pricing carbon at a
rate that can have positive and lasting domestic benefits and contribute to lowering Ireland’s share of
global emissions that remain a risk to future generations.
Action Points
The price of carbon will be doubled over four years.
The price will be progressively increased from €15 to €30 per tonne.
These measures will yield €330 million.
6.10 Capital Taxation
In recent Budgets the rates for Capital Gains Tax (CGT) and Capital Acquisitions Tax (CAT) were
increased from 20% to 25% and the DIRT rate now stands at 25% and 28% for savings products
with less frequent payment of interest.
The Plan envisages that this process will continue. The base for CGT and CAT will be broadened while
the level of reliefs and exemptions for these taxes will be reduced. In 2012, the current single CGT
rate of 25% will be changed to a system of differing rates for different levels of gains. A similar
system will be introduced for CAT where the current tax-free thresholds will be reduced to reflect the
fall on asset values over recent years and the very generous nature of these thresholds.
99

In line with the commitments on tax expenditures in this Plan, reliefs and exemptions from CGT, CAT
and Stamp Duty will either be abolished or greatly restricted to ensure that there is an adequate base
for these taxes and that all of society makes a fair contribution to the correction of the public finances.
A cautious estimated yield of just €145 million is included given the uncertainty of current market
conditions and asset price values generally.
Action Points
The structures and thresholds in the CAT and CGT systems will be reformed in 2012.
A range of capital tax expenditure will be curtailed.
These measures will yield €145 million in a full year.
6.11 Corporation Tax
The Irish Government’s position on corporation tax is unambiguous. The Programme for Government
clearly states that the Government guarantees that the 12½% rate of corporation tax will remain.
Nothing is changed by this Plan. That commitment is protected, in an EU context, by the principle of
unanimity in taxation matters.
While taxation has to play a part in restoring balance to our public finances, this will not apply to our
corporation tax rate. A low rate of corporation tax on export-orientated activity has been a
cornerstone of our industrial policy since the 1950s and the 12½% rate is now part of our
international ‘brand’. The contribution from the corporate sector will be made through the
maintenance and creation of high value employment.
The Commission on Taxation recommended that "a low stable corporation tax rate should remain a
core aspect of Irish tax policy to support economic activity in the long term". Ireland’s low corporate
tax rate is based on an open and transparent system that does not discriminate based on company
size or ownership. It is a low tax rate applied to a broad base. Over one thousand manufacturing
companies in Ireland are already experiencing an increase in their corporation tax rate from 10% to
12½% as the transitional provisions of the 10% manufacturing rate of corporation tax come to an
end in 2010.
The Government’s commitment to the maintenance of a competitive and transparent corporate tax
offering has been steadfast over the last three years. Notwithstanding the very real challenges, we
have continued to evolve the regime to support the knowledge economy.
We have used the tax system to support research and development, the acquisition and exploitation
of intellectual property, new start-up companies and to improve corporate energy efficiency. We have
also maintained our competitive position in International Financial Services. These changes have
resulted in continued investment in Ireland by multinational companies that see this country as a good
place to do business. We will continue to work with business for the delivery of the employment that
100

will be the lifeblood of our economic recovery thereby copper-fastening our ability to meet our
financial obligations as a State.
Action Point
There will be no change in the 12½% rate of corporation tax.
6.12 Small and Medium Enterprises
The importance of the role of small and medium sized enterprises in Ireland’s economy cannot be
overestimated. They supply goods and services on which larger companies rely. Small firms directly
support 700,000 jobs.
Over the last two years the Government has placed support for this sector at the heart of its strategy
for economic recovery.
Government is investing in small firms in their earliest stages of development via Enterprise Ireland’s
€175 million seed and venture capital programme and through the €500m Innovation Fund.
The Business Expansion Scheme has been operating for 26 years but funds raised under the Scheme
since 2008 have declined significantly and businesses have complained that the Scheme is too
administratively complex. For these reasons, the Government has decided, subject to European
Commission approval, to transform the old BES Scheme into a new and better-focussed Business
Investments Targeting Employment Scheme (BITES).
A simple and efficient certification process will be introduced. The maximum amount that can be
raised by companies in a 12 month period will be increased significantly, as will the lifetime amount
that can be raised per company.
In addition, some of the money raised from abolishing tax expenditures will be redirected to support
enterprise.
Action Point
A new “Business Investment Targeting Employment Scheme” will be introduced in
2011 to replace BES.
6.13 Impact of the Main Income Tax changes
The impact of this Plan on personal income is set out below. The calculations are based on the
technical assumption that the main adjustment will be made through reductions in personal tax bands
and credits. As discussed elsewhere, this could also be delivered by alternative means with different
results.
101
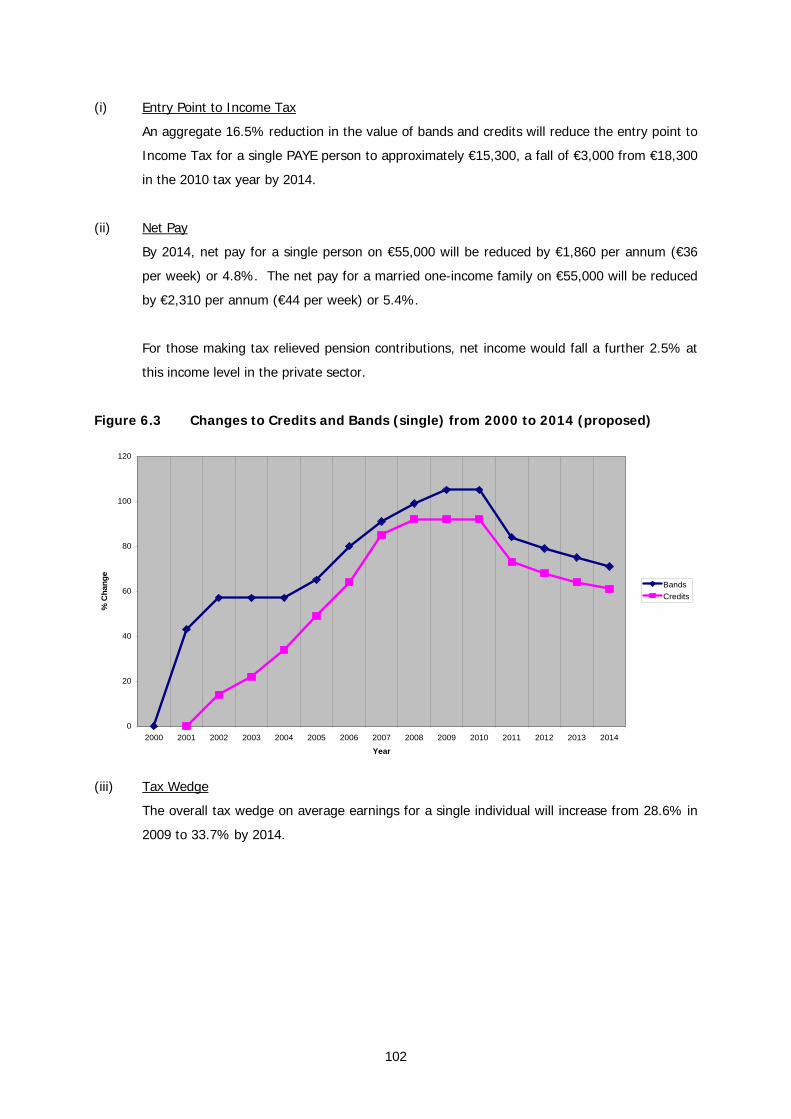
(i) Entry Point to Income Tax
An aggregate 16.5% reduction in the value of bands and credits will reduce the entry point to
Income Tax for a single PAYE person to approximately €15,300, a fall of €3,000 from €18,300
in the 2010 tax year by 2014.
(ii) Net Pay
By 2014, net pay for a single person on €55,000 will be reduced by €1,860 per annum (€36
per week) or 4.8%. The net pay for a married one-income family on €55,000 will be reduced
by €2,310 per annum (€44 per week) or 5.4%.
For those making tax relieved pension contributions, net income would fall a further 2.5% at
this income level in the private sector.
Figure 6.3 Changes to Credits and Bands (single) from 2000 to 2014 (proposed)
0
20
40
60
80
100
120
2000 2001 2002 2003 2004 2005 2006 2007 2008 2009 2010 2011 2012 2013 2014
Year
% C
hang
e
BandsCredits
(iii) Tax Wedge
The overall tax wedge on average earnings for a single individual will increase from 28.6% in
2009 to 33.7% by 2014.
102
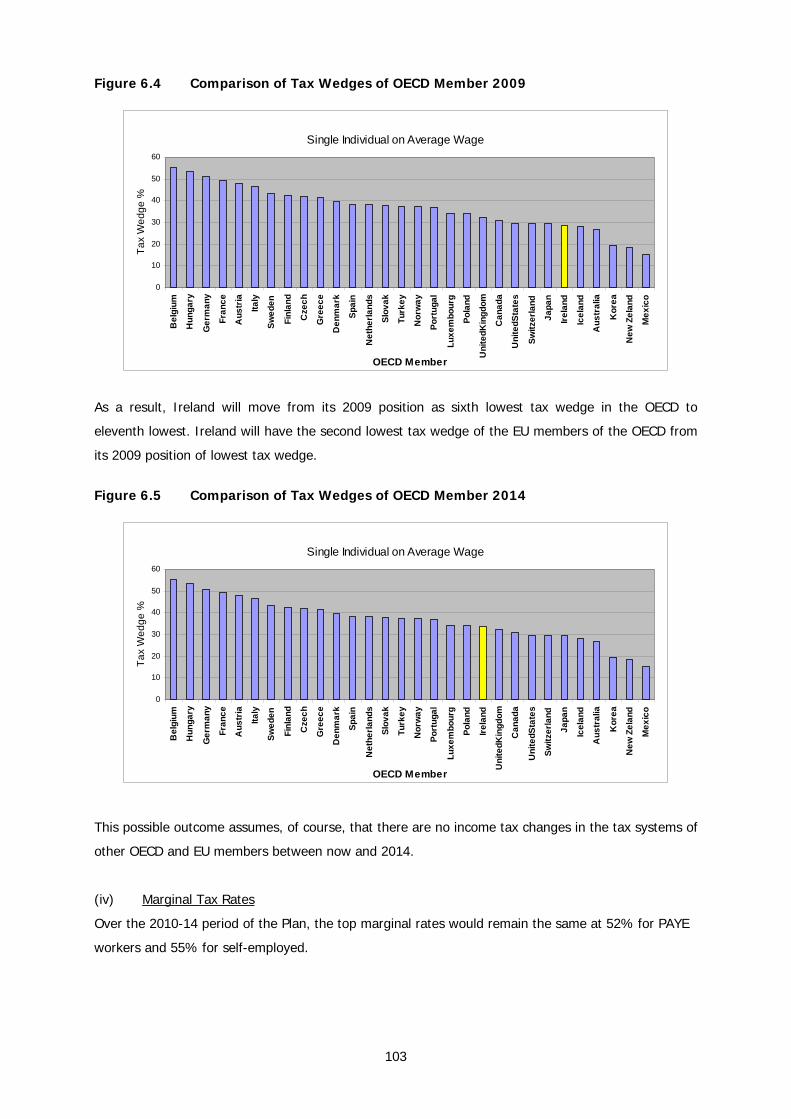
Figure 6.4 Comparison of Tax Wedges of OECD Member 2009
Single Individual on Average Wage
0
10
20
30
40
50
60
Bel
gium
Hun
gary
Ger
man
y
Fran
ce
Aus
tria
Italy
Swed
en
Finl
and
Cze
ch
Gre
ece
Den
mar
k
Spai
n
Net
herla
nds
Slov
ak
Turk
ey
Nor
way
Port
ugal
Luxe
mbo
urg
Pola
nd
Uni
tedK
ingd
om
Can
ada
Uni
tedS
tate
s
Switz
erla
nd
Japa
n
Irela
nd
Icel
and
Aus
tral
ia
Kor
ea
New
Zel
and
Mex
ico
OECD Member
Tax
Wed
ge %
As a result, Ireland will move from its 2009 position as sixth lowest tax wedge in the OECD to
eleventh lowest. Ireland will have the second lowest tax wedge of the EU members of the OECD from
its 2009 position of lowest tax wedge.
Figure 6.5 Comparison of Tax Wedges of OECD Member 2014
Single Individual on Average Wage
0
10
20
30
40
50
60
Bel
gium
Hun
gary
Ger
man
y
Fran
ce
Aus
tria
Italy
Swed
en
Finl
and
Cze
ch
Gre
ece
Den
mar
k
Spai
n
Net
herla
nds
Slov
ak
Turk
ey
Nor
way
Port
ugal
Luxe
mbo
urg
Pola
nd
Irela
nd
Uni
tedK
ingd
om
Can
ada
Uni
tedS
tate
s
Switz
erla
nd
Japa
n
Icel
and
Aus
tral
ia
Kor
ea
New
Zel
and
Mex
ico
OECD Member
Tax
Wed
ge %
This possible outcome assumes, of course, that there are no income tax changes in the tax systems of
other OECD and EU members between now and 2014.
(iv) Marginal Tax Rates
Over the 2010-14 period of the Plan, the top marginal rates would remain the same at 52% for PAYE
workers and 55% for self-employed.
103
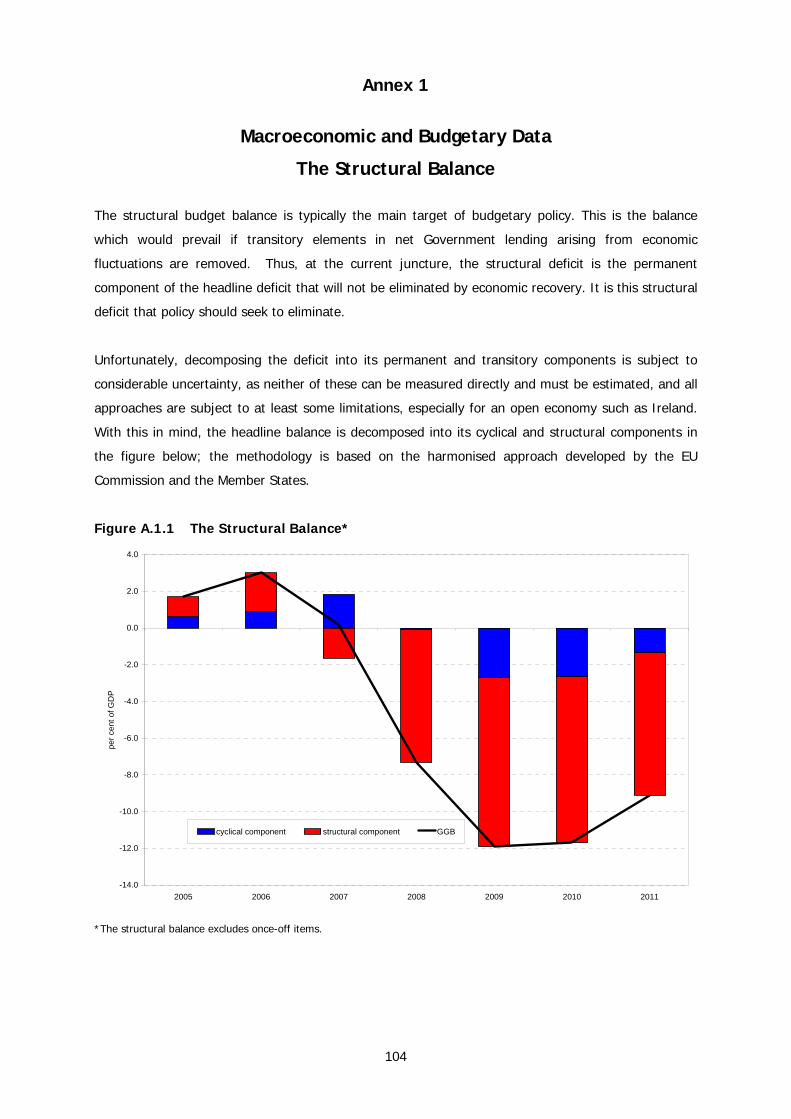
Annex 1
Macroeconomic and Budgetary Data
The Structural Balance The structural budget balance is typically the main target of budgetary policy. This is the balance
which would prevail if transitory elements in net Government lending arising from economic
fluctuations are removed. Thus, at the current juncture, the structural deficit is the permanent
component of the headline deficit that will not be eliminated by economic recovery. It is this structural
deficit that policy should seek to eliminate.
Unfortunately, decomposing the deficit into its permanent and transitory components is subject to
considerable uncertainty, as neither of these can be measured directly and must be estimated, and all
approaches are subject to at least some limitations, especially for an open economy such as Ireland.
With this in mind, the headline balance is decomposed into its cyclical and structural components in
the figure below; the methodology is based on the harmonised approach developed by the EU
Commission and the Member States.
Figure A.1.1 The Structural Balance*
-14.0
-12.0
-10.0
-8.0
-6.0
-4.0
-2.0
0.0
2.0
4.0
2005 2006 2007 2008 2009 2010 2011
per c
ent o
f GD
P
cyclical component structural component GGB
*The structural balance excludes once-off items.
104
Annex 2
Macroeconomic and Budgetary Data
Economic Tables, Technical Analysis, Risks and Sensitivity Analysis
Risks to the Outlook
The current economic environment remains surrounded by considerable uncertainty, both at a
domestic and global level. In Europe as a whole, for example, it is still not clear what impact
consolidation plans will have on activity levels in the coming years, given that sentiment levels have
generally continued on an upward trend since measures were announced. Against this backdrop the
risks surrounding the growth outlook - stabilisation in real GDP this year, followed by moderate output
growth in the period 2011 to 2014 – appear to be broadly balanced. Upside risks to the outlook come
primarily from the external side. In particular, the expectation that exports will increase by an average
of less than 5% over the forecast horizon may turn out to be somewhat pessimistic, given that it is
weaker than the historical relationship between exports and import growth in our main export markets
would suggest. It is also possible that the clarity provided by this plan could result in a more rapid
restoration of domestic confidence than is currently anticipated, while the structural reforms
announced by the Government could see employment recover more rapidly. In general, however,
domestic risks are tilted towards the downside. The most significant of these risks is that households
maintain savings rates at current very high levels which would represent a continued constraint on
personal consumption.
Comparison of Forecasts
Table A.2.1, below, compares the Department of Finance’s 2011 forecasts for real GDP, real GNP,
HICP inflation and employment growth with the latest published forecasts from a number of other
institutions. The latest consensus forecast – a monthly publication by Reuters based on a survey of
around 10 private sector institutions in Ireland – has also been included, to provide an indication of
the private sector’s view. In terms of economic growth, expectations for next year have generally
been revised down since the start of 2010. While there is a divergence between the Department of
Finance’s growth outlook and that of the other institutions, this primarily reflects budgetary
development. The forecasts are of a broadly similar vintage, but the Department’s forecast is the only
one that takes full account of the size of the consolidation that is now planned for next year.
Nevertheless, even taking account of the need to do more in 2011, there remains a general consensus
that the Irish economy will see a return to positive, but below trend, growth next year. In the case of
inflation, prices are generally expected to begin to increase once again in 2011 following successive
years of decline, while employment is forecast to stabilise over the course of next year.
105
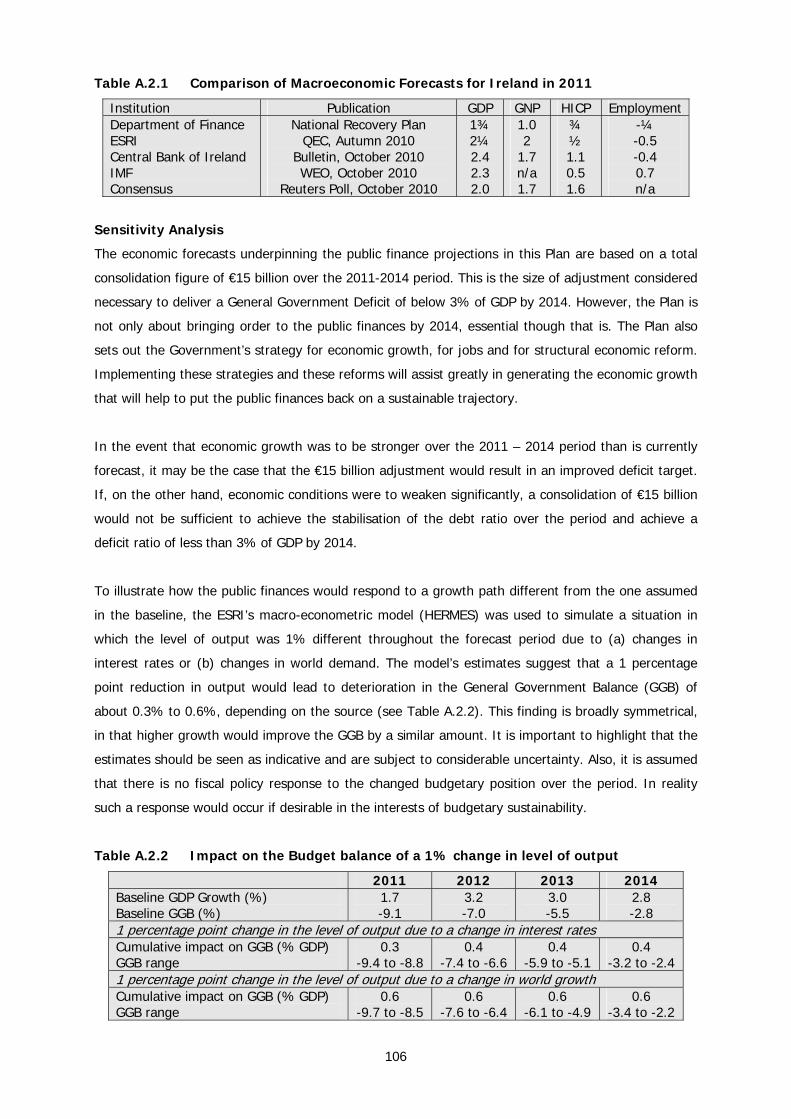
Table A.2.1 Comparison of Macroeconomic Forecasts for Ireland in 2011
Institution Publication GDP GNP HICP EmploymentDepartment of Finance ESRI Central Bank of Ireland IMF Consensus
National Recovery Plan QEC, Autumn 2010
Bulletin, October 2010 WEO, October 2010
Reuters Poll, October 2010
1¾ 2¼ 2.4 2.3 2.0
1.0 2
1.7 n/a 1.7
¾ ½ 1.1 0.5 1.6
-¼ -0.5 -0.4 0.7 n/a
Sensitivity Analysis
The economic forecasts underpinning the public finance projections in this Plan are based on a total
consolidation figure of €15 billion over the 2011-2014 period. This is the size of adjustment considered
necessary to deliver a General Government Deficit of below 3% of GDP by 2014. However, the Plan is
not only about bringing order to the public finances by 2014, essential though that is. The Plan also
sets out the Government’s strategy for economic growth, for jobs and for structural economic reform.
Implementing these strategies and these reforms will assist greatly in generating the economic growth
that will help to put the public finances back on a sustainable trajectory.
In the event that economic growth was to be stronger over the 2011 – 2014 period than is currently
forecast, it may be the case that the €15 billion adjustment would result in an improved deficit target.
If, on the other hand, economic conditions were to weaken significantly, a consolidation of €15 billion
would not be sufficient to achieve the stabilisation of the debt ratio over the period and achieve a
deficit ratio of less than 3% of GDP by 2014.
To illustrate how the public finances would respond to a growth path different from the one assumed
in the baseline, the ESRI’s macro-econometric model (HERMES) was used to simulate a situation in
which the level of output was 1% different throughout the forecast period due to (a) changes in
interest rates or (b) changes in world demand. The model’s estimates suggest that a 1 percentage
point reduction in output would lead to deterioration in the General Government Balance (GGB) of
about 0.3% to 0.6%, depending on the source (see Table A.2.2). This finding is broadly symmetrical,
in that higher growth would improve the GGB by a similar amount. It is important to highlight that the
estimates should be seen as indicative and are subject to considerable uncertainty. Also, it is assumed
that there is no fiscal policy response to the changed budgetary position over the period. In reality
such a response would occur if desirable in the interests of budgetary sustainability.
Table A.2.2 Impact on the Budget balance of a 1% change in level of output
2011 2012 2013 2014 Baseline GDP Growth (%) Baseline GGB (%)
1.7 -9.1
3.2 -7.0
3.0 -5.5
2.8 -2.8
1 percentage point change in the level of output due to a change in interest rates Cumulative impact on GGB (% GDP) GGB range
0.3 -9.4 to -8.8
0.4 -7.4 to -6.6
0.4 -5.9 to -5.1
0.4 -3.2 to -2.4
1 percentage point change in the level of output due to a change in world growth Cumulative impact on GGB (% GDP) GGB range
0.6 -9.7 to -8.5
0.6 -7.6 to -6.4
0.6 -6.1 to -4.9
0.6 -3.4 to -2.2
106
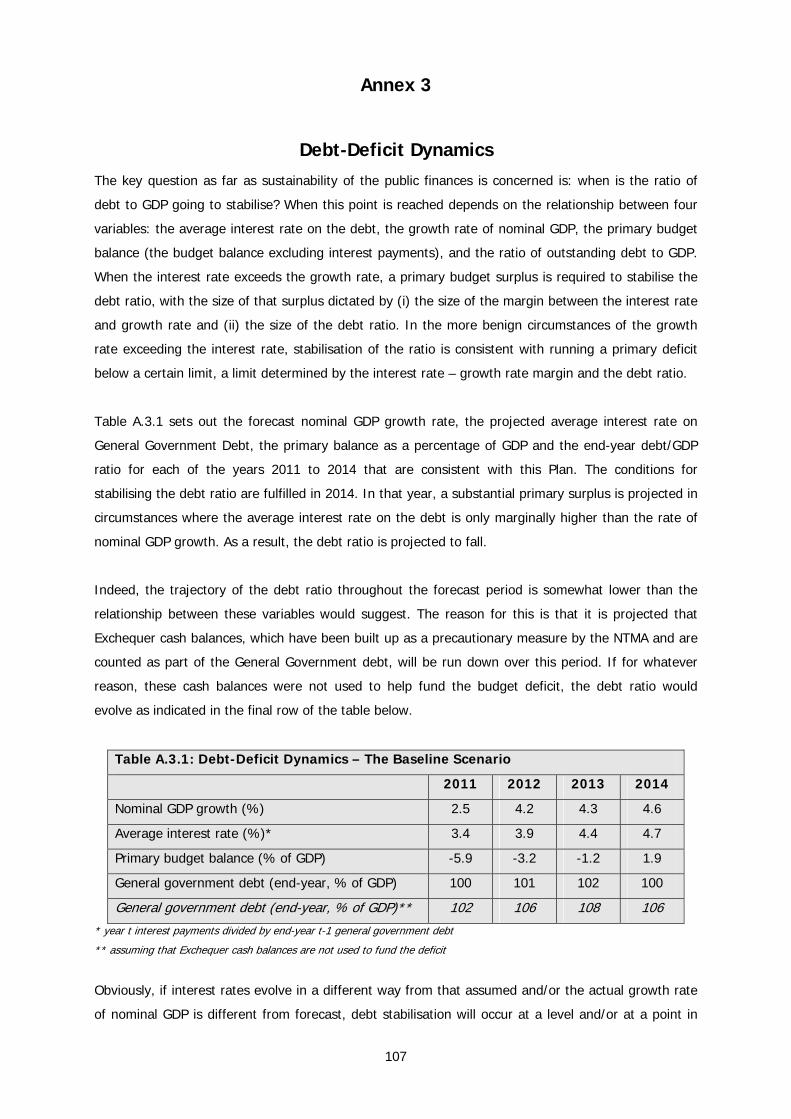
Annex 3
Debt-Deficit Dynamics The key question as far as sustainability of the public finances is concerned is: when is the ratio of
debt to GDP going to stabilise? When this point is reached depends on the relationship between four
variables: the average interest rate on the debt, the growth rate of nominal GDP, the primary budget
balance (the budget balance excluding interest payments), and the ratio of outstanding debt to GDP.
When the interest rate exceeds the growth rate, a primary budget surplus is required to stabilise the
debt ratio, with the size of that surplus dictated by (i) the size of the margin between the interest rate
and growth rate and (ii) the size of the debt ratio. In the more benign circumstances of the growth
rate exceeding the interest rate, stabilisation of the ratio is consistent with running a primary deficit
below a certain limit, a limit determined by the interest rate – growth rate margin and the debt ratio.
Table A.3.1 sets out the forecast nominal GDP growth rate, the projected average interest rate on
General Government Debt, the primary balance as a percentage of GDP and the end-year debt/GDP
ratio for each of the years 2011 to 2014 that are consistent with this Plan. The conditions for
stabilising the debt ratio are fulfilled in 2014. In that year, a substantial primary surplus is projected in
circumstances where the average interest rate on the debt is only marginally higher than the rate of
nominal GDP growth. As a result, the debt ratio is projected to fall.
Indeed, the trajectory of the debt ratio throughout the forecast period is somewhat lower than the
relationship between these variables would suggest. The reason for this is that it is projected that
Exchequer cash balances, which have been built up as a precautionary measure by the NTMA and are
counted as part of the General Government debt, will be run down over this period. If for whatever
reason, these cash balances were not used to help fund the budget deficit, the debt ratio would
evolve as indicated in the final row of the table below.
Table A.3.1: Debt-Deficit Dynamics – The Baseline Scenario
2011 2012 2013 2014
Nominal GDP growth (%) 2.5 4.2 4.3 4.6
Average interest rate (%)* 3.4 3.9 4.4 4.7
Primary budget balance (% of GDP) -5.9 -3.2 -1.2 1.9
General government debt (end-year, % of GDP) 100 101 102 100
General government debt (end-year, % of GDP)** 102 106 108 106
* year t interest payments divided by end-year t-1 general government debt
** assuming that Exchequer cash balances are not used to fund the deficit
Obviously, if interest rates evolve in a different way from that assumed and/or the actual growth rate
of nominal GDP is different from forecast, debt stabilisation will occur at a level and/or at a point in
107
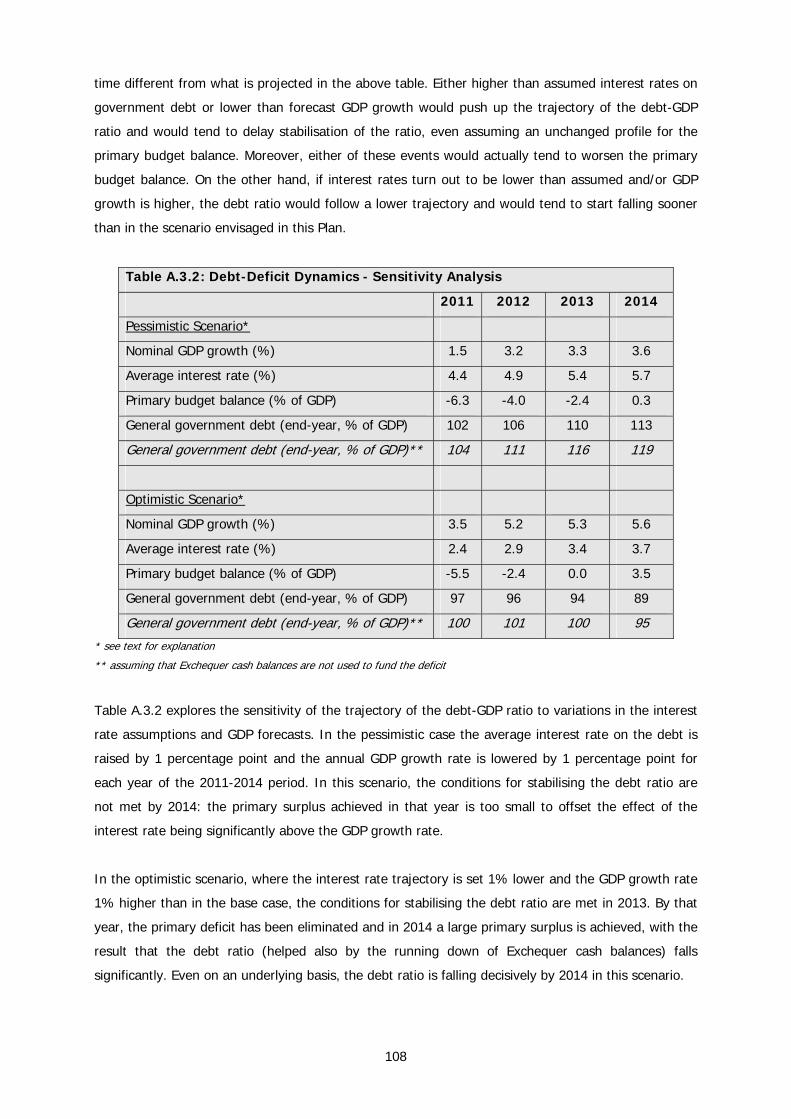
time different from what is projected in the above table. Either higher than assumed interest rates on
government debt or lower than forecast GDP growth would push up the trajectory of the debt-GDP
ratio and would tend to delay stabilisation of the ratio, even assuming an unchanged profile for the
primary budget balance. Moreover, either of these events would actually tend to worsen the primary
budget balance. On the other hand, if interest rates turn out to be lower than assumed and/or GDP
growth is higher, the debt ratio would follow a lower trajectory and would tend to start falling sooner
than in the scenario envisaged in this Plan.
Table A.3.2: Debt-Deficit Dynamics - Sensitivity Analysis
2011 2012 2013 2014
Pessimistic Scenario*
Nominal GDP growth (%) 1.5 3.2 3.3 3.6
Average interest rate (%) 4.4 4.9 5.4 5.7
Primary budget balance (% of GDP) -6.3 -4.0 -2.4 0.3
General government debt (end-year, % of GDP) 102 106 110 113
General government debt (end-year, % of GDP)** 104 111 116 119
Optimistic Scenario*
Nominal GDP growth (%) 3.5 5.2 5.3 5.6
Average interest rate (%) 2.4 2.9 3.4 3.7
Primary budget balance (% of GDP) -5.5 -2.4 0.0 3.5
General government debt (end-year, % of GDP) 97 96 94 89
General government debt (end-year, % of GDP)** 100 101 100 95
* see text for explanation
** assuming that Exchequer cash balances are not used to fund the deficit
Table A.3.2 explores the sensitivity of the trajectory of the debt-GDP ratio to variations in the interest
rate assumptions and GDP forecasts. In the pessimistic case the average interest rate on the debt is
raised by 1 percentage point and the annual GDP growth rate is lowered by 1 percentage point for
each year of the 2011-2014 period. In this scenario, the conditions for stabilising the debt ratio are
not met by 2014: the primary surplus achieved in that year is too small to offset the effect of the
interest rate being significantly above the GDP growth rate.
In the optimistic scenario, where the interest rate trajectory is set 1% lower and the GDP growth rate
1% higher than in the base case, the conditions for stabilising the debt ratio are met in 2013. By that
year, the primary deficit has been eliminated and in 2014 a large primary surplus is achieved, with the
result that the debt ratio (helped also by the running down of Exchequer cash balances) falls
significantly. Even on an underlying basis, the debt ratio is falling decisively by 2014 in this scenario.
108

In the baseline scenario, the average effective interest rate on the debt in 2011, calculated as
projected interest payments in 2011 divided by end-2010 General Government Debt, is estimated at
3.4%. A key reason for this seemingly low figure has to do with the fact that, of the €149 billion stock
of debt that will be outstanding at end-2010, almost €31 billion comprises the promissory notes issued
by way of support to the banking system during the year. In 2011, the first funding of the promissory
note programme, amounting to €3.1 billion, will take place and will generate interest payments of
around €200 million on an annual basis.
109
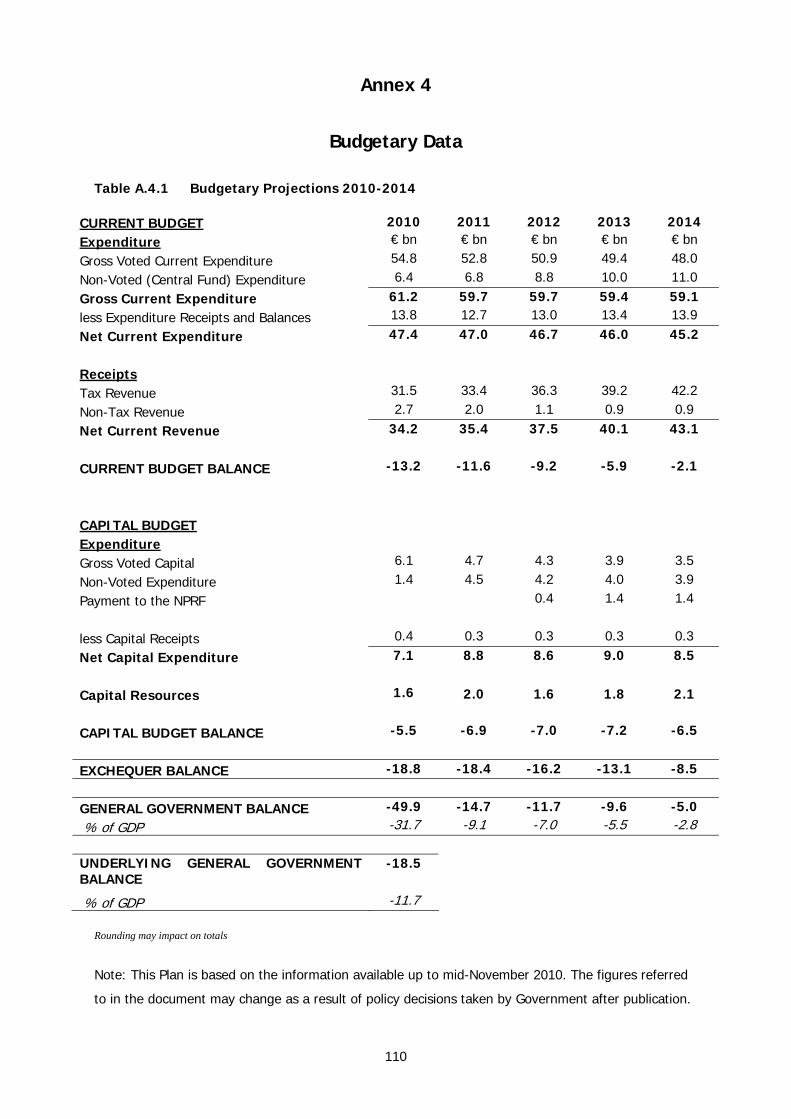
Annex 4
Budgetary Data
Table A.4.1 Budgetary Projections 2010-2014
CURRENT BUDGET 2010 2011 2012 2013 2014 Expenditure € bn € bn € bn € bn € bn
Gross Voted Current Expenditure 54.8 52.8 50.9 49.4 48.0
Non-Voted (Central Fund) Expenditure 6.4 6.8 8.8 10.0 11.0
Gross Current Expenditure 61.2 59.7 59.7 59.4 59.1
less Expenditure Receipts and Balances 13.8 12.7 13.0 13.4 13.9
Net Current Expenditure 47.4 47.0 46.7 46.0 45.2 Receipts Tax Revenue 31.5 33.4 36.3 39.2 42.2
Non-Tax Revenue 2.7 2.0 1.1 0.9 0.9
Net Current Revenue 34.2 35.4 37.5 40.1 43.1 CURRENT BUDGET BALANCE -13.2 -11.6 -9.2 -5.9 -2.1
CAPITAL BUDGET Expenditure Gross Voted Capital 6.1 4.7 4.3 3.9 3.5
Non-Voted Expenditure 1.4 4.5 4.2 4.0 3.9
Payment to the NPRF 0.4 1.4 1.4
less Capital Receipts 0.4 0.3 0.3 0.3 0.3
Net Capital Expenditure 7.1 8.8 8.6 9.0 8.5 Capital Resources 1.6 2.0 1.6 1.8 2.1 CAPITAL BUDGET BALANCE -5.5 -6.9 -7.0 -7.2 -6.5
EXCHEQUER BALANCE -18.8 -18.4 -16.2 -13.1 -8.5
GENERAL GOVERNMENT BALANCE -49.9 -14.7 -11.7 -9.6 -5.0
% of GDP -31.7 -9.1 -7.0 -5.5 -2.8 UNDERLYING GENERAL GOVERNMENT BALANCE
-18.5
% of GDP -11.7
Rounding may impact on totals
Note: This Plan is based on the information available up to mid-November 2010. The figures referred
to in the document may change as a result of policy decisions taken by Government after publication.
110
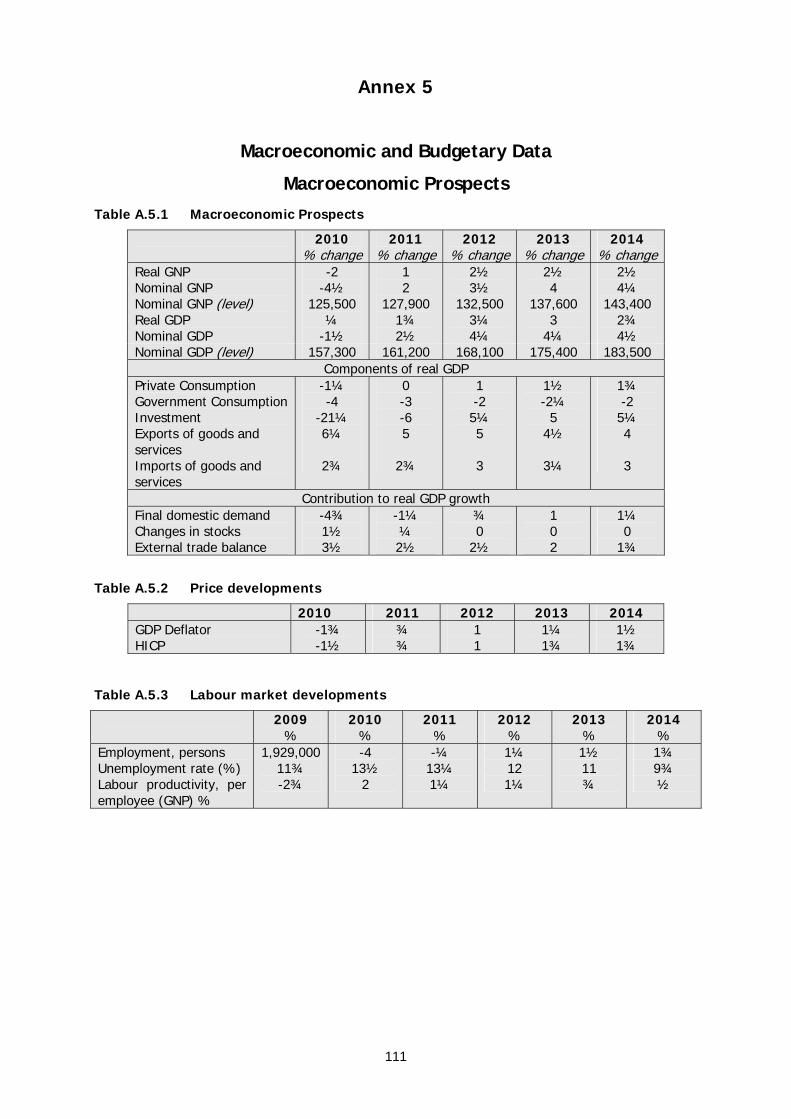
Annex 5
Macroeconomic and Budgetary Data
Macroeconomic Prospects
Table A.5.1 Macroeconomic Prospects
2010 % change
2011 % change
2012 % change
2013 % change
2014 % change
Real GNP Nominal GNP Nominal GNP (level) Real GDP Nominal GDP
-2 -4½
125,500 ¼
-1½
1 2
127,900 1¾ 2½
2½ 3½
132,500 3¼ 4¼
2½ 4
137,600 3
4¼
2½ 4¼
143,400 2¾ 4½
Nominal GDP (level) 157,300 161,200 168,100 175,400 183,500 Components of real GDP
Private Consumption Government Consumption Investment Exports of goods and services Imports of goods and services
-1¼ -4
-21¼ 6¼
2¾
0 -3 -6 5
2¾
1 -2
5¼ 5 3
1½ -2¼
5 4½
3¼
1¾ -2
5¼ 4 3
Contribution to real GDP growth Final domestic demand Changes in stocks External trade balance
-4¾ 1½ 3½
-1¼ ¼ 2½
¾ 0
2½
1 0 2
1¼ 0
1¾
Table A.5.2 Price developments
2010 2011 2012 2013 2014 GDP Deflator HICP
-1¾ -1½
¾ ¾
1 1
1¼ 1¾
1½ 1¾
Table A.5.3 Labour market developments
2009 %
2010 %
2011 %
2012 %
2013 %
2014 %
Employment, persons Unemployment rate (%) Labour productivity, per employee (GNP) %
1,929,000 11¾ -2¾
-4 13½
2
-¼ 13¼ 1¼
1¼ 12 1¼
1½ 11 ¾
1¾ 9¾ ½
111

Annex 6
Performance Budgeting ‘Performance Budgeting’ is the term used to describe ways of strengthening the focus upon what is
delivered with public funds, and factoring this into the resource-allocation process, in preference to
the traditional approach of focusing narrowly on the financial inputs.
Ireland’s system of resource allocation centres upon the traditional Vote accounting framework,
whereby financial allocations are authorised by the Dáil and accounted for on a subhead-by-subhead
basis. In recent years, this has been complemented with the Annual Output Statement (AOS)
approach, which includes information on public service performance and outputs.
In its 2008 Review of the Irish Public Service, the OECD was broadly supportive of the AOS concept,
and called for improvements to build performance information into the budgeting process. This
approach has been taken up in the Government’s Transforming Public Services agenda.
Proposed Approach
The Government has decided to integrate key, high-level performance information as part of the
annual Estimate, rather than continue to present such information in two separate documents – the
Estimate and the AOS – which are hard to reconcile with each other. This approach to ‘performance
budgeting’ will involve:-
• full alignment between the subhead structure of the Estimate and the ‘Programme’ structure
used in the AOS and Statement of Strategy;
• integration of Administration subheads alongside the corresponding Programme subheads, to
show the full costs of delivering each Programme; and
• inclusion of concise, high-level performance and impact information as part of the annual
Estimate.
The Government will progress this initiative by way of a pilot project, involving a policy-focused area
(the Department of Finance and the wider Finance Group of Votes) along with an area focused on
operation and service delivery (the Department of Agriculture, Fisheries & Food). The 2011 Estimates
for these areas will be prepared on the new Programme Estimate basis, and the new approach will be
rolled out to other Departments from 2012.
112
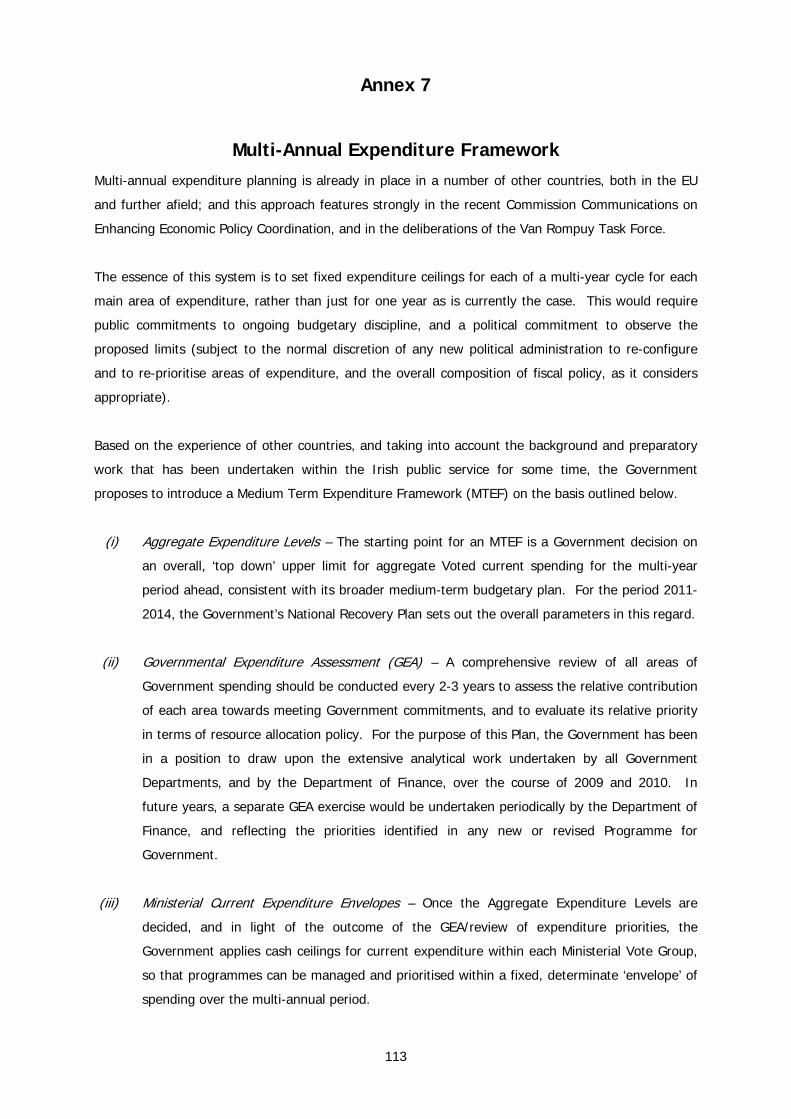
Annex 7
Multi-Annual Expenditure Framework Multi-annual expenditure planning is already in place in a number of other countries, both in the EU
and further afield; and this approach features strongly in the recent Commission Communications on
Enhancing Economic Policy Coordination, and in the deliberations of the Van Rompuy Task Force.
The essence of this system is to set fixed expenditure ceilings for each of a multi-year cycle for each
main area of expenditure, rather than just for one year as is currently the case. This would require
public commitments to ongoing budgetary discipline, and a political commitment to observe the
proposed limits (subject to the normal discretion of any new political administration to re-configure
and to re-prioritise areas of expenditure, and the overall composition of fiscal policy, as it considers
appropriate).
Based on the experience of other countries, and taking into account the background and preparatory
work that has been undertaken within the Irish public service for some time, the Government
proposes to introduce a Medium Term Expenditure Framework (MTEF) on the basis outlined below.
(i) Aggregate Expenditure Levels – The starting point for an MTEF is a Government decision on
an overall, ‘top down’ upper limit for aggregate Voted current spending for the multi-year
period ahead, consistent with its broader medium-term budgetary plan. For the period 2011-
2014, the Government’s National Recovery Plan sets out the overall parameters in this regard.
(ii) Governmental Expenditure Assessment (GEA) – A comprehensive review of all areas of
Government spending should be conducted every 2-3 years to assess the relative contribution
of each area towards meeting Government commitments, and to evaluate its relative priority
in terms of resource allocation policy. For the purpose of this Plan, the Government has been
in a position to draw upon the extensive analytical work undertaken by all Government
Departments, and by the Department of Finance, over the course of 2009 and 2010. In
future years, a separate GEA exercise would be undertaken periodically by the Department of
Finance, and reflecting the priorities identified in any new or revised Programme for
Government.
(iii) Ministerial Current Expenditure Envelopes – Once the Aggregate Expenditure Levels are
decided, and in light of the outcome of the GEA/review of expenditure priorities, the
Government applies cash ceilings for current expenditure within each Ministerial Vote Group,
so that programmes can be managed and prioritised within a fixed, determinate ‘envelope’ of
spending over the multi-annual period.
113
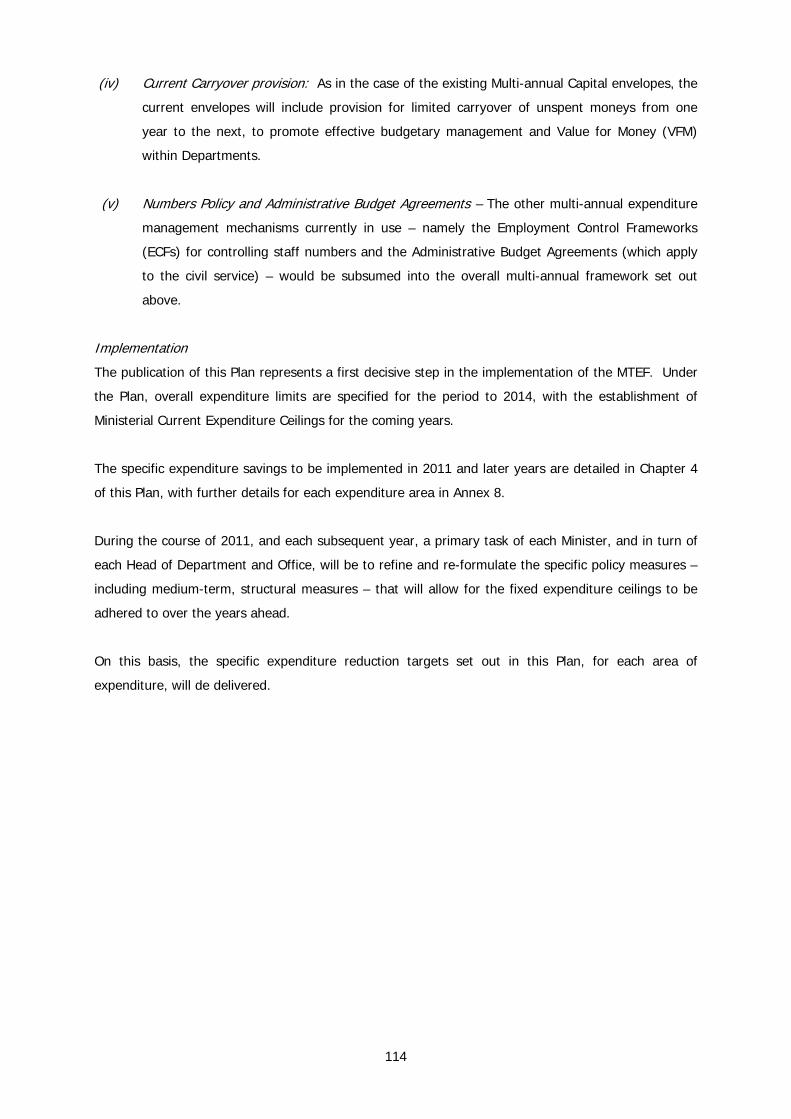
(iv) Current Carryover provision: As in the case of the existing Multi-annual Capital envelopes, the
current envelopes will include provision for limited carryover of unspent moneys from one
year to the next, to promote effective budgetary management and Value for Money (VFM)
within Departments.
(v) Numbers Policy and Administrative Budget Agreements – The other multi-annual expenditure
management mechanisms currently in use – namely the Employment Control Frameworks
(ECFs) for controlling staff numbers and the Administrative Budget Agreements (which apply
to the civil service) – would be subsumed into the overall multi-annual framework set out
above.
Implementation
The publication of this Plan represents a first decisive step in the implementation of the MTEF. Under
the Plan, overall expenditure limits are specified for the period to 2014, with the establishment of
Ministerial Current Expenditure Ceilings for the coming years.
The specific expenditure savings to be implemented in 2011 and later years are detailed in Chapter 4
of this Plan, with further details for each expenditure area in Annex 8.
During the course of 2011, and each subsequent year, a primary task of each Minister, and in turn of
each Head of Department and Office, will be to refine and re-formulate the specific policy measures –
including medium-term, structural measures – that will allow for the fixed expenditure ceilings to be
adhered to over the years ahead.
On this basis, the specific expenditure reduction targets set out in this Plan, for each area of
expenditure, will de delivered.
114
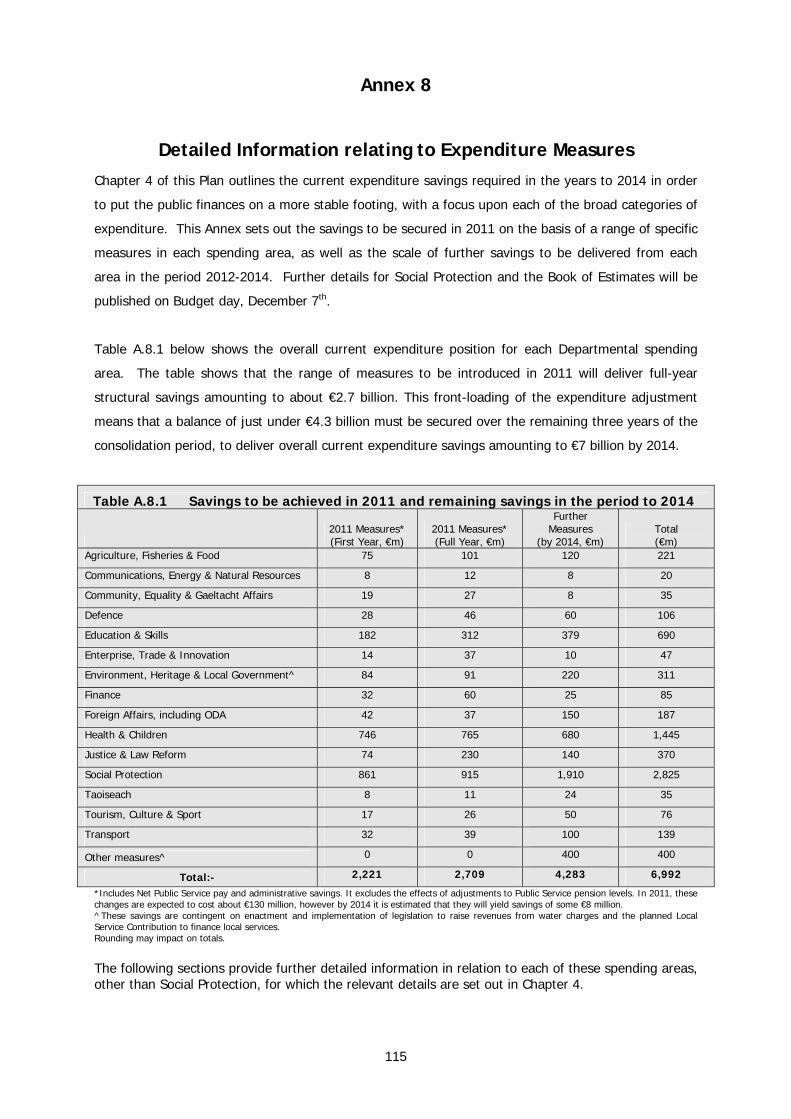
Annex 8
Detailed Information relating to Expenditure Measures Chapter 4 of this Plan outlines the current expenditure savings required in the years to 2014 in order
to put the public finances on a more stable footing, with a focus upon each of the broad categories of
expenditure. This Annex sets out the savings to be secured in 2011 on the basis of a range of specific
measures in each spending area, as well as the scale of further savings to be delivered from each
area in the period 2012-2014. Further details for Social Protection and the Book of Estimates will be
published on Budget day, December 7th.
Table A.8.1 below shows the overall current expenditure position for each Departmental spending
area. The table shows that the range of measures to be introduced in 2011 will deliver full-year
structural savings amounting to about €2.7 billion. This front-loading of the expenditure adjustment
means that a balance of just under €4.3 billion must be secured over the remaining three years of the
consolidation period, to deliver overall current expenditure savings amounting to €7 billion by 2014.
Table A.8.1 Savings to be achieved in 2011 and remaining savings in the period to 2014
2011 Measures* (First Year, €m)
2011 Measures* (Full Year, €m)
Further Measures
(by 2014, €m) Total (€m)
Agriculture, Fisheries & Food 75 101 120 221
Communications, Energy & Natural Resources 8 12 8 20
Community, Equality & Gaeltacht Affairs 19 27 8 35
Defence 28 46 60 106
Education & Skills 182 312 379 690
Enterprise, Trade & Innovation 14 37 10 47
Environment, Heritage & Local Government^ 84 91 220 311
Finance 32 60 25 85
Foreign Affairs, including ODA 42 37 150 187
Health & Children 746 765 680 1,445
Justice & Law Reform 74 230 140 370
Social Protection 861 915 1,910 2,825
Taoiseach 8 11 24 35
Tourism, Culture & Sport 17 26 50 76
Transport 32 39 100 139
Other measures^ 0 0 400 400
Total:- 2,221 2,709 4,283 6,992
*Includes Net Public Service pay and administrative savings. It excludes the effects of adjustments to Public Service pension levels. In 2011, these changes are expected to cost about €130 million, however by 2014 it is estimated that they will yield savings of some €8 million. ^These savings are contingent on enactment and implementation of legislation to raise revenues from water charges and the planned Local Service Contribution to finance local services. Rounding may impact on totals.
The following sections provide further detailed information in relation to each of these spending areas, other than Social Protection, for which the relevant details are set out in Chapter 4.
115
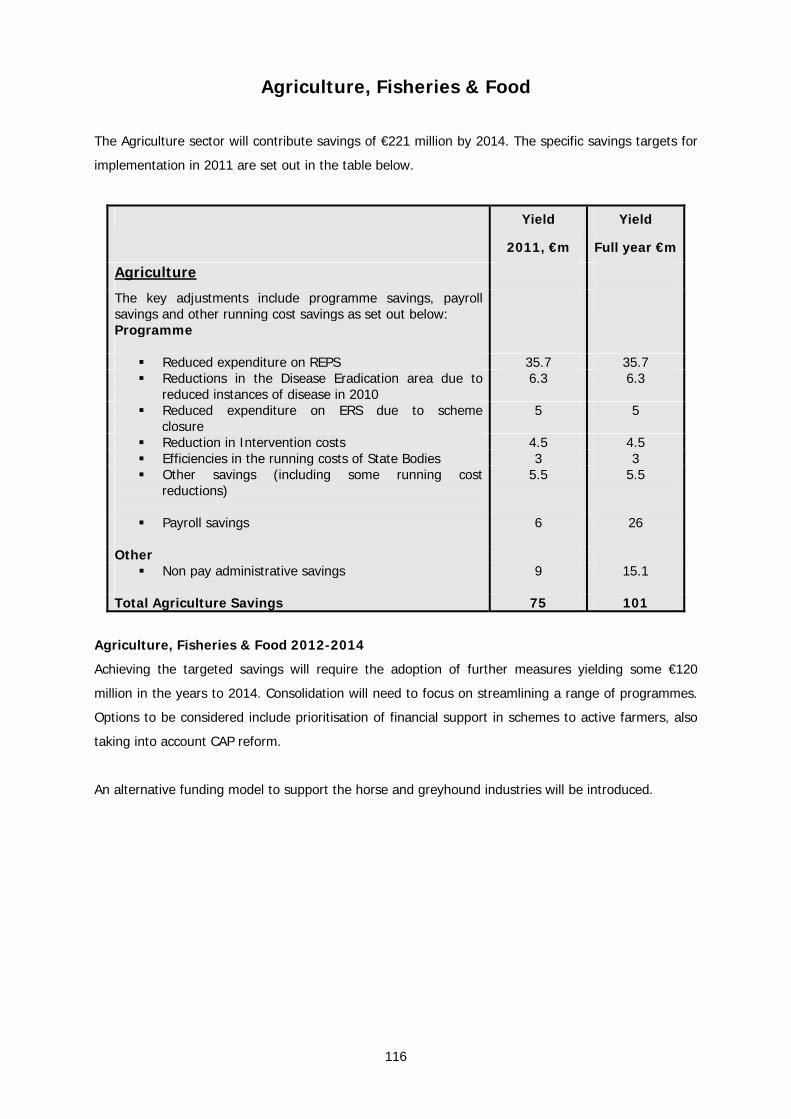
Agriculture, Fisheries & Food
The Agriculture sector will contribute savings of €221 million by 2014. The specific savings targets for
implementation in 2011 are set out in the table below.
Yield
2011, €m
Yield
Full year €m
Agriculture
The key adjustments include programme savings, payroll savings and other running cost savings as set out below: Programme
Reduced expenditure on REPS 35.7 35.7 Reductions in the Disease Eradication area due to
reduced instances of disease in 2010 6.3 6.3
Reduced expenditure on ERS due to scheme closure
5 5
Reduction in Intervention costs 4.5 4.5 Efficiencies in the running costs of State Bodies 3 3 Other savings (including some running cost
reductions)
5.5 5.5
Payroll savings
6 26
Other Non pay administrative savings
9 15.1
Total Agriculture Savings 75 101
Agriculture, Fisheries & Food 2012-2014
Achieving the targeted savings will require the adoption of further measures yielding some €120
million in the years to 2014. Consolidation will need to focus on streamlining a range of programmes.
Options to be considered include prioritisation of financial support in schemes to active farmers, also
taking into account CAP reform.
An alternative funding model to support the horse and greyhound industries will be introduced.
116
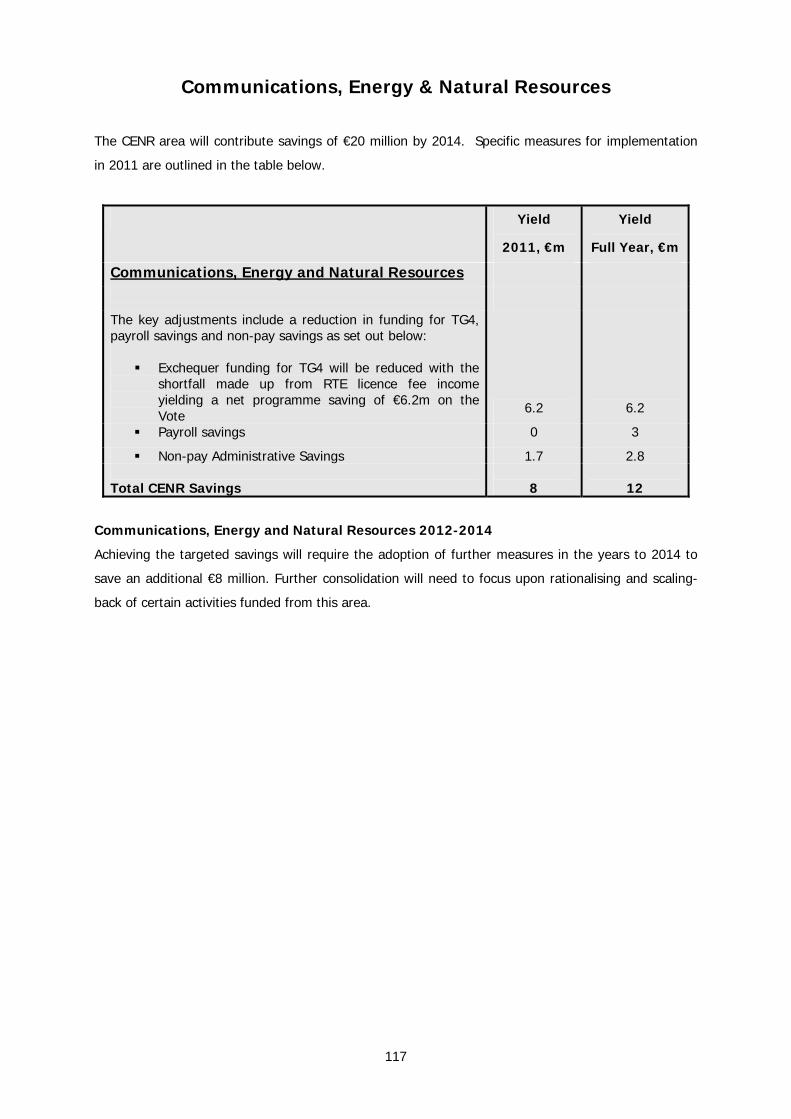
Communications, Energy & Natural Resources
The CENR area will contribute savings of €20 million by 2014. Specific measures for implementation
in 2011 are outlined in the table below.
Yield
2011, €m
Yield
Full Year, €m
Communications, Energy and Natural Resources
The key adjustments include a reduction in funding for TG4, payroll savings and non-pay savings as set out below:
Exchequer funding for TG4 will be reduced with the shortfall made up from RTE licence fee income yielding a net programme saving of €6.2m on the Vote 6.2 6.2
Payroll savings 0 3
Non-pay Administrative Savings 1.7 2.8 Total CENR Savings
8
12
Communications, Energy and Natural Resources 2012-2014
Achieving the targeted savings will require the adoption of further measures in the years to 2014 to
save an additional €8 million. Further consolidation will need to focus upon rationalising and scaling-
back of certain activities funded from this area.
117
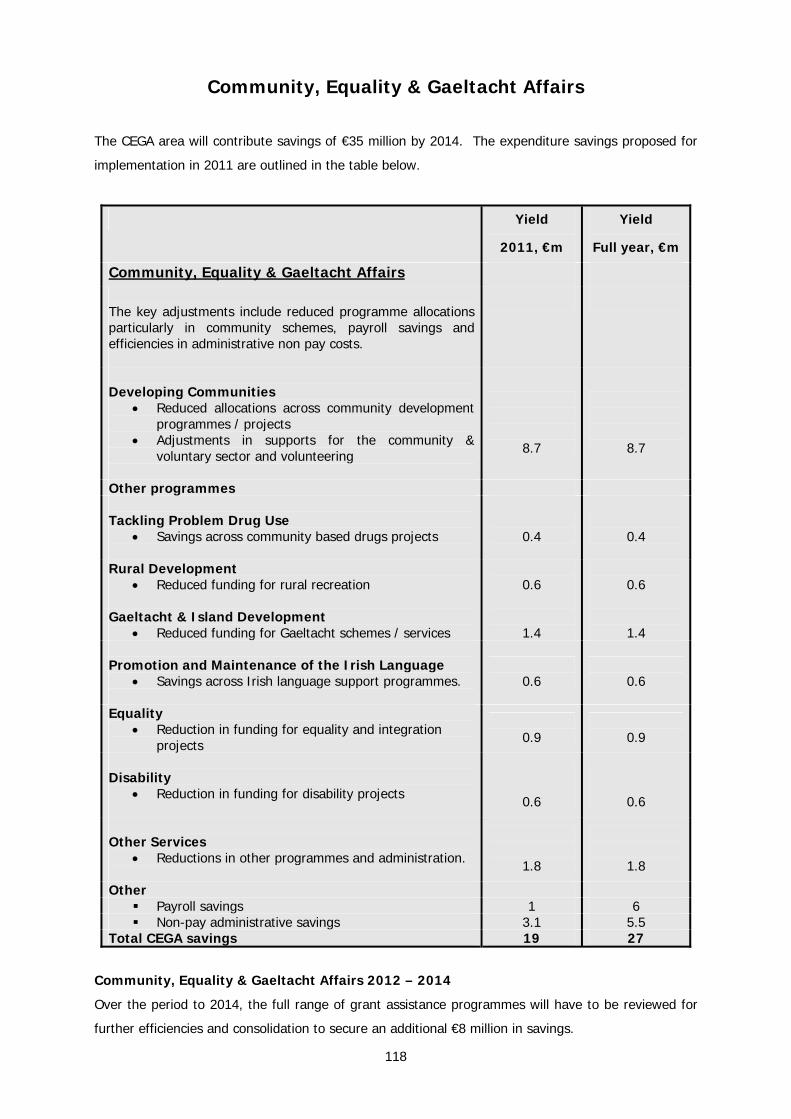
Community, Equality & Gaeltacht Affairs
The CEGA area will contribute savings of €35 million by 2014. The expenditure savings proposed for
implementation in 2011 are outlined in the table below.
Yield
2011, €m
Yield
Full year, €m
Community, Equality & Gaeltacht Affairs
The key adjustments include reduced programme allocations particularly in community schemes, payroll savings and efficiencies in administrative non pay costs.
Developing Communities
• Reduced allocations across community development programmes / projects
• Adjustments in supports for the community & voluntary sector and volunteering
8.7
8.7
Other programmes Tackling Problem Drug Use
• Savings across community based drugs projects
0.4
0.4
Rural Development • Reduced funding for rural recreation
0.6
0.6
Gaeltacht & Island Development
• Reduced funding for Gaeltacht schemes / services
1.4
1.4 Promotion and Maintenance of the Irish Language
• Savings across Irish language support programmes.
0.6
0.6
Equality • Reduction in funding for equality and integration
projects
0.9
0.9
Disability
• Reduction in funding for disability projects
0.6
0.6
Other Services
• Reductions in other programmes and administration.
1.8
1.8
Other Payroll savings 1 6 Non-pay administrative savings 3.1 5.5
Total CEGA savings 19 27
Community, Equality & Gaeltacht Affairs 2012 – 2014
Over the period to 2014, the full range of grant assistance programmes will have to be reviewed for
further efficiencies and consolidation to secure an additional €8 million in savings.
118
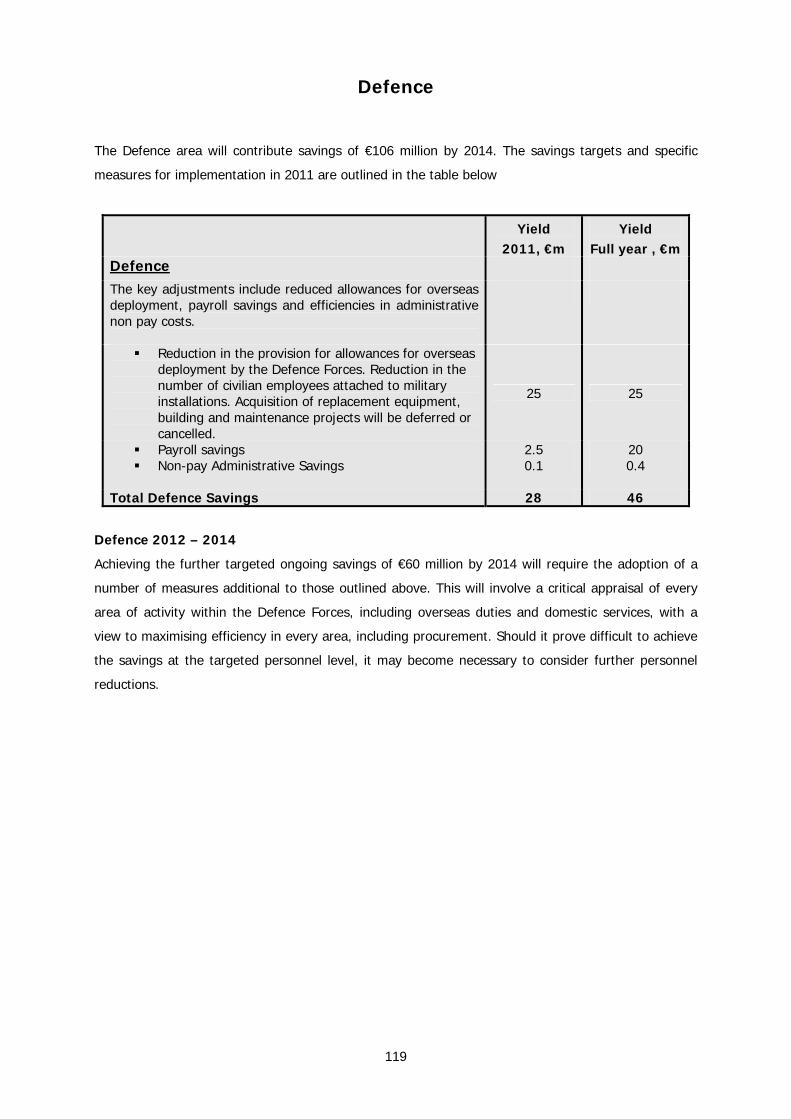
Defence
The Defence area will contribute savings of €106 million by 2014. The savings targets and specific
measures for implementation in 2011 are outlined in the table below
Yield 2011, €m
Yield Full year , €m
Defence
The key adjustments include reduced allowances for overseas deployment, payroll savings and efficiencies in administrative non pay costs.
Reduction in the provision for allowances for overseas deployment by the Defence Forces. Reduction in the number of civilian employees attached to military installations. Acquisition of replacement equipment, building and maintenance projects will be deferred or cancelled.
25 25
Payroll savings 2.5 20 Non-pay Administrative Savings
0.1 0.4
Total Defence Savings 28 46
Defence 2012 – 2014
Achieving the further targeted ongoing savings of €60 million by 2014 will require the adoption of a
number of measures additional to those outlined above. This will involve a critical appraisal of every
area of activity within the Defence Forces, including overseas duties and domestic services, with a
view to maximising efficiency in every area, including procurement. Should it prove difficult to achieve
the savings at the targeted personnel level, it may become necessary to consider further personnel
reductions.
119

Education & Skills
The table below outlines the measures to be adopted in 2011 to achieve the saving required. These
structural measures have a significantly higher medium-term impact, thus lessening the need for
further policy savings from this sector in future years. Structural changes early in the adjustment
process can yield substantial future savings, particularly in the area of pupil staffing ratios. Allocations
from the National Training Fund will also be reduced and the impact on training and employment
supports will have to be managed within the reduced allocation. The Government will continue to
place an emphasis on providing training for the unemployed, in particular those cohorts that are in
danger of becoming distanced from the labour market. The Education & Skills area, including FÁS, will
contribute savings of €690 million by 2014.
Yield
2011, €m
Yield
Full year , €m
Education and Skills
The key adjustments in the education sector include some one off measures as well as structural measures with significant medium-term impacts. The key adjustments are:
School Transport
Operational efficiencies and other savings measures in the school transport scheme
4.5 17
School Funding:
5% Reduction in all capitation grants, including grants for Adult Literacy, Community Education, School Completion Programme, Youthreach.
22.2
22.2
Education Fees:
Replace Student Services Charge with a flat higher education student contribution of €2,000, and introduce €200 charge for PLC students.
31 31
Student Support:
Savings in the student support scheme 22 51
Third Level:
5% cut in non-pay grant to Universities/IOTs etc. 14 14
NEPS:
Cap numbers at current level of 178 3 3
FAS/Training Allowances & similar Support Payments
Savings measures 21 21
Payroll savings
Reduce teacher numbers by a combination of measures 24 97.6
120
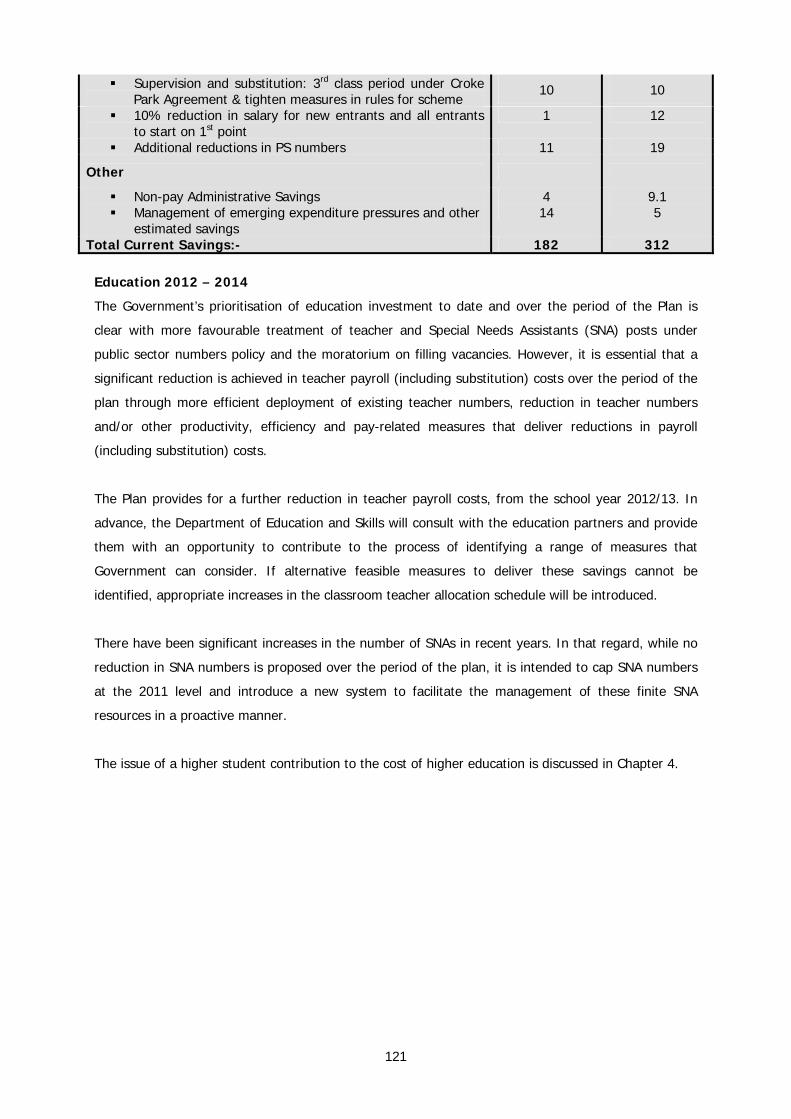
Supervision and substitution: 3rd class period under Croke Park Agreement & tighten measures in rules for scheme
10 10
10% reduction in salary for new entrants and all entrants to start on 1st point
1 12
Additional reductions in PS numbers 11 19
Other
Non-pay Administrative Savings Management of emerging expenditure pressures and other
estimated savings
4 14
9.1 5
Total Current Savings:- 182 312
Education 2012 – 2014
The Government’s prioritisation of education investment to date and over the period of the Plan is
clear with more favourable treatment of teacher and Special Needs Assistants (SNA) posts under
public sector numbers policy and the moratorium on filling vacancies. However, it is essential that a
significant reduction is achieved in teacher payroll (including substitution) costs over the period of the
plan through more efficient deployment of existing teacher numbers, reduction in teacher numbers
and/or other productivity, efficiency and pay-related measures that deliver reductions in payroll
(including substitution) costs.
The Plan provides for a further reduction in teacher payroll costs, from the school year 2012/13. In
advance, the Department of Education and Skills will consult with the education partners and provide
them with an opportunity to contribute to the process of identifying a range of measures that
Government can consider. If alternative feasible measures to deliver these savings cannot be
identified, appropriate increases in the classroom teacher allocation schedule will be introduced.
There have been significant increases in the number of SNAs in recent years. In that regard, while no
reduction in SNA numbers is proposed over the period of the plan, it is intended to cap SNA numbers
at the 2011 level and introduce a new system to facilitate the management of these finite SNA
resources in a proactive manner.
The issue of a higher student contribution to the cost of higher education is discussed in Chapter 4.
121
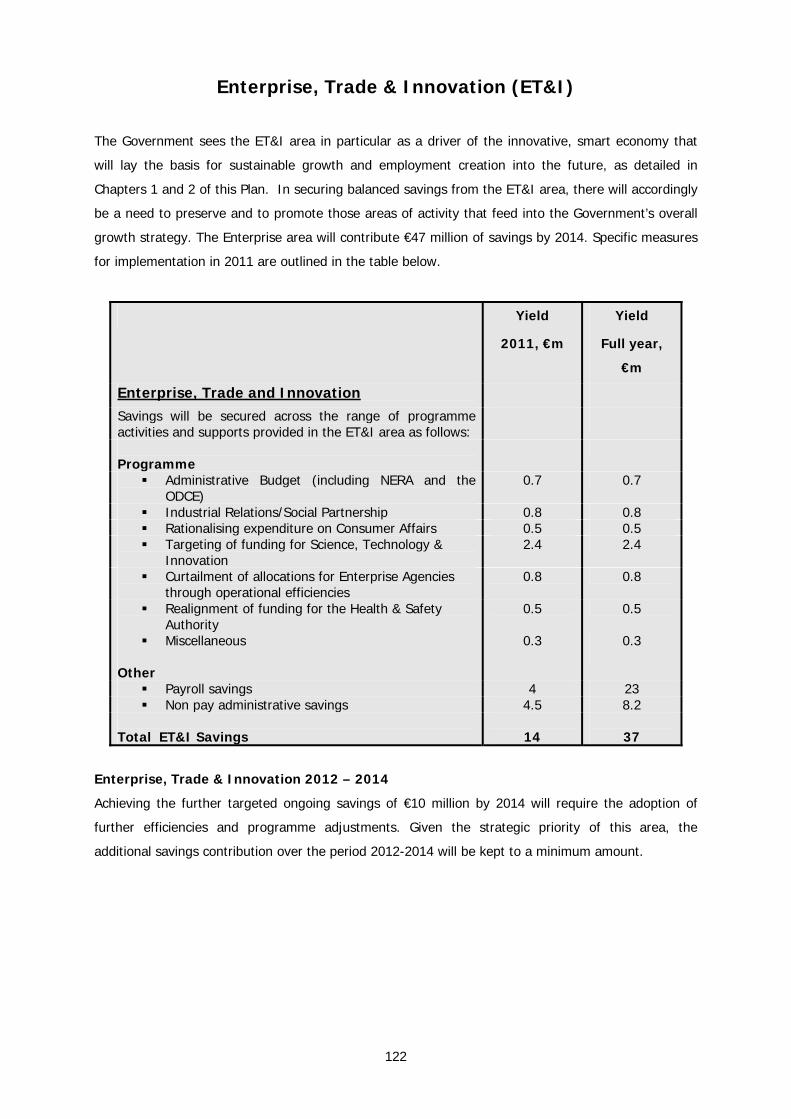
Enterprise, Trade & Innovation (ET&I)
The Government sees the ET&I area in particular as a driver of the innovative, smart economy that
will lay the basis for sustainable growth and employment creation into the future, as detailed in
Chapters 1 and 2 of this Plan. In securing balanced savings from the ET&I area, there will accordingly
be a need to preserve and to promote those areas of activity that feed into the Government’s overall
growth strategy. The Enterprise area will contribute €47 million of savings by 2014. Specific measures
for implementation in 2011 are outlined in the table below.
Yield
2011, €m
Yield
Full year,
€m
Enterprise, Trade and Innovation
Savings will be secured across the range of programme activities and supports provided in the ET&I area as follows:
Programme
Administrative Budget (including NERA and the ODCE)
0.7 0.7
Industrial Relations/Social Partnership 0.8 0.8 Rationalising expenditure on Consumer Affairs 0.5 0.5 Targeting of funding for Science, Technology &
Innovation 2.4 2.4
Curtailment of allocations for Enterprise Agencies through operational efficiencies
0.8 0.8
Realignment of funding for the Health & Safety Authority
0.5 0.5
Miscellaneous 0.3 0.3 Other
Payroll savings 4 23 Non pay administrative savings 4.5 8.2
Total ET&I Savings
14
37
Enterprise, Trade & Innovation 2012 – 2014
Achieving the further targeted ongoing savings of €10 million by 2014 will require the adoption of
further efficiencies and programme adjustments. Given the strategic priority of this area, the
additional savings contribution over the period 2012-2014 will be kept to a minimum amount.
122

Environment, Heritage & Local Government (EHLG)
Savings of up to €311 million are proposed to be implemented by 2014 from the EHLG area (which
includes Exchequer support for the Local Authorities). Specific measures for implementation in 2011
are outlined in the table below.
Yield
2011, €m
Yield
Full year, €m
Environment, Housing & Local Government There will be reductions within the housing, local government, heritage and community areas. In addition payroll and administrative savings are targeted. The key adjustments include the following: Programme
Lower Exchequer contribution to the Local Government Fund. Off-setting measures in the local government sector will be introduced
62 62
Savings will also arise from efficiencies in - Environmental protection measures - Built and Natural Heritage Programmes - Scheme of support to Voluntary and
Community Fora
9 7
1.2
9 7
1.2 Use Cash Reserves in Agencies (RPII & Heritage
Council) 0.75 -
Other
Payroll savings 1 7 Non-pay administrative savings 2.6 4.2
Total EHLG Savings:-
84
91
Environment, Heritage & Local Government 2012 – 2014
Savings and offsetting measures within the local government sector in 2012-2014 will allow the
Exchequer to end its contribution to the Local Government Fund. The introduction of water charges
and the local charge as proposed by the Government will lead to significant additional revenues from
2014.
123
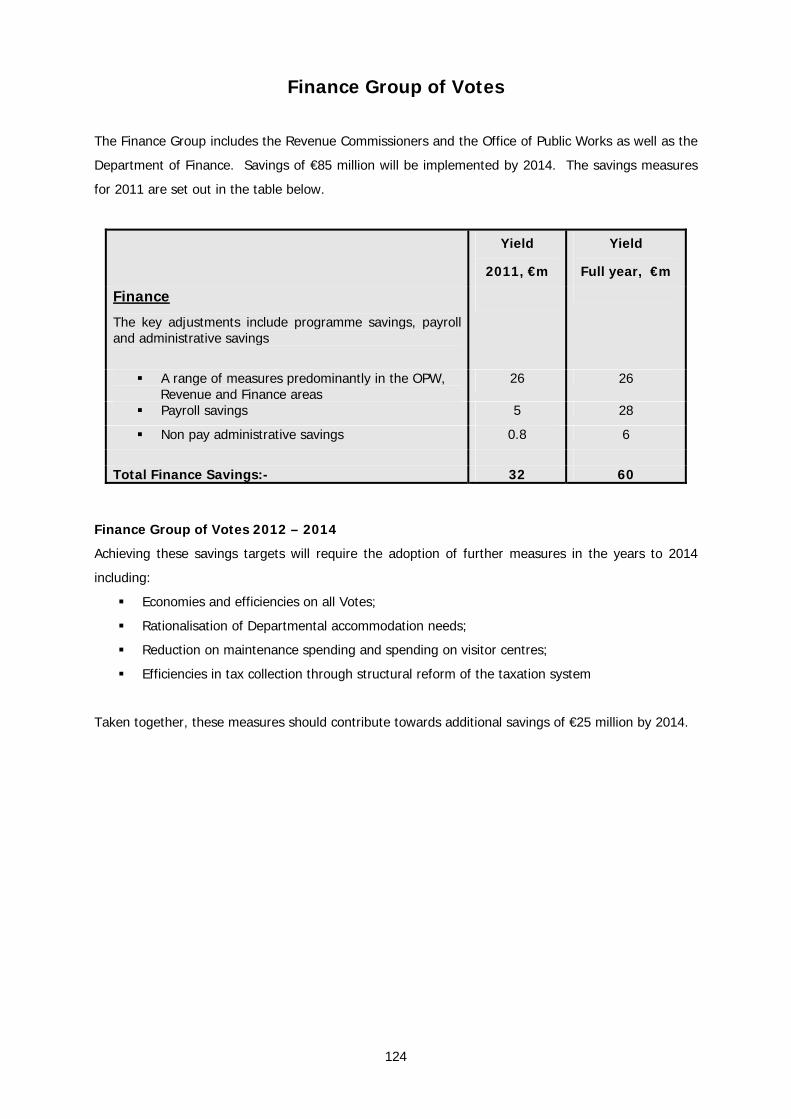
Finance Group of Votes
The Finance Group includes the Revenue Commissioners and the Office of Public Works as well as the
Department of Finance. Savings of €85 million will be implemented by 2014. The savings measures
for 2011 are set out in the table below.
Yield
2011, €m
Yield
Full year, €m
Finance
The key adjustments include programme savings, payroll and administrative savings
A range of measures predominantly in the OPW, Revenue and Finance areas
26 26
Payroll savings 5 28
Non pay administrative savings 0.8 6
Total Finance Savings:- 32 60
Finance Group of Votes 2012 – 2014 Achieving these savings targets will require the adoption of further measures in the years to 2014
including:
Economies and efficiencies on all Votes;
Rationalisation of Departmental accommodation needs;
Reduction on maintenance spending and spending on visitor centres;
Efficiencies in tax collection through structural reform of the taxation system
Taken together, these measures should contribute towards additional savings of €25 million by 2014.
124
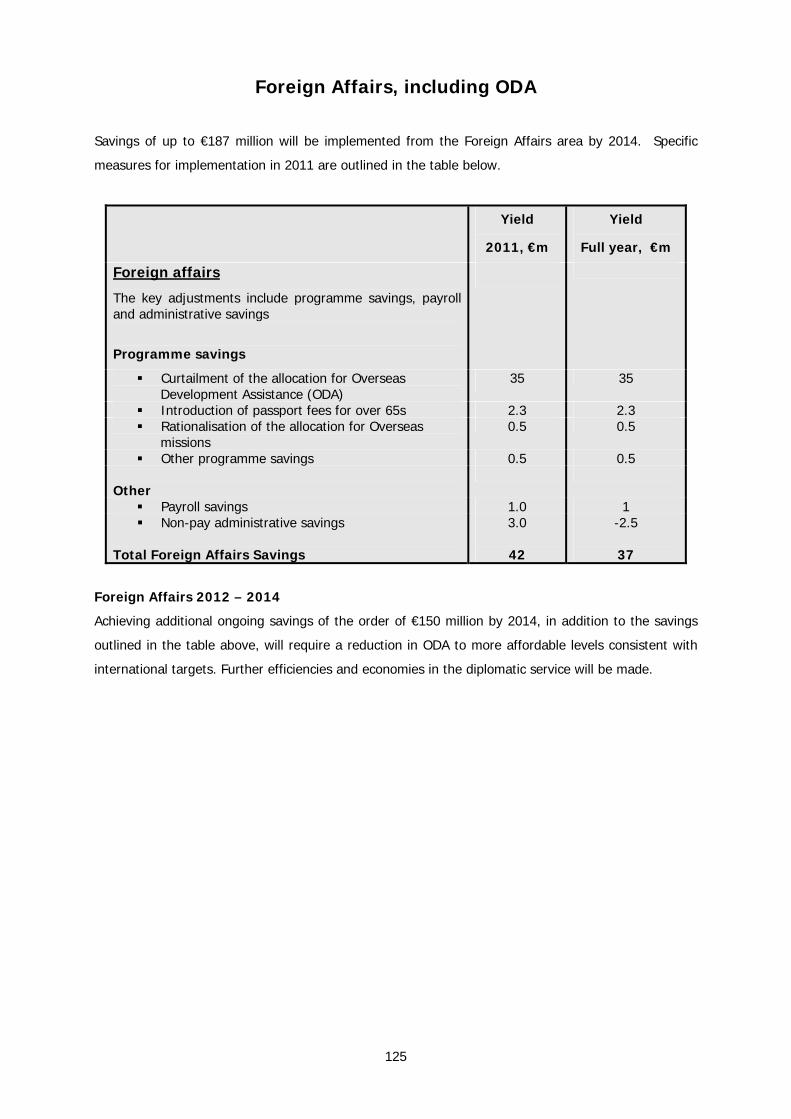
Foreign Affairs, including ODA
Savings of up to €187 million will be implemented from the Foreign Affairs area by 2014. Specific
measures for implementation in 2011 are outlined in the table below.
Yield
2011, €m
Yield
Full year, €m
Foreign affairs
The key adjustments include programme savings, payroll and administrative savings
Programme savings
Curtailment of the allocation for Overseas Development Assistance (ODA)
35 35
Introduction of passport fees for over 65s 2.3 2.3 Rationalisation of the allocation for Overseas
missions 0.5 0.5
Other programme savings 0.5 0.5 Other
Payroll savings 1.0 1 Non-pay administrative savings 3.0 -2.5
Total Foreign Affairs Savings
42
37
Foreign Affairs 2012 – 2014
Achieving additional ongoing savings of the order of €150 million by 2014, in addition to the savings
outlined in the table above, will require a reduction in ODA to more affordable levels consistent with
international targets. Further efficiencies and economies in the diplomatic service will be made.
125
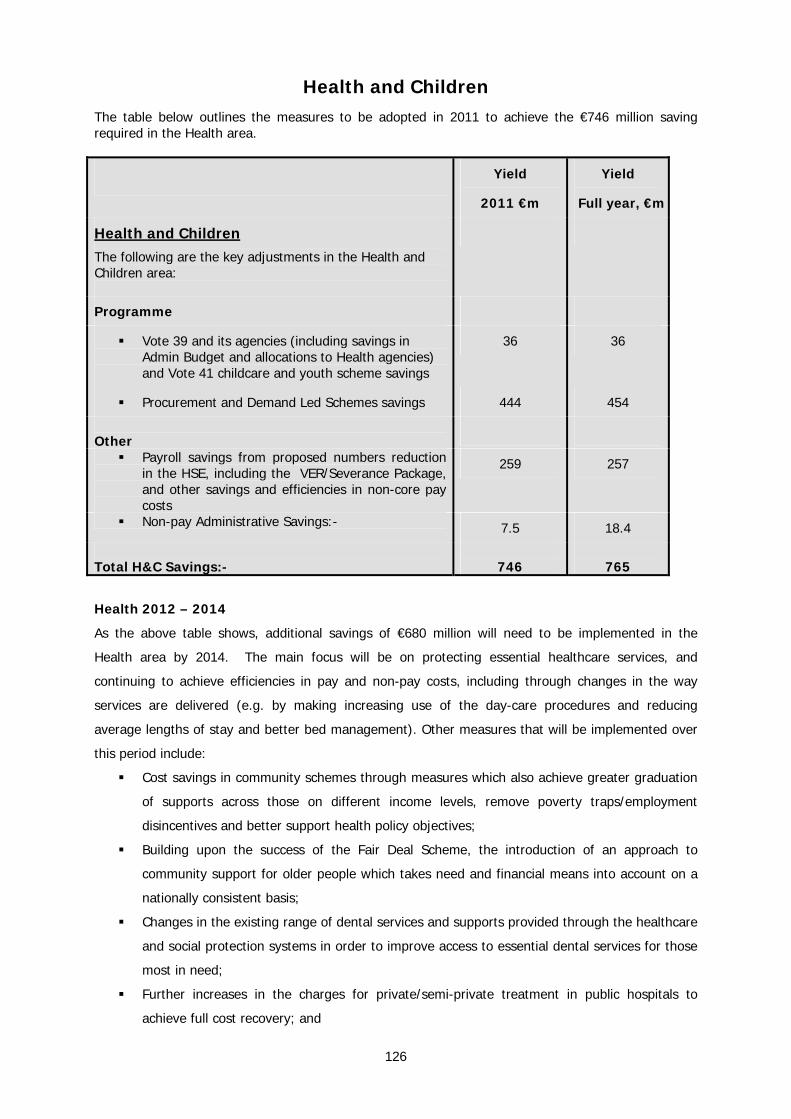
Health and Children The table below outlines the measures to be adopted in 2011 to achieve the €746 million saving required in the Health area.
Yield
2011 €m
Yield
Full year, €m
Health and Children The following are the key adjustments in the Health and Children area:
Programme
Vote 39 and its agencies (including savings in Admin Budget and allocations to Health agencies) and Vote 41 childcare and youth scheme savings
36 36
Procurement and Demand Led Schemes savings 444 454
Other
Payroll savings from proposed numbers reduction in the HSE, including the VER/Severance Package, and other savings and efficiencies in non-core pay costs
259 257
Non-pay Administrative Savings:- 7.5 18.4
Total H&C Savings:-
746
765
Health 2012 – 2014
As the above table shows, additional savings of €680 million will need to be implemented in the
Health area by 2014. The main focus will be on protecting essential healthcare services, and
continuing to achieve efficiencies in pay and non-pay costs, including through changes in the way
services are delivered (e.g. by making increasing use of the day-care procedures and reducing
average lengths of stay and better bed management). Other measures that will be implemented over
this period include:
Cost savings in community schemes through measures which also achieve greater graduation
of supports across those on different income levels, remove poverty traps/employment
disincentives and better support health policy objectives;
Building upon the success of the Fair Deal Scheme, the introduction of an approach to
community support for older people which takes need and financial means into account on a
nationally consistent basis;
Changes in the existing range of dental services and supports provided through the healthcare
and social protection systems in order to improve access to essential dental services for those
most in need;
Further increases in the charges for private/semi-private treatment in public hospitals to
achieve full cost recovery; and
126

The introduction of clinical guidelines to improve prescribing behaviours in order to generate
savings in drug costs, where appropriate, and reduce other treatment costs by providing more
effective drug treatment.
127
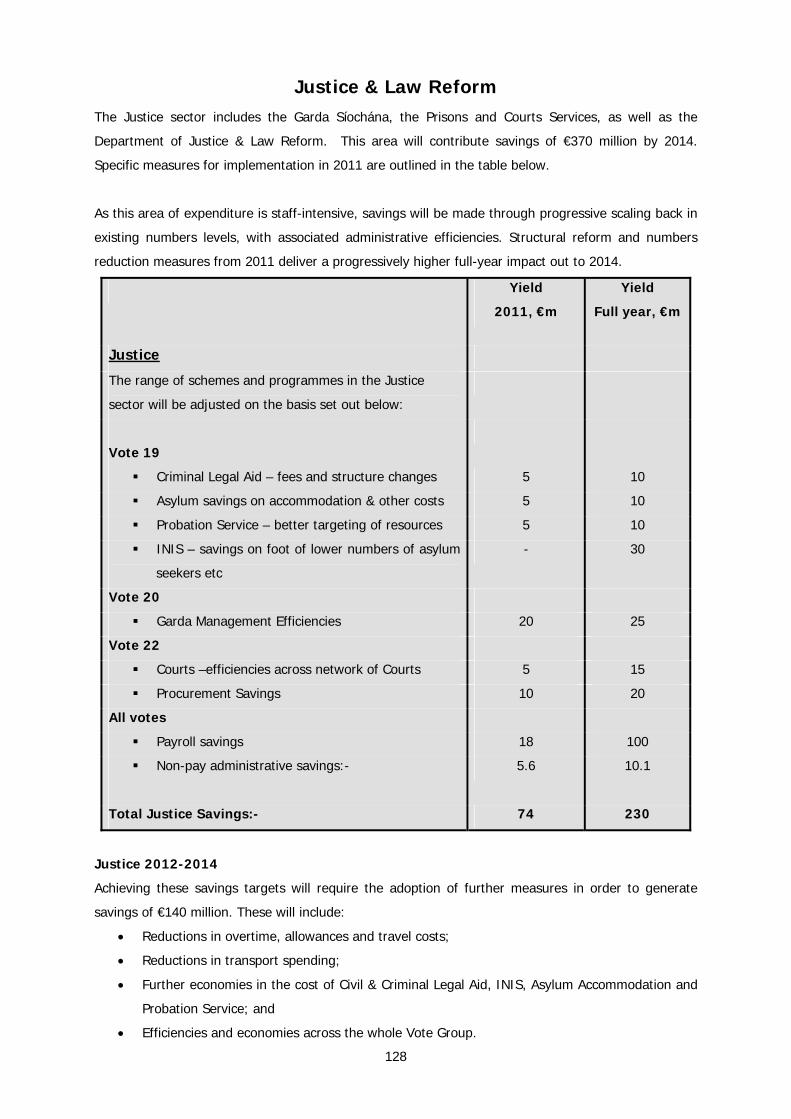
Justice & Law Reform The Justice sector includes the Garda Síochána, the Prisons and Courts Services, as well as the
Department of Justice & Law Reform. This area will contribute savings of €370 million by 2014.
Specific measures for implementation in 2011 are outlined in the table below.
As this area of expenditure is staff-intensive, savings will be made through progressive scaling back in
existing numbers levels, with associated administrative efficiencies. Structural reform and numbers
reduction measures from 2011 deliver a progressively higher full-year impact out to 2014.
Yield
2011, €m
Yield
Full year, €m
Justice
The range of schemes and programmes in the Justice
sector will be adjusted on the basis set out below:
Vote 19
Criminal Legal Aid – fees and structure changes 5 10
Asylum savings on accommodation & other costs 5 10
Probation Service – better targeting of resources 5 10
INIS – savings on foot of lower numbers of asylum
seekers etc
- 30
Vote 20
Garda Management Efficiencies 20 25
Vote 22
Courts –efficiencies across network of Courts 5 15
Procurement Savings 10 20
All votes
Payroll savings 18 100
Non-pay administrative savings:-
5.6 10.1
Total Justice Savings:- 74 230
Justice 2012-2014
Achieving these savings targets will require the adoption of further measures in order to generate
savings of €140 million. These will include:
• Reductions in overtime, allowances and travel costs;
• Reductions in transport spending;
• Further economies in the cost of Civil & Criminal Legal Aid, INIS, Asylum Accommodation and
Probation Service; and
• Efficiencies and economies across the whole Vote Group.
128
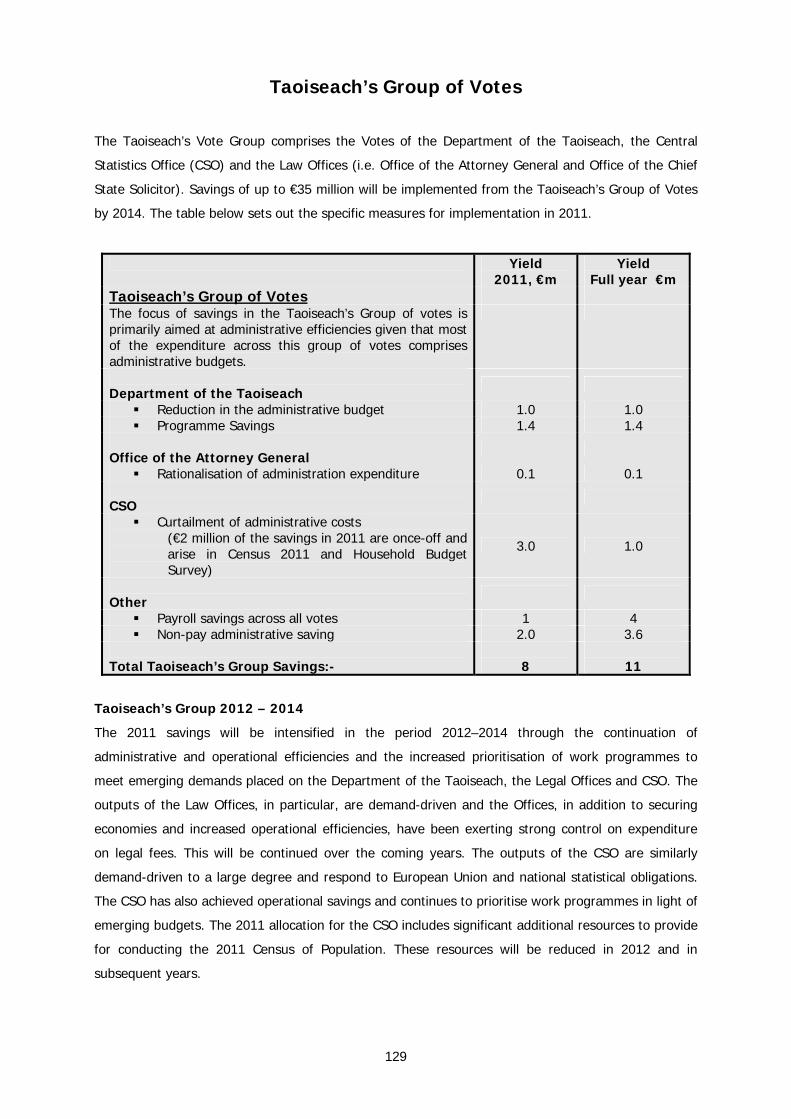
Taoiseach’s Group of Votes
The Taoiseach’s Vote Group comprises the Votes of the Department of the Taoiseach, the Central
Statistics Office (CSO) and the Law Offices (i.e. Office of the Attorney General and Office of the Chief
State Solicitor). Savings of up to €35 million will be implemented from the Taoiseach’s Group of Votes
by 2014. The table below sets out the specific measures for implementation in 2011.
Yield 2011, €m
Yield Full year €m
Taoiseach’s Group of Votes The focus of savings in the Taoiseach’s Group of votes is primarily aimed at administrative efficiencies given that most of the expenditure across this group of votes comprises administrative budgets.
Department of the Taoiseach
Reduction in the administrative budget 1.0 1.0 Programme Savings 1.4 1.4
Office of the Attorney General
Rationalisation of administration expenditure 0.1 0.1 CSO
Curtailment of administrative costs (€2 million of the savings in 2011 are once-off and arise in Census 2011 and Household Budget Survey)
3.0 1.0
Other
Payroll savings across all votes 1 4 Non-pay administrative saving 2.0 3.6
Total Taoiseach’s Group Savings:-
8
11
Taoiseach’s Group 2012 – 2014
The 2011 savings will be intensified in the period 2012–2014 through the continuation of
administrative and operational efficiencies and the increased prioritisation of work programmes to
meet emerging demands placed on the Department of the Taoiseach, the Legal Offices and CSO. The
outputs of the Law Offices, in particular, are demand-driven and the Offices, in addition to securing
economies and increased operational efficiencies, have been exerting strong control on expenditure
on legal fees. This will be continued over the coming years. The outputs of the CSO are similarly
demand-driven to a large degree and respond to European Union and national statistical obligations.
The CSO has also achieved operational savings and continues to prioritise work programmes in light of
emerging budgets. The 2011 allocation for the CSO includes significant additional resources to provide
for conducting the 2011 Census of Population. These resources will be reduced in 2012 and in
subsequent years.
129

Tourism, Culture & Sport
The Tourism, Culture & Sport area will contribute savings of €76 million by 2014. The specific
measures for implementation in 2011 are outlined in the table below.
Yield
2011, €m
Yield
Full year, €m
Tourism, Culture & Sport
The savings measures for this area comprise programme savings across the arts, culture and sport sectors as well as payroll and administrative savings. The key adjustments are set out below:
Programme savings
Reduction in tourism expenditure through operational efficiencies, prioritisation of activities and more focused tourism marketing investment
5 5
Reduced funding for sporting bodies and agencies including Irish Sports Council and National Sports Campus
3 3
Reduced allocations to cultural institutions and cultural projects
5 5
Other
Payroll savings 0 6 Non-pay administrative savings 4.0 7.2
Total Tourism, Culture & Sport Savings:- 17 26
Tourism, Culture & Sport 2012 – 2014
Additional savings amounting to €50 million will be required post 2011 involving:
• reductions in the allocations to sporting bodies and grants to local sports organisations;
• reduction in allocation to the Arts Council and other Cultural activities; and
• better focusing and prioritisation of Tourism spending.
130
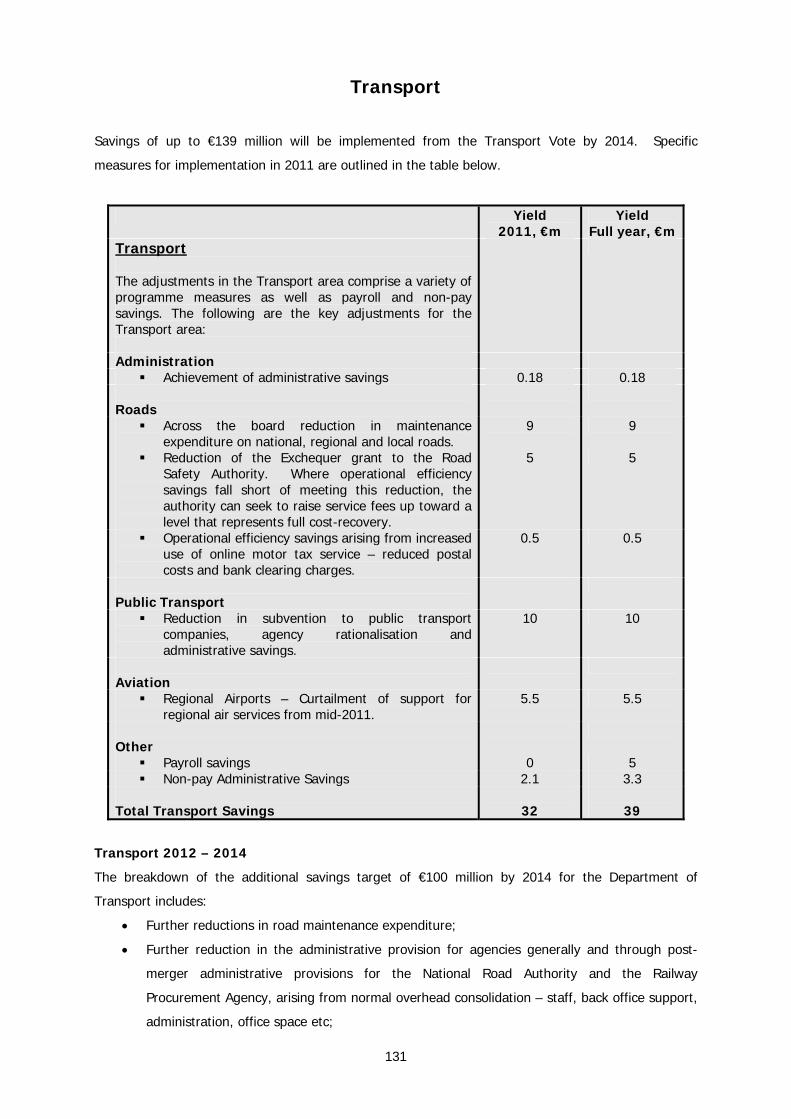
Transport
Savings of up to €139 million will be implemented from the Transport Vote by 2014. Specific
measures for implementation in 2011 are outlined in the table below.
Yield 2011, €m
Yield Full year, €m
Transport The adjustments in the Transport area comprise a variety of programme measures as well as payroll and non-pay savings. The following are the key adjustments for the Transport area:
Administration Achievement of administrative savings 0.18 0.18
Roads
Across the board reduction in maintenance expenditure on national, regional and local roads.
9 9
Reduction of the Exchequer grant to the Road Safety Authority. Where operational efficiency savings fall short of meeting this reduction, the authority can seek to raise service fees up toward a level that represents full cost-recovery.
5 5
Operational efficiency savings arising from increased use of online motor tax service – reduced postal costs and bank clearing charges.
0.5 0.5
Public Transport
Reduction in subvention to public transport companies, agency rationalisation and administrative savings.
10 10
Aviation
Regional Airports – Curtailment of support for regional air services from mid-2011.
5.5 5.5
Other
Payroll savings 0 5 Non-pay Administrative Savings 2.1 3.3
Total Transport Savings
32
39
Transport 2012 – 2014
The breakdown of the additional savings target of €100 million by 2014 for the Department of
Transport includes:
• Further reductions in road maintenance expenditure;
• Further reduction in the administrative provision for agencies generally and through post-
merger administrative provisions for the National Road Authority and the Railway
Procurement Agency, arising from normal overhead consolidation – staff, back office support,
administration, office space etc;
131

• Future funding requirements for agencies should be increasingly met from a raising of fees
towards full cost recovery levels; and
• Further rationalisation of services through implementation of the Deloitte Report will mean
reduced levels of subvention in future years.
132
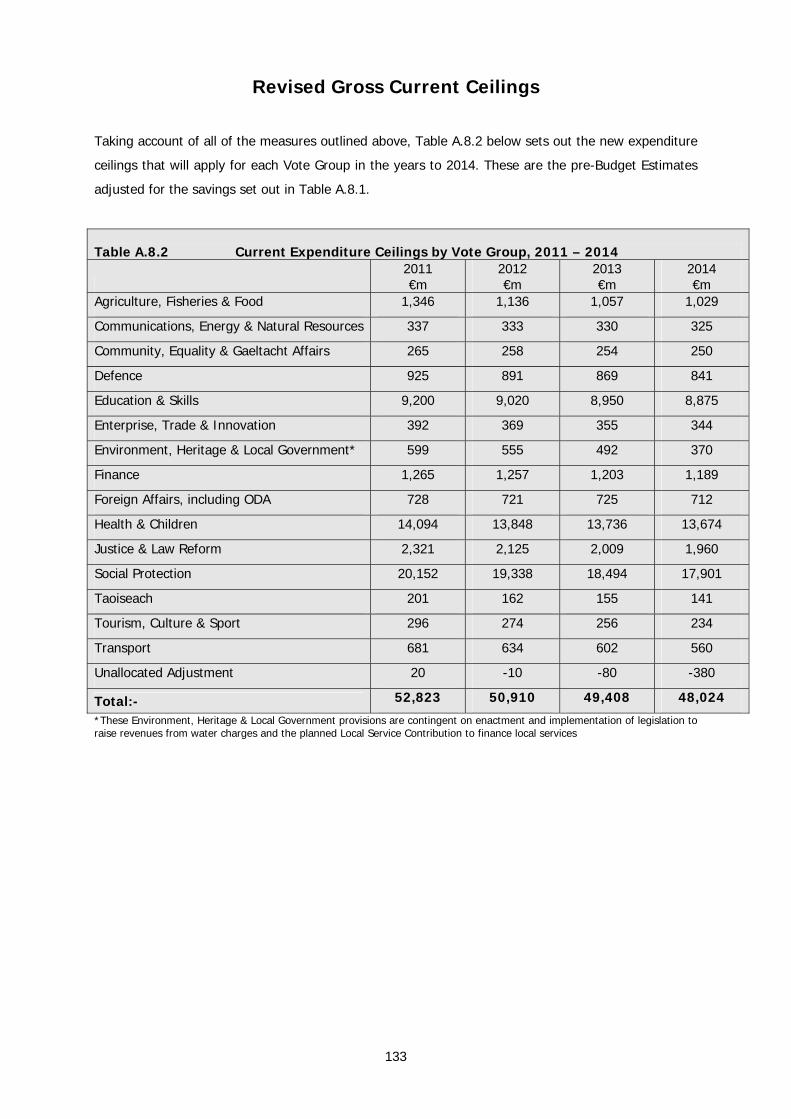
Revised Gross Current Ceilings
Taking account of all of the measures outlined above, Table A.8.2 below sets out the new expenditure
ceilings that will apply for each Vote Group in the years to 2014. These are the pre-Budget Estimates
adjusted for the savings set out in Table A.8.1.
Table A.8.2 Current Expenditure Ceilings by Vote Group, 2011 – 2014
2011 €m
2012 €m
2013 €m
2014 €m
Agriculture, Fisheries & Food 1,346 1,136 1,057 1,029
Communications, Energy & Natural Resources 337 333 330 325
Community, Equality & Gaeltacht Affairs 265 258 254 250
Defence 925 891 869 841
Education & Skills 9,200 9,020 8,950 8,875
Enterprise, Trade & Innovation 392 369 355 344
Environment, Heritage & Local Government* 599 555 492 370
Finance 1,265 1,257 1,203 1,189
Foreign Affairs, including ODA 728 721 725 712
Health & Children 14,094 13,848 13,736 13,674
Justice & Law Reform 2,321 2,125 2,009 1,960
Social Protection 20,152 19,338 18,494 17,901
Taoiseach 201 162 155 141
Tourism, Culture & Sport 296 274 256 234
Transport 681 634 602 560
Unallocated Adjustment 20 -10 -80 -380
Total:- 52,823 50,910 49,408 48,024
*These Environment, Heritage & Local Government provisions are contingent on enactment and implementation of legislation to raise revenues from water charges and the planned Local Service Contribution to finance local services
133

Annex 9
eGovernment and ICT
eGovernment
• Since 2008, the Government has ensured a renewed focus on achieving progress with
eGovernment. This has resulted in the development of a comprehensive eGovernment Strategy,
detailed eGovernment plans in individual civil and public service bodies, and a Rolling Programme
of priority eGovernment projects. The current Rolling Programme contains 20 key projects. This
will change over time as projects are completed and new ones come on-stream.
• The current eGovernment Strategy focuses on enhanced delivery of information electronically,
enhanced electronic delivery of services, and enhanced use of shared technology approaches. It
recommends ways of overcoming some of the difficulties and barriers there are with putting
certain information and services online. The eGovernment plans of individual bodies are being
developed in accordance with these recommendations.
• As a consequence, most public bodies now publish comprehensive information on their services
and schemes online, a wide range of public services are now either fully or partially available
online, and many public bodies are now using shared technology approaches to deliver these.
The result of this renewed focus is evidenced by Ireland’s improvement from 17th to joint 7th in
the last EU Commission e-Government Benchmark and by the hundreds of facilities now available
online from the Public Service. Additionally, Ireland is now considered to be one of the best
performers in eProcurement by the EU Commission.
• The Department of Finance is responsible for overseeing and co-ordinating this effort and reports
regularly to the Cabinet Committee on Transforming Public Service on the rate of progress being
achieved to ensure that the focus is maintained at the highest levels.
• The following activities are now underway/being planned:
o Preparations are being made to publicise the extent of online information and services, to
ensure that people and businesses are more aware of what is available and to encourage
greater uptake of the online channels;
o The Department of Finance and the Citizens Information Board (CIB) are developing a
single Government portal providing access to information on public services, online access
to these services, and detailed location and contact information on public bodies. The
intention is to launch the new portal early in the New Year;
o The Department of Finance has developed a central system to provide a single view of
the identity of Public Service customers (known as the Single Customer View), and has
successfully piloted it and a range of associated applications with public bodies. This
solution will be instrumental in helping public bodies to improve the quality of customer
identity data, improve assurances around identity claims, remove duplication of effort
134

from recording and checking processes, and facilitate the provision of online identity
services. The Department is now working on the legal basis necessary to put this solution
into production with the intention of doing that during the course of 2011;
o Further phases of the eGovernment Strategy are being considered:
online channels become most effective and give the most opportunity for driving
efficiencies and cost-savings when utilised extensively. A range of mechanisms,
including administrative and legal ones, will be explored to enhance the uptake of
electronic services and self-service;
while there is already a great deal of back-end integration between the systems
and processes of public bodies, there is scope for doing more. Mechanisms for
doing this will be explored and advised on;
a number of public bodies already publish some of their datasets online. The
potential for doing this more generally is being explored both within the Public
Service and with academic and private sector organisations. This exploration will
seek to identify how such publishing can be done in a way that provides value to
the general public and facilitates the development of both free and commercial
products;
a number of public bodies have already used online collaboration facilities with
varying degrees of success. The lessons from these early adopters are being
examined to determine how best to exploit collaborative technologies to give
citizens and businesses more insight on developments as they occur, greater
involvement in policy deliberations where applicable, and greater access to
mechanisms for giving their views; and
a comprehensive Identity Management Policy for the public service is being
developed. This is necessary given the dependence on many schemes and
services on proper identification of customers, the need to facilitate greater
personalisation in the delivery of services, and the need to comply with
international legislation and obligations. Once the research and consultations are
completed, a proposal will be submitted to Government for consideration. It is
intended to do this during the course of 2011.
Central ICT Arrangements
• The Department of Finance has taken the lead in implementing a range of shared ICT approaches
for the Public Service. These include:
o Government Networks which provides all public bodies with a high-capacity, secure and
resilient central Government Network to facilitate easy interconnectivity between them,
protected access to the Internet, direct access to shared central services and applications,
and interconnectivity with a wide range of voice and data service providers;
o A nationwide secure digital radio communications infrastructure for all of the emergency
and security services of the State; and
135

o A range of ICT procurement frameworks covering PCs, laptops, printers, mobile voice and
data services, fixed voice and data services. These frameworks have resulted in savings of
35%-50% in costs to public bodies.
• The use of these procurement approaches has now been mandated on all public bodies to ensure
that the maximum savings possible are garnered over the lifetime of this Plan.
• Other ICT procurement opportunities, especially in the areas of software licensing and support,
are being examined to determine if similar approaches can be employed.
• The Department of Finance is working with other public bodies and a range of private companies
to determine an appropriate approach for Government ‘Cloud Computing’. A number of pilots are
being planned. Although it will take a number of years to test and deploy models and facilitate
migrations, Government Cloud Computing has the potential to facilitate considerable efficiencies
and cost savings through reduced duplication and resource utilisation.
136
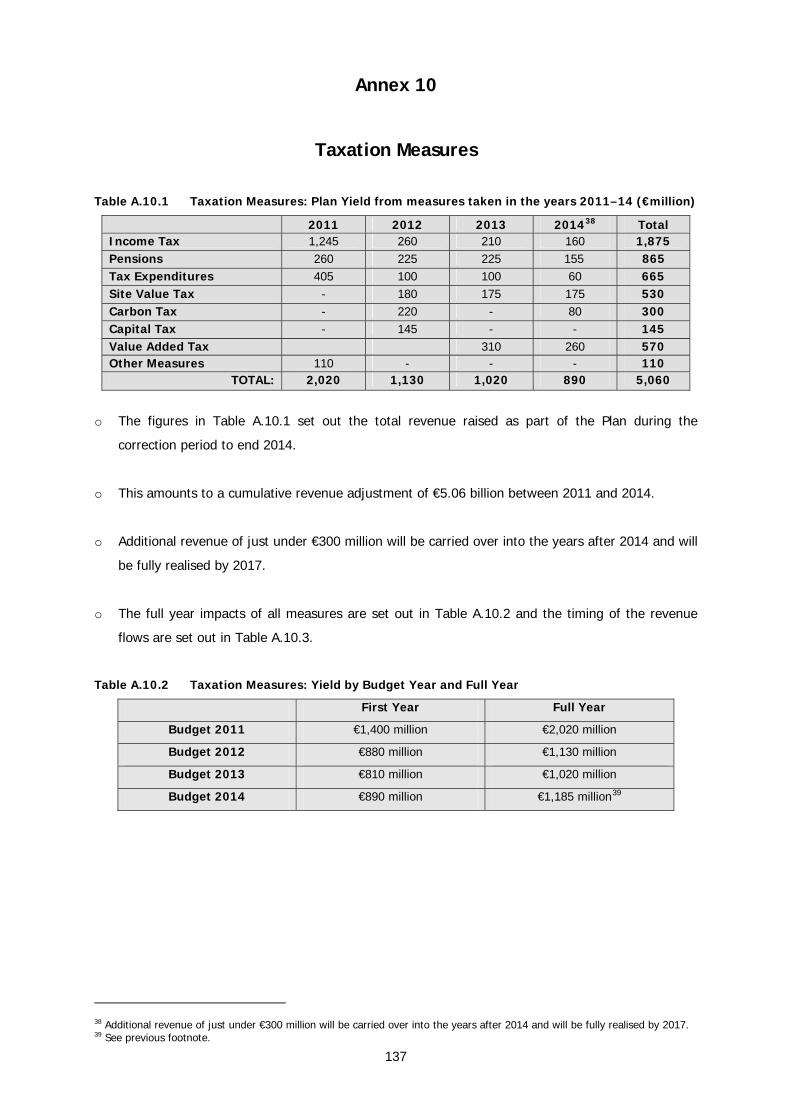
Annex 10
Taxation Measures
Table A.10.1 Taxation Measures: Plan Yield from measures taken in the years 2011–14 (€million)
2011 2012 2013 201438 Total Income Tax 1,245 260 210 160 1,875 Pensions 260 225 225 155 865 Tax Expenditures 405 100 100 60 665 Site Value Tax - 180 175 175 530 Carbon Tax - 220 - 80 300 Capital Tax - 145 - - 145 Value Added Tax 310 260 570 Other Measures 110 - - - 110
TOTAL: 2,020 1,130 1,020 890 5,060
o The figures in Table A.10.1 set out the total revenue raised as part of the Plan during the
correction period to end 2014.
o This amounts to a cumulative revenue adjustment of €5.06 billion between 2011 and 2014.
o Additional revenue of just under €300 million will be carried over into the years after 2014 and will
be fully realised by 2017.
o The full year impacts of all measures are set out in Table A.10.2 and the timing of the revenue
flows are set out in Table A.10.3.
Table A.10.2 Taxation Measures: Yield by Budget Year and Full Year
First Year Full Year
Budget 2011 €1,400 million €2,020 million
Budget 2012 €880 million €1,130 million
Budget 2013 €810 million €1,020 million
Budget 2014 €890 million €1,185 million39
38 Additional revenue of just under €300 million will be carried over into the years after 2014 and will be fully realised by 2017. 39 See previous footnote.
137
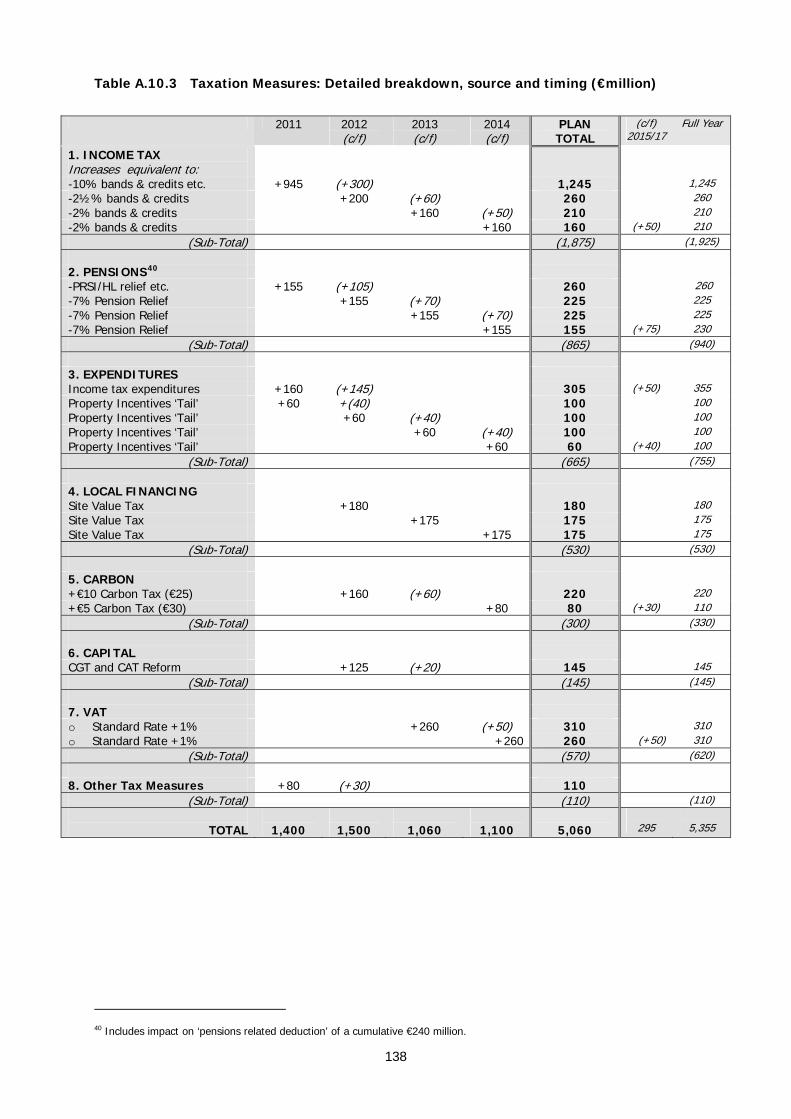
Table A.10.3 Taxation Measures: Detailed breakdown, source and timing (€million)
2011 2012 (c/f)
2013 (c/f)
2014 (c/f)
PLAN TOTAL
(c/f) 2015/17
Full Year
1. INCOME TAX Increases equivalent to:
-10% bands & credits etc. +945 (+300) 1,245 1,245 -2½% bands & credits +200 (+60) 260 260 -2% bands & credits +160 (+50) 210 210 -2% bands & credits +160 160 (+50) 210
(Sub-Total) (1,875) (1,925) 2. PENSIONS40 -PRSI/HL relief etc. +155 (+105) 260 260 -7% Pension Relief +155 (+70) 225 225 -7% Pension Relief +155 (+70) 225 225 -7% Pension Relief +155 155 (+75) 230
(Sub-Total) (865) (940) 3. EXPENDITURES Income tax expenditures +160 (+145) 305 (+50) 355 Property Incentives ‘Tail’ +60 +(40) 100 100 Property Incentives ‘Tail’ +60 (+40) 100 100 Property Incentives ‘Tail’ +60 (+40) 100 100 Property Incentives ‘Tail’ +60 60 (+40) 100
(Sub-Total) (665) (755) 4. LOCAL FINANCING Site Value Tax +180 180 180 Site Value Tax +175 175 175 Site Value Tax +175 175 175
(Sub-Total) (530) (530) 5. CARBON +€10 Carbon Tax (€25) +160 (+60) 220 220 +€5 Carbon Tax (€30) +80 80 (+30) 110
(Sub-Total) (300) (330) 6. CAPITAL CGT and CAT Reform +125 (+20) 145 145
(Sub-Total) (145) (145) 7. VAT o Standard Rate +1% +260 (+50) 310 310 o Standard Rate +1% +260 260 (+50) 310
(Sub-Total) (570) (620) 8. Other Tax Measures +80 (+30) 110
(Sub-Total) (110) (110)
TOTAL
1,400
1,500
1,060
1,100
5,060
295
5,355
40 Includes impact on ‘pensions related deduction’ of a cumulative €240 million.
138
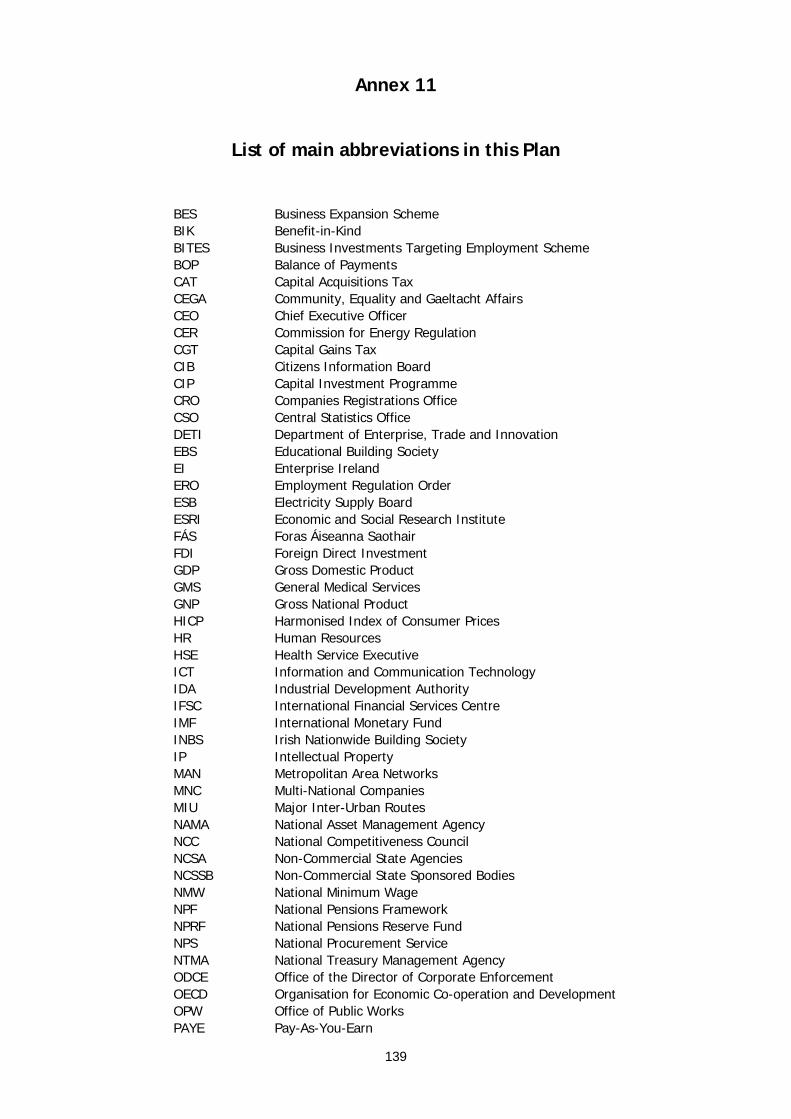
Annex 11
List of main abbreviations in this Plan
BES Business Expansion Scheme BIK Benefit-in-Kind BITES Business Investments Targeting Employment Scheme BOP Balance of Payments CAT Capital Acquisitions Tax CEGA Community, Equality and Gaeltacht Affairs CEO Chief Executive Officer CER Commission for Energy Regulation CGT Capital Gains Tax CIB Citizens Information Board CIP Capital Investment Programme CRO Companies Registrations Office CSO Central Statistics Office DETI Department of Enterprise, Trade and Innovation EBS Educational Building Society EI Enterprise Ireland ERO Employment Regulation Order ESB Electricity Supply Board ESRI Economic and Social Research Institute FÁS Foras Áiseanna Saothair FDI Foreign Direct Investment GDP Gross Domestic Product GMS General Medical Services GNP Gross National Product HICP Harmonised Index of Consumer Prices HR Human Resources HSE Health Service Executive ICT Information and Communication Technology IDA Industrial Development Authority IFSC International Financial Services Centre IMF International Monetary Fund INBS Irish Nationwide Building Society IP Intellectual Property MAN Metropolitan Area Networks MNC Multi-National Companies MIU Major Inter-Urban Routes NAMA National Asset Management Agency NCC National Competitiveness Council NCSA Non-Commercial State Agencies NCSSB Non-Commercial State Sponsored Bodies NMW National Minimum Wage NPF National Pensions Framework NPRF National Pensions Reserve Fund NPS National Procurement Service NTMA National Treasury Management Agency ODCE Office of the Director of Corporate Enforcement OECD Organisation for Economic Co-operation and Development OPW Office of Public Works PAYE Pay-As-You-Earn
139
140
PIAB Personal Injuries Assessment Board PIK Payment in Kind PLC Post Leaving Certificate PRSI Pay Related Social Insurance R&D Research and Development REA Registered Employment Agreement SFI Science Foundation Ireland SFT Standard Fund Threshold SME Small and Medium Enterprises SPU Stability Programme Update STI Science, Technology and Innovation VAT Value Added Tax VEC Vocational Education Committee VFM Value for Money VTOS Vocational Training Opportunities Scheme