Embed Size (px)
Citation preview
Rheol Acta (2002) 41: 61–76� Springer-Verlag 2002 ORIGINAL CONTRIBUTION
Susanne E. Mall-Gleissle
Wolfgang Gleissle
Gareth H. McKinley
Hans Buggisch
The normal stress behaviour of suspensionswith viscoelastic matrix fluids
Received: 20 December 2000Accepted: 7 May 2001
S. E. Mall-Gleissle (&)Universitaet Karlsruhe (TH)Institut fuer Technische Thermodynamikund Kaeltetechnik, Engler-Bunte-Ring 2176131 KarlsruheGermanye-mail: [email protected]
W. Gleissle Æ H. BuggischUniversitaet Karlsruhe (TH)Institut fuer MechanischeVerfahrenstechnik und Mechanik76128 Karlsruhe, Germany
G. H. McKinleyMassachusetts Instituteof Technology (MIT)Department of Mechanical Engineering77 Massachusetts Avenue, CambridgeMA 02139-4307, USA
Abstract We investigate the varia-tions in the shear stress and the firstand second normal stress differencesof suspensions formulated withviscoelastic fluids as the suspendingmedium. The test materials comprisetwo different silicone oils for thematrix fluids and glass spheres oftwo different mean diameters span-ning a range of volume fractionsbetween 5 and 25%. In agreementwith previous investigations, theshear stress–shear rate functions ofthe viscoelastic suspensions werefound to be of the same form as theviscometric functions of their matrixfluids, but progressively shiftedalong the shear rate axis to lowershear rates with increasing solidfraction. The normal stress differ-ences in all of the suspensionsexamined can be conveniently rep-resented as functions of the shearstress in the fluid. When plotted inthis form, the first normal stressdifference, as measured with a coneand plate rheometer, is positive inmagnitude but strongly decreaseswith increasing solid fraction. Thecontributions of the first and thesecond normal stress differences areseparated by using normal forcemeasurements with parallel platefixtures in conjunction with thecone-and-plate observations. In thisway it is possible for the first time toquantify successfully the variationsin the second normal stress differ-
ence of viscoelastic suspensions forsolid fractions of up to 25 vol.%. Incontrast to measurements of the firstnormal stress difference, the secondnormal stress difference is negativewith a magnitude that increases withincreasing solid content. The chang-es in the first and second normalstress differences are also stronglycorrelated to each other: The relativeincrease in the second normal stressdifference is equal to the relativedecrease of the first normal stressdifference at the same solid fraction.The variations of the first as well asof the second normal stress differ-ence are represented by power lawfunctions of the shear stress with anunique power law exponent that isindependent of the solid fraction.The well known edge effects thatarise in cone-and-plate as well asparallel-plate rheometry and limitthe accessible measuring range inhighly viscoelastic materials to lowshear rates could be partially sup-pressed by utilizing a custom-designed guard-ring arrangement. Aprocedure to correct the guard-ringinfluence on torque and normalforce measurements is alsopresented.
Key words Viscoelastic suspension ÆHighly filled material Æ First normalstress difference Æ Second normalstress difference Æ Normal stressproduct Æ Edge fracture
Introduction
Due to their prevalence in commercial processing oper-ations, there is a continuing interest in understanding theviscometric properties of highly filled viscoelastic fluids.The normal stress differences in suspensions based onviscoelastic matrix fluids are often of similar magnitudeas the shear stress, even at low shear rates. The resultingstress distributions arising in a complex flow such ascapillary due or extruder affect a number of importantprocessing criteria which are commonly grouped underthe broad heading of ’processability’. Relevant parame-ters may include the recoverable shear, the magnitude ofthe extrudate swell, and the critical conditions for onsetof flow instabilities. Further considerations are providedin the recent review of Hornsby (1999).The theoretical description of the normal stress
differences in concentrated suspensions formulated withNewtonian suspending fluids is now fairly well under-stood. The magnitude and sign of the normal stressdifferences depends on the magnitude of the dimension-less shear rate, or Peclet number, measuring the relativeimportance of the imposed viscous shear stress andBrownian motion. Theoretical scaling arguments andStokesian dynamics calculations show that in colloidaldispersions the normal stress differences vary linearlywith the magnitude of the deformation rate at very smalldimensionless shear rates. At higher Peclet numbers thenormal stress behaviour becomes more complex withshear thinning and the possibility of changes in sign athigh deformation rates (for further details see Brady andVicic 1995; Phan-Thien et al. 1999; Foss and Brady2000). Careful viscometric measurements in a number ofdifferent torsional flow configurations using suspensionswith viscous, but Newtonian, matrix fluids appear tosupport the model predictions at high Peclet numbers(Zarraga et al. 2000).Much less is known theoretically or experimentally
about the normal stress differences in highly-filledsuspensions formulated with viscoelastic matrix fluids.The first normal stress difference behaviour of suspen-sions has been quantified for some materials such asfilled rubbers (Tanaka and White 1980); howeverinstabilities such as edge fracture typically limit therange of deformation rates that can be examined. Thereare a few publications indicating that the second normalstress differences in viscoelastic suspensions may behigher in magnitude than in the pure liquid and mayeven overcome the magnitude of the first normal stressdifference (Tanaka and White 1980; Ohl and Gleissle1992). In the most comprehensive investigation to date,Aral and Kalyon (1997) examined a number of rheolo-gical properties for viscoelastic suspensions formulatedusing hollow spherical glass beads in a highly viscoussilicone oil over a broad range of volume fractions(0.1 £ cv £ 0.6). For volume fractions above 30% the
first normal stress difference measured in steady tor-sional shear flow was found to be negative with amagnitude that increased with deformation rate andvolume fraction. At very large volume fractions(cv > 0.4) additional complexities such as the failureof time-temperature superposition and the presence of ameasurable yield stress were documented. Negativenormal stress differences (N1 ) N2) > 10 kPa have alsobeen measured in glass bead-silicone oil suspensionsfrom Gleissle (1996).Microstructural modeling of such viscoelastic phe-
nomena are just beginning; however, Brownian dynam-ics calculations using a linear viscoelastic (Maxwell)matrix fluid appear to agree with some of the experi-mental observations of Aral and Kalyon for smallimposed deformations (Schaink et al. 2000). However,theoretical consideration of the effects of normal stressdifferences generated in the matrix fluid at large imposedshear strains have yet to be considered. It is to be hopedthat experimental measurements of general rheologicaltrends or scaling results for filled viscoelastic fluidsmight be used to guide future theoretical considerations.One common experimental observation is that the first
normal stress difference in a filled viscoelastic fluid is apower-law function of the imposed shear stress such thatN1 � sn with a power-law exponent (n) that appears todepend on the specific matrix fluid used in preparing thesuspension. Ohl and Gleissle (1992, 1993) obtainedvalues of n » 1.6 for glass spheres in viscoelastic siliconeoils using torsional flows in the cone-and-plate andparallel-plate geometries. Markovic et al. (2000) usedmeasurements of the recoverable shear and the wall shearstress in a capillary extrusion geometry to infer a value ofn » 1.3 for a number of ethylene-propylene-diene(EPDM) rubbers and a wide range of different curingformulations. Liang and Li (1999) used capillary rheo-metry measurements in glass-bead filled LDPE compos-ites and found n » 1 for volume fractions between 10 and40 vol.%. Corresponding measurements of the secondnormal stress difference are much scarcer due to the needfor special rheometric techniques (see, for example,Petersen 1974; Lee et al. 1992). One of the principalgoals of this paper is to quantify the first and the secondnormal stress differences of filled viscoelastic fluids and toshow that there are strong correlations between thevariations in N1 and N2 with both deformation rate andvolume fraction of filler. A new material constant isintroduced which combines information about both N1
and N2, and which is independent of the solid fillerfraction (Gleissle et al. 1998, 2000).
Materials and methods
To investigate the shear and the normal stress behaviour of filledmaterials with viscoelastic matrix fluids, two groups of model
62
suspensions were formulated. The first series consists of asilicone oil matrix with a zero-shear-viscosity g0 ¼ 103 Pa s(AK106 Wacker Chemie) filled with sieved glass beads of�xx¼ 4 lm average diameter. The second group was formulatedwith a lower viscosity silicone oil with g0 ¼ 400 Pa s (DOW 3 Æ105 Dow-Corning) and monodisperse glass spheres of �xx¼ 0.5 lmdiameter. The volume-fraction cv of the solid has been variedbetween 0 � cv � 25%:A torsional rheometer (Rheometric Scientific RMS 800) was
used to measure the three viscometric functions; i.e., the shearstress s _ccð Þ, and the first and second normal stress differences N1 _ccð Þand N2 _ccð Þ. This rate-controlled instrument is equipped with arebalance torque and force transducer. A variety of cone-and-plateas well as plate-and-plate fixtures have been used. The dimensionsof the different geometries are given in Table 1.
The shear stress functions (from CP and PP fixtures)
Agreement between the shear stress functions measured usingcone-and-plate (CP) fixtures and parallel-plate (PP) fixtures(denoted henceforth sCP and sPP) was first tested. Here sPP isthe true steady state shear stress at the rim (r¼R) in a parallelplate device. If MCP and MPP are the torques measured in theCP- and PP-devices respectively then
sCP ¼ 3
2pR3�MCP ð1Þ
sPP ¼ MPP
2pR33þ d lnMPP
d ln _cc
� �: ð2Þ
For further details see for example Bird et al. (1987) or Powell(1998).The resulting shear stresses of the virgin silicone oil AK 106 and
a series of suspensions formulated using this fluid as the suspendingmatrix fluid are plotted as a function of the shear rate in Fig. 1. Thedata demonstrate that the measurements with CP- and PPgeometries give equivalent results as expected. Deviations betweenCP- and PP results are within the magnitude of the plottingsymbols. This agreement is of fundamental importance for themethod used to separate N1 and N2 (with CP and PP measure-ments) as described later.It is commonly appreciated that viscoelastic liquids with large
normal stresses tend to exhibit flow instabilities in steadytorsional shear flow which limit the maximum shear rateachievable (Hutton 1969; Gleissle 1974; Tanner and Keentok1983). It is now generally accepted that these instabilities resultfrom the action of the second normal stress difference on defectsnaturally arising at the free surface at the outer rim of a cone-and-plate or parallel-and-plate fixture (Lee et al. 1992; Keentokand Xue 1999). Similar edge fracture instabilities are alsoobserved in filled suspensions formulated using Newtoniansuspending fluids and also appear to correlate well with themagnitude of the (negative) second normal stress difference(Zarraga et al. 2000). To avoid these instabilities and to extendthe measuring range towards higher shear rates or shear stresses,a special guard-ring assembly was constructed as shown inFig. 2. This fixture was based on the designs of Gleissle (1976,
1978) and removes the free surface from the edge of the fixture.The modified geometry and increased gap between the stationaryand rotating surfaces shifts the critical condition for onset ofinstability to higher deformation rates. Using this guard-ring themeasuring range could be extended by a factor of approximatelytwo or three.
Table 1 Dimensions of the cone-and-plate (CP) and parallel-plate (PP) rheometer fixtures used in this study
DOW 3 Æ 105
cv
CPR/mm
a/� PPR/mm
H/mm AK 106
cv
CPR/mm
a/� PPR/mm
H/mm
0 30 2.3 30 1.1 0 12.5 5.7 12.5 1.050.125 12.5 5.7 30 1.35 0.05 12.5 5.7 12.5 1.00.18 12.5 5.7 30 1.05 0.15 12.5 5.7 12.5 1.00.25 12.5 5.7 30 1.05 0.25 12.5 5.7 12.5 0.9
Fig. 1 Flow curves for the AK 106 matrix fluid and suspensions withcv¼ 0.05, 0.15, 0.25 measured in cone-and-plate and parallel-plategeometries
Fig. 2 Schematic drawing of the guard-ring assembly employed toincrease the range of shear rates attainable before onset of edgefracture
63
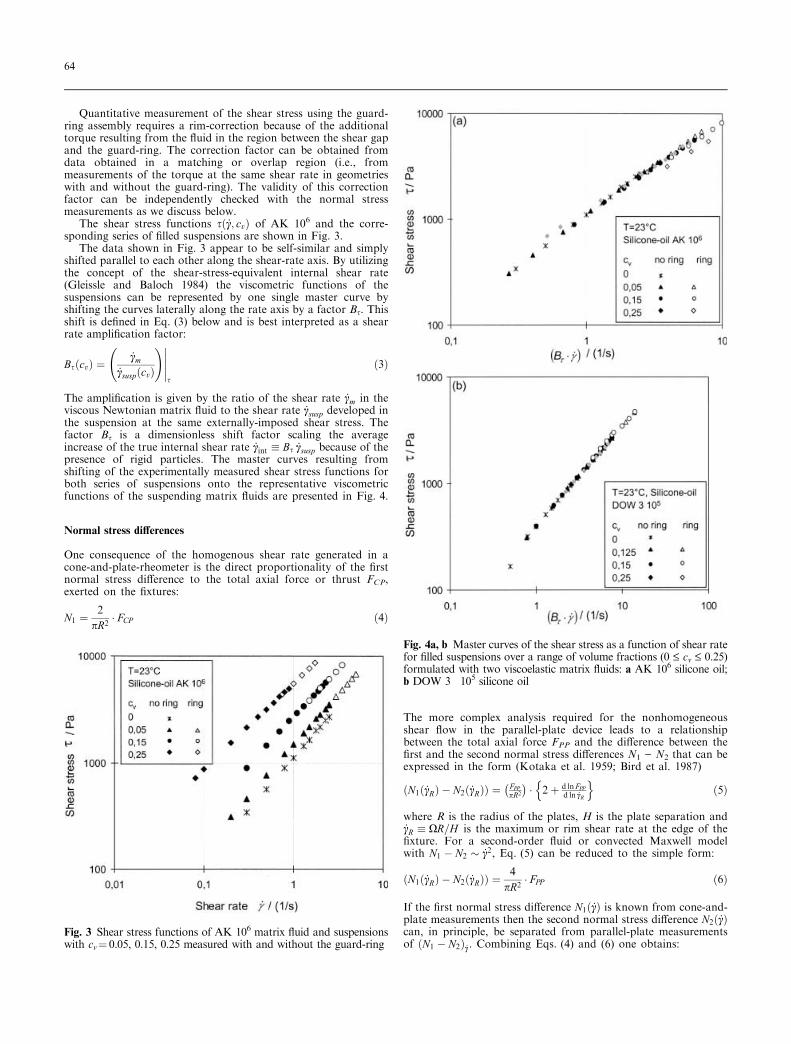
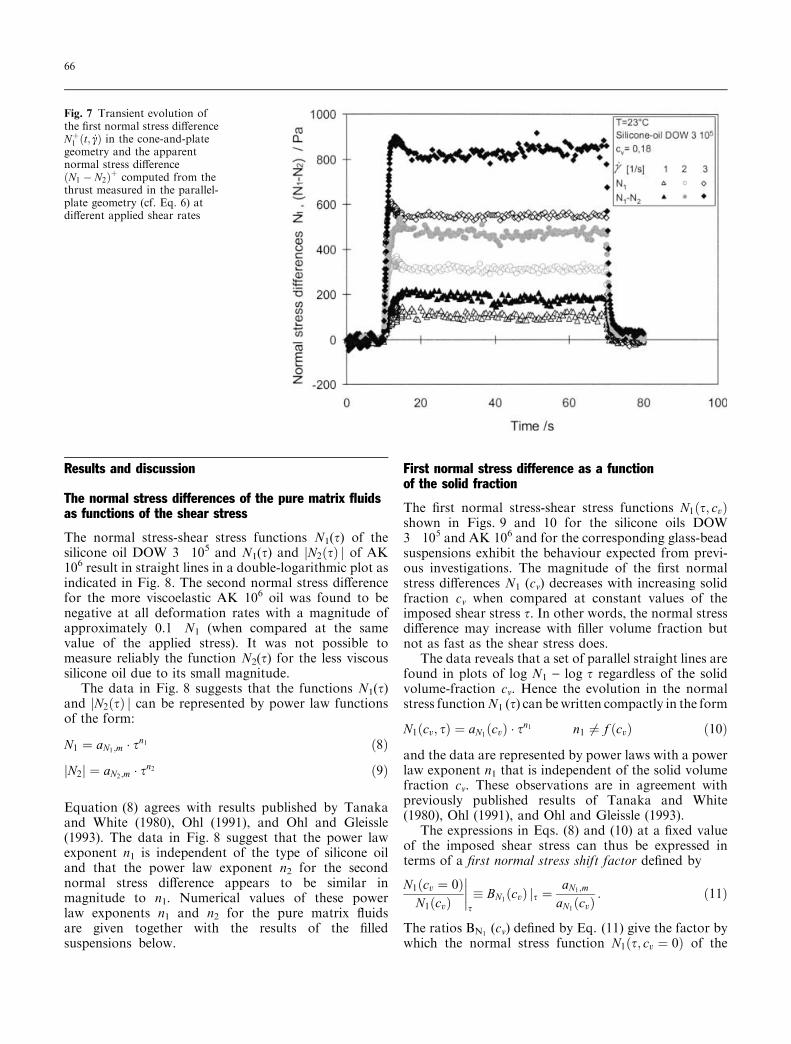
Quantitative measurement of the shear stress using the guard-ring assembly requires a rim-correction because of the additionaltorque resulting from the fluid in the region between the shear gapand the guard-ring. The correction factor can be obtained fromdata obtained in a matching or overlap region (i.e., frommeasurements of the torque at the same shear rate in geometrieswith and without the guard-ring). The validity of this correctionfactor can be independently checked with the normal stressmeasurements as we discuss below.The shear stress functions s _cc; cvð Þ of AK 106 and the corre-
sponding series of filled suspensions are shown in Fig. 3.The data shown in Fig. 3 appear to be self-similar and simply
shifted parallel to each other along the shear-rate axis. By utilizingthe concept of the shear-stress-equivalent internal shear rate(Gleissle and Baloch 1984) the viscometric functions of thesuspensions can be represented by one single master curve byshifting the curves laterally along the rate axis by a factor Bs. Thisshift is defined in Eq. (3) below and is best interpreted as a shearrate amplification factor:
Bs cvð Þ ¼ _ccm_ccsuspðcvÞ
!�����s
ð3Þ
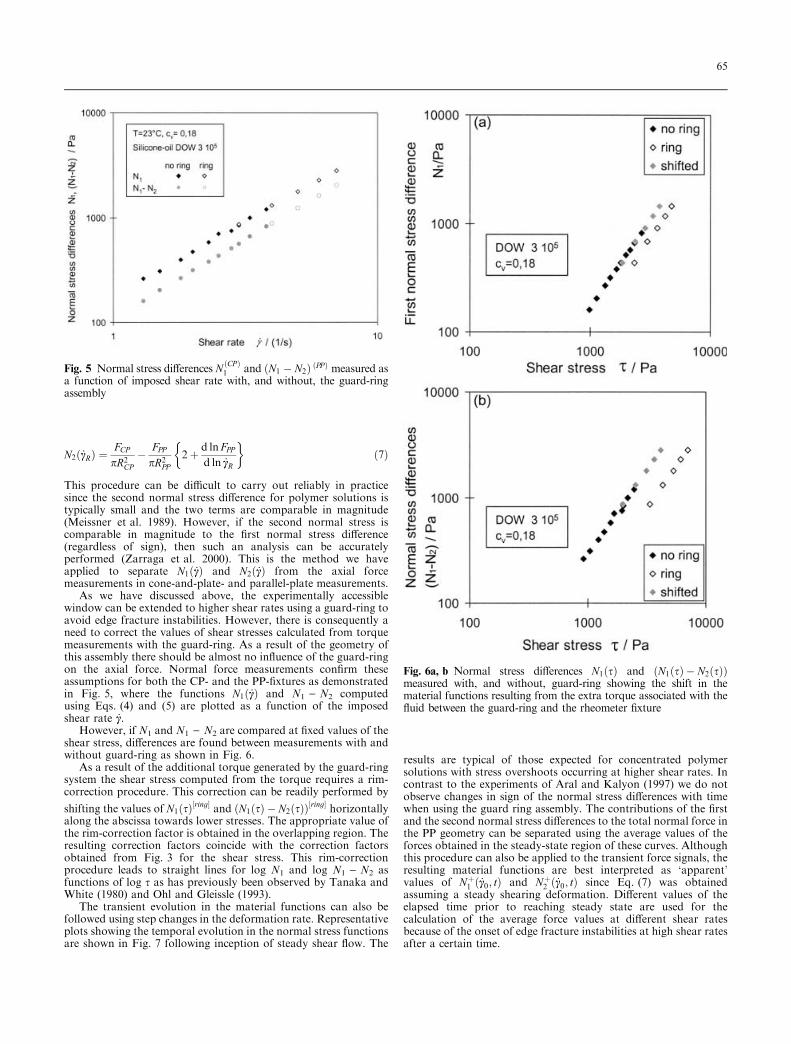
The amplification is given by the ratio of the shear rate _ccm in theviscous Newtonian matrix fluid to the shear rate _ccsusp developed inthe suspension at the same externally-imposed shear stress. Thefactor Bs is a dimensionless shift factor scaling the averageincrease of the true internal shear rate _ccint � Bs _ccsusp because of thepresence of rigid particles. The master curves resulting fromshifting of the experimentally measured shear stress functions forboth series of suspensions onto the representative viscometricfunctions of the suspending matrix fluids are presented in Fig. 4.
Normal stress differences
One consequence of the homogenous shear rate generated in acone-and-plate-rheometer is the direct proportionality of the firstnormal stress difference to the total axial force or thrust FCP,exerted on the fixtures:
N1 ¼2
pR2� FCP ð4Þ
The more complex analysis required for the nonhomogeneousshear flow in the parallel-plate device leads to a relationshipbetween the total axial force FPP and the difference between thefirst and the second normal stress differences N1 ) N2 that can beexpressed in the form (Kotaka et al. 1959; Bird et al. 1987)
N1ð _ccRÞ N2ð _ccRÞð Þ ¼ FPPpR2� �
� 2þ d ln FPPd ln _ccR
n oð5Þ
where R is the radius of the plates, H is the plate separation and_ccR � XR=H is the maximum or rim shear rate at the edge of thefixture. For a second-order fluid or convected Maxwell modelwith N1 N2 _cc2, Eq. (5) can be reduced to the simple form:
N1ð _ccRÞ N2ð _ccRÞð Þ ¼ 4
pR2� FPP ð6Þ
If the first normal stress difference N1 _ccð Þ is known from cone-and-plate measurements then the second normal stress difference N2 _ccð Þcan, in principle, be separated from parallel-plate measurementsof N1 N2ð Þ _cc. Combining Eqs. (4) and (6) one obtains:
Fig. 3 Shear stress functions of AK 106 matrix fluid and suspensionswith cv¼ 0.05, 0.15, 0.25 measured with and without the guard-ring
Fig. 4a, b Master curves of the shear stress as a function of shear ratefor filled suspensions over a range of volume fractions (0 £ cv £ 0.25)formulated with two viscoelastic matrix fluids: a AK 106 silicone oil;b DOW 3 Æ 105 silicone oil
64
N2 _ccRð Þ ¼ FCPpR2CP
FPPpR2PP
2þ d ln FPPd ln _ccR
�ð7Þ
This procedure can be difficult to carry out reliably in practicesince the second normal stress difference for polymer solutions istypically small and the two terms are comparable in magnitude(Meissner et al. 1989). However, if the second normal stress iscomparable in magnitude to the first normal stress difference(regardless of sign), then such an analysis can be accuratelyperformed (Zarraga et al. 2000). This is the method we haveapplied to separate N1 _ccð Þ and N2 _ccð Þ from the axial forcemeasurements in cone-and-plate- and parallel-plate measurements.As we have discussed above, the experimentally accessible
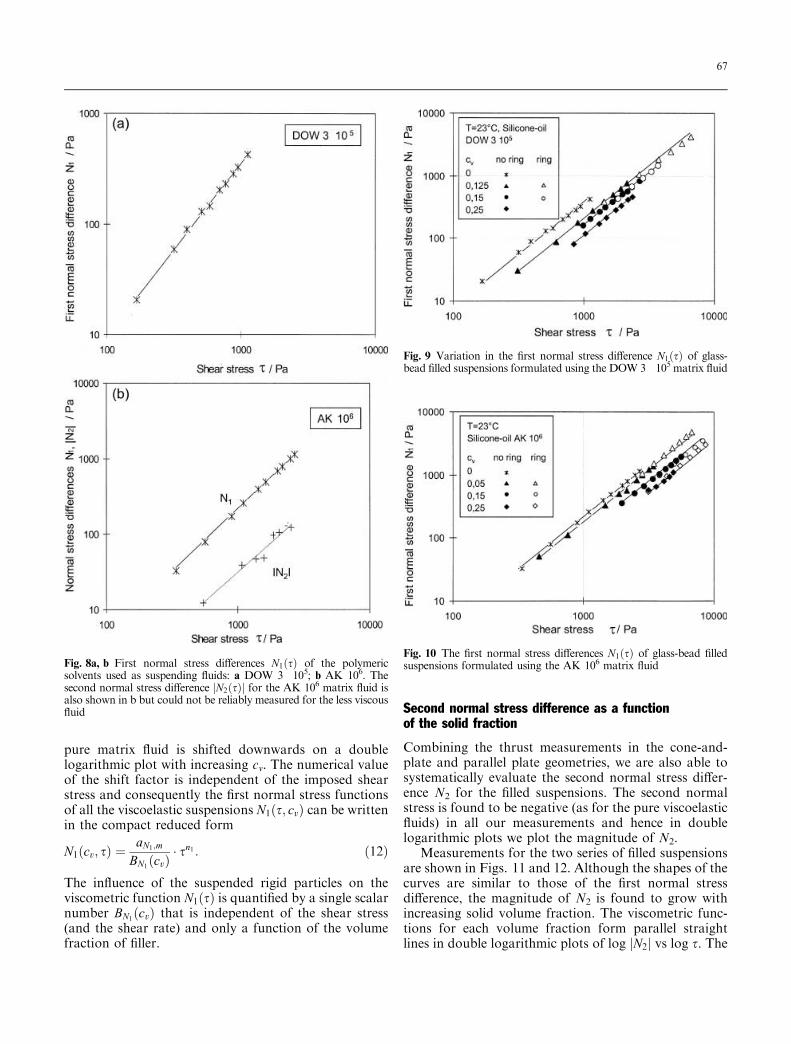
window can be extended to higher shear rates using a guard-ring toavoid edge fracture instabilities. However, there is consequently aneed to correct the values of shear stresses calculated from torquemeasurements with the guard-ring. As a result of the geometry ofthis assembly there should be almost no influence of the guard-ringon the axial force. Normal force measurements confirm theseassumptions for both the CP- and the PP-fixtures as demonstratedin Fig. 5, where the functions N1ð _ccÞ and N1 ) N2 computedusing Eqs. (4) and (5) are plotted as a function of the imposedshear rate _cc.However, if N1 and N1 ) N2 are compared at fixed values of the
shear stress, differences are found between measurements with andwithout guard-ring as shown in Fig. 6.As a result of the additional torque generated by the guard-ring
system the shear stress computed from the torque requires a rim-correction procedure. This correction can be readily performed by
shifting the values of N1ðsÞ½ring� and N1ðsÞ N2ðsÞð Þ½ring� horizontallyalong the abscissa towards lower stresses. The appropriate value ofthe rim-correction factor is obtained in the overlapping region. Theresulting correction factors coincide with the correction factorsobtained from Fig. 3 for the shear stress. This rim-correctionprocedure leads to straight lines for log N1 and log N1 ) N2 asfunctions of log s as has previously been observed by Tanaka andWhite (1980) and Ohl and Gleissle (1993).The transient evolution in the material functions can also be
followed using step changes in the deformation rate. Representativeplots showing the temporal evolution in the normal stress functionsare shown in Fig. 7 following inception of steady shear flow. The
results are typical of those expected for concentrated polymersolutions with stress overshoots occurring at higher shear rates. Incontrast to the experiments of Aral and Kalyon (1997) we do notobserve changes in sign of the normal stress differences with timewhen using the guard ring assembly. The contributions of the firstand the second normal stress differences to the total normal force inthe PP geometry can be separated using the average values of theforces obtained in the steady-state region of these curves. Althoughthis procedure can also be applied to the transient force signals, theresulting material functions are best interpreted as ‘apparent’values of Nþ
1 ð _cc0; tÞ and Nþ2 ð _cc0; tÞ since Eq. (7) was obtained
assuming a steady shearing deformation. Different values of theelapsed time prior to reaching steady state are used for thecalculation of the average force values at different shear ratesbecause of the onset of edge fracture instabilities at high shear ratesafter a certain time.
Fig. 5 Normal stress differences N ðCP Þ1 and N1 N2ð Þ ðPPÞ measured as
a function of imposed shear rate with, and without, the guard-ringassembly
Fig. 6a, b Normal stress differences N1ðsÞ and ðN1ðsÞ N2ðsÞÞmeasured with, and without, guard-ring showing the shift in thematerial functions resulting from the extra torque associated with thefluid between the guard-ring and the rheometer fixture
65
Results and discussion
The normal stress differences of the pure matrix fluidsas functions of the shear stress
The normal stress-shear stress functions N1(s) of thesilicone oil DOW 3 Æ 105 and N1(s) and N2 sð Þj j of AK106 result in straight lines in a double-logarithmic plot asindicated in Fig. 8. The second normal stress differencefor the more viscoelastic AK 106 oil was found to benegative at all deformation rates with a magnitude ofapproximately 0.1 Æ N1 (when compared at the samevalue of the applied stress). It was not possible tomeasure reliably the function N2(s) for the less viscoussilicone oil due to its small magnitude.The data in Fig. 8 suggests that the functions N1(s)
and N2 sð Þj j can be represented by power law functionsof the form:
N1 ¼ aN1;m � sn1 ð8Þ
N2j j ¼ aN2;m � sn2 ð9Þ
Equation (8) agrees with results published by Tanakaand White (1980), Ohl (1991), and Ohl and Gleissle(1993). The data in Fig. 8 suggest that the power lawexponent n1 is independent of the type of silicone oiland that the power law exponent n2 for the secondnormal stress difference appears to be similar inmagnitude to n1. Numerical values of these powerlaw exponents n1 and n2 for the pure matrix fluidsare given together with the results of the filledsuspensions below.
First normal stress difference as a functionof the solid fraction
The first normal stress-shear stress functions N1 s; cvð Þshown in Figs. 9 and 10 for the silicone oils DOW3 Æ 105 and AK 106 and for the corresponding glass-beadsuspensions exhibit the behaviour expected from previ-ous investigations. The magnitude of the first normalstress differences N1 (cv) decreases with increasing solidfraction cv when compared at constant values of theimposed shear stress s. In other words, the normal stressdifference may increase with filler volume fraction butnot as fast as the shear stress does.The data reveals that a set of parallel straight lines are
found in plots of log N1 ) log s regardless of the solidvolume-fraction cv. Hence the evolution in the normalstress functionN1 (s) can bewritten compactly in the form
N1ðcv; sÞ ¼ aN1ðcvÞ � sn1 n1 6¼ f cvð Þ ð10Þ
and the data are represented by power laws with a powerlaw exponent n1 that is independent of the solid volumefraction cv. These observations are in agreement withpreviously published results of Tanaka and White(1980), Ohl (1991), and Ohl and Gleissle (1993).The expressions in Eqs. (8) and (10) at a fixed value
of the imposed shear stress can thus be expressed interms of a first normal stress shift factor defined by
N1 cv ¼ 0ð ÞN1 cvð Þ
����s
� BN1 cvð Þ sj ¼ aN1;maN1ðcvÞ
: ð11Þ
The ratios BN1(cv) defined by Eq. (11) give the factor by
which the normal stress function N1 s; cv ¼ 0ð Þ of the
Fig. 7 Transient evolution ofthe first normal stress differenceNþ1 ðt; _ccÞ in the cone-and-plategeometry and the apparentnormal stress differenceðN1 N2Þþ computed from thethrust measured in the parallel-plate geometry (cf. Eq. 6) atdifferent applied shear rates
66
pure matrix fluid is shifted downwards on a doublelogarithmic plot with increasing cv. The numerical valueof the shift factor is independent of the imposed shearstress and consequently the first normal stress functionsof all the viscoelastic suspensions N1 s; cvð Þ can be writtenin the compact reduced form
N1 cv; sð Þ ¼ aN1;mBN1 cvð Þ � s
n1 : ð12Þ
The influence of the suspended rigid particles on theviscometric function N1 sð Þ is quantified by a single scalarnumber BN1 cvð Þ that is independent of the shear stress(and the shear rate) and only a function of the volumefraction of filler.
Second normal stress difference as a functionof the solid fraction
Combining the thrust measurements in the cone-and-plate and parallel plate geometries, we are also able tosystematically evaluate the second normal stress differ-ence N2 for the filled suspensions. The second normalstress is found to be negative (as for the pure viscoelasticfluids) in all our measurements and hence in doublelogarithmic plots we plot the magnitude of N2.Measurements for the two series of filled suspensions
are shown in Figs. 11 and 12. Although the shapes of thecurves are similar to those of the first normal stressdifference, the magnitude of N2 is found to grow withincreasing solid volume fraction. The viscometric func-tions for each volume fraction form parallel straightlines in double logarithmic plots of log N2j j vs log s. The
Fig. 8a, b First normal stress differences N1ðsÞ of the polymericsolvents used as suspending fluids: a DOW 3 Æ 105; b AK 106. Thesecond normal stress difference N2ðsÞj j for the AK 106 matrix fluid isalso shown in b but could not be reliably measured for the less viscousfluid
Fig. 9 Variation in the first normal stress difference N1ðsÞ of glass-bead filled suspensions formulated using the DOW 3 Æ 105 matrix fluid
Fig. 10 The first normal stress differences N1ðsÞ of glass-bead filledsuspensions formulated using the AK 106 matrix fluid
67
variation in the second normal stress difference cantherefore also be described by a power law function witha single exponent n2 that is applicable to all concentra-tions examined:
N2j j ¼ aN2 cvð Þ � sn2 n2 6¼ f cvð Þ ð13Þ
The magnitude of the shift along the ordinate axis canagain be written in terms of a shift factor BN2 cvð Þ that isindependent of the shear stress and varies with increas-ing solid fraction as
N2 cv ¼ 0ð ÞN2 cvð Þ
����s
� BN2 cvð Þ : ð14Þ
Consequently the viscometric functions of the secondnormal stress difference N2ðs; cvÞ at different shearstresses and solid volume fractions can be written in areduced form as found for the first normal stressdifference:
N2j j ¼ aN2;mBN2 cvð Þ � s
n2 ð15Þ
where aN2;m is the second normal stress coefficient of thepure matrix fluid, which may not be directly measurable(as is the case for the less viscous of the two matrix fluidsconsidered in this study).
Reduced normal stress functionsN1*(s, cv) and N2*(s, cv)
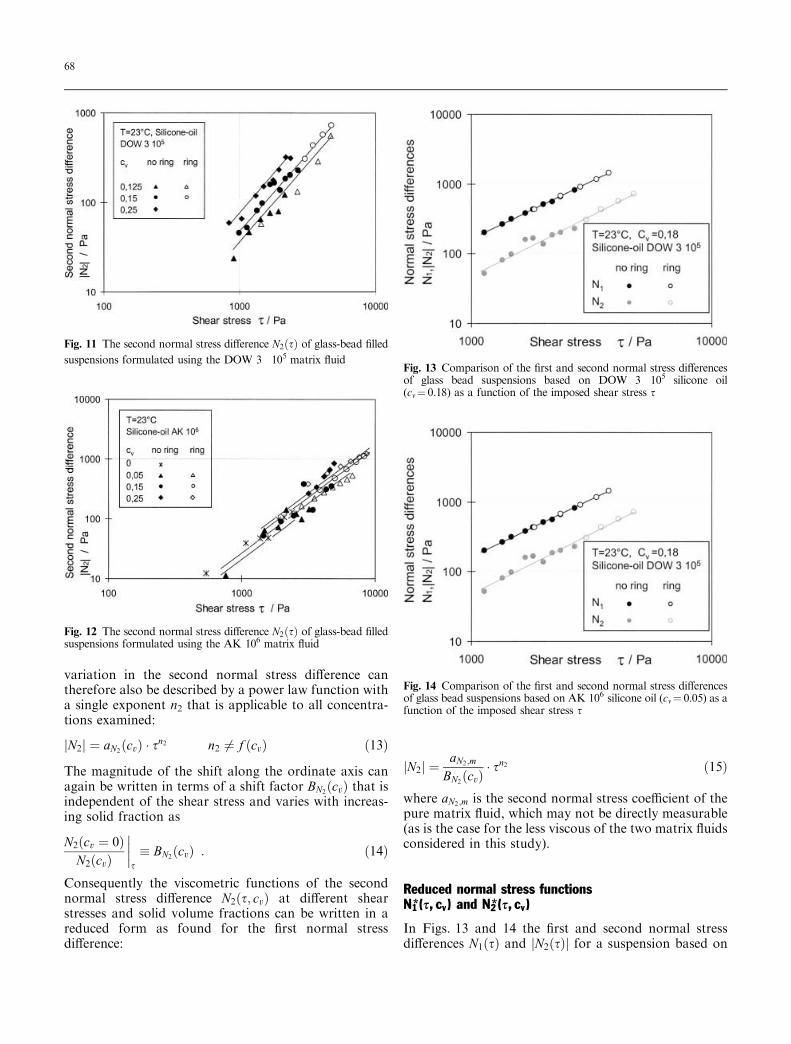
In Figs. 13 and 14 the first and second normal stressdifferences N1 sð Þ and N2 sð Þj j for a suspension based on
Fig. 11 The second normal stress difference N2ðsÞ of glass-bead filledsuspensions formulated using the DOW 3 Æ 105 matrix fluid
Fig. 12 The second normal stress difference N2ðsÞ of glass-bead filledsuspensions formulated using the AK 106 matrix fluid
Fig. 13 Comparison of the first and second normal stress differencesof glass bead suspensions based on DOW 3 Æ 105 silicone oil(cv¼ 0.18) as a function of the imposed shear stress s
Fig. 14 Comparison of the first and second normal stress differencesof glass bead suspensions based on AK 106 silicone oil (cv¼ 0.05) as afunction of the imposed shear stress s
68
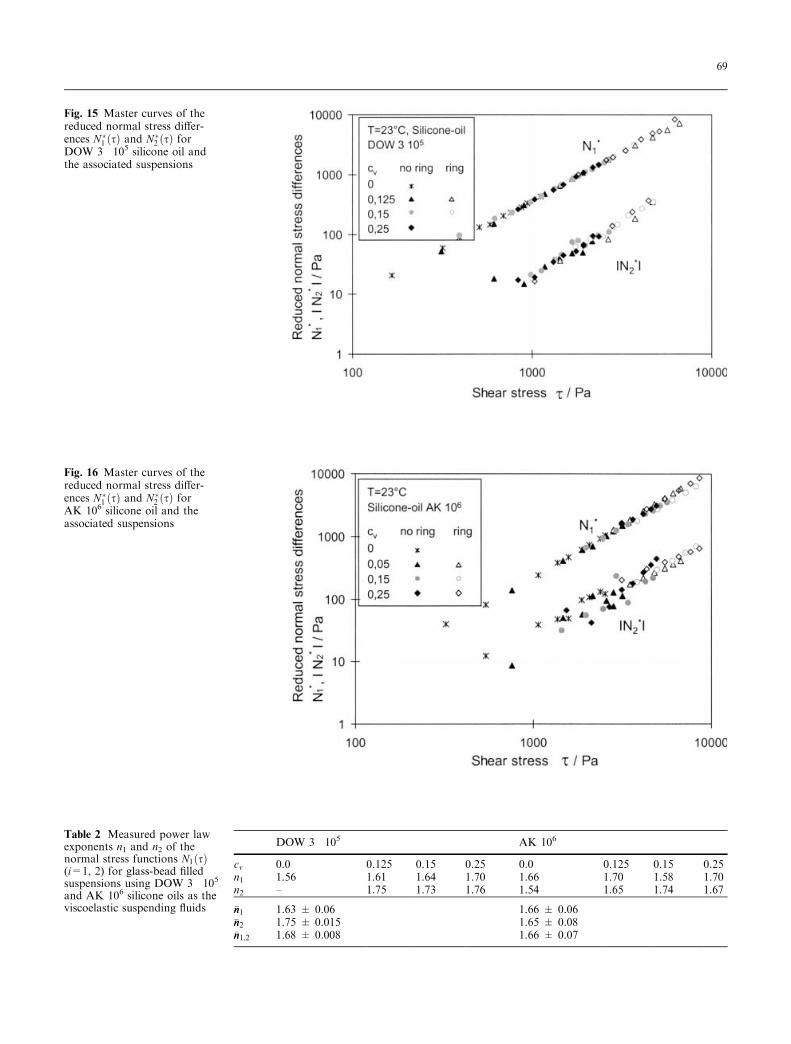
Fig. 15 Master curves of thereduced normal stress differ-ences N �
1 ðsÞ and N �2 ðsÞ for
DOW 3 Æ 105 silicone oil andthe associated suspensions
Fig. 16 Master curves of thereduced normal stress differ-ences N �
1 ðsÞ and N �2 ðsÞ for
AK 106 silicone oil and theassociated suspensions
Table 2 Measured power lawexponents n1 and n2 of thenormal stress functions N1 sð Þ(i=1, 2) for glass-bead filledsuspensions using DOW 3 Æ 105
and AK 106 silicone oils as theviscoelastic suspending fluids
DOW 3 Æ 105 AK 106
cv 0.0 0.125 0.15 0.25 0.0 0.125 0.15 0.25n1 1.56 1.61 1.64 1.70 1.66 1.70 1.58 1.70n2 – 1.75 1.73 1.76 1.54 1.65 1.74 1.67
�nn1 1.63 ± 0.06 1.66 ± 0.06�nn2 1.75 ± 0.015 1.65 ± 0.08�nn1;2 1.68 ± 0.008 1.66 ± 0.07
69
DOW 3 Æ 105 (cv¼ 0.18) and on AK 106 (cv¼ 0.05) areplotted as functions of the imposed shear stress. Onceagain the data are all found to be co-linear and hence wecan conclude that the power law exponent in Eqs. (8),(9), (10), (12), (13) and (15) are equal to each other:
n1 ¼ n2 ¼ n ð16ÞIn these viscoelastic filled suspensions the ratio of thesecond normal stress difference to the first normal stress
difference (denoted henceforth as W�) is thus indepen-dent of the shear stress (and shear rate) and is only afunction of the volume fraction of filler:
N2 cv; sð Þj jN1 cv; sð Þ ¼ W� cvð Þ ð17Þ
This normal stress ratio increases with increasing solidfraction from W�ð0Þ » 0.1 up to W�ð0:25Þ » 0.7 for theseries of suspensions formulated using the less viscous
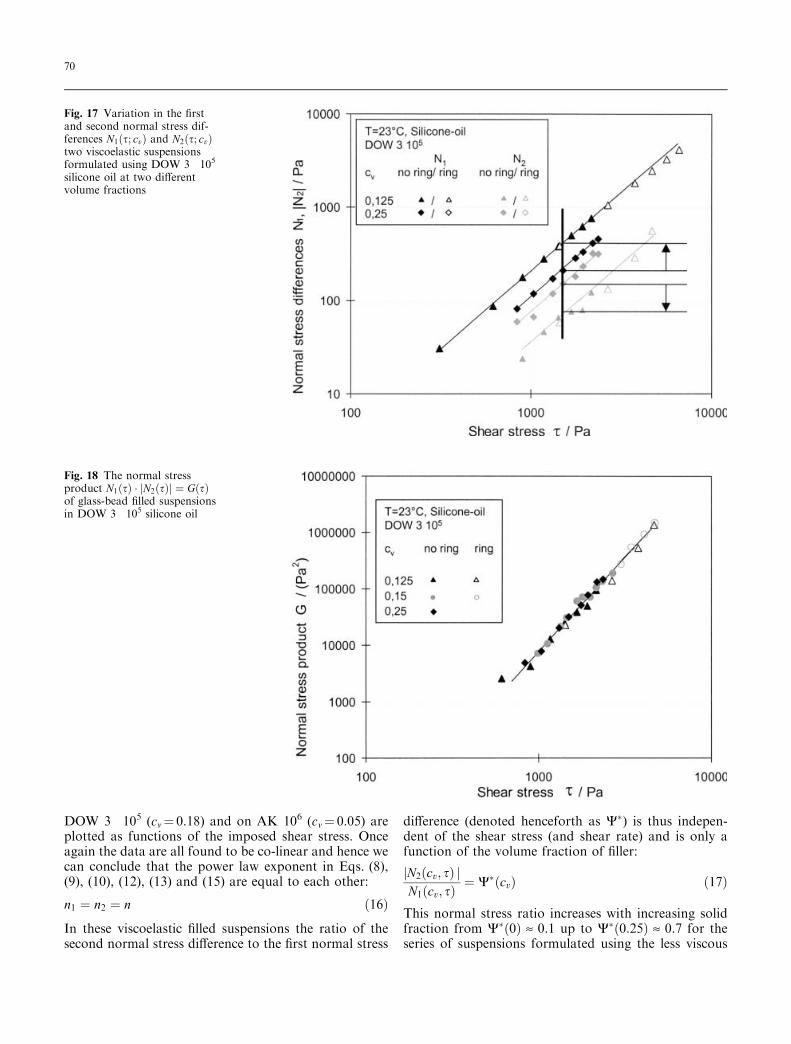
Fig. 17 Variation in the firstand second normal stress dif-ferences N1ðs; cvÞ and N2ðs; cvÞtwo viscoelastic suspensionsformulated using DOW 3 Æ 105
silicone oil at two differentvolume fractions
Fig. 18 The normal stressproduct N1ðsÞ � N2ðsÞj j ¼ GðsÞof glass-bead filled suspensionsin DOW 3 Æ 105 silicone oil
70
suspending fluid and up to 0.5 for the more viscoussystem.To summarize our experimental observations so far,
we have shown that, at a given value of the volumefraction, the functions N1 sð Þ and N2 sð Þj j are power lawfunctions with a common power law exponent n. Thefirst normal stress difference N1 is a decreasing functionand N2j j is an increasing function with increasing solidfraction. Using the definitions of the first normal stressshift factor BN1 cvð Þ from Eq. (11) and the second normalstress shift factor BN2 cvð Þ from Eq. (14), master curvesfor the normal stress-shear stress functions can be foundusing the following relationships:
N �1 sð Þ ¼ N1 s; cvð Þ � BN1 cvð Þ ð18Þ
N�2 sð Þ
�� �� ¼ N2 s; cvð Þj j � BN2 cvð Þ ð19ÞWhen the reduced normal stress differences N�
1 and N �2
�� ��are plotted vs the shear stress s the data take the formshown in Figs. 15 and 16. These master curves alsorepresent the normal stress functions of the pure matrixliquid since BN1ðcv ¼ 0Þ ¼ BN2ðcv ¼ 0Þ ¼ 1:
Although there is some scatter in the data (espe-cially at low shear stresses for the AK106 basedsuspensions), the slope of the reduced functions N�
1 sð Þand N�
2 sð Þ�� �� are found to be equal to each other.
Numerical values for the power law exponents arereported in Table 2.
Normal stress inter-relationship
In Fig. 17 the first and second normal stress differencesN1 and N2j j of two suspensions with varying volumefraction of particles (cv¼ 0.125 and cv¼ 0.25) and acommon matrix fluid (Dow 3 Æ 105) are plotted vs theshear stress s. As noted previously N1 sð Þ decreases withincreasing cv whereas N2j j increases with cv. Closeinspection of the data in Fig. 17 shows that, whenplotted in double logarithmic coordinates, the relativedecrease of N1 sð Þ for the two volume fractions consid-ered is nearly equal to the relative increase of N2 sð Þj j forthe same solid fraction. This correlation can be formu-lated in the following way:
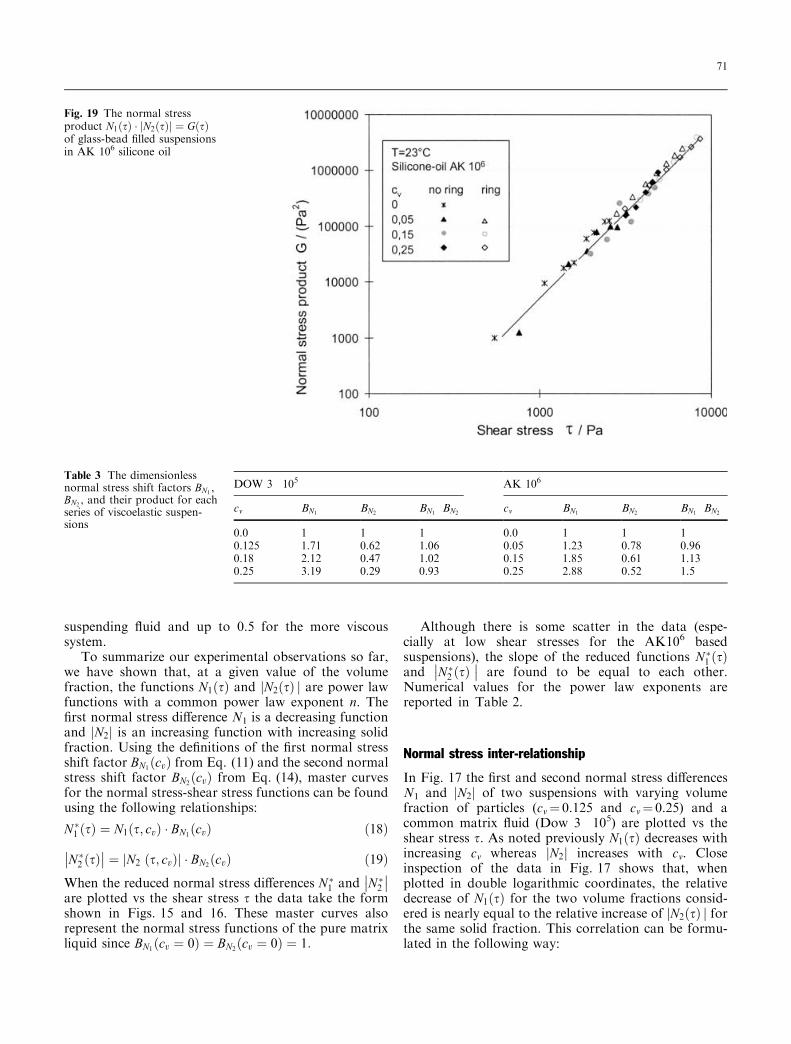
Fig. 19 The normal stressproduct N1ðsÞ � N2ðsÞj j ¼ GðsÞof glass-bead filled suspensionsin AK 106 silicone oil
Table 3 The dimensionlessnormal stress shift factors BN1 ,BN2 , and their product for eachseries of viscoelastic suspen-sions
DOW 3 Æ 105 AK 106
cv BN1 BN2 BN1 Æ BN2 cv BN1 BN2 BN1 Æ BN2
0.0 1 1 1 0.0 1 1 10.125 1.71 0.62 1.06 0.05 1.23 0.78 0.960.18 2.12 0.47 1.02 0.15 1.85 0.61 1.130.25 3.19 0.29 0.93 0.25 2.88 0.52 1.5
71
N1 c½i�v�
N1 c½j�v� ¼
N2 c½i�v� ��� ���
N2 c½j�v� ��� ���
264
3751
ð20Þ
where the superscripts i and j denote experimental datasets with two different concentrations of particles.Comparing the shifts of N1 and N2j j it should be
taken into account that it is not the shift factorsBN1 and BN2 themselves that are shown, but the relativechange of the normal stress differences if the volumeconcentration is changed from cv¼ 0.125 to cv¼ 0.25.Two single test series are compared so that themaximum deviation of ±8% from equality whichcan be seen in the diagram is better than might beanticipated considering the complexity of the normalstress separation method.Rearranging the experimental correlation given by
Eq. (20) leads to the following very simple general inter-relationship between the two normal stress differencesN1 and N2j j at two different concentrations:
N1 c½i�v�
� N2 c½i�v� ��� ��� ¼ N1 c½j�v
� � N2 c½j�v
� ��� ��� ð21Þ
To validate this relationship, the product N1 � N2j jð Þ wasplotted vs the shear stress for both series of filledviscoelastic suspensions. A remarkably simple correla-tion between the normal stress differences N1 and N2j j isthus found which can be expressed compactly in the form
N1 s; cvð Þ � N2 s; cvð Þj j ¼ GðsÞ: ð22Þi.e., the product of the first normal stress difference N1
and the magnitude of the second normal stress differenceN2j j, considered at constant shear stress, is constant andindependent of the solid concentration of particleswithin the entire shear rate range investigated. Theresulting product, denoted G(s), is a single function,rising with increasing shear stress s for all solid fractionsinvestigated and for both groups of suspensions (whichare based on two different silicone oils and glass spheresof different mean diameter (see Figs. 18 and 19).Using Eqs. (11), (14), and (21) it is possible to
rearrange Eq. (22) in terms of the shift factors for thefirst and the second normal stress differences. Since theseshift factors are themselves independent of the imposedstress, this relationship becomes
BN1ðcvÞ � BN2ðcvÞ ¼ 1 : ð23ÞNumerical values of this product are given in Table 3.The result expressed by Eq. (23) is independent of thesolid fraction cv and holds even for the pure matrixliquid. This implies that the function G(s) depends onlyon the properties of the matrix and is independent ofthe properties of the rigid particles used in ourexperiments.As we have mentioned above it was not possible to
measure directly the second normal stress difference for
the less viscoelastic silicone oil (Dow 3 Æ 105). However,with the help of Eqs. (21) and (23) it is now possible, forthe first time, to evaluate the magnitude of the secondnormal stress difference of the base (unfilled) liquid fromthe corresponding measurements with the (moreviscoelastic) filled suspensions. Taking i as the matrixfluid and j as a data series for which both N1ðsÞ andjN2ðsÞj have been measured then Eq. (21) gives
N2ðs; cv ¼ 0Þ ffiN1 s; c½j�v�
N1ðs; cv ¼ 0Þ
0@
1A N2 s; c½j�v
� ��� ��� : ð24Þ
Using Eqs. (8), (9), and (16) the shear-stress-dependentproduct G(s) can also be re-expressed in terms of theparameters characterizing the power law response of thefirst and second normal stress of the unfilled matrixfluid:
G sð Þ ¼ aN1;m � aN2;m � s2n ð25Þ
These relationships permit the evaluation of both thefirst and the second normal stress difference with respectto the shear stress and solid volume fraction, knowingsimply N1 sð Þ for the pure matrix fluid, the shift factorBN1 cvð Þ, and a single reference value of the function G(s)at a reference stress sref. For convenience, we pick areference stress of sref¼ 1 kPa¼ 1000 Pa and denote thisvalue as G0 � Gðsref ¼ 1 kPaÞ. It is important to recog-nize that only one single measurement of the secondnormal stress difference at any solid concentration (evenat cv¼ 0) is then sufficient to obtain the completefunctional response of N2 s; cvð Þ, at least in the power lawregime investigated in the present study. Numericalvalues of the experimentally determined factors areprovided in Table 4. For completeness we also summa-rize the complete set of equations below:
Pure matrix liquid:
N1 sð Þ ¼ aN1;m � sn ð8Þ
N2 sð Þ ¼ aN2;m � sn ¼ ðG0=s2nrefÞaN1;m
� sn ð26Þ
Suspension:
N1 s; cvð Þ ¼ aN1 cvð Þ � sn ¼ aN1;mBN1 cvð Þ � s
n ð12Þ
N2 s; cvð Þ ¼ aN2 cvð Þ � sn ¼ BN1 cvð ÞðG0=s2nrefÞaN1;m
� sn ð27Þ
with
G0 � N1 sref ; cv� �
� N2 sref ; cv� ��� ��� �
sref¼1kPa ð22Þ
Using these simple equations and the data for aN1and G0
from Table 4 plus the shift factors BN1 cvð Þ from Table 3,
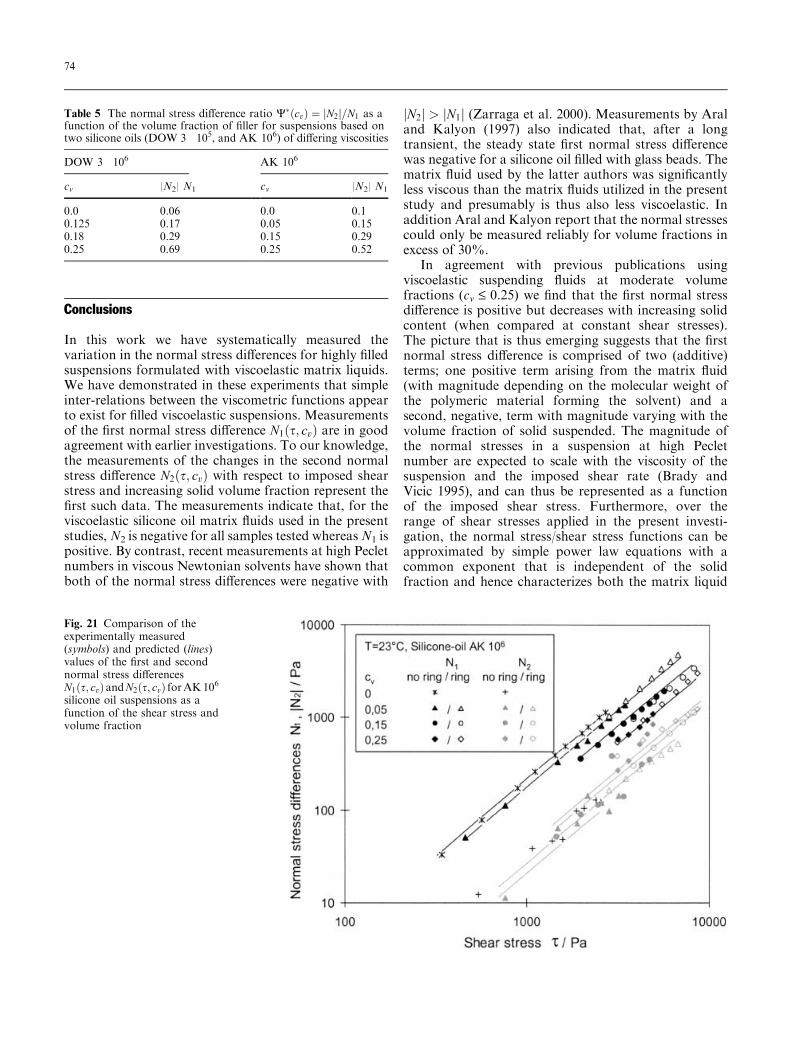
72
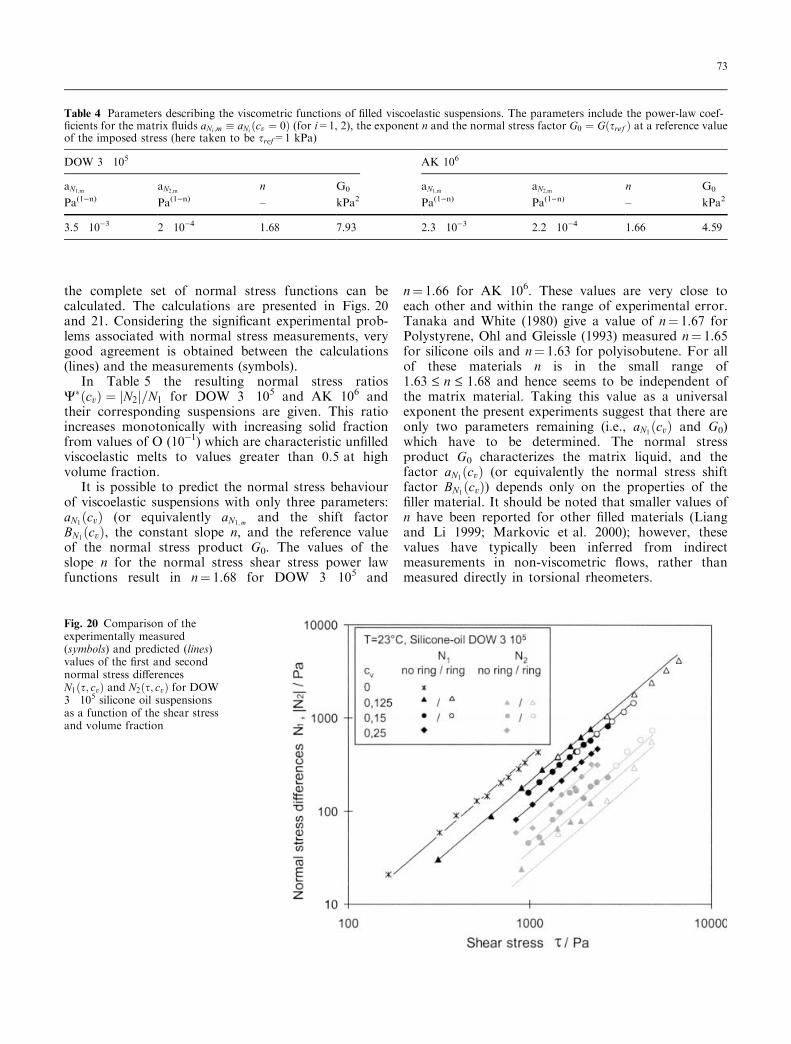
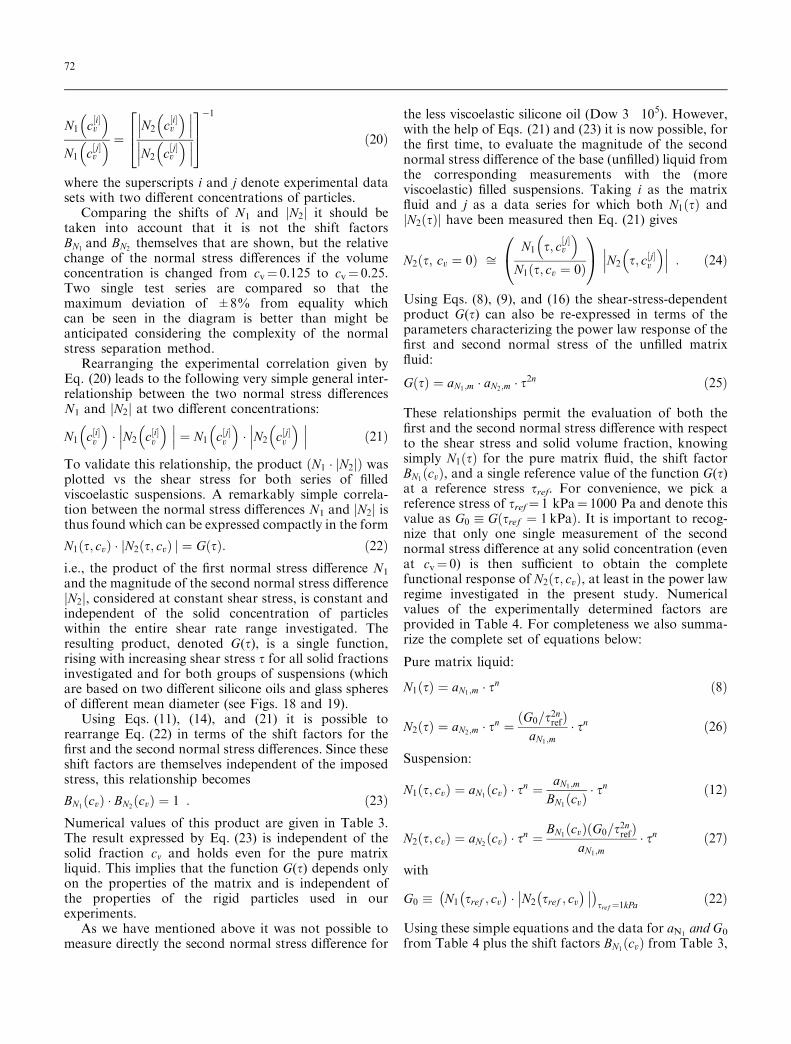
the complete set of normal stress functions can becalculated. The calculations are presented in Figs. 20and 21. Considering the significant experimental prob-lems associated with normal stress measurements, verygood agreement is obtained between the calculations(lines) and the measurements (symbols).In Table 5 the resulting normal stress ratios
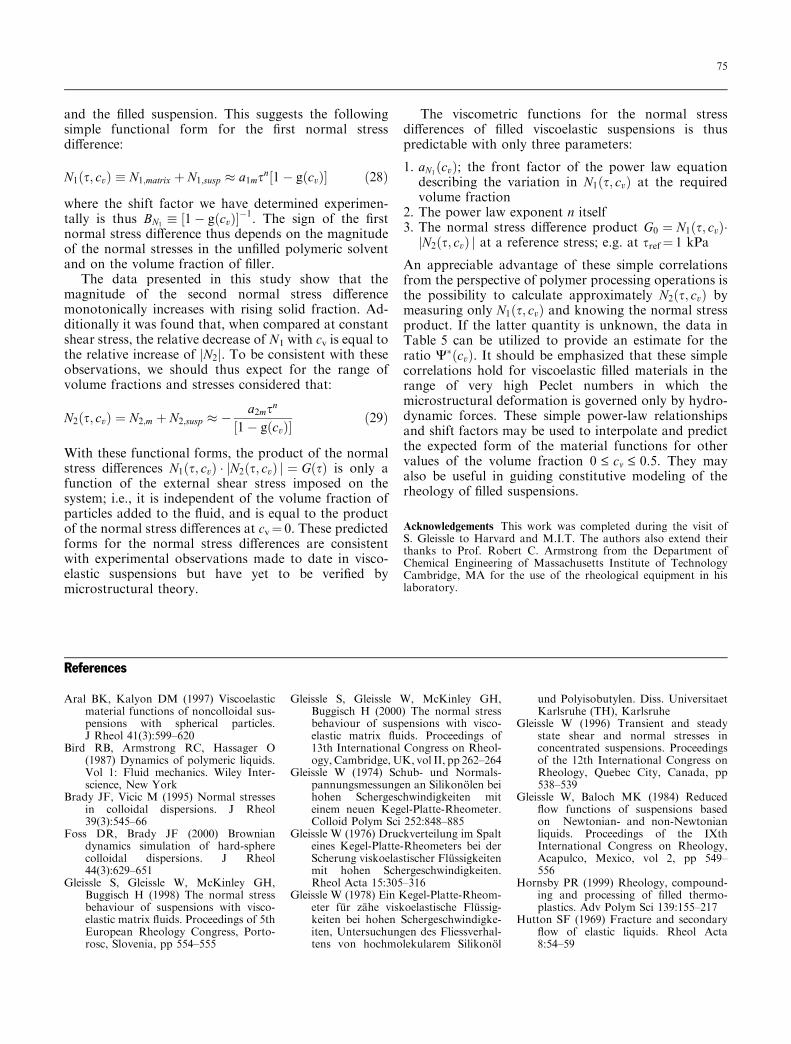
W�ðcvÞ ¼ N2j j=N1 for DOW 3 Æ 105 and AK 106 andtheir corresponding suspensions are given. This ratioincreases monotonically with increasing solid fractionfrom values of O (10)1) which are characteristic unfilledviscoelastic melts to values greater than 0.5 at highvolume fraction.It is possible to predict the normal stress behaviour
of viscoelastic suspensions with only three parameters:aN1ðcvÞ (or equivalently aN1;m and the shift factorBN1ðcvÞ, the constant slope n, and the reference valueof the normal stress product G0. The values of theslope n for the normal stress shear stress power lawfunctions result in n¼ 1.68 for DOW 3 Æ 105 and
n¼ 1.66 for AK 106. These values are very close toeach other and within the range of experimental error.Tanaka and White (1980) give a value of n¼ 1.67 forPolystyrene, Ohl and Gleissle (1993) measured n¼ 1.65for silicone oils and n¼ 1.63 for polyisobutene. For allof these materials n is in the small range of1.63 £ n £ 1.68 and hence seems to be independent ofthe matrix material. Taking this value as a universalexponent the present experiments suggest that there areonly two parameters remaining (i.e., aN1ðcvÞ and G0)which have to be determined. The normal stressproduct G0 characterizes the matrix liquid, and thefactor aN1ðcvÞ (or equivalently the normal stress shiftfactor BN1ðcvÞ) depends only on the properties of thefiller material. It should be noted that smaller values ofn have been reported for other filled materials (Liangand Li 1999; Markovic et al. 2000); however, thesevalues have typically been inferred from indirectmeasurements in non-viscometric flows, rather thanmeasured directly in torsional rheometers.
Table 4 Parameters describing the viscometric functions of filled viscoelastic suspensions. The parameters include the power-law coef-ficients for the matrix fluids aNi ;m � aNi ðcv ¼ 0Þ (for i=1, 2), the exponent n and the normal stress factor G0 ¼ Gðsref Þ at a reference valueof the imposed stress (here taken to be sref=1 kPa)
DOW 3 Æ 105 AK 106
aN1;m aN2;m n G0 aN1;m aN2;m n G0
Pa(1)n) Pa(1)n) – kPa2 Pa(1)n) Pa(1)n) – kPa2
3.5 Æ 10)3 2 Æ 10)4 1.68 7.93 2.3 Æ 10)3 2.2 Æ 10)4 1.66 4.59
Fig. 20 Comparison of theexperimentally measured(symbols) and predicted (lines)values of the first and secondnormal stress differencesN1ðs; cvÞ and N2ðs; cvÞ for DOW3 Æ 105 silicone oil suspensionsas a function of the shear stressand volume fraction
73
Conclusions
In this work we have systematically measured thevariation in the normal stress differences for highly filledsuspensions formulated with viscoelastic matrix liquids.We have demonstrated in these experiments that simpleinter-relations between the viscometric functions appearto exist for filled viscoelastic suspensions. Measurementsof the first normal stress difference N1ðs; cvÞ are in goodagreement with earlier investigations. To our knowledge,the measurements of the changes in the second normalstress difference N2ðs; cvÞ with respect to imposed shearstress and increasing solid volume fraction represent thefirst such data. The measurements indicate that, for theviscoelastic silicone oil matrix fluids used in the presentstudies,N2 is negative for all samples tested whereasN1 ispositive. By contrast, recent measurements at high Pecletnumbers in viscous Newtonian solvents have shown thatboth of the normal stress differences were negative with
N2j j > N1j j (Zarraga et al. 2000). Measurements by Araland Kalyon (1997) also indicated that, after a longtransient, the steady state first normal stress differencewas negative for a silicone oil filled with glass beads. Thematrix fluid used by the latter authors was significantlyless viscous than the matrix fluids utilized in the presentstudy and presumably is thus also less viscoelastic. Inaddition Aral and Kalyon report that the normal stressescould only be measured reliably for volume fractions inexcess of 30%.In agreement with previous publications using
viscoelastic suspending fluids at moderate volumefractions (cv £ 0.25) we find that the first normal stressdifference is positive but decreases with increasing solidcontent (when compared at constant shear stresses).The picture that is thus emerging suggests that the firstnormal stress difference is comprised of two (additive)terms; one positive term arising from the matrix fluid(with magnitude depending on the molecular weight ofthe polymeric material forming the solvent) and asecond, negative, term with magnitude varying with thevolume fraction of solid suspended. The magnitude ofthe normal stresses in a suspension at high Pecletnumber are expected to scale with the viscosity of thesuspension and the imposed shear rate (Brady andVicic 1995), and can thus be represented as a functionof the imposed shear stress. Furthermore, over therange of shear stresses applied in the present investi-gation, the normal stress/shear stress functions can beapproximated by simple power law equations with acommon exponent that is independent of the solidfraction and hence characterizes both the matrix liquid
Table 5 The normal stress difference ratio W�ðcvÞ ¼ jN2j=N1 as afunction of the volume fraction of filler for suspensions based ontwo silicone oils (DOW 3 Æ 105, and AK 106) of differing viscosities
DOW 3 Æ 106 AK 106
cv |N2| N1 cv |N2| N1
0.0 0.06 0.0 0.10.125 0.17 0.05 0.150.18 0.29 0.15 0.290.25 0.69 0.25 0.52
Fig. 21 Comparison of theexperimentally measured(symbols) and predicted (lines)values of the first and secondnormal stress differencesN1ðs; cvÞandN2ðs; cvÞ forAK106silicone oil suspensions as afunction of the shear stress andvolume fraction
74
and the filled suspension. This suggests the followingsimple functional form for the first normal stressdifference:
N1ðs; cvÞ � N1;matrix þ N1;susp � a1msn 1 gðcvÞ½ � ð28Þ
where the shift factor we have determined experimen-tally is thus BN1 � ½1 gðcvÞ�1. The sign of the firstnormal stress difference thus depends on the magnitudeof the normal stresses in the unfilled polymeric solventand on the volume fraction of filler.The data presented in this study show that the
magnitude of the second normal stress differencemonotonically increases with rising solid fraction. Ad-ditionally it was found that, when compared at constantshear stress, the relative decrease of N1 with cv is equal tothe relative increase of N2j j. To be consistent with theseobservations, we should thus expect for the range ofvolume fractions and stresses considered that:
N2ðs; cvÞ ¼ N2;m þ N2;susp � a2msn
1 gðcvÞ½ � ð29Þ
With these functional forms, the product of the normalstress differences N1 s; cvð Þ � N2 s; cvð Þj j ¼ GðsÞ is only afunction of the external shear stress imposed on thesystem; i.e., it is independent of the volume fraction ofparticles added to the fluid, and is equal to the productof the normal stress differences at cv¼ 0. These predictedforms for the normal stress differences are consistentwith experimental observations made to date in visco-elastic suspensions but have yet to be verified bymicrostructural theory.
The viscometric functions for the normal stressdifferences of filled viscoelastic suspensions is thuspredictable with only three parameters:
1. aN1 cvð Þ; the front factor of the power law equationdescribing the variation in N1 s; cvð Þ at the requiredvolume fraction
2. The power law exponent n itself3. The normal stress difference product G0 ¼ N1ðs; cvÞ�
N2ðs; cvÞj j at a reference stress; e.g. at sref¼ 1 kPaAn appreciable advantage of these simple correlationsfrom the perspective of polymer processing operations isthe possibility to calculate approximately N2ðs; cvÞ bymeasuring only N1ðs; cvÞ and knowing the normal stressproduct. If the latter quantity is unknown, the data inTable 5 can be utilized to provide an estimate for theratio W�ðcvÞ. It should be emphasized that these simplecorrelations hold for viscoelastic filled materials in therange of very high Peclet numbers in which themicrostructural deformation is governed only by hydro-dynamic forces. These simple power-law relationshipsand shift factors may be used to interpolate and predictthe expected form of the material functions for othervalues of the volume fraction 0 £ cv £ 0.5. They mayalso be useful in guiding constitutive modeling of therheology of filled suspensions.
Acknowledgements This work was completed during the visit ofS. Gleissle to Harvard and M.I.T. The authors also extend theirthanks to Prof. Robert C. Armstrong from the Department ofChemical Engineering of Massachusetts Institute of TechnologyCambridge, MA for the use of the rheological equipment in hislaboratory.
References
Aral BK, Kalyon DM (1997) Viscoelasticmaterial functions of noncolloidal sus-pensions with spherical particles.J Rheol 41(3):599–620
Bird RB, Armstrong RC, Hassager O(1987) Dynamics of polymeric liquids.Vol 1: Fluid mechanics. Wiley Inter-science, New York
Brady JF, Vicic M (1995) Normal stressesin colloidal dispersions. J Rheol39(3):545–66
Foss DR, Brady JF (2000) Browniandynamics simulation of hard-spherecolloidal dispersions. J Rheol44(3):629–651
Gleissle S, Gleissle W, McKinley GH,Buggisch H (1998) The normal stressbehaviour of suspensions with visco-elastic matrix fluids. Proceedings of 5thEuropean Rheology Congress, Porto-rosc, Slovenia, pp 554–555
Gleissle S, Gleissle W, McKinley GH,Buggisch H (2000) The normal stressbehaviour of suspensions with visco-elastic matrix fluids. Proceedings of13th International Congress on Rheol-ogy, Cambridge, UK, vol II, pp 262–264
Gleissle W (1974) Schub- und Normals-pannungsmessungen an Silikonolen beihohen Schergeschwindigkeiten miteinem neuen Kegel-Platte-Rheometer.Colloid Polym Sci 252:848–885
Gleissle W (1976) Druckverteilung im Spalteines Kegel-Platte-Rheometers bei derScherung viskoelastischer Flussigkeitenmit hohen Schergeschwindigkeiten.Rheol Acta 15:305–316
Gleissle W (1978) Ein Kegel-Platte-Rheom-eter fur zahe viskoelastische Flussig-keiten bei hohen Schergeschwindigke-iten, Untersuchungen des Fliessverhal-tens von hochmolekularem Silikonol
und Polyisobutylen. Diss. UniversitaetKarlsruhe (TH), Karlsruhe
Gleissle W (1996) Transient and steadystate shear and normal stresses inconcentrated suspensions. Proceedingsof the 12th International Congress onRheology, Quebec City, Canada, pp538–539
Gleissle W, Baloch MK (1984) Reducedflow functions of suspensions basedon Newtonian- and non-Newtonianliquids. Proceedings of the IXthInternational Congress on Rheology,Acapulco, Mexico, vol 2, pp 549–556
Hornsby PR (1999) Rheology, compound-ing and processing of filled thermo-plastics. Adv Polym Sci 139:155–217
Hutton SF (1969) Fracture and secondaryflow of elastic liquids. Rheol Acta8:54–59
75
Keentok M, Xue SC (1999) Edge fracturein cone-plate and parallel plate flows.Rheol Acta 38(4):321–348
Kotaka T, Kurata M, Tamura M (1959)Normal stress effect in polymer solu-tions. J Appl Phys 30:1705–1712
Lee CS, Tripp BC, Magda JJ (1992) DoesN1 or N2 control the onset of edgefracture. Rheol Acta 31:306–398
Liang JZ, Li RKY (1999) Rheologicalproperties of glass bead-filled low-den-sity polyethylene composite melts incapillary extrusion. J Appl Polym Sci73(8):1451–1456
Markovic MG, Choudhury NR, Dimopo-ulos M, Matisons JG, Dutta NK,Bhattacharya AK. (2000) Rheologicalbehavior of highly filled ethylene prop-ylene diene rubber compounds. PolymEng Sci 40(5):1065–1073
Meissner J, Garbella RW, Hostettler J(1989) Measuring normal stress differ-ences in polymer melt shear flow.J Rheol 33:843–864
Ohl N (1991) Die Beschreibung des Fliess-verhaltens von Suspensionen viskoelas-tischer Flussigkeiten bis zu hohenVolumenkonzentrationen. Diss.Universitat Karlsruhe (TH), Karlsruhe
Ohl N, Gleissle W (1992) The secondnormal stress difference for pure andhighly filled viscoelastic fluids. RheolActa 31:294–306
Ohl N, Gleissle W (1993) The characteriza-tion of steady-state shear and normalstress functions of highly concentratedsuspensions formulated with viscoelas-tic liquids. J Rheol 37(2):381–406
Petersen FJ (1974) Zur Bestimmung derNormalspannungsfunktionen vonHochpolymeren mittels der Platte-Abstands-Anordnung. Diss. RWTH-Aachen, Aachen
Phan-Thien N, Fan XJ, Khoo BC (1999) Anew constitutive model for monodi-spersed suspensions of spheres at highconcentrations. Rheol Acta 38(4):297–304
Powell RL (1998) In: Collyer AA, CleggPW (eds) Rheological measurements.Chapman & Hall, London
Schaink HM, Slot JM, Jongschaap RJJ,Mellema J (2000) The rheology ofsystems containing rigid spheres sus-pended in both viscous and viscoelasticmedia, studied by Stokesian dynamicssimulations. J Rheol 44(3):473–498
Tanaka H, White JL (1980) Experimentalinvestigations of shear and elongation-al flow properties of polystyrene meltsreinforced with calcium carbonate,titanium dioxide, and carbon black.Polym Eng Sci 20:949–956
Tanner RI, Keentok M (1983) Shear frac-ture in cone-plate rheometry. J Rheol27:47–57
Zarraga IE, Hill DA, Leighton DT (2000)The characterization of the total stressof concentrated suspensions of noncol-loidal spheres in Newtonian fluids.J Rheol 44(2):185–220
76