Embed Size (px)
Citation preview
Sarah Hillyear, Operations Manager
the offshore decommissioning market in the North Sea
the decommissioning market – present & future
the industry role for Decom North Sea
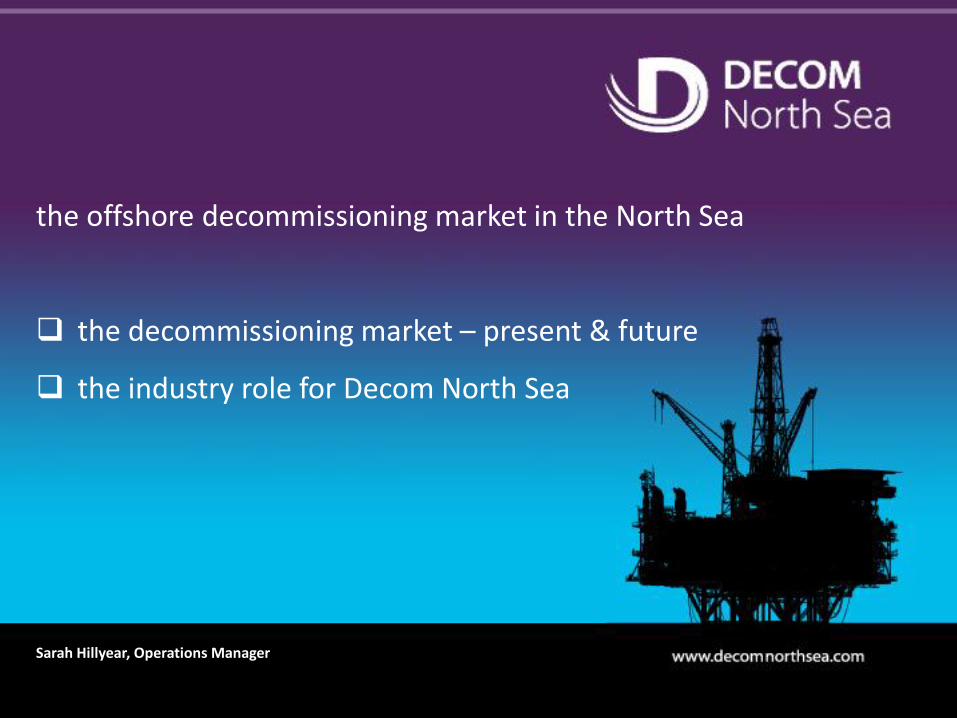
North Sea decommissioning activity
• developing decommissioning market
• ~ 7% of facilities removed to date with varying conditions and complexity
• estimated £400-500m annual spend, and rising
• supply chain capability developing
Shell Indefatigable
just completed BP NW Hutton
removed
Shell Brent Delta
being prepared
“coming soon”BP Miller, ValhallMarathon BraeCNR Murchison,
Ninian NorthHess Fife, Flora,
Angus, FergusPerenco Lemanand others
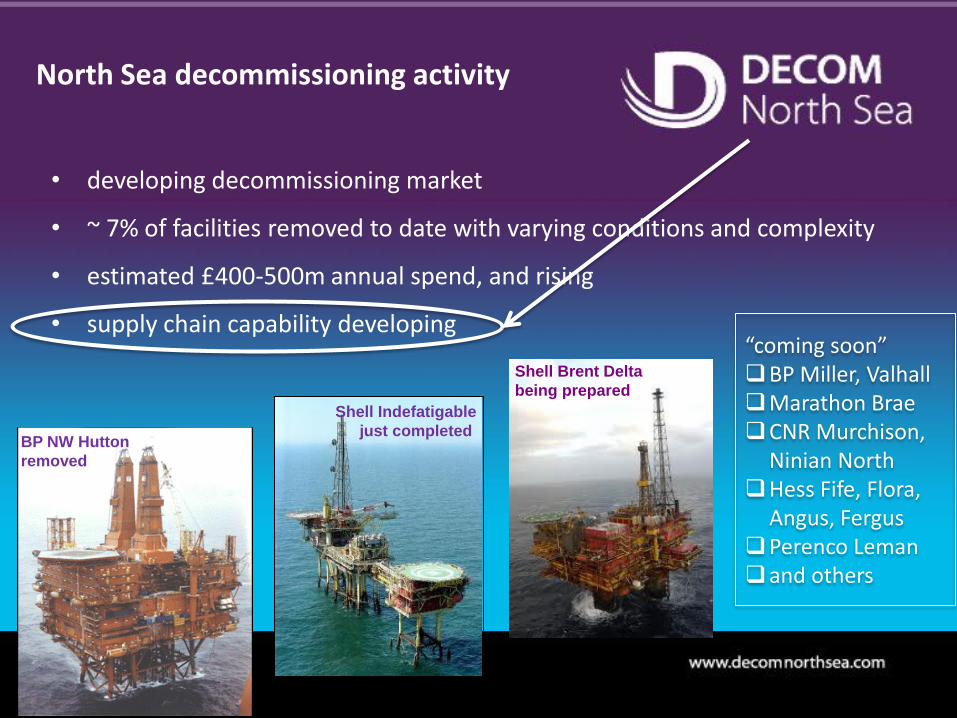
many forthcoming projects will be “firsts” for their respective operators
decommissioning projects have largely been “one-offs”
limited opportunity for learning and knowledge transfer
decommissioning cost estimates continuing to increase
early contractual experiences not always happy - for operators or contractors
industry now genuinely seeking more co-operation and innovation
some new technologies needed
some market observations
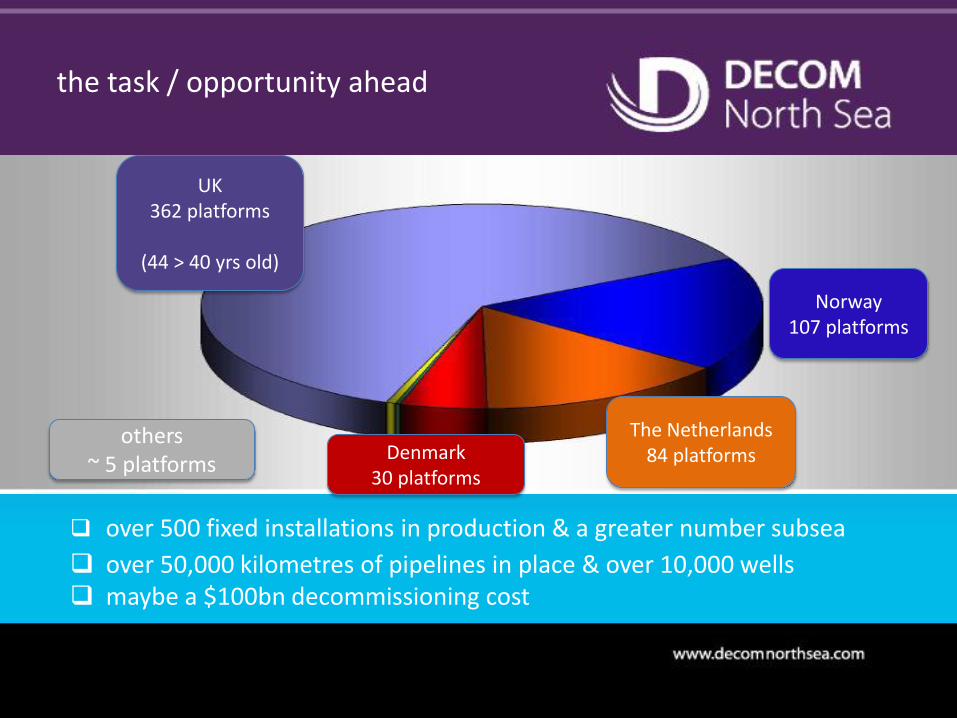
the task / opportunity ahead
over 500 fixed installations in production & a greater number subsea
over 50,000 kilometres of pipelines in place & over 10,000 wells maybe a $100bn decommissioning cost
UK 362 platforms
(44 > 40 yrs old)
Norway107 platforms
The Netherlands84 platformsDenmark
30 platforms
others ~ 5 platforms
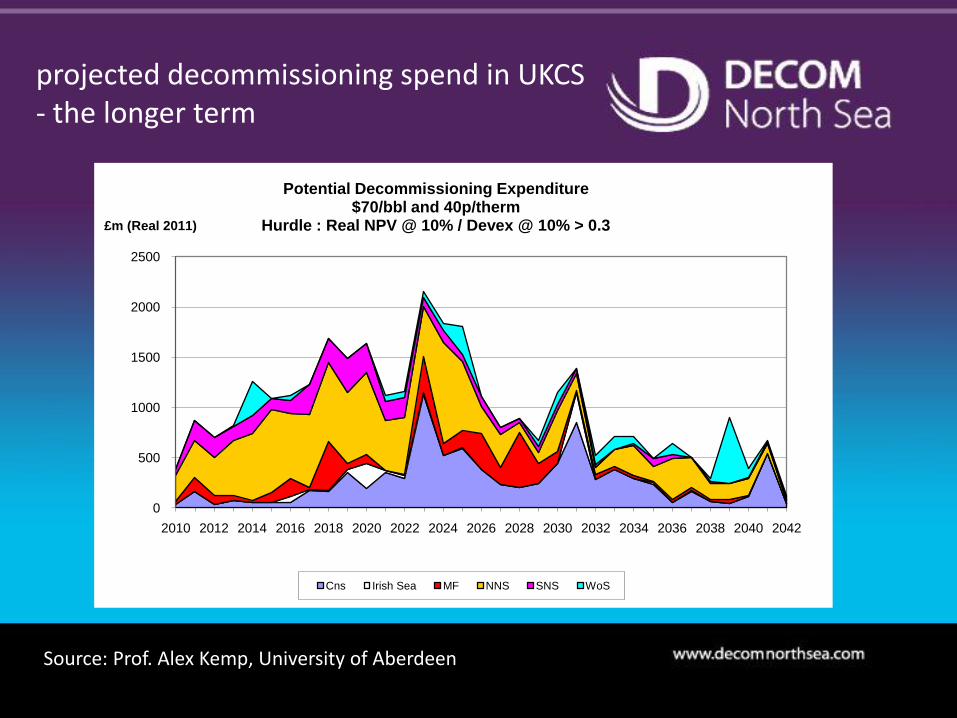
projected decommissioning spend in UKCS- the longer term
0
500
1000
1500
2000
2500
2010 2012 2014 2016 2018 2020 2022 2024 2026 2028 2030 2032 2034 2036 2038 2040 2042
£m (Real 2011)
Potential Decommissioning Expenditure$70/bbl and 40p/therm
Hurdle : Real NPV @ 10% / Devex @ 10% > 0.3
Cns Irish Sea MF NNS SNS WoS
Source: Prof. Alex Kemp, University of Aberdeen
0
200
400
600
800
1000
1200
2012 2013 2014 2015 2016
Tota
l Sp
en
d (
£m
illio
n)
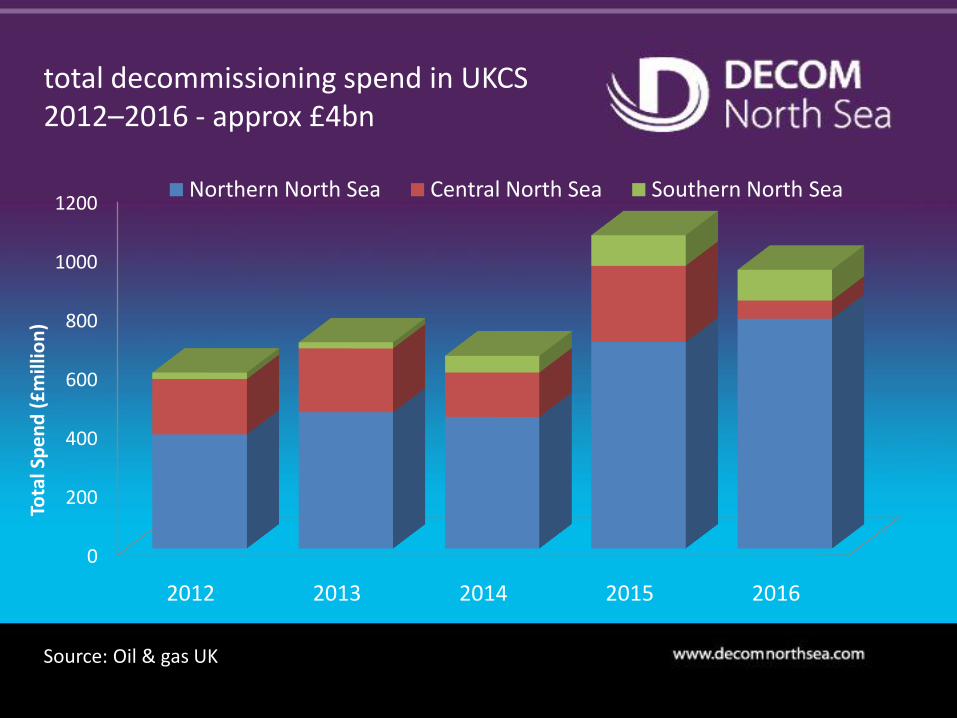
Northern North Sea Central North Sea Southern North Sea
Source: Oil & Gas UK Decommissioning Survey
total decommissioning spend in UKCS 2012–2016 - approx £4bn
Source: Oil & gas UK
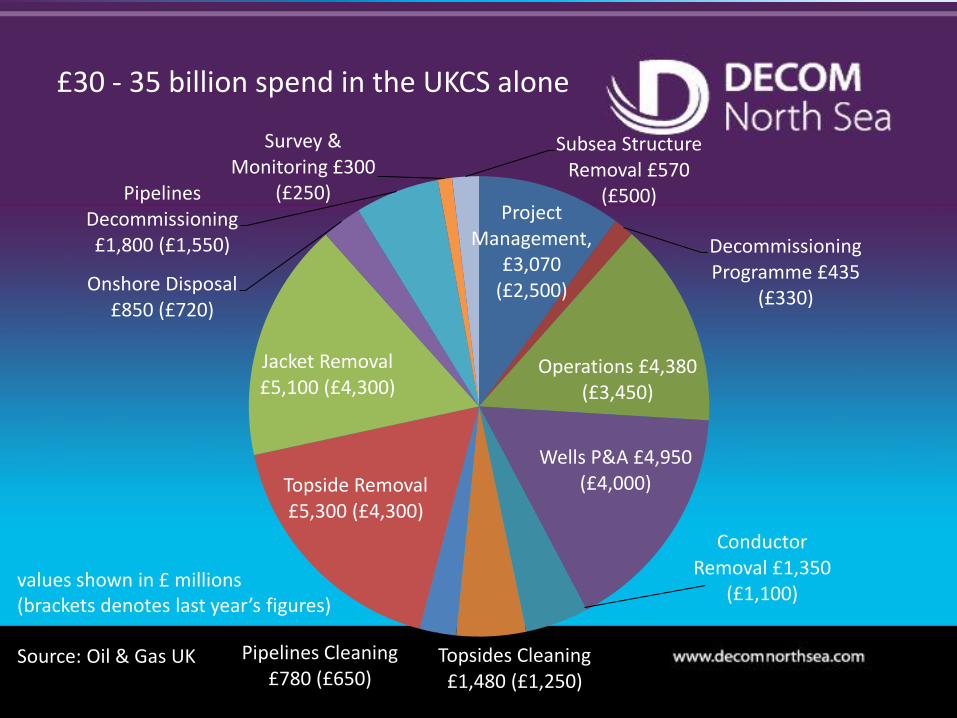
£30 - 35 billion spend in the UKCS alone
Project Management,
£3,070(£2,500)
Decommissioning Programme £435
(£330)
Operations £4,380 (£3,450)
Wells P&A £4,950 (£4,000)
Conductor Removal £1,350
(£1,100)
Topsides Cleaning £1,480 (£1,250)
Pipelines Cleaning £780 (£650)
Topside Removal £5,300 (£4,300)
Jacket Removal £5,100 (£4,300)
Onshore Disposal £850 (£720)
Pipelines Decommissioning £1,800 (£1,550)
Survey & Monitoring £300
(£250)
Subsea Structure Removal £570
(£500)
values shown in £ millions (brackets denotes last year’s figures)
Source: Oil & Gas UK
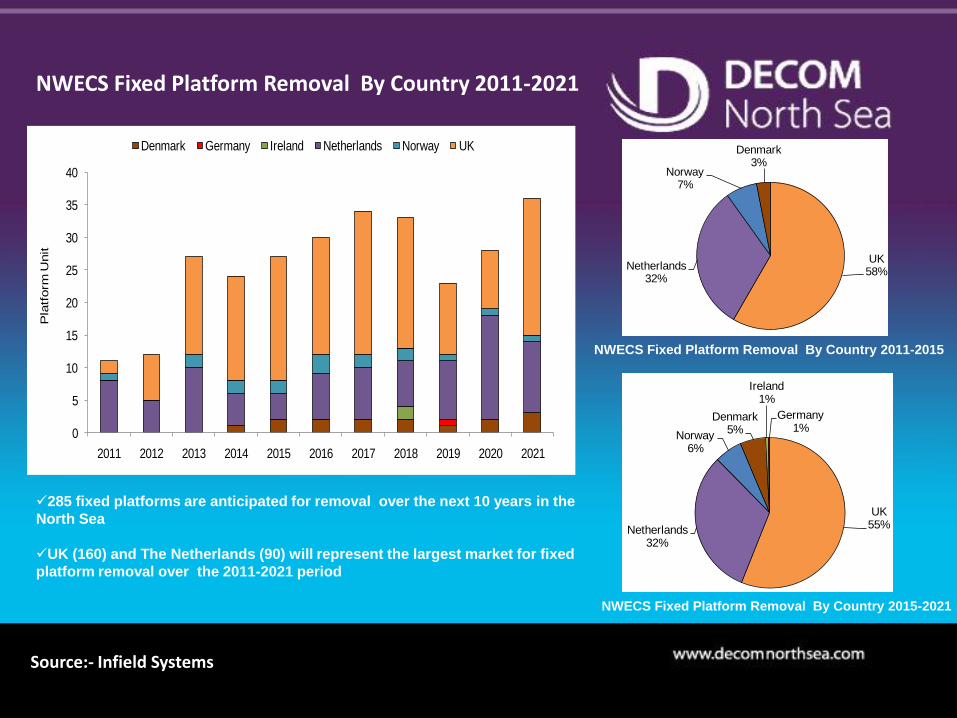
Source:- Infield Systems
NWECS Fixed Platform Removal By Country 2011-2015
NWECS Fixed Platform Removal By Country 2015-2021
NWECS Fixed Platform Removal By Country 2011-2021
285 fixed platforms are anticipated for removal over the next 10 years in the
North Sea
UK (160) and The Netherlands (90) will represent the largest market for fixed
platform removal over the 2011-2021 period
0
5
10
15
20
25
30
35
40
2011 2012 2013 2014 2015 2016 2017 2018 2019 2020 2021
Denmark Germany Ireland Netherlands Norway UK
Pla
tform
Unit
UK58%
Netherlands32%
Norway7%
Denmark3%
UK55%Netherlands
32%
Norway6%
Denmark5%
Ireland1%
Germany1%
Source:- Infield Systems
0
1
2
3
4
5
6
2011 2012 2013 2014 2015 2016 2017 2018 2019 2020
Norway UK
Pla
tform
Unit
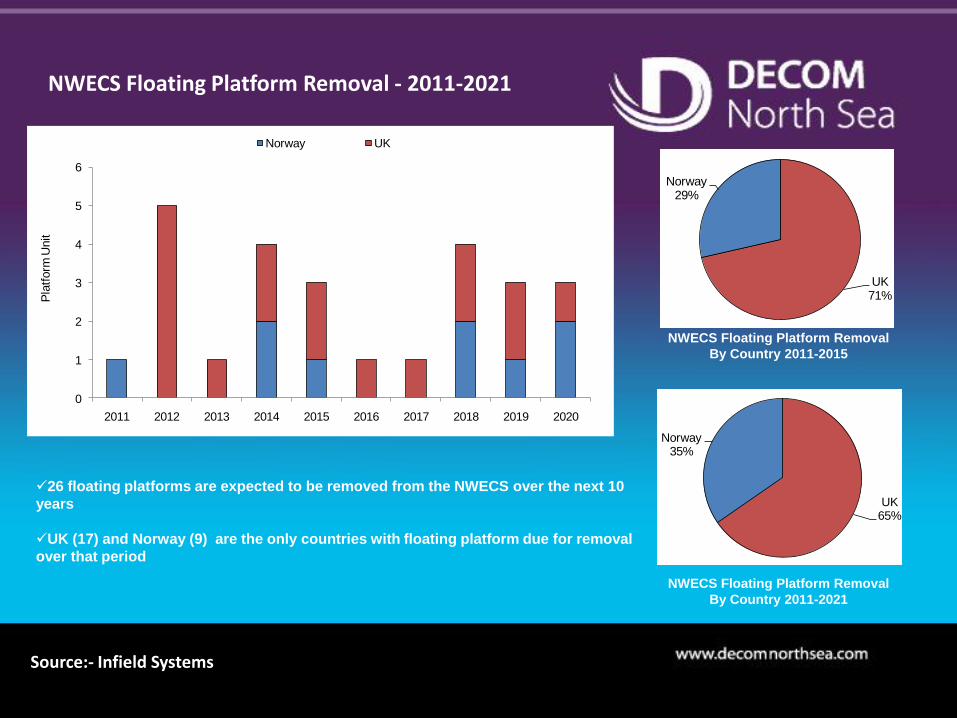
NWECS Floating Platform Removal
By Country 2011-2015
26 floating platforms are expected to be removed from the NWECS over the next 10
years
UK (17) and Norway (9) are the only countries with floating platform due for removal
over that period
NWECS Floating Platform Removal
By Country 2011-2021
NWECS Floating Platform Removal - 2011-2021
UK65%
Norway35%
UK71%
Norway29%
Source:- Infield Systems
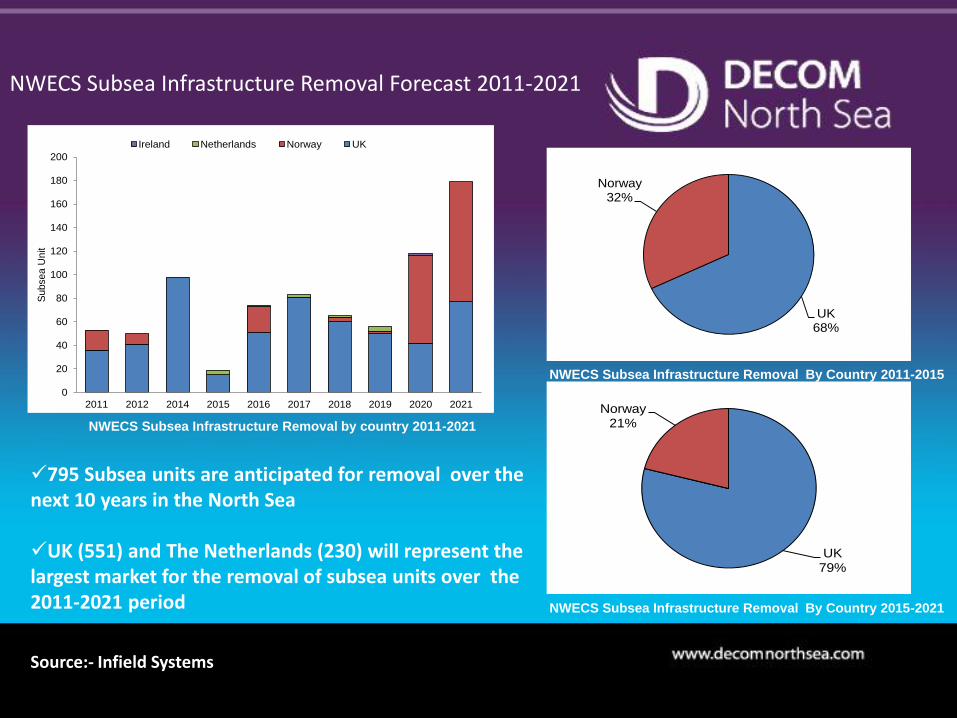
NWECS Subsea Infrastructure Removal Forecast 2011-2021
0
20
40
60
80
100
120
140
160
180
200
2011 2012 2014 2015 2016 2017 2018 2019 2020 2021
Subsea U
nit
Ireland Netherlands Norway UK
UK68%
Norway32%
NWECS Subsea Infrastructure Removal By Country 2011-2015
UK79%
Norway21%
NWECS Subsea Infrastructure Removal By Country 2015-2021
NWECS Subsea Infrastructure Removal by country 2011-2021
795 Subsea units are anticipated for removal over the next 10 years in the North Sea
UK (551) and The Netherlands (230) will represent the largest market for the removal of subsea units over the 2011-2021 period
Source:- Infield Systems
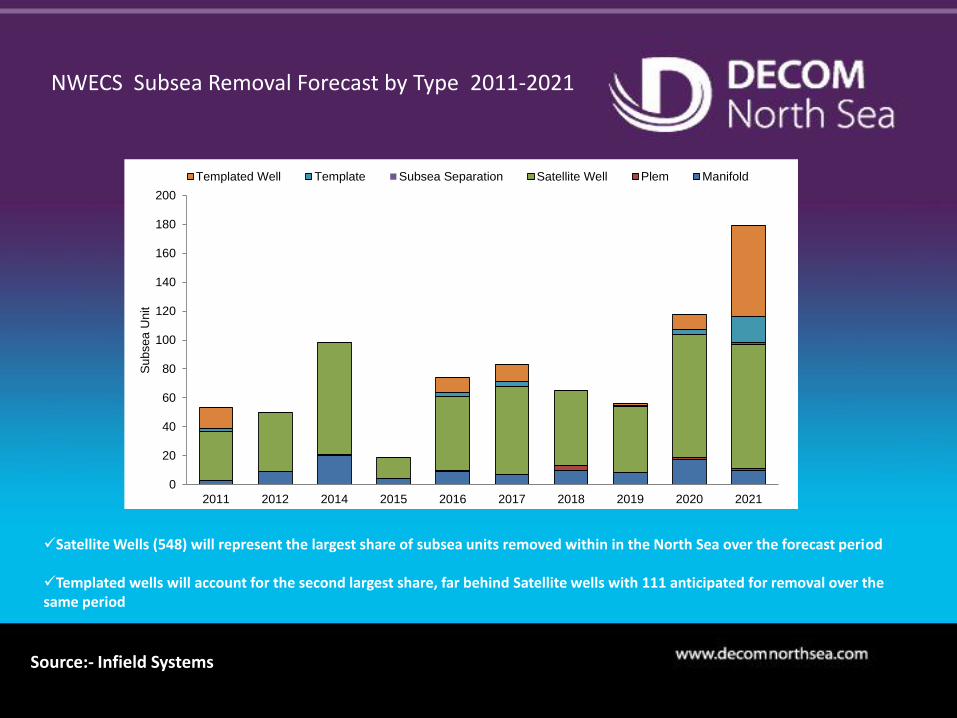
NWECS Subsea Removal Forecast by Type 2011-2021
0
20
40
60
80
100
120
140
160
180
200
2011 2012 2014 2015 2016 2017 2018 2019 2020 2021
Subsea U
nit
Templated Well Template Subsea Separation Satellite Well Plem Manifold
Satellite Wells (548) will represent the largest share of subsea units removed within in the North Sea over the forecast period
Templated wells will account for the second largest share, far behind Satellite wells with 111 anticipated for removal over the same period
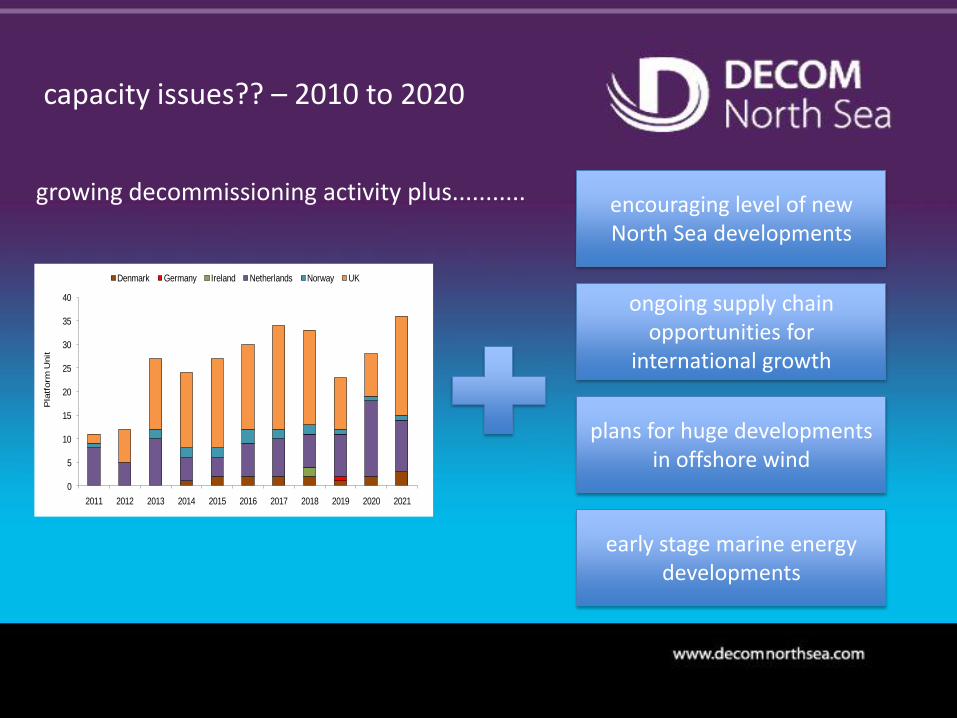
capacity issues?? – 2010 to 2020
encouraging level of new North Sea developments
ongoing supply chain opportunities for
international growth
plans for huge developments in offshore wind
early stage marine energy developments
growing decommissioning activity plus...........
0
5
10
15
20
25
30
35
40
2011 2012 2013 2014 2015 2016 2017 2018 2019 2020 2021
Denmark Germany Ireland Netherlands Norway UK
Pla
tform
Unit
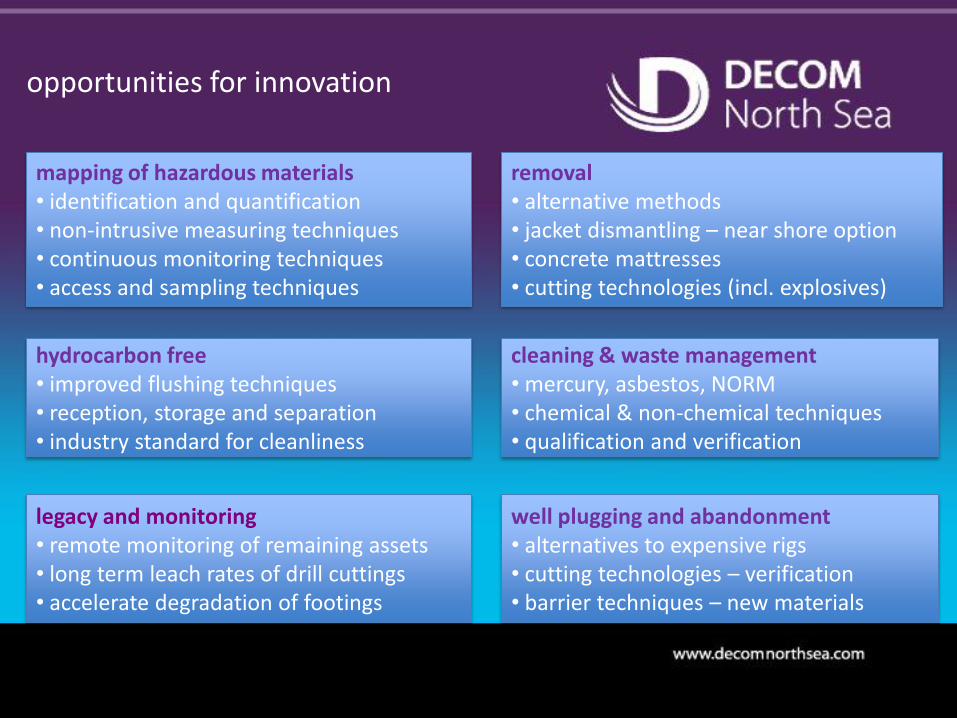
opportunities for innovation
mapping of hazardous materials• identification and quantification• non-intrusive measuring techniques• continuous monitoring techniques• access and sampling techniques
well plugging and abandonment• alternatives to expensive rigs• cutting technologies – verification• barrier techniques – new materials
hydrocarbon free• improved flushing techniques• reception, storage and separation• industry standard for cleanliness
cleaning & waste management• mercury, asbestos, NORM• chemical & non-chemical techniques• qualification and verification
removal• alternative methods• jacket dismantling – near shore option• concrete mattresses• cutting technologies (incl. explosives)
legacy and monitoring• remote monitoring of remaining assets• long term leach rates of drill cuttings• accelerate degradation of footings
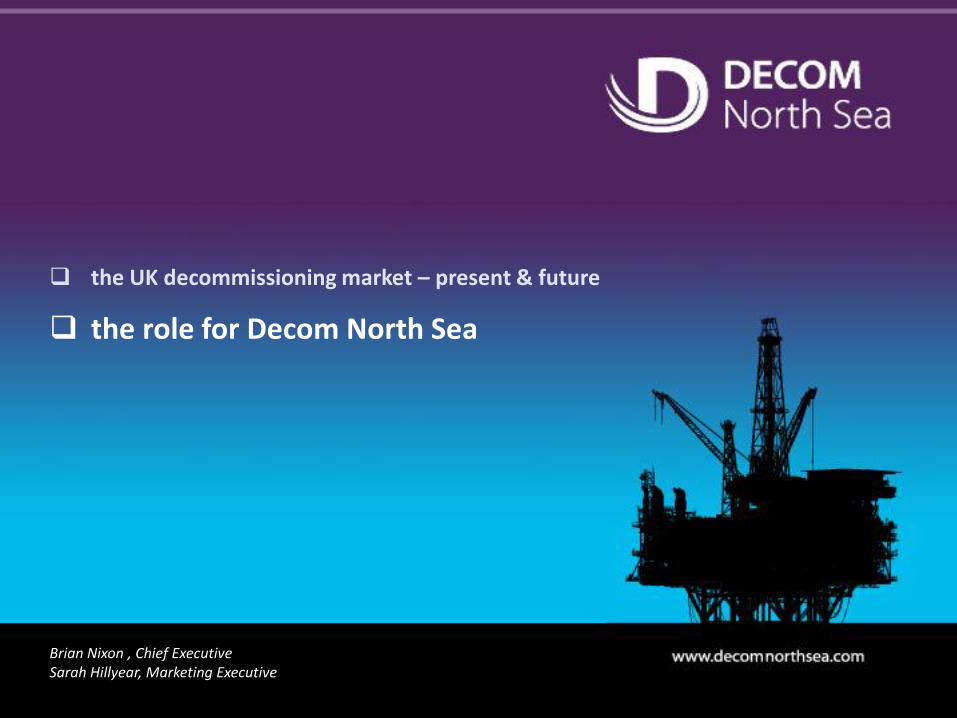
Brian Nixon , Chief ExecutiveSarah Hillyear, Marketing Executive
the UK decommissioning market – present & future
the role for Decom North Sea
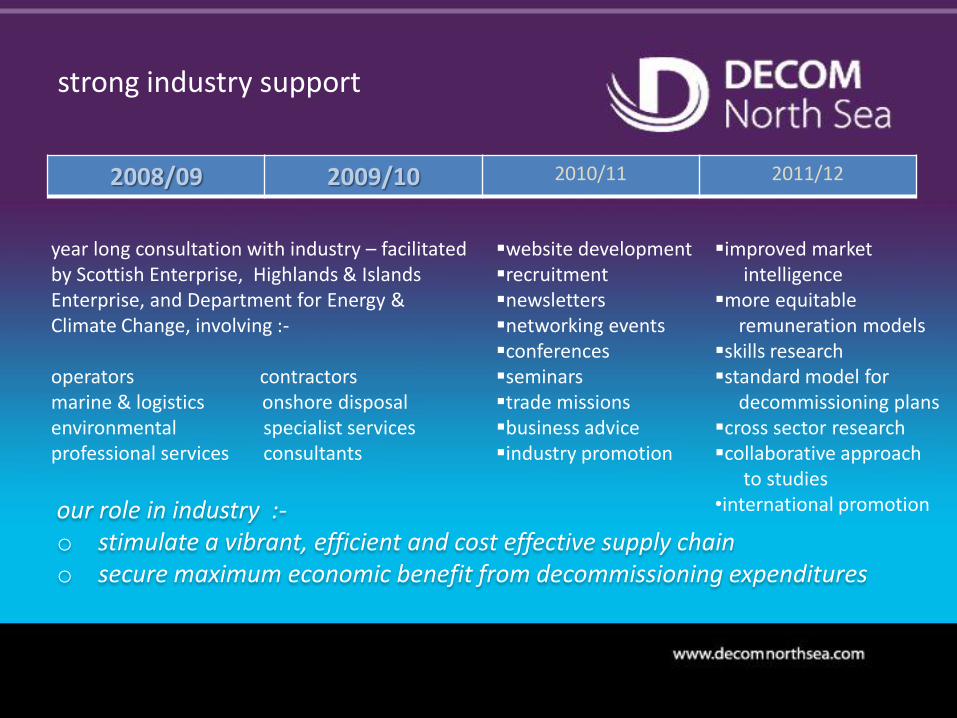
strong industry support
2008/09 2009/10 2010/11 2011/12
year long consultation with industry – facilitated by Scottish Enterprise, Highlands & Islands Enterprise, and Department for Energy & Climate Change, involving :-
operators contractorsmarine & logistics onshore disposalenvironmental specialist servicesprofessional services consultants
our role in industry :-o stimulate a vibrant, efficient and cost effective supply chaino secure maximum economic benefit from decommissioning expenditures
website developmentrecruitmentnewslettersnetworking eventsconferencesseminarstrade missionsbusiness adviceindustry promotion
improved marketintelligence
more equitable remuneration models
skills researchstandard model for
decommissioning planscross sector researchcollaborative approach
to studies•international promotion
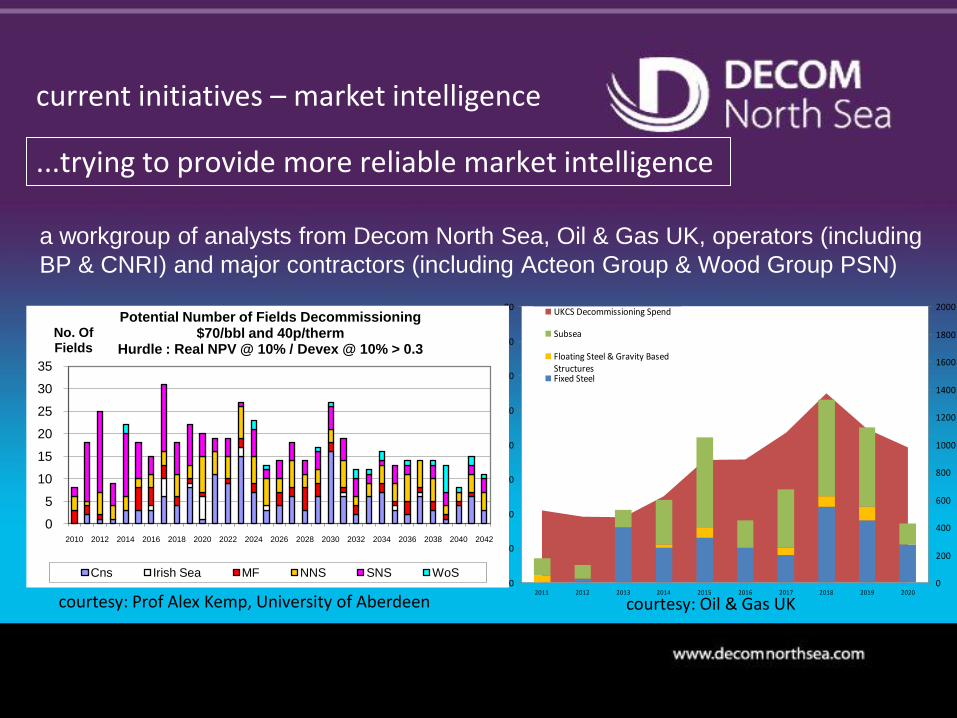
current initiatives – market intelligence
a workgroup of analysts from Decom North Sea, Oil & Gas UK, operators (including
BP & CNRI) and major contractors (including Acteon Group & Wood Group PSN)
0
10
20
30
40
50
60
70
80
2011 2012 2013 2014 2015 2016 2017 2018 2019 2020
No
. Of
Pla
tfo
rms/
Inst
alla
tio
ns
0
200
400
600
800
1000
1200
1400
1600
1800
2000
UK
CS
De
com
mis
sio
nin
g Sp
en
d (
£M
20
09
mo
ne
y)
UKCS Decommissioning Spend
Subsea
Floating Steel & Gravity BasedStructuresFixed Steel
courtesy: Prof Alex Kemp, University of Aberdeen courtesy: Oil & Gas UK
0
5
10
15
20
25
30
35
2010 2012 2014 2016 2018 2020 2022 2024 2026 2028 2030 2032 2034 2036 2038 2040 2042
No. OfFields
Potential Number of Fields Decommissioning$70/bbl and 40p/therm
Hurdle : Real NPV @ 10% / Devex @ 10% > 0.3
Cns Irish Sea MF NNS SNS WoS
...trying to provide more reliable market intelligence
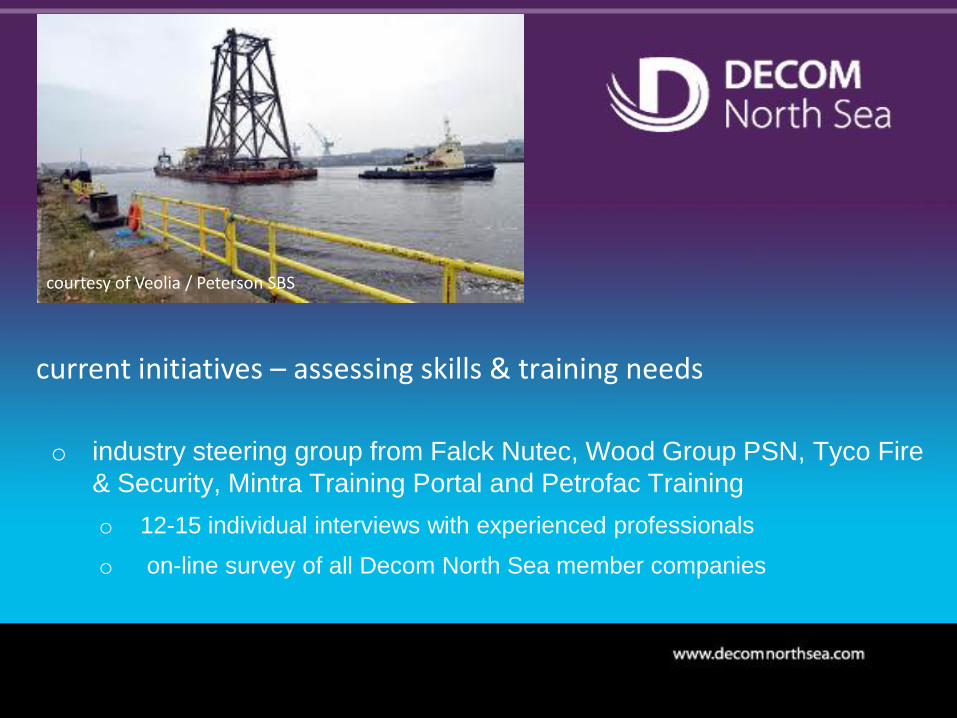
current initiatives – assessing skills & training needs
o industry steering group from Falck Nutec, Wood Group PSN, Tyco Fire
& Security, Mintra Training Portal and Petrofac Training
o 12-15 individual interviews with experienced professionals
o on-line survey of all Decom North Sea member companies
courtesy of Veolia / Peterson SBS
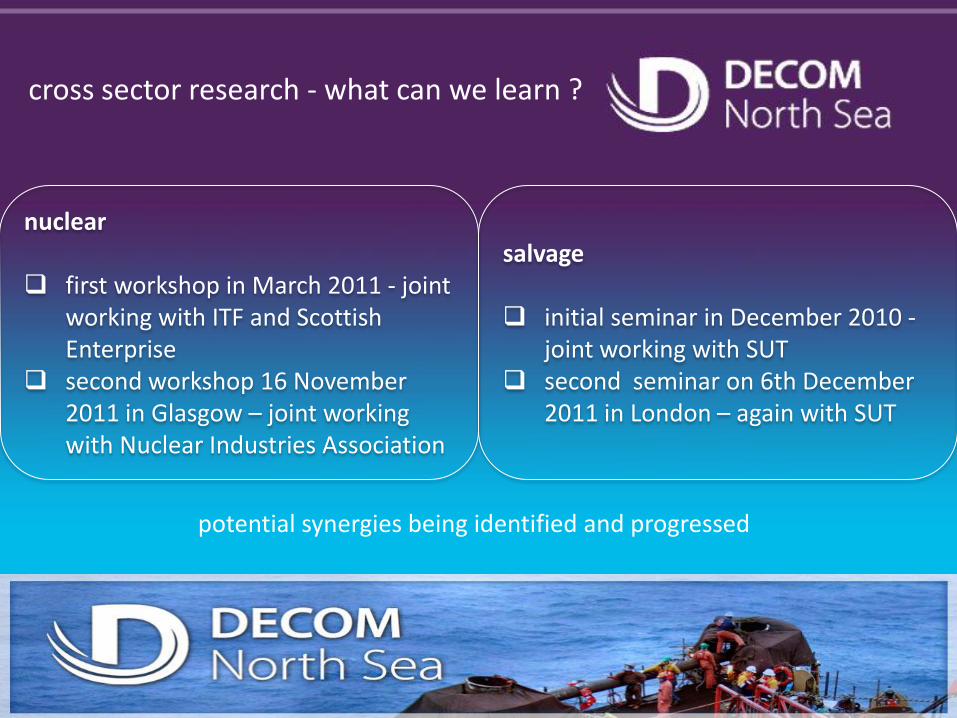
cross sector research - what can we learn ?
nuclear
first workshop in March 2011 - joint working with ITF and Scottish Enterprise
second workshop 16 November 2011 in Glasgow – joint working with Nuclear Industries Association
salvage
initial seminar in December 2010 -joint working with SUT
second seminar on 6th December 2011 in London – again with SUT
potential synergies being identified and progressed
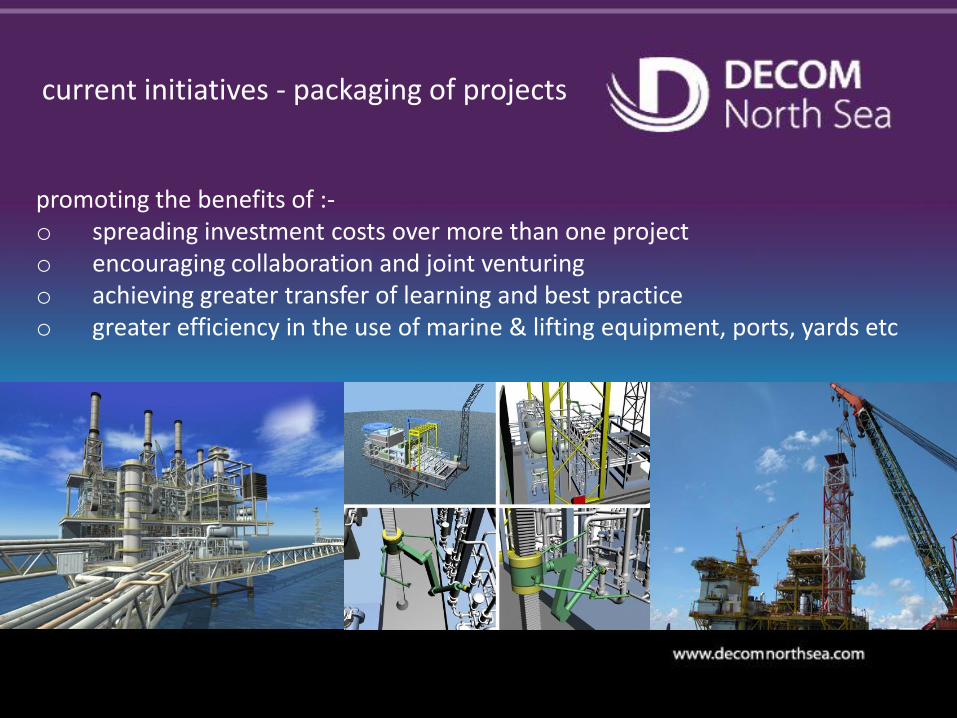
promoting the benefits of :-o spreading investment costs over more than one projecto encouraging collaboration and joint venturingo achieving greater transfer of learning and best practiceo greater efficiency in the use of marine & lifting equipment, ports, yards etc
current initiatives - packaging of projects
Sarah Hillyear, Operations Manager
www.decomnorthsea.com