Embed Size (px)
Citation preview

The Principals of Credit Cards Business
Pradeep PantVP & Cards Business Director
Citibank Taiwan
Note-The data used in this presentation is indicative to explain the concepts of Card Business and may not be accurate.
2
What is this session about?
Credit Card business
Lending on Cards & Unsecured Lending
Cards market in Taiwan & Asia
What is Cards business?
P&L Dynamics of Cards Business?
What are the Key Functions in Cards Business?
What about kind of skills & people needed in this business?
3
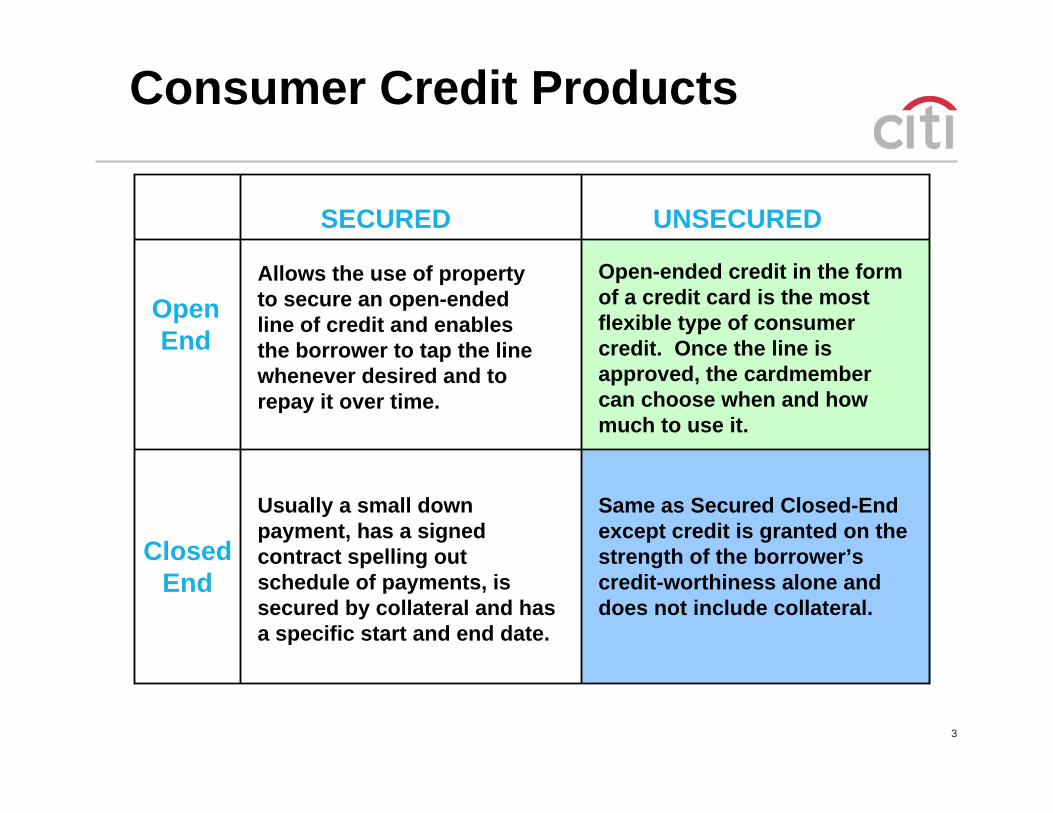
Consumer Credit Products
SECURED UNSECURED
Open End
ClosedEnd
Allows the use of property to secure an open-ended line of credit and enables the borrower to tap the line whenever desired and to repay it over time.
Open-ended credit in the form of a credit card is the most flexible type of consumer credit. Once the line is approved, the cardmembercan choose when and how much to use it.
Usually a small down payment, has a signed contract spelling out schedule of payments, is secured by collateral and has a specific start and end date.
Same as Secured Closed-Endexcept credit is granted on thestrength of the borrower’s credit-worthiness alone and does not include collateral.
Cards Industry in Taiwan
5
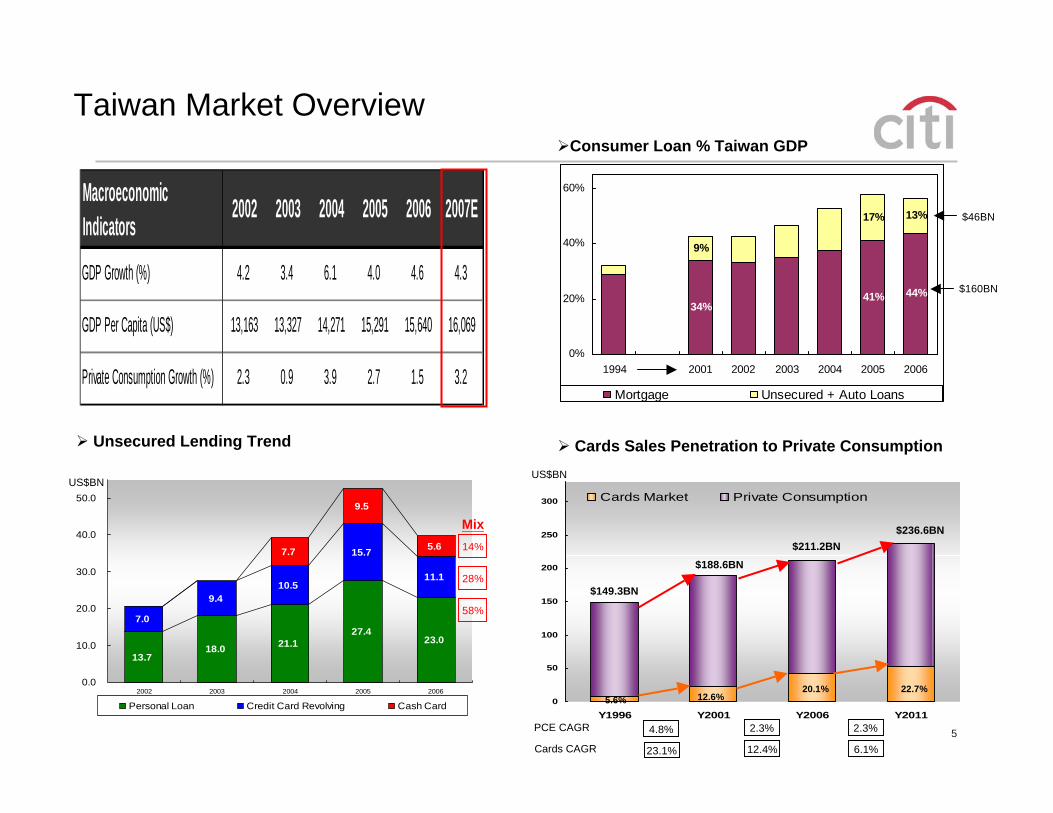
41% 44%
17% 13%
34%
9%
0%
20%
40%
60%
1994 2001 2002 2003 2004 2005 2006
Mortgage Unsecured + Auto Loans
Taiwan Market Overview
MacroeconomicIndicators 2002 2003 2004 2005 2006 2007E
GDP Growth (%) 4.2 3.4 6.1 4.0 4.6 4.3
GDP Per Capita (US$) 13,163 13,327 14,271 15,291 15,640 16,069
Private Consumption Growth (%) 2.3 0.9 3.9 2.7 1.5 3.2
$160BN
$46BN
13.718.0 21.1
27.423.0
7.0
9.410.5
15.7
11.1
7.7
9.5
5.6
0.0
10.0
20.0
30.0
40.0
50.0
2002 2003 2004 2005 2006
Personal Loan Credit Card Revolving Cash Card
US$BN
Unsecured Lending Trend
14%
28%
58%
Cards Sales Penetration to Private Consumption
0
50
100
150
200
250
300
Y1996 Y2001 Y2006 Y2011
Cards Market Private Consumption
12.6%20.1% 22.7%
US$BN
$236.6BN$211.2BN
$188.6BN
$149.3BN
5.6%
PCE CAGR 4.8% 2.3% 2.3%
Cards CAGR 23.1% 12.4% 6.1%
Consumer Loan % Taiwan GDP
Mix
6
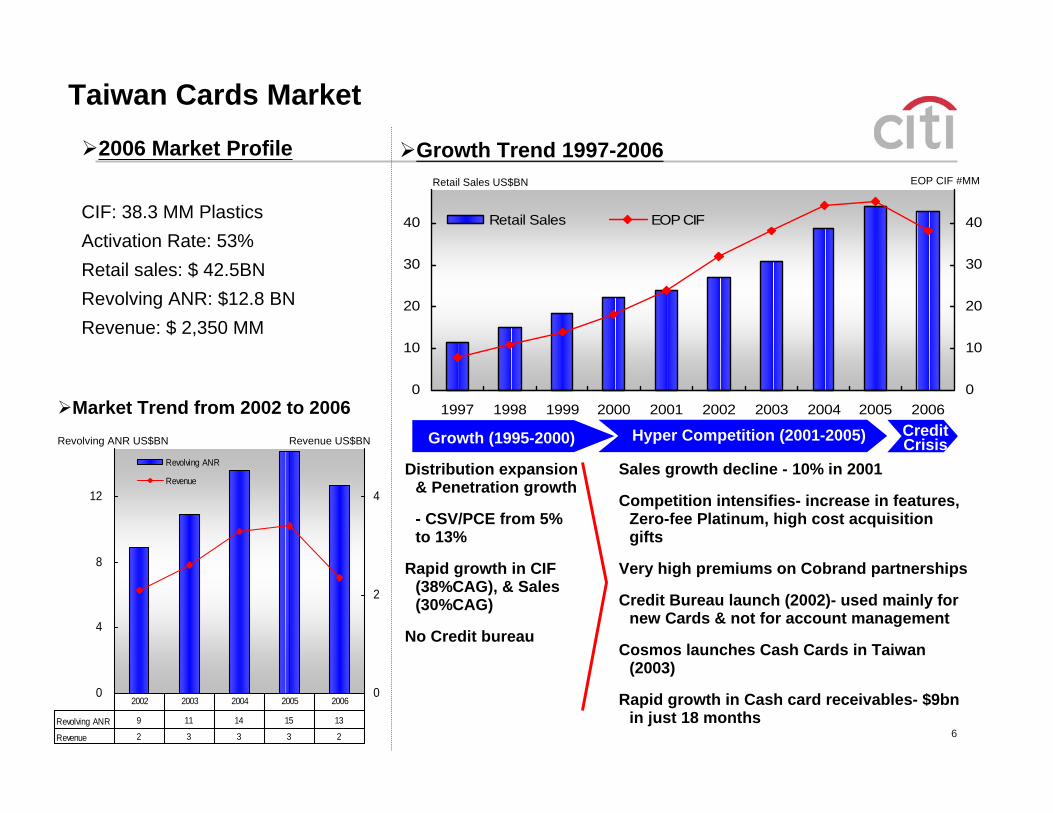
Taiwan Cards Market
0
10
20
30
40
1997 1998 1999 2000 2001 2002 2003 2004 2005 20060
10
20
30
40Retail Sales EOP CIF
Retail Sales US$BN
Growth (1995-2000) Hyper Competition (2001-2005)
Distribution expansion & Penetration growth
- CSV/PCE from 5% to 13%
Rapid growth in CIF (38%CAG), & Sales (30%CAG)
No Credit bureau
Sales growth decline - 10% in 2001
Competition intensifies- increase in features, Zero-fee Platinum, high cost acquisition gifts
Very high premiums on Cobrand partnerships
Credit Bureau launch (2002)- used mainly for new Cards & not for account management
Cosmos launches Cash Cards in Taiwan (2003)
Rapid growth in Cash card receivables- $9bn in just 18 months
EOP CIF #MM
2006 Market Profile
CIF: 38.3 MM PlasticsActivation Rate: 53%Retail sales: $ 42.5BNRevolving ANR: $12.8 BNRevenue: $ 2,350 MM
0
4
8
12
0
2
4
Revolving ANR
Revenue
Revolving ANR 9 11 14 15 13
Revenue 2 3 3 3 2
2002 2003 2004 2005 2006
Revolving ANR US$BN Revenue US$BN
Market Trend from 2002 to 2006
Growth Trend 1997-2006
CreditCrisis
7
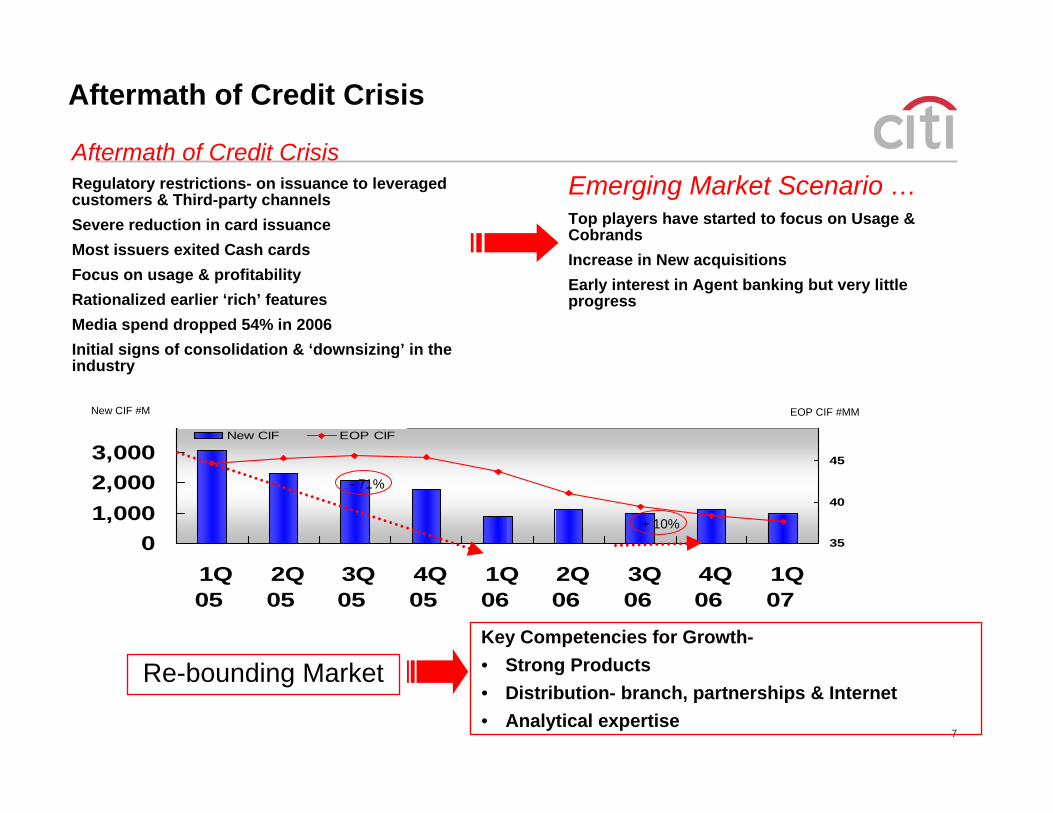
Aftermath of Credit Crisis
Aftermath of Credit CrisisRegulatory restrictions- on issuance to leveraged customers & Third-party channelsSevere reduction in card issuanceMost issuers exited Cash cardsFocus on usage & profitability Rationalized earlier ‘rich’ featuresMedia spend dropped 54% in 2006Initial signs of consolidation & ‘downsizing’ in the industry
Emerging Market Scenario …Top players have started to focus on Usage & Cobrands Increase in New acquisitions Early interest in Agent banking but very little progress
Re-bounding MarketKey Competencies for Growth-• Strong Products• Distribution- branch, partnerships & Internet• Analytical expertise
01,0002,0003,000
1Q05
2Q05
3Q05
4Q05
1Q06
2Q06
3Q06
4Q06
1Q07
35
40
45
New CIF EOP CIF
EOP CIF #MMNew CIF #M
+ 10%
- 71%
8
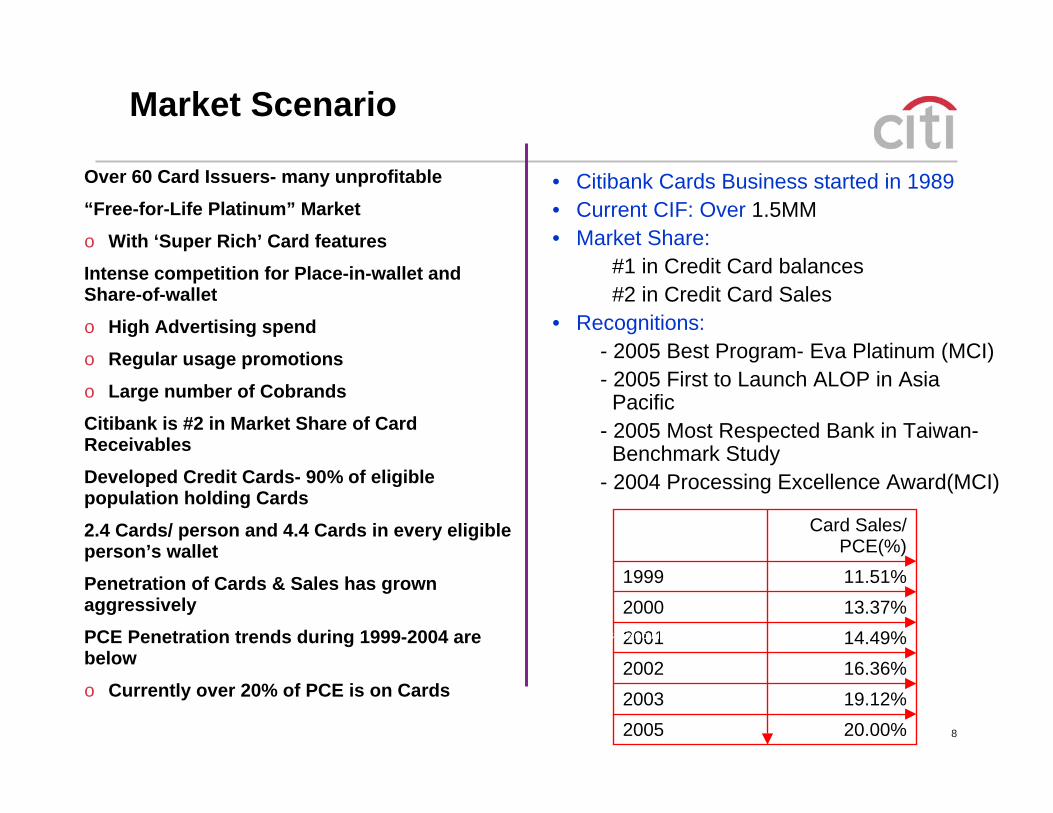
Market Scenario
20.00%200519.12%200316.36%200214.49%200113.37%200011.51%1999
Card Sales/ PCE(%)
Source: Directorate-General of Budget, Accounting & Statistics, Executive Yuan, FSC
Over 60 Card Issuers- many unprofitable
“Free-for-Life Platinum” Market
o With ‘Super Rich’ Card features
Intense competition for Place-in-wallet and Share-of-wallet
o High Advertising spend
o Regular usage promotions
o Large number of CobrandsCitibank is #2 in Market Share of Card Receivables
Developed Credit Cards- 90% of eligible population holding Cards
2.4 Cards/ person and 4.4 Cards in every eligible person’s wallet
Penetration of Cards & Sales has grown aggressivelyPCE Penetration trends during 1999-2004 are below
o Currently over 20% of PCE is on Cards
• Citibank Cards Business started in 1989 • Current CIF: Over 1.5MM• Market Share:
#1 in Credit Card balances#2 in Credit Card Sales
• Recognitions:- 2005 Best Program- Eva Platinum (MCI)- 2005 First to Launch ALOP in Asia
Pacific- 2005 Most Respected Bank in Taiwan-
Benchmark Study- 2004 Processing Excellence Award(MCI)
9
Taiwan Market Overview - Summary
Market fragmentation remains unchanged (45 players in the market)
M&A keeps moving – Citibank & BOOC, HSBC & Chung Hwa, StanChart & HIB, GE & Cosmos, Longreach & EnTie, Taishin & CHB (still negotiating)
Banks have tightened credit policy, curtailed sales & marketing, and cut cardholder benefits
Contactless Cards, by delivering a faster and more efficient payment experience, is a strong small ticket payment solution
10
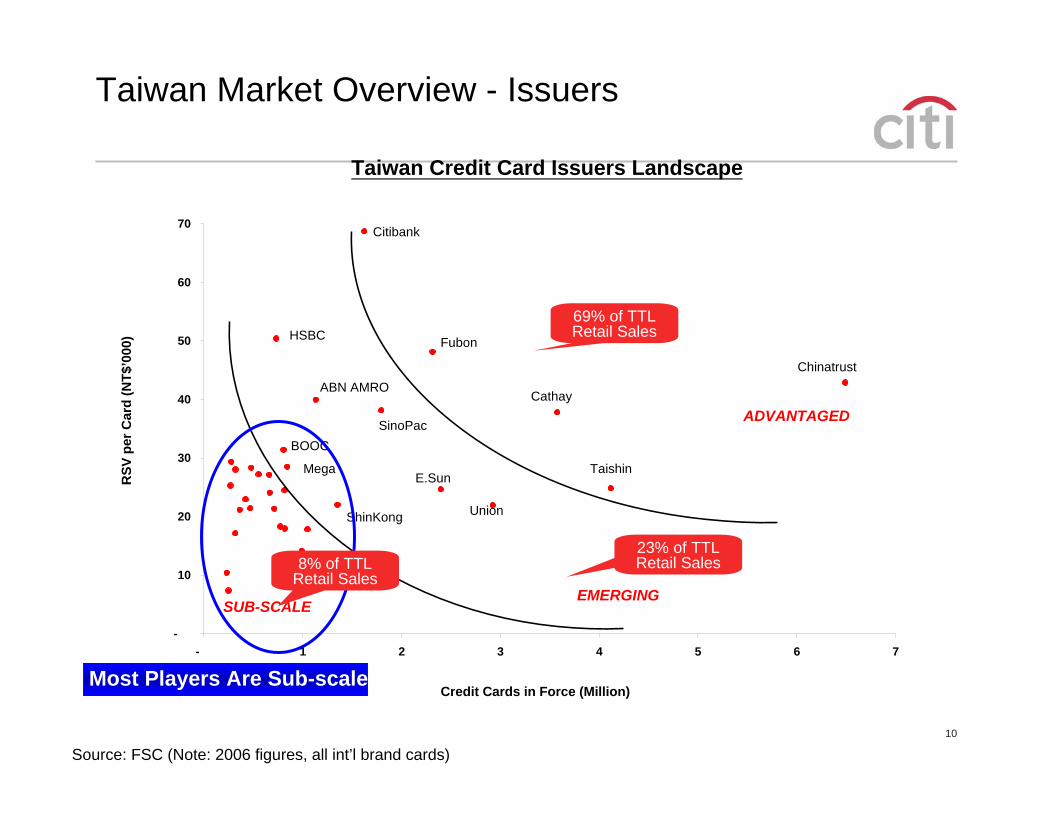
Taiwan Market Overview - Issuers
Source: FSC (Note: 2006 figures, all int’l brand cards)
Credit Cards in Force (Million)
RSV
per
Car
d (N
T$’0
00)
Taiwan Credit Card Issuers Landscape
-
10
20
30
40
50
60
70
- 1 2 3 4 5 6 7
Chinatrust
Taishin
Cathay
Fubon
Union
Citibank
E.Sun
SinoPac
ABN AMRO
HSBC
ShinKong
Mega
ADVANTAGED
SUB-SCALE EMERGING
BOOC
Most Players Are Sub-scale
69% of TTL Retail Sales
8% of TTL Retail Sales
23% of TTL Retail Sales
11
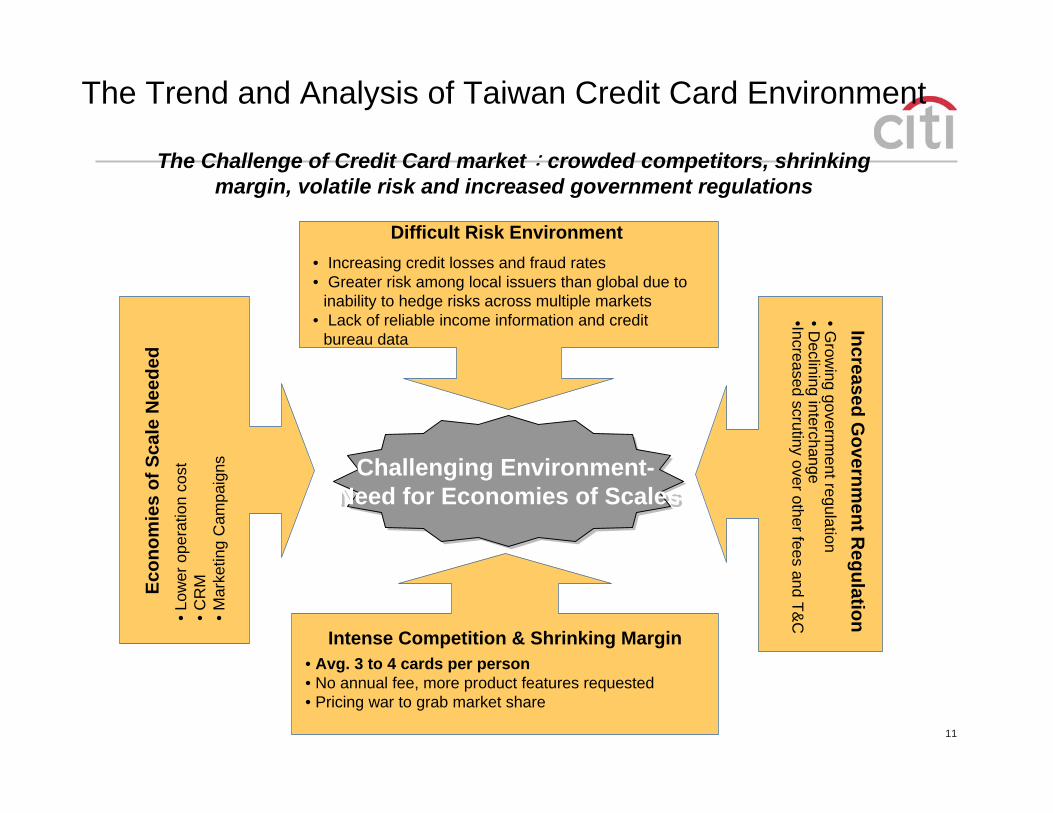
Challenging Environment-Need for Economies of Scales
Challenging Environment-Need for Economies of Scales
Intense Competition & Shrinking Margin• Avg. 3 to 4 cards per person• No annual fee, more product features requested• Pricing war to grab market share
Difficult Risk Environment• Increasing credit losses and fraud rates• Greater risk among local issuers than global due to
inability to hedge risks across multiple markets• Lack of reliable income information and credit
bureau data
Increased Governm
ent Regulation
•Grow
ing government regulation
•Declining interchange
•Increased scrutiny over other fees and T&C
Econ
omie
s of
Sca
le N
eede
d •L
ower
ope
ratio
n co
st•C
RM
•Mar
ketin
g C
ampa
igns
The Trend and Analysis of Taiwan Credit Card Environment
The Challenge of Credit Card market:crowded competitors, shrinking margin, volatile risk and increased government regulations
12
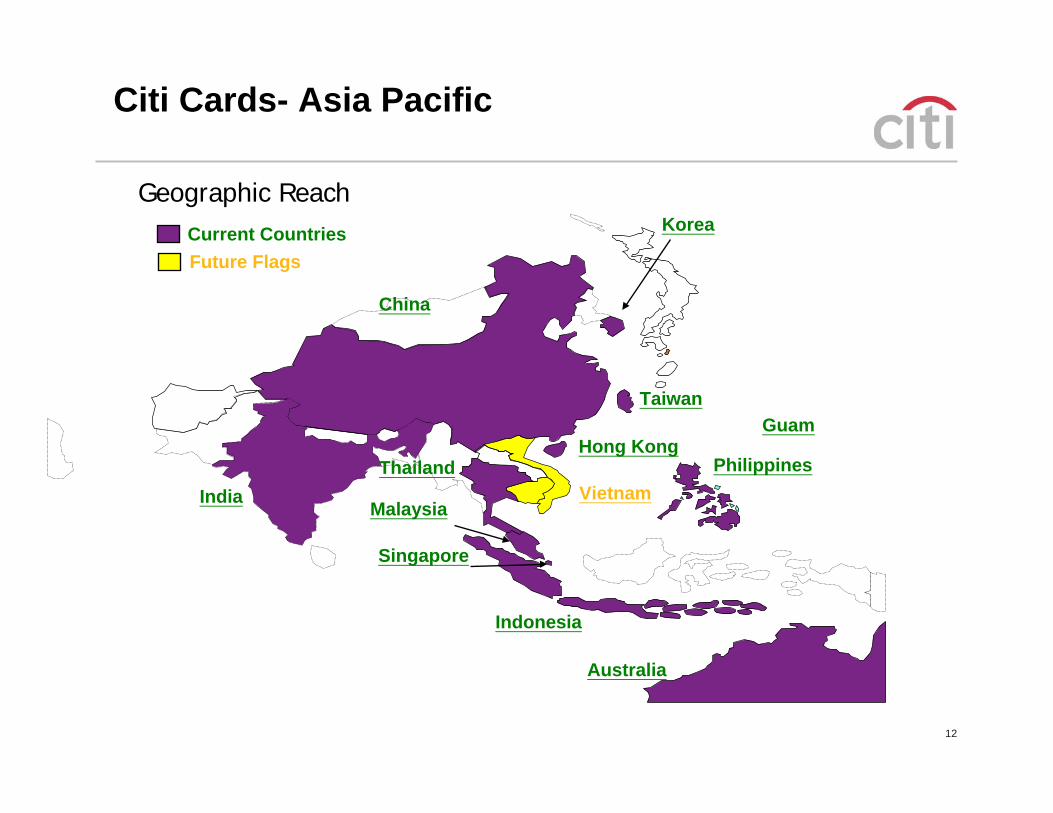
Citi Cards- Asia Pacific
Korea
Indonesia
Malaysia
Thailand
Australia
Hong Kong
Taiwan
Philippines
Singapore
Vietnam
China
Current CountriesFuture Flags
Guam
India
Geographic Reach
13
0
1000
2000
3000
4000
5000
6000
7000
8000Aus
tralia
Hon
g Kon
g
India
Indo
nesia
Malay
sia
Philippine
s
Singa
pore
Sou
th K
orea
Taiwan
Thailand
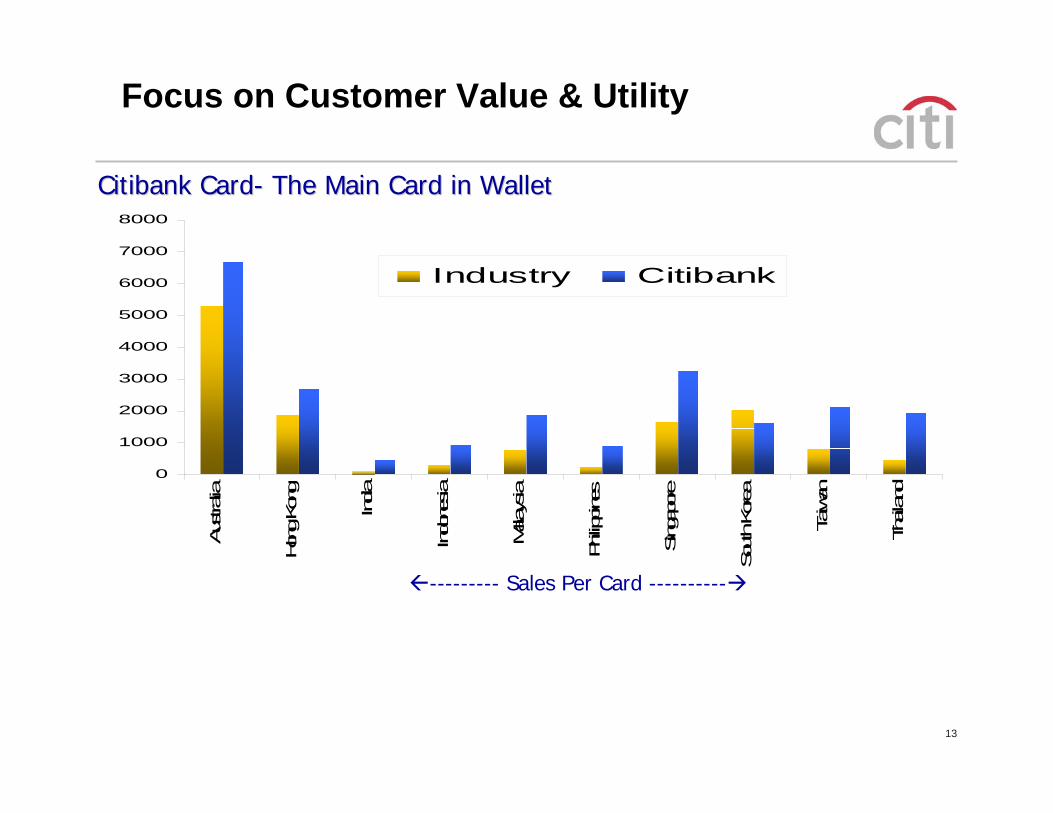
Industry Citibank
Focus on Customer Value & Utility
Citibank CardCitibank Card-- The Main Card in WalletThe Main Card in Wallet
--------- Sales Per Card ----------
Cards Business Dynamics
15
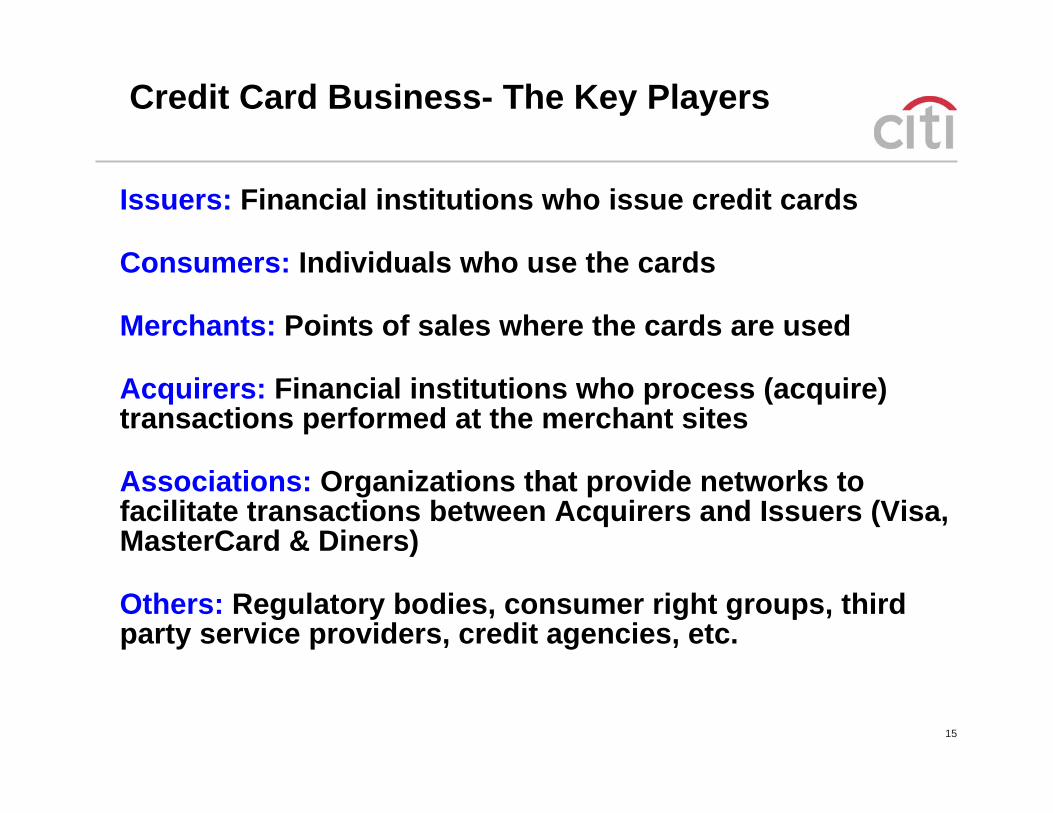
Credit Card Business- The Key Players
Issuers: Financial institutions who issue credit cards
Consumers: Individuals who use the cards
Merchants: Points of sales where the cards are used
Acquirers: Financial institutions who process (acquire) transactions performed at the merchant sites
Associations: Organizations that provide networks to facilitate transactions between Acquirers and Issuers (Visa, MasterCard & Diners)
Others: Regulatory bodies, consumer right groups, third party service providers, credit agencies, etc.
16
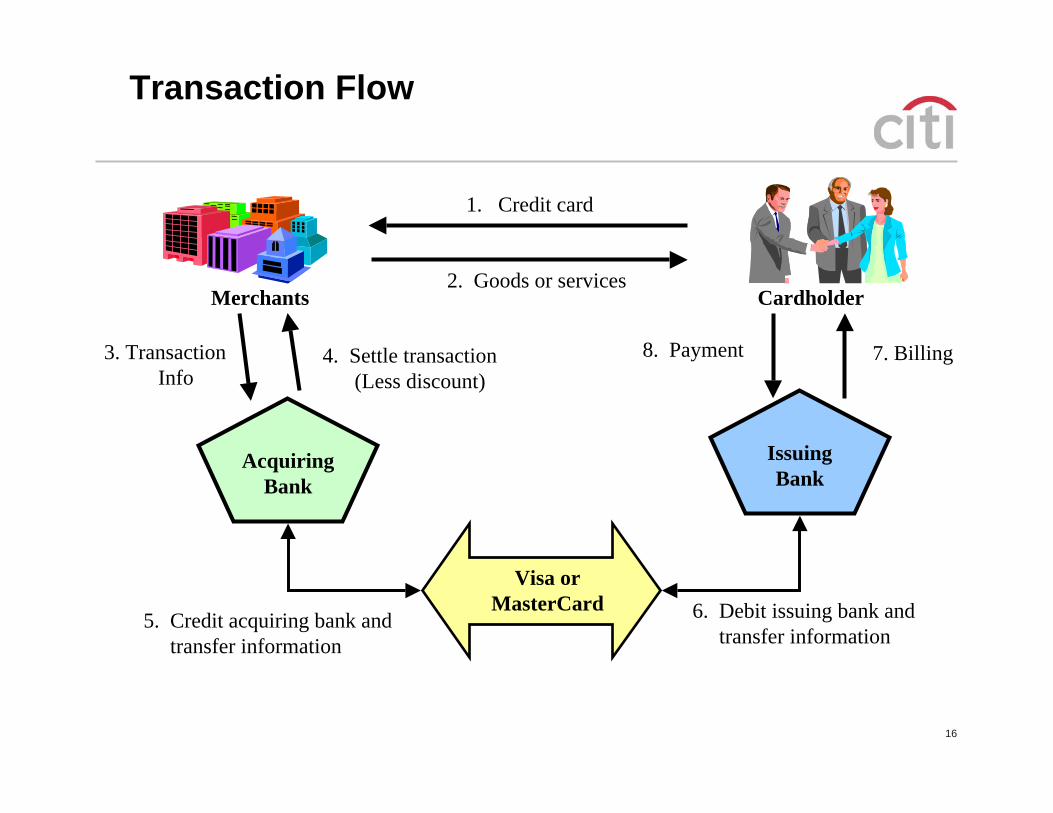
3. TransactionInfo
AcquiringBank
Visa or MasterCard
Merchants Cardholder
1. Credit card
2. Goods or services
8. Payment 7. Billing4. Settle transaction(Less discount)
5. Credit acquiring bank andtransfer information
IssuingBank
6. Debit issuing bank and transfer information
Transaction Flow
17
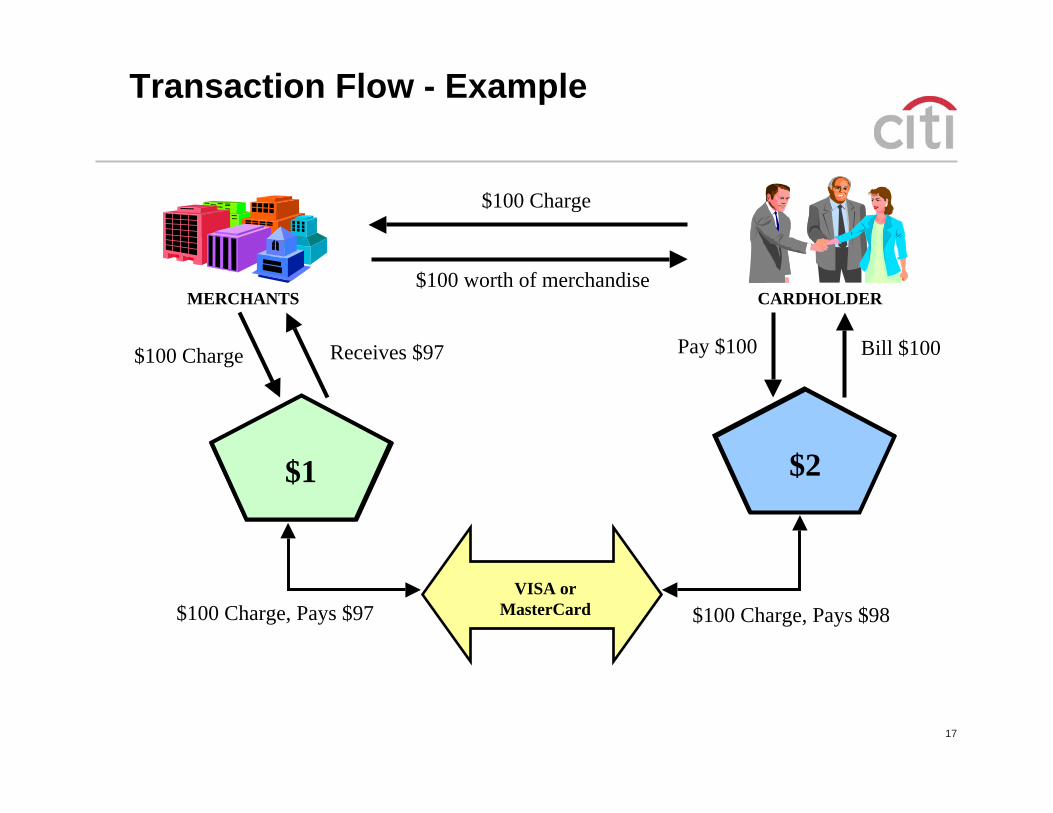
MERCHANTS CARDHOLDER
$100 Charge
$100 worth of merchandise
Pay $100 Bill $100Receives $97
$100 Charge, Pays $97 $100 Charge, Pays $98
$100 Charge
ACQUIRINGBANK
ISSUINGBANK
VISA orMasterCard
Transaction Flow - Example
$1 $2
18
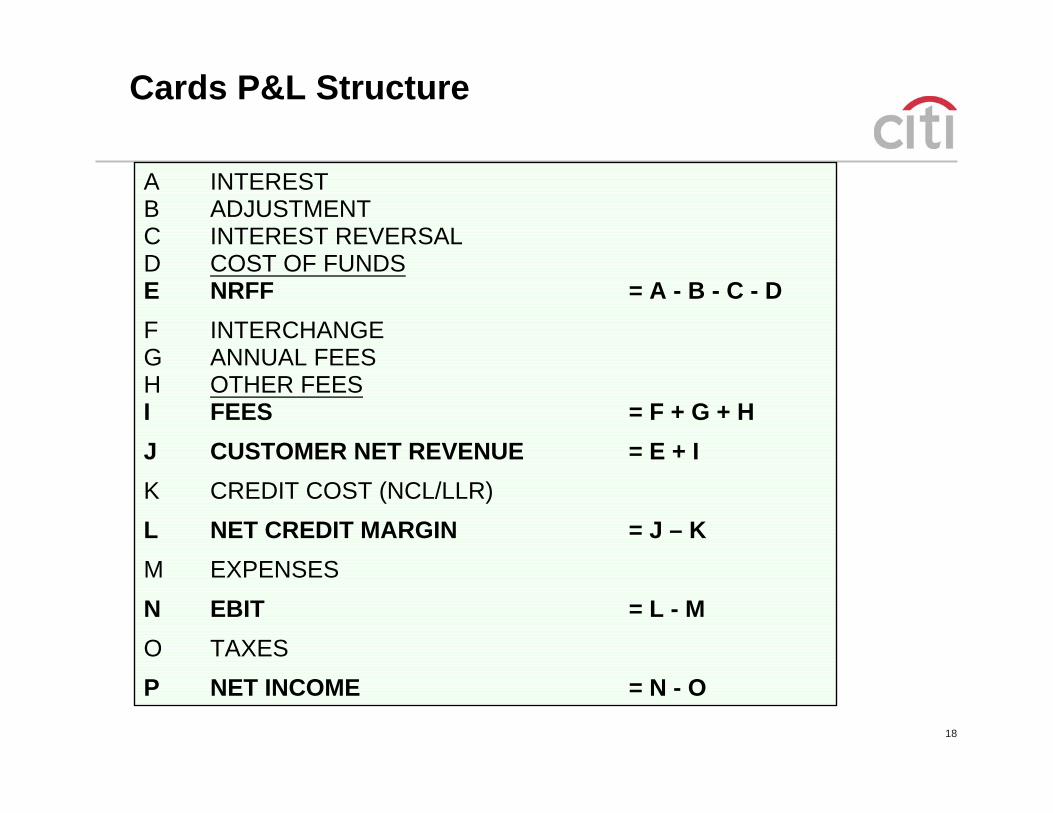
Cards P&L Structure
A INTERESTB ADJUSTMENTC INTEREST REVERSALD COST OF FUNDSE NRFF = A - B - C - DF INTERCHANGEG ANNUAL FEESH OTHER FEESI FEES = F + G + HJ CUSTOMER NET REVENUE = E + IK CREDIT COST (NCL/LLR)L NET CREDIT MARGIN = J – KM EXPENSESN EBIT = L - MO TAXESP NET INCOME = N - O
19
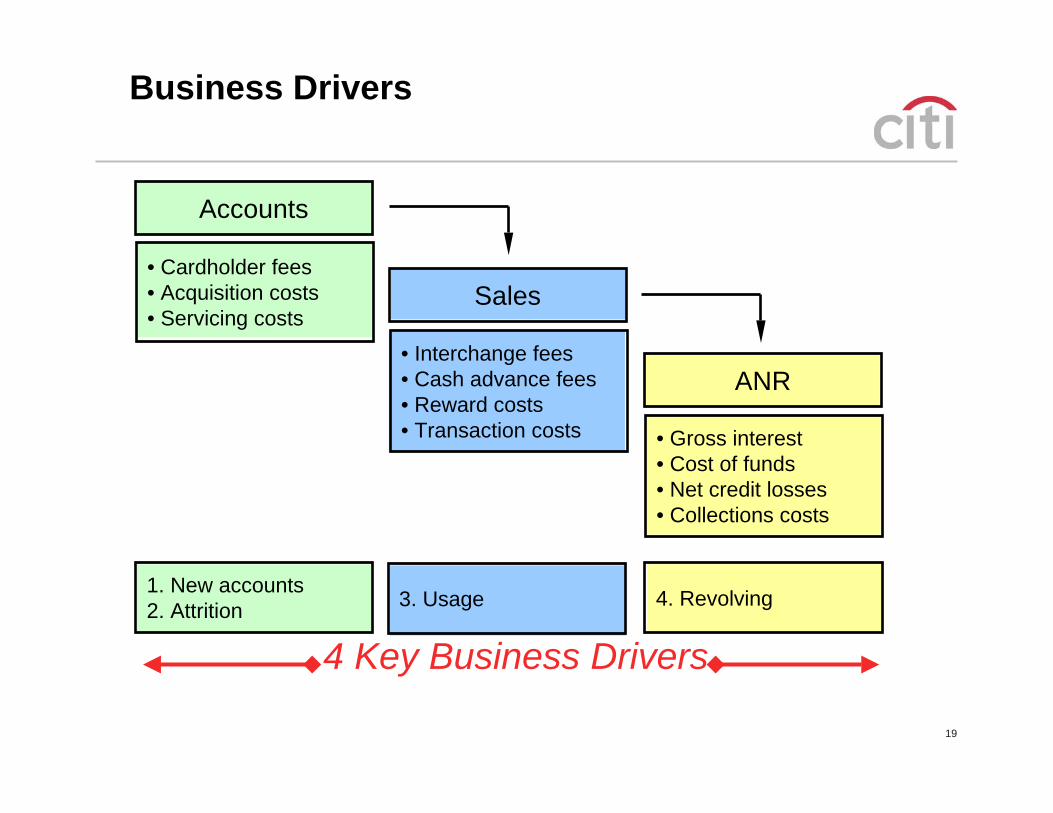
4. Revolving3. Usage1. New accounts2. Attrition
Business Drivers
Accounts
• Cardholder fees• Acquisition costs• Servicing costs
Sales
• Interchange fees• Cash advance fees• Reward costs• Transaction costs
ANR
• Gross interest• Cost of funds• Net credit losses• Collections costs
4 Key Business Drivers
20
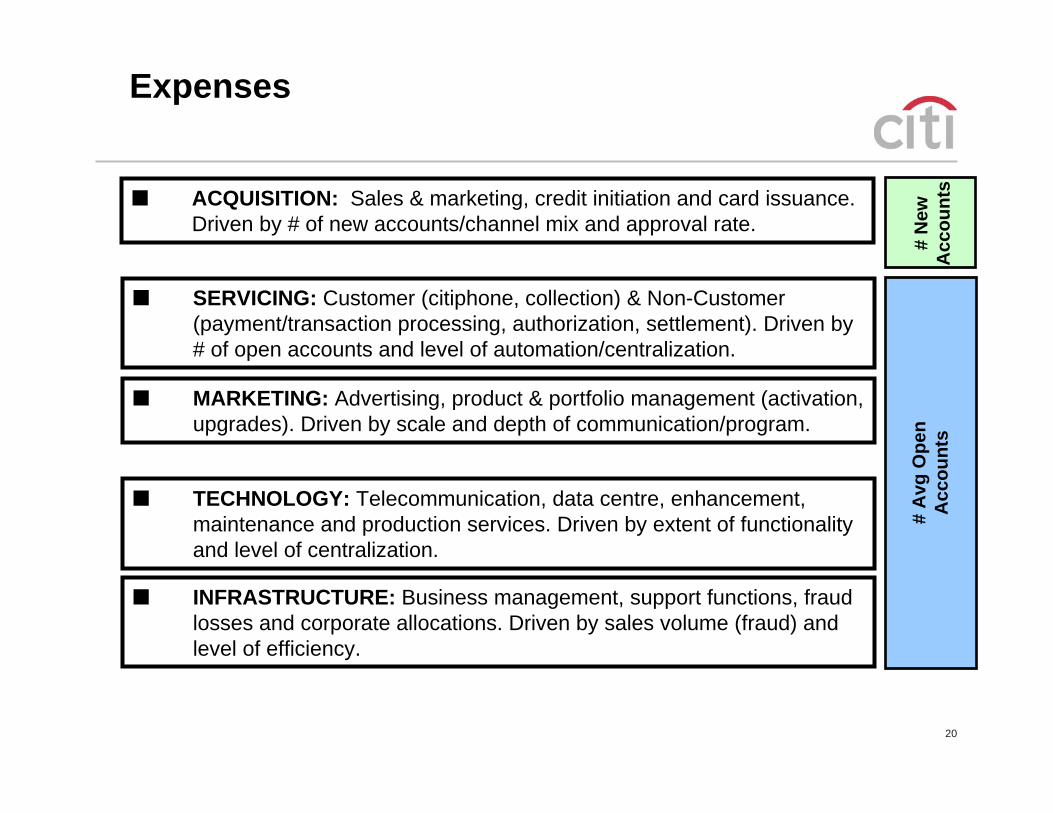
Expenses
ACQUISITION: Sales & marketing, credit initiation and card issuance. Driven by # of new accounts/channel mix and approval rate.
SERVICING: Customer (citiphone, collection) & Non-Customer (payment/transaction processing, authorization, settlement). Driven by # of open accounts and level of automation/centralization.
MARKETING: Advertising, product & portfolio management (activation, upgrades). Driven by scale and depth of communication/program.
TECHNOLOGY: Telecommunication, data centre, enhancement, maintenance and production services. Driven by extent of functionality and level of centralization.
INFRASTRUCTURE: Business management, support functions, fraud losses and corporate allocations. Driven by sales volume (fraud) and level of efficiency.
# N
ew
Acc
ount
s#
Avg
Ope
n A
ccou
nts
21
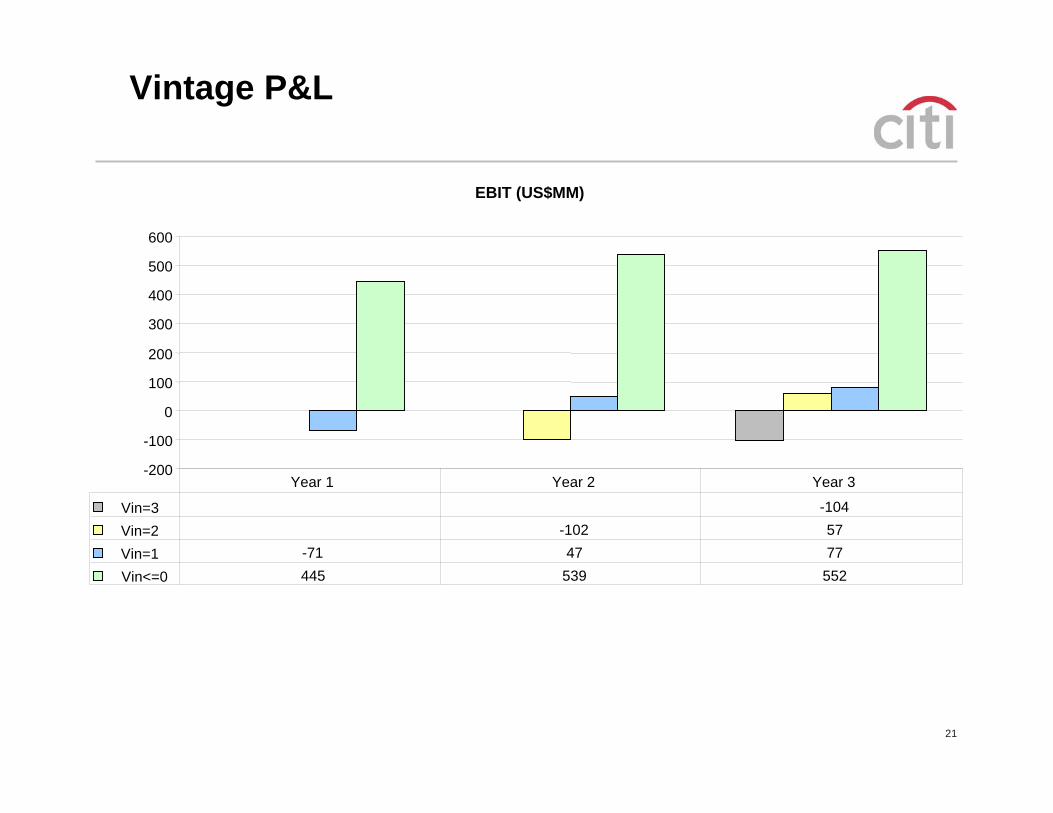
Vintage P&L
EBIT (US$MM)
-200
-100
0
100
200
300
400
500
600
Vin=3 -104Vin=2 -102 57Vin=1 -71 47 77Vin<=0 445 539 552
Year 1 Year 2 Year 3
22
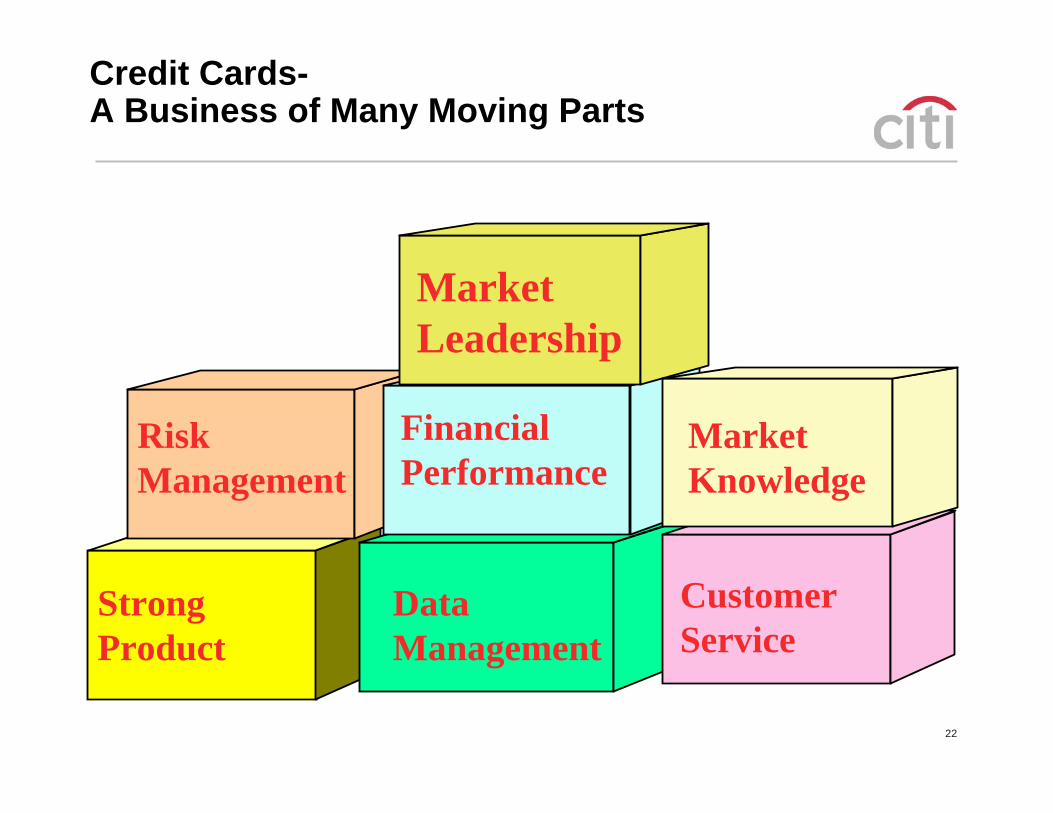
Market Leadership
StrongProduct
FinancialPerformance
MarketKnowledge
CustomerService
DataManagement
RiskManagement
Credit Cards-A Business of Many Moving Parts
23
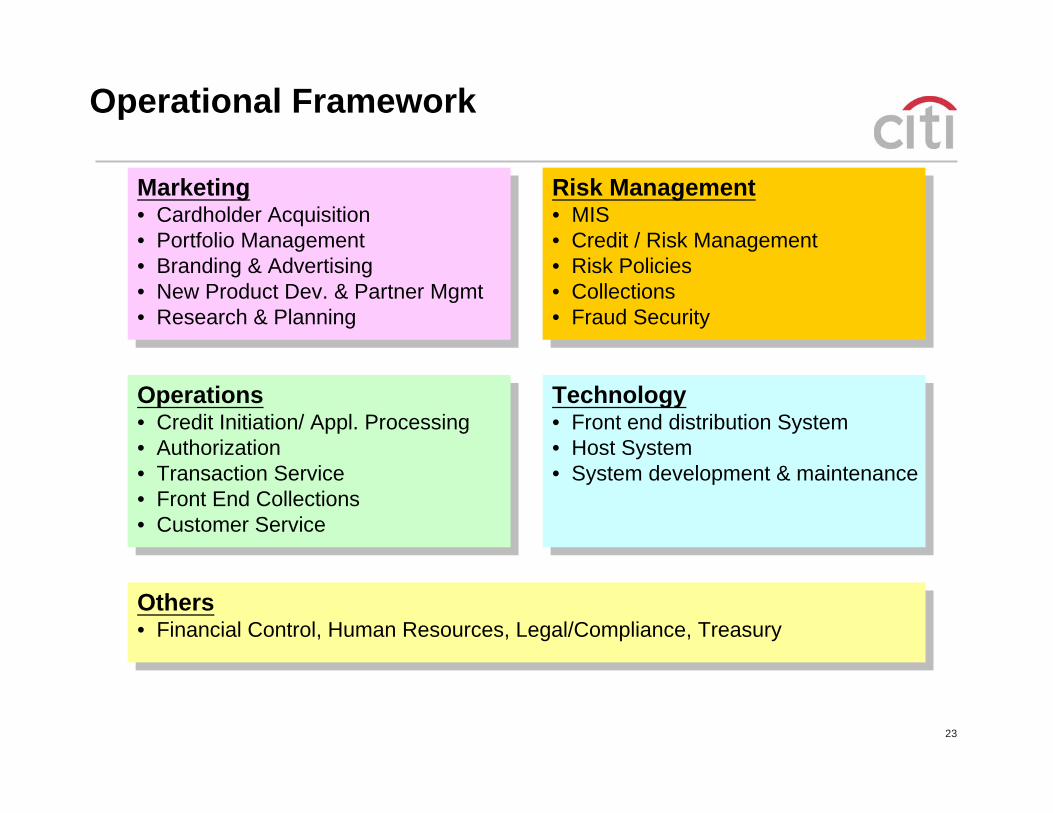
Risk Management• MIS• Credit / Risk Management• Risk Policies• Collections• Fraud Security
Risk Management• MIS• Credit / Risk Management• Risk Policies• Collections• Fraud Security
Marketing• Cardholder Acquisition• Portfolio Management• Branding & Advertising• New Product Dev. & Partner Mgmt• Research & Planning
Marketing• Cardholder Acquisition• Portfolio Management• Branding & Advertising• New Product Dev. & Partner Mgmt• Research & Planning
Others• Financial Control, Human Resources, Legal/Compliance, Treasury
Others• Financial Control, Human Resources, Legal/Compliance, Treasury
Technology• Front end distribution System• Host System• System development & maintenance
Technology• Front end distribution System• Host System• System development & maintenance
Operations• Credit Initiation/ Appl. Processing• Authorization• Transaction Service• Front End Collections• Customer Service
Operations• Credit Initiation/ Appl. Processing• Authorization• Transaction Service• Front End Collections• Customer Service
Operational Framework
24
Service- The Key Link with Customer
• Application Processing & Delivery Time
• Statement Rendition & Accuracy
• Phone Service Quality
• Reward Fulfillment PIR
• System Availability – AVR (Total)
• Emergency Card Replacement
25
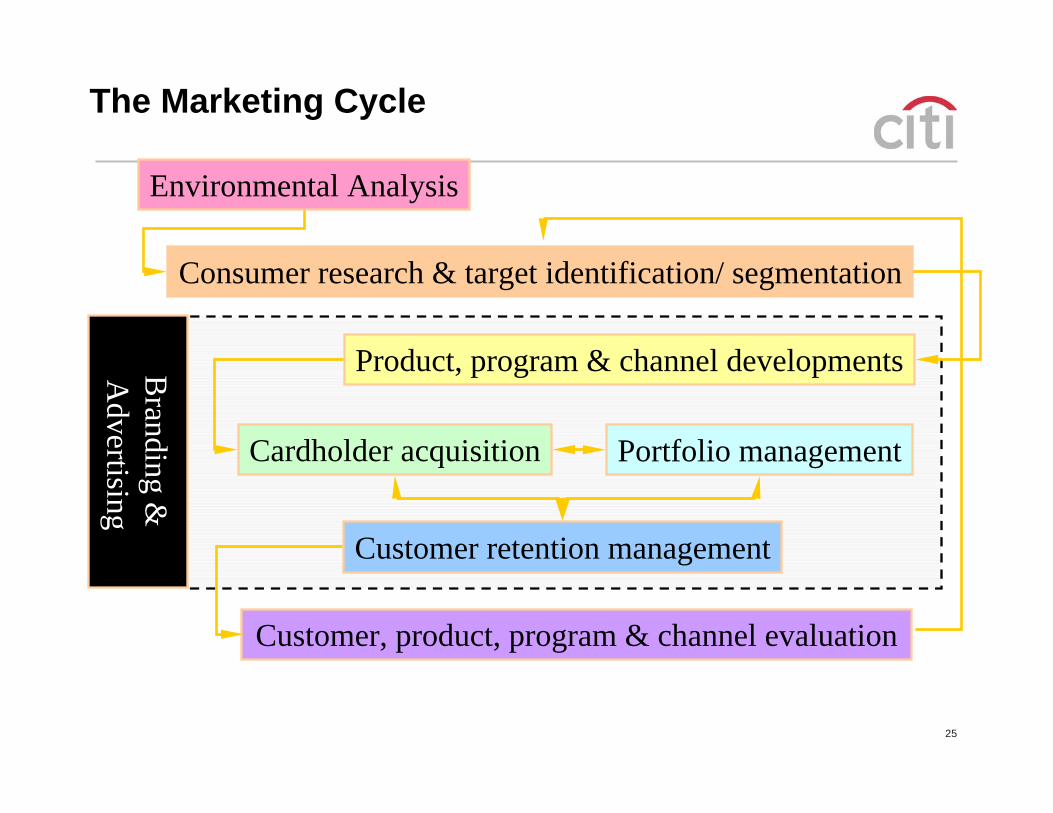
The Marketing Cycle
Environmental Analysis
Consumer research & target identification/ segmentation
Product, program & channel developments
Cardholder acquisition Portfolio management
Customer retention management
Customer, product, program & channel evaluation
Branding &
Advertising
26
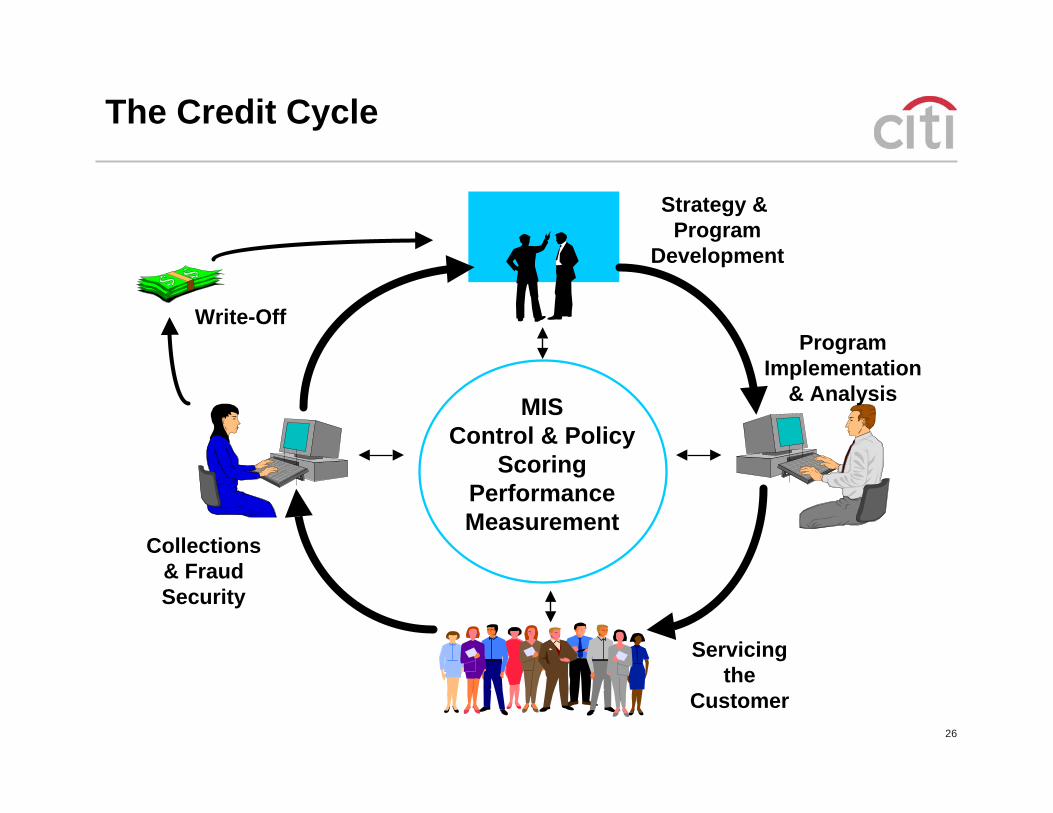
MISControl & Policy
ScoringPerformanceMeasurement
Strategy & Program
Development
ProgramImplementation
& Analysis
Servicingthe
Customer
Collections& FraudSecurity
Write-Off
The Credit Cycle
27
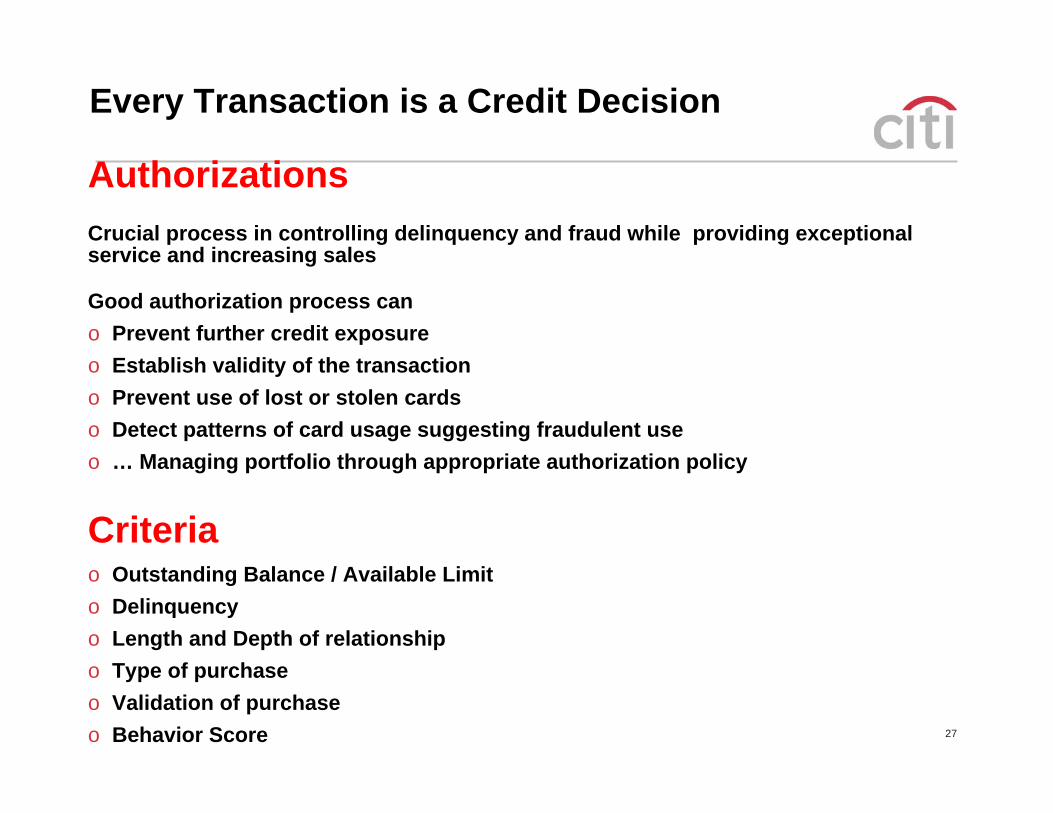
Every Transaction is a Credit Decision
AuthorizationsCrucial process in controlling delinquency and fraud while providing exceptional service and increasing sales
Good authorization process cano Prevent further credit exposureo Establish validity of the transactiono Prevent use of lost or stolen cardso Detect patterns of card usage suggesting fraudulent useo … Managing portfolio through appropriate authorization policy
Criteriao Outstanding Balance / Available Limito Delinquencyo Length and Depth of relationshipo Type of purchaseo Validation of purchaseo Behavior Score
28
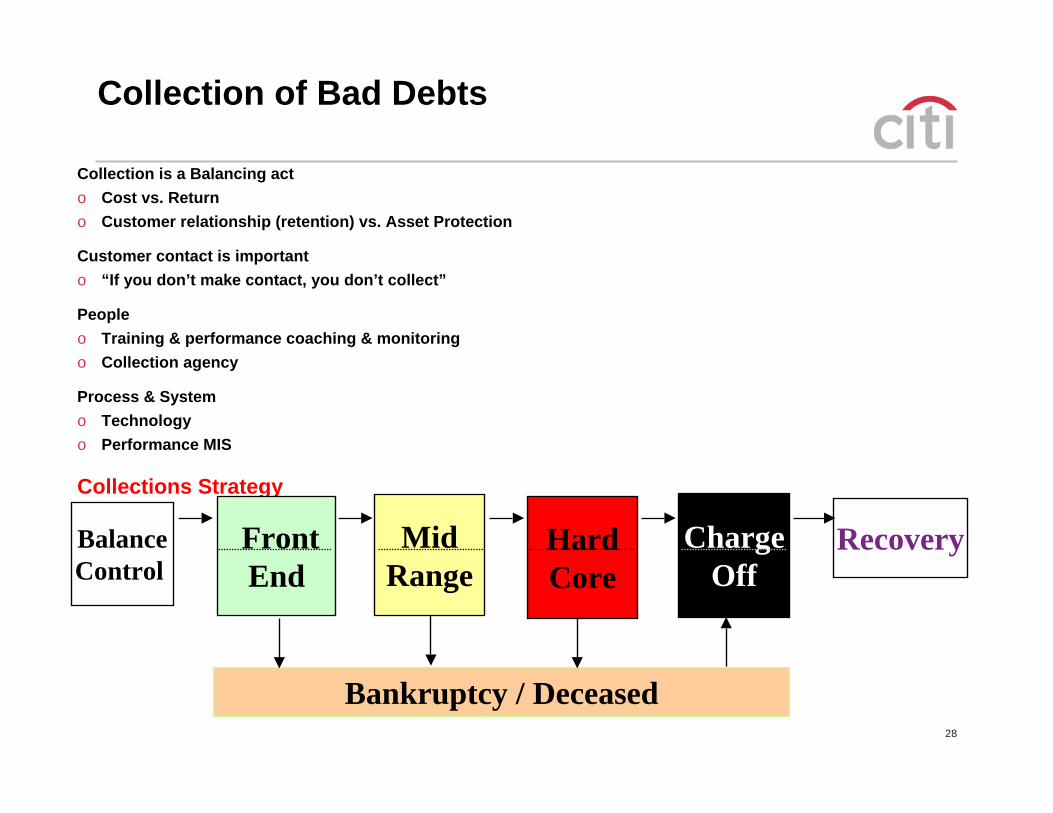
Collection of Bad Debts
Collection is a Balancing acto Cost vs. Returno Customer relationship (retention) vs. Asset Protection
Customer contact is importanto “If you don’t make contact, you don’t collect”
Peopleo Training & performance coaching & monitoringo Collection agency
Process & System o Technologyo Performance MIS
Collections Strategy
Balance Control
FrontEnd
MidRange
HardCore
ChargeOff
Recovery
Bankruptcy / Deceased
29
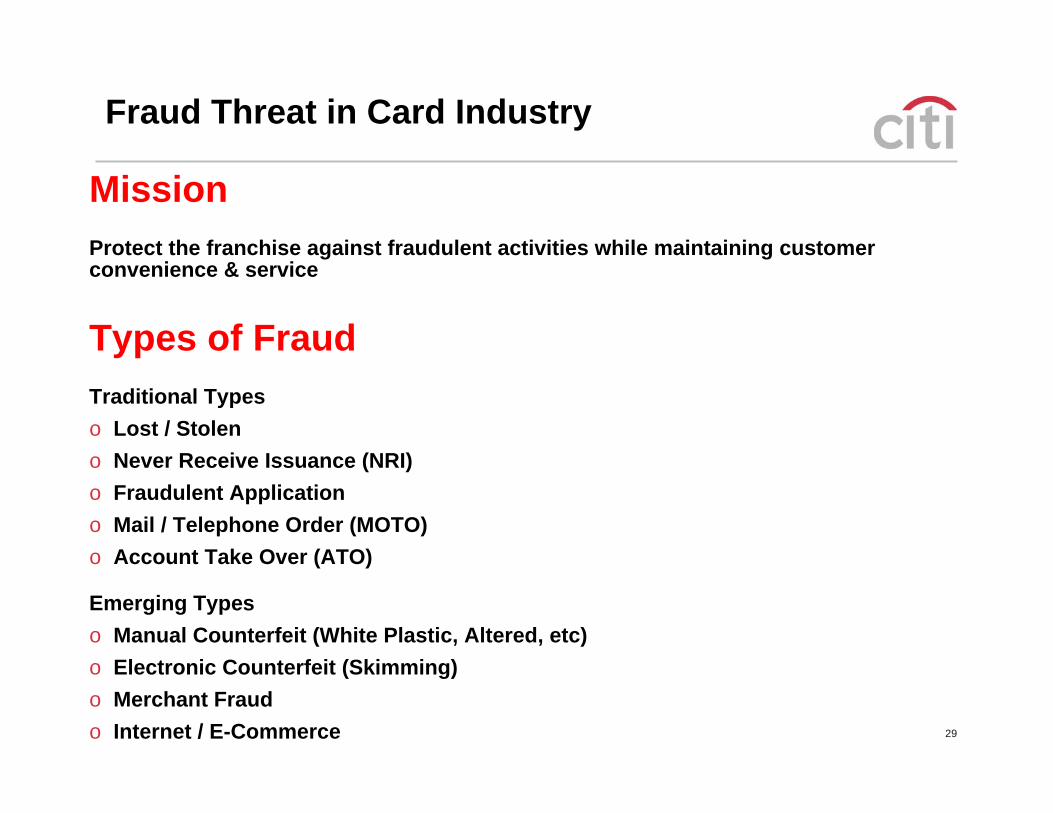
Fraud Threat in Card Industry
MissionProtect the franchise against fraudulent activities while maintaining customer convenience & service
Types of FraudTraditional Typeso Lost / Stoleno Never Receive Issuance (NRI)o Fraudulent Applicationo Mail / Telephone Order (MOTO) o Account Take Over (ATO)
Emerging Typeso Manual Counterfeit (White Plastic, Altered, etc)o Electronic Counterfeit (Skimming)o Merchant Fraudo Internet / E-Commerce
30
In Summary…
1. Cards is a ‘universal’ product with mass appeal
2. Industry continuous to grow- both due to economic growth and cash-to-card shift; specially in Asia
3. Effective marketing requires understanding different segment dynamics and support with right product/channel strategy
4. Cards is a complex business requiring significant local/ international infrastructure, and good understanding of risk management, analytics, and profitability dynamics.
5. It’s competitive, constantly changing and growing business
Challenging & fun business to work in…