Embed Size (px)
Citation preview

1
The Travelers Companies, Inc.
2014 Investor Day
June 6, 2014
Agenda
Travelers Medical Advantage Vinny Armentano - Senior Vice President, Business Insurance Claim
Select Accounts Marc Schmittlein – Executive Vice President, Select Accounts & Agribusiness
Personal Insurance Greg Toczydlowski – Executive Vice President & President, Personal Insurance
Jay Fishman – Chairman & Chief Executive Officer
Closing Remarks Jay Fishman – Chairman & Chief Executive Officer
Welcome
Break
Q & A
Lunch
Chairman & Chief Executive Officer
Jay Fishman
2014 Investor Day June 6, 2014
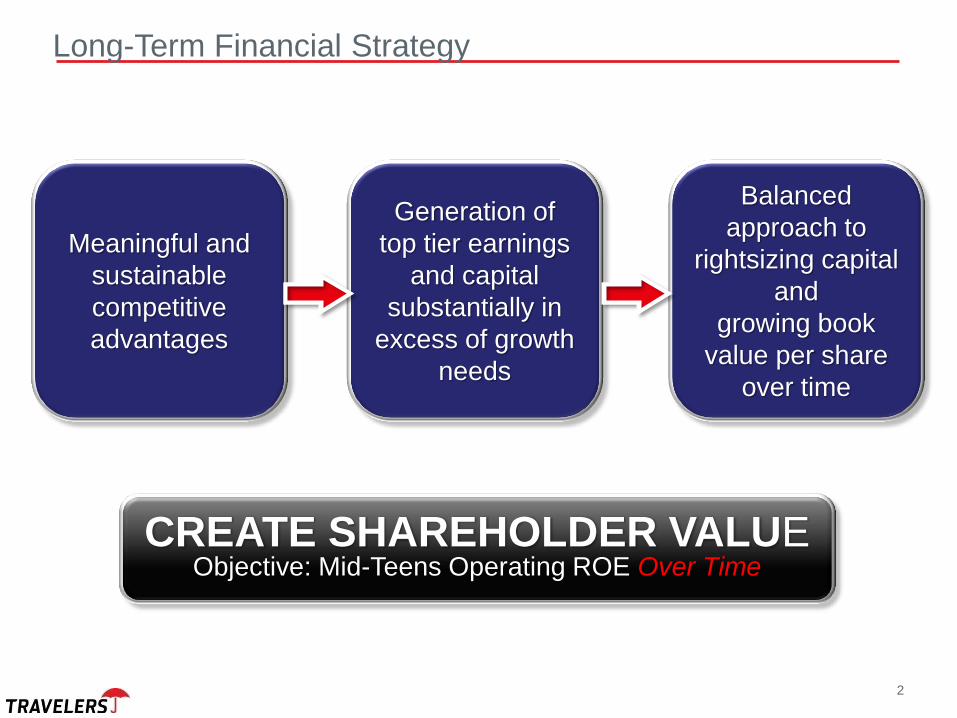
Long-Term Financial Strategy
Meaningful and
sustainable
competitive
advantages
Generation of
top tier earnings
and capital
substantially in
excess of growth
needs
Balanced
approach to
rightsizing capital
and
growing book
value per share
over time
CREATE SHAREHOLDER VALUE Objective: Mid-Teens Operating ROE Over Time
2
3
Overview
• Return focused company.
• Thoughtful capital allocators.
• Return excess capital to shareholders.
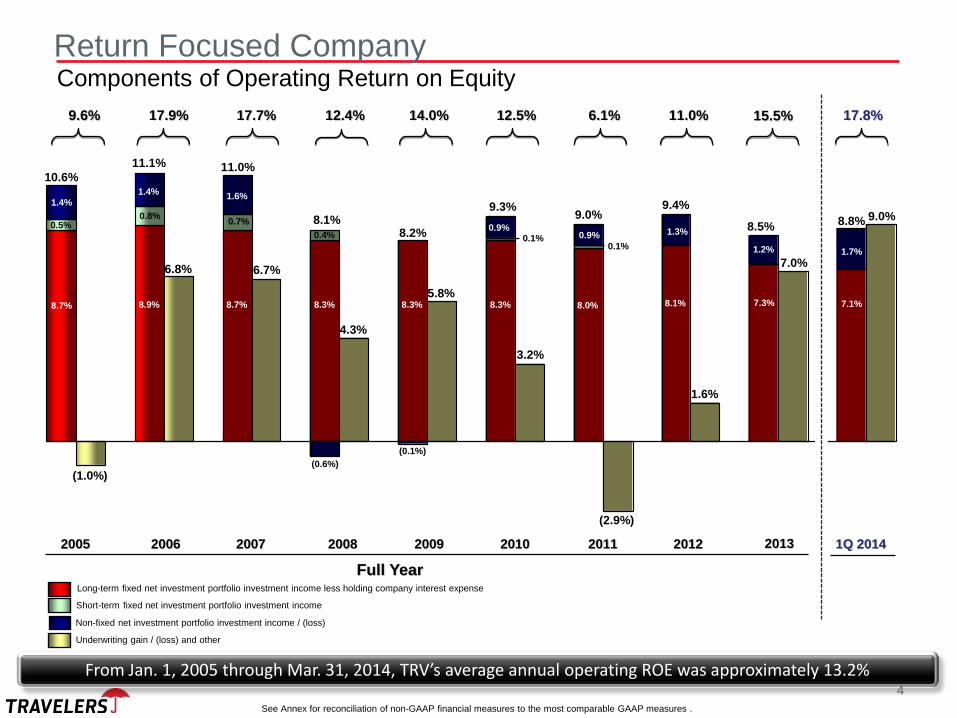
Long-term fixed net investment portfolio investment income less holding company interest expense
Non-fixed net investment portfolio investment income / (loss)
Underwriting gain / (loss) and other
Short-term fixed net investment portfolio investment income
2005 2006 2007 2008 2009 2010
Full Year
2011
17.9% 17.7% 12.4% 9.6% 14.0% 12.5% 6.1%
4.3%
8.9% 8.3% 8.7% 8.3% 8.7% 8.3% 8.0%
(1.0%)
6.8% 6.7%
5.8%
3.2%
(2.9%)
10.6%
11.1% 11.0%
8.1% 8.2%
9.3% 9.0%
(0.1%)
1.4%
1.4% 1.6%
0.9% 0.5%
0.8% 0.7%
0.4% 0.1% 0.1%
11.0%
2012
1.6%
8.1%
1.3%
9.4%
(0.6%)
0.9%
15.5%
8.5% 1.3%
7.3%
7.0%
From Jan. 1, 2005 through Mar. 31, 2014, TRV’s average annual operating ROE was approximately 13.2%
2013
17.8%
1Q 2014
8.8% 9.0%
1.7%
7.1%
Return Focused Company Components of Operating Return on Equity
See Annex for reconciliation of non-GAAP financial measures to the most comparable GAAP measures .
4
1.2%
0.9% 0.9%
TRV operating return on equity
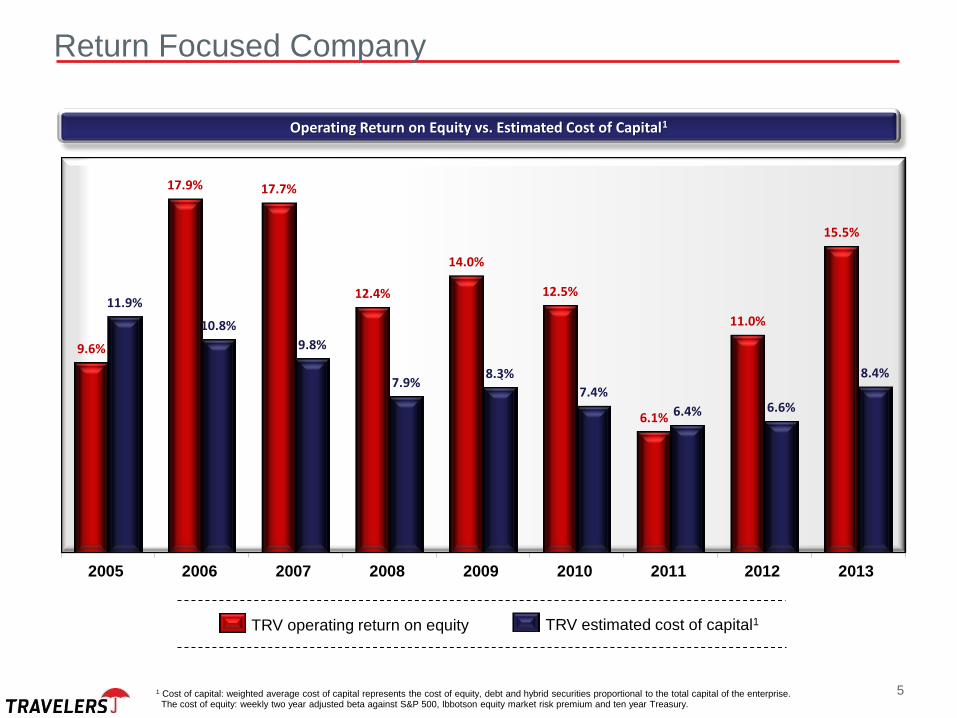
Return Focused Company
Operating Return on Equity vs. Estimated Cost of Capital1
9.6%
17.9% 17.7%
12.4%
14.0%
12.5%
6.1%
11.0%
15.5%
11.9%
10.8%
9.8%
7.9% 8.3%
7.4%
6.4% 6.6%
8.4%
2005 2006 2007 2008 2009 2010 2011 2012 2013
`
TRV estimated cost of capital1
1 Cost of capital: weighted average cost of capital represents the cost of equity, debt and hybrid securities proportional to the total capital of the enterprise. The cost of equity: weekly two year adjusted beta against S&P 500, Ibbotson equity market risk premium and ten year Treasury.
5
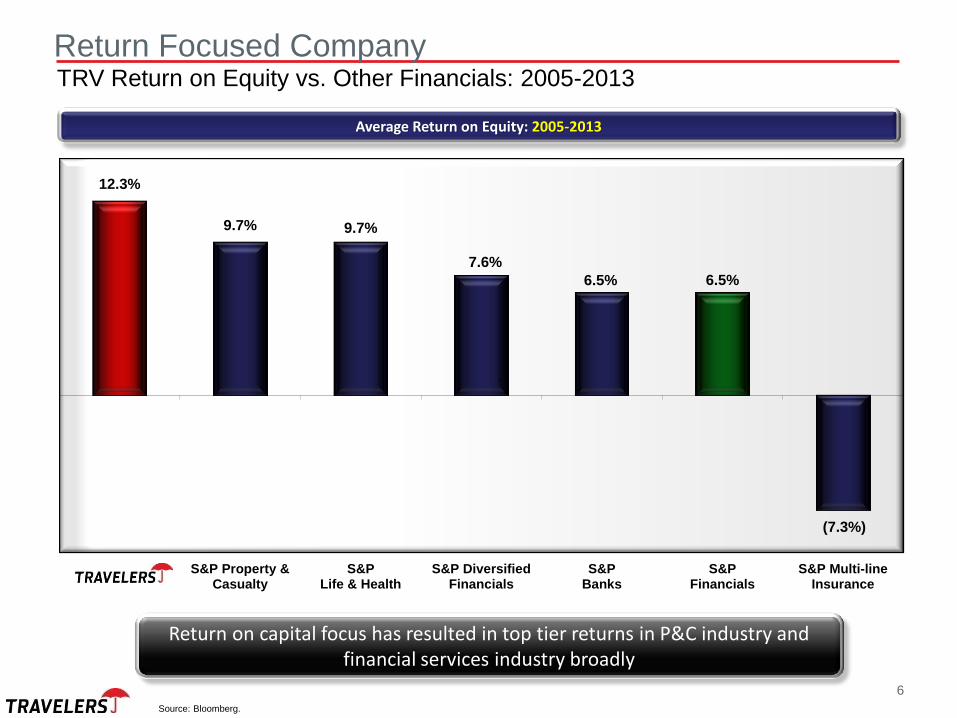
Return Focused Company
Return on capital focus has resulted in top tier returns in P&C industry and financial services industry broadly
Average Return on Equity: 2005-2013
12.3%
9.7% 9.7%
7.6%
6.5% 6.5%
(7.3%)
S&P Property &Casualty
S&PLife & Health
S&P DiversifiedFinancials
S&PBanks
S&PFinancials
S&P Multi-lineInsurance
`
TRV Return on Equity vs. Other Financials: 2005-2013
Source: Bloomberg.
6
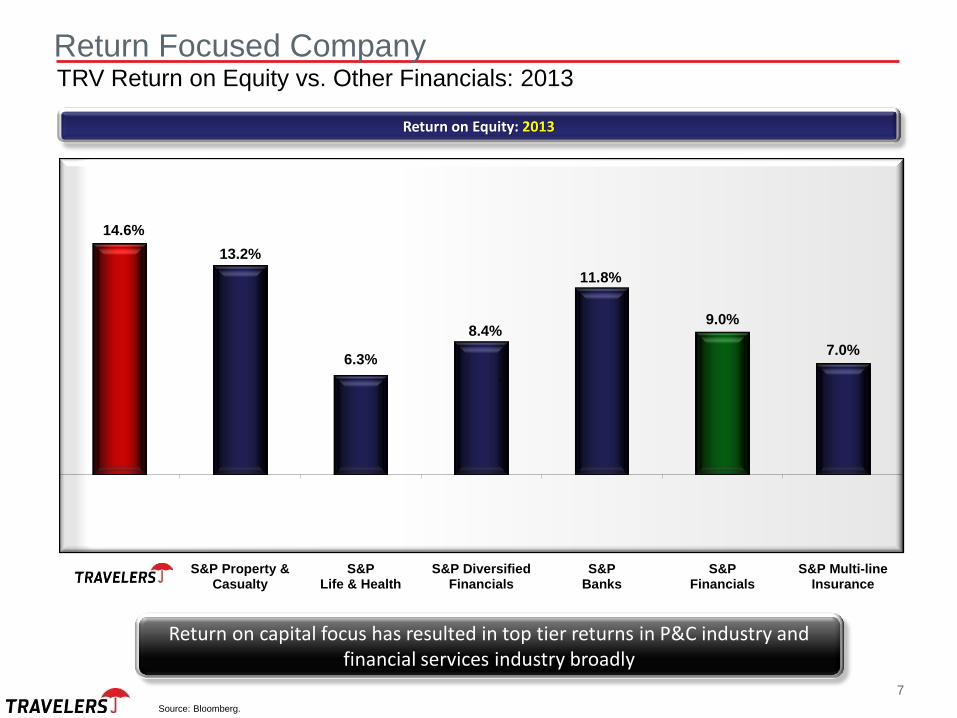
Return Focused Company
Return on capital focus has resulted in top tier returns in P&C industry and financial services industry broadly
Return on Equity: 2013
14.6%
13.2%
6.3%
8.4%
11.8%
9.0%
7.0%
TRV S&P Property &Casualty
S&PLife & Health
S&P DiversifiedFinancials
S&PBanks
S&PFinancials
S&P Multi-lineInsurance
`
TRV Return on Equity vs. Other Financials: 2013
Source: Bloomberg.
7
8
Overview
• Return focused company.
• Thoughtful capital allocators.
• Return excess capital to shareholders.
• Consistently invest in the development of competitive advantages.
• Strategic decisions and the resulting capital allocations are driven by
projected returns.
• Manage the business to where and when we believe competitive
advantages provide opportunities.
Thoughtful Capital Allocators
9
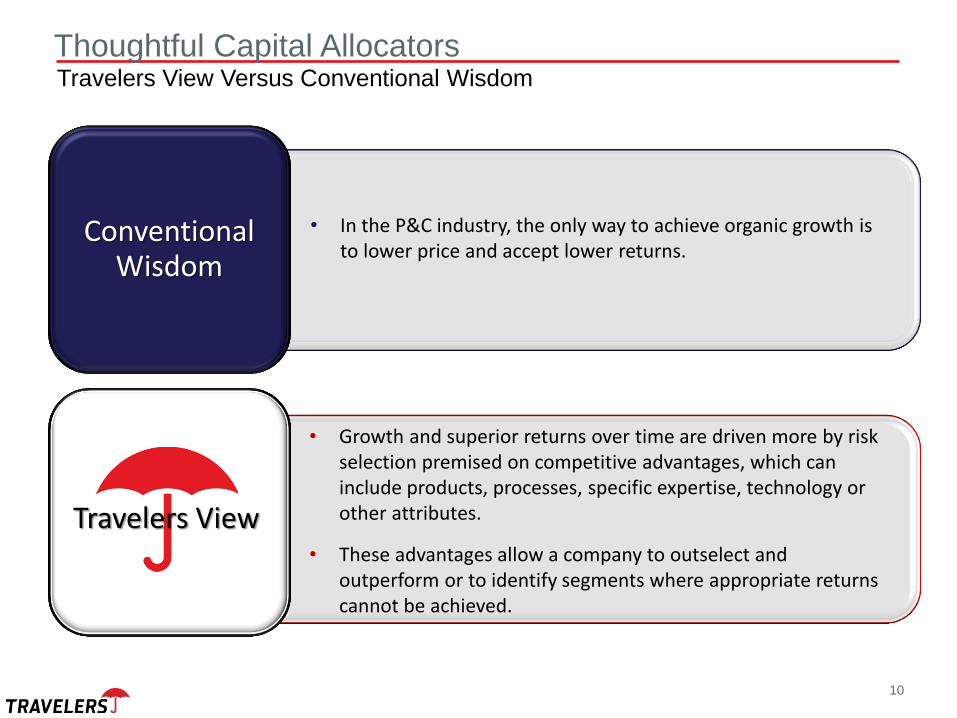
Conventional
Wisdom
Travelers View
• In the P&C industry, the only way to achieve organic growth is to lower price and accept lower returns.
• Growth and superior returns over time are driven more by risk selection premised on competitive advantages, which can include products, processes, specific expertise, technology or other attributes.
• These advantages allow a company to outselect and outperform or to identify segments where appropriate returns cannot be achieved.
Thoughtful Capital Allocators Travelers View Versus Conventional Wisdom
10
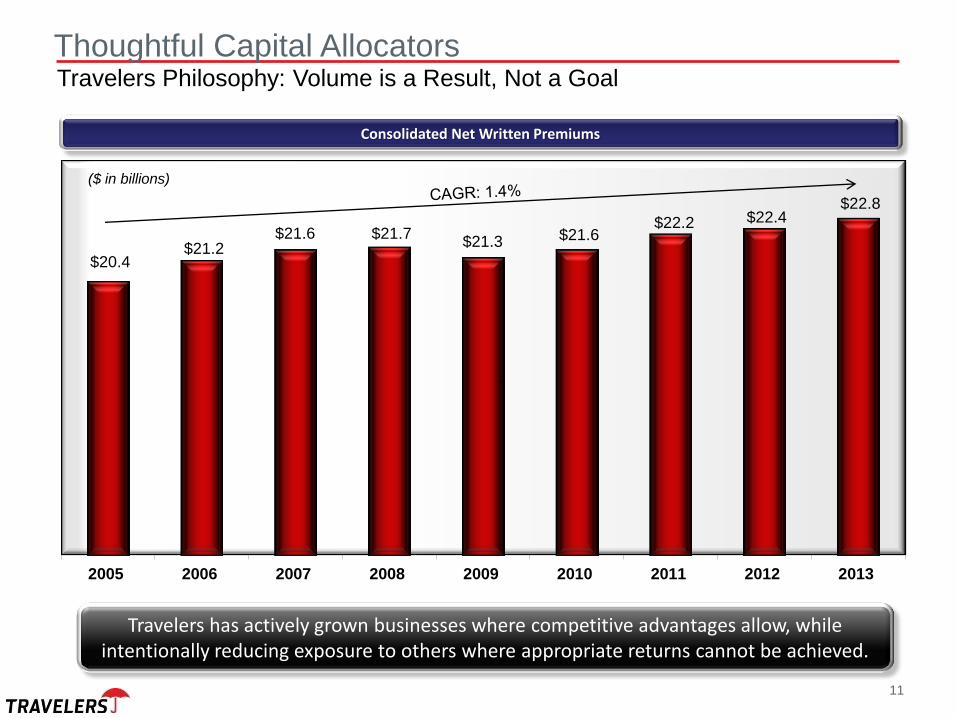
$20.4 $21.2
$21.6 $21.7 $21.3 $21.6
$22.2 $22.4 $22.8
2005 2006 2007 2008 2009 2010 2011 2012 2013
`
($ in billions)
Travelers has actively grown businesses where competitive advantages allow, while intentionally reducing exposure to others where appropriate returns cannot be achieved.
Consolidated Net Written Premiums
Thoughtful Capital Allocators Travelers Philosophy: Volume is a Result, Not a Goal
11
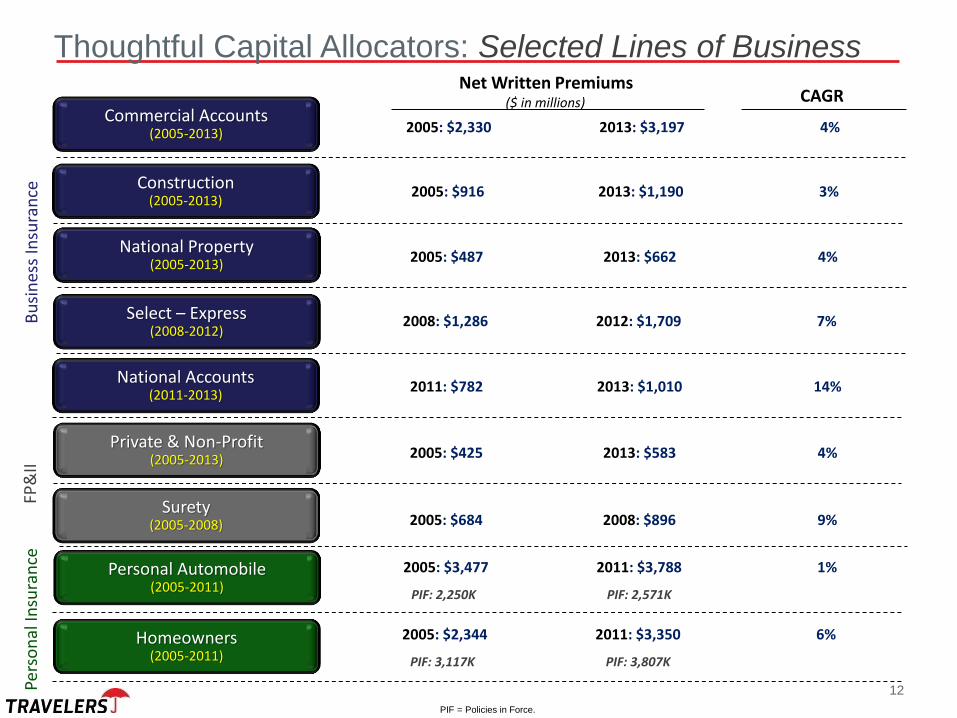
Thoughtful Capital Allocators: Selected Lines of Business
Commercial Accounts (2005-2013) 2005: $2,330 2013: $3,197 4%
Construction (2005-2013)
National Property (2005-2013)
Select – Express (2008-2012)
National Accounts (2011-2013)
Private & Non-Profit (2005-2013)
Surety (2005-2008)
Personal Automobile (2005-2011)
Homeowners (2005-2011)
Bu
sin
ess
Insu
ran
ce
Pers
on
al In
sura
nce
FP
&II
2005: $916 2013: $1,190 3%
2005: $487 2013: $662 4%
2008: $1,286 2012: $1,709 7%
2011: $782 2013: $1,010 14%
2005: $425 2013: $583 4%
2005: $684 2008: $896 9%
2005: $3,477 2011: $3,788 1%
PIF: 2,250K PIF: 2,571K
2005: $2,344 2011: $3,350 6%
PIF: 3,117K PIF: 3,807K
Net Written Premiums ($ in millions) CAGR
PIF = Policies in Force.
12
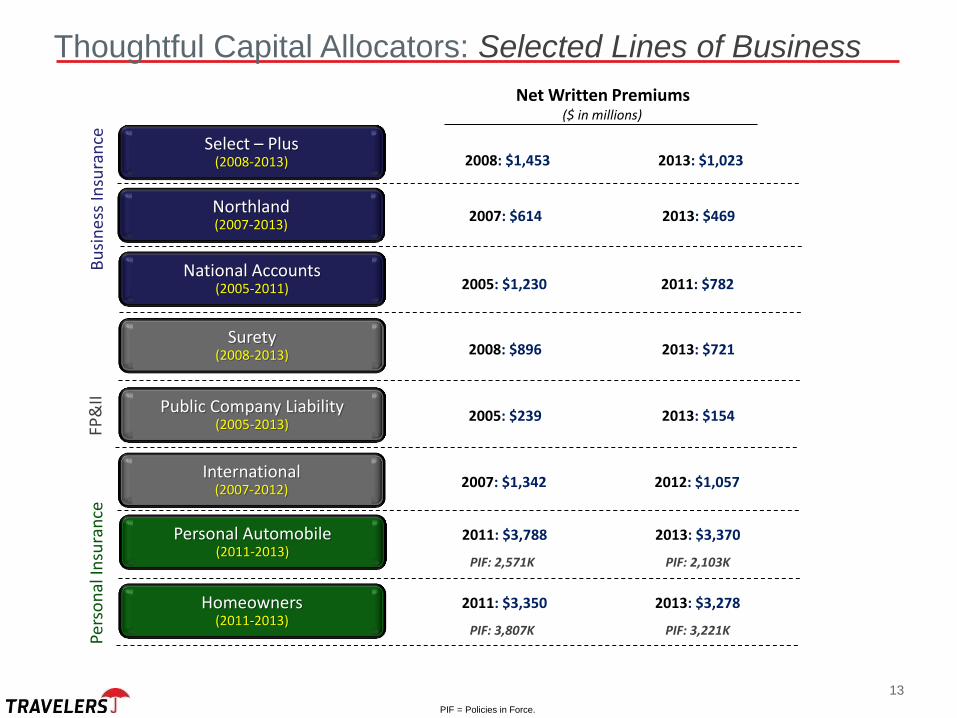
Select – Plus (2008-2013)
Northland (2007-2013)
National Accounts (2005-2011)
Surety (2008-2013)
Public Company Liability (2005-2013)
International (2007-2012)
Personal Automobile (2011-2013)
Homeowners (2011-2013)
Bu
sin
ess
Insu
ran
ce
Pers
on
al In
sura
nce
FP
&II
2008: $1,453 2013: $1,023
Thoughtful Capital Allocators: Selected Lines of Business
2007: $614 2013: $469
2005: $1,230 2011: $782
2008: $896 2013: $721
2005: $239 2013: $154
2007: $1,342 2012: $1,057
2011: $3,788 2013: $3,370
PIF: 2,571K PIF: 2,103K
2011: $3,350 2013: $3,278
PIF: 3,807K PIF: 3,221K
PIF = Policies in Force.
Net Written Premiums ($ in millions)
13
14
Overview
• Return focused company.
• Thoughtful capital allocators.
• Return excess capital to shareholders.

$622
$1,817
$3,685
$2,834
$3,990
$5,670
$3,569
$2,150
$3,134
$827
2005 2006 2007 2008 2009 2010 2011 2012 2013 1Q 2014
`
Return Excess Capital to Shareholders
Share Repurchases1 and dividends
Since the initial share repurchase authorization granted by the Board in 2Q’06, TRV has repurchased 405.0 million shares2 or 58% of the then outstanding number at a total cost of $22.5 billion
1 Represents stock repurchased under Board of Directors authorization.
2 Year-to-date through May 31, 2014.
3% 6% 10% 8% 15% 22% 15% 9% 12% 3%
Share Repurchases and Dividends as a Percentage of Market Capitalization
($ in millions)
2nd Quarter to Date
Share Repurchase1
(as of May 31, 2014)
$587 million
15
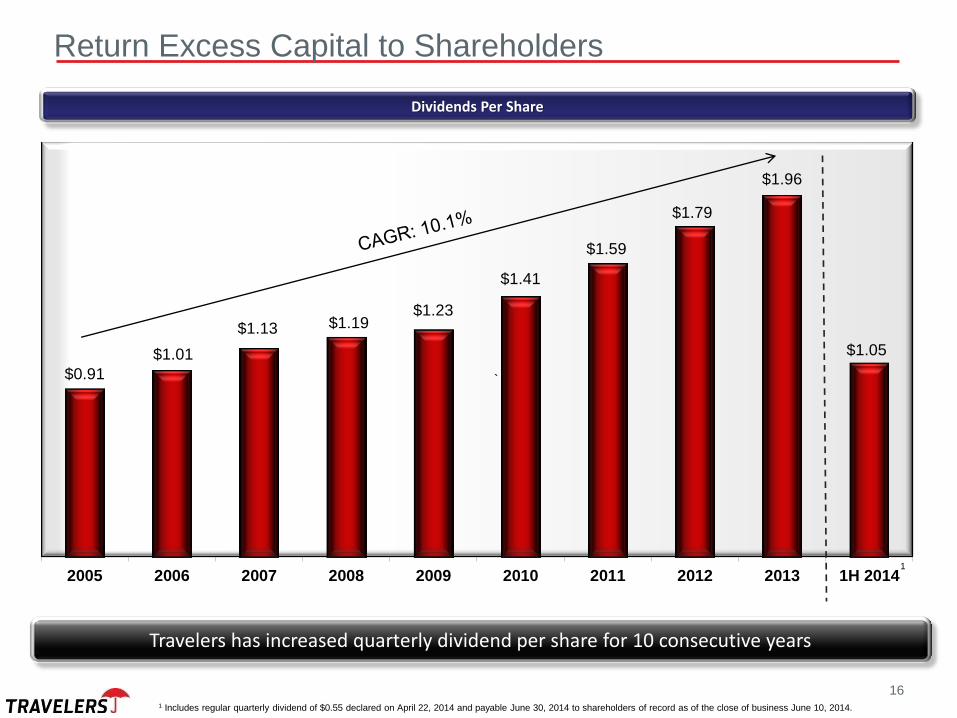
Return Excess Capital to Shareholders
Dividends Per Share
Travelers has increased quarterly dividend per share for 10 consecutive years
$0.91
$1.01
$1.13 $1.19 $1.23
$1.41
$1.59
$1.79
$1.96
$1.05
2005 2006 2007 2008 2009 2010 2011 2012 2013 1H 2014
`
1
1 Includes regular quarterly dividend of $0.55 declared on April 22, 2014 and payable June 30, 2014 to shareholders of record as of the close of business June 10, 2014.
16
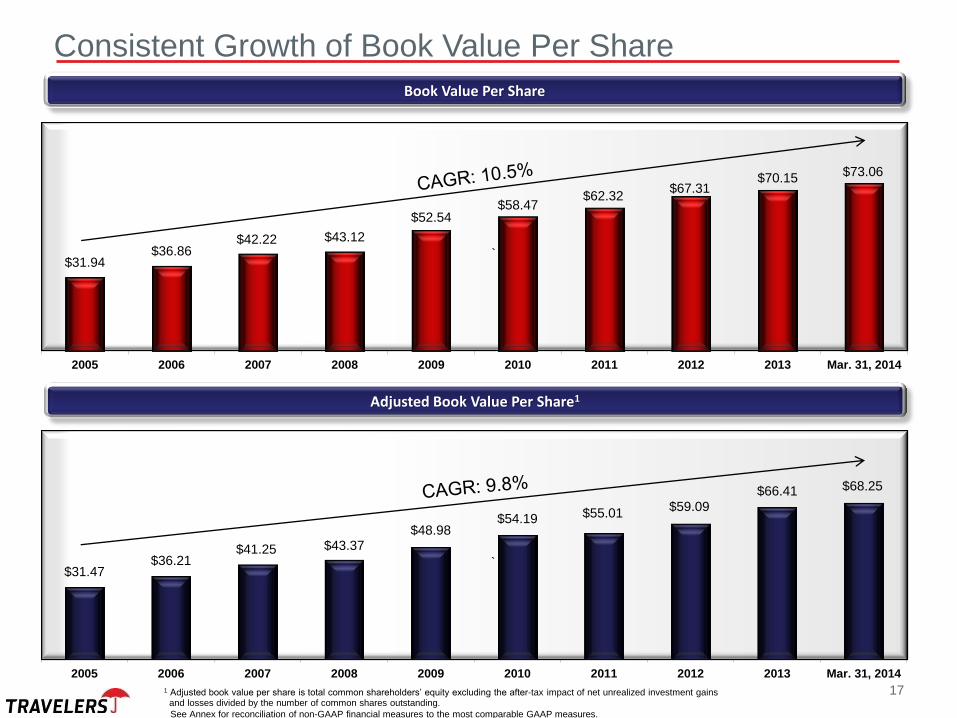
Consistent Growth of Book Value Per Share
Book Value Per Share
Adjusted Book Value Per Share1
$31.94 $36.86
$42.22 $43.12
$52.54 $58.47
$62.32 $67.31
$70.15 $73.06
2005 2006 2007 2008 2009 2010 2011 2012 2013 Mar. 31, 2014
`
$31.47 $36.21
$41.25 $43.37 $48.98
$54.19 $55.01 $59.09
$66.41 $68.25
2005 2006 2007 2008 2009 2010 2011 2012 2013 Mar. 31, 2014
`
1 Adjusted book value per share is total common shareholders’ equity excluding the after-tax impact of net unrealized investment gains and losses divided by the number of common shares outstanding. See Annex for reconciliation of non-GAAP financial measures to the most comparable GAAP measures.
17

Agenda
Travelers Medical Advantage Vinny Armentano - Senior Vice President, Business Insurance Claim
Select Accounts Marc Schmittlein – Executive Vice President, Select Accounts & Agribusiness
Personal Insurance Greg Toczydlowski – Executive Vice President & President, Personal Insurance
18
• Legacy of innovation (TravComp, Predictive Modeling, Nurse Triage Patent, and Concierge Claim Nurse).
• Decades of experience as a premier national accounts servicing carrier in workers’ compensation.
• Differentiating expertise in risk management, medical management and return to work supported by 3,700 Claim & Risk Control professionals.
• Best in class claim practices driven by medical management interaction with claim handling.
• Forward thinking: significant planning related to competing in the changing medical environment.
• Business customers are highly motivated to mitigate risk and manage losses effectively and value our expertise.
Agenda: Travelers Medical Advantage
19
• Market leading position in small commercial with history of innovation and investment.
• Clear understanding of the factors for success in the segment, including product breadth of Travelers property casualty franchise.
• Differentiated technology at the agents’ desktop critical for success.
• Analytical skill to optimize performance.
Agenda: Select Accounts
20
• Premier company within independent agent channel.
• Full account solution provider with industry leading property results and strong position in the preferred auto market.
• Analytical skill to quickly identify challenges and opportunities.
• Commitment to competing in a changing environment.
• Update on Quantum Auto 2.0.
Agenda: Personal Insurance
21

Additional Information Additional Information
The Travelers Companies, Inc.

Senior Vice President, Business Insurance Claim
25
Vinny Armentano
2014 Investor Day June 6, 2014
2
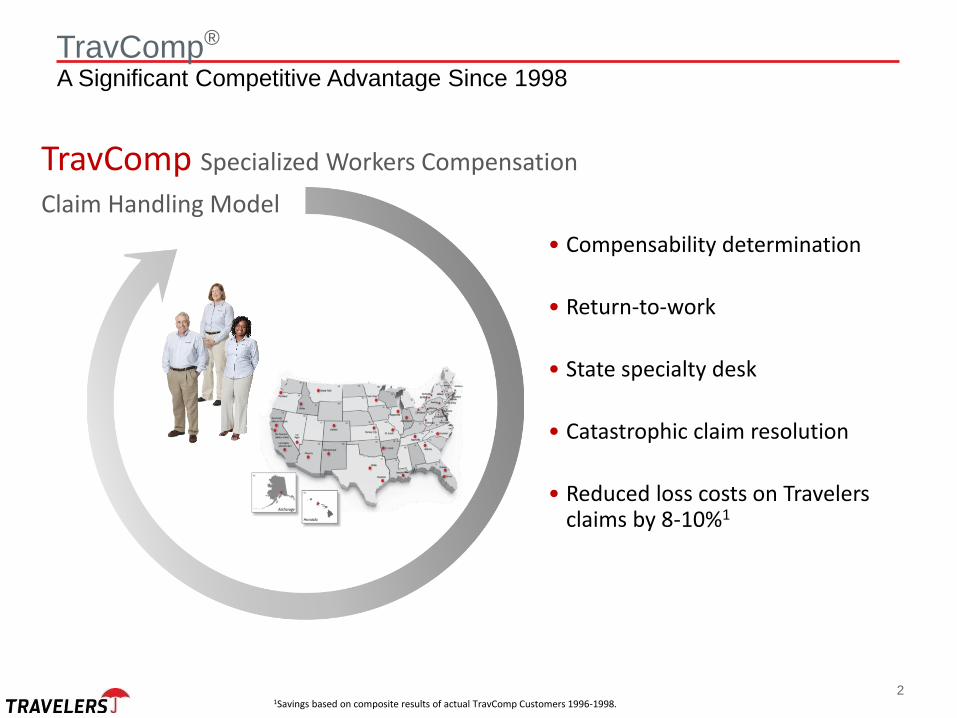
TravComp Specialized Workers Compensation
Claim Handling Model
• Compensability determination
• Return-to-work
• State specialty desk
• Catastrophic claim resolution
• Reduced loss costs on Travelers claims by 8-10%1
®
1Savings based on composite results of actual TravComp Customers 1996-1998.
TravComp A Significant Competitive Advantage Since 1998
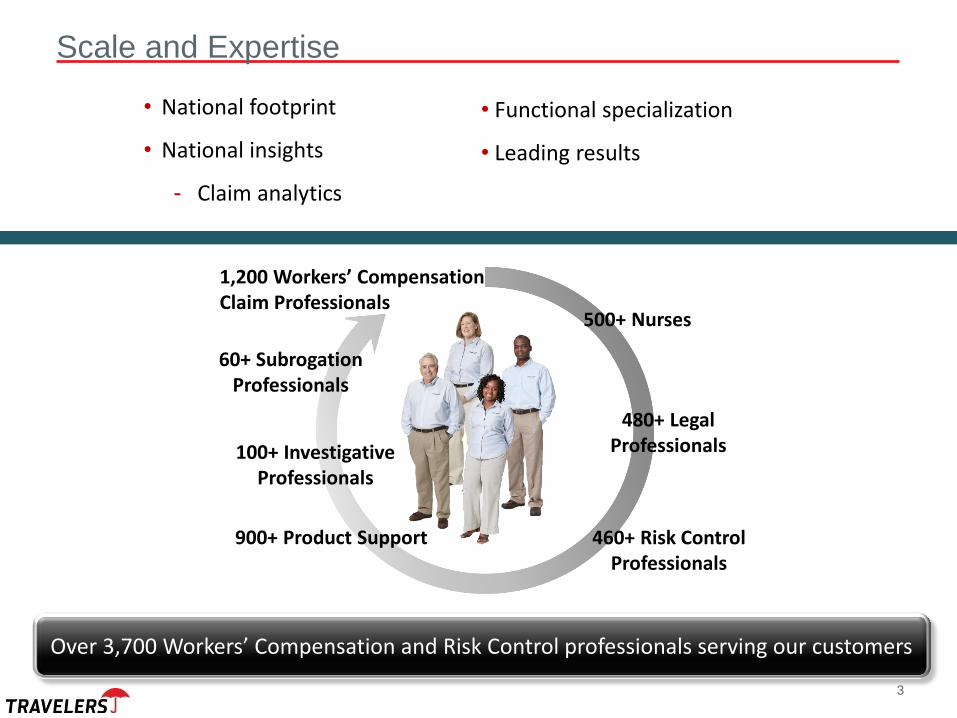
500+ Nurses
480+ Legal Professionals
60+ Subrogation Professionals
100+ Investigative Professionals
• National footprint
• National insights
- Claim analytics
• Functional specialization
• Leading results
460+ Risk Control Professionals
3
Scale and Expertise
1,200 Workers’ Compensation Claim Professionals
900+ Product Support
Over 3,700 Workers’ Compensation and Risk Control professionals serving our customers
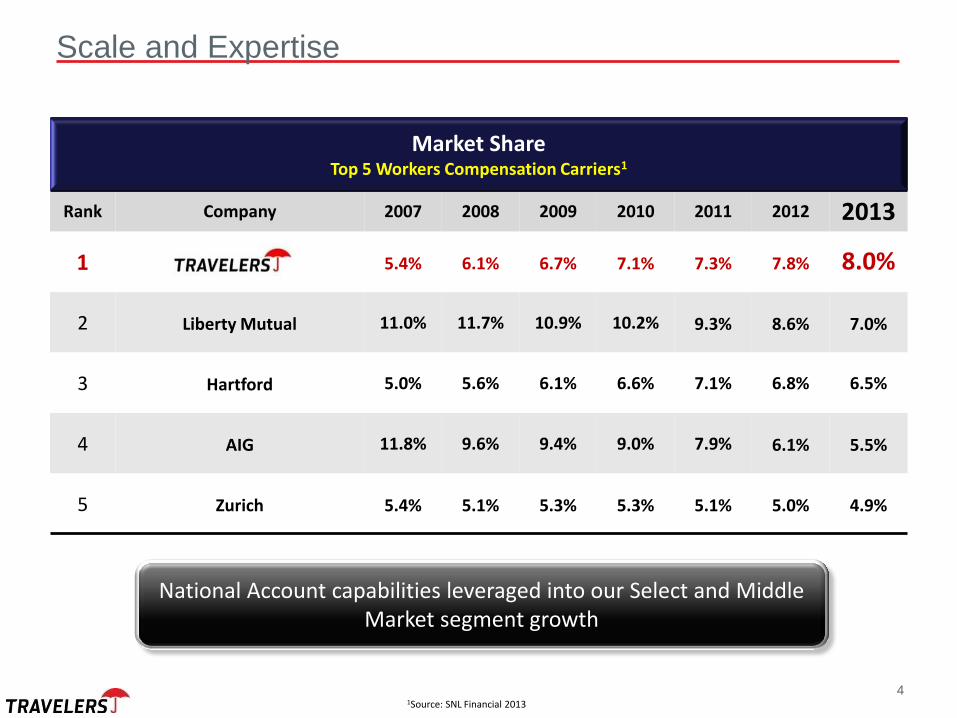
Market Share Top 5 Workers Compensation Carriers1
Rank Company 2007 2008 2009 2010 2011 2012 2013
1 5.4% 6.1% 6.7% 7.1% 7.3% 7.8% 8.0%
2 Liberty Mutual 11.0% 11.7% 10.9% 10.2% 9.3% 8.6% 7.0%
3 Hartford 5.0% 5.6% 6.1% 6.6% 7.1% 6.8% 6.5%
4 AIG 11.8% 9.6% 9.4% 9.0% 7.9% 6.1% 5.5%
5 Zurich 5.4% 5.1% 5.3% 5.3% 5.1% 5.0% 4.9%
1Source: SNL Financial 2013
National Account capabilities leveraged into our Select and Middle Market segment growth
4
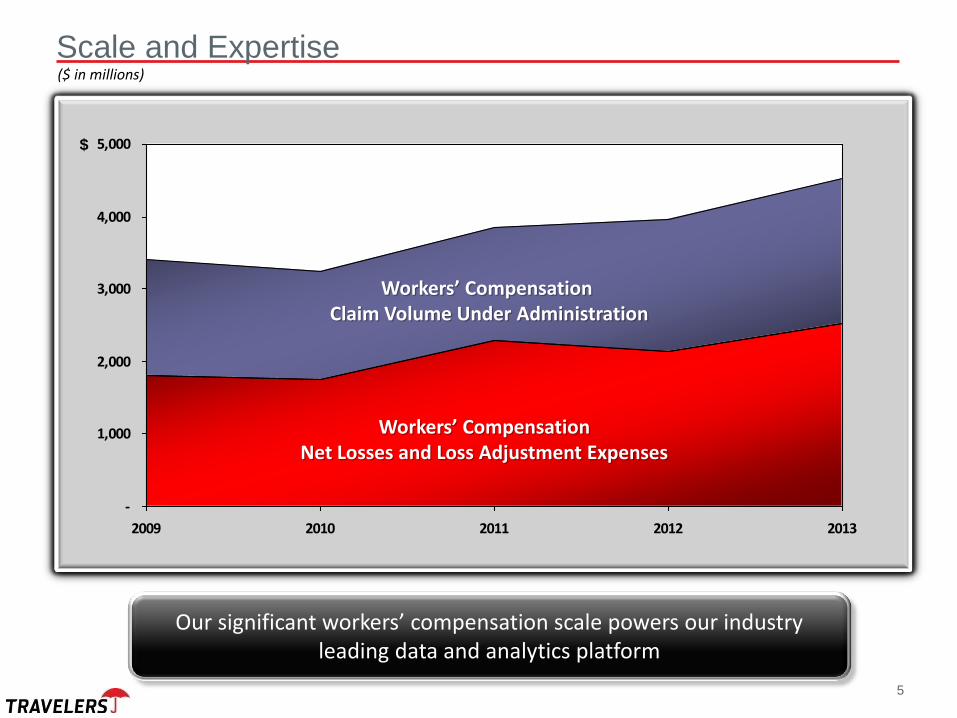
Scale and Expertise
5
($ in millions)
-
1,000
2,000
3,000
4,000
5,000
2009 2010 2011 2012 2013
$
Workers’ Compensation Net Losses and Loss Adjustment Expenses
Our significant workers’ compensation scale powers our industry leading data and analytics platform
Scale and Expertise
-
1,000
2,000
3,000
4,000
5,000
2009 2010 2011 2012 2013
$
Workers’ Compensation Claim Volume Under Administration
Workers’ Compensation Net Losses and Loss Adjustment Expenses
6
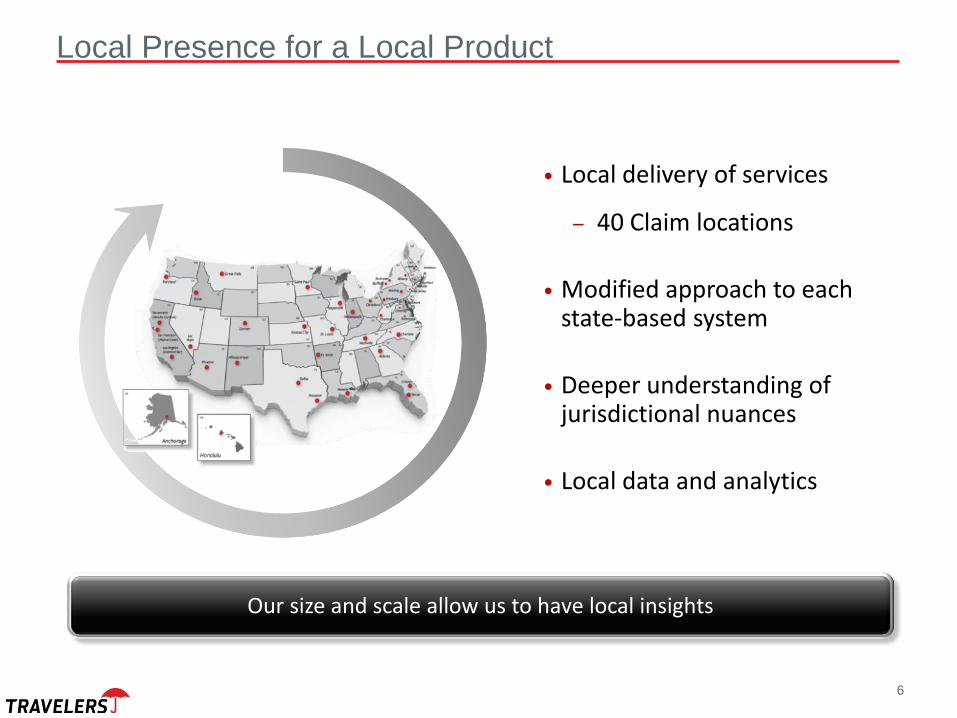
• Local delivery of services
– 40 Claim locations
• Modified approach to each state-based system
• Deeper understanding of jurisdictional nuances
• Local data and analytics
Local Presence for a Local Product
Our size and scale allow us to have local insights
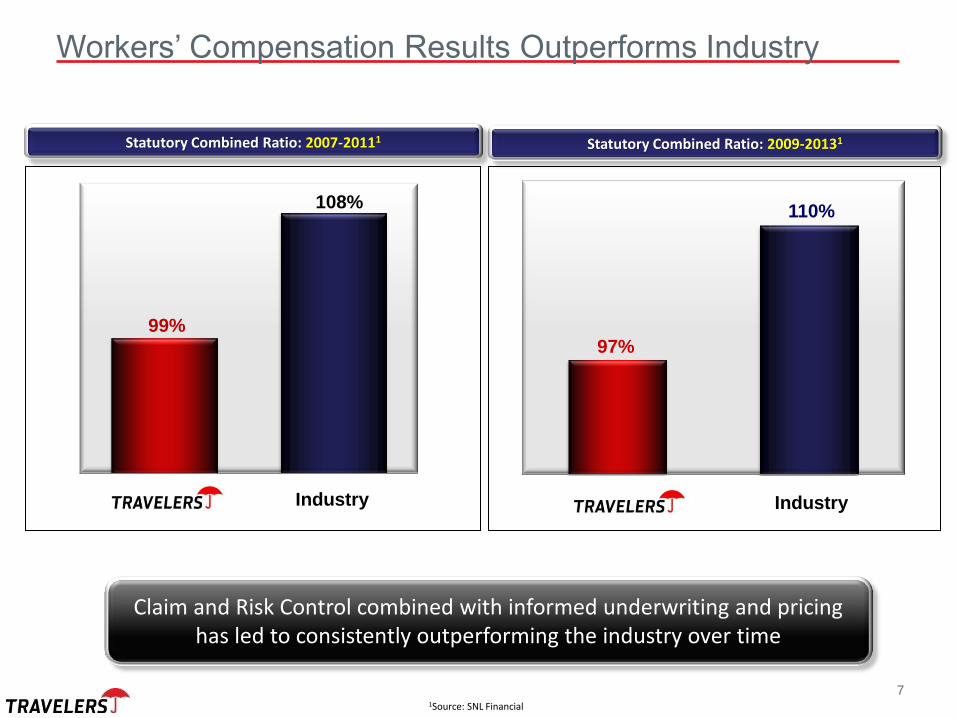
99%
108%
1Source: SNL Financial
Industry Industry
110%
97%
Workers’ Compensation Results Outperforms Industry
Claim and Risk Control combined with informed underwriting and pricing has led to consistently outperforming the industry over time
Statutory Combined Ratio: 2007-20111 Statutory Combined Ratio: 2009-20131
7
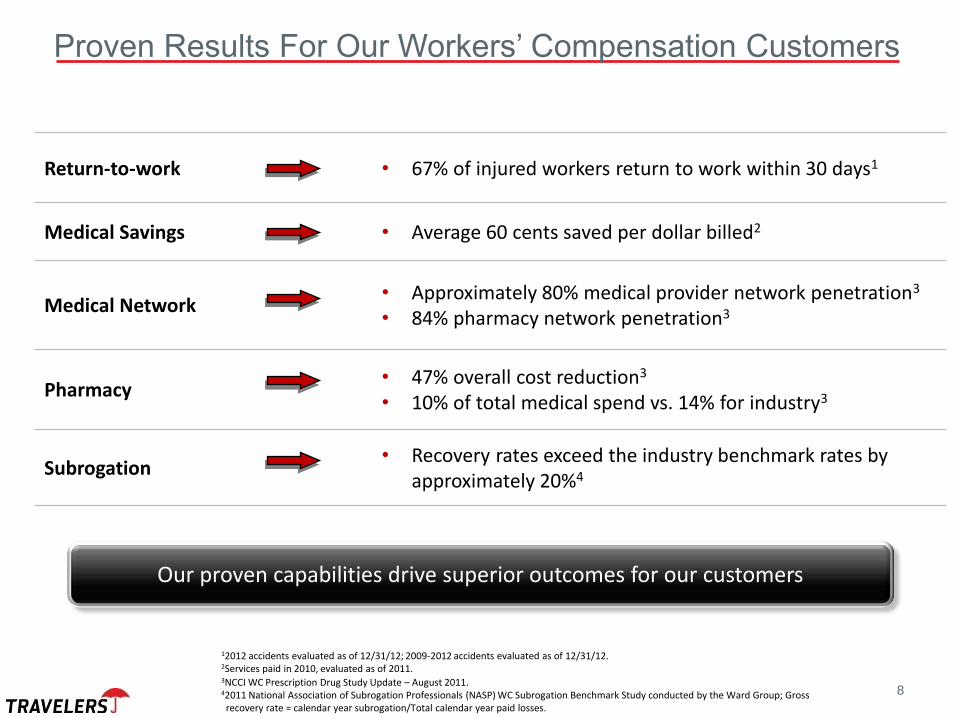
Return-to-work • 67% of injured workers return to work within 30 days1
Medical Savings • Average 60 cents saved per dollar billed2
Medical Network • Approximately 80% medical provider network penetration3
• 84% pharmacy network penetration3
Pharmacy • 47% overall cost reduction3
• 10% of total medical spend vs. 14% for industry3
Subrogation • Recovery rates exceed the industry benchmark rates by
approximately 20%4
3NCCI WC Prescription Drug Study Update – August 2011. 42011 National Association of Subrogation Professionals (NASP) WC Subrogation Benchmark Study conducted by the Ward Group; Gross recovery rate = calendar year subrogation/Total calendar year paid losses.
12012 accidents evaluated as of 12/31/12; 2009-2012 accidents evaluated as of 12/31/12. 2Services paid in 2010, evaluated as of 2011.
Proven Results For Our Workers’ Compensation Customers
Our proven capabilities drive superior outcomes for our customers
8
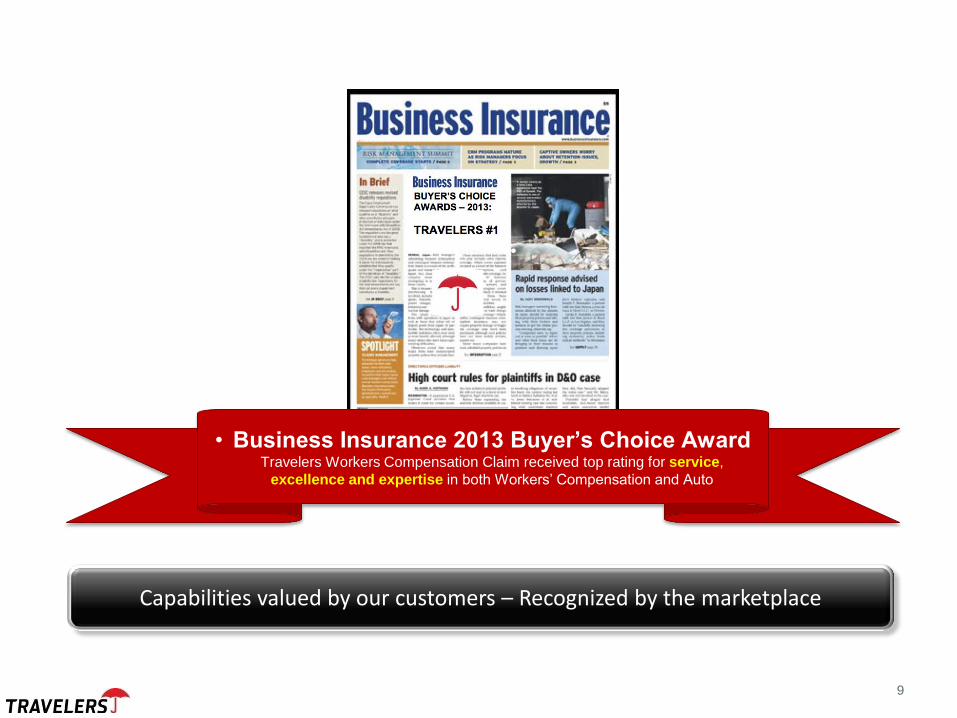
• Business Insurance 2013 Buyer’s Choice Award Travelers Workers Compensation Claim received top rating for service,
excellence and expertise in both Workers’ Compensation and Auto
Capabilities valued by our customers – Recognized by the marketplace
9
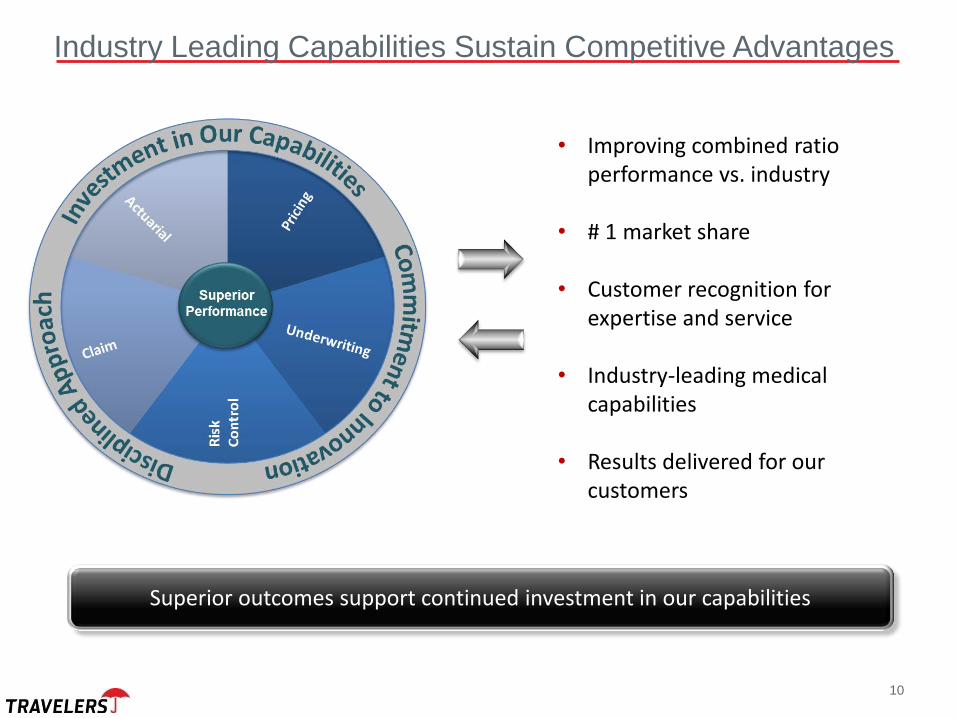
• Improving combined ratio performance vs. industry
• # 1 market share
• Customer recognition for expertise and service
• Industry-leading medical capabilities
• Results delivered for our customers
Superior outcomes support continued investment in our capabilities
Industry Leading Capabilities Sustain Competitive Advantages
10
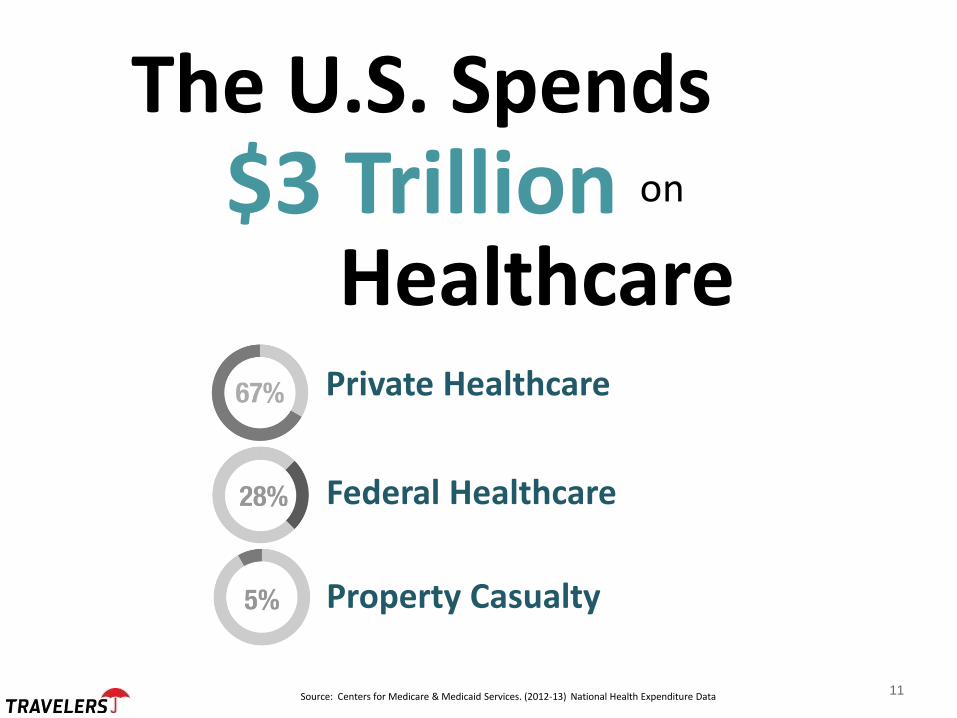
Private Healthcare
Federal Healthcare
Property Casualty
$3 Trillion Healthcare
on
Source: Centers for Medicare & Medicaid Services. (2012-13) National Health Expenditure Data
The U.S. Spends
11
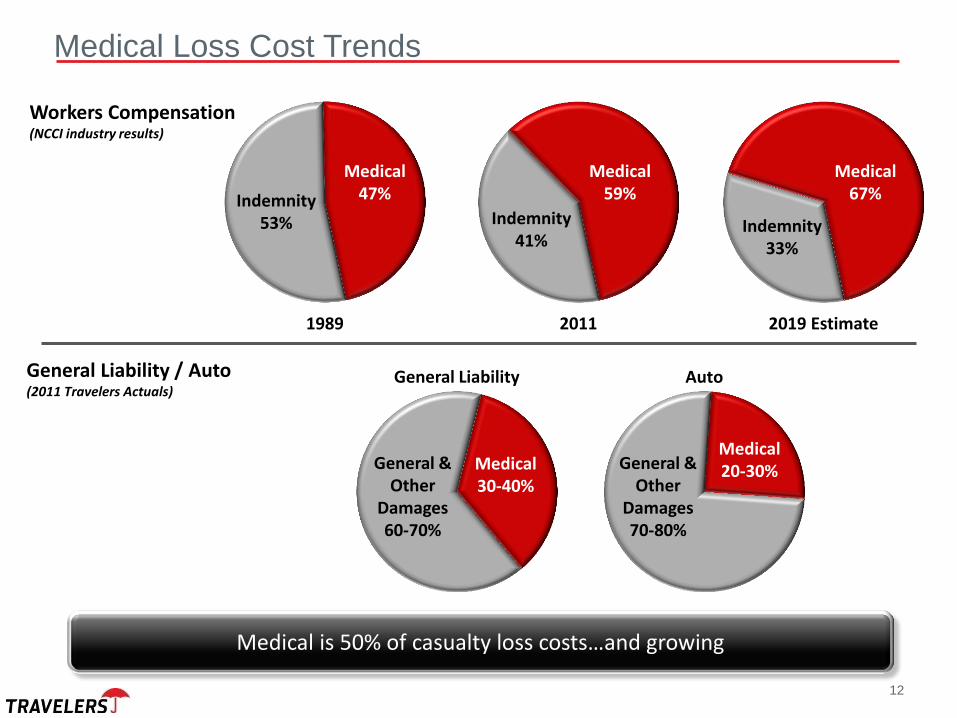
General Liability / Auto (2011 Travelers Actuals)
Workers Compensation (NCCI industry results)
Indemnity 53%
Medical 47%
Indemnity 41%
Medical 59%
Indemnity 33%
Medical 67%
1989 2011 2019 Estimate
General Liability Auto
General & Other
Damages 60-70%
Medical 30-40%
General & Other
Damages 70-80%
Medical 20-30%
Medical Loss Cost Trends
Medical is 50% of casualty loss costs…and growing
12
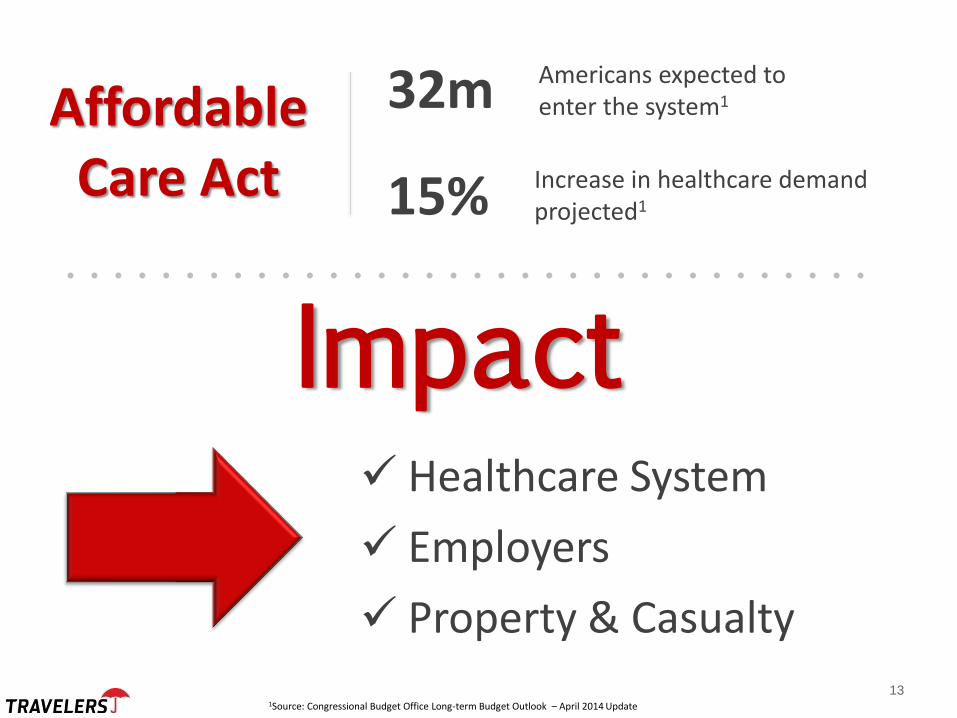
15% Increase in healthcare demand projected1
Affordable Care Act
Healthcare System
Employers
Property & Casualty
Impact
1Source: Congressional Budget Office Long-term Budget Outlook – April 2014 Update
Americans expected to enter the system1 32m
13
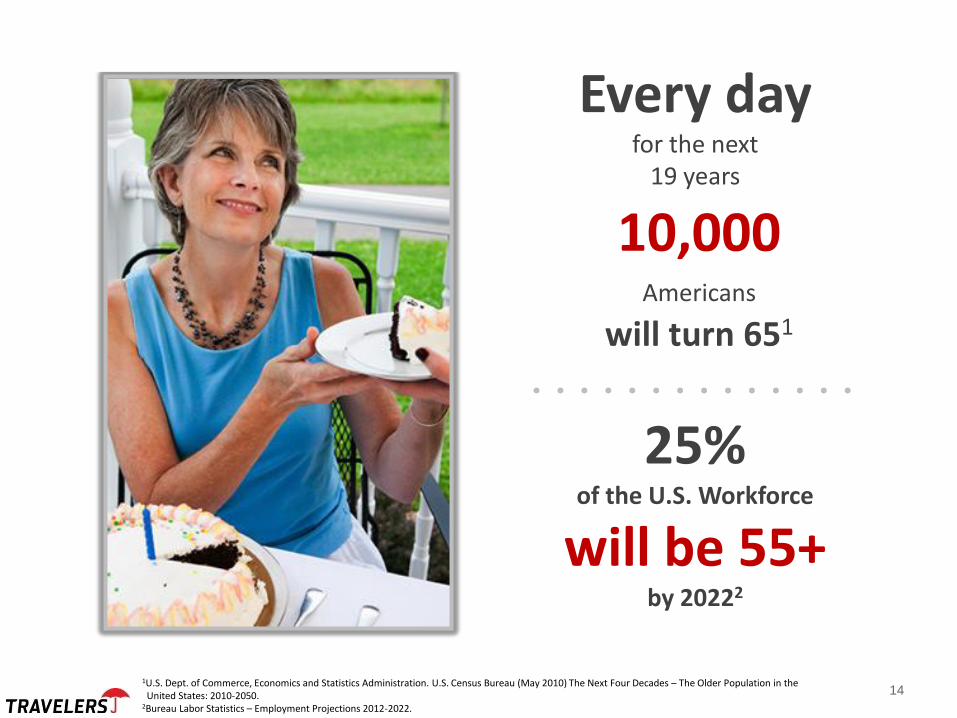
Every day for the next
19 years
10,000 Americans
will turn 651
25% of the U.S. Workforce
will be 55+ by 20222
1U.S. Dept. of Commerce, Economics and Statistics Administration. U.S. Census Bureau (May 2010) The Next Four Decades – The Older Population in the United States: 2010-2050. 2Bureau Labor Statistics – Employment Projections 2012-2022.
14

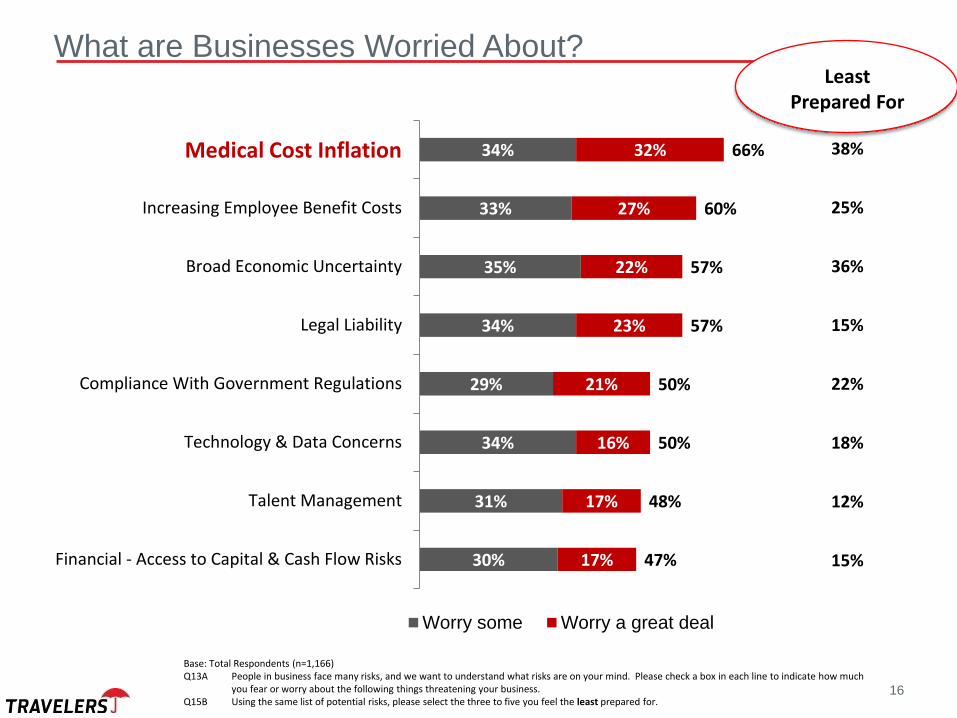
30%
31%
34%
29%
34%
35%
33%
34%
17%
17%
16%
21%
23%
22%
27%
32%
47%
48%
50%
50%
57%
57%
60%
66%
Financial - Access to Capital & Cash Flow Risks
Talent Management
Technology & Data Concerns
Compliance With Government Regulations
Legal Liability
Broad Economic Uncertainty
Increasing Employee Benefit Costs
Medical Cost Inflation
Worry some Worry a great deal
Base: Total Respondents (n=1,166) Q13A People in business face many risks, and we want to understand what risks are on your mind. Please check a box in each line to indicate how much
you fear or worry about the following things threatening your business. Q15B Using the same list of potential risks, please select the three to five you feel the least prepared for.
What are Businesses Worried About?
15
30%
31%
34%
29%
34%
35%
33%
34%
17%
17%
16%
21%
23%
22%
27%
32%
47%
48%
50%
50%
57%
57%
60%
66%
Financial - Access to Capital & Cash Flow Risks
Talent Management
Technology & Data Concerns
Compliance With Government Regulations
Legal Liability
Broad Economic Uncertainty
Increasing Employee Benefit Costs
Medical Cost Inflation
Worry some Worry a great deal
Base: Total Respondents (n=1,166) Q13A People in business face many risks, and we want to understand what risks are on your mind. Please check a box in each line to indicate how much
you fear or worry about the following things threatening your business. Q15B Using the same list of potential risks, please select the three to five you feel the least prepared for.
Least Prepared For
38%
25%
36%
15%
22%
18%
12%
15%
Medical Cost Inflation
What are Businesses Worried About?
16
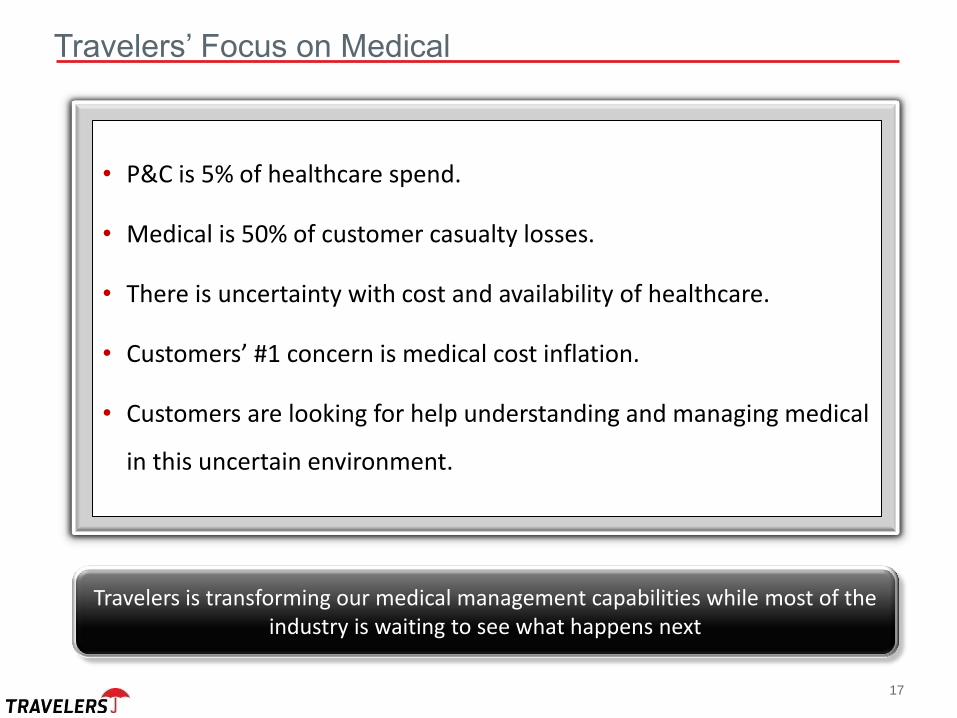
• P&C is 5% of healthcare spend.
• Medical is 50% of customer casualty losses.
• There is uncertainty with cost and availability of healthcare.
• Customers’ #1 concern is medical cost inflation.
• Customers are looking for help understanding and managing medical
in this uncertain environment.
17
Travelers’ Focus on Medical
Travelers is transforming our medical management capabilities while most of the industry is waiting to see what happens next
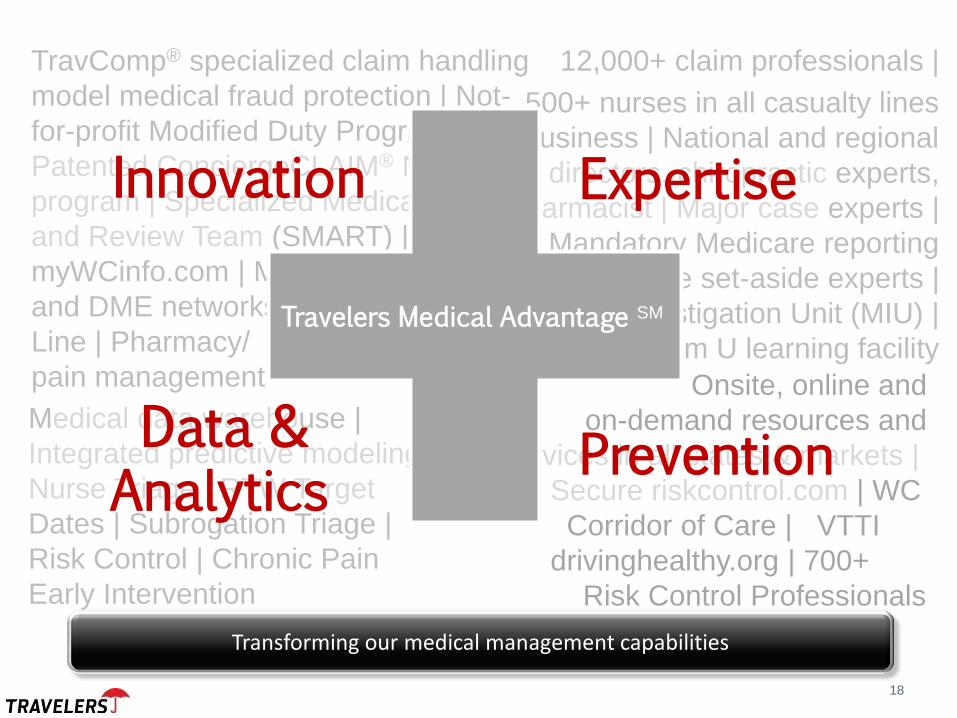
TravComp® specialized claim handling
model medical fraud protection | Not-
for-profit Modified Duty Program |
Patented ConciergeCLAIM® Nurse
program | Specialized Medical Audit
and Review Team (SMART) |
myWCinfo.com | Medical, pharmacy
and DME networks | TravCARE Nurse
Line | Pharmacy/
pain management
12,000+ claim professionals |
500+ nurses in all casualty lines
of business | National and regional
medical directors, chiropractic experts,
and pharmacist | Major case experts |
Mandatory Medicare reporting
expertise | Medicare set-aside experts |
Medical Investigation Unit (MIU) |
Claim U learning facility
Medical data warehouse |
Integrated predictive modeling |
Nurse Triage | RTW Target
Dates | Subrogation Triage |
Risk Control | Chronic Pain
Early Intervention
Onsite, online and
on-demand resources and
services in all states & markets |
Secure riskcontrol.com | WC
Corridor of Care | VTTI
drivinghealthy.org | 700+
Risk Control Professionals
Innovation Expertise
Prevention Data &
Analytics
18
Transforming our medical management capabilities
Travelers Medical Advantage SM
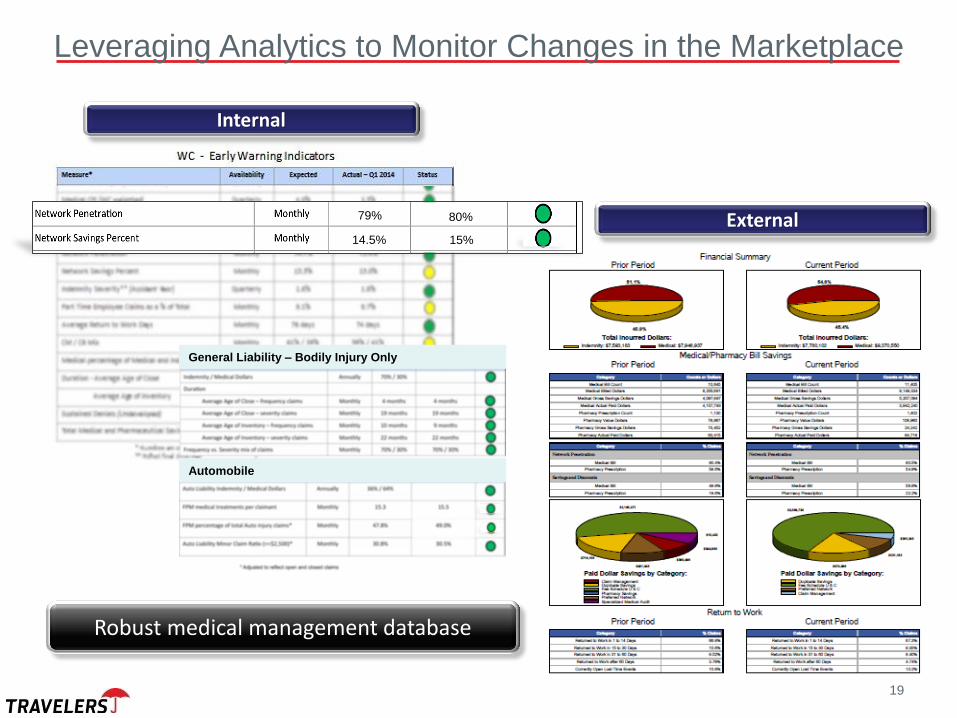
General Liability – Bodily Injury Only
Automobile
14.5%
79% 80%
15%
Leveraging Analytics to Monitor Changes in the Marketplace
19
Internal
External
Robust medical management database
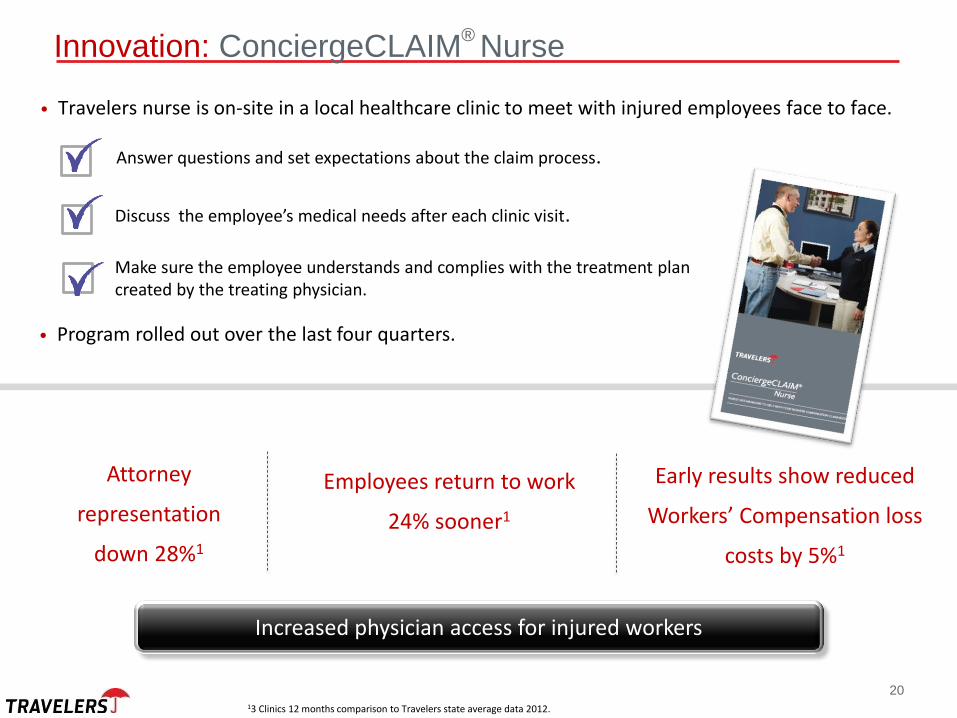
• Travelers nurse is on-site in a local healthcare clinic to meet with injured employees face to face.
Answer questions and set expectations about the claim process.
Discuss the employee’s medical needs after each clinic visit.
Make sure the employee understands and complies with the treatment plan created by the treating physician.
Early results show reduced
Workers’ Compensation loss
costs by 5%1
Employees return to work
24% sooner1
Attorney
representation
down 28%1
13 Clinics 12 months comparison to Travelers state average data 2012.
20
Increased physician access for injured workers
Innovation: ConciergeCLAIM Nurse ®
• Program rolled out over the last four quarters.
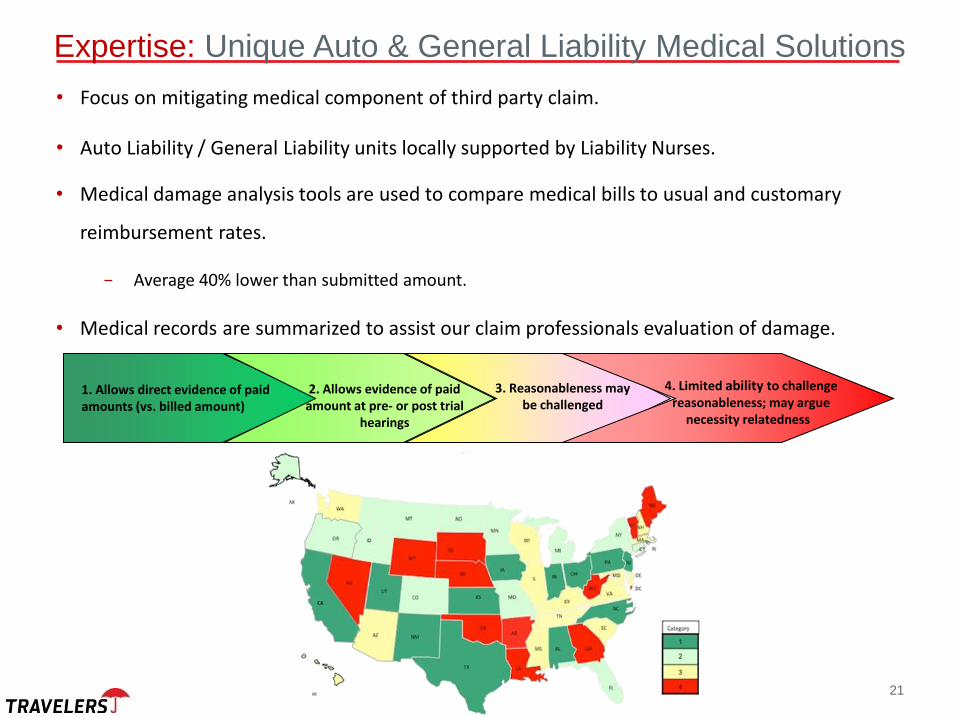
2. Allows evidence of paid amount at pre- or post trial
hearings
3. Reasonableness may be challenged
4. Limited ability to challenge reasonableness; may argue
necessity relatedness
1. Allows direct evidence of paid amounts (vs. billed amount)
21
Expertise: Unique Auto & General Liability Medical Solutions
• Focus on mitigating medical component of third party claim.
• Auto Liability / General Liability units locally supported by Liability Nurses.
• Medical damage analysis tools are used to compare medical bills to usual and customary
reimbursement rates.
− Average 40% lower than submitted amount.
• Medical records are summarized to assist our claim professionals evaluation of damage.
22
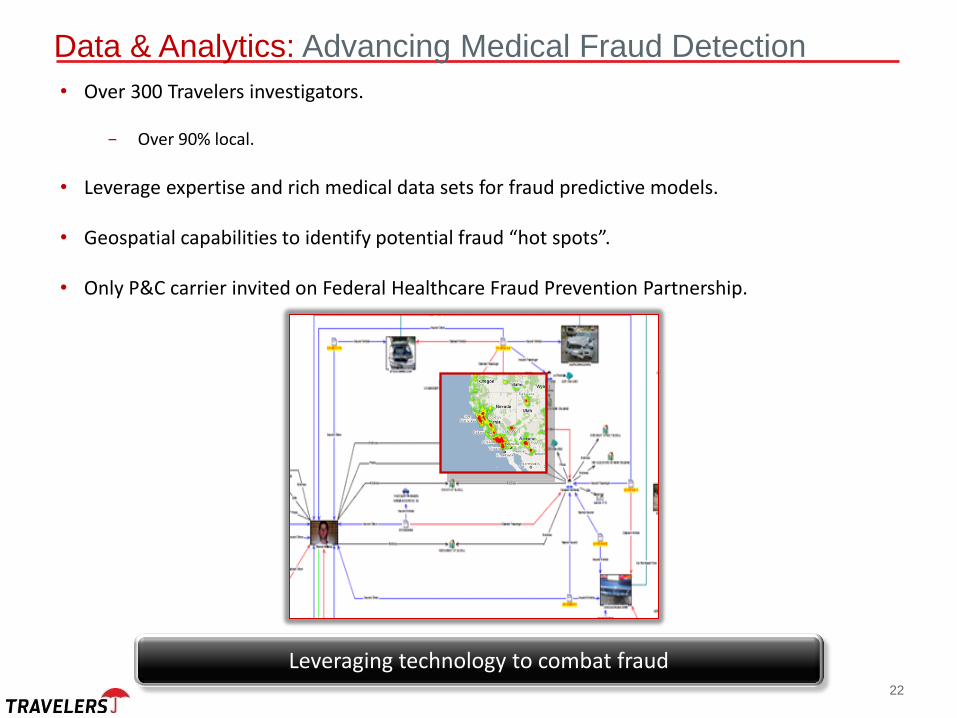
Data & Analytics: Advancing Medical Fraud Detection
Leveraging technology to combat fraud
• Over 300 Travelers investigators.
− Over 90% local.
• Leverage expertise and rich medical data sets for fraud predictive models.
• Geospatial capabilities to identify potential fraud “hot spots”.
• Only P&C carrier invited on Federal Healthcare Fraud Prevention Partnership.
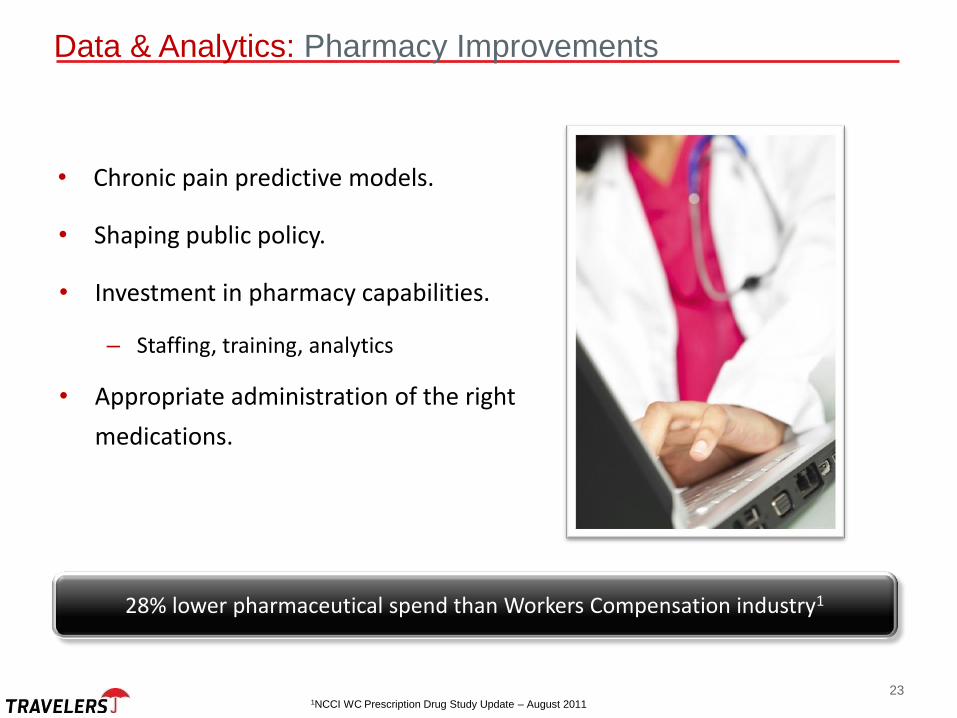
• Shaping public policy.
• Investment in pharmacy capabilities.
– Staffing, training, analytics
• Appropriate administration of the right
medications.
• Chronic pain predictive models.
1NCCI WC Prescription Drug Study Update – August 2011
23
Data & Analytics: Pharmacy Improvements
28% lower pharmaceutical spend than Workers Compensation industry1

• Wellness focus
• Partnership with Virginia Tech Transportation
Institute (VTTI)
− Eating healthy
− Cognitive ability
• Virtual Risk Experience
- Behavioral modification
24
Risk Control: Wellness
Going beyond traditional risk control methods
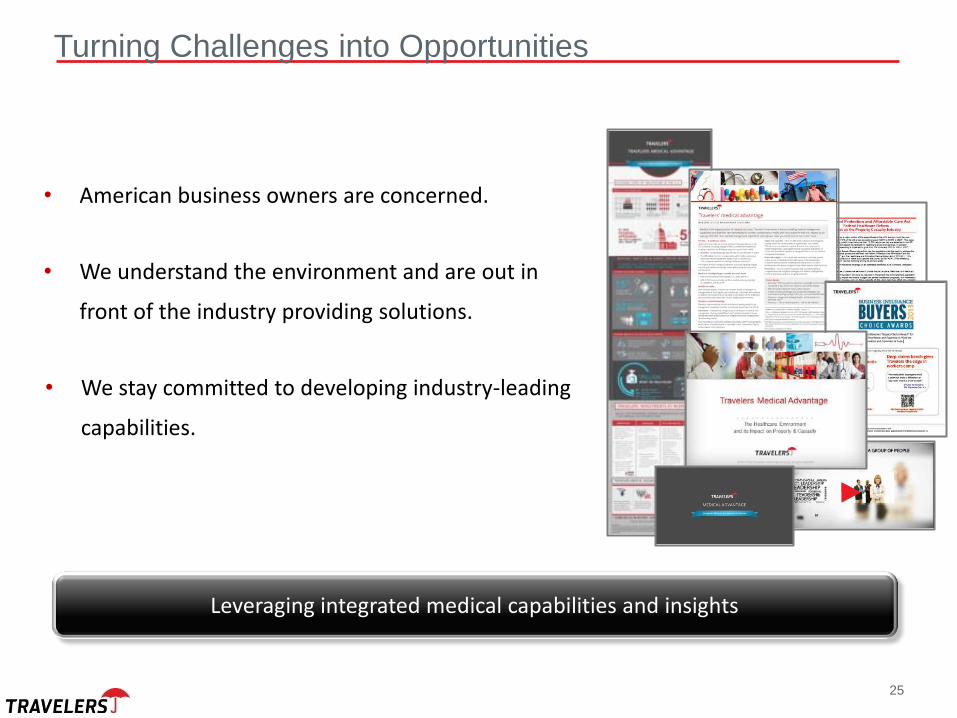
• We understand the environment and are out in
front of the industry providing solutions.
• We stay committed to developing industry-leading
capabilities.
• American business owners are concerned.
25
Turning Challenges into Opportunities
Leveraging integrated medical capabilities and insights
Anticipating Emerging Risks
Continued Investment
Transforming Capabilities Over Time
A real advantage for our customers and Travelers
26

51 Additional Information Additional Information
The Travelers Companies, Inc.

2014 Investor Day
Executive Vice President, Select Accounts & Agribusiness
52
Marc Schmittlein
June 6, 2014
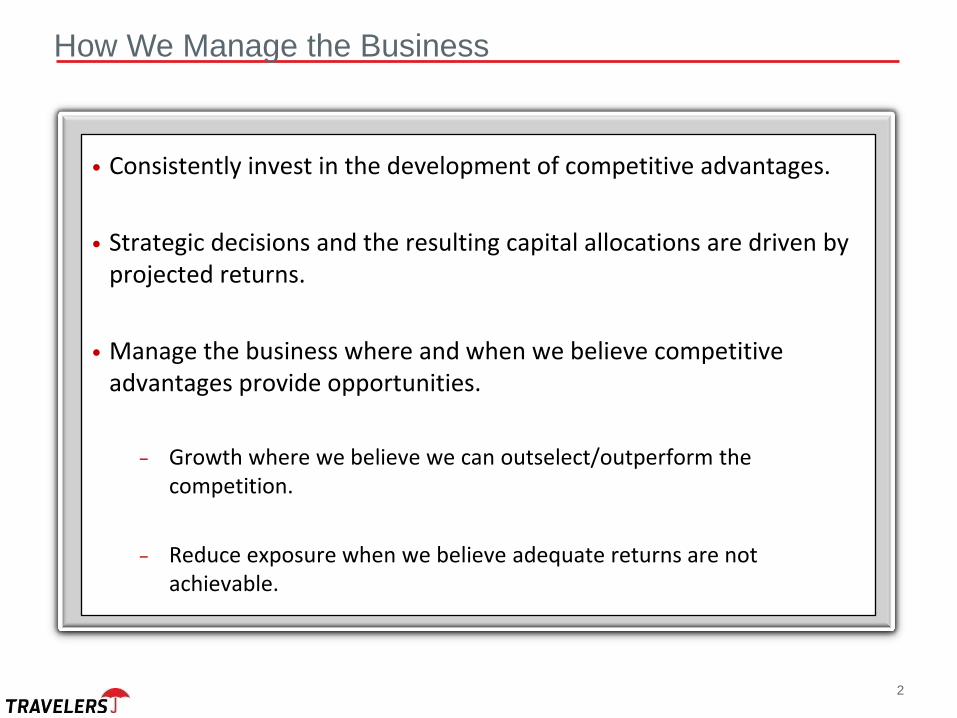
• Consistently invest in the development of competitive advantages.
• Strategic decisions and the resulting capital allocations are driven by projected returns.
• Manage the business where and when we believe competitive advantages provide opportunities.
− Growth where we believe we can outselect/outperform the competition.
− Reduce exposure when we believe adequate returns are not achievable.
2
How We Manage the Business
3
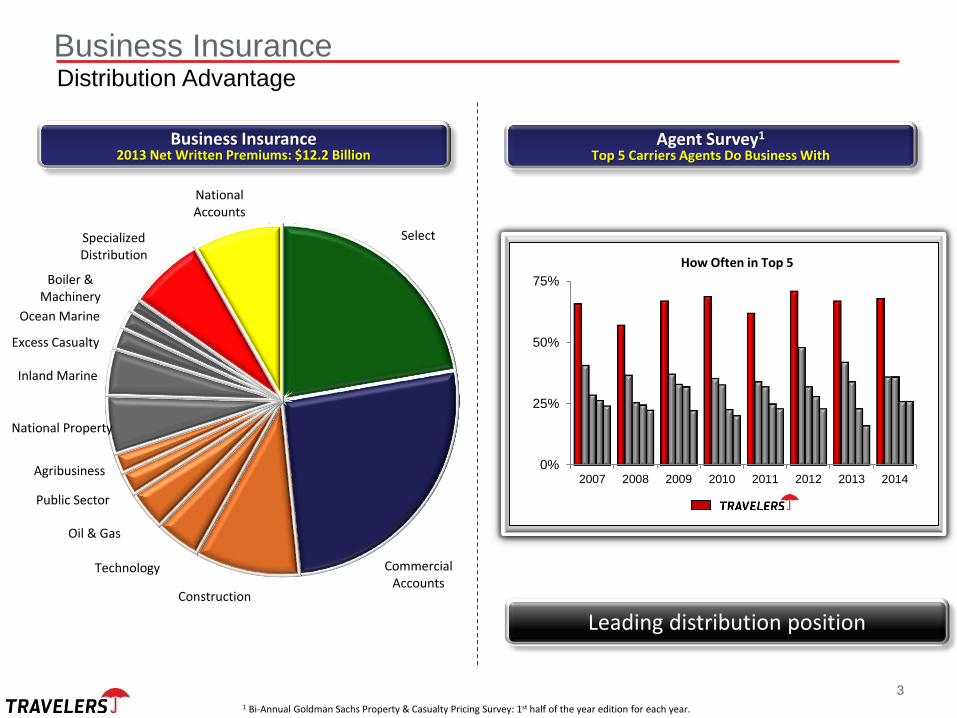
Select
Commercial Accounts
Construction
Technology
Oil & Gas
Public Sector
Agribusiness
National Property
Inland Marine
Excess Casualty
Ocean Marine
Boiler & Machinery
Specialized Distribution
National Accounts
0%
25%
50%
75%
2007 2008 2009 2010 2011 2012 2013 2014
1 Bi-Annual Goldman Sachs Property & Casualty Pricing Survey: 1st half of the year edition for each year.
How Often in Top 5
Business Insurance Distribution Advantage
Business Insurance 2013 Net Written Premiums: $12.2 Billion
Agent Survey1
Top 5 Carriers Agents Do Business With
Leading distribution position
4
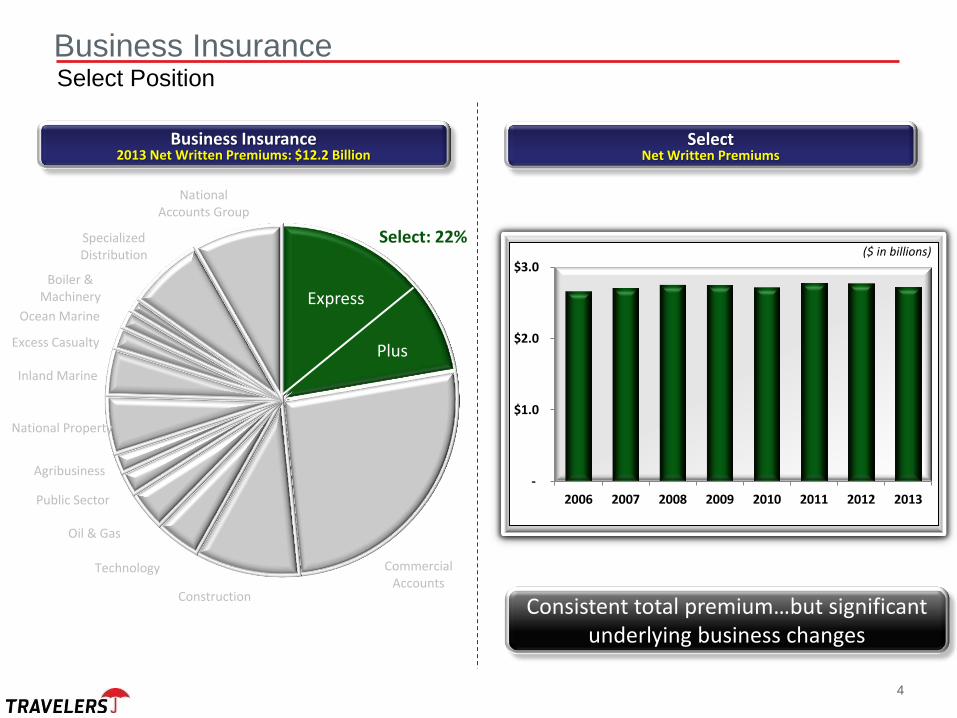
Select: 22%
Commercial Accounts
Construction
Technology
Oil & Gas
Public Sector
Agribusiness
National Property
Inland Marine
Excess Casualty
Ocean Marine
Boiler & Machinery
Specialized Distribution
National Accounts Group
Business Insurance Select Position
Business Insurance 2013 Net Written Premiums: $12.2 Billion
Select
Net Written Premiums
Consistent total premium…but significant underlying business changes
Express
Plus
$-
$1.0
$2.0
$3.0
2006 2007 2008 2009 2010 2011 2012 2013
($ in billions)
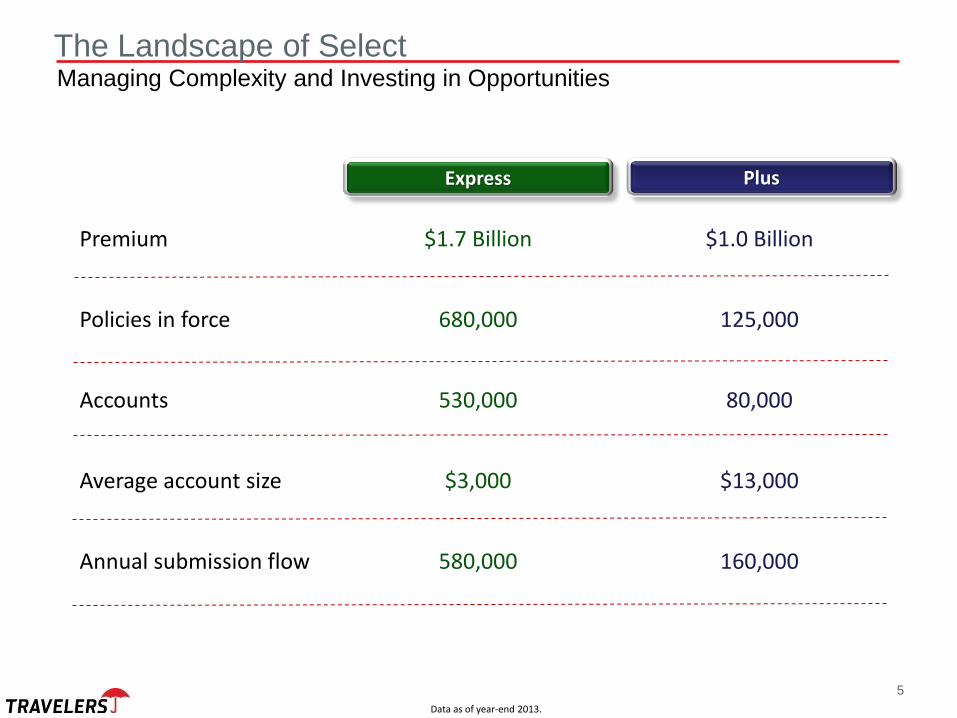
The Landscape of Select Managing Complexity and Investing in Opportunities
Premium $1.7 Billion $1.0 Billion
Policies in force 680,000 125,000
Accounts 530,000 80,000
Average account size $3,000 $13,000
Annual submission flow 580,000 160,000
Plus Express
Data as of year-end 2013.
5
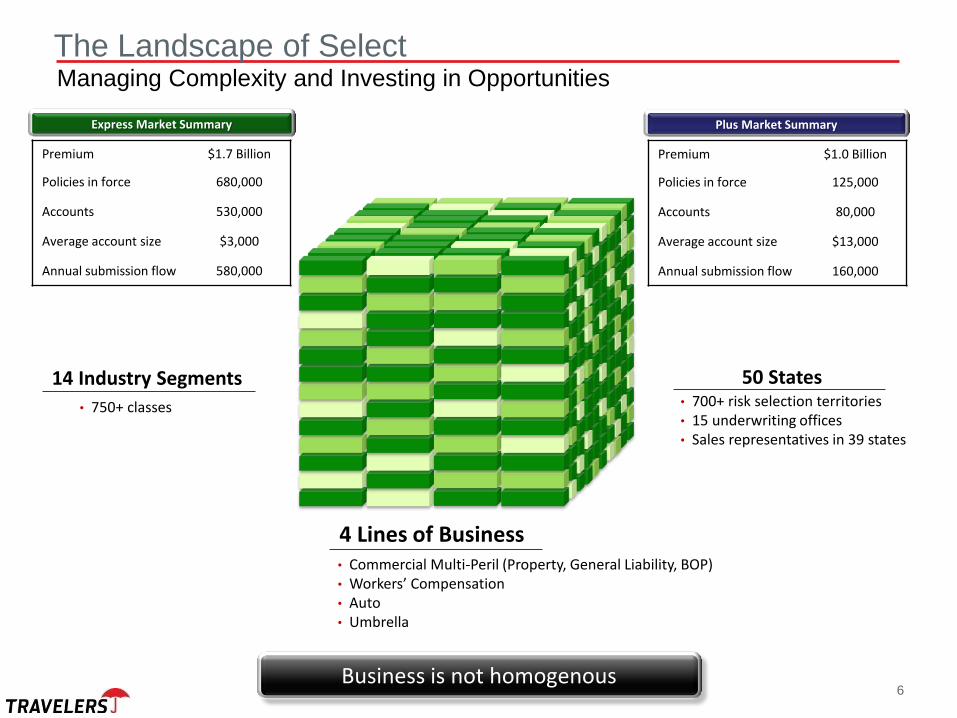
6
50 States & D.C.
700+ risk selection territories
900+ classes
Apartment, Building, Business, Condominium, Contractor, Garage, Institutional,
Manufacturing, Office, Restaurant, Store, Tech Office, Tech Manufacturing, Wholesale
15 underwriting offices
Sales representation in 39 states
50 States
4 Lines of Business
14 Industry Segments
• 750+ classes
The Landscape of Select Managing Complexity and Investing in Opportunities
Business is not homogenous
• Commercial Multi-Peril (Property, General Liability, BOP) • Workers’ Compensation • Auto • Umbrella
• 700+ risk selection territories • 15 underwriting offices • Sales representatives in 39 states
Premium $1.0 Billion
Policies in force 125,000
Accounts 80,000
Average account size $13,000
Annual submission flow 160,000
Express Market Summary
Premium $1.7 Billion
Policies in force 680,000
Accounts 530,000
Average account size $3,000
Annual submission flow 580,000
Plus Market Summary
7
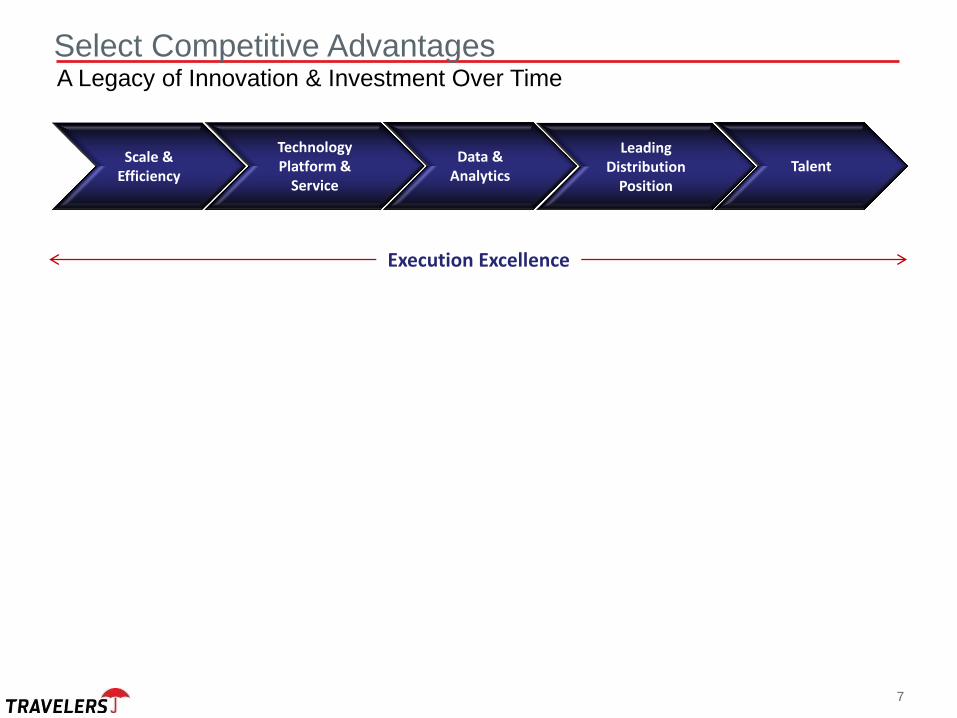
Scale & Efficiency
Technology Platform &
Service
Data & Analytics
Leading Distribution
Position Talent
Select Competitive Advantages A Legacy of Innovation & Investment Over Time
Execution Excellence
8
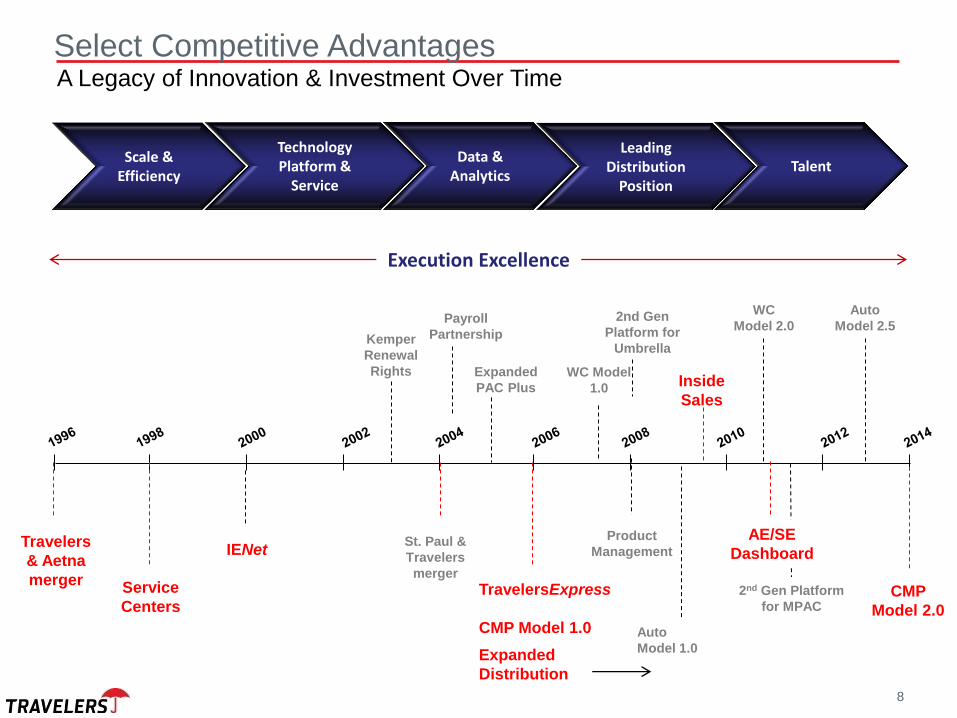
Select Competitive Advantages A Legacy of Innovation & Investment Over Time
Travelers
& Aetna
merger
St. Paul &
Travelers
merger
Kemper
Renewal
Rights
Service
Centers
IENet
Expanded
PAC Plus
TravelersExpress
CMP Model 1.0
Expanded
Distribution
WC Model
1.0
Product
Management
2nd Gen
Platform for
Umbrella
Inside
Sales
AE/SE
Dashboard
WC
Model 2.0 Payroll
Partnership
Auto
Model 1.0
2nd Gen Platform
for MPAC
Auto
Model 2.5
CMP
Model 2.0
Scale & Efficiency
Technology Platform &
Service
Data & Analytics
Leading Distribution
Position Talent
Execution Excellence
9
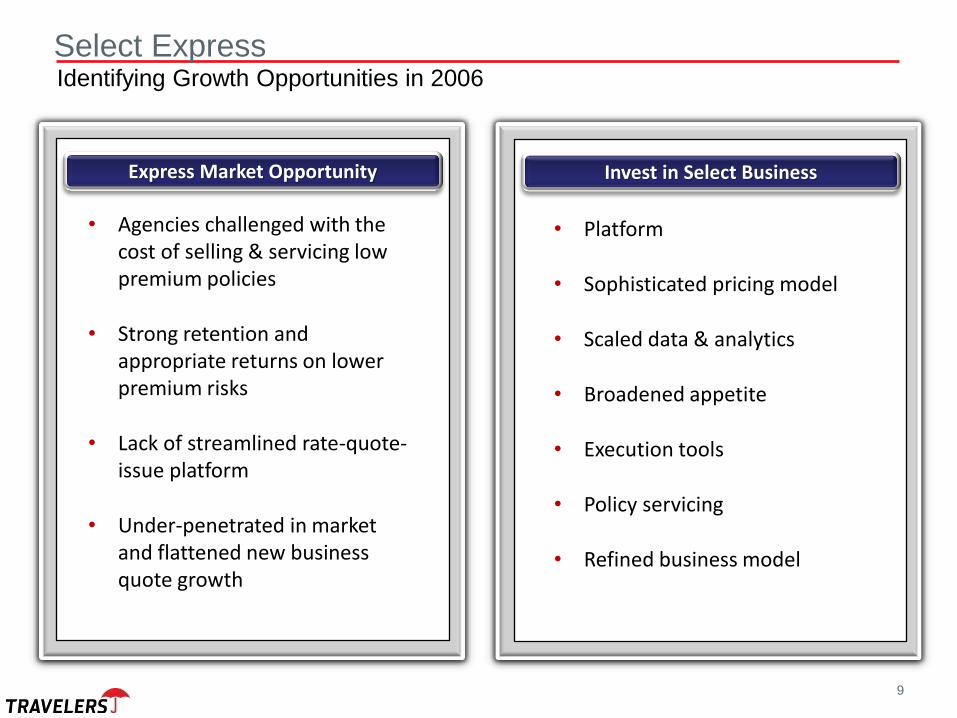
• Agencies challenged with the cost of selling & servicing low premium policies
• Strong retention and appropriate returns on lower premium risks
• Lack of streamlined rate-quote-issue platform
• Under-penetrated in market and flattened new business quote growth
Select Express Identifying Growth Opportunities in 2006
• Platform
• Sophisticated pricing model
• Scaled data & analytics
• Broadened appetite
• Execution tools
• Policy servicing
• Refined business model
Express Market Opportunity Invest in Select Business
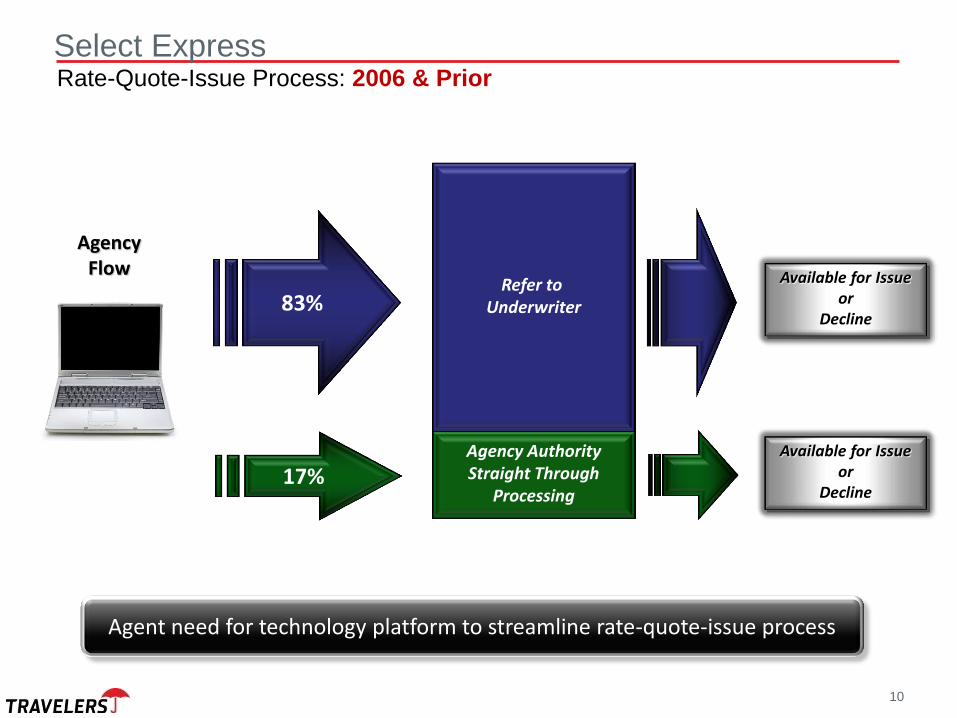
Agency Authority Straight Through
Processing
Agency Flow
83%
Refer to Underwriter
17%
10
Select Express Rate-Quote-Issue Process: 2006 & Prior
Agent need for technology platform to streamline rate-quote-issue process
Available for Issue or
Decline
Available for Issue or
Decline
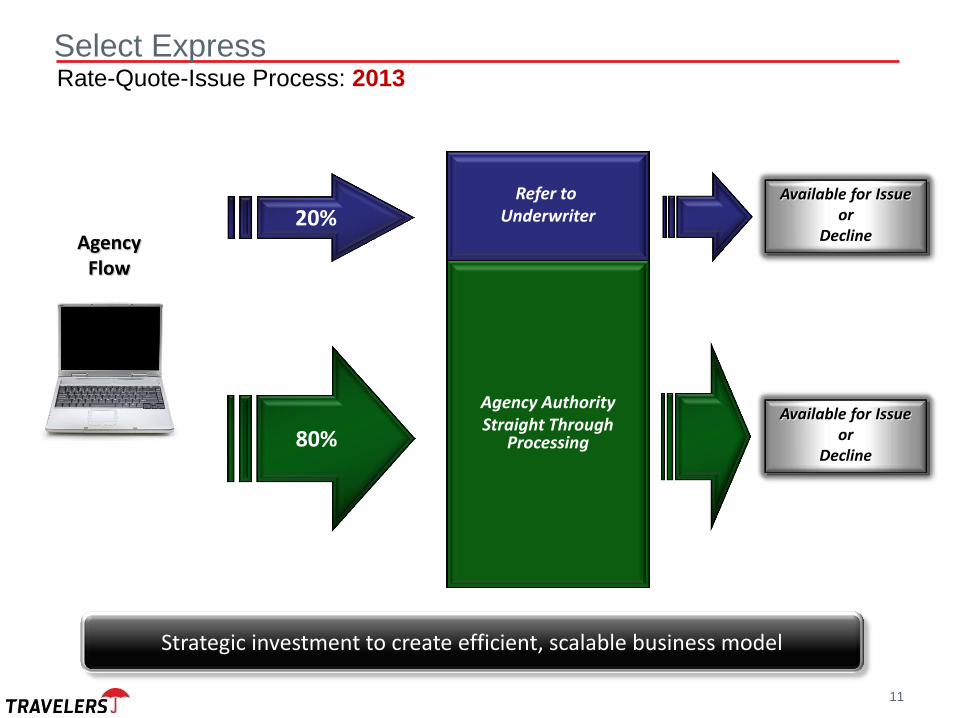
Agency Authority Straight Through
Processing 80%
Refer to Underwriter
20%
11
Select Express Rate-Quote-Issue Process: 2013
Strategic investment to create efficient, scalable business model
Agency Flow
Available for Issue or
Decline
Available for Issue or
Decline
12
-
200,000
400,000
600,000
800,000
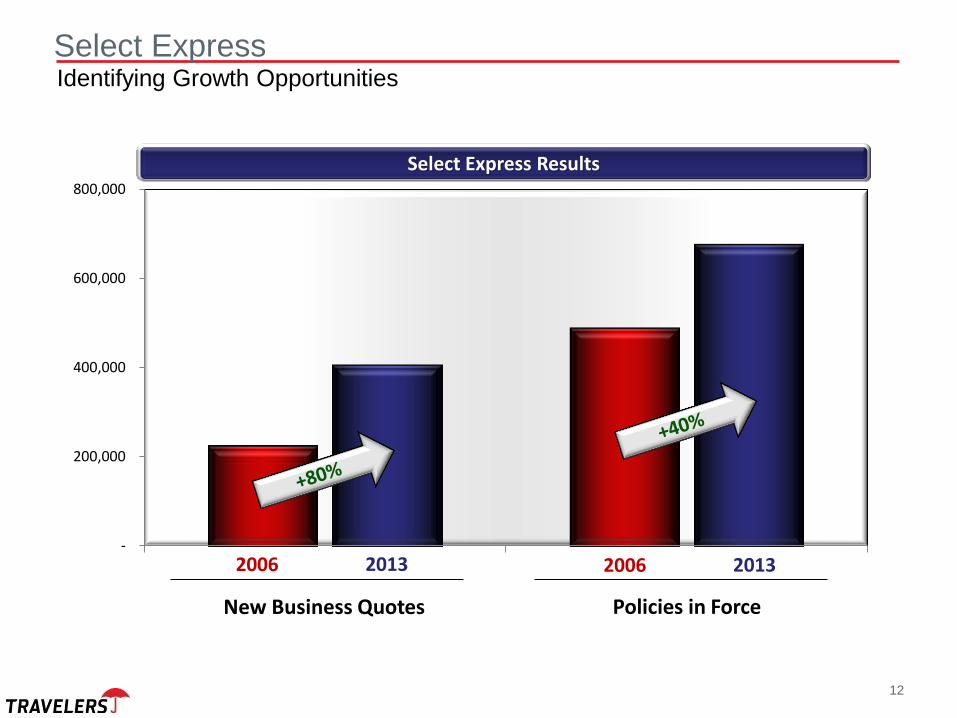
Select Express Identifying Growth Opportunities
Select Express Results
2006 2013 2006 2013
New Business Quotes Policies in Force
13
2006 2013
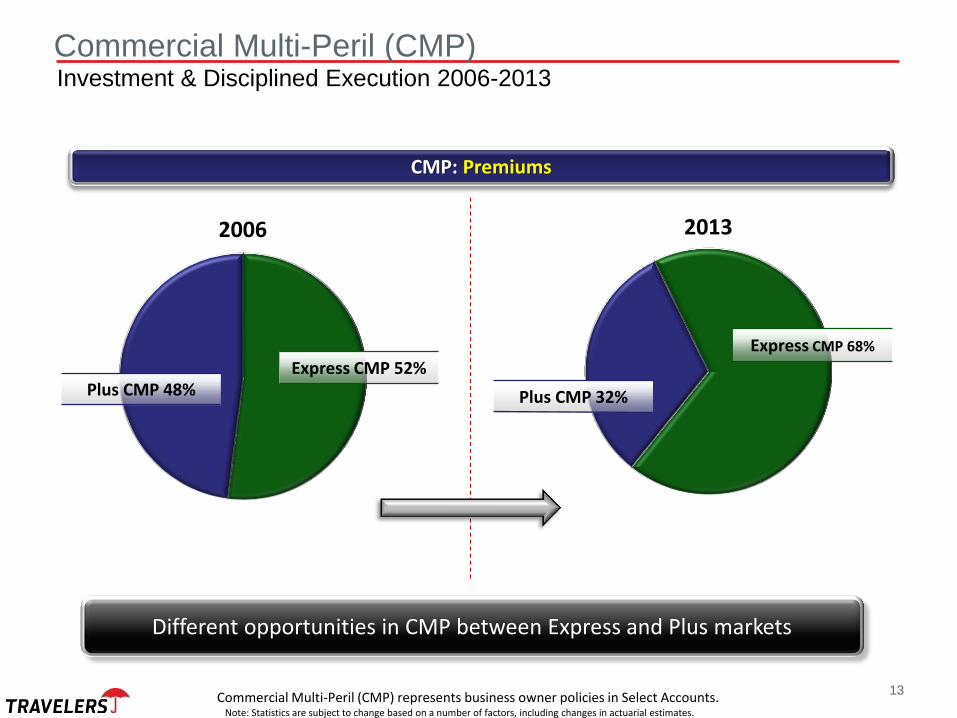
Commercial Multi-Peril (CMP) Investment & Disciplined Execution 2006-2013
Different opportunities in CMP between Express and Plus markets
CMP: Premiums
Express CMP 52% Plus CMP 48%
Express CMP 68%
Plus CMP 32%
Commercial Multi-Peril (CMP) represents business owner policies in Select Accounts. Note: Statistics are subject to change based on a number of factors, including changes in actuarial estimates.
14
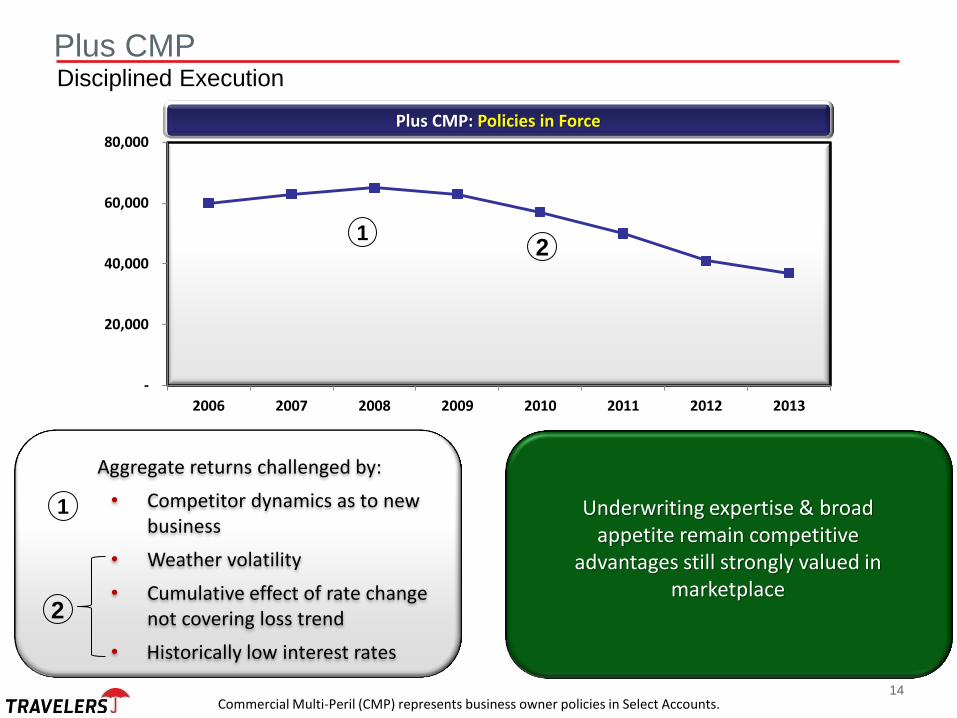
-
20,000
40,000
60,000
80,000
2006 2007 2008 2009 2010 2011 2012 2013
Underwriting expertise & broad appetite remain competitive
advantages still strongly valued in marketplace
Plus CMP Disciplined Execution
Plus CMP: Policies in Force
2 1
Aggregate returns challenged by:
• Competitor dynamics as to new business
• Weather volatility
• Cumulative effect of rate change not covering loss trend
• Historically low interest rates
2
1
Commercial Multi-Peril (CMP) represents business owner policies in Select Accounts.
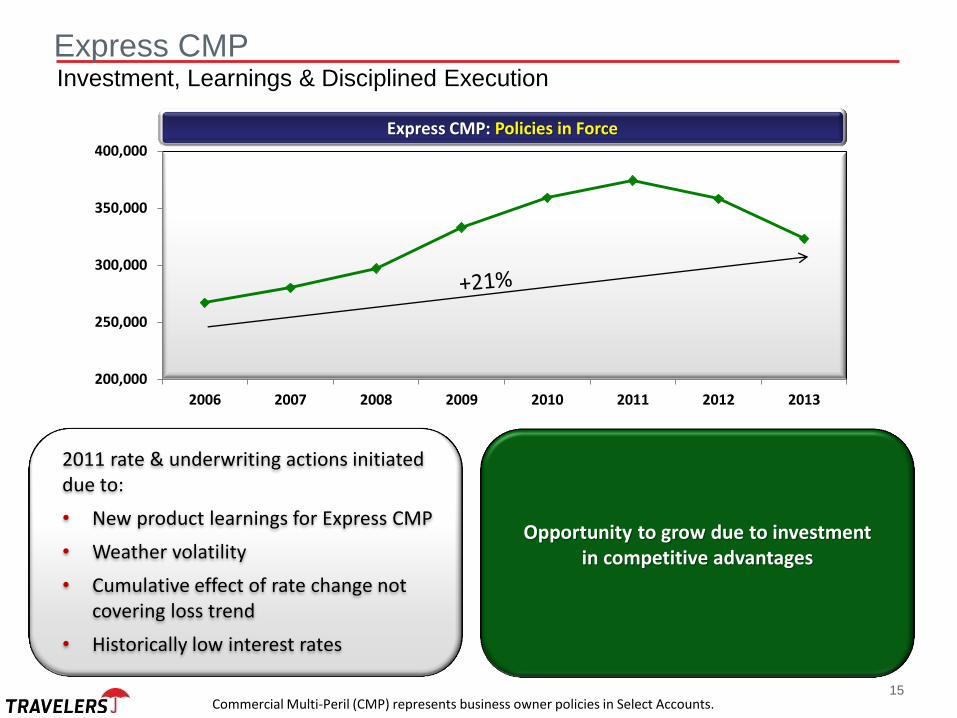
2011 rate & underwriting actions initiated due to:
• New product learnings for Express CMP
• Weather volatility
• Cumulative effect of rate change not covering loss trend
• Historically low interest rates
15
200,000
250,000
300,000
350,000
400,000
2006 2007 2008 2009 2010 2011 2012 2013
Opportunity to grow due to investment in competitive advantages
Express CMP Investment, Learnings & Disciplined Execution
Express CMP: Policies in Force
Commercial Multi-Peril (CMP) represents business owner policies in Select Accounts.
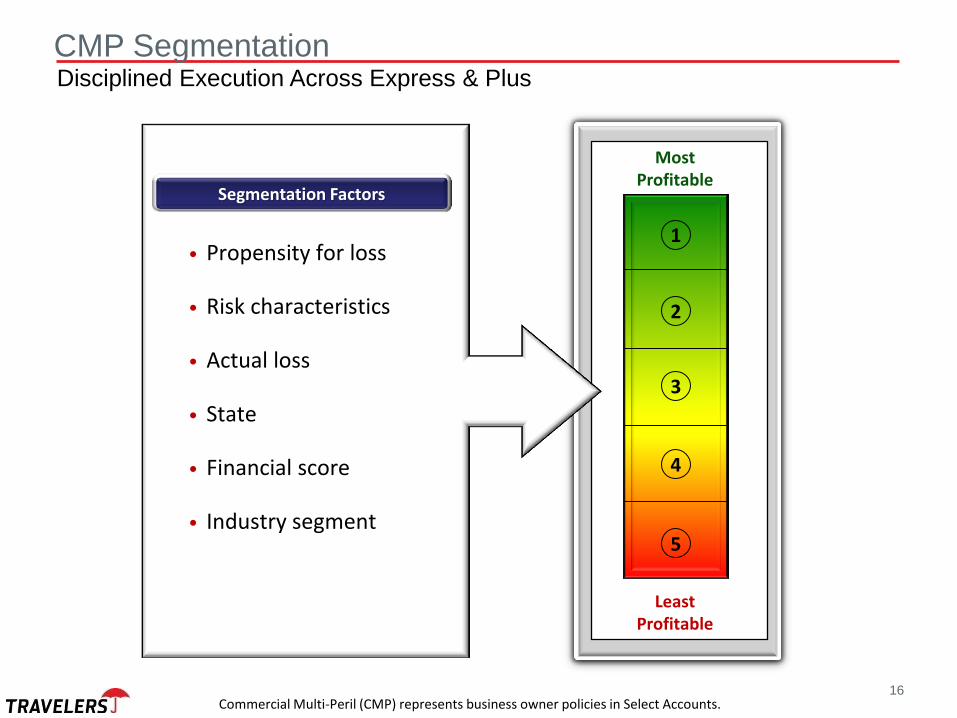
• Propensity for loss
• Risk characteristics
• Actual loss
• State
• Financial score
• Industry segment
16
Most Profitable
Least Profitable
1
2
3
4
5
CMP Segmentation Disciplined Execution Across Express & Plus
Segmentation Factors
Commercial Multi-Peril (CMP) represents business owner policies in Select Accounts.

17
Most Profitable
Least Profitable
1
2
3
4
5
Executed on highly segmented basis…still work to do…approaching target returns
CMP Segmentation Disciplined Execution Across Express & Plus
Fourth Quarter 2011 First Quarter 2014
1 2 3 4 5
RP
C
Re
ten
tio
n
QuintileRetention % RPC %
1 2 3 4 5
RP
C
Re
ten
tio
n
QuintileRetention % RPC %
Retention: ~4 point improvement
Loss ratio: 5+ point improvement
Renew
al P
rem
ium
Change (R
PC
)1
Renew
al P
rem
ium
Change (R
PC
)1
Rete
ntio
n
Rete
ntio
n
1 Represents the estimated change in average premium on policies that renew, including rate and exposure changes. Note: Statistics are subject to change based on a number of factors, including changes in actuarial estimates.
Commercial Multi-Peril (CMP) represents business owner policies in Select Accounts.
18
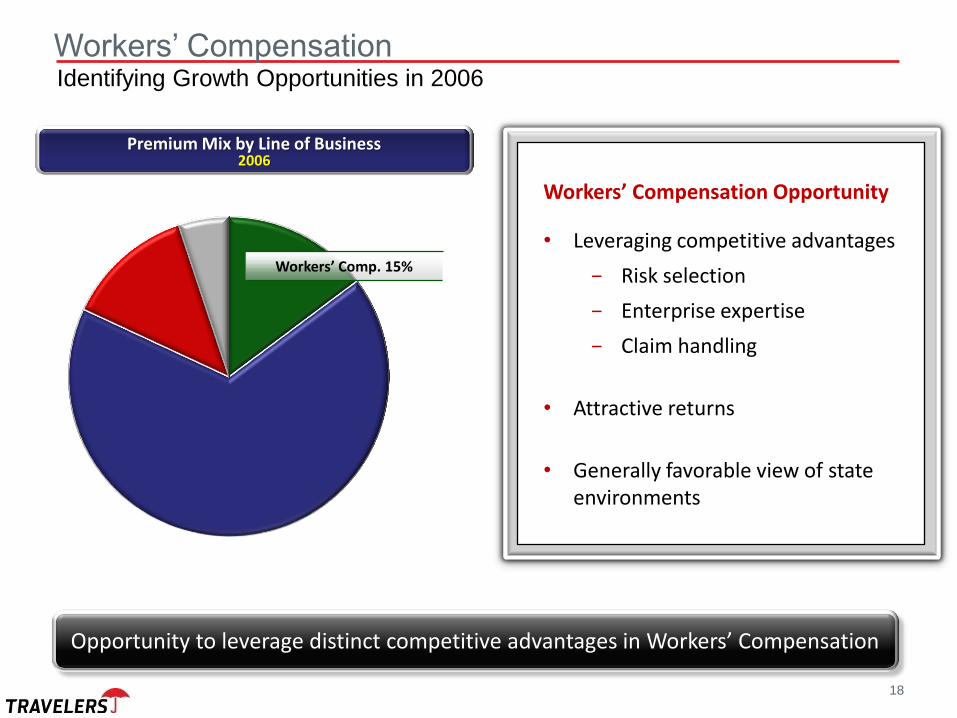
Workers’ Compensation Opportunity
• Leveraging competitive advantages
− Risk selection
− Enterprise expertise
− Claim handling
• Attractive returns
• Generally favorable view of state environments
Workers’ Compensation Identifying Growth Opportunities in 2006
Opportunity to leverage distinct competitive advantages in Workers’ Compensation
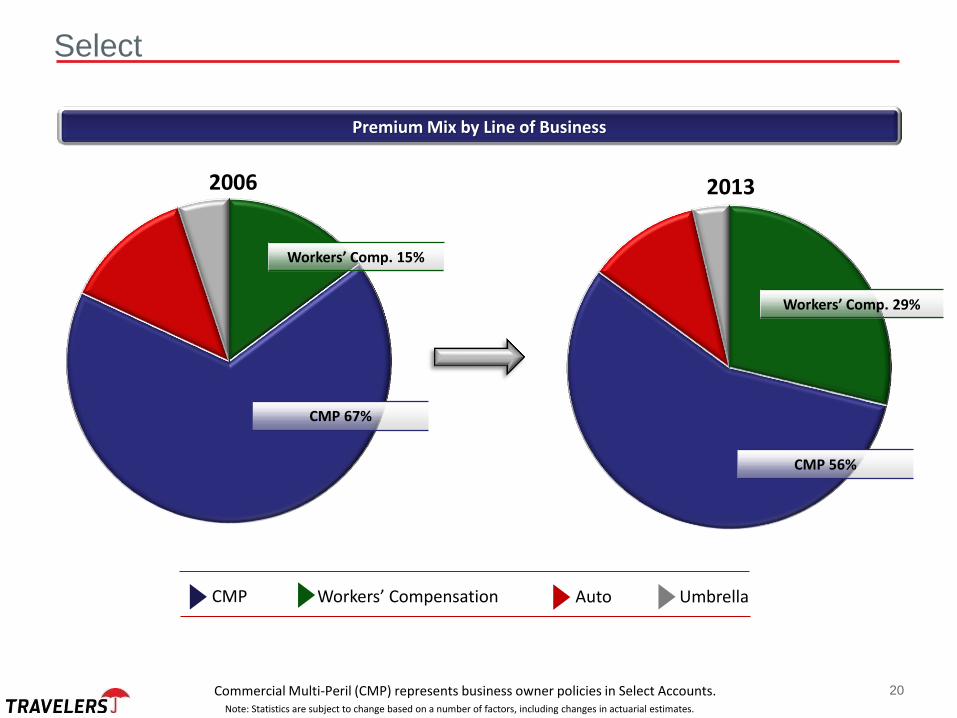
Premium Mix by Line of Business
2006
Workers’ Comp. 15%
19
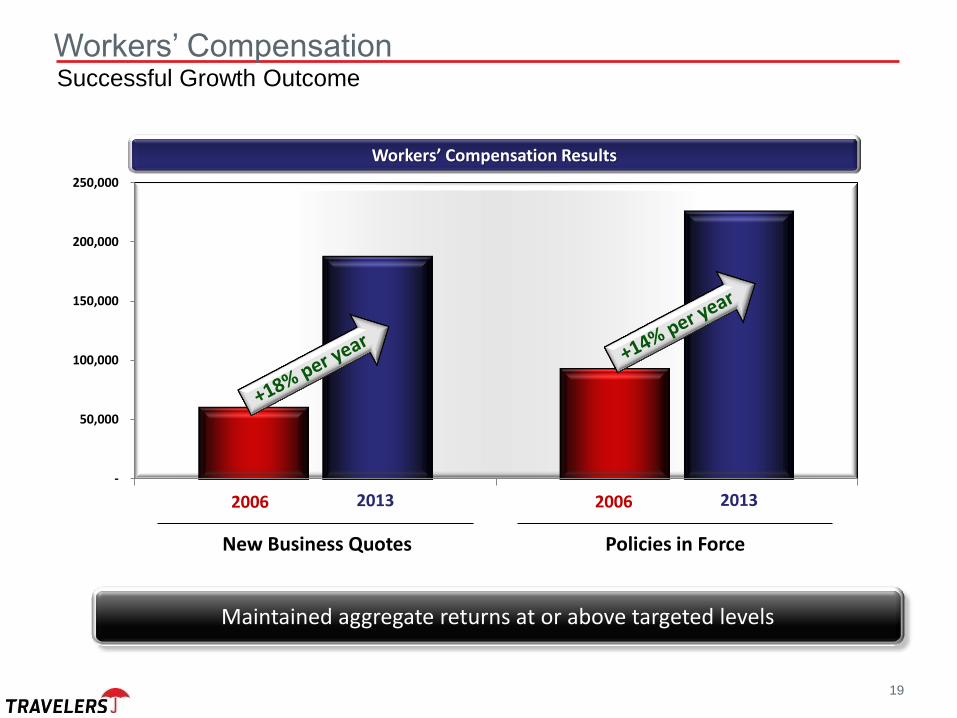
Workers’ Compensation Successful Growth Outcome
Maintained aggregate returns at or above targeted levels
-
50,000
100,000
150,000
200,000
250,000
2006 2013
New Business Quotes
2006 2013
Policies in Force
Workers’ Compensation Results
Workers’ Compensation
20
Workers’ Comp. 15%
Workers’ Comp. 29%
Select
Premium Mix by Line of Business
CMP 67%
CMP 56%
2006 2013
Note: Statistics are subject to change based on a number of factors, including changes in actuarial estimates.
Auto Umbrella CMP
Commercial Multi-Peril (CMP) represents business owner policies in Select Accounts.
21
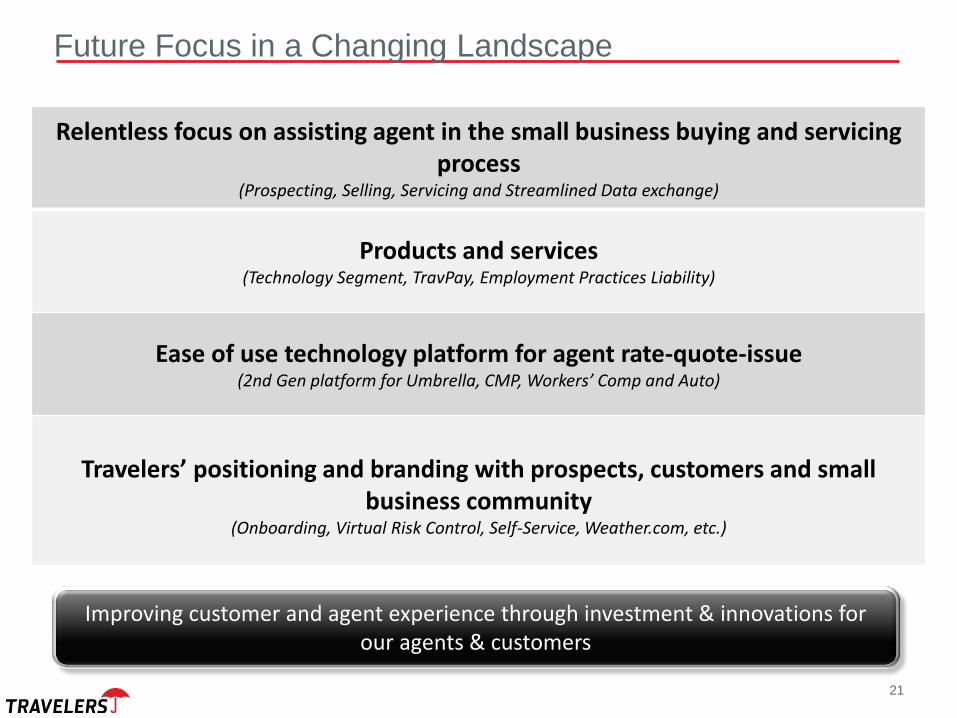
Relentless focus on assisting agent in the small business buying and servicing process
(Prospecting, Selling, Servicing and Streamlined Data exchange)
Products and services (Technology Segment, TravPay, Employment Practices Liability)
Ease of use technology platform for agent rate-quote-issue (2nd Gen platform for Umbrella, CMP, Workers’ Comp and Auto)
Travelers’ positioning and branding with prospects, customers and small
business community (Onboarding, Virtual Risk Control, Self-Service, Weather.com, etc.)
Future Focus in a Changing Landscape
Improving customer and agent experience through investment & innovations for our agents & customers

22
• Committed to small businesses by supporting American Express’ Small Business Saturday®
• Drive sales into locally owned businesses and assist our agents to encourage small business customers to participate.
Small Business Advocacy
Travelers stewardship for the small business owner
• Thirteen “Small Business - Big Opportunity” Symposia across the country.
• Discuss access to capital, business continuity planning, cyber risks, and regulatory relief.
• Partners include The Kauffman Foundation, Regional Federal Reserve Banks (Dallas, Boston, Pittsburgh) and The New York Stock Exchange.
23
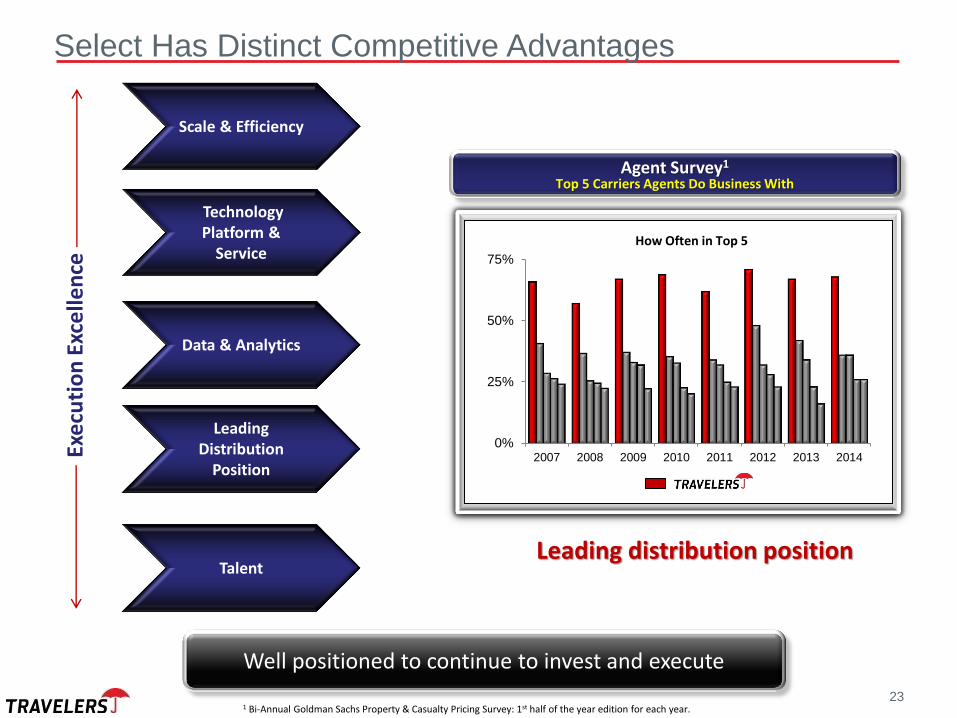
Select Has Distinct Competitive Advantages
Scale & Efficiency
Technology Platform &
Service
Data & Analytics
Leading Distribution
Position
Talent
Well positioned to continue to invest and execute
0%
25%
50%
75%
2007 2008 2009 2010 2011 2012 2013 2014
How Often in Top 5
Agent Survey1
Top 5 Carriers Agents Do Business With
Leading distribution position
Exe
cuti
on
Exc
elle
nce
1 Bi-Annual Goldman Sachs Property & Casualty Pricing Survey: 1st half of the year edition for each year.

75 Additional Information Additional Information
The Travelers Companies, Inc.

Executive Vice President & President, Personal Insurance
76
Greg Toczydlowski
2014 Investor Day June 6, 2014
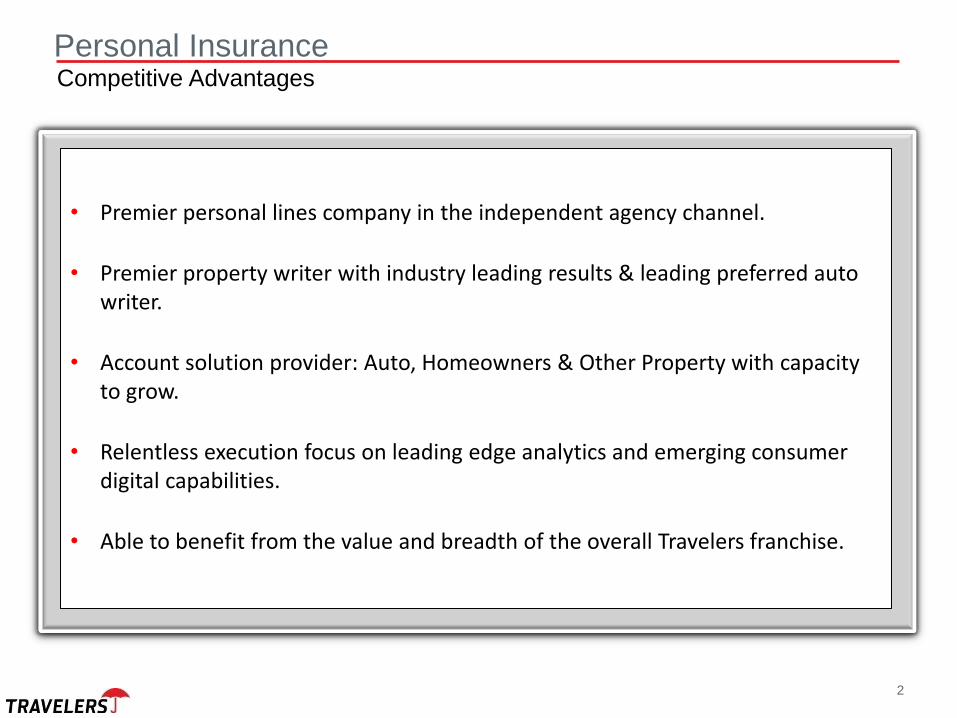
• Premier personal lines company in the independent agency channel.
• Premier property writer with industry leading results & leading preferred auto writer.
• Account solution provider: Auto, Homeowners & Other Property with capacity to grow.
• Relentless execution focus on leading edge analytics and emerging consumer digital capabilities.
• Able to benefit from the value and breadth of the overall Travelers franchise.
Personal Insurance Competitive Advantages
2
3
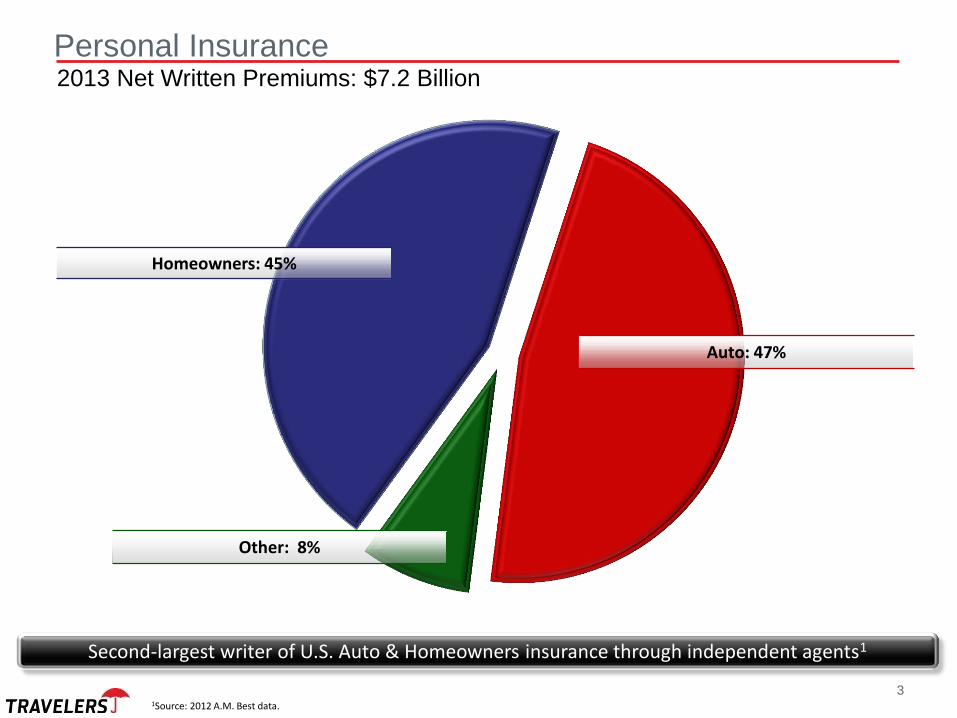
Auto: 47%
Other: 8%
Homeowners: 45%
1Source: 2012 A.M. Best data.
Personal Insurance 2013 Net Written Premiums: $7.2 Billion
Second-largest writer of U.S. Auto & Homeowners insurance through independent agents1
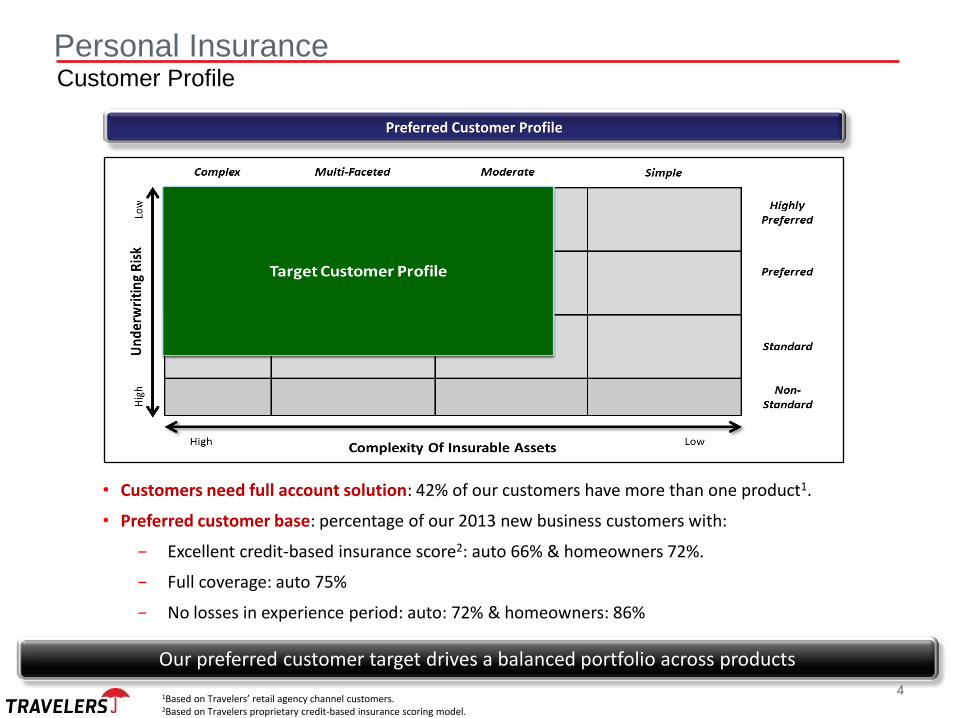
Personal Insurance Customer Profile
Our preferred customer target drives a balanced portfolio across products
Preferred Customer Profile
• Customers need full account solution: 42% of our customers have more than one product1.
• Preferred customer base: percentage of our 2013 new business customers with:
− Excellent credit-based insurance score2: auto 66% & homeowners 72%.
− Full coverage: auto 75%
− No losses in experience period: auto: 72% & homeowners: 86%
4 1Based on Travelers’ retail agency channel customers. 2Based on Travelers proprietary credit-based insurance scoring model.
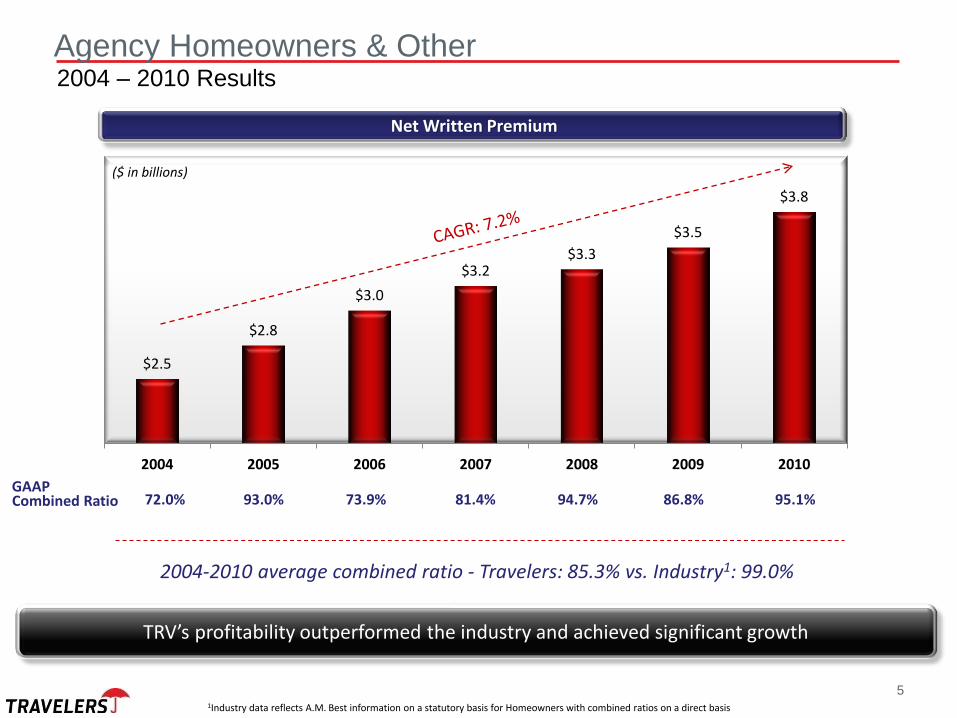
$2.5
$2.8
$3.0
$3.2 $3.3
$3.5
$3.8
$2.0
$2.5
$3.0
$3.5
$4.0
2004 2005 2006 2007 2008 2009 2010
5
Agency Homeowners & Other 2004 – 2010 Results
Net Written Premium
TRV’s profitability outperformed the industry and achieved significant growth
2004-2010 average combined ratio - Travelers: 85.3% vs. Industry1: 99.0%
1Industry data reflects A.M. Best information on a statutory basis for Homeowners with combined ratios on a direct basis
($ in billions)
72.0% 93.0% 73.9% 81.4% 94.7% 86.8% 95.1% Combined Ratio GAAP
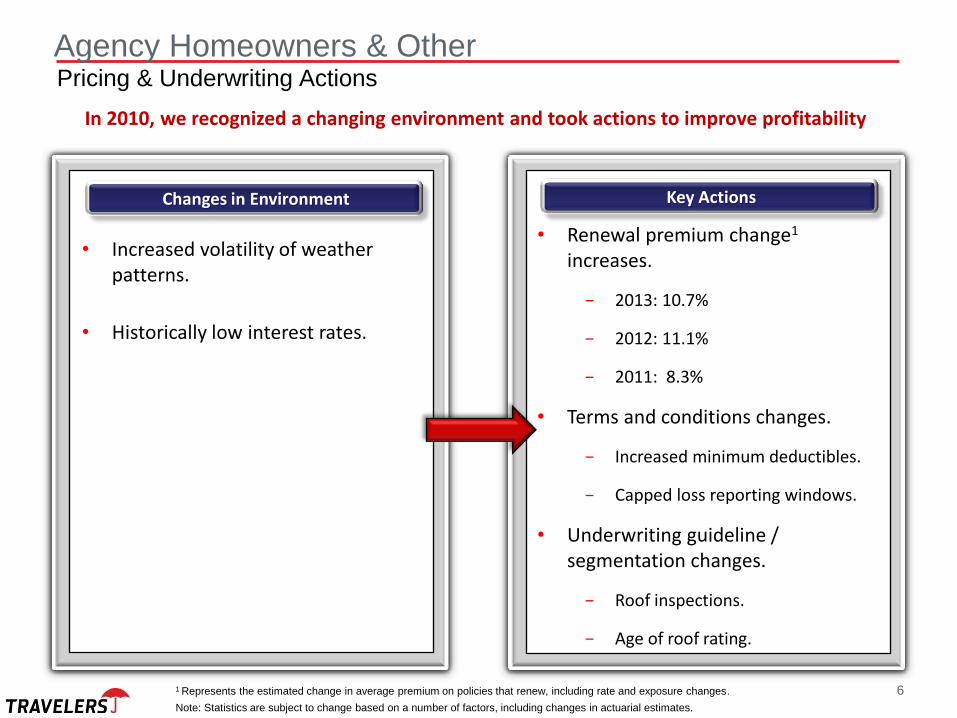
In 2010, we recognized a changing environment and took actions to improve profitability
• Renewal premium change1 increases.
− 2013: 10.7%
− 2012: 11.1%
− 2011: 8.3%
• Terms and conditions changes.
− Increased minimum deductibles.
− Capped loss reporting windows.
• Underwriting guideline / segmentation changes.
− Roof inspections.
− Age of roof rating.
Pricing & Underwriting Actions
• Increased volatility of weather patterns.
• Historically low interest rates.
Agency Homeowners & Other
6
Key Actions Changes in Environment
1 Represents the estimated change in average premium on policies that renew, including rate and exposure changes.
Note: Statistics are subject to change based on a number of factors, including changes in actuarial estimates.
7
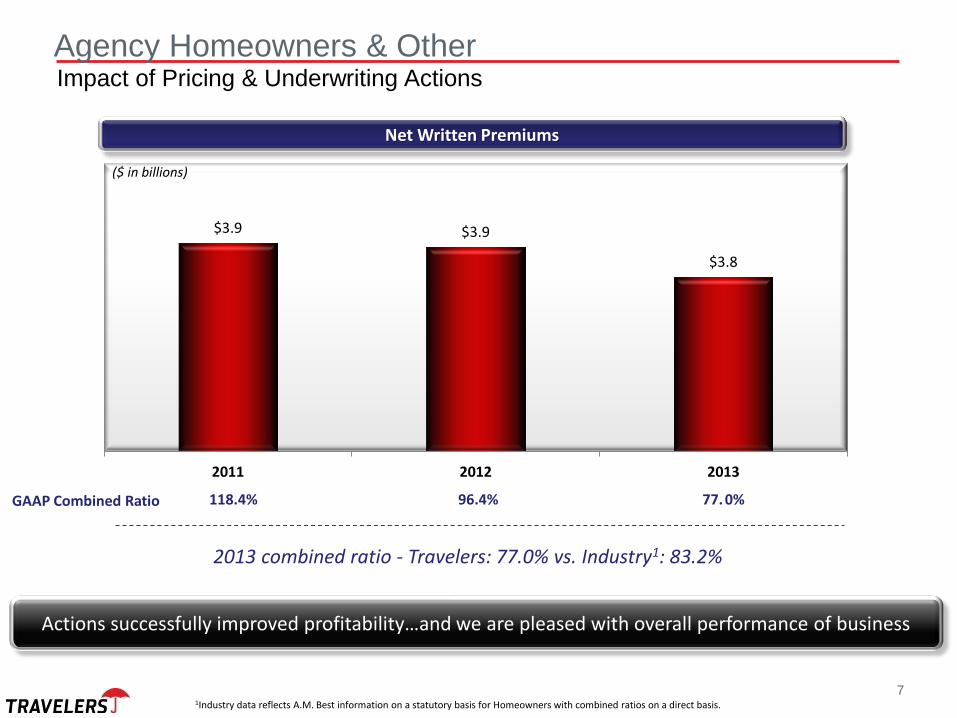
Agency Homeowners & Other Impact of Pricing & Underwriting Actions
$3.9 $3.9
$3.8
$3.2
$3.4
$3.6
$3.8
$4.0
$4.2
2011 2012 2013
Net Written Premiums
Actions successfully improved profitability…and we are pleased with overall performance of business
1Industry data reflects A.M. Best information on a statutory basis for Homeowners with combined ratios on a direct basis.
2013 combined ratio - Travelers: 77.0% vs. Industry1: 83.2%
GAAP Combined Ratio 118.4% 96.4% 77. 0%
($ in billions)
8
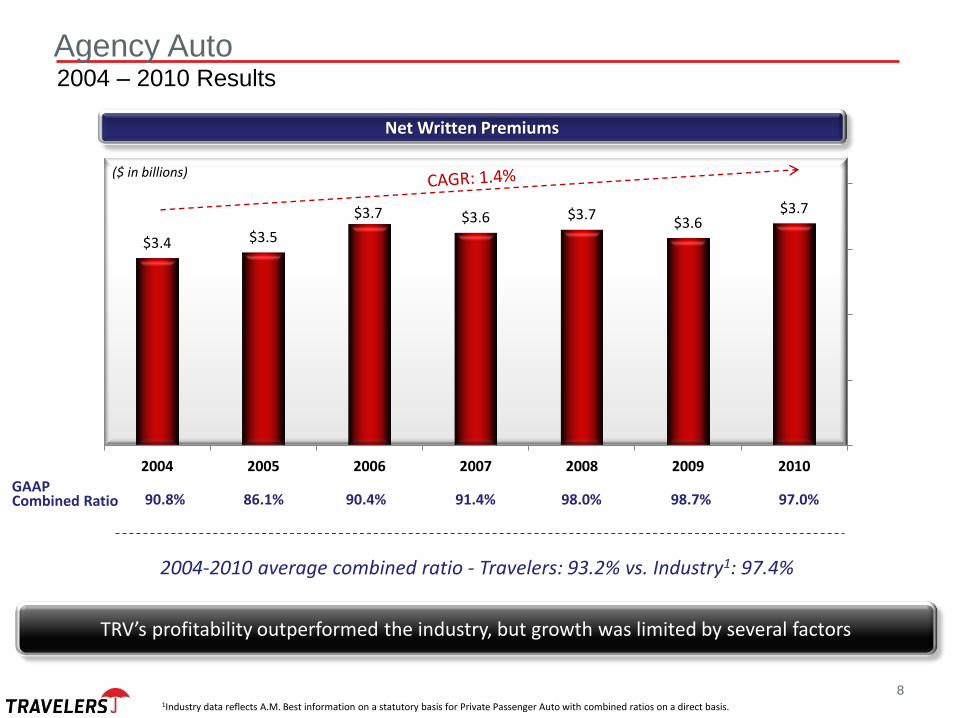
Agency Auto 2004 – 2010 Results
$3.4 $3.5
$3.7 $3.6 $3.7 $3.6
$3.7
$2.0
$2.5
$3.0
$3.5
$4.0
2004 2005 2006 2007 2008 2009 2010
Net Written Premiums
2004-2010 average combined ratio - Travelers: 93.2% vs. Industry1: 97.4%
1Industry data reflects A.M. Best information on a statutory basis for Private Passenger Auto with combined ratios on a direct basis.
TRV’s profitability outperformed the industry, but growth was limited by several factors
Combined Ratio GAAP
90.8% 86.1% 90.4% 91.4% 98.0% 98.7% 97.0%
($ in billions)
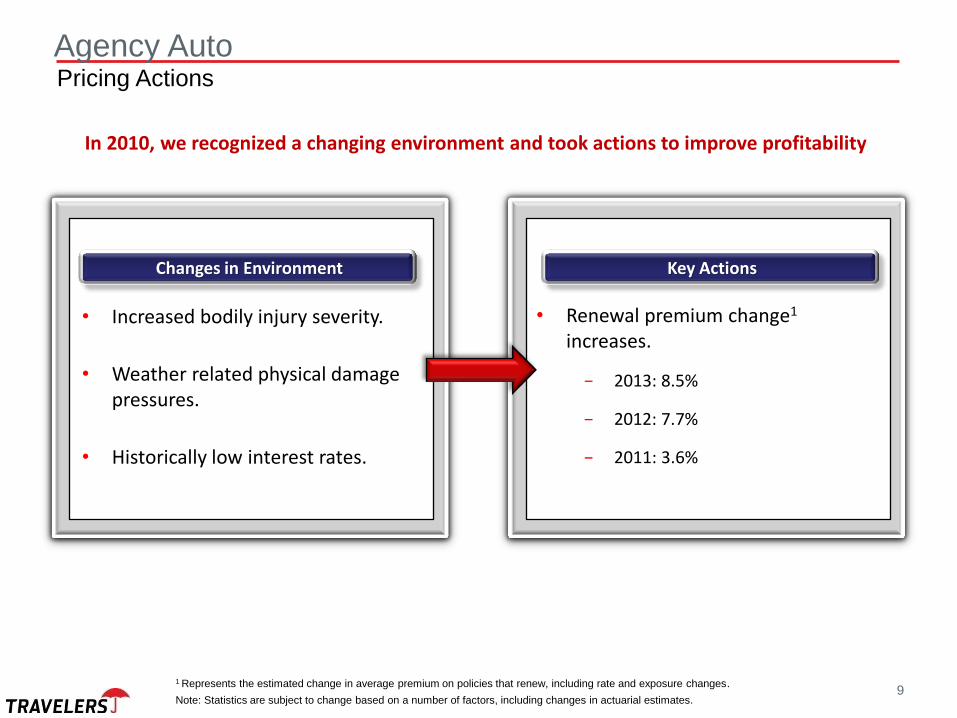
In 2010, we recognized a changing environment and took actions to improve profitability
• Renewal premium change1 increases.
− 2013: 8.5%
− 2012: 7.7%
− 2011: 3.6%
Pricing Actions
• Increased bodily injury severity.
• Weather related physical damage pressures.
• Historically low interest rates.
Agency Auto
9
Key Actions Changes in Environment
1 Represents the estimated change in average premium on policies that renew, including rate and exposure changes.
Note: Statistics are subject to change based on a number of factors, including changes in actuarial estimates.
10
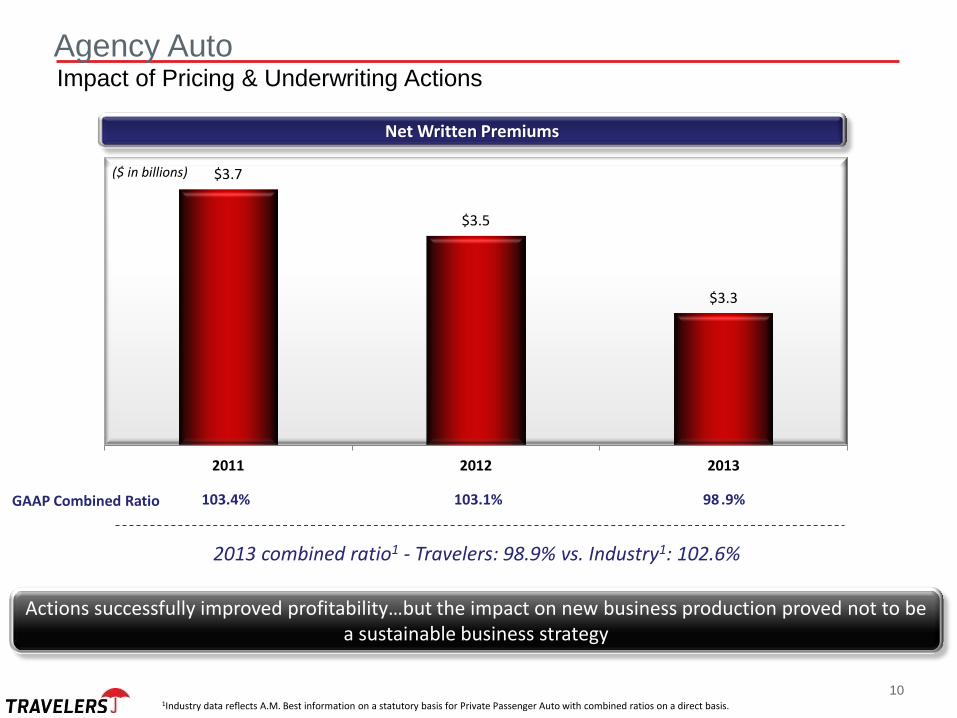
Agency Auto Impact of Pricing & Underwriting Actions
$3.7
$3.5
$3.3
$2.8
$3.2
$3.6
2011 2012 2013
Net Written Premiums
Actions successfully improved profitability…but the impact on new business production proved not to be a sustainable business strategy
1Industry data reflects A.M. Best information on a statutory basis for Private Passenger Auto with combined ratios on a direct basis.
2013 combined ratio1 - Travelers: 98.9% vs. Industry1: 102.6%
($ in billions)
103.4% 103.1% 98 .9% GAAP Combined Ratio
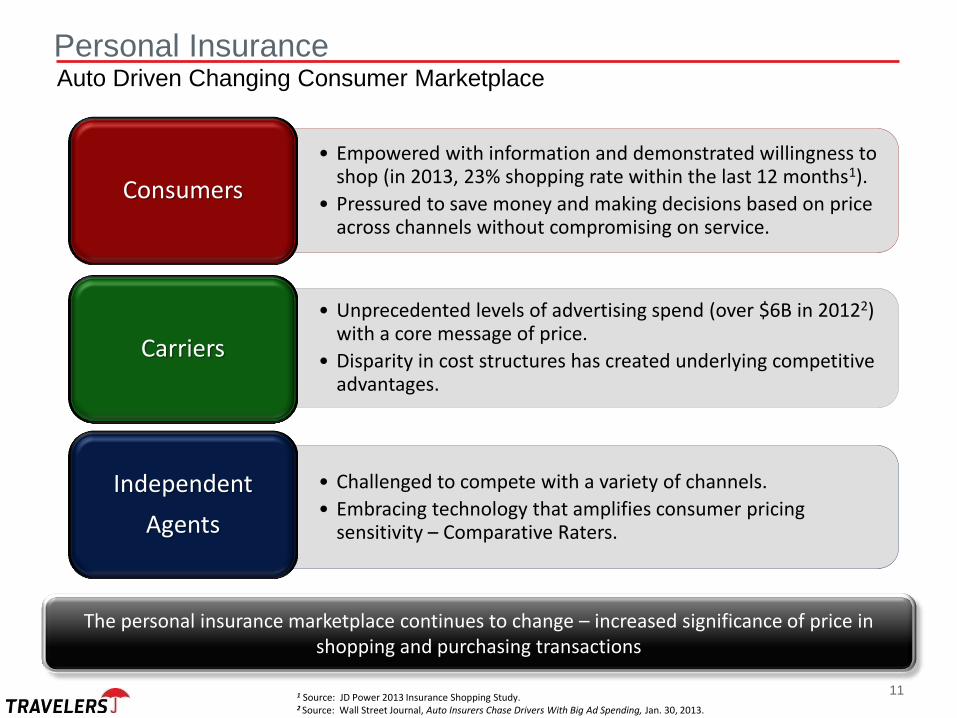
• Empowered with information and demonstrated willingness to shop (in 2013, 23% shopping rate within the last 12 months1).
• Pressured to save money and making decisions based on price across channels without compromising on service.
Consumers
• Unprecedented levels of advertising spend (over $6B in 20122) with a core message of price.
• Disparity in cost structures has created underlying competitive advantages.
Carriers
• Challenged to compete with a variety of channels.
• Embracing technology that amplifies consumer pricing sensitivity – Comparative Raters.
Independent
Agents
1 Source: JD Power 2013 Insurance Shopping Study. 2 Source: Wall Street Journal, Auto Insurers Chase Drivers With Big Ad Spending, Jan. 30, 2013.
Personal Insurance Auto Driven Changing Consumer Marketplace
The personal insurance marketplace continues to change – increased significance of price in shopping and purchasing transactions
11
12
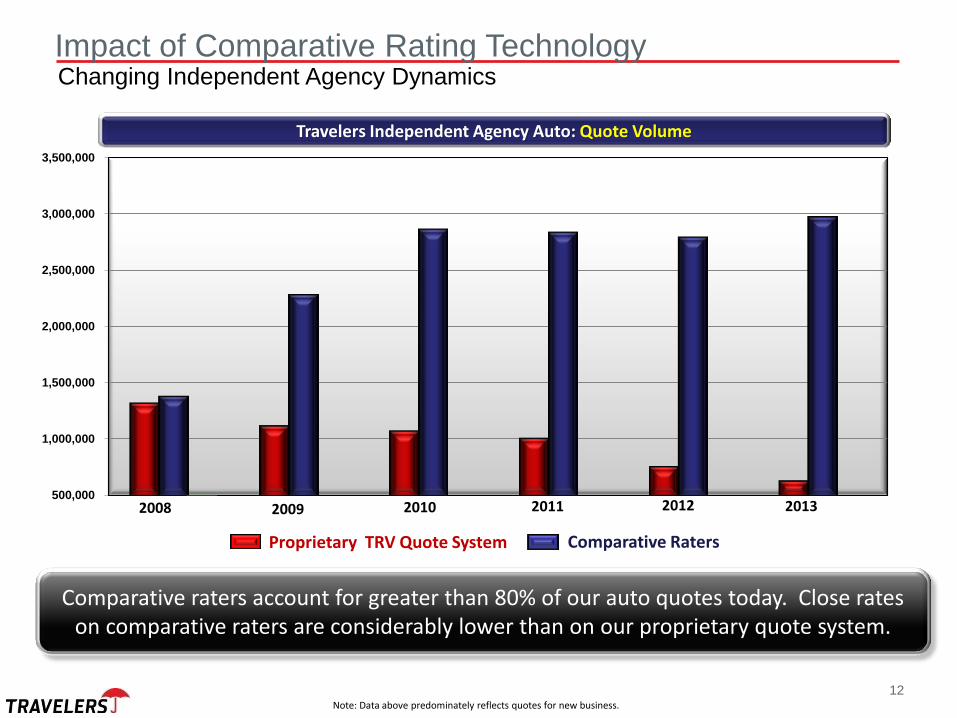
Changing Independent Agency Dynamics Impact of Comparative Rating Technology
500,000
1,000,000
1,500,000
2,000,000
2,500,000
3,000,000
3,500,000
Comparative Raters Proprietary TRV Quote System
2008 2009 2010 2011 2012
Comparative raters account for greater than 80% of our auto quotes today. Close rates on comparative raters are considerably lower than on our proprietary quote system.
Note: Data above predominately reflects quotes for new business.
2013
Travelers Independent Agency Auto: Quote Volume
0%
5%
10%
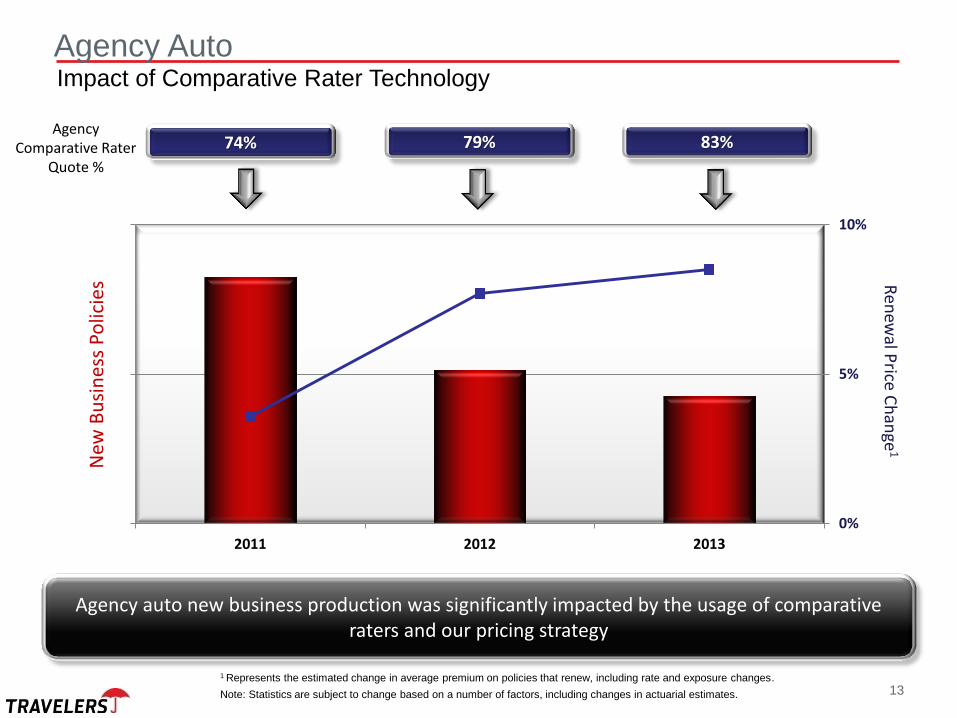
2011 2012 2013
Agency Auto
Impact of Comparative Rater Technology
Agency auto new business production was significantly impacted by the usage of comparative raters and our pricing strategy
74% 79% 83%
Ren
ewal P
rice Ch
ange
1
New
Bu
sin
ess
Polic
ies
Agency Comparative Rater
Quote %
1 Represents the estimated change in average premium on policies that renew, including rate and exposure changes.
Note: Statistics are subject to change based on a number of factors, including changes in actuarial estimates. 13

• Incorporates $140 million in expense reductions.
− Approximately $90 million achieved to date; remaining $50 million planned to be achieved by end of 2014.
− Savings primarily driven by staff reductions.
• Lowers the base commission rate by approximately 2 points.
• Updates underwriting with 8 years of data and experience from Quantum 1.0.
Examples:
− Waive 4th & 5th year minor violations for drivers who have been incident free for 3 years.
− Youthful driver leniency for tenured families.
• Offers new / upgraded features and packages creating value beyond price.
Examples:
− Accident forgiveness
− Loss forgiveness
− Roadside assistance
− New car replacement
Quantum Auto 2.0®
Market Competitive Product
Uniquely positioned in the independent agency channel across our target market with our segmentation and cost model
Redesigned product structure to be responsive to consumer buying patterns
14
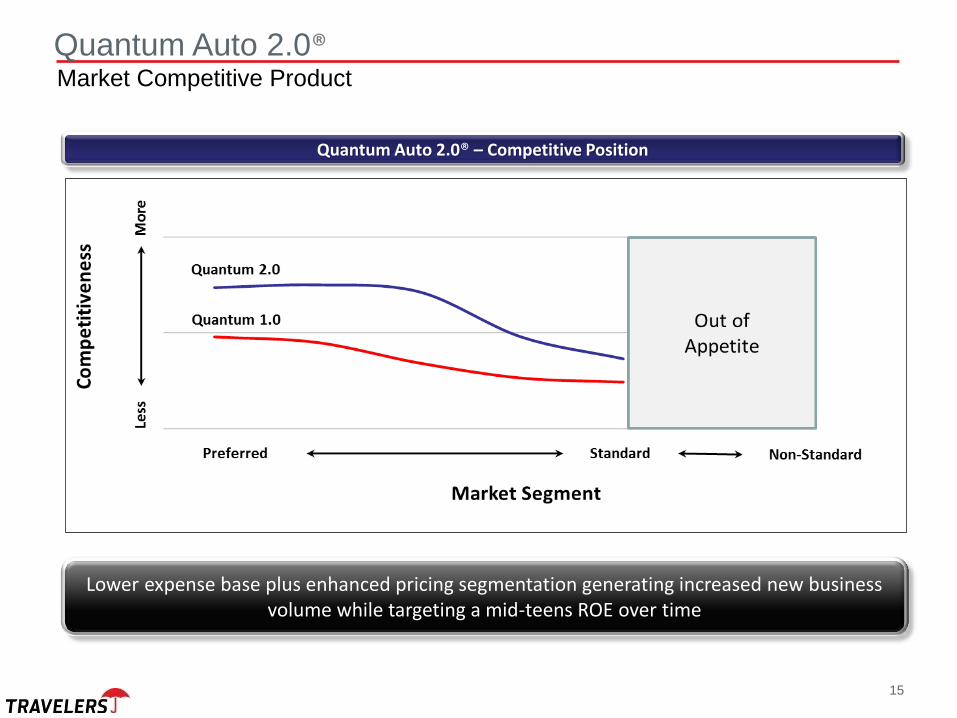
Quantum Auto 2.0®
Quantum Auto 2.0® – Competitive Position
Lower expense base plus enhanced pricing segmentation generating increased new business volume while targeting a mid-teens ROE over time
15
Market Competitive Product
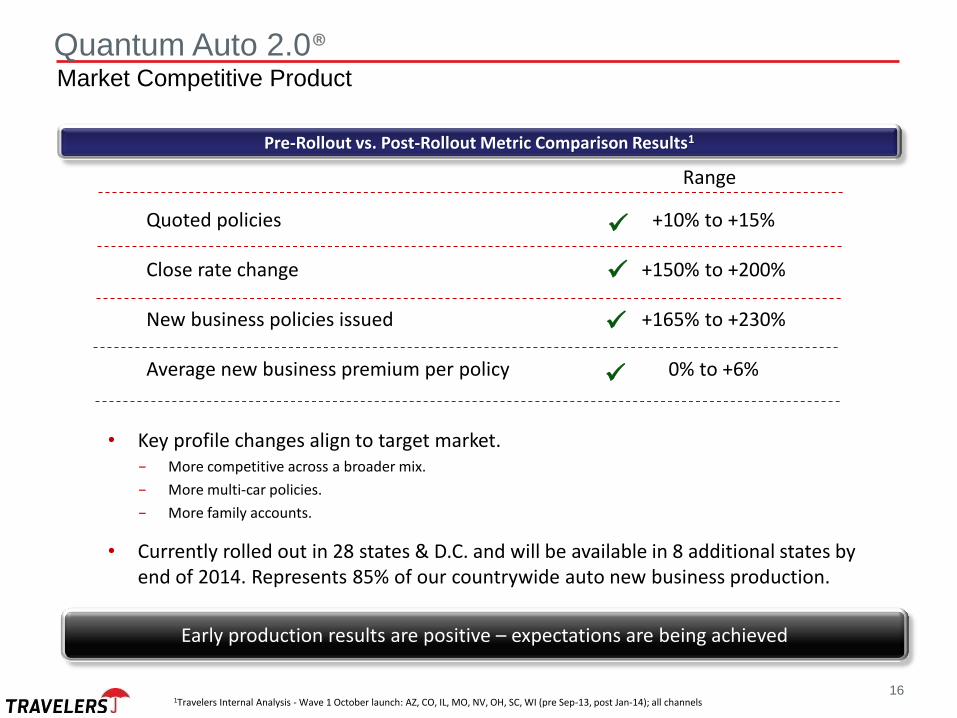
Quoted policies +10% to +15%
Close rate change +150% to +200%
New business policies issued +165% to +230%
Average new business premium per policy 0% to +6%
1Travelers Internal Analysis - Wave 1 October launch: AZ, CO, IL, MO, NV, OH, SC, WI (pre Sep-13, post Jan-14); all channels
• Key profile changes align to target market. − More competitive across a broader mix.
− More multi-car policies.
− More family accounts.
• Currently rolled out in 28 states & D.C. and will be available in 8 additional states by end of 2014. Represents 85% of our countrywide auto new business production.
Quantum Auto 2.0®
Pre-Rollout vs. Post-Rollout Metric Comparison Results1
Early production results are positive – expectations are being achieved
16
Range
Market Competitive Product
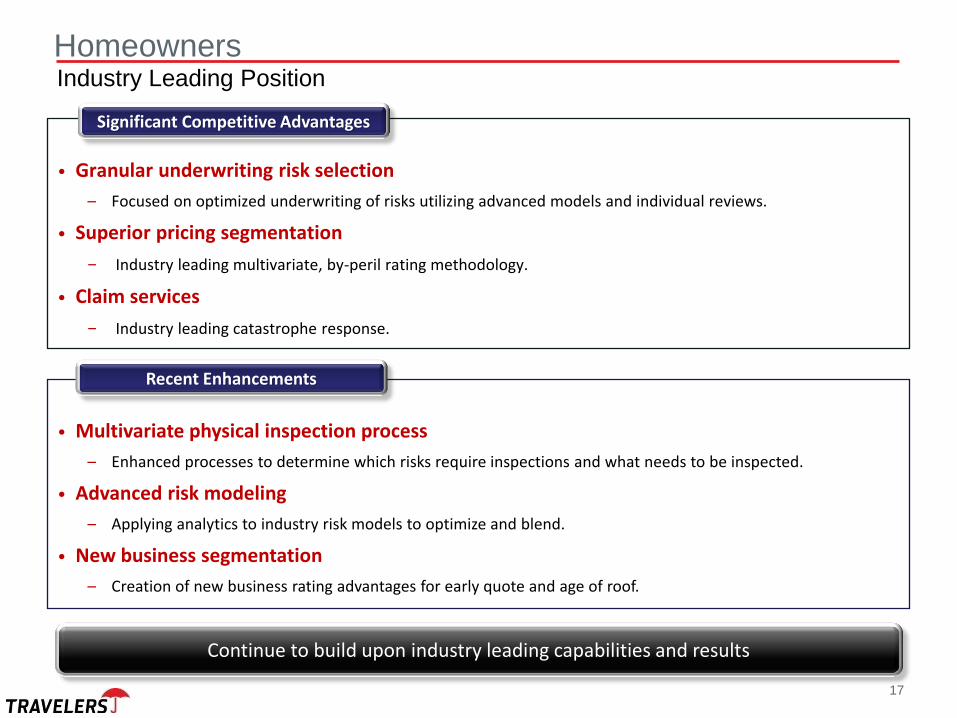
• Granular underwriting risk selection
– Focused on optimized underwriting of risks utilizing advanced models and individual reviews.
• Superior pricing segmentation
− Industry leading multivariate, by-peril rating methodology.
• Claim services
− Industry leading catastrophe response.
• Multivariate physical inspection process
– Enhanced processes to determine which risks require inspections and what needs to be inspected.
• Advanced risk modeling
– Applying analytics to industry risk models to optimize and blend.
• New business segmentation
– Creation of new business rating advantages for early quote and age of roof.
Homeowners
Significant Competitive Advantages
Continue to build upon industry leading capabilities and results
Recent Enhancements
17
Industry Leading Position
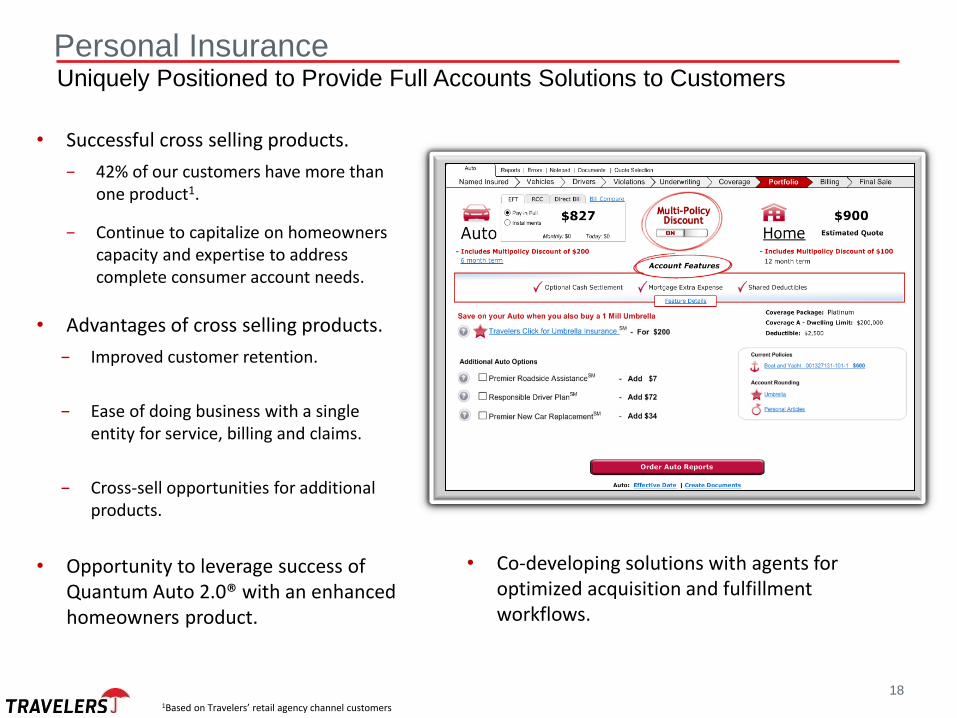
• Successful cross selling products.
− 42% of our customers have more than one product1.
− Continue to capitalize on homeowners capacity and expertise to address complete consumer account needs.
• Advantages of cross selling products.
− Improved customer retention.
− Ease of doing business with a single entity for service, billing and claims.
− Cross-sell opportunities for additional products.
• Opportunity to leverage success of Quantum Auto 2.0® with an enhanced homeowners product.
Personal Insurance
Uniquely Positioned to Provide Full Accounts Solutions to Customers
• Co-developing solutions with agents for optimized acquisition and fulfillment workflows.
18 1Based on Travelers’ retail agency channel customers
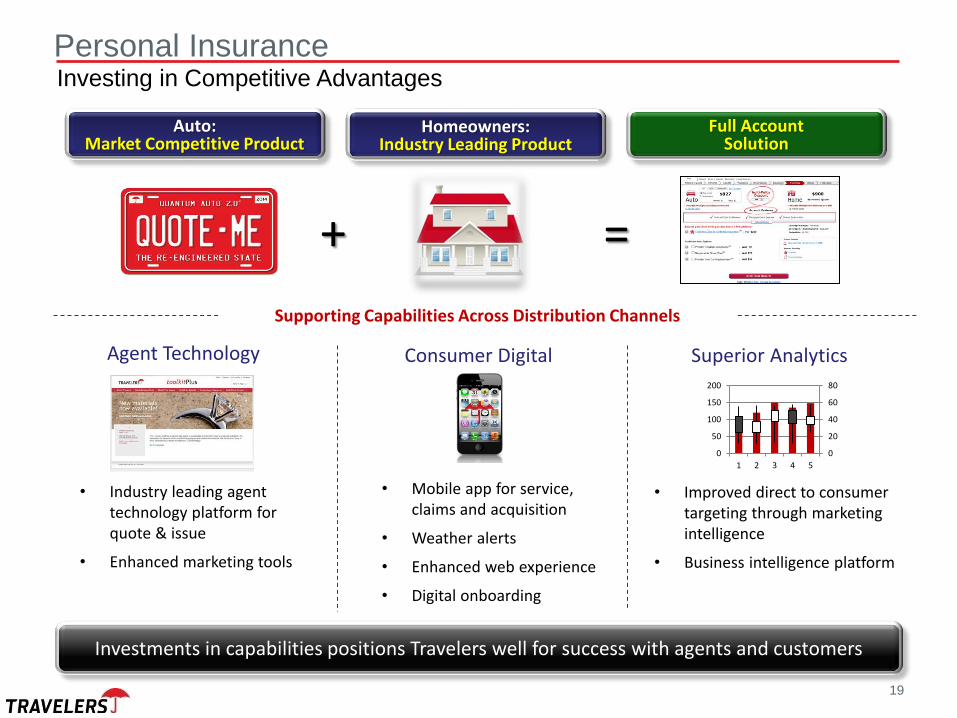
• Mobile app for service, claims and acquisition
• Weather alerts
• Enhanced web experience
• Digital onboarding
• Improved direct to consumer targeting through marketing intelligence
• Business intelligence platform
Superior Analytics Consumer Digital
• Industry leading agent technology platform for quote & issue
• Enhanced marketing tools
Agent Technology
0
20
40
60
80
0
50
100
150
200
1 2 3 4 5
Personal Insurance
Investments in capabilities positions Travelers well for success with agents and customers
Homeowners: Industry Leading Product
Auto: Market Competitive Product
Full Account Solution
Investing in Competitive Advantages
+ =
Supporting Capabilities Across Distribution Channels
19

95 Additional Information Additional Information
The Travelers Companies, Inc.

Chairman & Chief Executive Officer
96
Jay Fishman
2014 Investor Day June 6, 2014
• Premier independent agency company – important for agents’ success.
• Analytical skill. Long history of analytical innovation.
• Focus on granular results.
• Philosophy of volume being a result rather than a goal.
• Large national carrier executing with local expertise.
• Return on capital focus has resulted in top tier returns in P&C industry and financial services industry broadly.
Travelers
2
3
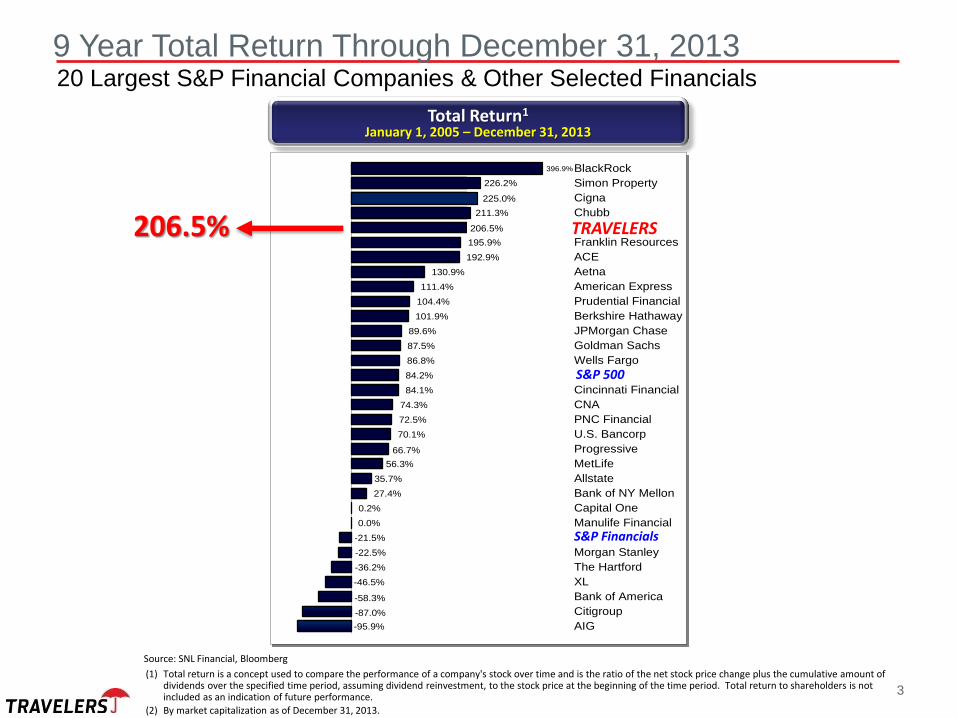
9 Year Total Return Through December 31, 2013 20 Largest S&P Financial Companies & Other Selected Financials
Source: SNL Financial, Bloomberg
(1) Total return is a concept used to compare the performance of a company's stock over time and is the ratio of the net stock price change plus the cumulative amount of dividends over the specified time period, assuming dividend reinvestment, to the stock price at the beginning of the time period. Total return to shareholders is not included as an indication of future performance.
(2) By market capitalization as of December 31, 2013.
Total Return1
January 1, 2005 – December 31, 2013
206.5% 195.9%
192.9%
130.9%
111.4%
104.4%
101.9%
89.6%
87.5%
86.8%
84.2%
84.1%
74.3%
72.5%
70.1%
66.7%
56.3%
35.7%
27.4%
0.2%
0.0%
-21.5%
-22.5%
-36.2%
-46.5%
-58.3%
-87.0%
-95.9%
BlackRock
Simon Property
Cigna
Chubb
Franklin Resources
ACE
Aetna
American Express
Prudential Financial
Berkshire Hathaway
JPMorgan Chase
Goldman Sachs
Wells Fargo
Cincinnati Financial
CNA
PNC Financial
U.S. Bancorp
Progressive
MetLife
Allstate
Bank of NY Mellon
Capital One
Manulife Financial
Morgan Stanley
The Hartford
XL
Bank of America
Citigroup
AIG
206.5%
211.3%
225.0%
226.2%
396.9%
TRAVELERS
S&P 500
S&P Financials

99 Additional Information Additional Information
The Travelers Companies, Inc.
100
Annex
2014 Investor Day June 6, 2014
This presentation contains, and management may make, certain “forward-looking statements” within the meaning of the Private Securities Litigation Reform Act of 1995. All statements, other than statements of historical facts, may be forward-looking statements. Words such as “may,” “will,” “should,” “likely,” “anticipates,” “expects,” “intends,” “plans,” “projects,” “believes,” “estimates” and similar expressions are used to identify these forward-looking statements. Examples of our forward-looking statements include statements relating to our future financial condition and operating results, our share repurchase plans, potential margins, potential returns, the sufficiency of our reserves and our strategic initiatives. We caution investors that such statements are subject to risks and uncertainties, many of which are difficult to predict and generally beyond the Company’s control, that could cause actual results to differ materially from those expressed in, or implied by, such forward-looking statements. Some of the factors that could cause actual results to differ include, but are not limited to, the following:
• Catastrophe losses; • Financial market disruption or economic downturn; • Changes to our claims and claim adjustment expense reserves; • The performance of our investment portfolio; • Asbestos and environmental claims and related litigation; • Mass tort claims; • Emerging claim and coverage issues; • Competition, including the impact of competition on our strategic initiatives and new products; • The collectability and availability of reinsurance coverage; • Credit risk we face in insurance operations and investment activities; • The federal, state and international regulatory environment; • A downgrade in our claims-paying or financial strength ratings; • The inability of our insurance subsidiaries to pay dividends to our holding company in sufficient amounts; • Disruptions to our relationships with our independent agents and brokers; • Risks associated with developing new products, including in Personal Insurance, or expanding in targeted markets; • Other changes in tax laws that adversely impact our investment portfolio or operating results; • Risks associated with our use of pricing and capital models; • Limits to the effectiveness of our information technology systems; • Difficulties with our technology, data security and/or outsourcing relationships; • Risks associated with our business outside of the United States, including regulatory risks; • Risks associated with acquisitions, and integration of acquired businesses; • Changes to existing accounting standards; • Limits to the effectiveness of our compliance controls; • Our ability to hire and retain qualified employees; • Company may be unable to protect and enforce its own intellectual property or maybe subject to claims infringing on intellectual property of others; • Losses of or restrictions placed on the use of credit scoring or other underwriting criteria in the pricing and underwriting of insurance products; • Factors impacting the operation of our repurchase plans; and • The company may not achieve the anticipated benefits of its transactions, its new products or its strategic initiativesor complete a transaction that is subject to closing
conditions.
For a more detailed discussion of these factors, see the information under "Risk Factors" and “Management’s Discussion and Analysis of Financial Condition and Results of Operations” in our most recent Form 10-K and Form 10-Q filed with the Securities and Exchange Commission. Our forward-looking statements speak only as of the date of this presentation or as of the date they are made, and we undertake no obligation to update those statements.
2
Explanatory Note
Travelers has organized its businesses into the following reportable business segments:
Business Insurance: The Business Insurance segment offers a broad array of property and casualty insurance and
insurance-related services to its clients primarily in the United States. Business Insurance is organized into the following
six groups, which collectively comprise Business Insurance Core operations: Select Accounts; Commercial Accounts;
National Accounts; Industry-Focused Underwriting including Construction, Technology, Public Sector Services, Oil & Gas
and Agribusiness; Target Risk Underwriting including National Property, Inland Marine, Ocean Marine, Excess Casualty,
Boiler & Machinery and Global Partner Services; and Specialized Distribution including Northland and National
Programs. Business Insurance also includes the Special Liability Group (which manages the company’s asbestos and
environmental liabilities) and the assumed reinsurance and certain other runoff operations, which collectively are
referred to as Business Insurance Other.
Financial, Professional & International Insurance: The Financial, Professional & International Insurance segment
includes surety and financial liability coverages, which primarily use credit-based underwriting processes, as well as
property and casualty products that are primarily marketed on a domestic basis in Canada, the United Kingdom and the
Republic of Ireland, and on an international basis as a corporate member of Lloyd’s. The segment includes the Bond &
Financial Products groups as well as the International group. The International group includes The Dominion of Canada
General Insurance Company, which the company acquired in November 2013 and which writes personal lines and small
commercial insurance business in Canada. In addition, the company owns 49.5% of the common stock of J. Malucelli
Participações em Seguros e Resseguros S.A., its joint venture in Brazil.
Personal Insurance: The Personal Insurance segment writes a broad range of property and casualty insurance covering
individuals’ personal risks. The primary products of automobile and homeowners insurance are complemented by a
broad suite of related coverages.
Description of Reportable Business Segments
3
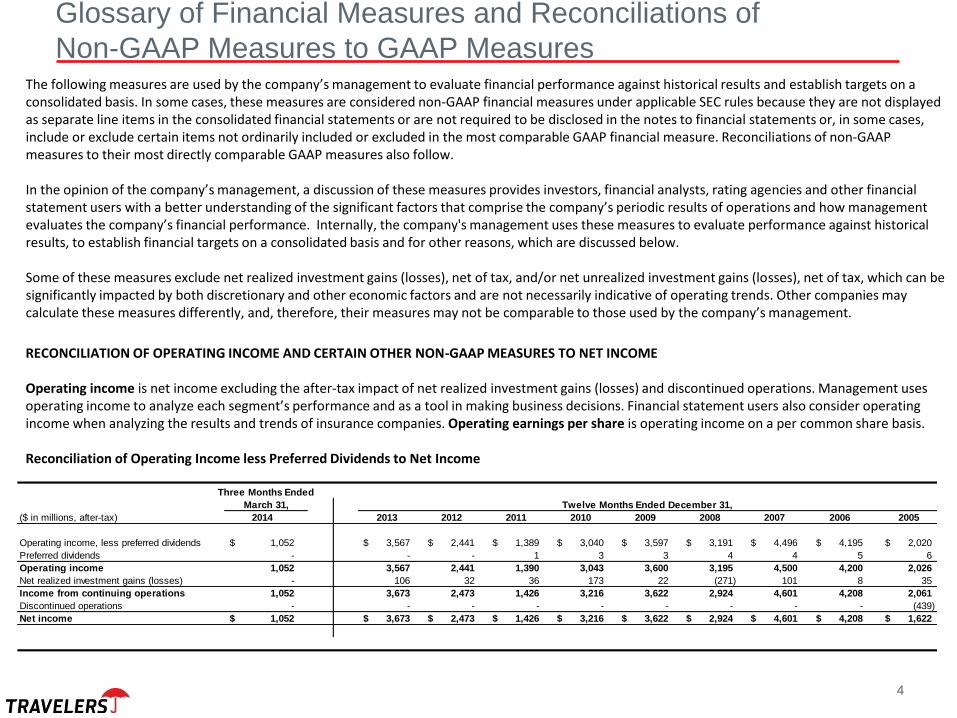
The following measures are used by the company’s management to evaluate financial performance against historical results and establish targets on a consolidated basis. In some cases, these measures are considered non-GAAP financial measures under applicable SEC rules because they are not displayed as separate line items in the consolidated financial statements or are not required to be disclosed in the notes to financial statements or, in some cases, include or exclude certain items not ordinarily included or excluded in the most comparable GAAP financial measure. Reconciliations of non-GAAP measures to their most directly comparable GAAP measures also follow. In the opinion of the company’s management, a discussion of these measures provides investors, financial analysts, rating agencies and other financial statement users with a better understanding of the significant factors that comprise the company’s periodic results of operations and how management evaluates the company’s financial performance. Internally, the company's management uses these measures to evaluate performance against historical results, to establish financial targets on a consolidated basis and for other reasons, which are discussed below. Some of these measures exclude net realized investment gains (losses), net of tax, and/or net unrealized investment gains (losses), net of tax, which can be significantly impacted by both discretionary and other economic factors and are not necessarily indicative of operating trends. Other companies may calculate these measures differently, and, therefore, their measures may not be comparable to those used by the company’s management.
RECONCILIATION OF OPERATING INCOME AND CERTAIN OTHER NON-GAAP MEASURES TO NET INCOME Operating income is net income excluding the after-tax impact of net realized investment gains (losses) and discontinued operations. Management uses operating income to analyze each segment’s performance and as a tool in making business decisions. Financial statement users also consider operating income when analyzing the results and trends of insurance companies. Operating earnings per share is operating income on a per common share basis. Reconciliation of Operating Income less Preferred Dividends to Net Income
4
Glossary of Financial Measures and Reconciliations of
Non-GAAP Measures to GAAP Measures
Three Months Ended
March 31, Twelve Months Ended December 31,
($ in millions, after-tax) 2014 2013 2012 2011 2010 2009 2008 2007 2006 2005
Operating income, less preferred dividends 1,052$ 3,567$ 2,441$ 1,389$ 3,040$ 3,597$ 3,191$ 4,496$ 4,195$ 2,020$
Preferred dividends - - - 1 3 3 4 4 5 6
Operating income 1,052 3,567 2,441 1,390 3,043 3,600 3,195 4,500 4,200 2,026
Net realized investment gains (losses) - 106 32 36 173 22 (271) 101 8 35
Income from continuing operations 1,052 3,673 2,473 1,426 3,216 3,622 2,924 4,601 4,208 2,061
Discontinued operations - - - - - - - - - (439)
Net income 1,052$ 3,673$ 2,473$ 1,426$ 3,216$ 3,622$ 2,924$ 4,601$ 4,208$ 1,622$
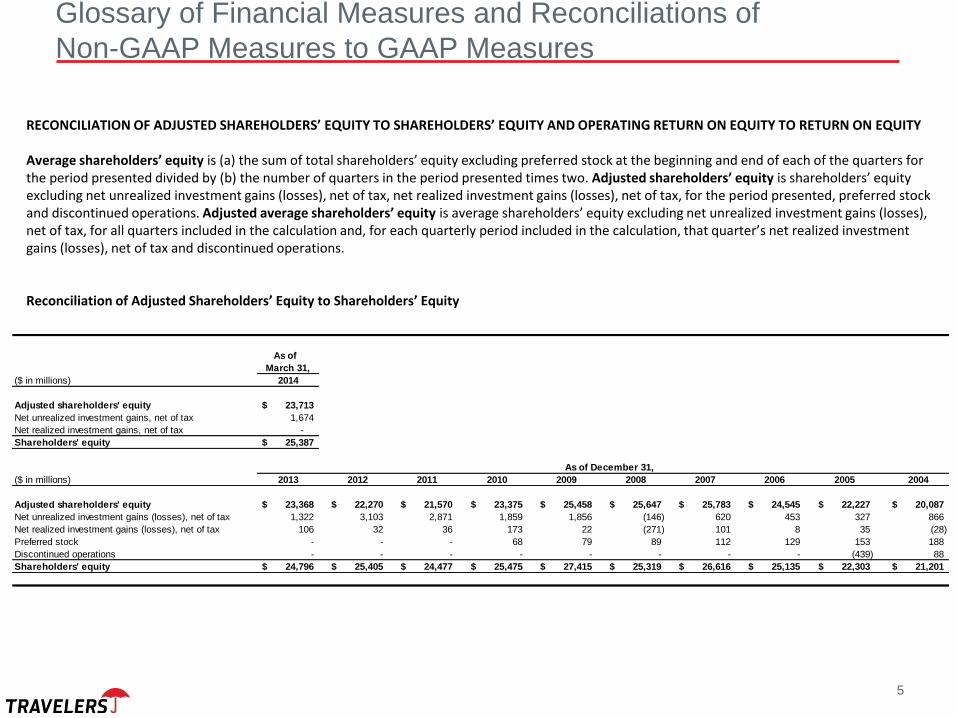
RECONCILIATION OF ADJUSTED SHAREHOLDERS’ EQUITY TO SHAREHOLDERS’ EQUITY AND OPERATING RETURN ON EQUITY TO RETURN ON EQUITY Average shareholders’ equity is (a) the sum of total shareholders’ equity excluding preferred stock at the beginning and end of each of the quarters for the period presented divided by (b) the number of quarters in the period presented times two. Adjusted shareholders’ equity is shareholders’ equity excluding net unrealized investment gains (losses), net of tax, net realized investment gains (losses), net of tax, for the period presented, preferred stock and discontinued operations. Adjusted average shareholders’ equity is average shareholders’ equity excluding net unrealized investment gains (losses), net of tax, for all quarters included in the calculation and, for each quarterly period included in the calculation, that quarter’s net realized investment gains (losses), net of tax and discontinued operations. Reconciliation of Adjusted Shareholders’ Equity to Shareholders’ Equity
Glossary of Financial Measures and Reconciliations of
Non-GAAP Measures to GAAP Measures
5
As of
March 31,
($ in millions) 2014
Adjusted shareholders' equity 23,713$
Net unrealized investment gains, net of tax 1,674
Net realized investment gains, net of tax -
Shareholders' equity 25,387$
As of December 31,
($ in millions) 2013 2012 2011 2010 2009 2008 2007 2006 2005 2004
Adjusted shareholders' equity 23,368$ 22,270$ 21,570$ 23,375$ 25,458$ 25,647$ 25,783$ 24,545$ 22,227$ 20,087$
Net unrealized investment gains (losses), net of tax 1,322 3,103 2,871 1,859 1,856 (146) 620 453 327 866
Net realized investment gains (losses), net of tax 106 32 36 173 22 (271) 101 8 35 (28)
Preferred stock - - - 68 79 89 112 129 153 188
Discontinued operations - - - - - - - - (439) 88
Shareholders' equity 24,796$ 25,405$ 24,477$ 25,475$ 27,415$ 25,319$ 26,616$ 25,135$ 22,303$ 21,201$
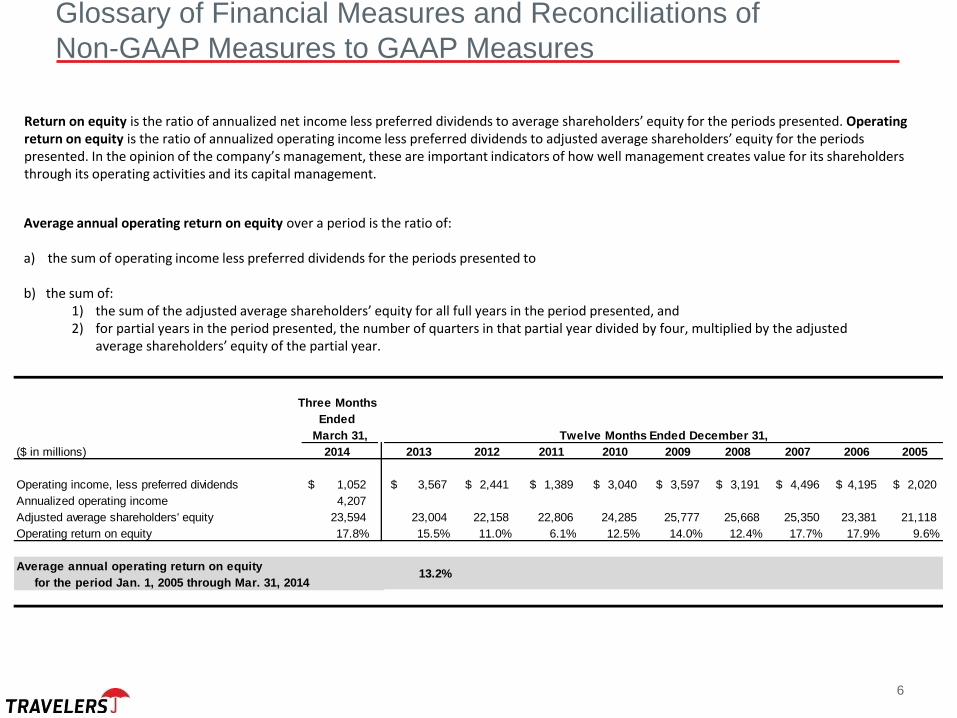
Return on equity is the ratio of annualized net income less preferred dividends to average shareholders’ equity for the periods presented. Operating return on equity is the ratio of annualized operating income less preferred dividends to adjusted average shareholders’ equity for the periods presented. In the opinion of the company’s management, these are important indicators of how well management creates value for its shareholders through its operating activities and its capital management.
Average annual operating return on equity over a period is the ratio of: a) the sum of operating income less preferred dividends for the periods presented to b) the sum of:
1) the sum of the adjusted average shareholders’ equity for all full years in the period presented, and 2) for partial years in the period presented, the number of quarters in that partial year divided by four, multiplied by the adjusted
average shareholders’ equity of the partial year. Calculation of Average Annual Operating Return on Equity from January 1, 2005 through March 31, 2014
Glossary of Financial Measures and Reconciliations of
Non-GAAP Measures to GAAP Measures
6
Three Months
Ended
March 31, Twelve Months Ended December 31,
($ in millions) 2014 2013 2012 2011 2010 2009 2008 2007 2006 2005
Operating income, less preferred dividends 1,052$ 3,567$ 2,441$ 1,389$ 3,040$ 3,597$ 3,191$ 4,496$ 4,195$ 2,020$
Annualized operating income 4,207
Adjusted average shareholders' equity 23,594 23,004 22,158 22,806 24,285 25,777 25,668 25,350 23,381 21,118
Operating return on equity 17.8% 15.5% 11.0% 6.1% 12.5% 14.0% 12.4% 17.7% 17.9% 9.6%
Average annual operating return on equity
for the period Jan. 1, 2005 through Mar. 31, 201413.2%
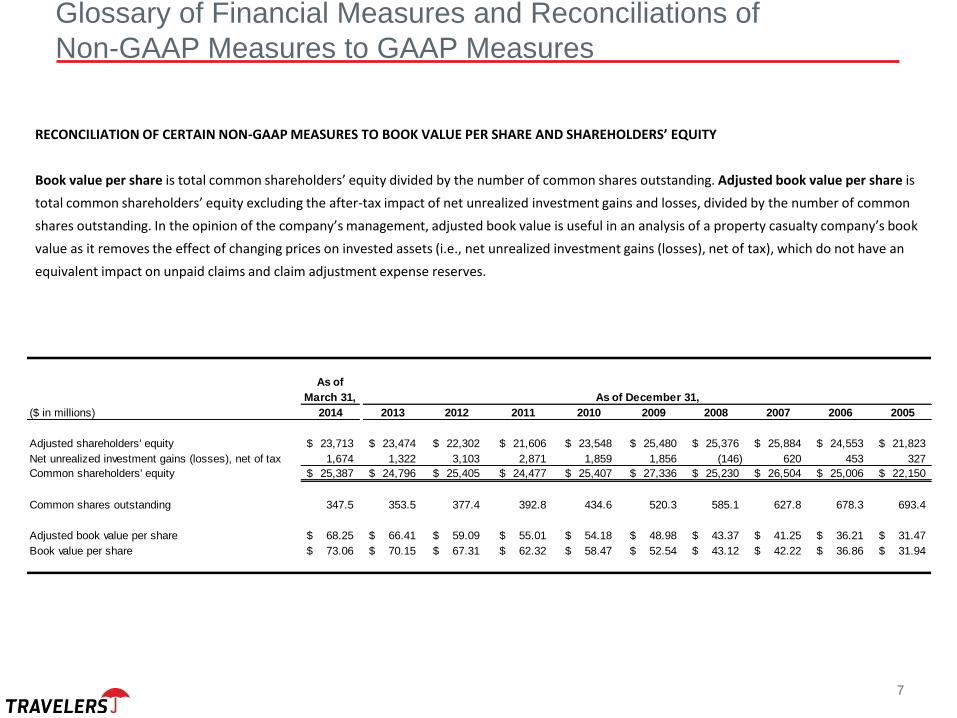
RECONCILIATION OF CERTAIN NON-GAAP MEASURES TO BOOK VALUE PER SHARE AND SHAREHOLDERS’ EQUITY
Book value per share is total common shareholders’ equity divided by the number of common shares outstanding. Adjusted book value per share is
total common shareholders’ equity excluding the after-tax impact of net unrealized investment gains and losses, divided by the number of common
shares outstanding. In the opinion of the company’s management, adjusted book value is useful in an analysis of a property casualty company’s book
value as it removes the effect of changing prices on invested assets (i.e., net unrealized investment gains (losses), net of tax), which do not have an
equivalent impact on unpaid claims and claim adjustment expense reserves.
Glossary of Financial Measures and Reconciliations of
Non-GAAP Measures to GAAP Measures
7
As of
March 31, As of December 31,
($ in millions) 2014 2013 2012 2011 2010 2009 2008 2007 2006 2005
Adjusted shareholders' equity 23,713$ 23,474$ 22,302$ 21,606$ 23,548$ 25,480$ 25,376$ 25,884$ 24,553$ 21,823$
Net unrealized investment gains (losses), net of tax 1,674 1,322 3,103 2,871 1,859 1,856 (146) 620 453 327
Common shareholders' equity 25,387$ 24,796$ 25,405$ 24,477$ 25,407$ 27,336$ 25,230$ 26,504$ 25,006$ 22,150$
Common shares outstanding 347.5 353.5 377.4 392.8 434.6 520.3 585.1 627.8 678.3 693.4
Adjusted book value per share 68.25$ 66.41$ 59.09$ 55.01$ 54.18$ 48.98$ 43.37$ 41.25$ 36.21$ 31.47$
Book value per share 73.06$ 70.15$ 67.31$ 62.32$ 58.47$ 52.54$ 43.12$ 42.22$ 36.86$ 31.94$
OTHER DEFINITIONS
Underwriting gain is net earned premiums and fee income less claims and claim adjustment expenses and insurance-related expenses. In the opinion of the company’s management, it is important to measure the profitability of each segment excluding the results of investing activities, which are managed separately from the insurance business. This measure is used to assess each segment’s business performance and as a tool in making business decisions. Pre-tax underwriting gain, excluding the impact of catastrophes and net favorable prior year loss reserve development, is the underwriting gain adjusted to exclude claims and claim adjustment expenses, reinstatement premiums and assessments related to catastrophes and loss reserve development related to time periods prior to the current year. In the opinion of the company's management, this measure is meaningful to users of the financial statements to understand the company's periodic earnings and the variability of earnings caused by the unpredictable nature (i.e., the timing and amount) of catastrophes and loss reserve development. This measure is also referred to as underlying underwriting margin or underlying underwriting gain. A catastrophe is a severe loss, resulting from natural and man-made events, including risks such as fire, earthquake, windstorm, explosion, terrorism and other similar events. Each catastrophe has unique characteristics, and catastrophes are not predictable as to timing or amount. Their effects are included in net and operating income and claims and claim adjustment expense reserves upon occurrence. A catastrophe may result in the payment of reinsurance reinstatement premiums and assessments from various pools. In the opinion of the company's management, a discussion of the impact of catastrophes is meaningful to users of the financial statements to understand the company’s periodic earnings and the variability in periodic earnings caused by the unpredictable nature of catastrophes. Net favorable (unfavorable) prior year loss reserve development is the increase or decrease in incurred claims and claim adjustment expenses as a result of the re-estimation of claims and claim adjustment expense reserves at successive valuation dates for a given group of claims, which may be related to one or more prior years. In the opinion of the company's management, a discussion of loss reserve development is meaningful to users of the financial statements as it allows them to assess the impact between prior and current year development on incurred claims and claim adjustment expenses, net and operating income (loss), and changes in claims and claim adjustment expense reserve levels from period to period.
Glossary of Financial Measures and Reconciliations of
Non-GAAP Measures to GAAP Measures
8
OTHER DEFINITIONS CONTINUED
Combined ratio (SAP and GAAP) For SAP, it is the sum of the SAP loss and LAE ratio and the SAP underwriting expense ratio as defined in the statutory financial statements required by insurance regulators. The GAAP combined ratio is the equivalent of, and is calculated in the same manner as, the SAP combined ratio except that the SAP underwriting expense ratio is based on net written premium and the GAAP underwriting expense ratio is based on net earned premiums. The loss and LAE ratio for SAP is the ratio of incurred losses and loss adjustment expenses less certain administrative services fee income to net earned premiums as defined in the statutory financial statements required by insurance regulators. The GAAP ratio is calculated in the same manner as the SAP ratio. The underwriting expense ratio for SAP is the ratio of underwriting expenses incurred (including commissions paid), less certain administrative services fee income and billing and policy fees, to net written premiums as defined in the statutory financial statements required by insurance regulators. For GAAP, it is the ratio of underwriting expenses (including the amortization of deferred acquisition costs), less certain administrative services fee income and billing and policy fees, to net earned premiums. The GAAP combined ratio, GAAP loss and LAE ratio, and GAAP underwriting expense ratio are used as indicators of the company’s underwriting discipline, efficiency in acquiring and servicing its business and overall underwriting profitability. A combined ratio under 100% generally indicates an underwriting profit. A combined ratio over 100% generally indicates an underwriting loss. Underlying GAAP combined ratio represents the GAAP combined ratio excluding the impact of net prior year reserve development and catastrophes. In the opinion of the company’s management, this measure is meaningful to users of the financial statements to understand the company’s periodic underwriting profitability and the variability of underwriting profitability caused by the unpredictable nature of catastrophes and loss reserve development. Gross written premiums reflect the direct and assumed contractually determined amounts charged to policyholders for the effective period of the contract based on the terms and conditions of the insurance contract. Net written premiums reflect gross written premiums less premiums ceded to reinsurers. These are GAAP measures.
For the Business Insurance and Financial, Professional and International Insurance segments, retention is the amount of premium available for renewal that was retained, excluding rate and exposure changes. For the Personal Insurance segment, retention is the ratio of the expected number of renewal policies that will be retained throughout the annual policy period to the number of available renewal base policies. For all of the segments, renewal rate change represents the estimated change in average premium on policies that renew, excluding exposure changes. Exposure is the measure of risk used in the pricing of an insurance product. The change in exposure is the amount of change in premium on policies that renew attributable to the change in portfolio risk. Renewal premium change represents the estimated change in average premium on policies that renew, including rate and exposure changes. New business volume is the amount of written premium related to new policyholders and additional products sold to existing policyholders. These are operating statistics, which are subject to change based upon a number of factors, including changes in actuarial estimates. For the Business Insurance segment, retention, renewal premium change and new business volumes exclude National Accounts and Business Insurance-Other.
Glossary of Financial Measures and Reconciliations of
Non-GAAP Measures to GAAP Measures
9
10
Disclosure
In this presentation or in the discussion that follows, we may refer to some non-GAAP financial measures. For a reconciliation of these measures to the most comparable GAAP measures and a glossary of financial measures, we refer you to the Annex of this presentation and our most recent annual report on Form 10-K filed with the Securities and Exchange Commission (SEC). See the “For Investors” section at Travelers.com.
For further information, please see Travelers reports filed with the SEC pursuant to the Securities Exchange Act of 1934 which are available at the SEC’s website (www.sec.gov).
Copies of this presentation and the accompanying webcast are publicly available on the Travelers website (www.travelers.com).
From time to time, Travelers may use its website and/or social media outlets, such as Facebook and Twitter, as distribution channels of material company information. Financial and other important information regarding the company is routinely accessible through and posted on our website at http://investor.travelers.com, our Facebook page at https://www.facebook.com/travelers and our Twitter account (@TRV_Insurance) at https://twitter.com/TRV_Insurance. In addition, you may automatically receive email alerts and other information about Travelers when you enroll your email address by visiting the “Email Alert Service” section at http://investor.travelers.com.

110 Additional Information Additional Information
The Travelers Companies, Inc.