Embed Size (px)
Citation preview
doi.org/10.26434/chemrxiv.13193858.v2
Theoretical Study on Proton Diffusivity in Y-Doped BaZrO3 with RealisticDopant ConfigurationsTakeo Fujii, Kazuaki Toyoura, Tetsuya Uda, Shusuke Kasamatsu
Submitted date: 06/11/2020 • Posted date: 06/11/2020Licence: CC BY-NC-ND 4.0Citation information: Fujii, Takeo; Toyoura, Kazuaki; Uda, Tetsuya; Kasamatsu, Shusuke (2020): TheoreticalStudy on Proton Diffusivity in Y-Doped BaZrO3 with Realistic Dopant Configurations. ChemRxiv. Preprint.https://doi.org/10.26434/chemrxiv.13193858.v2
We theoretically revisit the proton diffusivity in yttrium-doped barium zirconate (Y-doped BaZrO3) with realisticdopant configurations under processing conditions. In a recent study employing the replica exchange MonteCarlo method, the equilibrium Y configurations at typical sintering temperatures were shown to deviate fromthe random configuration assumed in earlier theoretical studies. In the present study, we took this observationinto account and evaluated the effect of the Y configuration on the proton diffusivity. Using the masterequation approach based on local diffusion barriers calculated from first principles, the proton diffusivitiesunder realistic Y configurations were estimated to be higher than those in the random configuration. This isexplained by the fact that realistic Y configurations have fewer trap sites with deep potential wells compared tothe random configuration due to the isolation trend of Y dopants. In addition, the effects of proton-protoninteraction and the abundance of preferential conduction pathways are discussed; it is found that both arerelatively minor factors compared to the trap site effect in determining the dependence of the proton diffusivityon the Y configurations.
File list (1)
download fileview on ChemRxivMS_ESI_Fujii_ver1.pdf (1.45 MiB)
1
Theoretical study on proton diffusivity
in Y-doped BaZrO3 with realistic dopant configurations
Takeo Fujii1, Kazuaki Toyoura*,1, Tetsuya Uda1, and Shusuke Kasamatsu**,2
1 Department of Materials Science and Engineering, Kyoto University, Kyoto 606-8501, Japan 2 Academic Assembly (Faculty of Science), Yamagata University, Yamagata 990-8560, Japan
Abstract
We theoretically revisit the proton diffusivity in yttrium-doped barium zirconate (Y-doped
BaZrO3) with realistic dopant configurations under processing conditions. In a recent study employing
the replica exchange Monte Carlo method, the equilibrium Y configurations at typical sintering
temperatures were shown to deviate from the random configuration assumed in earlier theoretical
studies. In the present study, we took this observation into account and evaluated the effect of the Y
configuration on the proton diffusivity. Using the master equation approach based on local diffusion
barriers calculated from first principles, the proton diffusivities under realistic Y configurations were
estimated to be higher than those in the random configuration. This is explained by the fact that realistic
Y configurations have fewer trap sites with deep potential wells compared to the random configuration
due to the isolation trend of Y dopants. In addition, the effects of proton-proton interaction and the
abundance of preferential conduction pathways are discussed; it is found that both are relatively minor
factors compared to the trap site effect in determining the dependence of the proton diffusivity on the
Y configurations.
2
1. Introduction
Acceptor-doped barium zirconate (BaZrO3) with the cubic perovskite structure has both high
proton conductivity and high chemical stability [1-5], which makes it a promising candidate for
electrolytes in various electrochemical devices such as fuel cells and electrolyzers. Yttrium ions (Y3+
ions) are typical dopant species for BaZrO3 [6-8], substituting Zr4+ sites to introduce protons into the
crystal by the charge compensation mechanism. The proton conductivity depends on the Y dopant
concentration xY with a maximum at xY ~ 0.2, where xY is defined as the occupancy of Y dopants on
Zr sites, i.e., BaZr1-xYYxY
O3-δ [8].
The atomic-scale picture of the proton conduction mechanism in acceptor-doped BaZrO3 has been
investigated intensively [9-15]. According to experimental reports by nuclear magnetic resonance and
infrared spectroscopies (IR, NMR) [9,10] and theoretical reports by first-principles calculations [11-
15], protons mainly reside around oxide ions in the crystal to form an OH bond. They migrate over a
long range through rotation around single oxide ions (reorientation of the OH bond) and hopping
between adjacent oxide ions. The calculated potential barriers Emig of the proton rotation and hopping
in the dopant-free crystal are reported to be 0.17 eV and 0.25 eV, respectively [16], meaning that the
rate-determining step is the proton hopping in the case of negligible dopant-proton interaction.
The interaction between Y dopants and protons (Y-H interaction) is, however, a key factor
governing the proton conductivity in Y-doped BaZrO3. The negative formal charge of Y dopants on Zr
sites stabilizes protons due to electrostatic attraction, leading to reduced proton diffusivity. This effect
3
is called proton trapping in general. Yamazaki et al. extracted the proton migration energy, Ea, and the
association energy between protons and Y dopants, Eas, from the temperature dependence of the proton
diffusivity by simply assuming two types of protons in the crystal, i.e., free and trapped protons [17].
The reported Ea and Eas are 16 kJ/mol (0.17 eV) and 29 kJ/mol (0.30 eV) in BaZr0.8Y0.2O3–,
respectively.
The above simple assumption is a good approximation for dilute-dopant systems, e.g., xY ≤ 0.01,
but the interaction between dopants and protons should be more complicated in highly doped systems.
Toyoura et al. theoretically clarified the detailed interaction between Y dopants and protons by
evaluating the potential barriers of proton rotation and hopping under various local Y configurations
using first-principles calculations [18]. The calculated potential barriers were found to vary
significantly depending on the local Y configuration, ranging from 0.08 eV to 1.08 eV for proton
rotation and from 0.02 eV to 0.56 eV for proton hopping. They also performed diffusion simulations
using the kinetic Monte Carlo method based on the calculated barriers and found that trapping is quite
strong at proton sites surrounded by three Y dopants. The number of such sites increases with dopant
concentration xY in the BaZrO3 crystal, leading to lower proton diffusivity. In addition, Toyoura et al.
clarified that protons in highly doped BaZrO3, e.g., xY ~ 0.2, preferentially migrate along the three-
dimensional (3D) network of Y dopants. The preferential proton conduction partially cancels the strong
trapping effect of densely populated dopants, resulting in a minor reduction of the proton diffusivity
in highly doped BaZrO3. Draber et al. also reported the preferential proton conduction along the Y
4
network as nanoscale percolation [19], where the proton diffusivity was estimated in a similar first-
principles manner to that in Ref. [18]. However, they artificially modified the potential energy surface
of a proton in the crystal as the difference in energy baseline between the trap region and the trap-free
region coinciding with the association energy of single Y and H ions. As a result, the effect of the
preferential conduction was overestimated, leading to the abrupt increase in the proton diffusivity at
the xY threshold of the percolation.
As for Y configurations on Zr sites in BaZr1-xYYxY
O3-δ, Y dopants are assumed to be randomly
distributed in the above studies [17-19]. This simple assumption is only based on the high sintering
temperature of BaZrO3 above 1873 K. In addition, supercells with random distribution of Y-Y pairs
were also employed in one of the previous reports [18] to roughly estimate the association effect of Y
dopants [20] on the proton diffusivity. Kasamatsu et al. have recently reported the thermal equilibrium
configurations of Y dopants and O vacancies in the wide temperature range (600–2500 K), which were
determined by a first-principles thermodynamic sampling simulation based on the replica exchange
Monte Carlo (RXMC) method [21]. They claimed that the Y configuration in Y-doped BaZrO3 does
not reach the random configuration even at the highest temperature, suggesting that the above
assumption concerning the Y configuration in the crystal could be too simple.
In the present study, we revisit, from first principles, the proton diffusivity in Y-doped BaZrO3
focusing on the effect of Y configurations. Specifically, we estimate the proton diffusivities in multiple
supercells reflecting the Y configuration in thermal equilibrium at the sintering temperature. The effect
5
of the deviation from the random Y configuration on the proton diffusivity is discussed by focusing on
local Y configurations around individual proton sites. The effect of proton-proton (H-H) interaction,
which tends to slightly increase the proton diffusivity by the trap-site filling effect in this system [22],
is additionally taken into consideration.
2. Computational methodology
2.1 Y configurations
As noted above, RXMC sampling of dopant and vacancy configurations were performed in Ref.
[21] by one of the authors. The sampling was performed within a 3×3×3 cubic perovskite supercell at
varying Y concentrations (xY = 0.07, 0.15, 0.22, 0.30) and at 16 temperatures between T = 600 K and
T = 2500 K. The calculations were repeated twice,s resulting in two independent equilibrium
ensembles of 1400 configurations for each (xY, T) pair. It should be noted that the 3×3×3 supercells do
not allow for consideration of Y agglomeration beyond pairs at xY = 0.07, because the low
concentration corresponds to the 3×3×3 supercell with only two Y ions.
In principle, we can perform proton diffusivity calculations while keeping the Y positions fixed
on each of the 1400×2 Y configurations at given (xY, T); the results may then be averaged to obtain
the proton diffusivity vs. (xY, T), where T can be considered the sintering temperature which determines
the Y configuration (to emphasize this point, we will denote the processing temperature as Tsinter
hereafter). However, we found significant finite size effects when performing diffusivity calculations
6
using the master equation approach (Sec. 2.2) in the 3×3×3 supercell. Thus, we decided to generate
9×9×9 supercell models designed to incorporate the cation-cation correlations of all 1400
configurations in each (xY, Tsinter) ensemble. To achieve this, we borrowed the idea from the generation
of special quasirandom structures (SQS) [23], which tries to approximate as well as possible the
completely random state within a limited supercell size. Instead of the usual SQS generation procedure
which searches for a configuration that matches the correlation functions calculated for the completely
random state, we match our supercell model with the average 2, 3, and 4-body correlation functions of
the 1400 structures in each (xY, Tsinter) ensemble. We employed the mcsqs code [24], originally
developed for SQS generation, to perform the matching using a Monte Carlo procedure. Since the
resulting configuration depends somewhat on the initial state used in the Monte Carlo procedure, we
performed 36 independent mcsqs runs for each (xY, Tsinter). This was repeated twice corresponding to
the two independent RXMC runs in Ref. [21]. This means that 72 supercell models consisting of 9×9×9
unit cells were prepared for each (xY, Tsinter) pair to be used in diffusivity calculations.
In this work, we performed diffusivity calculations on Y configurations at Tsinter = 1866 K, which
is a typical sintering temperature, and at Tsinter = 853 K, to examine how the sintering temperature may
affect the Y configuration and thus the proton conductivity (we note that the phase separation into Y-
rich and Y-poor phases around xY ~ 0.1 was reported below 1773 K [25]; this low temperature is chosen
more for the sake of comparison rather than to reproduce to the experimental situation). For
comparison, 72 supercells with random configurations of single Y ions and Y-Y pairs were also
7
prepared by simple random sampling without SQS generation.
2.2 Proton diffusivity
In our previous first-principles study [18], the potential barriers Emig of proton rotation and
hopping in Y-doped BaZrO3 were evaluated by the nudged elastic band method. The calculated Emig
are widely scattered depending on the local Y configuration around the migrating proton, ranging from
0.08 eV to 1.08 eV for proton rotation and from 0.02 eV to 0.56 eV for proton hopping (See ref. [18]
for details). In the present study, the proton jump frequencies in the crystal at a given temperature
were estimated using the reported values according to the following equation,
𝛤 = 𝛤0exp (−Δ𝐸mig
𝑘B𝑇) (1)
where 0 is the vibrational prefactor, kB is the Boltzmann constant, and T is the temperature. 𝛤0 was
set to 10 THz for all rotational and hopping paths, which is a typical value for ionic jumps in crystals
[26-30].
The proton diffusivity was estimated under the independent-particle approximation by solving the
following master equation corresponding to the balance of the existence probability of a single particle
at each site [31,32].
𝜕
𝜕𝑡𝑝𝑖(𝐫, 𝑡) = ∑ [(𝛤𝑗𝑖𝑝𝑗(𝐫 + 𝐬𝑖𝑗 , 𝑡) − 𝛤𝑖𝑗𝑝𝑖(𝐫, 𝑡)]𝑗∈𝐴𝑖
, (2)
where i is the site index in the unit cell (𝑖 = 1,2,⋯ , 𝑛), 𝑝𝑖(𝐫, 𝑡) is the existence probability of the
single particle at site i as a function of position r and time t, 𝐴𝑖 is the set of all adjacent sites to site i,
8
and ij and sij are the jump frequency and jump vector from site i to j, respectively. The first and second
terms in the brackets of equation (2) correspond to the inflow and outflow of the existence probability
at site i, respectively. This equation can easily be solved by performing a Fourier transform 𝑃𝑖(𝐐, 𝑡) =
∫ 𝑝𝑖(𝐫, t) exp(𝑖𝐐𝐫)d𝐫+∞
−∞ with respect to position r. Each element of the diffusion coefficient tensor
D can finally be obtained as the eigenvalue of the n×n jump matrix 𝚲 with elements 𝛬𝑖𝑗 ,
𝛬𝑖𝑗 = 𝛤𝑗𝑖 exp(−𝑖𝐐𝐬𝑖𝑗) − 𝛿𝑖𝑗 ∑ 𝛤𝑖𝑗𝑗∈𝐴𝑖, (3)
where ij is the Kronecker delta. An appropriate Q vector with a small magnitude should be chosen for
estimating each element 𝐷𝑖𝑗. See ref. [33] for details.
The H-H interaction was additionally treated as the modified site blocking effect, meaning that
protons cannot occupy more than one proton site around an oxide ion at the same time (See ref. [22]).
This assumption is based on the relatively strong repulsive interaction between two protons bonding
to the same oxide ion [22]. Specifically, the jump frequency from site i to j was modified by the
probability that another proton occupies site j or the other three sites around the same oxide ion as site
j, denoted by 𝑝𝑗OH. A proton at site i can jump into site j with the probability (1 − 𝑝𝑗
OH), leading to
the modified jump frequency (1 − 𝑝𝑗OH)𝛤𝑖𝑗 . The 𝑝𝑗
OH can be estimated easily assuming thermal
equilibrium based on the Fermi-Dirac distribution function. The correlation effect between successive
proton jumps was also taken into consideration for estimating the proton diffusivity. This effect is
attributed to the deviation from the thermal-equilibrium site occupancies at the sites involved in the
previous jumps. In the present study, the proton diffusivity was corrected by estimating the time loss
9
in oscillatory jumps between adjacent sites [22]. The number of protons was set to be equal to the
number of Y dopants in all calculations presented below, and no oxygen vacancies were considered;
this corresponds to the ideal situation of 100% hydration in Y-doped BaZrO3.
3. Results & Discussion
3.1 Proton Diffusivity
The proton diffusivities were evaluated in multiple supercells at several Y concentrations (xY =
0.07, 0.15, 0.22, 0.30), where Y dopants are distributed in four types of configurations, i.e., thermal
equilibrium configurations at 1866 K and 853 K (1866K and 853K), and random configurations of
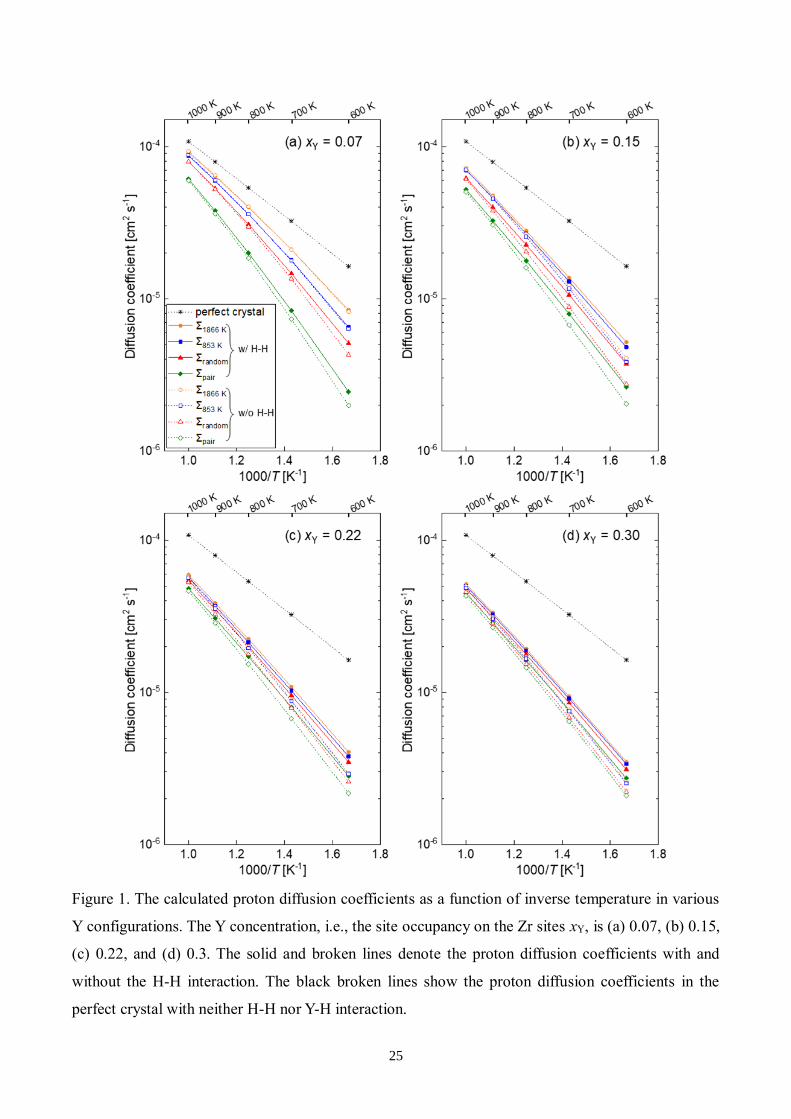
single Y ions and Y-Y pairs (random and pair). The solid lines with solid symbols in Fig. 1 show the
calculated proton diffusion coefficients as a function of inverse temperature. For reference, the
calculated proton diffusion coefficients in the perfect crystal without neither H-H nor Y-H interactions
(the ideal noninteracting model) are also shown by the black broken lines. In this temperature range,
the proton diffusivities in the supercells with Y configurations in thermal equilibrium at 1866 K and
853 K (1866K and 853K) are higher than those in the case of the random configuration of Y dopants
(random). This trend is understandable considering the repulsive interaction between Y dopants in
thermal equilibrium at the two temperatures [21]. The repulsive interaction enhances Y-dopant
isolation in 1866K and 853K, leading to the opposite deviation from the proton diffusivity in random to
10
that in pair with Y-dopant association. The isolation trend of Y dopants gradually decays with
increasing Y concentration (xY), resulting in less dependence of the proton diffusivity on Y
configurations at higher xY.
The above explanation provides a qualitative understanding of the dependence of the proton
diffusivity on Y configurations, i.e., enhanced Y isolation leads to higher diffusivity in 1866K and 853K
compared to random. In the following subsections, we discuss the microscopic origin of the enhanced
proton diffusivity through a quantitative comparison of the differences in three factors governing the
proton diffusivity, i.e. Y-H interaction (proton trapping), preferential conduction (percolation), and H-
H interaction (trap-site filling & carrier blocking), between the four types of Y configurations. Since
the H-H interaction has a minor effect on the proton diffusivity, the minor interaction is first discussed
in Sec. 3.2, and is neglected for the subsequent detailed discussion on the other two factors, i.e., Y-H
interaction and preferential conduction, in Secs. 3.3 and 3.4.
3.2 H-H interaction
First, we evaluate the effect of H-H interaction by comparing the proton diffusivities with and
without the H-H interactions. According to the literature [22], the H-H interaction causes two
competing effects, carrier blocking and trap-site filling. Carrier blocking has a negative impact on
diffusivity due to protons interfering with the movements of other protons. Trap-site filling, on the
other hand, has a positive effect: trap sites with low potential energies are occupied by a portion of the
11
protons, and this prevents other protons from being trapped in the same trap sites. The broken lines
with open symbols in Fig. 1 show the calculated proton diffusion coefficients without H-H interaction
under the independent-particle approximation. The H-H interaction enhances the proton diffusivity
regardless of Y concentration, indicating that the positive effect of trap-site filling exceeds the negative
one of carrier blocking. The characteristics (i.e., local Y configurations) of the trap sites themselves
will be discussed in Sec. 3.3.
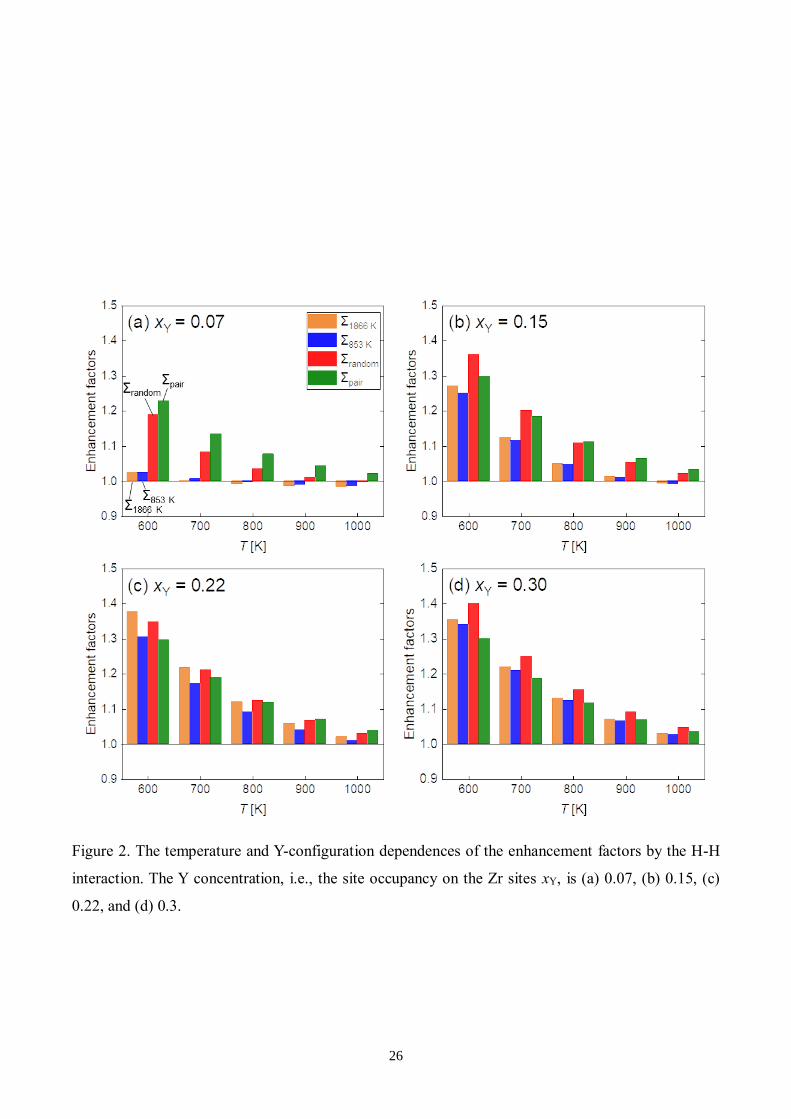
Figure 2 shows the ratios of the calculated diffusion coefficients with and without H-H interaction,
Dw/H-H and Dw/oH-H, at various Y concentrations (xY = 0.07, 0.15, 0.22, 0.30) and temperatures (T = 600,
700, 800, 900, 1000 K), which we call enhancement factors hereafter. The enhancement factor tends
to be higher at lower temperatures; this is reasonable because protons are more likely to occupy trap
sites at lower temperatures, resulting in a more pronounced trap-site filling effect. On the other hand,
the enhancement factor shows little dependence on the Y concentration except for xY = 0.07. This trend
suggests that the increase of the positive effect of trap-site filling is cancelled out by the negative
effects due to the increase in the number of trap sites and the potential well deepening at the trap sites
with increasing Y concentrations. At the lowest Y concentration (xY = 0.07), the enhancement factor is
smaller than those at higher Y concentrations; this can be explained by few trap sites with deep
potential wells surrounded by several Y dopants, resulting in weak trap-site filling effect at xY = 0.07.
Concerning the dependence on the types of Y configurations (1866K, 853K, random, and pair), the
difference is more pronounced at lower Y concentrations. At xY = 0.22 and 0.30, the enhancement
12
factors do not show a clear dependence on Y configurations, while those in 1866K and 853K are
significantly lower than those in random and pair at xY = 0.07 and 0.15. The origin of the difference in
the enhancement factor is the isolation trend of Y dopants in 1866K and 853K; this leads to fewer proton
sites with deep potential wells (again, these sites will be discussed in Sec. 3.3), resulting in a weaker
trap-site filling effect.
The enhancement factor by the H-H interaction is, however, 1.4 at most, and this is a rather minor
effect as highlighted in Fig. 1. That is, the differences between the fully interacting models with Y-
H/H-H interaction and the ideal noninteracting model (solid lines vs. black broken lines in Fig. 1) are
much larger than the change due to H-H interaction (colored solid vs. broken lines in Fig. 1).
Enhancement factors can be significant only when the number of carriers exceeds the number of clearly
defined trap sites with much lower energy than other sites [22]. The low enhancement factors indicate
that this is not the case in Y-doped BaZrO3. Moreover, the dependence on the types of Y configurations
(1866K, 853K, random and pair) is maintained at any Y concentration regardless of the H-H interaction.
Therefore, in the following subsections, the effects of Y-H interaction and preferential conduction are
discussed based on the proton diffusivities without the H-H interactions (broken lines in Fig. 1).
3.3 Y-H interaction
The proton site energies and the potential barriers of proton rotation and hopping are drastically
changed by Y-H interaction, mainly depending on the local configurations of Y dopants. All proton

13
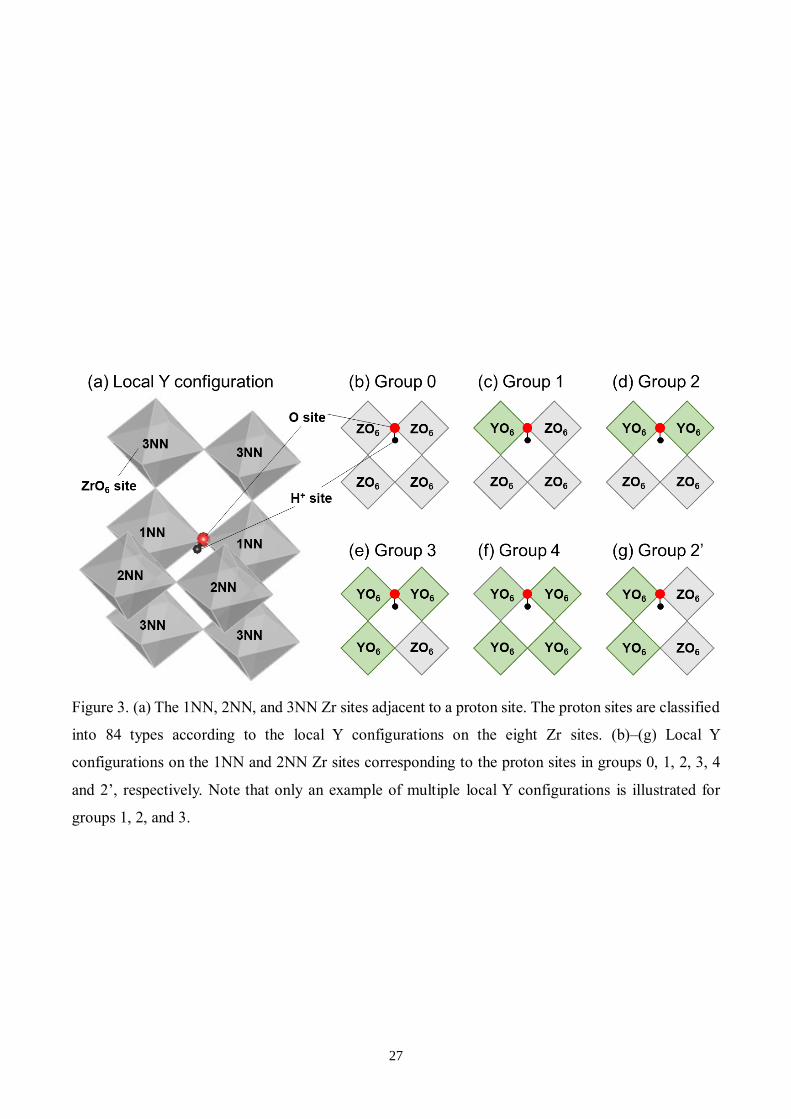
sites in the supercells are therefore classified by the local Y configuration as in our previous study [18].
Specifically, all proton sites are classified into 84 types by the Y configuration on the eight Zr sites
adjacent to a proton site, i.e., the first-, second-, and third-nearest-neighbor Zr sites (1NN, 2NN, and
3NN Zr sites), shown in Fig. 3(a).
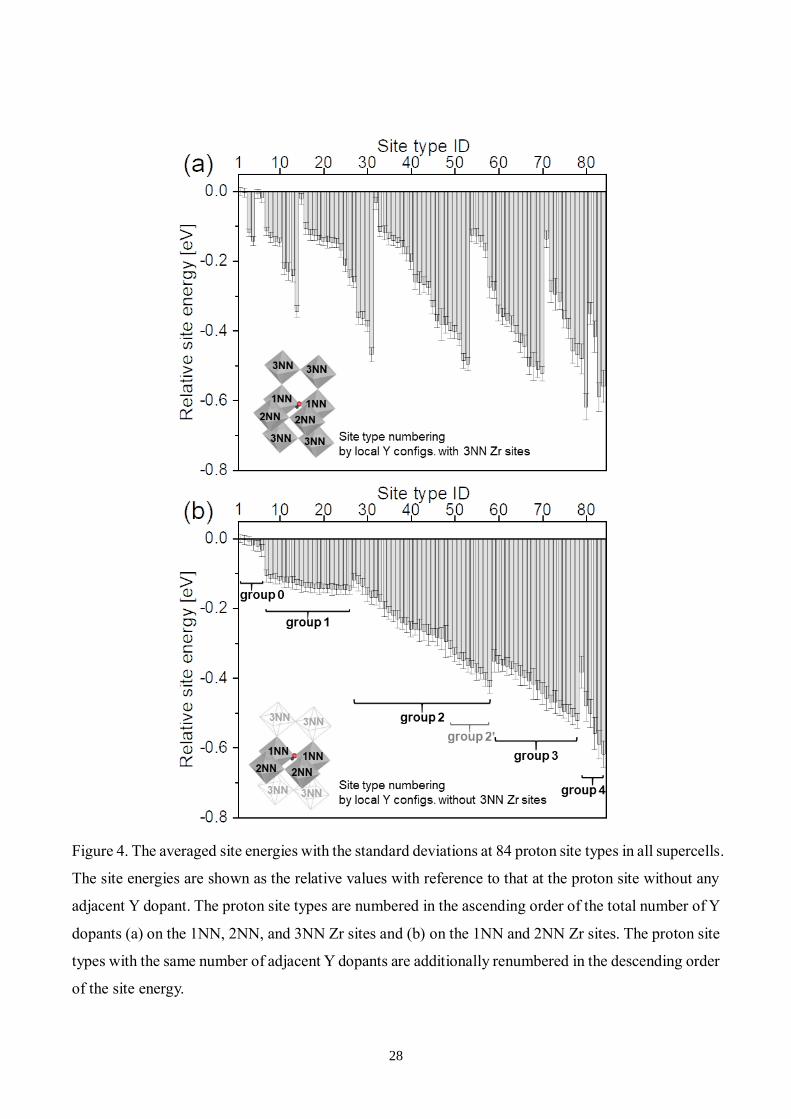
Figure 4(a) shows the averaged site energies with the standard deviations at the 84 proton site
types in all supercells, where the site energies also depend on the Y configuration beyond the adjacent
Zr sites. The site energies are shown as relative values with reference to that at the proton site without
any adjacent Y dopant, which can be regarded as the trap-free region. In this figure, the proton site
types are numbered in ascending order of the total number of Y dopants on the adjacent Zr sites, where
a proton site type with higher site energy is assigned a lower site ID when two or more site types have
the same number of adjacent Y dopants. Although a clear correlation between the site energy and the
total number of Y dopant within 3NN sites cannot be seen in Fig. 4(a), a strong negative correlation
between the site energy and the number of adjacent Y dopants becomes evident when considering only
the 1NN and 2NN sites. Specifically, the 84 proton sites are divided into five groups by the number of
Y dopants only in the 1NN and 2NN Zr sites as shown in Figs. 3(b)-(f), i.e., groups 0, 1, 2, 3, and 4.
The group ID represents the number of adjacent Y dopants in the four Zr sites. Figure 4(b) shows the
proton site energies at all 84 proton sites, in which the proton sites are renumbered in the order of the
group ID. The proton sites in the same group are additionally renumbered in the descending order of
the site energy. A clear correlation can be seen in this figure, i.e., lower site energies are associated
14
with larger numbers of adjacent Y dopants. This indicates that the local Y configuration on the four
adjacent Zr sites is the key factor in determining the proton site energy.
In our previous study [18], only the proton sites with the triangular Y configuration in group 3
were focused on as the most dominant trap sites, since they have the highest proton existence
probability at xY = 0.20. However, the proton sites in group 4 surrounded by more Y dopants have
lower site energies, i.e., higher trapping strength, although they are less abundant than group 3.
Therefore, the proton sites in groups 3 and 4 should have been defined as the trap sites for protons.
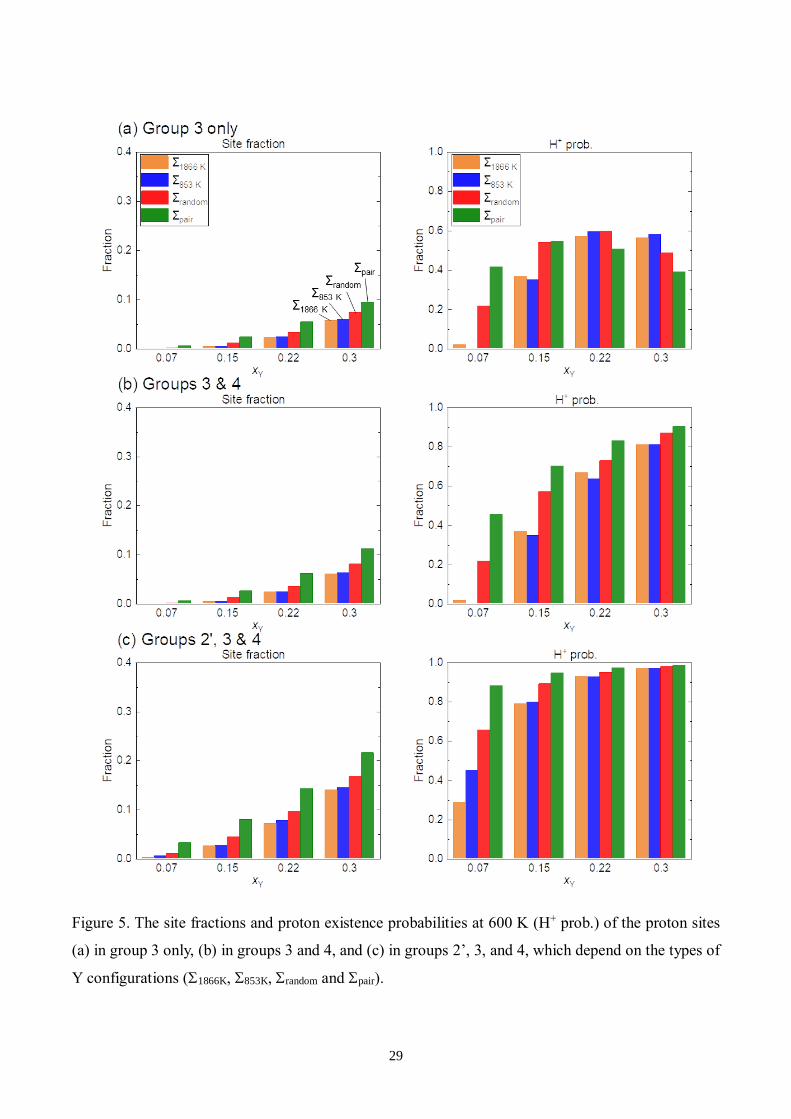
Figures 5 (a) and (b) show the trap-site fractions and the proton existence probabilities at the trap sites,
i.e., proton trapping probability, at 600 K based on the two definitions of trap sites. In both trap-site
definitions of “group 3 only” and “groups 3 & 4”, the fraction of trap sites depends on the type of Y
configurations, increasing in the order of 1866K, 853K, random and pair. The trap-site fraction is
inversely correlated with the proton diffusivity, which is reasonable in terms of the negative effect of
trap sites on the proton diffusivity. However, the proton trapping probability has no correlation with
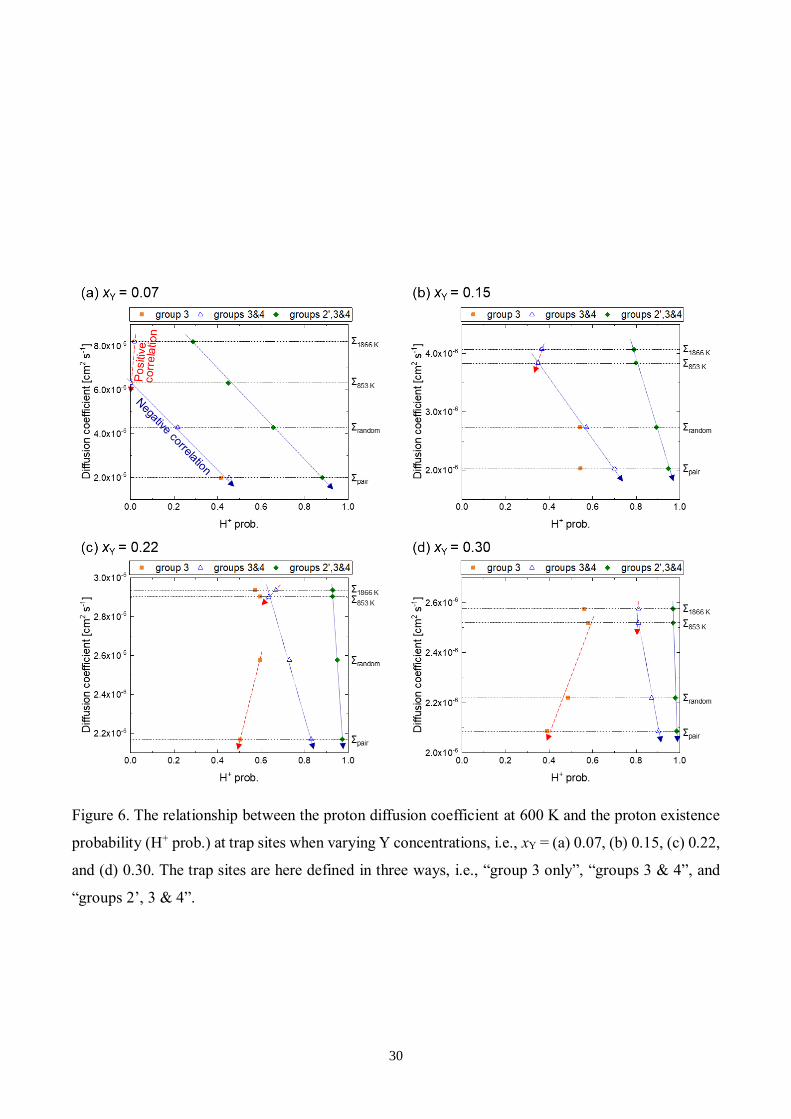
the proton diffusivity in the case of the trap-site definition of “group 3 only”. Figure 6 shows the
relationship between the proton diffusion coefficient at 600 K and the proton trapping probability with
various definitions of trap sites. The orange squares and the blue triangles correspond to the trap-site
definitions of “group 3 only” and “groups 3 & 4”, respectively. Ideally, the diffusion coefficient
decreases with increasing the proton trapping probability, i.e., a negative correlation should be
observed in these plots. However, the plots in the definition of “group 3 only” are far from the ideal
15
correlation, particularly at higher Y concentrations. On the other hand, the plots in the definition of
“groups 3 and 4” approach the ideal negative correlation, meaning that the proton sites in both groups
3 and 4 are identified as the main trap sites for protons in Y-doped BaZrO3.
Note that the difference between 1866K and 853K still deviates from the ideal negative correlation,
suggesting that the definition of trap sites remains insufficient. Focusing on the site energies in group
2, several proton sites have low site energies comparable to those in group 3. Such low-energy proton
sites have a common Y configuration, i.e., a Y-Y pair occupying the adjacent 1NN and 2NN Zr sites
as shown in Fig. 3(g). These low-energy proton sites in group 2 are called group 2’ hereafter. Figure
5(c) shows the trap-site fractions and the proton trapping probabilities at 600 K when all proton sites
in groups 2’, 3, and 4 are defined as the trap sites. The green diamonds in Fig. 6 correspond to the third
definition of trap sites (groups 2’, 3, and 4), which are now consistent with the ideal negative
correlation between the proton diffusivity and the proton existence probability at the defined trap sites.
Therefore, the proton sites in group 2’ should also be considered trap sites.
We can now reconcile the impact of Y configuration on the proton diffusivity based on the above
definition of trap sites. That is, the Y configuration in the thermal equilibrium state at higher
temperatures tends to form less trap sites, resulting in higher proton diffusivity. This is attributed to the
repulsive interaction between Y dopants, suggesting that the isolation of Y dopants in the crystal is a
reasonable strategy for improving the proton conductivity.
16
3.4 Preferential conduction
The preferential conduction along the YO6 network is also a key factor in determining the proton
diffusivity. In the present study, the optimal path, which is defined as the lowest-energy path between
two most stable sites separated by a lattice translation vector of the 9×9×9 supercell, was explored by
the dynamic-programming-based algorithm [34]. The site energy at the highest-energy proton site
along the optimal path vs. that in the entire supercell (Eopthigh
) is a direct indicator for the preferential
conduction.
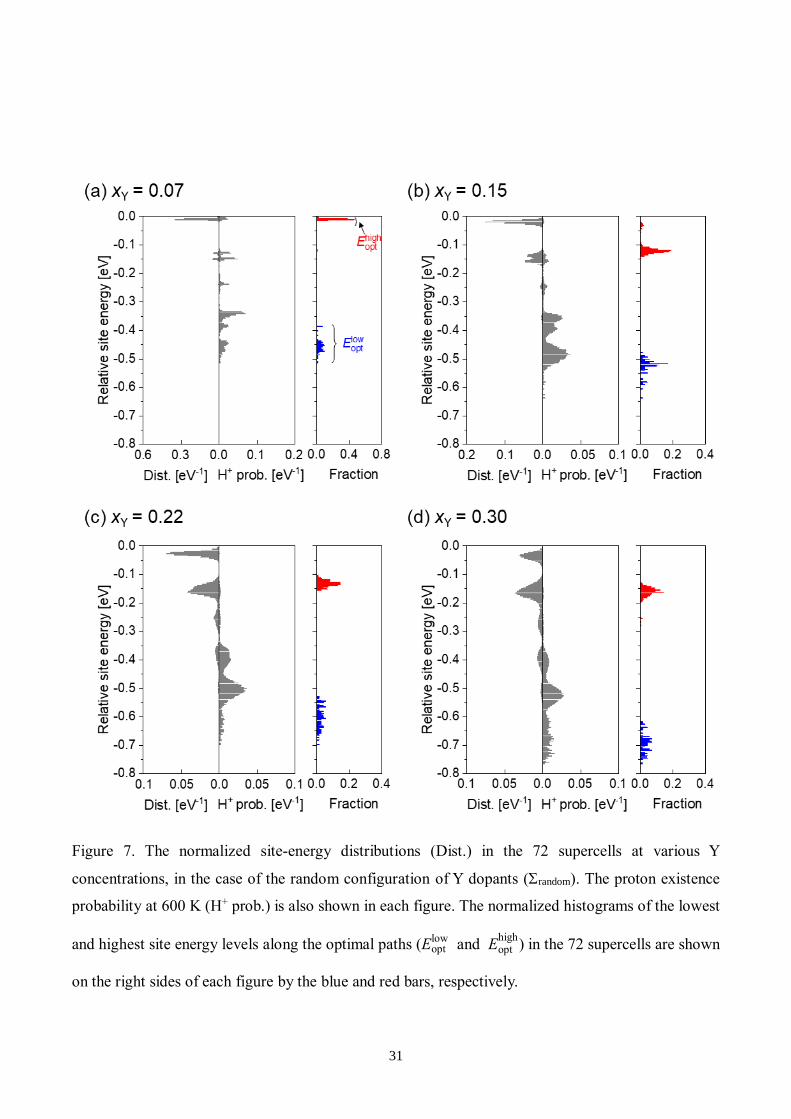
Taking the random configuration of Y dopants (random) as an example, the normalized site-energy
distribution in the 72 supercells at each Y concentration is shown in Fig. 7 (See Fig. S1 for 1866K,
853K, and pair). The site energy is expressed as the relative energy with reference to the highest energy
site in each supercell. The proton existence probability at 600 K is also shown in each figure. In
addition, the normalized histograms of the lowest and highest site energies along the optimal paths in
the 72 supercells are shown by the blue and red bars, respectively. Regardless of Y concentration, the
normalized site-energy distribution exhibits a single peak close to 0 eV and a single or double peak
around –0.15 eV, which are attributed to the proton sites in group 0 and group 1, respectively. Although
the site-energy distributions of the other groups seem negligibly small, these sites also play a key role
in the proton diffusivity. In fact, the proton existence probabilities are higher at these sites with lower
site energies than those in groups 0 and 1. The lowest site energy (Eoptlow
) exhibits a declining trend with
the Y concentration.
17
Focusing on the highest energy sites along the optimal paths, they all belong to group 0 at xY =
0.07, meaning that protons migrate over a long range via trap-free regions without adjacent Y dopants.
This conduction mechanism is close to the conventional picture of carrier conduction in a crystal with
dilute dopants, i.e., trapping and detrapping employed by Yamazaki et al. in Ref. [17]. On the other
hand, the highest energy sites belong to group 1 in most cases at xY ≥ 0.15. This indicates that the
preferential proton conduction occurs along the YO6 network and that protons are not required to visit
trap-free regions for their long-range migration. This phenomenon is called nanoscale percolation by
Draber et al. [19], which can lead to an abrupt increase in the proton diffusivity at the xY threshold of
percolation.
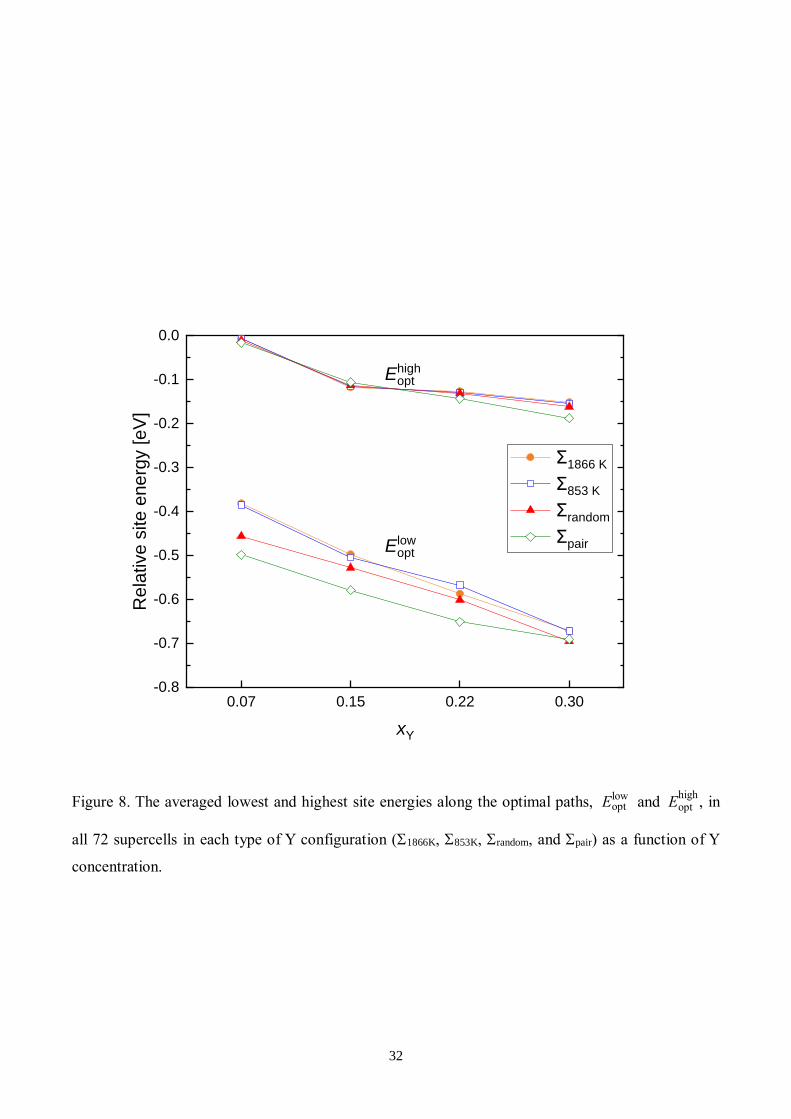
Figure 8 shows the averaged Eoptlow
and Eopthigh
in all 72 supercells in each Y configuration (1866K,
853K, random, and pair) as a function of Y concentration. At xY = 0.07, Eopthigh
are close to 0 eV in all Y
configurations, indicating no preferential conduction at the low Y concentration. On the other hand,
Eoptlow
depends on the Y configurations, which decreases in the order of 1866K, 853K, random, and pair.
Therefore, the difference in the energy distribution of the trap sites is the main factor for the difference
in the proton diffusivity between the Y configurations at the low Y concentration. At xY = 0.15, the
preferential conduction of protons starts appearing in most of the supercells with a few exceptions (See
Fig. S1). The fraction of the exceptions increases in the order of 1866K, 853K, random and pair,
corresponding to the increasing tendency of the averaged Eopthigh
. This indicates that the preferential
conduction pathways are more readily formed with higher isolation trend of Y dopants at the relatively
18
low Y concentration. In contrast, Eopthigh
decreases in the same order at the highest Y concentration (xY
= 0.30), where the association of Y dopants makes the YO6 network more developed. Thus, the effects
of isolation and association trends of Y dopants change depending on the Y concentration. Concerning
Eoptlow
, the difference between the four types of Y configurations becomes smaller with increasing Y
concentration. Hence, the proton diffusivities in the four types of Y configurations are close to each
other at the highest Y concentration (Fig. 1(d)).
Note that the preferential conduction on the proton diffusivity has a minor effect compared to the
proton trapping effect. Eoptlow
and Eopthigh
are indicators for the proton trapping and the preferential
conduction, respectively, meaning that the changes in the two indicators depending on the Y
concentration are important for discussion of the dominant factor determining the proton diffusivity.
Taking the 1866K configuration of Y dopants as the most realistic condition, Eoptlow
and Eopthigh
decrease
with increasing the Y concentration xY in the range from 0.07 to 0.30 by –0.29 eV and –0.15 eV,
respectively. The smaller change in Eopthigh
indicates the minor impact of the preferential conduction on
the proton diffusivity, resulting in a declining trend of the proton diffusivity due to the major impact
of the proton trapping. The declining trend in this work is opposite to the rising trend of the proton
mobility reported in Ref. [19]. This is probably due to the overestimation of the percolation effect in
Ref. [19], which originates from their artificial modification of the potential energy surface of a proton
in the crystal to distinguish between the trap region and the trap-free region.
19
Conclusions
In the present study, we theoretically revisited the proton diffusivity in Y-doped BaZrO3 with
realistic dopant configurations under processing conditions. The findings of the present study are
summarized below:
1. The estimated proton diffusivity with the realistic Y configurations are basically higher than that
with the random configuration. This is due to the isolation trend of Y dopants at thermal equilibrium,
which decreases the number of trap sites with deep potential wells.
2. The proton trapping by Y-H interaction is the most dominant factor governing the proton diffusivity
in the crystal compared to the other two factors, i.e., preferential conduction along the 3D network of
Y dopants and H-H interaction.
3. The above to findings suggest that a reasonable strategy for improving the proton diffusivity is
suppressing the negative impact of proton trapping by controlling the dopant configuration in the
crystal, rather than enhancing the positive impact of preferential conduction. Specifically, Y dopants
should be isolated as much as possible from each other, which is different from the previously proposed
strategy in Ref. [19] that the preferential conduction network is developed as much as possible by
forming superstructure of Y dopants in the crystal.

20
Acknowledgment
This work was partially supported by JSPS KAKENHI granted to K.T. (20H02422) and to S.K.
(19K15287). The RXMC calculations were performed using ab Initio Configurational Sampling
toolkit (abICS) [https://www.pasums.issp.u-tokyo.ac.jp/abics/en/] on joint-use supercomputing
facilities at the Institute for Solid State Physics, the University of Tokyo. S.K. is also supported by
CREST, Japan Science and Technology Agency (JPMJCR18J3).
21
References
1 K. D. Kreuer, Solid State Ionics, 1999, 125, 285.
2 K. Katahira, Y. Kohchi, T. Shimura and H. Iwahara, Solid State Ionics, 2000, 138, 91.
3 Y. Yamazaki, R. Hernandez-Sanchez and S. M. Haile, Chem. Mater., 2009, 21, 2755.
4 D. Pergolesi, E. Fabbri, A. D. Epifanio, E.D. Bartolomeo, A. Tebano, S. Sanna, S. Licoccia,
G. Balestrino and E. Traversa, Nat. Mater., 2010, 9, 846.
5 D. Han, Y. Nose, K. Shinoda and T. Uda, Solid State Ionics, 2012, 213, 2.
6 F. Giannici, M. Shirpour, A. Longo, A. Martorana, R. Merkle and J. Maier, Chem. Mater., 2011, 23,
2994–3002.
7 D. Han, K. Kishida, K. Shinoda, H. Inui and T. Uda, J. Mater. Chem. A, 2013, 1, 3027–3033.
8 D. Han and T. Uda, J. Mater. Chem. A, 2018, 6, 18571-18582.
9 T. Omata, Y. Noguchi and S. Otsuka-Yao-Matsuo, J. Electrochem. Soc., 2005, 152, E200-E205.
10 I. Oikawa and H. Takamura, Chem. Mater., 2015, 27, 6660-6667.
11 W. Münch, K. D. Kreuer, G. Seifert and J. Maier, Solid State Ionics, 2000, 136-137, 183.
12 M. S. Islam, J. Mater. Chem., 2000, 10, 1027.
13 M. A. Gomez, M. A. Griffin, S. Jindal, K. D. Rule and V. R. Cooper, J. Chem. Phys., 2005, 123,
094703.
14 M. E. Björketun, P. G. Sundell, G.Wahnström and D. Engberg, Solid State Ionics, 2005, 176, 3035.
15 N. Bork, N. Bonanos, J. Rossmeisl and T. Vegge, Phys. Rev. B, 2010, 82, 014103.
16 K. Toyoura, D. Hirano, A. Seko, M. Shiga, A. Kuwabara, M. Karasuyama, K. Shitara and
I. Takeuchi, Phys. Rev. B, 2016, 93, 054112.
17 Y. Yamazaki, F. Blanc, Y. Okuyama, L. Buannic, J. C. Lucio-Vega, C. P. Grey and S. M. Haile, Nat.
Mater., 2013, 12, 647.
18 K. Toyoura, W. Meng, D. Han and T. Uda, J. Mater. Chem. A, 2018, 6, 22721.
19 F. M. Draber, C. Ader, J. P. Arnold, S. Eisele, S. Grieshammer, S. Yamaguchi and M. Martin, Nat.
Mater., 2019, 19, 338–346.
22
20 H. Takahashi, I. Yashima, K. Amezawa, K. Eguchi, H. Matsumoto, H. Takamura and S. Yamaguchi,
Chem. Mater., 2017, 29, 1518.
21 S. Kasamatsu, O. Sugino, T. Ogawa and A. Kuwabara, J. Mater. Chem. A, 2020, 8, 12674-12686.
22 K. Toyoura, T. Fujii, N. Hatada, D. Han and T. Uda, J. Phys. Chem. C., 2019, 123, 26823.
23 A. Zunger, S. H. Wei, L. G. Ferreira and J. E. Bernard, Phys. Rev. Lett., 1990, 65, 353–356.
24 A. van de Walle, P. Tiwary, M. M. de Jong, D. L. Olmsted, M. D. Asta, A. Dick, D. Shin, Y. Wang,
L. Q. Chen and Z. K. Liu, Calphad, 2013, 42, 13.
25 K. Ueno, N. Hatada, D. Han, K. Toyoura and T. Uda, J. Solid State Electrochem., 2020, 24, 1523-
1538.
26 R. Yu and L. C. De Jonghe, J. Phys. Chem. C, 2007, 111, 11003.
27 K. Toyoura, Y. Koyama, A. Kuwabara, F. Oba and I. Tanaka, Phys. Rev. B, 2008, 78, 214303.
28 K. Toyoura, N. Hatada, Y. Nose, I. Tanaka, K. Matsunaga and T. Uda, J. Phys. Chem. C, 2012, 116,
19117.
29 N. Hatada, K. Toyoura, T. Onishi, Y. Adachi and T. Uda, J. Phys. Chem. C, 2014, 118, 29629.
30 K. Toyoura, A. Nakamura and K. Matsunaga, J. Phys. Chem. C, 2015, 119, 8480.
31 C. T. Chudley and R. J. Elliott, Proc. Phys. Soc., 1961, 77, 353.
32 R. Hempelmann, Quasielastic Neutron Scattering and Solid State Diffusion, Oxford University
Press Inc., New York, 2000.
33 K. Toyoura, T. Fujii, K. Kanamori and I. Takeuchi, Phys. Rev. B, 2020, 101, 184117.
34 K. Kanamori, K. Toyoura, J. Honda, K. Hattori, A. Seko, M. Karasuyama, K. Shitara, M. Shiga,
A. Kuwabara and I. Takeuchi, Phys. Rev. B, 2018, 97, 125124.
23
Figure captions
Figure 1. The calculated proton diffusion coefficients as a function of inverse temperature in various
Y configurations. The Y concentration, i.e., the site occupancy on the Zr sites xY, is (a) 0.07, (b) 0.15,
(c) 0.22, and (d) 0.3. The solid and broken lines denote the proton diffusion coefficients with and
without the H-H interaction. The black broken lines show the proton diffusion coefficients in the
perfect crystal with neither H-H nor Y-H interaction.
Figure 2. The temperature and Y-configuration dependences of the enhancement factors by the H-H
interaction. The Y concentration, i.e., the site occupancy on the Zr sites xY, is (a) 0.07, (b) 0.15, (c)
0.22, and (d) 0.3.
Figure 3. (a) The 1NN, 2NN, and 3NN Zr sites adjacent to a proton site. The proton sites are classified
into 84 types according to the local Y configurations on the eight Zr sites. (b)–(g) Local Y
configurations on the 1NN and 2NN Zr sites corresponding to the proton sites in groups 0, 1, 2, 3, 4
and 2’, respectively. Note that only an example of multiple local Y configurations is illustrated for
groups 1, 2, and 3.
Figure 4. The averaged site energies with the standard deviations at 84 proton site types in all supercells.
The site energies are shown as the relative values with reference to that at the proton site without any
adjacent Y dopant. The proton site types are numbered in the ascending order of the total number of Y
dopants (a) on the 1NN, 2NN, and 3NN Zr sites and (b) on the 1NN and 2NN Zr sites. The proton site
types with the same number of adjacent Y dopants are additionally renumbered in the descending order
of the site energy.
Figure 5. The site fractions and proton existence probabilities at 600 K (H+ prob.) of the proton sites
(a) in group 3 only, (b) in groups 3 and 4, and (c) in groups 2’, 3, and 4, which depend on the types of
Y configurations (1866K, 853K, random and pair).
Figure 6. The relationship between the proton diffusion coefficient at 600 K and the proton existence
probability (H+ prob.) at trap sites when varying Y concentrations, i.e., xY = (a) 0.07, (b) 0.15, (c) 0.22,
24
and (d) 0.30. The trap sites are here defined in three ways, i.e., “group 3 only”, “groups 3 & 4”, and
“groups 2’, 3 & 4”.
Figure 7. The normalized site-energy distributions (Dist.) in the 72 supercells at various Y
concentrations, in the case of the random configuration of Y dopants (random). The proton existence
probability at 600 K (H+ prob.) is also shown in each figure. The normalized histograms of the lowest
and highest site energy levels along the optimal paths (Eoptlow
and Eopthigh
) in the 72 supercells are shown
on the right sides of each figure by the blue and red bars, respectively.
Figure 8. The averaged lowest and highest site energies along the optimal paths, Eoptlow
and Eopthigh
, in
all 72 supercells in each type of Y configuration (1866K, 853K, random, and pair) as a function of Y
concentration.
25
Figure 1. The calculated proton diffusion coefficients as a function of inverse temperature in various
Y configurations. The Y concentration, i.e., the site occupancy on the Zr sites xY, is (a) 0.07, (b) 0.15,
(c) 0.22, and (d) 0.3. The solid and broken lines denote the proton diffusion coefficients with and
without the H-H interaction. The black broken lines show the proton diffusion coefficients in the
perfect crystal with neither H-H nor Y-H interaction.
26
Figure 2. The temperature and Y-configuration dependences of the enhancement factors by the H-H
interaction. The Y concentration, i.e., the site occupancy on the Zr sites xY, is (a) 0.07, (b) 0.15, (c)
0.22, and (d) 0.3.
27
Figure 3. (a) The 1NN, 2NN, and 3NN Zr sites adjacent to a proton site. The proton sites are classified
into 84 types according to the local Y configurations on the eight Zr sites. (b)–(g) Local Y
configurations on the 1NN and 2NN Zr sites corresponding to the proton sites in groups 0, 1, 2, 3, 4
and 2’, respectively. Note that only an example of multiple local Y configurations is illustrated for
groups 1, 2, and 3.
28
Figure 4. The averaged site energies with the standard deviations at 84 proton site types in all supercells.
The site energies are shown as the relative values with reference to that at the proton site without any
adjacent Y dopant. The proton site types are numbered in the ascending order of the total number of Y
dopants (a) on the 1NN, 2NN, and 3NN Zr sites and (b) on the 1NN and 2NN Zr sites. The proton site
types with the same number of adjacent Y dopants are additionally renumbered in the descending order
of the site energy.
29
Figure 5. The site fractions and proton existence probabilities at 600 K (H+ prob.) of the proton sites
(a) in group 3 only, (b) in groups 3 and 4, and (c) in groups 2’, 3, and 4, which depend on the types of
Y configurations (1866K, 853K, random and pair).
30
Figure 6. The relationship between the proton diffusion coefficient at 600 K and the proton existence
probability (H+ prob.) at trap sites when varying Y concentrations, i.e., xY = (a) 0.07, (b) 0.15, (c) 0.22,
and (d) 0.30. The trap sites are here defined in three ways, i.e., “group 3 only”, “groups 3 & 4”, and
“groups 2’, 3 & 4”.
31
Figure 7. The normalized site-energy distributions (Dist.) in the 72 supercells at various Y
concentrations, in the case of the random configuration of Y dopants (random). The proton existence
probability at 600 K (H+ prob.) is also shown in each figure. The normalized histograms of the lowest
and highest site energy levels along the optimal paths (Eoptlow
and Eopthigh
) in the 72 supercells are shown
on the right sides of each figure by the blue and red bars, respectively.
32
0.07 0.15 0.22 0.30-0.8
-0.7
-0.6
-0.5
-0.4
-0.3
-0.2
-0.1
0.0
Re
lative s
ite
ene
rgy [e
V]
xY
Σ1866 K
Σ853 K
Σrandom
Σpair
Ehighopt
Elowopt
Figure 8. The averaged lowest and highest site energies along the optimal paths, Eoptlow
and Eopthigh
, in
all 72 supercells in each type of Y configuration (1866K, 853K, random, and pair) as a function of Y
concentration.
33
Supplementary Information
Theoretical study on proton diffusivity
in Y-doped BaZrO3 with realistic dopant configurations
Takeo Fujii1, Kazuaki Toyoura*,1, Tetsuya Uda1, and Shusuke Kasamatsu**,2
1 Department of Materials Science and Engineering, Kyoto University, Kyoto 606-8501, Japan 2 Academic Assembly (Faculty of Science), Yamagata University, Yamagata 990-8560, Japan
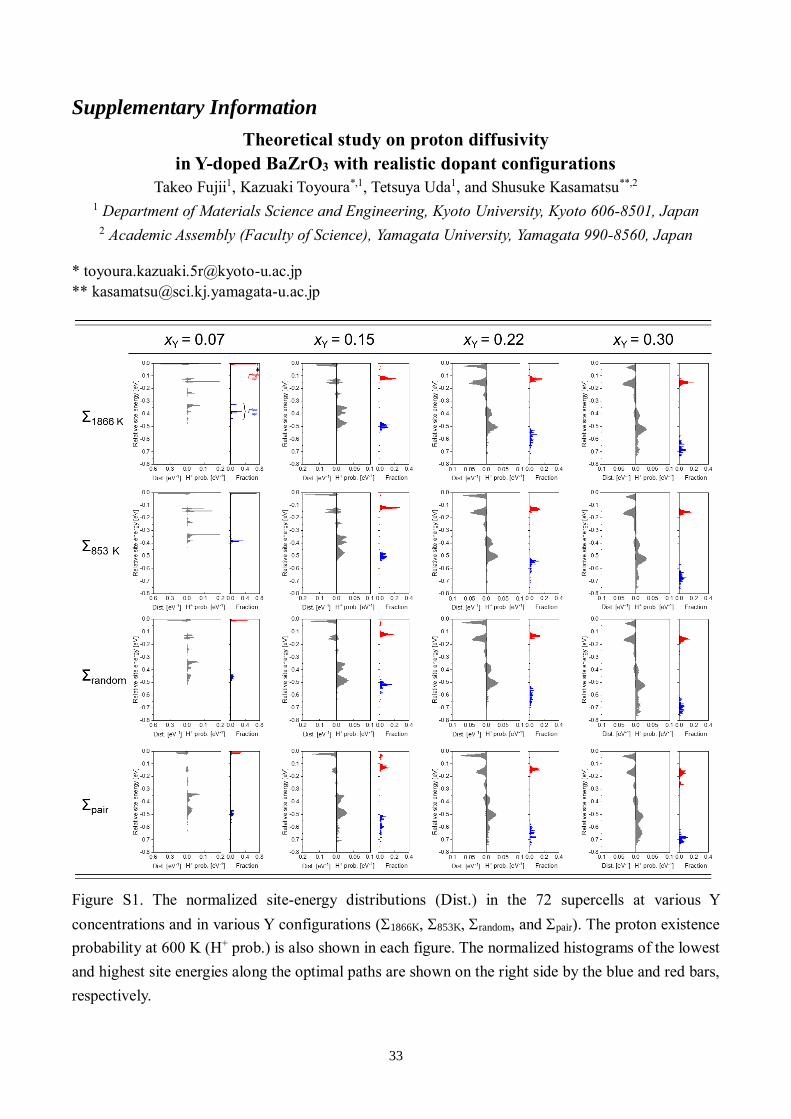
Figure S1. The normalized site-energy distributions (Dist.) in the 72 supercells at various Y
concentrations and in various Y configurations (1866K, 853K, random, and pair). The proton existence
probability at 600 K (H+ prob.) is also shown in each figure. The normalized histograms of the lowest
and highest site energies along the optimal paths are shown on the right side by the blue and red bars,
respectively.

download fileview on ChemRxivMS_ESI_Fujii_ver1.pdf (1.45 MiB)