Embed Size (px)
Citation preview

INVESTOR PRESENTATION
JUNE 19, 2018

Important Disclosures
Forward-Looking Statements
This presentation contains projections and other forward-looking statements within the meaning of Section 27A of the Securities Act of 1933 and Section 21E of the Securities
Exchange Act of 1934. Words such as “estimate,” “project,” “will,” “may,” “anticipate,” “plan,” “intend,” “believe,” “expect,” “outlook,” “guidance,” “target,” “objective,” “forecast” or similar
expressions that convey the prospective nature of events or outcomes generally indicate forward-looking statements. These projections and statements reflect the Company’s current
views with respect to future events and financial performance as of this date. No assurances can be given, however, that these events will occur or that these projections will be
achieved, and actual results could differ materially from those projected as a result of certain factors. For a summary of events that may affect the accuracy of these projections and
forward-looking statements, see “Risk Factors” in our Form 10-K for the year ended December 31, 2017 filed with the Securities and Exchange Commission (the “SEC”). Unless legally
required, Callon does not undertake any obligation to update forward looking statements as a result of new information, future events or otherwise
SUPPLEMENTAL NON-GAAP FINANCIAL MEASURES
This presentation includes non-GAAP measures, such as Adjusted EBITDA, Adjusted Income, Adjusted Income per diluted share, Adjusted G&A and other measures identified as non-
GAAP.
Adjusted EBITDA is a supplemental non-GAAP financial measure that is used by management and external users of our financial statements, such as industry analysts, investors,
lenders and rating agencies. We define Adjusted EBITDA as net income (loss) before interest expense, income taxes, depreciation, depletion and amortization, exploration expense,
(gains) losses on derivative instruments excluding net cash receipts (payments) on settled derivative instruments and premiums paid for put options that settled during the period,
impairment of oil and natural gas properties, non-cash equity based compensation, asset retirement obligation accretion expense, other income, gains and losses from the sale of
assets and other non-cash operating items. Adjusted EBITDA is not a measure of net income as determined by United States generally accepted accounting principles (‘‘GAAP’’).
Management believes Adjusted EBITDA is useful because it allows it to more effectively evaluate our operating performance and compare the results of our operations from period to
period and against our peers without regard to our financing methods or capital structure. We exclude the items listed above from net income in arriving at Adjusted EBITDA because
these amounts can vary substantially from company to company within our industry depending upon accounting methods and book values of assets, capital structures and the method
by which the assets were acquired. Adjusted EBITDA should not be considered as an alternative to, or more meaningful than, net income as determined in accordance with GAAP or as
an indicator of our operating performance or liquidity. Certain items excluded from Adjusted EBITDA are significant components in understanding and assessing a company’s financial
performance, such as a company’s cost of capital and tax structure, as well as the historic costs of depreciable assets, none of which are components of Adjusted EBITDA. Our
presentation of Adjusted EBITDA should not be construed as an inference that our results will be unaffected by unusual or non-recurring items.
We believe that the non-GAAP measure of Adjusted income available to common shareholders (“Adjusted Income”) and Adjusted Income per diluted share are useful to investors
because they provide readers with a meaningful measure of our profitability before recording certain items whose timing or amount cannot be reasonably determined. These measures
exclude the net of tax effects of certain non-recurring items and non-cash valuation adjustments, which are detailed in the reconciliation provided below. Prior to being tax-effected and
excluded, the amounts reflected in the determination of Adjusted income and Adjusted income per diluted share below were computed in accordance with GAAP.
Adjusted general and administrative expense (“Adjusted G&A”) is a supplemental non-GAAP financial measure that excludes certain non-recurring expenses and non-cash valuation
adjustments related to incentive compensation plans. We believe that the non-GAAP measure of Adjusted G&A is useful to investors because it provides readers with a meaningful
measure of our recurring G&A expense and provides for greater comparability period-over-period. The Appendix table details all adjustments to G&A on a GAAP basis to arrive at
Adjusted G&A.
For a reconciliation of non-GAAP measures to their most directly comparable GAAP measure, please see schedules included in the Appendix.

Important Disclosures
3
METRIC CALCULATION METHODOLOGIES
$ / Net Acre (Adj.): This calculation aims to normalize transaction purchase prices for the value of the
production acquired to arrive at an implied adjusted valuation for the undeveloped acreage acquired. The
adjustment value for the acquired production is determined by applying what management believes is a
reasonable valuation multiple for the present value of a flowing equivalent barrel of production—based on
prevailing NYMEX strip pricing at the time of the acquisition—to reported sustained production rates at the
time of the acquisition. This adjusted undeveloped valuation is then divided by the net surface acreage
acquired to yield a best-efforts, “apples-to-apples” transaction metric to use as a rough guide for relative
valuation purposes.
$ / Net Delineated Hz Location (Adj.): This calculation aims to normalize transaction purchase prices for
the value of the production acquired to arrive at an implied adjusted valuation for the inventory of
undeveloped horizontal locations (net to the acquired interest), in zones, which management believes to
have been sufficiently delineated by operated and/or offsetting industry activity to date. The adjustment
value for the acquired production is determined by applying what management believes is a reasonable
valuation multiple for the present value of a flowing equivalent barrel of production—based on prevailing
NYMEX strip pricing at the time of the acquisition—to reported sustained production rates at the time of
the acquisition. It also adjusts for management’s estimates of value for midstream and water disposal
infrastructure and net acreage that does not currently carry delineated well locations. This adjusted
undeveloped valuation is then divided by the previously described net identified horizontal locations
acquired to yield a best-efforts, “apples-to-apples” transaction metric to use as a rough guide for relative
valuation purposes.

Callon Petroleum
CURRENT RIG ACTIVITY
4
1Q18 RESULTS
1. LOE figures are calculated on a two-stream basis2. Statistical measures for Market Capitalization and Enterprise Value are as of market close on June 14, 2018. Shares outstanding and net debt are represented pro forma for the recently announced Delaware Basin
acquisition and related senior notes and equity offerings3. LTM Adjusted EBITDA calculated as Callon LTM Adjusted EBITDA plus acquisition 1Q18 Adjusted EBITDA annualized. For a reconciliation of Callon’s Net Income (Loss) to Adjusted EBITDA see the Offering
Memorandum
OPERATIONAL HIGHLIGHTS
1Q18 production of 26.6 Mboe/d
Oil mix of 77%
YOY growth of 30%
Operating margin of $44.31 per Boe (~83%)
LOE per Boe $5.45 (1)
Adjusted EBITDA of $91.7MM
Successful early time results from WC A down-spacing test in Wildhorse
Strong initial production from first Spur two well pad (UWC A & LWC A)
25%+ improvement in Delaware Basin drilling efficiency
Drilling of 1st “mega-pad” at Monarch underway
85,000+ PRO FORMA NET ACRES
Pro-forma Key Statistics (2)
Shares Outstanding 227 MM
Market Capitalization $2.3 B
Net Debt $1.0 B
Enterprise Value $3.3 B
Net debt/1Q18 LQA Adj. EBITDA (3) 2.0x

Sustained, Leading Operating Margins
$28.90 $27.83 $30.34 $34.02 $32.32 $32.58
$40.51 $44.31
$0.00
$10.00
$20.00
$30.00
$40.00
$50.00
$60.00
$70.00
2Q 2016 3Q 2016 4Q 2016 1Q 2017 2Q 2017 3Q 2017 4Q 2017 1Q 2018
5
OPERATING MARGIN GROWTH ($/Boe)
Note: Peer set includes CDEV, CXO, EGN, FANG, LPI, MTDR, PE, PXD, REN
1Q 2018 OPERATING MARGIN PEER COMPARISON ($/Boe)
$44.31
$20
$30
$40
$50
CPE Peer #1 Peer #2 Peer #3 Peer #4 Peer #5 Peer #6 Peer #7 Peer #8 Peer #9
Peer Average $34.72 /Boe
$17/Boe$10/Boe

Midland Basin – Operational Updates
6
2nd QUARTER MIDLAND ACTIVITY SHIFT
Monarch recycling program yielding benefits
Recent wells have been able to source over 40% of
frac volumes from recycling
Model for expanded efforts across footprint
1st “mega-pad” underway at Monarch
Targeting two Lower Spraberry flow units
Completion operations recently commenced
WildHorse increasing activity during 2Q
Positive initial results from WC A down-spacing test
Remaining 2018 scheduled activity still set for 660’
spacing (monitoring down-spacing test results)
Intra-basin sand testing underway with positive early
results
Multi-well pads in Fairway area driving operational
efficiency
2Q18 primary
activity areas

7
Early results are very encouraging with ten well spacing test (Open wells) currently
exceeding cumulative oil plots for comparable two well pads (eight well spacing)
Wildhorse WC A Down-Spacing Test
0
20,000
40,000
60,000
80,000
100,000
120,000
140,000
Da
y 1
Da
y 1
1
Da
y 2
1
Da
y 3
1
Da
y 4
1
Da
y 5
1
Da
y 6
1
Da
y 7
1
Da
y 8
1
Da
y 9
1
Day 1
01
Day 1
11
Day 1
21
Day 1
31
Day 1
41
Day 1
51
Day 1
61
Day 1
71
Day 1
81
Day 1
91
Day 2
01
Day 2
11
Day 2
21
Cu
mu
lative
Oil
(Bb
l)
OPEN A2 #1AH OPEN A3 #3AH PLAYERS #1AH
PLAYERS #2AH WYNDHAM #1AH WYNDHAM #2AH

Delaware Basin – Ramping Activity
8
SPUR AREA IN PROGRAM DEVELOPMENT MODE
Strong initial results from Rendezvous twowell pad (Upper and Lower WC A)
Improved efficiency in drilling as activityincreases
Goodnight Midstream pipeline projectedonline in 3Q, recycling projects movingforward
Upcoming delineation of Wolfcamp C and2nd Bone Spring Shale
-
10,000
20,000
30,000
40,000
50,000
60,000
70,000
Day 50Day 40Day 30Day 20Day 10
Cum
ula
tive O
il (B
bls
)
Rendezvous Avg Cum Oil Prior 4 Well Avg Cum Oil
Rendezvous Pad
Goodnight Midstream
water pipeline

Improved Delaware Drilling Efficiency
9
AVERAGE DRILLING FOOTAGE PER DAY
1st 2nd 3rd 4th 5th 6th OffsetOperatorAverage
CPEAverage
LatestCPE Well
18%
increase
8%
increase
Callon Operated Delaware Wells
Note: Offset Operator average is composed of 14 recent peer results in the southeast Delaware basin targeting the Wolfcamp
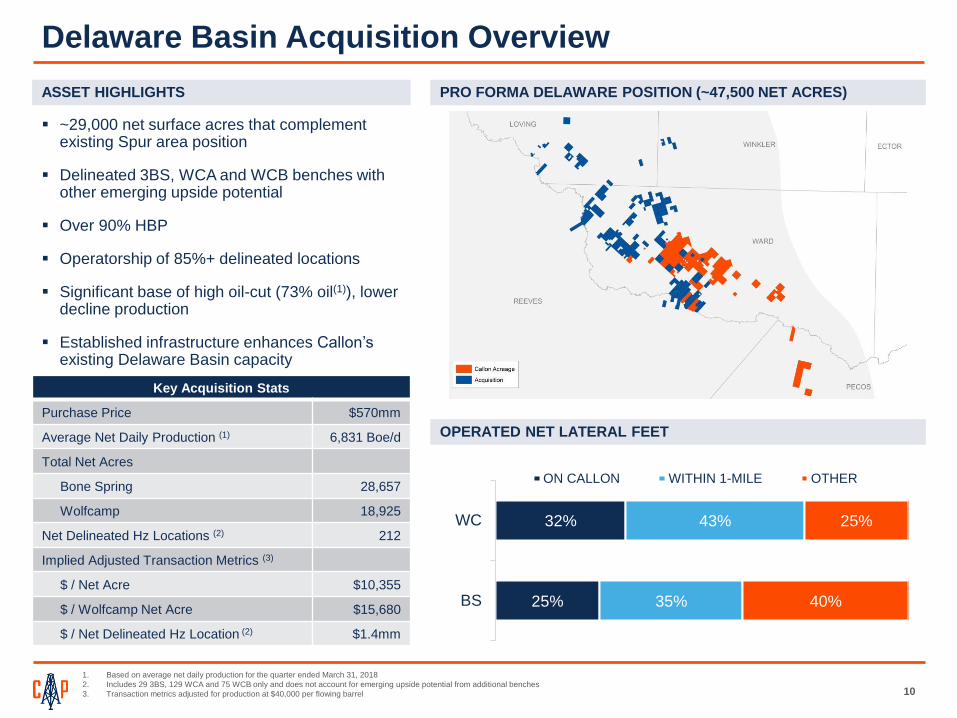
PRO FORMA DELAWARE POSITION (~47,500 NET ACRES)
Delaware Basin Acquisition Overview
~29,000 net surface acres that complement existing Spur area position
Delineated 3BS, WCA and WCB benches with other emerging upside potential
Over 90% HBP
Operatorship of 85%+ delineated locations
Significant base of high oil-cut (73% oil(1)), lower decline production
Established infrastructure enhances Callon’sexisting Delaware Basin capacity
Key Acquisition Stats
Purchase Price $570mm
Average Net Daily Production (1) 6,831 Boe/d
Total Net Acres
Bone Spring 28,657
Wolfcamp 18,925
Net Delineated Hz Locations (2) 212
Implied Adjusted Transaction Metrics (3)
$ / Net Acre $10,355
$ / Wolfcamp Net Acre $15,680
$ / Net Delineated Hz Location (2) $1.4mm
1. Based on average net daily production for the quarter ended March 31, 2018
2. Includes 29 3BS, 129 WCA and 75 WCB only and does not account for emerging upside potential from additional benches
3. Transaction metrics adjusted for production at $40,000 per flowing barrel
ASSET HIGHLIGHTS
10
25%
32%
35%
43%
40%
25%
BS
WC
ON CALLON WITHIN 1-MILE OTHER
OPERATED NET LATERAL FEET

December 2016 May 2018
Building Scale in the Core of the Delaware
11
Highly focused additions have enhanced our core operated position
Reeves
Ward
Pecos
Loving Winkler
Reeves
Ward
Pecos
Loving Winkler
Reeves
Ward
Pecos
Loving Winkler
December 2017
Bolt-On Acreage
Acquisitions
Acquired Assets from
Ameredev
~16,100 Total Net Acres
Pro Forma Delaware
Acreage Position
~47,500 Total Net Acres
Callon May 2018
Acquisition
Callon Dec 2016
2017 Bolt-OnsCallon Dec 2016

Strategic Acquisition Complements Our Strategy
Unique Bolt-On Opportunity
Contiguous
Acreage Benefits
1. Acquisition portion of pro forma 1Q18 Adjusted EBITDA is calculated as follows: midpoint of revenue range less midpoint of direct operating expenses range of seller for 1Q 2018 as disclosed in the Offering
Memorandum
Bolsters position in oil rich, over-pressured core of Delaware Basin
Land / ownership depth synergies unlock significant value
Benefits from existing geologic and technical data sets
Increased working interest and extended laterals drive near-term NAV benefits
Enhances optionality for multi-well pad development
Leverage of existing infrastructure on both footprints
1212
Compelling
Corporate Value
Proposition
Near-term corporate returns generated from established production base
Accretive to CF per DAS and ROCE
Additional organic upside from emerging target zones

13
Expansion in the Core of the Delaware Basin
Loving
Winkler
Reeves
Ward
Pecos
Loving Winkler
Reeves
Ward
Pecos
Expands operating
position in the core of the
Southern Delaware Basin
Primary Wolfcamp
horizons contain
attractive combination of
reservoir properties
High OOIP
High reservoir pressure
High % oil
Comprehensive 3D
seismic coverage across
pro forma acreage
Improves placement of
lateral in zone for more
effective completions
Advantage for delineation
of emerging zones
Core operating area
features structurally quiet
basin floor with minimal
faulting through position
WOLFCAMP TOTAL OOIP (MMBO/SEC)
3D SEISMIC COVERAGEWOLFCAMP A & B (% OIL)
WOLFCAMP RESERVOIR PRESSURECORE ACREAGE POSITION
High
Low
Wolfc
am
p
Tota
l OO
IP
(Mm
bo/s
ec)
200
0
Loving Winkler
Reeves
Ward
Pecos
Loving Winkler
Reeves
Ward
Pecos
High
Low
Wolfc
am
p
Perc
ent O
il
100%
0%
3D Seismic Coverage
High
Low
Wolfc
am
p
Reserv
oir
Pre
ssure
(psi)
10,000
2,000

Corbets 34 149 #02WA Prior operator “Kitchen Sink
Design” high proppant/fluid
loading and peak cluster/stage
density
Saratoga #07LA Testing lower cost limit 30%
lower proppant load, 15% less
fluid load, 40% lower
stage/cluster density
Sleeping Indian #01LA Cost / benefit optimization
lower proppant/fluid load offset
by 50% increase in cluster
density and use of frac tech
Rendezvous Pad Multi-well pad application
Upper A / Lower A co-
development
Seller WCA Hz PDPs
Wolfcamp A Design & Performance Optimization
1
1. All wells normalized to 7,500’ lateral length
2
3
0
20
40
60
80
100
120
140
160
180
0 30 60 90 120 150 180 210 240 270 300 330 360
Cum
ula
tive O
il P
roduction (
MB
O)
–N
orm
aliz
ed t
o 7
,500’
Days on Production
CORBETS 34 149 #02WA SARATOGA A1 #07LA
SLEEPING INDIAN A1 #01LA RENDEZVOUS A1 #01LA & #09UA
SELLER WCA AVG (9 wells)
4
1
2
3
4
S
Demonstrated performance improvement through optimized landing zone and completion design
S
COMPLETION DESIGN EVOLUTION
14

Benefits of Significant Existing Infrastructure
FACILITIES HIGHLIGHTS
Single Well Pad
INTEGRATED FACILITIES FOOTPRINT SUPPORTS EFFICIENT PAD DEVELOPMENT
Four operated SWD wells with 95 Mbbl/d of current injection capacity
Supporting water gathering lines
Full electrification across acquired asset base
Increased scale enhances recycling initiative benefiting capital and LOE
PAD DEVELOPMENT SAVINGS
Integration of acquired infrastructure into combined footprint provides
ample capacity to facilitate cost-efficient, multi-well pad development
15

Upside – 2nd Bone Spring Shale & Wolfcamp C
16
A
B
C
D
E
F
G
H
I
J
K
L
12
3
4
5
Reeves
Ward
Pecos
Loving Winkler
Callon plans to test upside horizons in 2018 (2nd Bone Spring and Wolfcamp C)
Industry delineation continues beyond primary horizons (Wolfcamp A, Wolfcamp B and 3rd Bone Spring)
State 5913A GGH 2H
Jagged Peak
IP24/1,000’: 177 Boe/d
Spud Date: 3/25/2017
UL Fourmile 1H
Felix Energy
IP24/1,000’: 160 Boe/d
Spud Date: 3/25/2017
UL Mayflower 42-18 3H
Felix Energy
IP24/1,000’: 194 Boe/d
Spud Date: 7/6/2017
County Line 18B-C2 1H
Jagged Peak
IP30/1,000’: 170 Boe/d
Spud Date: 9/15/2017
Whiskey River 7374B 1H
Jagged Peak
IP24/1,000’: 298 Boe/d
Spud Date: 9/17/2017
Link 1-32 Unit 4H
Anadarko
IP24/1,000’: 166 Boe/d
Spud Date: 3/25/2017
Elmer 33-67 801H
Energen
IP24/1,000’: 121 Boe/d
Spud Date: 3/25/2017
Whiskey River 7374A 1H
Jagged Peak
IP24/1,000’: 290 Boe/d
Spud Date: 9/15/2017
McIntyre State 40 1H
Diamondback
IP30/1,000’: 85 Boe/d
Spud Date: 3/15/2016
County Line 18A-C2 1H
Jagged Peak
IP30/1,000’: 180 Boe/d
Spud Date: 3/25/2017
Arno 78 121H
Matador
IP30/1,000’: 144 Boe/d
Spud Date: 1/15/2017
Dorothy White 82 124H
Matador
IP30/1,000’: 140 Boe/d
Spud Date: 3/8/2017
UL 20 Sugarloaf 1H
Forge/Oasis
IP24/1,000’: 112 Boe/d
Spud Date: 8/15/2017
Morrison H B 73H
Oxy
IP24/1,000’: 195 Boe/d
Spud Date: 10/17/2016
Shavano 38-28 1H
Felix Energy
IP30/1,000’: Pending
Spud Date: 12/14/2017
Collie A East N 63H
Oxy
IP30/1,000’: 93 Boe/d
Spud Date: 4/26/2017
Townsen 66 1
Carrizo
IP30/1,000’: 120 Boe/d
Spud Date: 2/11/2017
A
B
C
D
E
F
G
H
I
J
K
L
1 2 3 4 5
2nd Bone Spring
Wolfcamp C
Estimated 172 total net
upside locations targeting
the 2BS and WCC

Value Enhancing Financial Impact
Transaction is a measured approach to growth that is immediately accretive to debt-adjusted per
share metrics, including cash flow and production, and returns on capital employed
Material current cash flow contribution from significant PDP base
Provides meaningful optionality for planned capital allocation, but limited HBP requirements supports a measured
approach to development
Accelerates path to free cash flow generation
Completed acquisition financing preserves liquidity and maintains strong balance sheet and
leverage metrics
Pro forma net debt / 1Q’18 annualized Adjusted EBITDA of 2.0x (1)
Expected liquidity benefits from planned borrowing base redetermination
BENEFICIAL FINANCIAL IMPACTS
17
1. Acquisition portion of pro forma 1Q18 Adjusted EBITDA is calculated as follows: midpoint of revenue range less midpoint of direct operating expenses range and financing transactions
2. Based on average net daily production for the quarter ended March 31, 2018
3. This reflects underwriters exercising shoe in full for the equity issuance closed on May 30th, 2018
0%
20%
40%
60%
80%
SharesOutstanding
1Q'18Net Production
Net Acres Gross Hz Locations
% Incre
ase
+67%
+26%
ACQUISITION DRIVES SIGNIFICANT VALUE ENHANCEMENT
+13%
+51%
Current 26.6 Mboe/d ~56,900 net acres 1,545 gross Hz locations
Pro Forma 227.5 MM (3) 33.4 Mboe/d ~86,100 net acres 2,581 gross Hz locations
(2)

Financial Positioning
Long-term acquisition financing completed
$299MM equity offering
$400MM 8NC3 senior unsecured notes
Leverage statistics preserved and liquidity
position enhanced
Borrowing base redetermination to be
completed at closing of acquisition
18
PRO FORMA CAPITALIZATION ($MM)
1Q18 Adj. Pro Forma
Cash $18 37 $55
Credit facility 75 (75) 0
Senior notes due 2024 600 600
New senior notes 0 400 400
Total debt $675 $1,000
Preferred stock 73 73
Stockholders’ equity 1,838 289 2,127
Total capitalization $2,586 $3,200
Credit statistics
Net debt / LTM Adj. EBITDA(1) 2.2x 2.3x
Net debt / LQA Adj. EBITDA(2) 1.8x 2.0x
Liquidity
Commitment amount $650 $650
Less: drawn (75) 0
Plus: cash 18 55
Total liquidity $593 $705
1. LTM Adjusted EBITDA calculated as Callon LTM Adjusted EBITDA plus acquisition 1Q18 Adjusted EBITDA annualized. For a reconcil iation of Callon’s Net Income (Loss) to Adjusted EBITDA see the
Appendix
2. Acquisition portion of pro forma 1Q18 Adjusted EBITDA is calculated as follows: midpoint of revenue range less midpoint of di rect operating expenses range of seller for 1Q 2018
3. Based off current consensus production estimates per FACTSET as of June 14, 2018
RISK MANAGEMENT (3)
HIGHLIGHTS
70%
40%45%
30%
20%
2H18 2019 2020
% o
f C
onse
nsu
s O
il
NYMEX WTI Midland-Cushing

Physical Oil Flow Assurance
~ 90% on pipeline/gathering systems (pro-forma) with firm transport
Long-term firm sales agreements (NYMEX-based) with multiple counterparties with FT out of the Permian
Acquired acreage under long-term firm sales agreements
Enhanced marketing options with larger pro-forma production base
19
OFFTAKE
1. Hedge contracts as of June 14, 2018
2. Peers included in oil price realization chart : CDEV, CXO, EGN, FANG, JAG, LPI, PE, RSPP
OIL TRANSPORT EVOLUTION ($/Bbl) 1Q18 OIL PRICE REALIZATIONS2 ($/Bbl)
$0.00
$0.50
$1.00
$1.50
$2.00
$2.50
$3.00
$/B
bl
Trucking On Pipe
55% Current
Production
Pipe takeaway
Medallion Firm
Transport
Purchasers
Shell, BP,
Trafigura, Rio
Energy, Delek
Enterprise / Plains Firm Sales 45% Current
Production
Enterprise Firm Sales Acquired
Production
$62.28
$60.00
$60.50
$61.00
$61.50
$62.00
$62.50
CPE Peer 1 Peer 2 Peer 3 Peer 4 Peer 5 Peer 6 Peer 7 Peer 8
Peer Average: $61.57

Portfolio Approach Provides Broad Optionality
Firm sales volumes are covered by buyer held
FT agreements for transport out of the Permian
basin
Diversified purchaser portfolio (Plains,
Enterprise, Shell, BP, Trafigura, Delek, etc.)
with multi-year term agreements covering up
to 60KBopd
More than 90% of oil on pipe (pro-forma) with
additional tie-ins pending for Medallion system
Primary transport rights on Medallion
equivalent to other “preferred shippers”
Multi-year firm gathering commitments from
three primary providers (Enterprise, Plains,
Medallion) with ratable increases covered as
volumes grow
Sales are linked to NYMEX based pricing
mechanisms
20
Oil Marketing Arrangements
1) Projected oil volumes are annual exit rate figures for legacy CPE properties
Firm Transport on Medallion System Provides Broad Options for Delivery
Buyer 1 Buyer 2 Buyer 3 Buyer 4 Buyer 5 Buyer 6 Buyer 7
Up to
14 Mbopd
Up to
10 Mbopd
Up to
10 Mbopd
Up to
8 Mbopd
Up to
6.7 Mbopd
Up to
6 Mbopd
Up to
3 Mbopd
Flows on FT Flows on FT Flows on FT Flows on FT Flows on FT Flows on FTFT or local
refinery sale
Nymex
based pricing
Nymex
based pricing
Nymex
based pricing
Nymex
based pricing
Nymex
based pricing
Nymex
based pricing
Nymex
based pricing
Multi-year dedications with WTG, Enlink,
Targa, and Brazos across the basin
Delaware purchaser flows direct connect to El
Paso 1600 line with additional capacity
pending on Whitewater line
Gas Marketing Arrangements
• Longhorn
• Cactus II
(Pending)
• Grey Oak
(pending)
Centurion
• Centurion
• PE II
• WTG
• Bridgetex
Midland to
Sealy
• >60% of CPE(1) oil to flow on Medallion by YE 18
• Firm delivery to all market off-take points
• Capacity increasing with production growth
Basin
Medallion pipeline
Medallion offtake points

Callon Pure Play Peers <$10 Bn Market Cap
21
Source: Latest public investor presentations and 10-Q filing for the quarter ended March 31, 2018
Note: Operating Margin defined as unhedged sales revenue less lease operating expenses, gathering and transportation expenses and production taxes
Lea
Pecos
Terrell
Brewster
Gaines
Upton
Lynn
Crockett
Reeves
Terry
Andrews
Ector
Ward
Martin
ReaganCrane
MidlandWinkler
Dawson
Yoakum
Borden
Loving
Howard
Glasscock
Val Verde
Hockley LubbockCochran
NM TX
Lea
Pecos
Terrell
Brewster
Gaines
Upton
Lynn
Crockett
Reeves
Terry
Andrews
Ector
Ward
Martin
Reagan
Crane
MidlandWinkler
Dawson
Yoakum
Borden
Loving
Howard
Glasscock
Val Verde
Hockley LubbockCochran
NM TX
Callon has amassed a highly economic acreage position ripe for full-scale development
Callon 1Q’18 Pro Forma:
Net acres: ~86,100
Net Mbo/d: 25.6
Op. margin ($/boe): $43.92
Jagged Peak 1Q’18:
Net acres: ~77,700
Net Mbo/d: 21.9
Op. margin ($/boe): $44.90
Centennial 1Q’18:
Net acres: ~80,100
Net Mbo/d: 31.6
Op. margin ($/boe): $35.28
RSP Permian 1Q’18:
Net acres: ~91,900
Net Mbo/d: 45.3
Op. margin ($/boe): $40.34
Jagged Peak
Lea
Pecos
Terrell
Brewster
Gaines
Upton
Lynn
Crockett
Reeves
Terry
Andrews
Ector
Ward
Martin
ReaganCrane
MidlandWinkler
Dawson
Yoakum
Borden
Loving
Howard
Glasscock
Val Verde
Hockley LubbockCochran
NM TX
Centennial RSP Permian
Lea
Pecos
Terrell
Brewster
Gaines
Upton
Lynn
Crockett
Reeves
Terry
Andrews
Ector
Ward
Martin
ReaganCrane
MidlandWinkler
Dawson
Yoakum
Borden
Loving
Howard
Glasscock
Val Verde
Hockley LubbockCochran
NM TX
Callon May 2018
Acquisition

APPENDIX

23
Between company owned and third party committed volumes, Callon has in excess of 400,000 bbl/d of water disposal capacity (excluding pending Goodnight project of 80,000 bbl/d)
Average CPE water disposal during February was ~90K Bwpd across the entire Permian footprint (25% of controlled capacity)
Water Disposal as a Competitive Advantage
WATER MANAGEMENT INITIATIVES
Strategic Water Handling Agreements
• Gravity – water sourcing (Wildhorse
and Spur areas)
• Goodnight Midstream – Spur disposal
pipeline to the CBP
Recycling Efforts
• Underway at Monarch, utilized on
recently fracked wells +40% of
sourced volumes
• Spur build-out progressing, goal of
sourcing 50% of frac water volumes
from recycling by year end
Incremental Capacity in Key Areas
• New Deep Ellenburger wells projected
online at Ranger and Wildhorse
during Q2 supplying significant
incremental capacity
COMPANY OWNED AND OPERATED DISPOSAL CAPACITY BY AREA
~60,000 bwpd
~50,000 bwpd
~100,000 bwpd
~45,000 bwpd

Current Guidance Summary (Unadjusted for Acquistion)
24
1. Excludes stock-based compensation and corporate depreciation and amortization. See the Non-GAAP related disclosures in the Appendix
2. Excludes certain non-recurring expenses and non-cash valuation adjustments. See the non-GAAP related disclosures in the Appendix
3. All cash interest expense anticipated to be capitalized
4. Includes drilling, completions, facilities, seismic, land and other items. Excludes capitalized expenses. Net of infrastructure monetizations of $20 million
FY18
Guidance
Total production (MBoepd) 29.5 – 32.0
Oil production 77%
Income statement expenses (per BOE)
LOE, including workovers $5.25 - $6.25
Production taxes, including ad valorem
(% of unhedged revenues)6%
Adjusted G&A: cash component (1) $1.75 - $2.50
Adjusted G&A: non-cash component (2) $0.50 - $1.00
Cash interest expense (3) $0.00
Statutory income tax rate 22%
Capital expenditures ($MM, accrual basis)
Total operational capital (4) $500 - $540
Capitalized expenses $60 - $70
Net operated horizontal wells placed on production 43 – 46
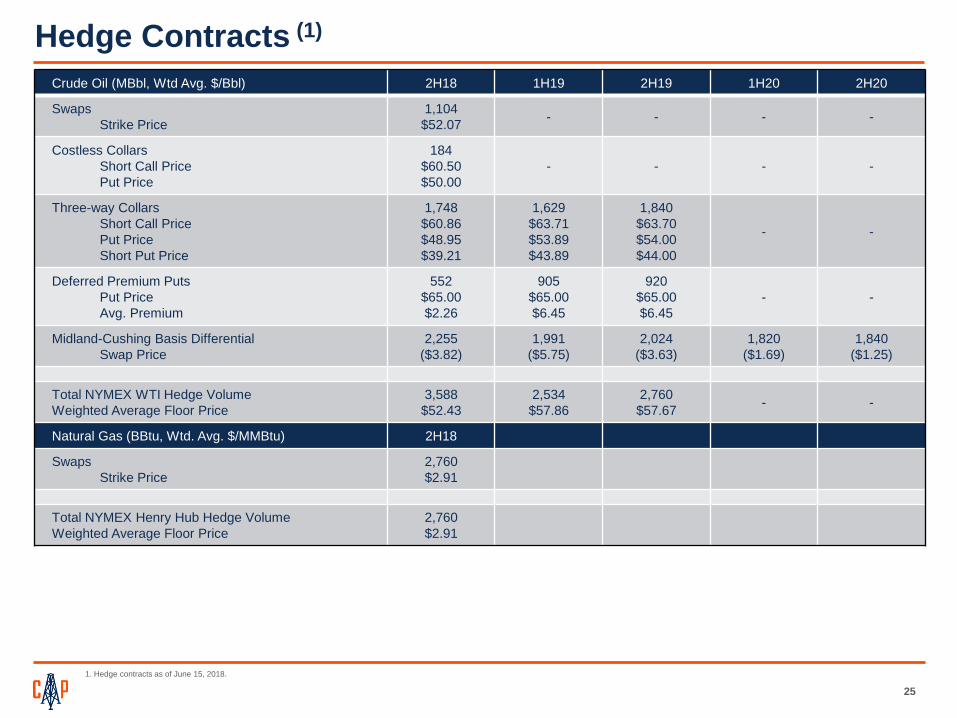
Hedge Contracts (1)
25
1. Hedge contracts as of June 15, 2018.
Crude Oil (MBbl, Wtd Avg. $/Bbl) 2H18 1H19 2H19 1H20 2H20
Swaps
Strike Price
1,104
$52.07- - - -
Costless Collars
Short Call Price
Put Price
184
$60.50
$50.00
- - - -
Three-way Collars
Short Call Price
Put Price
Short Put Price
1,748
$60.86
$48.95
$39.21
1,629
$63.71
$53.89
$43.89
1,840
$63.70
$54.00
$44.00
- -
Deferred Premium Puts
Put Price
Avg. Premium
552
$65.00
$2.26
905
$65.00
$6.45
920
$65.00
$6.45
- -
Midland-Cushing Basis Differential
Swap Price
2,255
($3.82)
1,991
($5.75)
2,024
($3.63)
1,820
($1.69)
1,840
($1.25)
Total NYMEX WTI Hedge Volume
Weighted Average Floor Price
3,588
$52.43
2,534
$57.86
2,760
$57.67- -
Natural Gas (BBtu, Wtd. Avg. $/MMBtu) 2H18
Swaps
Strike Price
2,760
$2.91
Total NYMEX Henry Hub Hedge Volume
Weighted Average Floor Price
2,760
$2.91
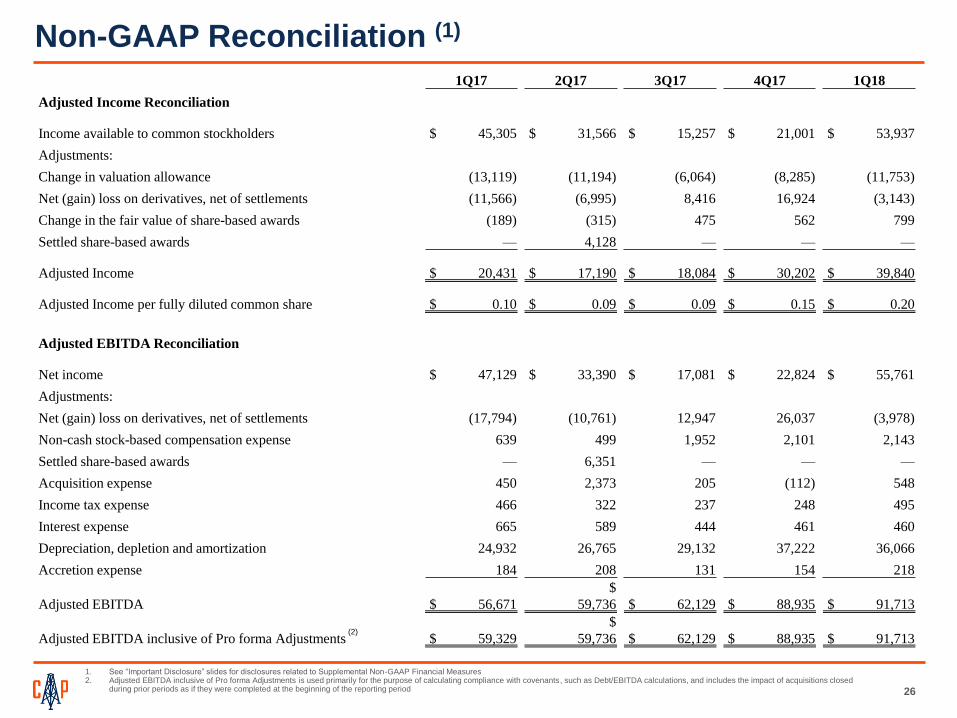
1Q17 2Q17 3Q17 4Q17 1Q18
Adjusted Income Reconciliation
Income available to common stockholders $ 45,305 $ 31,566 $ 15,257 $ 21,001 $ 53,937
Adjustments:
Change in valuation allowance (13,119) (11,194) (6,064) (8,285) (11,753)
Net (gain) loss on derivatives, net of settlements (11,566) (6,995) 8,416 16,924 (3,143)
Change in the fair value of share-based awards (189) (315) 475 562 799
Settled share-based awards — 4,128 — — —
Adjusted Income $ 20,431 $ 17,190 $ 18,084 $ 30,202 $ 39,840
Adjusted Income per fully diluted common share $ 0.10 $ 0.09 $ 0.09 $ 0.15 $ 0.20
Adjusted EBITDA Reconciliation
Net income $ 47,129 $ 33,390 $ 17,081 $ 22,824 $ 55,761
Adjustments:
Net (gain) loss on derivatives, net of settlements (17,794) (10,761) 12,947 26,037 (3,978)
Non-cash stock-based compensation expense 639 499 1,952 2,101 2,143
Settled share-based awards — 6,351 — — —
Acquisition expense 450 2,373 205 (112) 548
Income tax expense 466 322 237 248 495
Interest expense 665 589 444 461 460
Depreciation, depletion and amortization 24,932 26,765 29,132 37,222 36,066
Accretion expense 184 208 131 154 218
Adjusted EBITDA $ 56,671
$
59,736 $ 62,129 $ 88,935 $ 91,713
Adjusted EBITDA inclusive of Pro forma Adjustments $ 59,329
$
59,736 $ 62,129 $ 88,935 $ 91,713
Non-GAAP Reconciliation (1)
26
1. See “Important Disclosure” slides for disclosures related to Supplemental Non-GAAP Financial Measures2. Adjusted EBITDA inclusive of Pro forma Adjustments is used primarily for the purpose of calculating compliance with covenants, such as Debt/EBITDA calculations, and includes the impact of acquisitions closed
during prior periods as if they were completed at the beginning of the reporting period
(2)

1Q17 2Q17 3Q17 4Q17 1Q18
Adjusted G&A Reconciliation
Total G&A expense $ 5,206 $ 6,430 $ 7,259 $ 8,173 $ 8,769
Adjustments:
Less: Early retirement expenses — (444) — — —
Less: Early retirement expenses related to share-based compensation — (81) — — —
Less: Change in the fair value of liability share-based awards (non-cash) (307) 567 (731) (844) (991)
Adjusted G&A – total 5,513 6,472 6,528 7,329 7,778
Less: Restricted stock share-based compensation (non-cash) (921) (966) (1,198) (1,202) (1,105)
Less: Corporate depreciation & amortization (non-cash) (121) (114) (146) (125) (124)
Adjusted G&A – cash component $ 4,471 $ 5,392 $ 5,184 $ 6,002 $ 6,549
Adjusted Total Revenue Reconciliation
Oil revenue $ 72,008 $ 72,885 $ 73,349 $ 104,132 $ 115,286
Natural gas revenue 9,355 9,398 11,265 14,081 12,154
Total revenue 81,363 82,283 84,614 118,213 127,440
Impact of cash-settled derivatives (2,491) (267) (1,214) (4,501) (8,459)
Adjusted Total Revenue $ 78,872 $ 82,016 $ 83,400 $ 113,712 $ 118,981
Total Production (Mboe) 1,838 2,021 2,074 2,439 2,391
Adjusted Total Revenue per Boe $ 42.91 $ 40.58 $ 40.21 $ 46.62 $ 49.76
Discretionary Cash Flow Reconciliation
Net cash provided by operating activities $ 52,684 $ 43,128 $ 53,893 $ 80,186 $ 92,215
Changes in working capital (5,890) 8,968 7,777 8,642 (4,512)
Payments to settle asset retirement obligations 765 816 250 216 366
Payments to settle vested liability share-based awards 8,662 4,511 — — 3,089
Discretionary cash flow $ 56,221 $ 57,423 $ 61,920 $ 89,044 $ 91,158
Discretionary cash flow per diluted share $ 0.28 $ 0.28 $ 0.31 $ 0.44 $ 0.45
Non-GAAP Reconciliation (1)
27
1. See “Important Disclosure” slides for disclosures related to Supplemental Non-GAAP Financial Measures