Embed Size (px)
Citation preview

© 2009 Weatherford. All rights reserved.
Thoughts on laboratory sand retention testing for water injection wells
Tracey Ballard and Steve Beare
0
© 2010 Weatherford. All rights reserved.
Sand control in water injectors
• Historically less focus on injectors compared to producers?
• Injectors are becoming more fashionable
– SPE ATW every 2 yrs in nice places
1
© 2010 Weatherford. All rights reserved.
Screen sizing
• We have rough guidelines for producers
– D10 for metal mesh
– D30-ish for wire wraps
………but are often asked about injectors
• Seems to be 2 schools of thought:
– Size bigger than equivalent producer
– Size smaller than equivalent producer
2
© 2010 Weatherford. All rights reserved.
Difference between producers and injectors
• Producers:
– Failing sand will tend to pack off around the screen.
– Less susceptible to resorting though cross flow
• Injectors:
– Potentially more aggressive environment for sand control
– Flow in the injection direction will push failed sand against the
formation.
– Stopping and restarting injection causes water hammer and
backflow into the well bore.
– This flow in both directions means the sand is susceptible to re-
sort as it is alternately flowed in both directions.
3
© 2010 Weatherford. All rights reserved.
Possible test protocols for injectors
• Throbber
– Slurry test incorporating strong pulsing allowing some
re-sorting of the sand
• Pressuriser
– Sandpack test where water is injected through the
pack in the injection direction pressurising a reservoir
behind the pack
– When injection is stopped the pressure release from
the reservoir allows fluid to flow through the screen.
– Mimics a water injector ?
4
© 2010 Weatherford. All rights reserved.
Throbbing tests
• Not a direct simulation of what happens in the field but a
way of incorporating an aspect of sand re-sorting in a
test.
• A “normal” slurry test using a pulsing pump. The flow
pulses (is not constant).
• The idea to be more aggressive than standard retention
tests to mimic potential resorting of sands in water
injectors.
© 2010 Weatherford. All rights reserved.
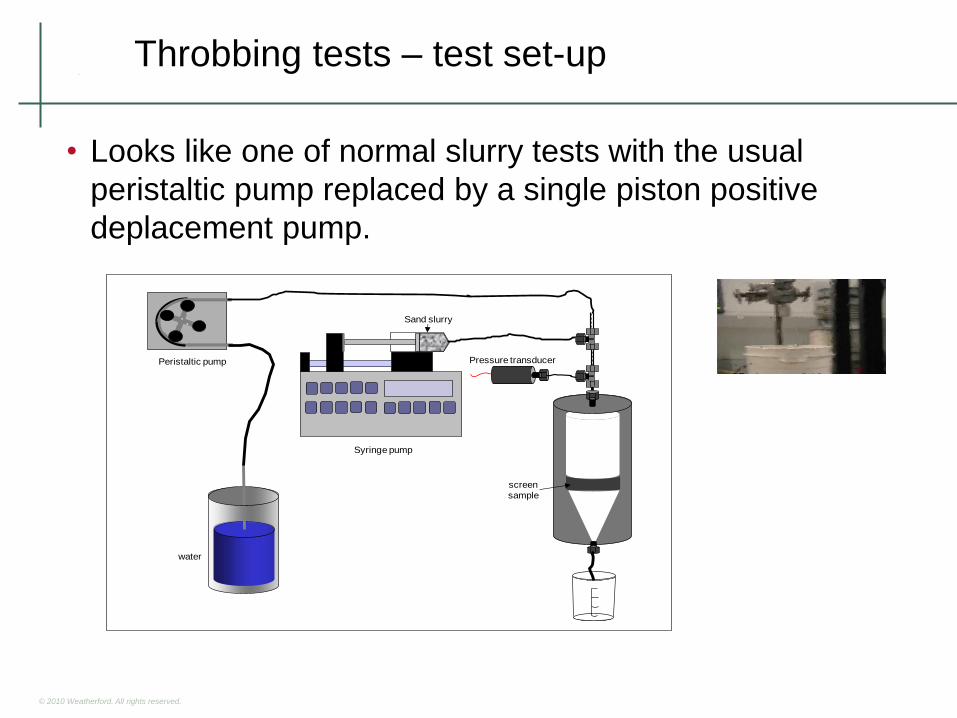
Throbbing tests – test set-up
• Looks like one of normal slurry tests with the usual
peristaltic pump replaced by a single piston positive
deplacement pump.
water
Peristaltic pump
screen
sample
Pressure transducer
Sand slurry
Syringe pump
© 2010 Weatherford. All rights reserved.
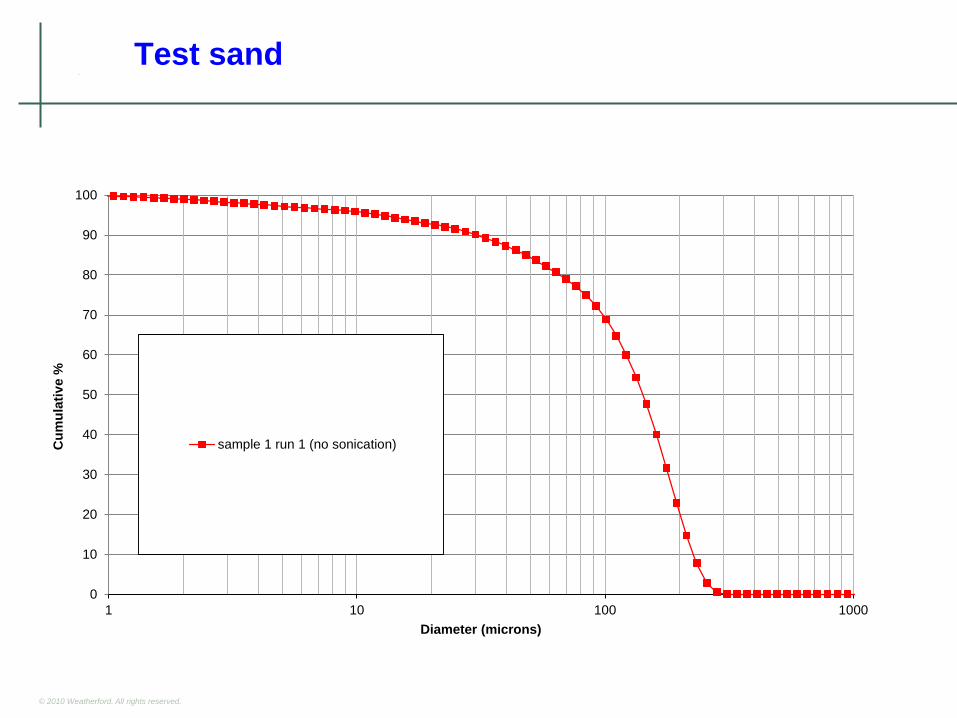
Test sand
0
10
20
30
40
50
60
70
80
90
100
1 10 100 1000
Cu
mu
lati
ve %
Diameter (microns)
sample 1 run 1 (no sonication)
© 2010 Weatherford. All rights reserved.
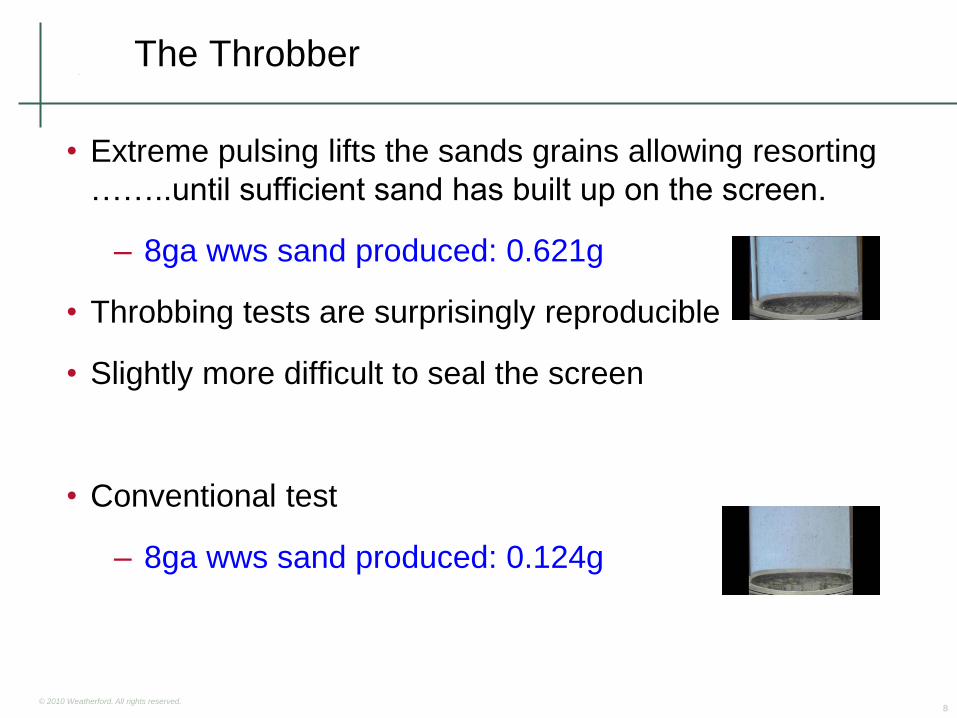
The Throbber
• Extreme pulsing lifts the sands grains allowing resorting
……..until sufficient sand has built up on the screen.
– 8ga wws sand produced: 0.621g
• Throbbing tests are surprisingly reproducible
• Slightly more difficult to seal the screen
• Conventional test
– 8ga wws sand produced: 0.124g
8
© 2010 Weatherford. All rights reserved.
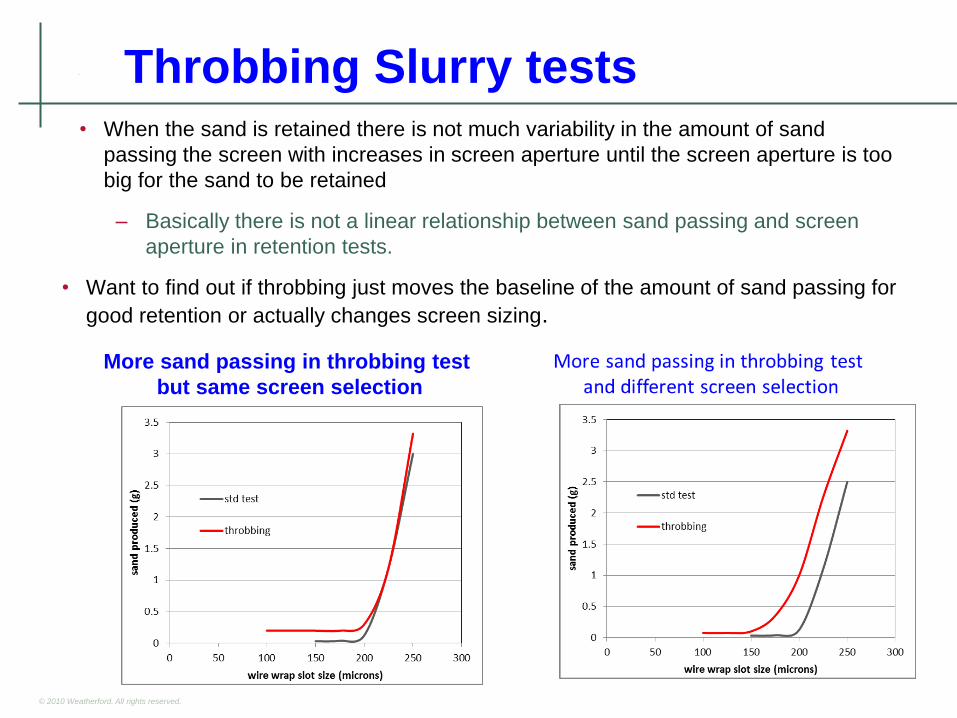
Throbbing Slurry tests • When the sand is retained there is not much variability in the amount of sand
passing the screen with increases in screen aperture until the screen aperture is too
big for the sand to be retained
– Basically there is not a linear relationship between sand passing and screen
aperture in retention tests.
• Want to find out if throbbing just moves the baseline of the amount of sand passing for
good retention or actually changes screen sizing.
More sand passing in throbbing test
but same screen selection
© 2010 Weatherford. All rights reserved.
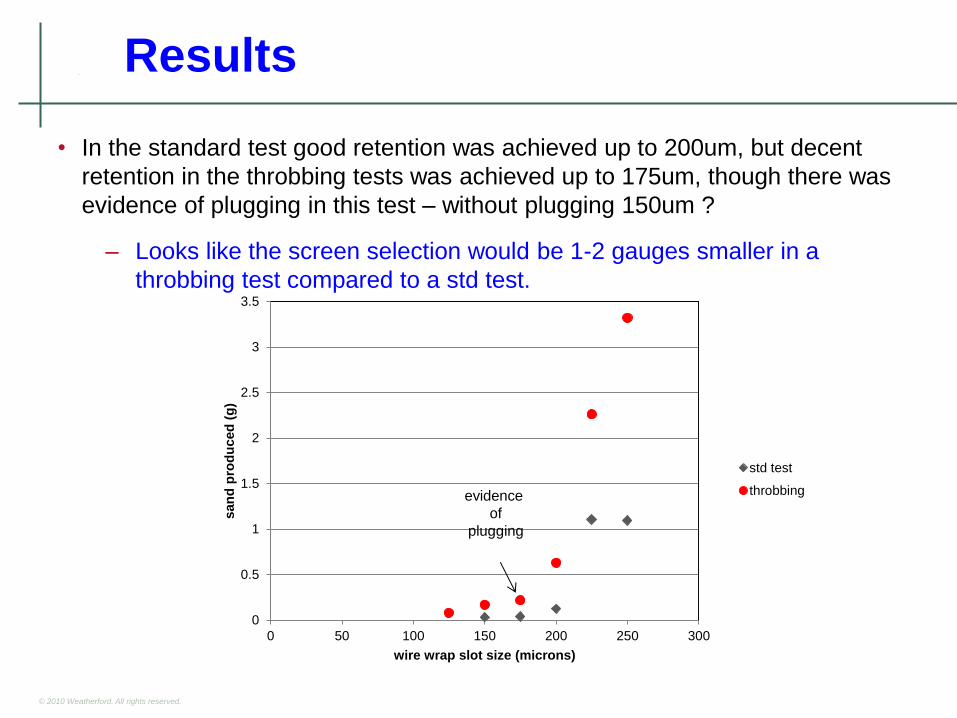
Results
• In the standard test good retention was achieved up to 200um, but decent
retention in the throbbing tests was achieved up to 175um, though there was
evidence of plugging in this test – without plugging 150um ?
– Looks like the screen selection would be 1-2 gauges smaller in a
throbbing test compared to a std test.
0
0.5
1
1.5
2
2.5
3
3.5
0 50 100 150 200 250 300
san
d p
rod
uced
(g
)
wire wrap slot size (microns)
std test
throbbingevidence
of
plugging
© 2010 Weatherford. All rights reserved.
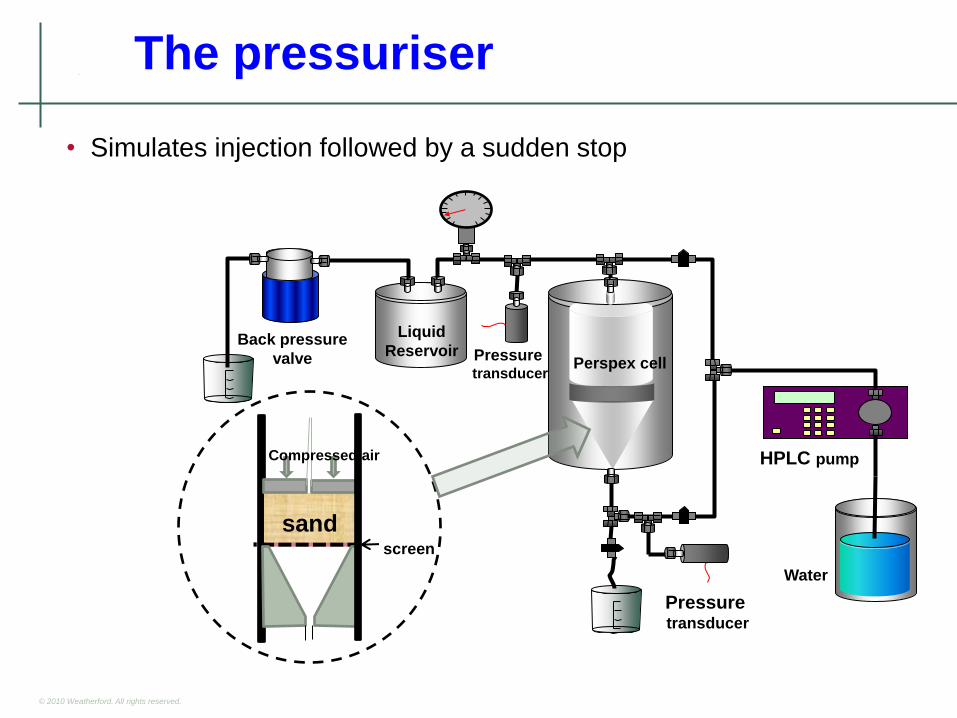
The pressuriser
• Simulates injection followed by a sudden stop
Water
HPLC pump
Perspex cell
Pressure transducer
Liquid
Reservoir Back pressure
valve
sand
Pressure transducer
Compressed air
screen
© 2010 Weatherford. All rights reserved.
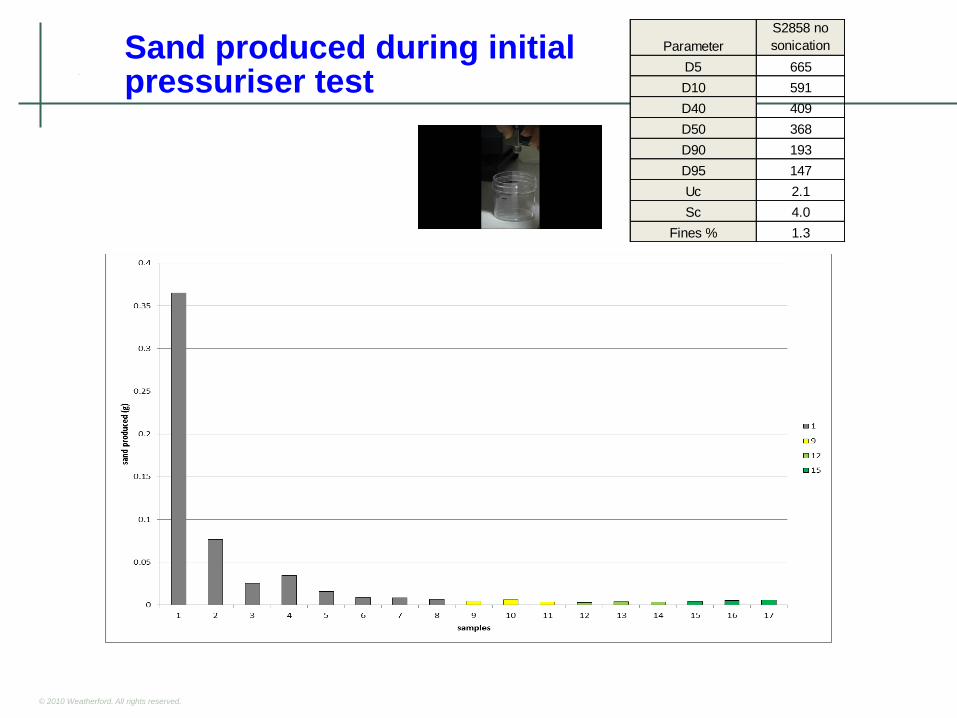
Sand produced during initial pressuriser test
Parameter
S2858 no
sonication
D5 665
D10 591
D40 409
D50 368
D90 193
D95 147
Uc 2.1
Sc 4.0
Fines % 1.3
© 2010 Weatherford. All rights reserved.
commissioning tests
• Tried a more poorly sorted sand (fines 20%) …….loads of trouble
– leaks around piston ….. etc….etc..
• Eventually set-up a working leak free system. But in the initial tests
the piston was not moving – though we thought it was. This caused a
number of effects - all getting worse as the tests progress
– Moving the sandpack up and down
– Partial fluidisation of the sandpack
– Release of fines in the upward direction
– Formation of holes in the pack
• Finally managed to get enough pressure on the piston to prevent the
pack moving ……or so we thought. But the video shows some
movement. Though test results are reproducible.
© 2010 Weatherford. All rights reserved.
commissioning tests
• Injection rate doesn’t appear to affect sand production if the
sandpack is fully constrained.
• If the pack moves allowing re-sorting loads more sand is produced.
• Have run initial tests varying the injection flow rate as the rate
increases and the pressure increases the pressure on the piston is
not sufficient and the pack can move.
© 2010 Weatherford. All rights reserved.
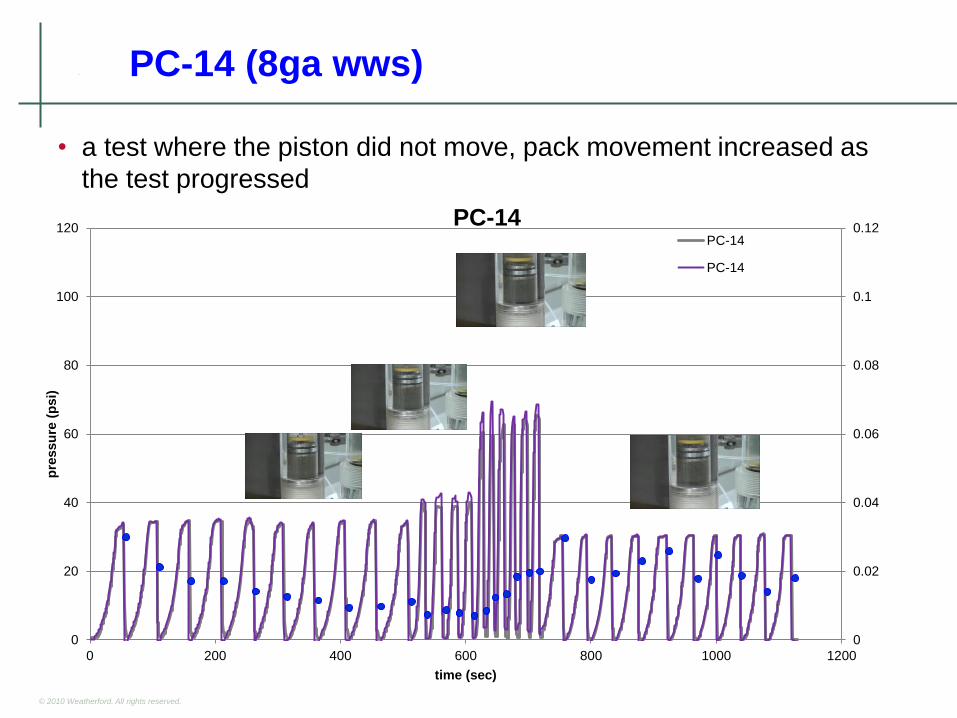
PC-14 (8ga wws)
• a test where the piston did not move, pack movement increased as
the test progressed
0
0.02
0.04
0.06
0.08
0.1
0.12
0
20
40
60
80
100
120
0 200 400 600 800 1000 1200
pre
ssu
re (
ps
i)
time (sec)
PC-14 PC-14
PC-14
© 2010 Weatherford. All rights reserved.
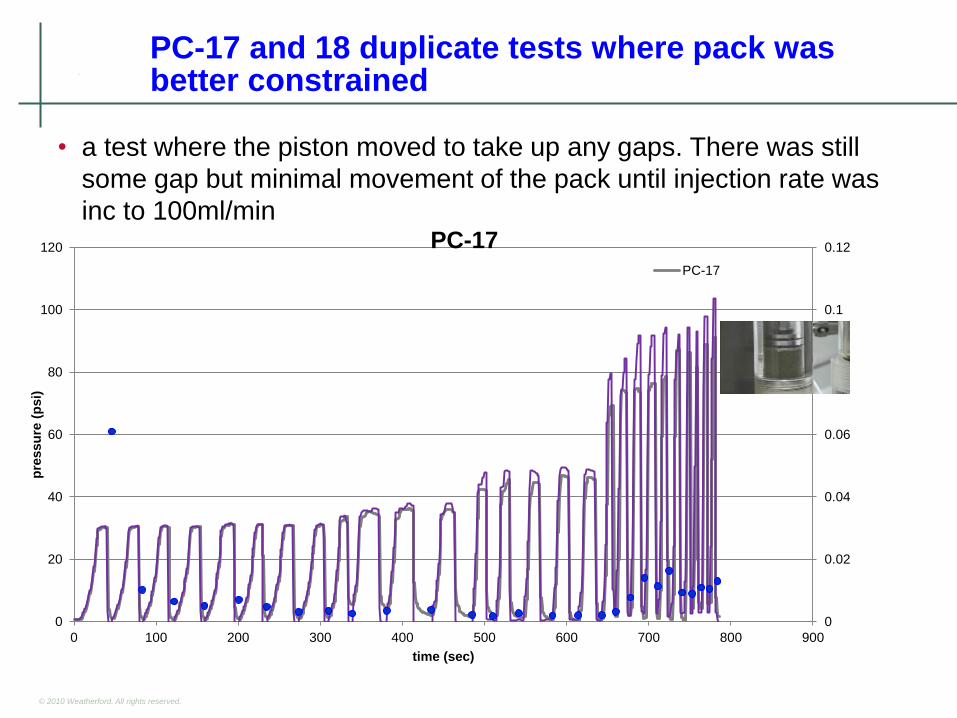
PC-17 and 18 duplicate tests where pack was better constrained
• a test where the piston moved to take up any gaps. There was still
some gap but minimal movement of the pack until injection rate was
inc to 100ml/min
0
0.02
0.04
0.06
0.08
0.1
0.12
0
20
40
60
80
100
120
0 100 200 300 400 500 600 700 800 900
pre
ssu
re (
psi)
time (sec)
PC-17 PC-17
© 2010 Weatherford. All rights reserved.
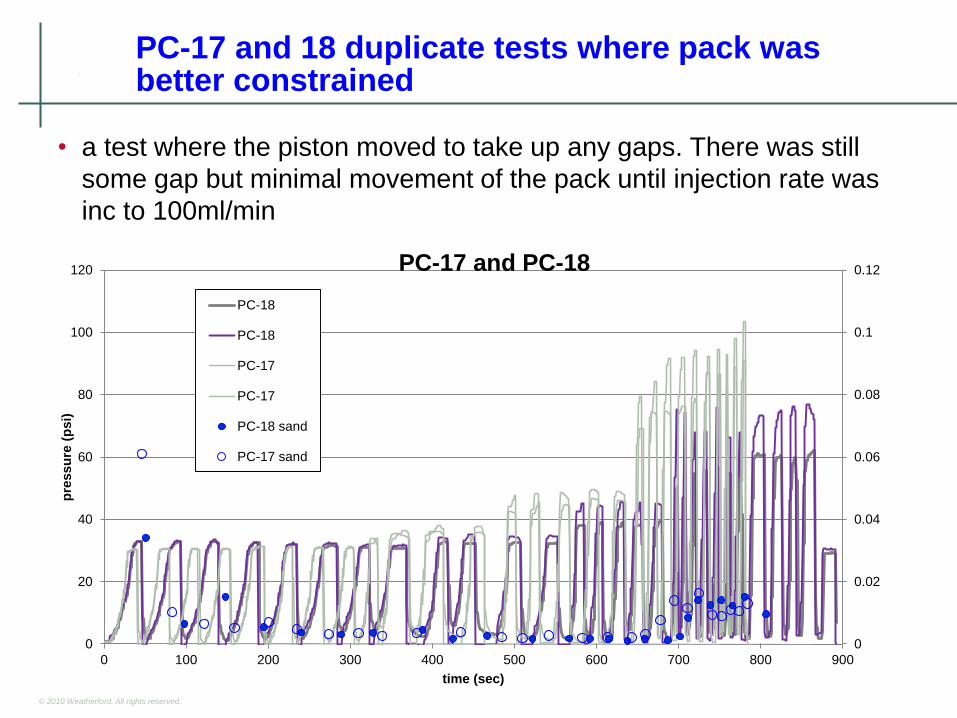
PC-17 and 18 duplicate tests where pack was better constrained
• a test where the piston moved to take up any gaps. There was still
some gap but minimal movement of the pack until injection rate was
inc to 100ml/min
0
0.02
0.04
0.06
0.08
0.1
0.12
0
20
40
60
80
100
120
0 100 200 300 400 500 600 700 800 900
pre
ssu
re (
psi)
time (sec)
PC-17 and PC-18
PC-18
PC-18
PC-17
PC-17
PC-18 sand
PC-17 sand
© 2010 Weatherford. All rights reserved.
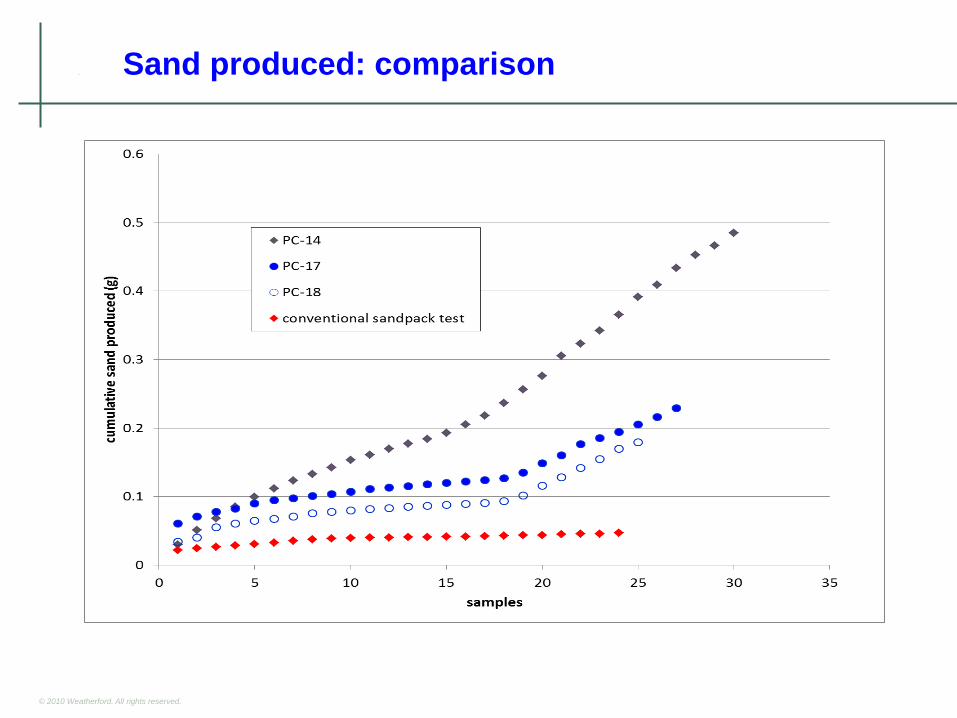
Sand produced: comparison
© 2010 Weatherford. All rights reserved.
Summary
• Throbber
– Nice reproducible results
– But is it a better test for water injectors ?
– Need to re-inject the produced solids through the
screen in the injection direction – check for plugging
• Pressuriser
– What seems to be a straightforward test can be a
nightmare in practice
– Needs more work ……

© 2010 Weatherford. All rights reserved.
Comments/ideas
…is this stuff any use ??


![Giesserei 1 2 2009 - PROGUSS AUSTRIA · trieangebotenwerden.DazuzählenJ-Sand,KerphaliteKF,Cerabeads, M-Sand,R-Sand,Bauxit-Sand,AlodurRBT9undSchamotte[6]. FormgrundstoffeundSpezialsande](https://img.pdfslide.tips/doc/110x75/5b4f06d87f8b9a166e8b67c5/giesserei-1-2-2009-proguss-trieangebotenwerdendazuzaehlenj-sandkerphalitekfcerabeads.jpg)